Attached files
| file | filename |
|---|---|
| EX-3.4 - EX-3.4 - BMC STOCK HOLDINGS, INC. | d520315dex34.htm |
| EX-23.1 - EX-23.1 - BMC STOCK HOLDINGS, INC. | d520315dex231.htm |
Table of Contents
As filed with the Securities and Exchange Commission on July 30, 2013
Registration No. 333-189368
UNITED STATES
SECURITIES AND EXCHANGE COMMISSION
Washington, D.C. 20549
AMENDMENT NO. 3
TO
FORM S-1
REGISTRATION STATEMENT
UNDER THE SECURITIES ACT OF 1933
STOCK BUILDING SUPPLY HOLDINGS, INC.
(Exact name of registrant as specified in its charter)
| Delaware | 5211 | 26-4687975 | ||
| (State or other jurisdiction of incorporation or organization) |
(Primary Standard Industrial Classification Code Number) |
(I.R.S. Employer Identification No.) |
8020 Arco Corporate Drive, Suite 400
Raleigh, North Carolina 27617
Phone: (919) 431-1000
(Address, including zip code, and telephone number, including area code, of registrant’s principal executive offices)
Bryan J. Yeazel
Executive Vice President, Chief Administrative Officer and General Counsel
8020 Arco Corporate Drive, Suite 400
Raleigh, North Carolina 27617
Phone: (919) 431-1000
(Name, address, including zip code, and telephone number, including area code, of agent for service)
Copies of all communications, including communications sent to agent for service, should be sent to:
| Carol Anne Huff Kirkland & Ellis LLP 300 North LaSalle Chicago, Illinois 60654 (312) 862-2000 |
Michael Kaplan Davis Polk & Wardwell LLP 450 Lexington Avenue New York, New York 10017 (212) 450-4000 |
Approximate date of commencement of proposed sale to the public: As soon as practicable after this Registration Statement becomes effective.
If any of the securities being registered on this Form are to be offered on a delayed or continuous basis pursuant to Rule 415 under the Securities Act of 1933, check the following box: ¨
If this Form is filed to register additional securities for an offering pursuant to Rule 462(b) under the Securities Act, please check the following box and list the Securities Act registration statement number of the earlier effective registration statement for the same offering. ¨
If this Form is a post-effective amendment filed pursuant to Rule 462(c) under the Securities Act, check the following box and list the Securities Act registration statement number of the earlier effective registration statement for the same offering. ¨
If this Form is a post-effective amendment filed pursuant to Rule 462(d) under the Securities Act, check the following box and list the Securities Act registration statement number of the earlier effective registration statement for the same offering. ¨
Indicate by check mark whether the registrant is a large accelerated filer, an accelerated filer, a non-accelerated filer, or a smaller reporting company. See the definitions of “large accelerated filer,” “accelerated filer” and “smaller reporting company” in Rule 12b-2 of the Exchange Act. (Check one):
| Large accelerated filer ¨ | Accelerated filer ¨ | Non-accelerated filer x | Smaller reporting company ¨ | |||
| (Do not check if a smaller reporting company) | ||||||
CALCULATION OF REGISTRATION FEE
|
| ||||||||
| Title of Each Class of Securities to be Registered |
Amount to be |
Proposed Maximum Offering Price per Share(2) |
Proposed Maximum Aggregate Offering |
Amount of Registration Fee(3)(4) | ||||
| Common Stock, $0.01 par value per share |
10,147,060 | $18.00 | $182,647,080 | $24,913.07 | ||||
|
| ||||||||
|
| ||||||||
| (1) | Includes 1,323,530 additional shares of common stock that the underwriters have the option to purchase. |
| (2) | Estimated solely for the purpose of calculating the registration fee pursuant to Rule 457(a) of the Securities Act of 1933, as amended. |
| (3) | Calculated by multiplying 0.00013640 by the proposed maximum aggregate offering price. |
| (4) | $23,870 was previously paid with the initial filing of this registration statement. |
The registrant hereby amends this Registration Statement on such date or dates as may be necessary to delay its effective date until the registrant shall file a further amendment which specifically states that this Registration Statement shall thereafter become effective in accordance with Section 8(a) of the Securities Act of 1933 or until this Registration Statement shall become effective on such date as the Commission, acting pursuant to said Section 8(a), may determine.
Table of Contents
The information in this preliminary prospectus is not complete and may be changed. These securities may not be sold until the registration statement filed with the Securities and Exchange Commission is effective. This preliminary prospectus is not an offer to sell nor does it seek an offer to buy these securities in any jurisdiction where the offer or sale is not permitted.
Subject to Completion. Dated July 30, 2013.
8,823,530 Shares

Stock Building Supply Holdings, Inc.
Common Stock
This is an initial public offering of shares of common stock of Stock Building Supply Holdings, Inc. We are offering 4,411,765 shares of common stock. The selling stockholders identified in this prospectus are selling an additional 4,411,765 shares of common stock. We will not receive any proceeds from the sale of shares of common stock by the selling stockholders.
Prior to this offering, there has been no public market for the common stock. It is currently estimated that the initial public offering price per share will be between $16.00 and $18.00. We have been approved to list the common stock on the NASDAQ Stock Market under the symbol “STCK.”
We are an “emerging growth company” as defined in Section 2(a)(19) of the Securities Act of 1933, as amended, and, as such, are allowed to provide in this prospectus more limited disclosures than an issuer that would not so qualify. In addition, for so long as we remain an emerging growth company, we will qualify for certain limited exceptions from investor protection laws such as the Sarbanes-Oxley Act of 2002. Please read “Risk Factors—Risks Related to this Offering and Our Common Stock—We are an ‘emerging growth company’ and we cannot be certain if the reduced disclosure requirements applicable to emerging growth companies will make our common stock less attractive to investors.”
See “Risk Factors” on page 20 to read about factors you should consider before buying shares of the common stock.
Neither the Securities and Exchange Commission nor any other state securities commission has approved or disapproved of these securities or passed upon the accuracy or adequacy of this prospectus. Any representation to the contrary is a criminal offense.
| Per Share | Total | |||||||
| Initial public offering price |
$ | $ | ||||||
| Underwriting discount(1) |
$ | $ | ||||||
| Proceeds, before expenses, to us |
$ | $ | ||||||
| Proceeds, before expenses, to the selling stockholders |
$ | $ | ||||||
| (1) | See “Underwriting.” |
To the extent that the underwriters sell more than 8,823,530 shares of common stock, the underwriters have the option to purchase up to an additional 1,323,530 shares from the selling stockholders at the initial public offering price less the underwriting discount.
The underwriters expect to deliver the shares against payment in New York, New York on , 2013.
| Goldman, Sachs & Co. | ||||||||||
| Barclays | ||||||||||
| Citigroup | ||||||||||
| Baird | Stephens Inc. | Wells Fargo Securities |
Prospectus dated , 2013.
Table of Contents

Table of Contents
| 1 | ||||
| 20 | ||||
| 40 | ||||
| 42 | ||||
| 43 | ||||
| 44 | ||||
| 47 | ||||
| 49 | ||||
| MANAGEMENT’S DISCUSSION AND ANALYSIS OF FINANCIAL CONDITION AND RESULTS OF OPERATIONS |
53 | |||
| 86 | ||||
| 102 | ||||
| 111 | ||||
| 123 | ||||
| 126 | ||||
| 131 | ||||
| 136 | ||||
| CERTAIN U.S. FEDERAL INCOME TAX CONSIDERATIONS TO NON-U.S. HOLDERS |
138 | |||
| 142 | ||||
| 147 | ||||
| 147 | ||||
| 147 | ||||
| F-1 |
Through and including , 2013 (the 25th day after the date of this prospectus), all dealers effecting transactions in these securities, whether or not participating in this offering, may be required to deliver a prospectus. This is in addition to a dealer’s obligation to deliver a prospectus when acting as an underwriter and with respect to an unsold allotment or subscription.
We have not authorized anyone to provide any information or to make any representations other than those contained in this prospectus or in any free writing prospectuses we have prepared. We take no responsibility for, and can provide no assurance as to the reliability of, any other information that others may give you. This prospectus is an offer to sell only the shares offered hereby, but only under circumstances and in jurisdictions where it is lawful to do so. The information contained in this prospectus is current only as of its date.
Persons who come into possession of this prospectus and any such free writing prospectus in jurisdictions outside the United States are required to inform themselves about and to observe any restrictions as to this offering and the distribution of this prospectus and any such free writing prospectus applicable to that jurisdiction.
i
Table of Contents
Market and industry data
We obtained the industry, market and competitive position data used throughout this prospectus from our own internal estimates and research as well as from industry publications and research, surveys and studies conducted by third-parties. Third-party industry publications include the Home Improvement Research Institute’s (“HIRI”) Home Improvement Products Market Forecast Update (published in March 2013), the National Association of Homebuilders’ (“NAHB”) Housing and Interest Rate Forecast (published in July 2013), the Harvard Joint Center for Housing Studies’ (“HJCHS”) The U.S. Housing Stock: Ready for Renewal (published in January 2013), McGraw-Hill Construction’s (“McGraw-Hill Construction”) Market Forecasting Service Report (published in June 2013), Random Lengths’ Yardstick (published in December 2012), as well as data published by Standard & Poor’s Financial Services LLC as of June 2013, the Bureau of Labor Statistics as of December 2012 and January 2013, the U.S. Census Bureau as of December 2012 and June 2013 and The Wall Street Journal as of July 2013. Industry publications, studies and surveys generally state that they have been obtained from sources believed to be reliable, although they do not guarantee the accuracy or completeness of such information. The information derived from the sources cited in this prospectus represents the most recently available data and, therefore, we believe such data remain reliable. While we believe our internal company research is reliable and the market definitions are appropriate, neither such research nor these definitions have been verified by any independent source.
ii
Table of Contents
This summary highlights information contained elsewhere in this prospectus. It does not contain all of the information that may be important to you and your investment decision. You should carefully read the following summary together with the entire prospectus. In this prospectus, unless the context otherwise requires, references to the “Company,” “we,” “us” and “our” refer to Stock Building Supply Holdings, Inc., together with its consolidated subsidiaries.
Overview
We are a large, diversified lumber and building materials (“LBM”) distributor and solutions provider that sells to new construction and repair and remodel contractors. Our primary products are lumber & lumber sheet goods, millwork, doors, flooring, windows, structural components, such as engineered wood products (“EWP”), trusses, wall panels and other exterior products. We serve a broad customer base, including large-scale production homebuilders, custom homebuilders and repair and remodeling contractors, and we believe we are among the top three LBM suppliers for residential construction in 80% of the geographic markets in which we operate, based on net sales. We offer over 39,000 products sourced through our strategic network of suppliers, which together with our various solution-based services, represent approximately 50% of the construction cost of a typical new home. By enabling our customers to source a significant portion of their materials and services from one supplier, we have positioned ourselves as the supply partner of choice for many of our customers.
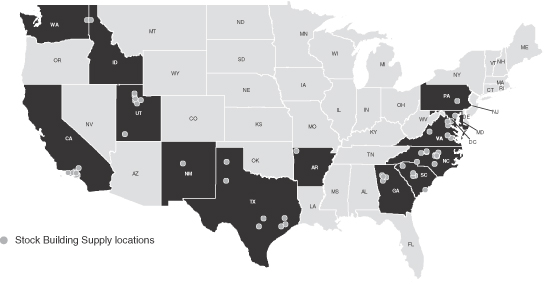
We have operations in 13 states that accounted for approximately 48% of 2012 U.S. single-family housing permits according to the U.S. Census Bureau. Our primary operating regions include the South and West regions of the United States (as defined by the U.S. Census Bureau), with a significant portion of our net sales derived from markets within Texas, North Carolina, California and Utah. Following our acquisition by an affiliate of The Gores Group, LLC (“Gores”) in 2009, we aggressively and strategically reduced our footprint to improve our profitability. Today, our facilities are strategically located in 20 metropolitan areas in these 13 states that we believe have an attractive potential for economic growth based on population trends, increasing business activity and above-average employment growth. The following map shows our current operating footprint.
1
Table of Contents
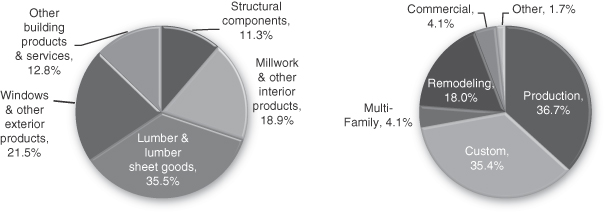
We provide a balanced mix of products and services to U.S. production and custom homebuilders and repair and remodel, multi-family and commercial contractors. The charts below summarize our 2012 revenues by product category and customer segment.
| 2012 revenues |
2012 revenues |
2
Table of Contents
The following table demonstrates the favorable demographic trends in the metropolitan areas in which we operate and the capabilities of our facilities.
| Market |
2012 single family permits |
Year over year single family permit change |
December 2012 unemployment rate |
2012 total employment year over year change |
Distribution & retail operations |
Millwork fabrication |
Structural components fabrication |
Flooring operations |
||||||||||||||||||||||||
| Houston, TX |
28,628 | 25.1 | % | 6.0 | % | 4.0 | % | 4 | 1 | 2 | ||||||||||||||||||||||
| Washington, DC |
10,980 | 13.9 | % | 5.3 | % | 1.1 | % | 3 | 2 | 3 | (7) | |||||||||||||||||||||
| Atlanta, GA |
9,167 | 47.5 | % | 8.4 | % | 2.3 | % | 3 | 2 | 2 | ||||||||||||||||||||||
| Austin, TX |
8,229 | 32.1 | % | 5.0 | % | 3.9 | % | 1 | 1 | 1 | ||||||||||||||||||||||
| Raleigh-Durham, |
8,020 | 27.7 | % | 7.4 | % | 2.8 | % | 4 | 1 | 1 | 3 | (8) | ||||||||||||||||||||
| Charlotte, NC |
6,703 | 36.5 | % | 9.4 | % | 3.2 | % | 1 | 2 | 1 | ||||||||||||||||||||||
| Eastern PA(2) |
5,956 | 14.8 | % | 8.2 | % | 1.0 | % | 1 | 1 | 1 | ||||||||||||||||||||||
| San Antonio, TX |
5,102 | 15.7 | % | 5.7 | % | 2.6 | % | 1 | ||||||||||||||||||||||||
| Salt Lake City, UT(3) |
5,052 | 40.6 | % | 4.9 | % | 4.4 | % | 5 | 3 | 2 | ||||||||||||||||||||||
| Los Angeles, CA |
4,946 | 20.7 | % | 9.4 | % | 2.2 | % | 11 | 2 | 1 | ||||||||||||||||||||||
| Richmond, VA |
2,840 | 20.7 | % | 6.0 | % | 1.1 | % | 1 | 1 | 1 | ||||||||||||||||||||||
| Columbia, SC |
2,791 | 16.8 | % | 7.5 | % | 1.2 | % | 2 | 1 | 2 | (9) | |||||||||||||||||||||
| Greenville, SC |
2,246 | 37.0 | % | 7.0 | % | 1.4 | % | 1 | 1 | |||||||||||||||||||||||
| Greensboro, NC(4) |
2,014 | 2.0 | % | 9.4 | % | 0.9 | % | 1 | 1 | |||||||||||||||||||||||
| Northwest AR(5) |
1,763 | 52.2 | % | 5.1 | % | 3.3 | % | 1 | 1 | 1 | ||||||||||||||||||||||
| Southern Utah(6) |
1,317 | 54.2 | % | 6.6 | % | 5.1 | % | 1 | 1 | |||||||||||||||||||||||
| Albuquerque, NM |
1,259 | (7.0 | %) | 6.7 | % | 0.2 | % | 1 | 1 | 1 | ||||||||||||||||||||||
| Spokane, WA |
963 | 30.1 | % | 8.4 | % | 1.9 | % | 2 | 1 | |||||||||||||||||||||||
| Lubbock, TX |
752 | 8.7 | % | 4.7 | % | 1.6 | % | 2 | 1 | |||||||||||||||||||||||
| Amarillo, TX |
653 | (0.5 | %) | 4.3 | % | 0.4 | % | 2 | ||||||||||||||||||||||||
|
|
|
|
|
|
|
|
|
|
|
|
|
|
|
|
|
|||||||||||||||||
| Total for Stock Building Supply markets |
109,381 | 25.3 | % | 7.5 | % | 2.2 | % | 48 | 19 | 14 | 13 | |||||||||||||||||||||
| U.S. Total |
518,695 | 23.9 | % | 7.8 | % | 1.7 | % | |||||||||||||||||||||||||
Source: U.S. Census Bureau and Bureau of Labor Statistics
| (1) | Durham-Chapel Hill, NC and Raleigh-Cary, NC metropolitan statistical areas (“MSAs”) |
| (2) | Philadelphia-Camden-Wilmington, PA-NJ-DE-MD and Lancaster, PA MSAs |
| (3) | Salt Lake City, UT and Provo-Orem, UT MSAs |
| (4) | Greensboro-High Point, NC and Winston-Salem, NC MSAs |
| (5) | Fayetteville-Springdale-Rogers, AR-MO MSA |
| (6) | St. George, UT MSA |
| (7) | Includes flooring location in Baltimore, MD |
| (8) | Includes flooring location in Fayetteville, NC |
| (9) | Includes flooring location in Charleston, SC |
Since 2010, we have acquired four businesses and, through investments in a proprietary information technology (“IT”) and operational platform, have improved our distribution service capability. We have also integrated each of our local branches with our headquarters in Raleigh, North Carolina. Additionally, we have undertaken efforts to streamline and improve significantly our business processes by adopting a “LEAN” business philosophy to reduce waste and add value. These initiatives allowed us to reduce selling, general and administrative expense by $25.1 million while net sales increased 25.4% from 2010 to 2012. We believe that, as we continue to pursue these initiatives, we will further improve the service and support we provide to our customers, increase the effectiveness of our employees and contractors and improve efficiency across all aspects of our business.
In 2006, our current footprint of facilities generated approximately $1.8 billion in net sales, and we believe that we will achieve attractive growth as our markets recover to normalized levels of new home construction. From 2010 to 2012, our net sales increased $190.7 million, from $751.7 million to $942.4 million. Over the same period, our Adjusted EBITDA increased $60.0 million, from $(58.0) million to $2.0 million, while our net loss decreased $55.5 million, from $70.0 million to $14.5 million. For a reconciliation of
3
Table of Contents
net loss to Adjusted EBITDA, see “—Summary consolidated financial data.” We believe that the housing recovery in our markets will continue to drive significant increases in demand for our products and the significant growth in net sales and Adjusted EBITDA that we have experienced since 2010.
Our industry
The LBM distribution industry in the United States is highly fragmented, with a number of retailers and distributors offering a broad range of products and services. Demand for our products is principally influenced by new residential construction and residential repair and remodeling activity. Following several challenging years, single-family housing starts increased in 2012 to 0.54 million and, as a result, demand for the products we distribute and for our services has also increased. From 2005 to 2011, single-family housing starts in the United States declined by approximately 75%. According to the U.S. Census Bureau, single-family housing starts in 2009, 2010 and 2011 were 0.44 million, 0.47 million and 0.43 million, respectively, which are significantly less than the 50-year average rate of 1.0 million. Approximately 67% of the 52 economists named in the May 2013 Economic Forecasting Survey conducted by The Wall Street Journal expect housing starts in 2013 to reach or exceed 1.0 million for the first time since 2007 and recent national housing statistics confirm that a robust housing recovery is already underway. For example, U.S. single-family housing starts increased 20.2% year-over-year for the six months ended June 30, 2013. Additionally, the Case-Shiller Index, a leading measure of pricing for the U.S. residential housing market, has increased on a year-over-year basis for 11 straight months and is at its highest levels since November 2008.
We believe that there is considerable growth potential in the U.S. housing sector. As of June 2013, McGraw-Hill Construction forecasts that U.S. single-family housing starts will increase to 1.1 million by 2015. Many publicly-traded homebuilders, including Lennar Corporation, D.R. Horton, Inc. and Beazer Homes USA, Inc., have reported strong earnings results and positive financial outlooks in the near-term, confirming the momentum of the housing recovery. For example, net new orders for publicly-traded homebuilders increased 24% year-over-year in the three months ended March 31, 2013, with some publicly-traded homebuilders reporting order increases of over 49%.
The products we distribute are also used in professional remodeling projects. According to the HJCHS, the U.S. remodeling market reached a peak of $328 billion in 2007 before declining approximately 16% to $275 billion in 2011. Despite this decline, factors, including the overall age of the U.S. housing stock, heightened focus on energy efficiency, rising home prices and availability of consumer capital at low interest rates, are expected to drive long-term growth in repair and remodeling expenditures. As of March 2013, HIRI estimates that total U.S. sales of home maintenance, repair and improvement products to the professional market will grow at a rate of 5.0% in 2013, 6.2% in 2014 and 4.9% in 2015.
Our competitive strengths
We believe the following key competitive strengths have contributed to our success and will position us for significant growth as part of a multi-year recovery in our end markets.
Leading distributor of building products to U.S. residential construction markets
We believe we are one of the leading LBM distributors in the United States. We serve all segments of the residential construction industry, including large-scale production homebuilders, custom homebuilders and repair and remodeling contractors. We believe that we are among the top three LBM participants in 80% of the geographic markets in which we operate based on net sales. Because of our leading market position, we believe we are well-positioned to take advantage of the projected recovery in the residential construction market.
4
Table of Contents
Low cost distribution platform with strong operating leverage
Through aggressive cost management and strategic restructuring activities implemented during the global economic downturn, we have driven significant productivity gains and positioned our company for profitable growth. Since 2009, we have closed or sold over 100 facilities in locations that we determined would not provide us with sufficient scale, or where we would otherwise not be able to compete effectively and profitably.
Beginning in 2011, our management team began implementing LEAN business practices to improve customer service, reduce waste and increase productivity. These LEAN initiatives have improved our sourcing practices and streamlined our supply chain and, along with other cost reduction efforts, have reduced our selling, general and administrative expenses as a percent of net sales from 32.8% for the fiscal year ended December 31, 2010 to 23.5% for the fiscal year ended December 31, 2012. Over the same period we have significantly increased productivity and operating leverage as net sales increased by $190.7 million, while selling, general and administrative expenses decreased by $25.1 million. We believe that our current low fixed cost position will help us to generate increased profitability as the market continues to recover.
We have also developed several innovative and proprietary eBusiness systems. These services have enabled us to track our supply chain more accurately, significantly improve customer service and reduce waste. Due in part to our LEAN initiatives and focus on efficiency, our Adjusted EBITDA has increased $60.0 million, from ($58.0) million in 2010 to $2.0 million in 2012, while our net loss has decreased $55.5 million, from $70.0 million in 2010 to $14.5 million in 2012. We believe that our Adjusted EBITDA will continue to increase as a percent of net sales as the residential construction sector rebounds.
Leading local businesses in attractive geographic markets
We operate in 20 metropolitan areas in 13 states that we believe have attractive potential for economic growth, with strong LBM product capabilities in each market we serve. We believe we are one of the top three LBM suppliers in 80% of these markets, based on net sales, with strong customer relationships and a professional team to serve our customers as they grow. Our primary operating regions include the South and West regions of the United States (as defined by the U.S. Census Bureau), which we believe are markets that are well-positioned to grow as the residential construction market recovers. McGraw-Hill Construction forecasts that the compounded annual growth rate for single-family housing starts in our 20 markets will be 24.1% from 2012 to 2015.
Proven ability to acquire and integrate complementary businesses
Our management has demonstrated a core competency in identifying, acquiring and successfully integrating businesses to provide us greater scale in our current markets and opportunities to grow in new markets. Since 2010, we have acquired the assets of four businesses with core LBM capabilities, three of which were in our current markets and one of which provided us with a strategic position in a new market.
While we have significant growth potential in our current operational footprint, we plan to continue to evaluate and acquire attractive businesses in our current geographic markets as well as new geographies to expand service capabilities and customer share to accelerate increases in profitability.
5
Table of Contents
Extensive offering of building materials and services
We offer a comprehensive line of residential building products that are used in the construction of homes, including windows, doors and trim, and many of the products used in the interior and exterior finishing of homes. We also provide manufactured products such as roof and floor trusses, wall panels and various millwork products. We offer over 39,000 different products sourced through our strategic network of suppliers and have access to a wide range of special order products. Additionally, we provide solution-based services to our customers as needed, including design, product specification and installation management services. We believe that the breadth of the products we offer our customers provides us with a strategic advantage and enables us to forge deeper relationships with customers than smaller competitors who may be unable to supply a similar product range and lack access to the broad resources of a national company.
Superior customer service and value-added capabilities
We complement our line of building products with superior customer service and value-added capabilities. Our experienced customer service professionals provide a full range of services, including customized design and installation services specific to each job site and type. We believe that the breadth of our services, our focus on individual customer needs and the integration of our supply chain and fulfillment capabilities set us apart from many of our competitors.
We offer training programs and advanced service tools for our employees in order to assist them in providing solutions for our customers. Our innovative Stock Logistics Solutions capability, in which we provide real-time delivery information and confirmation via the Internet and to mobile devices, is one example of customer service capabilities that have increased customer loyalty and helped us drive growth in our markets.
Integrated supply chain that increases efficiency and benefits customers and suppliers
Although we operate facilities in 20 metropolitan areas across 13 states, we maintain an integrated, national supply chain that we believe enables us to provide our customers with superior services, timely delivery and more favorable pricing. We have integrated our sourcing and purchasing operations into a central procurement function. Over the last ten years, we have invested in an Enterprise Resource Planning (“ERP”) system that integrates each of our local branches with our headquarters operation. Our ERP system allows us to manage customer orders and deliver efficiently across our entire organization. It also enables central product replenishment and optimizes inventory management to improve working capital requirements. Through Stock Logistics Solutions, which includes a mobile Global Positioning System (“GPS”) application on our delivery trucks that is integrated with our ERP software, our sales and service professionals can better schedule, dispatch and manage customer deliveries.
Our integrated sourcing and purchasing operations have enabled us to develop cost-effective national sourcing agreements with key suppliers that provide us with product delivery certainty and favorable terms. Through these sourcing agreements we are also able to realize stronger gross margins (defined as gross profit as a percentage of net sales) and achieve superior inventory management, especially during periods of market growth as product supply in the industry becomes more limited. Additionally, our broad reach, efficient operations and significant growth potential offer our suppliers an opportunity to strategically partner with us for growth, which further strengthens their loyalty to us.
6
Table of Contents
Experienced management team and principal equity holder
Our senior management team has more than 120 years of combined experience in manufacturing and distribution with a track record of financial and operational excellence in both favorable and challenging market conditions. Since 1987, our equity sponsor Gores has acquired and operated more than 80 companies while employing a consistent, operationally-oriented approach to create value in its businesses.
Our strategy
We intend to capitalize on our strong market position in LBM distribution to increase revenues and profits and maximize operating cash flow as the U.S. housing market recovers. We seek to achieve this by executing on the following strategies:
Expand our business with existing customers by offering additional value
We plan to continue to grow our net sales by increasing our share of our existing customers’ business. Products and services we intend to expand organically include millwork and structural components manufacturing, enhanced specification and design services, and additional LEAN eBusiness solutions for our customers and our sales and service professionals.
Expand in existing, adjacent and new geographies
We plan to expand our business through organic and acquisitive means in order to take advantage of our national supply chain and broad LBM capabilities. In addition, while we have operations in 13 states that accounted for approximately 48% of 2012 U.S. single-family housing permits, our markets within those states accounted for less than half of those permits according to the U.S. Census Bureau, providing significant opportunity for growth into markets adjacent to our current markets within these states. We believe that our scale, integrated supply chain, product knowledge, eBusiness solutions and professional customer service will enable us to grow significantly as we expand in our existing markets and in markets adjacent to our existing markets within the states where we currently operate, as well as into additional states as market and competitive conditions support further growth. We believe that our balance sheet and liquidity position will support our growth strategy.
Deliver leading customer service, productivity and operational excellence as our business grows
We strive for continued operational excellence. We have implemented a talent training and development program focused on specific skills training, business development and LEAN initiatives. We believe that the customer service and productivity gains we realized from these initiatives will continue to improve as they are implemented more broadly across our organization.
We completed an ERP implementation across all branches, and our proprietary eBusiness system, which includes Stock Logistics Solutions, will provide the platform for continued service improvements. We believe that there is an opportunity for further margin improvement as we expand our business and continue to implement LEAN initiatives that bring value to our customers.
Selectively pursue strategic acquisitions
Our industry remains highly fragmented. We intend to focus on using our operating platform and proven integration capabilities to pursue additional acquisition opportunities while minimizing execution
7
Table of Contents
risk. We will focus on investments in markets adjacent to our existing operations or acquisitions that enhance our presence and capabilities in our 20 existing metropolitan areas. Additionally, we will consider acquiring operations or companies to enter new geographic regions. We believe our capital structure positions us to acquire businesses we find strategically attractive.
Selected risks associated with our business
There are a number of risks and uncertainties that may affect our financial and operating performance and our growth prospects. You should carefully consider all of the risks discussed in “Risk Factors” before investing in our common stock. These risks include, but are not limited to, the following:
| Ÿ | the state of the homebuilding industry and repair and remodeling activity; |
| Ÿ | seasonality and cyclicality of the building products supply and services industry; |
| Ÿ | competitive industry pressures and competitive pricing pressure from our customers; |
| Ÿ | inflation or deflation of commodity prices; |
| Ÿ | litigation or warranty claims relating to our products and services; |
| Ÿ | our ability to maintain profitability; |
| Ÿ | our ability to attract and retain key employees; and |
| Ÿ | product shortages and relationships with key suppliers. |
Corporate changes
On May 2, 2013, we converted from a Delaware limited liability company into a Delaware corporation by filing a certificate of conversion in Delaware and changed our name from Saturn Acquisition Holdings, LLC to Stock Building Supply Holdings, Inc. and on July 29, 2013, we effected a 25.972-for-1 split of our Class A voting common stock and Class B non-voting common stock.
Upon consummation of this offering, our authorized capital stock will consist of 300,000,000 shares of a single class of common stock and 50,000,000 shares of preferred stock. Immediately prior to such time, upon the effectiveness of our amended and restated certificate of incorporation, all outstanding shares of our Class A voting common stock and Class B non-voting common stock will convert into an equal number of shares of a single class of common stock, all outstanding options to purchase Class B non-voting common stock held by certain members of our management will convert into options to purchase an equal number of shares of our common stock and all outstanding shares of our Class A junior preferred stock, Class B senior preferred stock and Class C convertible preferred stock will convert into an aggregate of 6,707,898 shares of common stock (assuming an initial public offering price of $17.00 per share, which is the midpoint of the price range set forth on the cover of this prospectus, and assuming a closing date of August 12, 2013, as applicable). See “—The offering” and “Capitalization—Conversion of Preferred Stock.”
Preliminary financial results for the three months and six months ended June 30, 2013
Set forth below are certain preliminary estimates of our results of operations for our three and six month periods ended June 30, 2013. We have not yet closed our books and finalized our financial results for the three and six months ended June 30, 2013, and our consolidated financial statements and related notes as of and for the three and six months ended June 30, 2013 are not expected to be filed with the SEC until after this offering is completed. Since we have not closed our books, our final results for the period may differ from estimates set forth below due to the completion of our financial
8
Table of Contents
closing procedures, final adjustments and other developments that may arise between now and the time when we issue our financial results for the second quarter. Any changes could be material. See “Special Note Regarding Forward-Looking Statements.”
The preliminary financial data included below has been prepared by, and is the responsibility of, our management. PricewaterhouseCoopers LLP has not audited, reviewed, compiled or performed any procedures with respect to such preliminary financial data. Accordingly, PricewaterhouseCoopers LLP does not express an opinion or any other form of assurance with respect thereto.
We are providing the following preliminary estimates of our financial results and operating metrics for the three and six months ended June 30, 2013:
| Ÿ | For the three months ended June 30, 2013, we expect net sales to be between $313.7 million and $315.3 million, as compared to net sales of $246.5 million for the three months ended June 30, 2012. For the six months ended June 30, 2013, we expect net sales to be between $562.4 million and $564.0 million, as compared to net sales of $434.4 million for the six months ended June 30, 2012. The estimated increase in net sales for both periods was primarily the result of increased sales volumes associated with the improving residential construction market and increased selling prices for lumber and lumber sheet goods. |
| Ÿ | For the three months ended June 30, 2013, we expect gross profit to be between $70.5 million and $71.3 million, as compared to gross profit of $55.1 million for the three months ended June 30, 2012. For the six months ended June 30, 2013, we expect gross profit to be between $124.3 million and $125.1 million, as compared to gross profit of $98.5 million for the six months ended June 30, 2012. The estimated increase in gross profit for both periods was primarily the result of increased sales volumes and selling prices as described above. |
| Ÿ | For the three months ended June 30, 2013, we expect Adjusted EBITDA to be between $8.5 million and $9.5 million, as compared to Adjusted EBITDA of $2.3 million for the three months ended June 30, 2012, and net income to be between $1.3 million and $2.3 million, as compared to net loss of $2.2 million for the three months ended June 30, 2012, in each case primarily due to the higher gross profits described above. For the six months ended June 30, 2013, we expect Adjusted EBITDA to be between $7.3 million and $8.3 million as compared to Adjusted EBITDA of $(5.3) million for the six months ended June 30, 2012 and we expect net loss to be between $1.7 million and $2.7 million, as compared to net loss of $10.8 million for the six months ended June 30, 2012. |
As of June 30, 2013, we had outstanding borrowings of $117.7 million, with estimated net availability of $22.3 million, under our revolving line of credit (the “Revolver”) under our secured credit agreement (the “Credit Agreement”). The increase in outstanding borrowings of $25.2 million from March 31, 2013 to June 30, 2013 was primarily due to seasonal and other increases in working capital associated with the increase in our net sales. As of June 30, 2013, cash and cash equivalents totaled approximately $9.1 million.
9
Table of Contents
The following is a reconciliation of estimated net income (loss) to estimated EBITDA and Adjusted EBITDA. See “—Summary consolidated financial data” for the definition of Adjusted EBITDA and the reasons for providing these financial measures and the limitations of these measures, which do not reflect all items of income and expense as reported under GAAP.
| Three months ended June 30, | Six months ended June 30, | |||||||||||||||||||||||
| (dollars in thousands) | 2012 | 2013-Low | 2013-High | 2012 | 2013-Low | 2013-High | ||||||||||||||||||
| (as restated)(e) | (estimated) | (estimated) | (as restated)(e) | (estimated) | (estimated) | |||||||||||||||||||
| Net income (loss) |
$ | (2,237 | ) | $ | 1,320 | $ | 2,320 | $ | (10,803 | ) | $ | (2,737 | ) | $ | (1,737 | ) | ||||||||
| Interest expense |
1,085 | 1,300 | 1,200 | 2,048 | 2,325 | 2,225 | ||||||||||||||||||
| Income tax expense (benefit) |
(1,293 | ) | 880 | 1,290 | (5,556 | ) | (999 | ) | (589 | ) | ||||||||||||||
| Depreciation and amortization |
3,031 | 3,150 | 3,050 | 6,061 | 6,109 | 6,009 | ||||||||||||||||||
|
|
|
|
|
|
|
|
|
|
|
|
|
|||||||||||||
| EBITDA |
$ | 586 | $ | 6,650 | $ | 7,860 | $ | (8,250 | ) | $ | 4,698 | $ | 5,908 | |||||||||||
| Restructuring, severance, other expense related to store closures and business optimization (a) |
538 | 420 | 350 | 825 | 653 | 583 | ||||||||||||||||||
| Discontinued operations, net of tax benefit(b) |
128 | (90 | ) | (100 | ) | 241 | (247 | ) | (257 | ) | ||||||||||||||
| Management fees(c) |
362 | 600 | 560 | 767 | 1,006 | 966 | ||||||||||||||||||
| Non-cash compensation expense |
351 | 125 | 115 | 679 | 271 | 261 | ||||||||||||||||||
| Acquisition costs |
— | 125 | 100 | 46 | 228 | 203 | ||||||||||||||||||
| Reduction of tax indemnification asset(d) |
347 | — | — | 347 | — | — | ||||||||||||||||||
| Non-capitalizable expenses associated with the offering |
— | 670 | 615 | — | 670 | 615 | ||||||||||||||||||
|
|
|
|
|
|
|
|
|
|
|
|
|
|||||||||||||
| Adjusted EBITDA |
$ | 2,312 | $ | 8,500 | $ | 9,500 | $ | (5,345 | ) | $ | 7,279 | $ | 8,279 | |||||||||||
|
|
|
|
|
|
|
|
|
|
|
|
|
|||||||||||||
| (a) | Represents (i) $0.1 million of restructuring expense related to store closures for the six months ended June 30, 2013, (ii) $0.2 million, $0.1 million, $0.3 million and $0.1 million of severance expense for the three months ended June 30, 2012 and 2013 and the six months ended June 30, 2012 and 2013, respectively, and (iii) $0.3 million, $0.2 million, $0.5 million and $0.4 million related to closed locations, consisting of post-closure expenses for the three months ended June 30, 2012 and 2013 and the six months ended June 30, 2012 and 2013, respectively. |
| (b) | During the year ended December 31, 2012, we ceased operations in certain geographic markets due to declines in residential homebuilding throughout the United States. The cessation of operations in these markets has been treated as discontinued operations as the markets had distinguishable cash flows and operations that have been eliminated from ongoing operations. |
| (c) | Represents the expense for management services provided by Gores and its affiliates. |
10
Table of Contents
| (d) | Includes $0.3 million of expense related to the reduction of a tax indemnification asset, with a corresponding increase in income tax benefit, for the three months ended June 30, 2012 and the six months ended June 30, 2012. This indemnification asset corresponds to the long-term liability related to uncertain tax positions for which Wolseley had indemnified the Company, which was reduced upon the expiration of the statute of limitations for certain tax periods. |
| (e) | Our consolidated financial statements and related footnotes as of December 31, 2012 and March 31, 2013, for the year ended December 31, 2012 and for the three months ended March 31, 2012 and 2013 have been restated. See note (2) to our audited and unaudited financial statements included elsewhere in this prospectus. |
Company background and corporate information
The Company’s predecessor was founded as Carolina Builders Corporation in Raleigh, North Carolina in 1922 and began operating under the Stock Building Supply name in 2003.
In May 2009, Gores Building Holdings, LLC (“Gores Holdings”), an affiliate of Gores, formed the Company as a new subsidiary and the Company acquired our subsidiary, Stock Building Supply Holdings, LLC, from an affiliate of Wolseley plc (“Wolseley”). In connection with the acquisition, Gores Holdings retained 51% of the Company’s equity interests and issued the remaining interests to Wolseley. Following the acquisition, our subsidiary immediately entered into a prepackaged reorganization plan pursuant to Chapter 11 of the Bankruptcy Code. The prepackaged reorganization was pursuant to a pre-arranged plan with the Company’s creditors, which took effect upon filing and enabled us to terminate certain real property leases in undesirable locations in exchange for payment of a statutory amount of damages. In November 2011, Gores Holdings purchased the remaining minority interest in us from Wolseley. On May 2, 2013, the Company converted to a corporation and changed its name to Stock Building Supply Holdings, Inc. from Saturn Acquisition Holdings, LLC. We are currently owned by Gores Holdings and its affiliates and members of our senior management. Stock Building Supply Holdings, Inc. is a holding company that derives all of its operating income from its subsidiaries.
Our principal executive offices are located at 8020 Arco Corporate Drive, Suite 400, Raleigh, North Carolina 27617. Our telephone number at that location is (919) 431-1000. Our website address is www.stocksupply.com. The reference to our website is a textual reference only. We do not incorporate the information on or accessible through our website into this prospectus and you should not consider any information on, or that can be accessed through our website as part of this prospectus.
Our equity sponsor
Gores is a control oriented private equity firm specializing in acquiring and partnering with businesses that can benefit from its operational expertise and flexible capital base. Gores combines the operational and due diligence capabilities of a strategic buyer with the seasoned mergers and acquisitions team of a traditional financial buyer. Since 1987, Gores has acquired and operated more than 80 companies while employing a consistent, operationally-oriented approach to create value in its businesses alongside management. Its current portfolio includes companies across diverse industries in which its partners have considerable experience, including technology, telecommunications, business services, industrial, healthcare, media and entertainment, and consumer products. Headquartered in Los Angeles, as of December 31, 2012, Gores had approximately $3.6 billion in assets under management.
11
Table of Contents
The offering
| Common stock offered by us |
4,411,765 shares |
| Common stock offered by the selling stockholders |
4,411,765 shares |
| Common stock outstanding immediately after this offering |
25,580,380 shares |
| Option to purchase additional shares |
The selling stockholders have agreed to allow the underwriters to purchase up to an additional 1,323,530 shares from the selling stockholders, at the public offering price, less the underwriting discount, within 30 days of the date of this prospectus. |
| Use of proceeds |
We expect to receive net proceeds from this offering of approximately $67.5 million, based upon an assumed initial public offering price of $17.00 per share, which is the midpoint of the price range set forth on the cover of this prospectus, and after deducting underwriting discounts and estimated offering expenses payable by us. We will not receive any of the proceeds from the sale of shares of our common stock by the selling stockholders. |
| We intend to use the net proceeds from this offering to pay approximately $58.5 million of the outstanding balances under our Revolver and to pay a fee of $9.0 million to Gores to terminate our management services agreement with Gores. We will not receive any of the proceeds from the sale of shares of common stock by the selling stockholders. See “Use of Proceeds.” |
| Dividend policy |
We do not plan to pay dividends on our common stock. The declaration and payment of all future dividends, if any, will be at the discretion of our board of directors and will depend upon our financial condition, earnings, contractual conditions, restrictions imposed by our Credit Agreement and other factors that our board of directors may deem relevant. See “Dividend Policy.” |
| Risk factors |
See “Risk Factors” and the other information in this prospectus for a discussion of the factors you should consider before you decide to invest in our common stock. |
| Conflicts of interest |
The offering is being conducted in accordance with the applicable provisions of Rule 5121 of the Conduct Rules of the Financial Industry Regulatory Authority, Inc. (“FINRA”), because Wells Fargo Securities, LLC will have a “conflict of interest” pursuant to Rule 5121(f)(5)(C)(i) by virtue of the role of its affiliate as a lender under our Revolver, since a portion of the net proceeds of this offering will be received by such affiliate according to its proportionate share in its capacity as lender. See “Underwriting—Conflicts of interest.” |
12
Table of Contents
| Directed share program |
At our request, the underwriters have reserved up to 5% of the shares offered hereby for sale at the initial public offering price to persons who are directors, officers or other employees, or who are otherwise associated with us, through a directed share program. The number of shares available for sale to the general public will be reduced by the number of directed shares purchased by participants in the program. See “Underwriting.” |
| Proposed symbol for trading on NASDAQ |
We have been approved to list our common stock on the NASDAQ Stock Market (“NASDAQ”) under the symbol “STCK.” |
Unless otherwise indicated, all information in this prospectus relating to the number of shares of our common stock to be outstanding immediately after this offering:
| Ÿ | gives effect to the conversion of Saturn Acquisition Holdings, LLC into Stock Building Supply Holdings, Inc. on May 2, 2013 and the 25.972-for-1 split of our Class A voting common stock and Class B non-voting common stock effected on July 29, 2013; |
| Ÿ | assumes the effectiveness of our amended and restated certificate of incorporation, which we will adopt immediately prior to the completion of this offering; |
| Ÿ | gives effect to the conversion of all outstanding shares of our Class A voting common stock and Class B non-voting common stock into an aggregate of 14,460,717 shares of a single class of common stock immediately prior to the completion of this offering; |
| Ÿ | gives effect to the conversion immediately prior to completion of this offering of all outstanding: (i) Class A junior preferred stock into an aggregate of 300 shares of common stock (assuming an initial public offering price of $17.00 per share, which is the midpoint of the price range set forth on the cover of this prospectus); (ii) Class B senior preferred stock into an aggregate of 2,252,709 shares of common stock (assuming an initial public offering price of $17.00 per share, which is the midpoint of the price range set forth on the cover of this prospectus, and assuming a closing date of August 12, 2013); and (iii) Class C convertible preferred stock into an aggregate of 4,454,889 shares of common stock, in each case, as further described under “Capitalization—Conversion of Preferred Stock;” |
| Ÿ | assumes (i) no exercise of the underwriters of their option to purchase up to 1,323,530 additional shares and (ii) an initial public offering price of $17.00 per share, which is the midpoint of the price range set forth on the cover of this prospectus; and |
| Ÿ | excludes (i) options to purchase 226,607 shares of common stock that will be outstanding upon completion of this offering with an average exercise price of $0.97, (ii) approximately $0.6 million worth of restricted stock valued at the initial public offering price to be awarded upon completion of the offering to certain executive officers and directors (35,294 shares assuming an initial offering price of $17.00 per share), (iii) restricted shares or options to purchase an amount of shares of our common stock collectively equal to 600,000 shares, less the restricted shares and options to purchase an amount of shares awarded to our executive officers and directors described in item (ii) above, to be awarded to executive officers and other employees upon completion of the offering with an exercise price set at the initial public offering price and (iv) an aggregate of 1,200,000 additional shares of our common stock reserved for issuance under the new equity incentive plan we intend to adopt in connection with this offering (the “2013 Incentive Plan”) as described in “Executive Compensation—2013 Incentive Plan.” |
13
Table of Contents
A $1.00 increase in the assumed initial public offering price of $17.00 per share, which is the midpoint of the price range set forth on the cover of this prospectus, would decrease the aggregate number of shares of common stock issuable upon conversion of our Class A junior preferred stock and Class B senior preferred stock by 125,167 shares (assuming a closing date of August 12, 2013). A $1.00 decrease in the assumed initial public offering price of $17.00 per share, which is the midpoint of the range set forth on the cover of this prospectus, would increase the aggregate number of shares of common stock issuable upon conversion of our Class A junior preferred stock and Class B senior preferred stock by 140,813 shares (assuming a closing date of August 12, 2013). Each one-day later (earlier) change in the closing date would increase (decrease) the aggregate number of shares by 496 shares (assuming an initial public offering price of $17.00 per share, which is the midpoint of the price range set forth on the cover of this prospectus).
14
Table of Contents
Summary consolidated financial data
The following tables set forth our summary consolidated financial data. The summary consolidated financial data as of December 31, 2011 and 2012 and for the years ended December 31, 2010, 2011 and 2012 have been derived from our audited consolidated financial statements included elsewhere in this prospectus. The summary consolidated financial data as of December 31, 2010 have been derived from our audited consolidated financial statements, which are not included in this prospectus. The summary consolidated financial data as of March 31, 2013 and for the three-month periods ended March 31, 2012 and 2013 have been derived from our unaudited consolidated financial statements. The unaudited consolidated financial statements include all of our accounts and the accounts of our subsidiaries and, in the opinion of management, include all recurring adjustments and normal accruals necessary for a fair presentation of our financial position, results of operations and cash flows for the dates and periods presented. These financial statements should be read in conjunction with our most recent audited annual financial statements. Results for interim periods are not necessarily indicative of the results to be expected during the remainder of the current year or for any future period.
You should read the information set forth below in conjunction with “Use of Proceeds,” “Capitalization,” “Management’s Discussion and Analysis of Financial Condition and Results of Operations” and our consolidated financial statements and notes thereto included elsewhere in this prospectus. Our historical consolidated financial data may not be indicative of our future performance.
| Year ended December 31, | Three months ended March 31, | |||||||||||||||||||
| (in thousands, except shares and per share data) |
2010 | 2011 | 2012 | 2012 | 2013 | |||||||||||||||
| (as restated)(11) | (as restated)(11) | (as restated)(11) | ||||||||||||||||||
| Statement of operations information: |
||||||||||||||||||||
| Net sales |
$ | 751,706 | $ | 759,982 | $ | 942,398 | $ | 187,939 | $ | 248,726 | ||||||||||
| Cost of goods sold(1) |
587,692 | 591,017 | 727,670 | 144,508 | 194,936 | |||||||||||||||
|
|
|
|
|
|
|
|
|
|
|
|||||||||||
| Gross profit |
164,014 | 168,965 | 214,728 | 43,431 | 53,790 | |||||||||||||||
| Operating expenses: |
||||||||||||||||||||
| Selling, general and administrative expenses(2) |
246,338 | 213,036 | 221,192 | 52,834 | 56,802 | |||||||||||||||
| Depreciation expense |
29,337 | 11,844 | 7,759 | 2,067 | 1,639 | |||||||||||||||
| Amortization expense |
1,140 | 1,457 | 1,470 | 365 | 547 | |||||||||||||||
| Impairment of assets held for sale(3) |
2,944 | 580 | 361 | — | — | |||||||||||||||
| Restructuring expense(4) |
7,089 | 1,349 | 2,853 | 44 | 60 | |||||||||||||||
|
|
|
|
|
|
|
|
|
|
|
|||||||||||
| Loss from operations |
(122,834 | ) | (59,301 | ) | (18,907 | ) | (11,879 | ) | (5,258 | ) | ||||||||||
| Other income (expenses): |
||||||||||||||||||||
| Bargain purchase gain(5) |
11,223 | — | — | — | — | |||||||||||||||
| Interest expense |
(1,575 | ) | (2,842 | ) | (4,037 | ) | (963 | ) | (1,025 | ) | ||||||||||
| Other income (expense), net(6) |
(57 | ) | (2,120 | ) | 278 | 126 | 190 | |||||||||||||
|
|
|
|
|
|
|
|
|
|
|
|||||||||||
| Loss from continuing operations before income taxes |
(113,243 | ) | (64,263 | ) | (22,666 | ) | (12,716 | ) | (6,093 | ) | ||||||||||
| Income tax benefit(6) |
47,463 | 22,332 | 8,084 | 4,263 | 1,879 | |||||||||||||||
|
|
|
|
|
|
|
|
|
|
|
|||||||||||
| Loss from continuing operations |
(65,780 | ) | (41,931 | ) | (14,582 | ) | (8,453 | ) | (4,214 | ) | ||||||||||
| Income (loss) from discontinued operations, net of tax benefit (provision) of $4,038, $(658), $(52), 79 and (109), respectively(7) |
(4,214 | ) | (202 | ) | 49 | (113 | ) | 157 | ||||||||||||
|
|
|
|
|
|
|
|
|
|
|
|||||||||||
| Net loss |
(69,994 | ) | (42,133 | ) | (14,533 | ) | (8,566 | ) | (4,057 | ) | ||||||||||
| Redeemable Class B Senior Preferred stock dividend |
(5,079 | ) | (4,188 | ) | (4,480 | ) | (1,100 | ) | (729 | ) | ||||||||||
| Accretion of beneficial conversion feature on Convertible Class C Preferred stock |
— | — | (5,000 | ) | (5,000 | ) | — | |||||||||||||
|
|
|
|
|
|
|
|
|
|
|
|||||||||||
| Loss attributable to common stockholders |
$ | (75,073 | ) | $ | (46,321 | ) | $ | (24,013 | ) | $ | (14,666 | ) | $ | (4,786 | ) | |||||
|
|
|
|
|
|
|
|
|
|
|
|||||||||||
| Basic and diluted loss per common share(8): |
||||||||||||||||||||
| Loss from continuing operations |
$ | (3.01 | ) | $ | (2.07 | ) | $ | (1.83 | ) | $ | (1.15 | ) | $ | (0.36 | ) | |||||
| Income (loss) from discontinued operations |
(0.18 | ) | (0.01 | ) | — | (0.01 | ) | 0.01 | ||||||||||||
|
|
|
|
|
|
|
|
|
|
|
|||||||||||
| Net loss |
$ | (3.19 | ) | $ | (2.08 | ) | $ | (1.83 | ) | $ | (1.16 | ) | $ | (0.35 | ) | |||||
|
|
|
|
|
|
|
|
|
|
|
|||||||||||
15
Table of Contents
| Year ended December 31, | Three months ended March 31, | |||||||||||||||||||
| (in thousands, except shares and per share data) |
2010 | 2011 | 2012 | 2012 | 2013 | |||||||||||||||
|
(as restated)(11) |
(as restated)(11) | (as restated)(11) | ||||||||||||||||||
| Weighted average number of common shares outstanding, basic and diluted(8) |
23,502,470 | 22,262,337 | 13,153,446 | 12,662,556 | 13,523,270 | |||||||||||||||
| Pro forma (as adjusted) basic and diluted loss per common share(9): |
||||||||||||||||||||
| Loss from continuing operations |
|
$ | (0.58 | ) | $ | (0.34 | ) | $ | (0.16 | ) | ||||||||||
| Income (loss) from discontinued operations |
|
— | (0.01 | ) | — | |||||||||||||||
|
|
|
|
|
|
|
|||||||||||||||
| Net loss |
|
$ | (0.58 | ) | $ | (0.35 | ) | $ | (0.16 | ) | ||||||||||
|
|
|
|
|
|
|
|||||||||||||||
| Weighted average common shares used in computing pro forma (as adjusted) basic and diluted loss per common share |
|
25,255,523 | 24,764,633 | 25,625,347 | ||||||||||||||||
| Statements of cash flows data: |
||||||||||||||||||||
| Net cash provided by (used in): |
||||||||||||||||||||
| Operating activities |
$ | (57,999 | ) | $ | (7,001 | ) | $ | (12,243 | ) | $ | (10,900 | ) | $ | (17,641 | ) | |||||
| Investing activities |
8,093 | 7,322 | (4,861 | ) | 1,165 | 1,466 | ||||||||||||||
| Financing activities |
(20,415 | ) | 138 | 14,838 | 10,039 | 19,239 | ||||||||||||||
| Other financial data: |
||||||||||||||||||||
| Depreciation and amortization |
$ | 36,149 | $ | 16,188 | $ | 11,718 | $ | 3,030 | $ | 2,959 | ||||||||||
| Capital expenditures |
2,506 | 1,339 | 2,741 | 705 | 374 | |||||||||||||||
| EBITDA(10) |
(79,733 | ) | (45,435 | ) | (6,862 | ) | (8,836 | ) | (1,952 | ) | ||||||||||
| Adjusted EBITDA(10) |
(57,987 | ) | (30,799 | ) | 1,993 | (7,657 | ) | (1,221 | ) | |||||||||||
| Balance sheet data (at period end): |
||||||||||||||||||||
| Cash and cash equivalents |
$ | 4,498 | $ | 4,957 | $ | 2,691 | $ | 5,261 | $ | 5,755 | ||||||||||
| Total current assets |
188,227 | 155,455 | 194,345 | 189,509 | 230,255 | |||||||||||||||
| Property and equipment, net of accumulated depreciation |
72,821 | 57,759 | 55,076 | 55,492 | 54,302 | |||||||||||||||
| Total assets |
294,970 | 254,641 | 286,012 | 283,423 | 320,499 | |||||||||||||||
| Total debt |
15,174 | 35,915 | 79,182 | 45,787 | 100,292 | |||||||||||||||
| Redeemable preferred stock |
50,809 | 54,997 | 41,477 | 61,097 | 42,206 | |||||||||||||||
| Total stockholders’ equity(8) |
122,229 | 51,426 | 34,164 | 42,213 | 29,522 | |||||||||||||||
| (1) | Includes depreciation expense of $5.7 million, $2.9 million, $2.5 million, $0.6 million and $0.8 million for the years ended December 31, 2010, 2011 and 2012, and the three months ended March 31, 2012 and 2013, respectively. |
| (2) | Includes severance expense of $1.6 million, $2.0 million, $0.5 million, $0.1 million and $0 for the years ended December 31, 2010, 2011 and 2012, and the three months ended March 31, 2012 and 2013, respectively. |
| (3) | Impairment of assets held for sale represents the write down of such assets to the lower of depreciated cost or estimated fair value less expected disposition costs. See note (9) to our audited financial statements included elsewhere in this prospectus. |
| (4) | Relates to store closures and workforce reductions in continuing markets. |
| (5) | Represents the excess of the net assets acquired over the purchase price of certain assets and liabilities of National Home Centers, Inc. (“NHC”) in April 2010. See note (4) to our audited financial statements included elsewhere in this prospectus. |
| (6) | Includes $3.1 million, $1.9 million and $0.4 million of expense related to the reduction of a tax indemnification asset, with a corresponding increase in income tax benefit, for the years ended December 31, 2010, 2011 and 2012, respectively. This indemnification asset corresponds to the long-term liability related to uncertain tax positions for which Wolseley had indemnified the Company, which was reduced upon the expiration of the statute of limitations for certain tax periods. See note (15) to our audited financial statements included elsewhere in this prospectus. |
| (7) | During the years ended December 31, 2010, 2011 and 2012, we ceased operations in certain geographic markets due to declines in residential homebuilding throughout the United States. The cessation of operations in these markets has been treated as discontinued operations as the markets had distinguishable cash flows and operations that have been eliminated from ongoing operations. See note (5) to our audited financial statements included elsewhere in this prospectus. |
16
Table of Contents
| (8) | We have adjusted our historical financial statements to retroactively reflect the conversion from a limited liability company to a corporation on May 2, 2013 and the change of members’ equity to stockholders’ equity and the 25.972 -for-1 split of our Class A voting common stock and Class B non-voting common stock effected on July 29, 2013. |
| (9) | Pro forma (as adjusted) basic and diluted loss per common share and number of weighted average common shares used in computing pro forma (as adjusted) basic and diluted loss per common share in the table above give effect to (i) this offering and (ii) the conversion of all of our outstanding preferred stock into common stock upon the closing of this offering as if such conversion had occurred as of January 1, 2012, and assuming an initial public offering price of $17.00 per share, which is the midpoint of the price range set forth on the cover of this prospectus, with respect to the Class A junior preferred stock and Class B senior preferred stock. See “Capitalization—Conversion of Preferred Stock.” |
| (10) | EBITDA is defined as net loss before interest, income taxes and depreciation and amortization. Adjusted EBITDA is defined as EBITDA plus impairment of assets held for sale, restructuring, severance and other expenses related to store closures and business optimization, bargain purchase gain, discontinued operations, management fees, non-cash compensation, acquisition costs, other expense resulting from the reduction of a tax indemnification asset and certain other items. Adjusted EBITDA is intended as a supplemental measure of our performance that is not required by, or presented in accordance with, generally accepted accounting principles in the United States (“GAAP”). We believe that EBITDA and Adjusted EBITDA provide useful information to management and investors regarding certain financial and business trends relating to our financial condition and operating results. Our management uses EBITDA and Adjusted EBITDA to compare the Company’s performance to that of prior periods for trend analyses, for purposes of determining management incentive compensation, and for budgeting and planning purposes. These measures are used in monthly financial reports prepared for management and our board of directors. We believe that the use of EBITDA and Adjusted EBITDA provides an additional tool for investors to use in evaluating ongoing operating results and trends and in comparing the Company’s financial measures with other distribution and retail companies, which may present similar non-GAAP financial measures to investors. Our management does not consider EBITDA or Adjusted EBITDA in isolation or as an alternative to financial measures determined in accordance with GAAP. The principal limitation of EBITDA and Adjusted EBITDA is that they exclude significant expenses and income that are required by GAAP to be recorded in the Company’s financial statements. Some of these limitations are: (i) EBITDA and Adjusted EBITDA do not reflect changes in, or cash requirements for, our working capital needs; (ii) EBITDA and Adjusted EBITDA do not reflect our interest expense, or the requirements necessary to service interest or principal payments on our debt; (iii) EBITDA and Adjusted EBITDA do not reflect our income tax expenses or the cash requirements to pay our taxes; (iv) EBITDA and Adjusted EBITDA do not reflect historical cash expenditures or future requirements for capital expenditure or contractual commitments; and (v) although depreciation and amortization charges are non-cash charges, the assets being depreciated and amortized will often have to be replaced in the future and EBITDA and Adjusted EBITDA do not reflect any cash requirements for such replacements. In order to compensate for these limitations, management presents EBITDA and Adjusted EBITDA in connection with GAAP results. You should review the reconciliation of net loss to EBITDA and Adjusted EBITDA below, and not rely on any single financial measure to evaluate our business. |
17
Table of Contents
The following is a reconciliation of net loss to EBITDA and Adjusted EBITDA.
| Year ended December 31, | Three months ended March 31, |
|||||||||||||||||||
| (dollars in thousands) | 2010 | 2011 | 2012 | 2012 | 2013 | |||||||||||||||
| (as restated)(i) | (as restated)(i) | (as restated)(i) | ||||||||||||||||||
| Net loss |
$ | (69,994 | ) | $ | (42,133 | ) | $ | (14,533 | ) | $ | (8,566 | ) | $ | (4,057 | ) | |||||
| Interest expense |
1,575 | 2,842 | 4,037 | 963 | 1,025 | |||||||||||||||
| Income tax benefit |
(47,463 | ) | (22,332 | ) | (8,084 | ) | (4,263 | ) | (1,879 | ) | ||||||||||
| Depreciation and amortization |
36,149 | 16,188 | 11,718 | 3,030 | 2,959 | |||||||||||||||
|
|
|
|
|
|
|
|
|
|
|
|||||||||||
| EBITDA |
$ | (79,733 | ) | $ | (45,435 | ) | $ | (6,862 | ) | $ | (8,836 | ) | $ | (1,952 | ) | |||||
| Impairment of assets held for sale(a) |
2,944 | 580 | 361 | — | — | |||||||||||||||
| Restructuring, severance, other expense related to store closures and business optimization(b) |
19,731 | 8,110 | 5,228 | 287 | 233 | |||||||||||||||
| Bargain purchase gain(c) |
(11,223 | ) | — | — | — | — | ||||||||||||||
| Discontinued operations, net of tax benefit(d) |
4,214 | 202 | (49 | ) | 113 | (157 | ) | |||||||||||||
| Management fees(e) |
2,597 | 2,406 | 1,379 | 405 | 406 | |||||||||||||||
| Non-cash compensation expense |
288 | 384 | 1,305 | 328 | 146 | |||||||||||||||
| Acquisition costs(f) |
4,086 | 1,017 | 284 | 46 | 103 | |||||||||||||||
| Reduction of tax indemnification asset(g) |
3,056 | 1,937 | 347 | — | — | |||||||||||||||
| Other items(h) |
(3,947 | ) | — | — | — | — | ||||||||||||||
|
|
|
|
|
|
|
|
|
|
|
|||||||||||
| Adjusted EBITDA |
$ | (57,987 | ) | $ | (30,799 | ) | $ | 1,993 | $ | (7,657 | ) | $ | (1,221 | ) | ||||||
|
|
|
|
|
|
|
|
|
|
|
|||||||||||
| (a) | See note (3) above. |
| (b) | See notes (2) and (4) above. Also includes (i) $7.7 million, $3.9 million, $1.8 million, $0.2 million and $0.1 million for the years ended December 31, 2010, 2011 and 2012, and the three months ended March 31, 2012 and 2013, respectively, related to closed locations, consisting of pre-tax losses incurred during closure and post-closure expenses, (ii) a $1.4 million loss on the sale of land and buildings in the year ended December 31, 2010, and (iii) $1.9 million, $0.9 million and $0 of business optimization expenses, primarily consulting fees related to cost saving initiatives, for the years ended December 31, 2010, 2011 and 2012, respectively. |
| (c) | See note (5) above. |
| (d) | See note (7) above. |
| (e) | Represents the expense for management services provided by Gores and its affiliates and by Wolseley through November 2011, other than $0.5 million that is included in income (loss) from discontinued operations the year ended December 31, 2010. |
| (f) | Represents (i) $2.1 million and $2.0 million in the year ended December 31, 2010 related to the acquisition of NHC and Bison Building Materials, LLC (“Bison”), respectively, (ii) $0.8 million and $0.2 million in the year ended December 31, 2011 related to an abandoned acquisition and the acquisition of Bison, respectively, and (iii) $0.2 million and $0.1 million in the year ended December 31, 2012 related to the acquisitions of Total Building Services Group, LLC (“TBSG”) and Chesapeake Structural Systems, Inc. (“Chesapeake”), respectively, and (iv) $0.1 million in the three months ended March 31, 2013 related to the acquisition of TBSG. |
| (g) | See note (6) above. |
18
Table of Contents
| (h) | Represents (i) $0.7 million of expenses related to the Company’s prepackaged reorganization and (ii) $4.6 million received as proceeds from the settlement of a legal proceeding. |
| (i) | See note (11) below. |
| (11) | Our consolidated financial statements and related footnotes as of December 31, 2012 and March 31, 2013, for the year ended December 31, 2012 and for the three months ended March 31, 2012 and 2013 have been restated. See note (2) to our audited and unaudited financial statements included elsewhere in this prospectus. |
19
Table of Contents
An investment in our common stock involves a high degree of risk. You should carefully consider the risks described below, together with all of the other information included in this prospectus, before making an investment decision. If any of the following risks actually occurs, our business, financial condition and operating results could be materially and adversely affected. In that event, the trading price of our common stock could decline and you could lose all or part of your investment.
Risks related to our business
The industry in which we operate is dependent upon the homebuilding industry and repair and remodeling activity, the economy, the credit markets and other important factors.
The building products supply and services industry is highly dependent on new home construction and repair and remodeling activity, which in turn are dependent upon a number of factors, including interest rates, consumer confidence, employment rates, foreclosure rates, housing inventory levels, housing demand, the availability of land, the availability of construction financing and the health of the economy and mortgage markets. Unfavorable changes in demographics, credit markets, consumer confidence, health care costs, housing affordability, housing inventory levels, a weakening of the national economy or of any regional or local economy in which we operate, and other factors beyond our control could adversely affect consumer spending, result in decreased demand for homes, and adversely affect our business. Changes in federal income tax laws may also affect demand for new homes. Various proposals have been publicly discussed to limit mortgage interest deductions and to limit the exclusion of gain from the sale of a principal residence. Enactment of such proposals may have an adverse effect on the homebuilding industry in general. No meaningful prediction can be made as to whether any such proposals will be enacted and, if enacted, the particular form such laws would take. Because we have substantial fixed costs, relatively modest declines in our customers’ production levels could have a significant adverse effect on our financial condition, operating results and cash flows.
The homebuilding industry underwent a significant downturn that began in mid-2006 and began to stabilize in late 2011. The downturn in the homebuilding industry resulted in a substantial reduction in demand for our products and services, which in turn had a significant adverse effect on our business during fiscal years 2007 through 2012 and led to our filing for bankruptcy in 2009. The NAHB is forecasting approximately 644,000 U.S. single-family housing starts for 2013, which is an increase of 20% from 2012, but still well below historical averages. There is significant uncertainty regarding the timing and extent of any recovery in construction and repair and remodel activity and resulting product demand levels. The positive impact of a recovery on our business may also be dampened to the extent the average selling price or average size of new single family homes decreases, which could cause homebuilders to decrease spending on our products and services.
In addition, beginning in 2007, the mortgage markets experienced substantial disruption due to increased defaults, primarily as a result of credit quality deterioration. The disruption resulted in a stricter regulatory environment and reduced availability of mortgages for potential home buyers due to a tight credit market and stricter standards to qualify for mortgages. Mortgage financing and commercial credit for smaller homebuilders, as well as for the development of new residential lots, continue to be constrained. As the housing industry is dependent upon the economy and employment levels as well as potential home buyers’ access to mortgage financing and homebuilders’ access to commercial credit, it is likely that the housing industry will not fully recover until conditions in the economy and the credit markets improve and unemployment rates decline. Prolonged weakness in the homebuilding industry would have a significant adverse effect on our business, financial condition and operating results.
20
Table of Contents
In addition, as a result of the homebuilding industry downturn, there has been a trend of significant consolidation as smaller, private homebuilders have gone out of business. We refer to the large homebuilders as “production homebuilders.” While we generate significant business from these homebuilders, our gross margins on sales to them tend to be lower than our gross margins on sales to other market segments. This could impact our gross margins as homebuilding recovers if the market share held by the production homebuilders increases.
The building products supply and services industry is seasonal and cyclical.
Our industry is seasonal. Although weather patterns affect our operating results throughout the year, our first and fourth quarters have historically been, and are generally expected to continue to be, adversely affected by weather patterns in some of our markets, causing reduced construction activity. To the extent that hurricanes, severe storms, earthquakes, floods, fires, other natural disasters or similar events occur in the markets in which we operate, our business may be adversely affected.
The building products supply and services industry is also subject to cyclical market pressures. Quarterly results historically have reflected, and are expected to continue to reflect, fluctuations from period to period arising from the following: the volatility of lumber prices; the cyclical nature of the homebuilding industry; general economic conditions in the markets in which we compete; the pricing policies of our competitors; and the production schedules of our customers.
Our industry is highly fragmented and competitive, and increased competitive pressure may adversely affect our results.
The building products supply and services industry is highly fragmented and competitive. We face significant competition from local, regional and national building materials chains, as well as from privately-owned single site enterprises. Any of these competitors may (i) foresee the course of market development more accurately than we do, (ii) provide superior service and sell superior products, (iii) have the ability to produce or supply similar products and services at a lower cost, (iv) develop stronger relationships with our customers, (v) adapt more quickly to new technologies or evolving customer requirements than we do, (vi) develop a superior branch network in our markets or (vii) have access to financing on more favorable terms that we can obtain. As a result, we may not be able to compete successfully with them. In addition, home center retailers, which have historically concentrated their sales efforts on retail consumers and small contractors, may in the future intensify their marketing efforts to professional homebuilders. Furthermore, certain product manufacturers sell and distribute their products directly to production homebuilders. The volume of such direct sales could increase in the future. Additionally, manufacturers and specialty distributors who sell products to us may elect to sell and distribute directly to homebuilders in the future or enter into exclusive supplier arrangements with other distributors. Consolidation of production homebuilders may result in increased competition for their business. Finally, we may not be able to maintain our operating costs or product prices at a level sufficiently low for us to compete effectively. If we are unable to compete effectively, our financial condition, operating results and cash flows may be adversely affected.
Certain of our products are commodities and fluctuations in prices of these commodities could affect our operating results.
Many of the building products we distribute, including oriented strand board (“OSB”), plywood, lumber and particleboard, are commodities that are widely available from other manufacturers or distributors with prices and volumes determined frequently based on participants’ perceptions of short-term supply and demand factors. A shortage of capacity or excess capacity in the industry can result in significant increases or declines in market prices for those products, often within a short period of time.
21
Table of Contents
Prices of commodity products can also change as a result of national and international economic conditions, labor and freight costs, competition, market speculation, government regulation, and trade policies, as well as from periodic delays in the delivery of lumber and other products. Short-term changes in the cost of these materials, some of which are subject to significant fluctuations, are sometimes passed on to our customers, but our pricing quotation periods and pricing pressure from our competitors may limit our ability to pass on such price changes. For example, we frequently enter into extended pricing commitments, which may compress our gross margins in periods of inflation. At times, the price at which we can charge our customers for any one or more products may even fall below the price at which we can purchase such products, requiring us to incur short-term losses on product sales. We may also be limited in our ability to pass on increases in freight costs on our products due to the price of fuel.
Periods of generally increasing prices provide the opportunity for higher sales and increased gross profit (subject to the extended pricing commitments described above), while generally declining price environments may result in declines in sales and profitability. In particular, low market prices for wood products over a sustained period can adversely affect our financial condition, operating results and cash flows, as can excessive spikes in market prices. We have generally experienced increasing prices as the homebuilding market has recovered. For the year ended December 31, 2012, average composite framing lumber prices and average composite structural panel prices (a composite calculation based on index prices for OSB and plywood) as reflected by Random Lengths were 18% and 32% higher than the prior year. Our lumber & lumber sheet goods product category represented 35.5% of net sales for that period. Lumber prices remain slightly above prior year levels through June 2013 but have declined from their highs achieved earlier in 2013. However, if lumber or structural panel prices were to decline significantly from current levels, our sales and profits would be negatively affected.
We are exposed to product liability, product warranty, casualty, construction defect and other claims and legal proceedings related to our products and services as well as services provided for us through third parties.
We are from time to time involved in product liability, product warranty, casualty, construction defect, and other claims relating to the products we manufacture, distribute or install, and services we provide, either directly or through third parties, that, if adversely determined, could adversely affect our financial condition, operating results and cash flows if we were unable to seek indemnification for such claims or were not adequately insured for such claims. We rely on manufacturers and other suppliers to provide us with many of the products we sell, distribute or install. Because we do not have direct control over the quality of such products manufactured or supplied by such third-party suppliers, we are exposed to risks relating to the quality of such products. In addition, we are exposed to potential claims arising from the conduct of our employees, homebuilders and their subcontractors, and third-party installers for which we may be liable. We and they are subject to regulatory requirements and risks applicable to general contractors, which include management of licensing, permitting and quality of our third-party installers. If we fail to manage these processes effectively or provide proper oversight of these services, we could suffer lost sales, fines and lawsuits, as well as damage to our reputation, which could adversely affect our business.
Although we currently maintain what we believe to be suitable and adequate insurance in excess of our self-insured amounts, there can be no assurance that we will be able to maintain such insurance on acceptable terms or that such insurance will provide adequate protection against potential liabilities. Product liability, product warranty, casualty, construction defect, and other claims can be expensive to defend and can divert the attention of management and other personnel for significant periods, regardless of the ultimate outcome. Claims of this nature could also have a negative impact on customer confidence in our products and our Company. We cannot assure you that any current or future claims will not adversely affect our financial condition, operating results and cash flows.
22
Table of Contents
Pursuant to the restructuring and investment agreement, Wolseley agreed to indemnify us for, among other things, losses arising from any third-party claim (i) existing as of May 5, 2009 or (ii) brought or asserted against the Company arising from actions taken by Wolseley or the Company prior to May 5, 2009. In the event Wolseley is unable or unwilling to satisfy its indemnification obligations to us, we would be responsible for any liabilities arising from actions taken prior to May 5, 2009 and the costs of defending claims related thereto. The resulting increase in our liabilities or litigation expenses could have a material adverse effect on our financial results.
We may be unable to achieve or maintain profitability or positive cash flows from operations.
We have set goals to progressively improve our profitability over time by growing our sales, increasing our gross margin and reducing our expenses as a percentage of sales. For the fiscal years 2011 and 2012 we had net losses of $42.1 million and $14.5 million, respectively, and used cash from operations of $7.0 million and $12.2 million, respectively. There can be no assurance that we will achieve our enhanced profitability goals or generate positive cash flow from operations. Factors that could significantly adversely affect our efforts to achieve these goals include, but are not limited to, the failure to:
| Ÿ | grow our revenue through organic growth or through acquisitions; |
| Ÿ | improve our revenue mix by investing (including through acquisitions) in businesses that provide higher gross margins than we have been able to generate historically; |
| Ÿ | achieve improvements in purchasing or to maintain or increase our rebates from suppliers through our supplier consolidation and/or low-cost country initiatives; |
| Ÿ | improve our gross margins through the utilization of improved pricing practices and technology and sourcing savings; |
| Ÿ | maintain or reduce our overhead and support expenses as we grow; |
| Ÿ | effectively evaluate future inventory reserves; |
| Ÿ | collect monies owed from customers; |
| Ÿ | maintain relationships with our significant customers; and |
| Ÿ | integrate any businesses acquired. |
Any of these failures or delays may adversely affect our ability to increase our profitability.
Residential renovation and improvement activity levels may not return to historic levels which may negatively impact our business, liquidity and results of operations.
Our business relies on residential renovation and improvement (including repair and remodeling) activity levels. Unlike most previous cyclical declines in new home construction in which we did not experience comparable declines in our sales related to home improvement, the recent economic decline adversely affected our home improvement business as well. According to the U.S. Census Bureau, residential improvement project spending in the United States increased 10% in 2012, but remains 14% below its peak in 2007. Continued high unemployment levels, high mortgage delinquency and foreclosure rates, limitations in the availability of mortgage and home improvement financing and significantly lower housing turnover, may continue to limit consumers’ spending, particularly on discretionary items, and affect their confidence level leading to continued reduced spending on home improvement projects.
We cannot predict the timing or strength of a significant recovery, if any, in these markets. Continued depressed activity levels in consumer spending for home improvement and new home
23
Table of Contents
construction will continue to adversely affect our results of operations and our financial position. Furthermore, continued economic weakness may cause unanticipated shifts in consumer preferences and purchasing practices and in the business models and strategies of our customers. Such shifts may alter the nature and prices of products demanded by the end consumer and our customers and could adversely affect our operating performance.
Our continued success will depend on our ability to retain our key employees and to attract and retain new qualified employees, while controlling our labor costs.
Our success depends in part on our ability to attract, hire, train, and retain qualified managerial, operational, sales, and other personnel, while at the same time controlling our labor costs. We face significant competition for these types of employees in our industry and from other industries. We may be unsuccessful in attracting and retaining the personnel we require to conduct and expand our operations successfully. In addition, key personnel, including sales force employees with key customer relationships, may leave us and compete against us. Our success also depends to a significant extent on the continued service of our senior management team. Our senior management team has more than 120 years of combined experience in manufacturing and distribution, and has been integral to our successful acquisition and integration of businesses to gain scale in our current markets. These factors make our current senior management team uniquely qualified to execute our business strategy. The loss of any member of our senior management team or other experienced, senior employees or sales force employees could impair our ability to execute our business plan, cause us to lose customers and reduce our net sales, or lead to employee morale problems and/or the loss of other key employees. In any such event, our financial condition, operating results and cash flows could be adversely affected.
Our ability to control labor costs is subject to numerous external factors, including prevailing wage rates, the impact of legislation or regulations governing labor relations or healthcare benefits, and health and other insurance costs. In addition, we compete with other companies for many of our employees in hourly positions, and we invest significant resources in training and motivating them to maintain a high level of job satisfaction. These positions have historically had high turnover rates, which can lead to increased training and retention costs. If we are unable to attract or retain highly qualified employees in the future, it could adversely impact our operating results.
Product shortages, loss of key suppliers or failure to develop relationships with qualified suppliers, and our dependence on third-party suppliers and manufacturers could affect our financial health.
Our ability to offer a wide variety of products to our customers is dependent upon our ability to obtain adequate product supply from manufacturers and other suppliers. Generally, our products are obtainable from various sources and in sufficient quantities. Our ability to continue to identify and develop relationships with qualified suppliers who can satisfy our high standards for quality and our need to access products in a timely and efficient manner is a significant challenge. Our ability to access products also can be adversely affected by the financial instability of suppliers (particularly in light of continuing economic difficulties in various regions of the United States and the world), suppliers’ noncompliance with applicable laws, supply disruptions, shipping interruptions or costs, and other factors beyond our control. The loss of, or a substantial decrease in the availability of, products from our suppliers or the loss of key supplier arrangements could adversely impact our financial condition, operating results and cash flows.
Although in many instances we have agreements with our suppliers, these agreements are generally terminable by either party on limited notice. Many of our suppliers also offer us favorable terms based on the volume of our purchases. If market conditions change, suppliers may stop offering us favorable terms. Failure by our suppliers to continue to supply us with products on favorable terms,
24
Table of Contents
commercially reasonable terms, or at all, could put pressure on our operating margins or have a material adverse effect on our financial condition, operating results and cash flows.
A portion of the workforces of many of our suppliers, particularly our foreign suppliers, are represented by labor unions. Workforce disputes at these suppliers may result in work stoppages or slowdowns. For example, in recent years our suppliers in Chile (who provide a significant portion of certain of our products) have been subject to numerous labor stoppages. Such disruptions could have a material adverse effect on these suppliers ability to continue meeting our needs.
The implementation of our supply chain and technology initiatives could disrupt our operations, and these initiatives might not provide the anticipated benefits or might fail.
We have made, and we plan to continue to make, significant investments in our supply chain and technology. These initiatives are designed to streamline our operations to allow our employees to continue to provide high quality service to our customers, while simplifying customer interaction and providing our customers with a more interconnected purchasing experience. The cost and potential problems and interruptions associated with the implementation of these initiatives, including those associated with managing third-party service providers and employing new web-based tools and services, could disrupt or reduce the efficiency of our operations. In the event that we grow very rapidly, there can be no assurance that we will be able to keep up, expand or adapt our information technology infrastructure to meet evolving demand on a timely basis and at a commercially reasonable cost, or at all. In addition, our improved supply chain and new or upgraded technology might not provide the anticipated benefits, it might take longer than expected to realize the anticipated benefits, or the initiatives might fail altogether.
We occupy most of our facilities under long-term non-cancelable leases. We may be unable to renew leases at the end of their terms. If we close a facility, we are still obligated under the applicable lease.
Most of our facilities are located in leased premises. Many of our current leases are non-cancelable and typically have initial terms ranging from five to ten years and most provide options to renew for specified periods of time. We believe that leases we enter into in the future will likely be long-term and non-cancelable and have similar renewal options. If we close or idle a facility, most likely we remain committed to perform our obligations under the applicable lease, which would include, among other things, payment of the base rent, insurance, taxes, and other expenses on the leased property for the balance of the lease term. The inability to terminate leases when idling a facility or exiting a geographic market can have a significant adverse impact on our financial condition, operating results and cash flows. For example, in response to the significant downturn in the homebuilding industry that began in 2006, we determined that it was necessary to discontinue operations in certain unprofitable markets. Because we were unable to terminate leases in these locations and were no longer able to make required payments under the leases, we undertook a prepackaged reorganization under the bankruptcy code in order to terminate the real property leases in those markets in exchange for payment of a statutory amount of damages.
In addition, at the end of the lease term and any renewal period for a facility, we may be unable to renew the lease without substantial additional cost, if at all. If we are unable to renew our facility leases, we may close or relocate a facility, which could subject us to construction and other costs and risks, which in turn could have a material adverse effect on our business and operating results. In addition, we may not be able to secure a replacement facility in a location that is as commercially viable, including access to rail service, as the lease we are unable to renew. For example, closing a facility, even during the time of relocation, will reduce the sales that the facility would have contributed to our revenues. Additionally, the revenue and profit, if any, generated at a relocated facility may not equal the revenue and profit generated at the existing one.
25
Table of Contents
Homebuilding activities in the Texas, North Carolina, California and Utah markets have a large impact on our results of operations because we conduct a significant portion of our business in these markets.
We presently conduct a significant portion of our business in the Texas, North Carolina, California and Utah markets, which represented approximately 32%, 16%, 11% and 10%, respectively, of our 2012 total net sales. Home prices and sales activities in these markets and in most of the other markets in which we operate have declined from time to time, particularly as a result of slow economic growth. In the last several years, these markets have benefited from better than average employment growth, which has aided homebuilding activities, but we cannot assure you that these conditions will continue. Local economic conditions can depend on a variety of factors, including national economic conditions, local and state budget situations and the impact of federal cutbacks. If homebuilding activity declines in one or more of the markets in which we operate, our costs may not decline at all or at the same rate and may negatively impact our operating results.
We may be unable to manage effectively our inventory and working capital as our sales volume increases or material prices fluctuate, which could have a material adverse effect on our business, financial condition and operating results.
We purchase certain materials, including lumber products, which are then sold to customers as well as used as direct production inputs for our manufactured and prefabricated products. We must maintain, and have adequate working capital to purchase, sufficient inventory to meet customer demand. Due to the lead times required by our suppliers, we order products in advance of expected sales. This requires us to forecast our sales and purchase accordingly. In periods of growth, it can be especially difficult to accurately forecast sales. We must also manage our working capital to fund our inventory purchases. Excessive spikes in the market prices of certain building products, such as lumber, can put negative pressure on our operating cash flows by requiring us to invest more in inventory. In the future, if we are unable to manage effectively our inventory and working capital as we attempt to grow our business, our cash flows may be negatively affected, which could have a material adverse effect on our business, financial condition and operating results.
The majority of our net sales are credit sales which are made primarily to customers whose ability to pay is dependent, in part, upon the economic strength of the industry and geographic areas in which they operate, and the failure to collect or timely collect monies owed from customers could adversely affect our financial condition.
The majority of our net sales volume in fiscal 2012 was facilitated through the extension of credit to our customers whose ability to pay is dependent, in part, upon the economic strength of the industry in the areas where they operate. We offer credit to customers, either through unsecured credit that is based solely upon the creditworthiness of the customer, or secured credit for materials sold for a specific job where the security lies in lien rights associated with the material going into the job. The type of credit offered depends both on the financial strength of the customer and the nature of the business in which the customer is involved. End users, resellers and other non-contractor customers generally purchase more on unsecured credit than secured credit. The inability of our customers to pay off their credit lines in a timely manner, or at all, would adversely affect our financial condition, operating results and cash flows. Furthermore, our collections efforts with respect to non-paying or slow-paying customers could negatively impact our customer relations going forward.
Because we depend on the creditworthiness of certain of our customers, if the financial condition of our customers declines, our credit risk could increase. Significant contraction in our markets, coupled with tightened credit availability and financial institution underwriting standards, could adversely affect certain of our customers. Should one or more of our larger customers declare bankruptcy as has occurred in the past, it could adversely affect the collectability of our accounts receivable, bad debt reserves and net income.
26
Table of Contents
We are subject to competitive pricing pressure from our customers.
Production homebuilders historically have exerted significant pressure on their outside suppliers to keep prices low because of their market share and ability to leverage such market share in the highly fragmented building products supply and services industry. The housing industry downturn resulted in significantly increased pricing pressures from production homebuilders and other customers. These pricing pressures have adversely affected our operating results and cash flows. In addition, continued consolidation among homebuilders, and changes in homebuilders’ purchasing policies or payment practices, could result in additional pricing pressure. Moreover, during the housing downturn, several of our homebuilder customers defaulted on amounts owed to us or extended their payable days as a result of their financial condition. If such payment failures or delays were to recur, it could significantly adversely affect our financial condition, operating results and cash flows.
We may not timely identify or effectively respond to consumer needs, expectations or trends, which could adversely affect our relationship with customers, the demand for our products and services and our market share.
It is difficult to predict successfully the products and services our customers will demand. The success of our business depends in part on our ability to identify and respond promptly to changes in demographics, consumer preferences, expectations, needs and weather conditions, while also managing inventory levels. For example, an increased consumer focus on making homes energy efficient could require us to offer more energy efficient building materials and there can be no assurance that we would be able to identify appropriate suppliers on acceptable terms. Failure to identify timely or effectively respond to changing consumer preferences, expectations and building product needs could adversely affect our relationship with customers, the demand for our products and services and our market share.
We may be unable to implement successfully our growth strategy, which includes pursuing strategic acquisitions and opening new facilities.
Our long-term business plan provides for continued growth through strategic acquisitions and organic growth through the construction of new facilities or the expansion of existing facilities. Failure to identify and acquire suitable acquisition candidates on appropriate terms could have a material adverse effect on our growth strategy. Moreover, our reduced operating results during the housing downturn, our liquidity position, or the requirements of our Credit Agreement, could prevent us from obtaining the capital required to effect new acquisitions or expansions of existing facilities. Our failure to make successful acquisitions or to build or expand facilities, including manufacturing facilities, produce saleable product, or meet customer demand in a timely manner could result in damage to or loss of customer relationships, which could adversely affect our financial condition, operating results and cash flows.
In addition, we may not be able to integrate the operations of future acquired businesses in an efficient and cost-effective manner or without significant disruption to our existing operations. Acquisitions involve significant risks and uncertainties, including uncertainties as to the future financial performance of the acquired business, difficulties integrating acquired personnel and corporate cultures into our business, the potential loss of key employees, customers or suppliers, difficulties in integrating different computer and accounting systems, exposure to unknown or unforeseen liabilities of acquired companies, and the diversion of management attention and resources from existing operations. We may be unable to complete successfully potential acquisitions due to multiple factors, such as issues related to regulatory review of the proposed transactions. We may also be required to incur additional debt in order to consummate acquisitions in the future, which debt may be substantial and may limit our flexibility in using our cash flow from operations. Our failure to integrate future
27
Table of Contents
acquired businesses effectively or to manage other consequences of our acquisitions, including increased indebtedness, could prevent us from remaining competitive and, ultimately, could adversely affect our financial condition, operating results and cash flows.
Federal, state, local and other regulations could impose substantial costs and/or restrictions on our operations that would reduce our net income.
We are subject to various federal, state, local, and other regulations, including, among other things, regulations promulgated by the Department of Transportation (“DOT”), work safety regulations promulgated by the Department of Labor’s Occupational Safety and Health Administration (“OSHA”), employment regulations promulgated by the United States Equal Employment Opportunity Commission, accounting standards issued by the Financial Accounting Standards Board or similar entities, and state and local zoning restrictions, building codes and contractors’ licensing boards. More burdensome regulatory requirements in these or other areas may increase our general and administrative costs and adversely affect our financial condition, operating results and cash flows. Moreover, failure to comply with the regulatory requirements applicable to our business could expose us to substantial penalties that could adversely affect our financial condition, operating results and cash flows.
Our transportation operations are subject to the regulatory jurisdiction of the DOT. The DOT has broad administrative powers with respect to our transportation operations. More restrictive limitations on vehicle weight and size, trailer length and configuration, or driver hours of service would increase our costs, which, if we are unable to pass these cost increases on to our customers, may increase our selling, general and administrative expenses and adversely affect our financial condition, operating results and cash flows. If we fail to comply adequately with DOT regulations or regulations become more stringent, we could experience increased inspections, regulatory authorities could take remedial action including imposing fines or shutting down our operations or we could be subject to increased audit and compliance costs. If any of these events were to occur, our financial condition, operating results and cash flows would be adversely affected.
In addition, the homebuilding industry is subject to various local, state and federal statutes, ordinances, rules and regulations concerning zoning, building design and safety, construction, energy conservation, environmental protection and similar matters, including regulations that impose restrictive zoning and density requirements on our business or that limit the number of homes that can be built within the boundaries of a particular area. Regulatory restrictions may increase our operating expenses and limit the availability of suitable building lots for our customers, which could negatively affect our sales and earnings.
The loss of any of our significant customers could affect our financial health.
Our ten largest customers generated approximately 18.6% and 20.5% of our net sales for the years ended December 31, 2011 and 2012, respectively. We cannot guarantee that we will maintain or improve our relationships with these customers or that we will continue to supply these customers at historical levels. Due to the weak housing market over the past several years, many of our homebuilder customers substantially reduced their construction activity. Some homebuilder customers exited or severely curtailed building activity in certain of our markets.
In addition, production homebuilders and other customers may: (i) seek to purchase some of the products that we currently sell directly from manufacturers; (ii) elect to establish their own building products manufacturing and distribution facilities or (iii) give advantages to manufacturing or distribution intermediaries in which they have an economic stake. Continued consolidation among production homebuilders could also result in a loss of some of our present customers to our competitors. The loss of one or more of our significant customers or deterioration in our relations with
28
Table of Contents
any of them could adversely affect our financial condition, operating results and cash flows. Furthermore, our customers typically are not required to purchase any minimum amount of products from us. The contracts into which we have entered with most of our professional customers typically provide that we supply particular products or services for a certain period of time when and if ordered by the customer. Should our customers purchase our products in significantly lower quantities than they have in the past, such decreased purchases could have a material adverse effect on our financial condition, operating results and cash flows.
We may have future capital needs that require us to incur additional debt and may not be able to obtain additional financing on acceptable terms, if at all.
We are substantially reliant on liquidity provided by our Credit Agreement and cash on hand to provide working capital and fund our operations. Our working capital and capital expenditure requirements are likely to grow as the housing market improves. Economic and credit market conditions, the performance of the homebuilding industry, and our financial performance, as well as other factors, may constrain our financing abilities. Our ability to secure additional financing, if available, and to satisfy our financial obligations under indebtedness outstanding from time to time will depend upon our future operating performance, the availability of credit, economic conditions, and financial, business, and other factors, many of which are beyond our control. The prolonged continuation or worsening of current housing market conditions and the macroeconomic factors that affect our industry could require us to seek additional capital and have a material adverse effect on our ability to secure such capital on favorable terms, if at all.
We may be unable to secure additional financing or financing on favorable terms or our operating cash flow may be insufficient to satisfy our financial obligations under our outstanding indebtedness. If additional funds are raised through the issuance of additional equity or convertible debt securities, our stockholders may experience significant dilution. We may also incur additional indebtedness in the future, including collateralized debt, subject to the restrictions contained in the Credit Agreement. If new debt is added to our current debt levels, the related risks that we now face could intensify.
The Credit Agreement contains various financial covenants that could limit our ability to operate our business.
The Credit Agreement includes a financial covenant that requires us to maintain a minimum Fixed Charge Coverage Ratio of 1.0 as defined therein. However, the covenant is only applicable if the sum of availability under the Revolver plus Qualified Cash (which includes cash and cash equivalents in deposit accounts or securities accounts or any combination thereof that are subject to a control agreement) falls below $15 million at any time, and remains in effect until the sum of availability under the Revolver plus Qualified Cash exceeds $15 million for 30 consecutive days. While there can be no assurances, based upon our forecast, we do not expect the covenant to become applicable during the year ended December 31, 2013. However, while we would currently satisfy this covenant if it were applicable, should this not be the case, we would evaluate our liquidity options including amending the Credit Agreement, seeking alternative financing arrangements of debt and/or equity and/or selling assets. No assurances can be given that such alternative financing would be available, or if available, under terms similar to our existing Credit Agreement or that we would be able to sell assets on a timely basis.
We may be adversely affected by any disruption in our information technology systems.
Our operations are dependent upon our information technology systems, which encompass all of our major business functions. Our ERP system, which we use for operations representing virtually all of our sales, is a proprietary system that has been highly customized by our computer programmers. Our
29
Table of Contents
centralized financial reporting system currently draws data from our ERP system. We rely upon such information technology systems to manage and replenish inventory, to fill and ship customer orders on a timely basis, and to coordinate our sales and distribution activities across all of our products and services. A substantial disruption in our information technology systems for any prolonged time period (arising from, for example, system capacity limits from unexpected increases in our volume of business, outages, computer viruses, unauthorized access, or delays in our service) could result in delays in receiving inventory and supplies or filling customer orders and adversely affect our customer service and relationships. Our systems might be damaged or interrupted by natural or man-made events or by computer viruses, physical or electronic break-ins, or similar disruptions affecting the global Internet. There can be no assurance that such delays, problems, or costs will not have a material adverse effect on our financial condition, operating results and cash flows.
We may be adversely affected by any natural or man-made disruptions to our distribution and manufacturing facilities.
We currently maintain a broad network of distribution and manufacturing facilities throughout the eastern, southern and western United States. Any widespread disruption to our facilities resulting from fire, earthquake, weather-related events, an act of terrorism, or any other cause could damage a significant portion of our inventory and could materially impair our ability to distribute our products to customers. We could incur significantly higher costs and longer lead times associated with distributing our products to our customers during the time that it takes for us to reopen or replace a damaged facility. In addition, any shortages of fuel or significant fuel cost increases could disrupt our ability to distribute products to our customers. Disruptions to the national or local transportation infrastructure systems including those related to a domestic terrorist attack may also affect our ability to keep our operations and services functioning properly. If any of these events were to occur, our financial condition, operating results and cash flows could be materially adversely affected.
We are subject to exposure to environmental liabilities and are subject to environmental regulation.
We are subject to various federal, state and local environmental laws, ordinances, rules and regulations including those promulgated by the United States Environmental Protection Agency and analogous state agencies. As current and former owners, lessees and operators of real property, we can be held liable for the investigation or remediation of contamination at or from such properties, in some circumstances irrespective of whether we knew of or caused such contamination. No assurance can be provided that investigation and remediation will not be required in the future as a result of spills or releases of petroleum products or hazardous substances, the discovery of currently unknown environmental conditions, more stringent standards regarding existing contamination, or changes in legislation, laws, ordinances, rules or regulations or their interpretation or enforcement. More burdensome environmental regulatory requirements may increase our costs and adversely affect our financial condition, operating results and cash flows.
We are subject to cybersecurity risks and may incur increasing costs in an effort to minimize those risks.
Our business employs systems and a website that allow for the secure storage and transmission of customers’ proprietary information. Security breaches could expose us to a risk of loss or misuse of this information, litigation and potential liability. We may not have the resources or technical sophistication to anticipate or prevent rapidly evolving types of cyber attacks. Any compromise of our security could result in a violation of applicable privacy and other laws, significant legal and financial exposure, damage to our reputation, and a loss of confidence in our security measures, which could harm our business. The regulatory environment related to information security and privacy is
30
Table of Contents
increasingly rigorous, with new and constantly changing requirements applicable to our business, and compliance with those requirements could result in additional costs. Our computer systems have been, and will likely continue to be, subjected to computer viruses or other malicious codes, unauthorized access attempts, and cyber- or phishing-attacks. These events could compromise our confidential information, impede or interrupt our business operations, and may result in other negative consequences, including remediation costs, loss of revenue, litigation and reputational damage. To date, we have not experienced a material breach of cybersecurity. As cyber attacks become more sophisticated generally, and as we implement changes giving customers greater electronic access to our systems, we may be required to incur significant costs to strengthen our systems from outside intrusions and/or obtain insurance coverage related to the threat of such attacks, as we currently do not carry any such coverage. While we have implemented administrative and technical controls and have taken other preventive actions to reduce the risk of cyber incidents and protect our information technology, they may be insufficient to prevent physical and electronic break-ins, cyber-attacks or other security breaches to our computer systems.
Risks related to this offering and our common stock
Prior to this offering, there has been no public market for our common stock, and we do not know if one will develop to provide you with adequate liquidity to sell our common stock at prices equal to, or greater than, the price you paid in this offering.
Prior to this offering, there has not been a public market for our common stock. We cannot predict the extent to which investor interest in our Company will lead to the development of an active trading market on the exchange on which we list our common stock or how liquid that market might become. If an active trading market does not develop, you may have difficulty selling any of our common stock that you buy. The initial public offering price for the common stock has been determined by negotiations between us and the representatives of the underwriters and may not be indicative of prices that will prevail in the open market following this offering. Consequently, you may not be able to sell our common stock at prices equal to or greater than the price you paid in this offering, or at all.
The price of our common stock may fluctuate significantly, and you could lose all or part of your investment.
Volatility in the market price of our common stock may prevent you from being able to sell your shares at or above the price you paid for them. The market price for our common stock could fluctuate significantly for various reasons, including:
| Ÿ | our operating and financial performance and prospects; |
| Ÿ | our quarterly or annual earnings or those of other companies in our industry; |
| Ÿ | the public’s reaction to our press releases, our other public announcements and our filings with the Securities and Exchange Commission (the “SEC”); |
| Ÿ | changes in, or failure to meet, earnings estimates or recommendations by research analysts who track our common stock or the stock of other companies in our industry; |
| Ÿ | the failure of research analysts to cover our common stock; |
| Ÿ | general economic, industry and market conditions; |
| Ÿ | strategic actions by us, our customers or our competitors, such as acquisitions or restructurings; |
| Ÿ | new laws or regulations or new interpretations of existing laws or regulations applicable to our business; |
| Ÿ | changes in accounting standards, policies, guidance, interpretations or principles; |
31
Table of Contents
| Ÿ | material litigation or government investigations; |
| Ÿ | changes in general conditions in the United States and global economies or financial markets, including those resulting from war, incidents of terrorism or responses to such events; |
| Ÿ | changes in key personnel; |
| Ÿ | sales of common stock by us, our principal stockholder or members of our management team; |
| Ÿ | termination of lock-up agreements with our management team and principal stockholder; |
| Ÿ | the granting or exercise of employee stock options; |
| Ÿ | payment of liabilities for which we are self-insured; |
| Ÿ | volume of trading in our common stock; |
| Ÿ | threats to, or impairments of, our intellectual property; and |
| Ÿ | the impact of the factors described elsewhere in “Risk Factors.” |
In addition, in recent years, the stock market has regularly experienced significant price and volume fluctuations. This volatility has had a significant impact on the market price of securities issued by many companies, including companies in our industry. The changes frequently appear to occur without regard to the operating performance of the affected companies. Hence, the price of our common stock could fluctuate based upon factors that have little or nothing to do with us and these fluctuations could materially reduce our share price.
The requirements of being a public company will increase certain of our costs and require significant management focus.
As a public company, our legal, accounting and other expenses associated with compliance-related and other activities will increase. For example, in connection with this offering, we will create new board of directors committees and appoint one or more independent directors to comply with the corporate governance requirements of the exchange on which we will list our common stock. Costs to obtain director and officer liability insurance will contribute to our increased costs. As a result of the associated liability, it may be more difficult for us to attract and retain qualified persons to serve on our board of directors or as executive officers. Advocacy efforts by stockholders and third parties may also prompt even more changes in governance and reporting requirements, which could further increase our compliance costs.
We are exempt from certain corporate governance requirements since we are a “controlled company” within the meaning of the rules of the exchange on which we will list our common stock and, as a result, you will not have the protections afforded by these corporate governance requirements.
Following the consummation of this offering, Gores Holdings will hold a majority of our common stock. As a result of the completion of this offering, we will be considered a “controlled company” for the purposes of the listing requirements of the exchange on which we will list our common stock. Under these rules, a company of which more than 50% of the voting power is held by a group is a “controlled company” and may elect not to comply with certain corporate governance requirements of the exchange on which we will list our common stock, including the requirements that our board of directors, our Compensation Committee and our Corporate Governance and Nominating Committee meet the standard of independence established by those corporate governance requirements. The independence standards are intended to ensure that directors who meet the independence standard are free of any conflicting interest that could influence their actions as directors. Accordingly, you may not have the same protections afforded to stockholders of companies that are subject to all of the corporate governance requirements of the exchange on which we will list our common stock.
32
Table of Contents
We are an ‘‘emerging growth company’’ and we cannot be certain if the reduced disclosure requirements applicable to emerging growth companies will make our common stock less attractive to investors.
We are an ‘‘emerging growth company’’ and we may take advantage of certain exemptions from various reporting requirements that are applicable to other public companies that are not ‘‘emerging growth companies.’’ We will remain an ‘‘emerging growth company’’ for up to five years following the completion of this offering or until we achieve total annual gross revenues in excess of $1 billion during a fiscal year or become a large accelerated filer as a result of achieving a public float of at least $700 million as of the end of a second fiscal quarter. If the housing market continues to strengthen, we could exceed annual gross revenues of $1 billion shortly after the date of this prospectus, as we had $967 million of total gross revenues in 2012. The exemptions include not being required to comply with the auditor attestation requirements of Section 404 of the Sarbanes-Oxley Act, reduced disclosure obligations regarding executive compensation in our periodic reports and proxy statements, and exemptions from the requirements of holding a non-binding advisory vote on executive compensation and stockholder approval of any golden parachute payments not previously approved. If we choose not to comply with the auditor attestation requirements of Section 404 of the Sarbanes-Oxley Act, our auditors will not be required to attest to the effectiveness of our internal controls over financial reporting. As a result, investors may become less comfortable with the effectiveness of our internal controls and the risk that material weaknesses or other deficiencies in our internal control go undetected may increase. If we choose to provide reduced disclosures in our periodic reports and proxy statements while we are an emerging growth company, investors would have access to less information and analysis about our executive compensation, which may make it difficult for investors to evaluate our executive compensation practices. We cannot predict if investors will find our common stock less attractive because we may rely on these exemptions and provide reduced disclosure. If some investors find our common stock less attractive as a result, there may be a less active trading market for our common stock and our stock price may be more volatile.
Our majority stockholder will have the ability to control significant corporate activities after the completion of this offering and our majority stockholder’s interests may not coincide with yours.
After the consummation of this offering, Gores Holdings and its affiliates will beneficially own approximately 57.6% of our common stock, assuming the underwriters do not exercise their option to purchase additional shares. If the underwriters exercise in full their option to purchase additional shares, Gores Holdings will beneficially own approximately 52.5% of our common stock. As a result of its ownership, Gores Holdings (and indirectly, Gores, given its control of Gores Holdings), so long as it holds a majority of our outstanding shares, will have the ability to control the outcome of matters submitted to a vote of stockholders and, through our board of directors, the ability to control decision-making with respect to our business direction and policies.
Matters over which Gores Holdings (and indirectly, Gores, given its control of Gores Holdings) will exercise control following this offering include:
| Ÿ | election of directors; |
| Ÿ | mergers and other business combination transactions, including proposed transactions that would result in our stockholders receiving a premium price for their shares; |
| Ÿ | other acquisitions or dispositions of businesses or assets; |
| Ÿ | incurrence of indebtedness and the issuance of equity securities; |
| Ÿ | repurchase of stock and payment of dividends; and |
| Ÿ | the issuance of shares to management under the 2013 Incentive Plan. |
33
Table of Contents
Even if Gores Holdings’ ownership of our shares falls below a majority, it may continue to be able to strongly influence or effectively control our decisions. In addition, Gores Holdings’ will have a contractual right to designate a number of directors proportionate to its stock ownership. See “Certain Relationships and Related Party Transactions—Director Nomination Agreement.”
Conflicts of interest may arise because some of our directors are affiliated with our largest stockholder.
Messrs. Freedman, Meyer, Wald and Yager, who are officers or employees of Gores or its affiliates, serve on our board of directors. Gores controls Gores Holdings, our majority stockholder (after giving effect to this offering). Gores or its affiliates may hold equity interests in entities that directly or indirectly compete with us, and companies in which it or one of its affiliates is an investor or may invest in the future may begin competing with us or become customers of or vendors to the Company. As a result of these relationships, when conflicts between the interests of Gores, on the one hand, and of our other stockholders, on the other hand, arise, these directors may not be disinterested. Although our directors and officers have a duty of loyalty to us under Delaware law and our amended and restated certificate of incorporation, transactions that we enter into in which a director or officer has a conflict of interest are generally permissible so long as (i) the material facts relating to the director’s or officer’s relationship or interest as to the transaction are disclosed to our board of directors and a majority of our disinterested directors approves the transaction, (ii) the material facts relating to the director’s or officer’s relationship or interest as to the transaction are disclosed to our stockholders and a majority of our disinterested stockholders approve the transaction or (iii) the transaction is otherwise fair to us. Our amended and restated certificate of incorporation also provides that any principal, officer, member, manager and/or employee of Gores or any entity that controls, is controlled by or under common control with Gores or any investment funds managed by Gores will not be required to offer any transaction opportunity of which they become aware to us and could take any such opportunity for themselves or offer it to other companies in which they have an investment, unless such opportunity is offered to them solely in their capacities as our directors.
If you purchase shares of common stock sold in this offering, you will incur immediate and substantial dilution.
If you purchase shares of common stock in this offering, you will incur immediate and substantial dilution in the amount of $13.15 per share, because the assumed initial public offering price of $17.00, which is the midpoint of the price range set forth on the cover of this prospectus, is substantially higher than the pro forma net tangible book value per share of our outstanding common stock. This dilution is due in large part to the fact that Gores Holdings paid substantially less than the initial public offering price when it acquired its shares of our capital stock in 2009. In addition, you may also experience additional dilution upon future equity issuances or the exercise of stock options to purchase common stock granted to our employees, directors and consultants under our stock option and equity incentive plans. For additional information, see “Dilution.”
We do not currently intend to pay dividends on our common stock following the offering.
We do not anticipate paying any cash dividends on our common stock for the foreseeable future. Instead, we intend to retain future earnings to fund our growth. In addition, our existing indebtedness restricts, and we anticipate our future indebtedness may restrict, our ability to pay dividends. Therefore, you may not receive a return on your investment in our common stock by receiving a payment of dividends. See “Dividend Policy.”
The issuer of common stock in this offering does not conduct any substantive operations and, as a result, its ability to pay dividends will be dependent upon the financial results and cash flows of its
34
Table of Contents
operating subsidiaries and the distribution or other payment of cash to it in the form of dividends or otherwise. The direct and indirect subsidiaries of the issuer are separate and distinct legal entities and have no obligation to make any funds available to the issuer.
Future sales of our common stock, or the perception in the public markets that these sales may occur, may depress our stock price.
Sales of substantial amounts of our common stock in the public market after this offering, or the perception that these sales could occur, could adversely affect the price of our common stock and could impair our ability to raise capital through the sale of additional shares. Upon completion of this offering, there will be 25,580,380 shares of our common stock outstanding. Of these, the 8,823,530 shares being sold in this offering (or 10,147,060 shares if the underwriters exercise their option to purchase additional shares in full) will be freely tradable immediately after this offering (except for any shares purchased by affiliates, if any) and approximately 16,756,850 shares (or 15,433,320 shares if the underwriters exercise their option to purchase additional shares in full) may be sold upon expiration of lock-up agreements 180 days after the date of this prospectus (subject in some cases to volume limitations). Sales by Gores Holdings of a substantial number of shares after this offering could significantly reduce the market price of our common stock. Gores Holdings and our other stockholders prior to this offering have the right to require us to register their shares of our common stock. See “Certain Relationships and Related Party Transactions—Plan of conversion and certificate of incorporation.”
We also intend to register all common stock that we may issue under the 2013 Incentive Plan, as described in “Executive Compensation—2013 Incentive Plan.” Effective upon the completion of this offering, an aggregate of 1,800,000 shares of our common stock will be reserved for future issuance under the 2013 Incentive Plan (including pursuant to the grants described below to be made in connection with this offering), in addition to 94,083 shares issuable upon exercise of existing options that have vested and 132,524 shares issuable upon exercise of existing options that have not vested. Upon completion of the offering, we also expect to award approximately $0.6 million worth of restricted stock to certain executive officers and directors (valued at the initial public offering price), and restricted shares or options to purchase a number of shares of our common stock collectively equal to 600,000 shares, less the restricted shares and options to purchase an amount of shares awarded to our executive officers and directors, with an exercise price set at the initial public offering price. Once we register these shares, which we plan to do shortly after the completion of this offering, they can be freely sold in the public market upon issuance, subject to the lock-up agreements referred to above. If a large number of these shares are sold in the public market, the sales could reduce the trading price of our common stock.
Our future operating results may fluctuate significantly and our current operating results may not be a good indication of our future performance. Fluctuations in our quarterly financial results could affect our stock price in the future.
Our revenues and operating results have historically varied from period-to-period and we expect that they will continue to do so as a result of a number of factors, many of which are outside of our control. If our quarterly financial results or our predictions of future financial results fail to meet the expectations of securities analysts and investors, our stock price could be negatively affected. Any volatility in our quarterly financial results may make it more difficult for us to raise capital in the future or pursue acquisitions that involve issuances of our stock. Our operating results for prior periods may not be effective predictors of future performance.
Factors associated with our industry, the operation of our business and the markets for our products and services may cause our quarterly financial results to fluctuate, including:
| Ÿ | the seasonal and cyclical nature of the homebuilding industry; |
| Ÿ | the highly competitive nature of our industry; |
35
Table of Contents
| Ÿ | the volatility of prices, availability and affordability of raw materials, including lumber, wood products and other building products; |
| Ÿ | shortages of skilled and technical labor, increased labor costs and labor disruptions; |
| Ÿ | the production schedules of our customers; |
| Ÿ | general economic conditions, including but not limited to housing starts, repair and remodel activity and light commercial construction, inventory levels of new and existing homes for sale, foreclosure rates, interest rates, unemployment rates, relative currency values, mortgage availability and pricing, as well as other consumer financing mechanisms, that ultimately affect demand for our products; |
| Ÿ | actions of suppliers, customers and competitors, including merger and acquisition activities, plant closures and financial failures; |
| Ÿ | the financial condition and creditworthiness of our customers; |
| Ÿ | cost of compliance with government laws and regulations; |
| Ÿ | weather patterns; and |
| Ÿ | severe weather phenomena such as drought, hurricanes, tornadoes and fire. |
Any one of the factors above or the cumulative effect of some of the factors referred to above may result in significant fluctuations in our quarterly financial and other operating results, including fluctuations in our key metrics. The variability and unpredictability could result in our failing to meet our internal operating plan or the expectations of securities analysts or investors for any period. If we fail to meet or exceed such expectations for these or any other reasons, the market price of our shares could fall substantially and we could face costly lawsuits, including securities class action suits.
Certain provisions of our organizational documents and other contractual provisions may make it difficult for stockholders to change the composition of our board of directors and may discourage hostile takeover attempts that some of our stockholders may consider to be beneficial.
Certain provisions of our amended and restated certificate of incorporation and amended and restated bylaws may have the effect of delaying or preventing changes in control if our board of directors determines that such changes in control are not in the best interests of us and our stockholders. The provisions in our amended and restated certificate of incorporation and amended and restated bylaws include, among other things, the following:
| Ÿ | a classified board of directors with three-year staggered terms; |
| Ÿ | the ability of our board of directors to issue shares of preferred stock and to determine the price and other terms, including preferences and voting rights, of those shares without stockholder approval; |
| Ÿ | stockholder action can only be taken at a special or regular meeting and not by written consent following the time that Gores Holdings and its affiliates cease to beneficially own a majority of our common stock; |
| Ÿ | advance notice procedures for nominating candidates to our board of directors or presenting matters at stockholder meetings; |
| Ÿ | removal of directors only for cause following the time that Gores Holdings and its affiliates cease to beneficially own a majority of our common stock; |
| Ÿ | allowing only our board of directors to fill vacancies on our board of directors; and |
36
Table of Contents
| Ÿ | following the time that Gores Holdings and its affiliates cease to beneficially own a majority of our common stock, super-majority voting requirements to amend our amended and restated bylaws and certain provisions of our amended and restated certificate of incorporation. |
In addition, in connection with this offering, we will enter into a Director Nomination Agreement with Gores Holdings that provides Gores Holdings the right to designate nominees for election to our board of directors for so long as Gores Holdings beneficially owns 10% or more of the total number of shares of our common stock then outstanding. For a description of the terms of the Director Nomination Agreement, see “Certain Relationships and Related Party Transactions—Director Nomination Agreement.”
We have elected in our amended and restated certificate of incorporation not to be subject to Section 203 of the Delaware General Corporation Law (“DGCL”), an anti-takeover law. In general, Section 203 prohibits a publicly held Delaware corporation from engaging in a business combination, such as a merger, with a person or group owning 15% or more of the corporation’s voting stock for a period of three years following the date the person became an interested stockholder, unless (with certain exceptions) the business combination or the transaction in which the person became an interested stockholder is approved in a prescribed manner. Accordingly, we are not subject to any anti-takeover effects of Section 203. However, our amended and restated certificate of incorporation contains provisions that have the same effect as Section 203, except that they provide that Gores Holdings, its affiliates (including any investment funds managed by Gores) and any person that becomes an interested stockholder as a result of a transfer of 5% or more of our voting stock by the forgoing persons to such person are excluded from the “interested stockholder” definition in our amended and restated certificate of incorporation and are therefore not subject to the restrictions set forth therein that have the same effect as Section 203. See “Description of Capital Stock—Anti-takeover effects of Delaware law and our amended and restated certificate of incorporation and amended and restated bylaws.”
While these provisions have the effect of encouraging persons seeking to acquire control of our Company to negotiate with our board of directors, they could enable the board of directors to hinder or frustrate a transaction that some, or a majority, of the stockholders might believe to be in their best interests and, in that case, may prevent or discourage attempts to remove and replace incumbent directors.
These provisions may frustrate or prevent any attempts by our stockholders to replace or remove our current management by making it more difficult for stockholders to replace members of our board of directors, which is responsible for appointing the members of our management. For more information, see “Description of Capital Stock.”
Any issuance of preferred stock could make it difficult for another company to acquire us or could otherwise adversely affect holders of our common stock, which could depress the price of our common stock.
Our board of directors has the authority to issue preferred stock and to determine the preferences, limitations and relative rights of shares of preferred stock and to fix the number of shares constituting any series and the designation of such series, without any further vote or action by our stockholders. Our preferred stock could be issued with voting, liquidation, dividend and other rights superior to the rights of our common stock. The potential issuance of preferred stock may delay or prevent a change in control of us, discouraging bids for our common stock at a premium over the market price, and adversely affect the market price and the voting and other rights of the holders of our common stock.
37
Table of Contents
We have identified a material weakness in our internal control over financial reporting. If the material weakness persists or if we fail to establish and maintain effective internal control over financial reporting in the future, our ability to both timely and accurately report our financial results could be adversely affected.
We are not currently required to comply with the rules of the SEC implementing Section 404 of the Sarbanes-Oxley Act and therefore are not required to make a formal assessment of the effectiveness of our internal control over financial reporting for that purpose. Upon becoming a public company, we will be required to comply with the SEC’s rules implementing Sections 302 and 404 of the Sarbanes-Oxley Act, which will require management to certify financial and other information in our quarterly and annual reports and provide an annual management report on the effectiveness of controls over financial reporting. Though we will be required to disclose changes made in our internal controls and procedures on a quarterly basis, we will not be required to make our first annual assessment of our internal control over financial reporting pursuant to Section 404 until the year following our first annual report required to be filed with the SEC. To comply with the requirements of being a public company, we may need to undertake various actions, such as implementing new internal controls and procedures and hiring accounting or internal audit staff.
A material weakness in our internal control over financial reporting existed as of December 31, 2012 and March 31, 2013. A material weakness is a deficiency, or combination of deficiencies, in internal control over financial reporting, such that there is a reasonable possibility that a material misstatement of our annual or interim financial statements will not be prevented, detected and corrected on a timely basis. During the third quarter of 2013, we identified transactions that should have been considered in the January 1, 2012 valuation of the Company’s Class A and Class B common stock. The updated valuation of our Class A and Class B common stock led to the following restatements: (i) to correct compensation expense related to a modification of the exercise price of our outstanding stock options, the issuance of new stock options and shares purchased by management and (ii) to recognize a beneficial conversion feature for the Class C convertible preferred stock and related accretion of dividends. We determined that the error was caused by the fact that certain controls relating to the Company’s valuation process were not at a precise enough level to identify the proper accounting treatment for the beneficial conversion feature or its implications on the January 2012 valuation of our common stock.
The material weakness described above could result in a misstatement of our accounts or disclosures that would result in a material misstatement of our financial statements that would not be prevented or detected. We are taking steps to remediate the material weakness, including designing and implementing improved processes and controls related to the review of the underlying assumptions and inputs used by the valuation specialist and the evaluation of how different value outputs may give rise to different equity accounting treatments (such as the beneficial conversion feature noted above). We cannot assure you that the measures we have taken to date, or any measures we may take in the future, will be sufficient to remediate the material weakness described above or to avoid potential future material weaknesses. Following the completion of this offering, we will value our common stock based on the market price for such stock.
We may in the future discover areas of our internal controls that need improvement. Our internal control over financial reporting will not prevent or detect all errors and all fraud. A control system, no matter how well designed and operated, can provide only reasonable, not absolute, assurance that the control system’s objectives will be met. Because of the inherent limitations in all control systems, no evaluation of controls can provide absolute assurance that misstatements due to error or fraud will not occur or that all control issues and instances of fraud will be detected.
If we are unable to maintain proper and effective internal controls, we may not be able to produce timely and accurate financial statements, and we or our independent registered public accounting firm
38
Table of Contents
may conclude that our internal control over financial reporting is not effective. If that were to happen, the market price of our stock could decline and we could be subject to sanctions or investigations by NASDAQ, the SEC or other regulatory authorities. Testing and maintaining internal controls could also divert our management’s attention from other matters that are important to the operation of our business.
Our business and stock price may suffer as a result of our lack of public company operating experience. In addition, if securities or industry analysts do not publish research or publish inaccurate or unfavorable research about our business, our stock price and trading volume could decline.
Prior to the completion of this offering, we have been a privately-held company. Our lack of public company operating experience may make it difficult to forecast and evaluate our future prospects. If we are unable to execute our business strategy, either as a result of our inability to manage effectively our business in a public company environment or for any other reason, our business, prospects, financial condition and operating results may be harmed. In addition, as a new public company we do not currently have and may never obtain research coverage by securities and industry analysts. If no securities or industry analysts commence coverage of our Company, the trading price for our stock would be negatively impacted. If we obtain securities or industry analyst coverage and if one or more of the analysts who covers us downgrades our stock or publishes inaccurate or unfavorable research about our business, our stock price would likely decline. If one or more of these analysts ceases coverage of us or fails to publish reports on us regularly, demand for our stock could decrease, which could cause our stock price and trading volume to decline.
We are a holding company and conduct all of our operations through our subsidiaries.
We are a holding company and derive all of our operating income from our subsidiaries. All of our assets are held by our direct and indirect subsidiaries. We rely on the earnings and cash flows of our subsidiaries, which are paid to us by our subsidiaries in the form of dividends and other payments or distributions, to meet our debt service obligations. The ability of our subsidiaries to pay dividends or make other payments or distributions to us will depend on their respective operating results and may be restricted by, among other things, the laws of their jurisdiction of organization (which may limit the amount of funds available for the payment of dividends and other distributions to us), the terms of existing and future indebtedness and other agreements of our subsidiaries and the covenants of any future outstanding indebtedness we or our subsidiaries incur.
39
Table of Contents
SPECIAL NOTE REGARDING FORWARD-LOOKING STATEMENTS
Some of the statements contained in this prospectus constitute forward-looking statements, including in the sections captioned “Prospectus Summary,” “Risk Factors,” “Management’s Discussion and Analysis of Financial Condition and Results of Operations” and “Business.” Forward-looking statements relate to expectations, beliefs, projections, future plans and strategies, anticipated events or trends and similar expressions concerning matters that are not historical facts or present facts or conditions. In many cases, you can identify forward-looking statements by terms such as “may,” “will,” “should,” “expects,” “plans,” “anticipates,” “believes,” “estimates,” “predicts,” “potential” or the negative of these terms or other comparable terminology.
The forward-looking statements contained in this prospectus reflect our views as of the date of this prospectus about future events and are subject to risks, uncertainties, assumptions and changes in circumstances that may cause events or our actual activities or results to differ significantly from those expressed in any forward-looking statement. Although we believe that the expectations reflected in the forward-looking statements are reasonable, we cannot guarantee future events, results, actions, levels of activity, performance or achievements. A number of important factors could cause actual results to differ materially from those indicated by the forward-looking statements, including, but not limited to, those factors described in “Risk Factors” and “Management’s Discussion and Analysis of Financial Condition and Results of Operations.” These factors include without limitation:
| Ÿ | the state of the homebuilding industry and repair and remodeling activity, the economy and the credit markets; |
| Ÿ | seasonality and cyclicality of the building products supply and services industry; |
| Ÿ | competitive industry pressures and competitive pricing pressure from our customers; |
| Ÿ | inflation or deflation of prices of our products; |
| Ÿ | our exposure to product liability, product warranty, casualty, construction defect and other claims and legal proceedings; |
| Ÿ | our ability to maintain profitability; |
| Ÿ | failure of the residential renovation and improvement activities to return to historic levels; |
| Ÿ | our ability to retain our key employees and to attract and retain new qualified employees while controlling our labor costs; |
| Ÿ | product shortages, loss of key suppliers or failure to develop relationships with qualified suppliers, and our dependence on third-party suppliers and manufacturers; |
| Ÿ | the implementation of our supply chain and technology initiatives; |
| Ÿ | the impact of long-term non-cancelable leases at our facilities; |
| Ÿ | our concentration of business in the Texas, North Carolina, California and Utah markets; |
| Ÿ | our ability to manage effectively inventory and working capital; |
| Ÿ | the credit risk from our customers; |
| Ÿ | pricing pressure from our customers and competitors; |
| Ÿ | our ability to identify or respond effectively to consumer needs, expectations or trends; |
| Ÿ | our ability to implement successfully our growth strategy; |
| Ÿ | the impact of federal, state, local and other laws and regulations; |
40
Table of Contents
| Ÿ | the potential loss of significant customers; |
| Ÿ | our ability to obtain additional financing on acceptable terms; |
| Ÿ | the various financial covenants in our Credit Agreement; |
| Ÿ | disruptions in our information technology systems; |
| Ÿ | natural or man-made disruptions to our distribution and manufacturing facilities; |
| Ÿ | our exposure to environmental liabilities and subjection to environmental laws and regulation; and |
| Ÿ | cybersecurity risks. |
Certain of these and other factors are discussed in more detail in “Risk Factors” in this prospectus. These factors should not be construed as exhaustive and should be read in conjunction with the other cautionary statements that are included in this prospectus. The forward-looking statements included in this prospectus are made only as of the date of this prospectus and we undertake no obligation to publicly update or review any forward-looking statement made by us or on our behalf, whether as a result of new information, future developments, subsequent events or circumstances or otherwise.
41
Table of Contents
We estimate that the net proceeds from our issuance and sale of 4,411,765 shares of common stock in this offering will be approximately $67.5 million, assuming an initial public offering price of $17.00 per share, which is the midpoint of the price range set forth on the cover page of this prospectus, and after deducting underwriting discounts and commissions and estimated offering expenses payable by us. We will not receive any of the proceeds from the sale of shares of our common stock by the selling stockholders.
A $1.00 increase (decrease) in the assumed initial public offering price of $17.00 per share would increase (decrease) our net proceeds from this offering by approximately $4.1 million, assuming that the number of shares offered by us, as set forth on the cover page of this prospectus, remains the same and after deducting the underwriting discounts and commissions and estimated offering expenses payable by us.
We intend to use the net proceeds to the Company from this offering to pay approximately $58.5 million of the outstanding balances under our Revolver and to pay a fee of $9.0 million to Gores to terminate our management services agreement with Gores.
Borrowings under the Revolver bear interest, at our option, at either a base rate (which means the higher of (i) the federal funds rate plus 0.5% or (ii) the prime rate) plus a base rate margin (which ranges from 0.50% to 1.00% based on Revolver availability) or LIBOR plus a LIBOR rate margin (which ranges from 1.50% to 2.00% based on Revolver availability). The Revolver matures in December 2016. An affiliate of Wells Fargo Securities, LLC is a lender under our Revolver. Accordingly, the affiliate will receive net proceeds from this offering in connection with the repayment of the Revolver. See “Underwriting—Conflicts of Interest.”
42
Table of Contents
Following the consummation of this offering, we do not plan to pay a regular dividend on our common stock. The declaration and payment of all future dividends, if any, will be at the discretion of our board of directors and will depend upon our financial condition, earnings, contractual conditions, restrictions imposed by the Credit Agreement or applicable laws and other factors that our board of directors may deem relevant.
Additionally, because we are a holding company, our ability to pay dividends on our common stock is limited by restrictions on the ability of our subsidiaries to pay dividends or make distributions to us, including restrictions under the terms of the agreements governing our indebtedness. See “Management’s Discussion and Analysis of Financial Condition and Results of Operations—Liquidity and capital resources—Revolving credit facility.” Any future determination to pay dividends will be at the discretion of our board of directors, subject to compliance with covenants in current and future agreements governing our indebtedness, and will depend upon our operating results, financial condition, capital requirements and other factors that our board of directors deems relevant.
43
Table of Contents
The following table sets forth our cash and cash equivalents and our consolidated capitalization as of March 31, 2013 on:
| Ÿ | an actual basis, as adjusted to retroactively reflect the change of members’ equity to stockholders’ equity following our conversion to a corporation and the 25.972-for-1 split of our Class A voting common stock and Class B non-voting common stock effected on July 29, 2013; |
| Ÿ | a pro forma basis, to give effect to (i) the conversion of all outstanding shares of our Class A voting common stock and Class B non-voting common stock into an equal number of shares of a single class of common stock immediately prior to the completion of this offering; and (ii) the conversion of all outstanding shares of our Class A junior preferred stock, Class B senior preferred stock and Class C convertible preferred stock into an aggregate of 6,707,898 shares of common stock upon the completion of this offering (assuming an initial public offering price of $17.00 per share, which is the midpoint of the price range set forth on the cover of this prospectus, and assuming a closing date of August 12, 2013, as applicable); and |
| Ÿ | a pro forma, as adjusted basis, to give further effect to (i) our receipt of the estimated net proceeds from the issuance and sale of 4,411,765 shares of common stock in this offering at an assumed initial public offering of $17.00 per share, which is the midpoint of the price range set forth on the cover of this prospectus, and after deducting underwriting discounts and estimated offering expenses payable by us, (ii) the payment of $58.5 million of the outstanding balance under our Revolver with a portion of the net proceeds from this offering and (iii) the payment of a $9.0 million fee to Gores to terminate our management services agreement with Gores, with a portion of the net proceeds from this offering. |
44
Table of Contents
You should read this table together with the sections entitled “Use of Proceeds,” “Selected Historical Consolidated Financial and Operating Data,” “Management’s Discussion and Analysis of Financial Condition and Results of Operations” and our financial statements and the related notes included elsewhere in this prospectus.
| As of March 31, 2013 | ||||||||||||
| Actual | Pro forma | Pro forma, as adjusted |
||||||||||
| (in thousands, except share and per share amounts) | (as restated)(2) | |||||||||||
| Cash and cash equivalents |
$ | 5,755 | $ | 5,755 | $ | 5,755 | ||||||
|
|
|
|
|
|
|
|||||||
| Long-term debt (including current maturities): |
||||||||||||
| Revolving line of credit(1) |
92,484 | 92,484 | 33,984 | |||||||||
| Capital lease obligations |
7,808 | 7,808 | 7,808 | |||||||||
|
|
|
|
|
|
|
|||||||
| Total debt |
100,292 | 100,292 | 41,792 | |||||||||
| Class A Junior Preferred stock, $0.01 par value, 10,000 shares authorized and issued and 5,100 shares outstanding, actual; no shares authorized, issued and outstanding, pro forma and pro forma, as adjusted |
— | — | — | |||||||||
| Class B Senior Preferred stock, $0.01 par value, 500,000 shares authorized, 75,000 shares issued, 36,388 shares outstanding, actual; no shares authorized, issued and outstanding, pro forma and pro forma, as adjusted |
37,206 | — | — | |||||||||
| Class C Convertible Preferred stock, pro forma and $0.01 par value, 5,000 shares authorized, issued and outstanding, actual; no shares authorized, issued and outstanding, pro forma and pro forma, as adjusted |
5,000 | — | — | |||||||||
| Stockholders’ equity: |
||||||||||||
| Class A voting common stock, $0.01 par value, 22,725,500 shares authorized and issued, 11,590,005 shares outstanding, actual; no shares authorized, issued and outstanding, pro forma and pro forma, as adjusted |
116 | — | — | |||||||||
| Class B non-voting common stock, $0.01 par value, 3,246,500 shares authorized and 2,870,712 issued and outstanding, actual; no shares authorized, issued and outstanding, pro forma and pro forma, as adjusted |
29 | — | — | |||||||||
| Preferred stock, $0.01 par value, no shares authorized, issued and outstanding, actual and pro forma; 50,000,000 authorized and no shares issued and outstanding, pro forma, as adjusted |
— | — | — | |||||||||
| Common stock, $0.01 par value, no shares authorized, issued and outstanding, actual; 300,000,000 shares authorized and 21,168,615 issued and outstanding, pro forma; 300,000,000 authorized and 25,580,380 issued and outstanding, pro forma, as adjusted |
— | 212 | 256 | |||||||||
| Additional paid-in capital |
45,949 | 88,088 | 155,544 | |||||||||
| Retained deficit |
(16,572 | ) | (16,572 | ) | (25,572 | ) | ||||||
|
|
|
|
|
|
|
|||||||
| Total stockholders’ equity |
29,522 | 71,728 | 130,228 | |||||||||
|
|
|
|
|
|
|
|||||||
| Total capitalization |
$ | 172,020 | $ | 172,020 | $ | 172,020 | ||||||
|
|
|
|
|
|
|
|||||||
| (1) | We had outstanding borrowings of $92.5 million with net availability of $36.4 million under our Revolver at March 31, 2013. See “Summary—Preliminary Financial Results for the Three Months and Six Months Ended June 30, 2013.” The repayment of a portion of the Revolver with the proceeds of this offering will not reduce available commitments. |
| (2) | Our consolidated financial statements and related footnotes as of March 31, 2013 have been restated. See note (2) to our unaudited financial statements included elsewhere in this prospectus. |
A $1.00 increase (decrease) in the assumed initial public offering price of $17.00 per share, which is the midpoint of the price range set forth on the cover of this prospectus, would increase (decrease) the pro forma, as adjusted amount for each of cash and cash equivalents, additional paid-in capital,
45
Table of Contents
total stockholders’ equity and total capitalization by approximately $4.1 million, assuming that the number of shares offered by us, as set forth on the cover of this prospectus, remains the same, and after deducting the estimated underwriting discounts and commissions and estimated offering expenses payable by us.
Conversion of Preferred Stock
Our amended and restated certificate of incorporation, which we will adopt immediately prior to consummation of this offering, provides that immediately prior to consummation of this offering, (i) each share of our Class A junior preferred stock will be automatically converted into a number of shares of common stock equal to the amount determined by dividing $1.00 by the initial public offering price per share, (ii) each share of our Class B senior preferred stock will automatically be converted into a number of shares of common stock equal to the amount determined by dividing the sum of (a) $1,000 plus (b) an amount equal to any accumulated and unpaid distributions on each share of Class B senior preferred stock from the date we converted to a corporation (May 2, 2013), to but excluding the date of the preferred conversion, by the initial public offering price per share, and (iii) each share of our Class C convertible preferred stock will automatically be converted into a number of shares of common stock equal to the amount determined by dividing $1,000 by $1.1223625 (which reflects our 25.972-for-1 stock split).
The dividends on our Class B senior preferred stock accumulate at the rate of 8% per annum, compounded quarterly, on the $1,000 liquidation preference from May 2, 2013, when we converted from a Delaware limited liability company to a Delaware corporation.
The number of shares of common stock issuable upon conversion of our Class A junior preferred stock and Class B senior preferred stock will depend on the actual price per share of the common stock in this offering and, in the case of the Class B senior preferred stock, the closing date. A $1.00 increase in the assumed initial public offering price of $17.00 per share, which is the midpoint of the range set forth on the cover of this prospectus, would decrease the aggregate number of shares of common stock issuable upon conversion of our Class A junior preferred stock and Class B senior preferred stock by 125,167 shares (assuming a closing date of August 12, 2013). A $1.00 decrease in the assumed initial public offering price of $17.00 per share, which is the midpoint of the range set forth on the cover of this prospectus, would increase the aggregate number of shares of common stock issuable upon conversion of our Class A junior preferred stock and Class B senior preferred stock by 140,813 shares (assuming a closing date of August 12, 2013). Each one-day later (earlier) change in the closing date would increase (decrease) the aggregate number of shares by 496 shares (assuming an initial public offering price of $17.00 per share, which is the midpoint of the price range set forth on the cover of this prospectus).
46
Table of Contents
Our pro forma net tangible book value as of March 31, 2013 was approximately $39.9 million, or approximately $1.89 per share. Pro forma net tangible book value per share represents the amount of our total tangible assets less the amount of our total liabilities, divided by the number of shares of common stock outstanding, prior to the sale by us of 4,411,765 shares of common stock offered in this offering. Pro forma net tangible book value as of March 31, 2013 gives pro forma effect to (i) the conversion of all outstanding shares of our Class A voting common and Class B non-voting common stock into an aggregate of 14,460,717 shares of a single class of common stock upon the completion of this offering and (ii) the conversion of all outstanding shares of our Class A junior preferred stock, Class B senior preferred stock and Class C convertible preferred stock into an aggregate of 6,707,898 shares of common stock upon the completion of this offering. Dilution in pro forma net tangible book value per share represents the difference between the amount per share paid by investors in this offering and the net tangible book value per share of our common stock outstanding immediately after this offering.
After giving effect to the items discussed above and the sale by us of 4,411,765 shares of common stock in this offering, based upon an assumed initial public offering price of $17.00 per share, which is the midpoint of the price range set forth on the cover of this prospectus, and after deducting underwriting discounts and commissions and estimated expenses payable by us in connection with this offering and the payment of a $9.0 million fee to Gores to terminate our management services agreement with Gores, our pro forma, as adjusted, net tangible book value as of March 31, 2013 would have been approximately $98.4 million, or $3.85 per share of common stock. This represents an immediate increase in pro forma net tangible book value of $1.96 per share to existing stockholders and immediate dilution of $13.15 per share to new investors purchasing shares of common stock in this offering at the initial public offering price.
The following table illustrates this per share dilution.
| Assumed initial public offering price per share |
$ | 17.00 | ||||||
|
|
|
|||||||
| Pro forma net tangible book value per share as of March 31, 2013 |
$ | 1.89 | ||||||
| Increase in pro forma net tangible book value per share attributable to new investors in this offering |
1.96 | |||||||
|
|
|
|||||||
| Pro forma, as adjusted, net tangible book value per share as of March 31, 2013 (after giving effect to this offering) |
3.85 | |||||||
|
|
|
|||||||
| Dilution per share to new investors |
$ | 13.15 | ||||||
|
|
|
The following table summarizes, as of March 31, 2013, on a pro forma, as adjusted, basis giving pro forma effect to the items discussed above and the sale of 4,411,765 shares of common stock in this offering, the number of shares of our common stock purchased from us, the aggregate cash consideration paid to us and the average price per share paid to us by existing stockholders and to be paid by new investors purchasing shares of our common stock from us in this offering. The table assumes an initial public offering price of $17.00 per share, which is the midpoint of the price range set forth on the cover of this prospectus, before deducting estimated underwriting discounts and commissions and estimated expenses payable by us in connection with this offering and the payment of a $9.0 million fee to Gores to terminate our management agreement with Gores.
| Shares purchased | Total consideration | Average price per share |
||||||||||||||||||
| Number | Percent | Amount | Percent | |||||||||||||||||
| (millions) | ||||||||||||||||||||
| Existing stockholders |
21,168,615 | 82.8 | % | $ | 41.8 | 35.8 | % | $ | 1.98 | |||||||||||
| New investors |
4,411,765 | 17.2 | 75.0 | 64.2 | 17.00 | |||||||||||||||
|
|
|
|
|
|
|
|
|
|||||||||||||
| Total |
25,580,380 | 100 | % | $ | 116.8 | 100 | % | |||||||||||||
|
|
|
|
|
|
|
|
|
|||||||||||||
47
Table of Contents
A $1.00 increase (decrease) in the assumed initial public offering price of $17.00 per share, which is the midpoint of the price range set forth on the cover of this prospectus, would increase (decrease) the total consideration paid by investors participating in this offering by $4.4 million, or increase (decrease) the percent of total consideration paid by investors participating in this offering by 1.3% and 1.4%, respectively, assuming that the number of shares offered by us, as set forth on the cover of this prospectus, remains the same and before deducting the estimated underwriting discounts and commissions and estimated offering expenses payable by us.
To the extent that any options or other equity incentive grants are exercised or issued in the future (including pursuant to the 2013 Incentive Plan) with an exercise price or purchase price below the initial public offering price, new investors will experience further dilution.
48
Table of Contents
SELECTED CONSOLIDATED FINANCIAL DATA
The following tables set forth our selected consolidated financial data. The selected consolidated financial data as of December 31, 2011 and 2012 and for the years ended December 31, 2010, 2011 and 2012 have been derived from our audited consolidated financial statements included elsewhere in this prospectus. The selected consolidated financial data as of December 31, 2010 have been derived from our audited consolidated financial statements which are not included in this prospectus. The summary consolidated financial data as of March 31, 2013 and for the three-month periods ended March 31, 2012 and 2013 have been derived from our unaudited consolidated financial statements. The unaudited consolidated financial statements include all of our accounts and the accounts of our subsidiaries and, in the opinion of management, include all recurring adjustments and normal accruals necessary for a fair presentation of our financial position, results of operations and cash flows for the dates and periods presented. These financial statements should be read in conjunction with our most recent audited annual financial statements. Results for interim periods are not necessarily indicative of the results to be expected during the remainder of the current year or for any future period.
You should read the information set forth below in conjunction with “Use of Proceeds,” “Capitalization,” “Management’s Discussion and Analysis of Financial Condition and Results of Operations,” and our consolidated financial statements and notes thereto included elsewhere in this prospectus. Our historical consolidated financial data may not be indicative of our future performance.
| Year ended December 31, | Three months ended March 31, |
|||||||||||||||||||
| (in thousands, except shares and per share data) | 2010 | 2011 | 2012 | 2012 | 2013 | |||||||||||||||
| (as restated)(10) | (as restated)(10) | (as restated)(10) | ||||||||||||||||||
| Statement of operations information: |
||||||||||||||||||||
| Net sales |
$ | 751,706 | $ | 759,982 | $ | 942,398 | $ | 187,939 | $ | 248,726 | ||||||||||
| Cost of goods sold(1) |
587,692 | 591,017 | 727,670 | 144,508 | 194,936 | |||||||||||||||
|
|
|
|
|
|
|
|
|
|
|
|||||||||||
| Gross profit |
164,014 | 168,965 | 214,728 | 43,431 | 53,790 | |||||||||||||||
| Operating expenses: |
||||||||||||||||||||
| Selling, general and administrative expenses(2) |
246,338 | 213,036 | 221,192 | 52,834 | 56,802 | |||||||||||||||
| Depreciation expense |
29,337 | 11,844 | 7,759 | 2,067 | 1,639 | |||||||||||||||
| Amortization expense |
1,140 | 1,457 | 1,470 | 365 | 547 | |||||||||||||||
| Impairment of assets held for sale(3) |
2,944 | 580 | 361 | — | — | |||||||||||||||
| Restructuring expense(4) |
7,089 | 1,349 | 2,853 | 44 | 60 | |||||||||||||||
|
|
|
|
|
|
|
|
|
|
|
|||||||||||
| Loss from operations |
(122,834 | ) | (59,301 | ) | (18,907 | ) | (11,879 | ) | (5,258 | ) | ||||||||||
| Other income (expenses): |
||||||||||||||||||||
| Bargain purchase gain(5) |
11,223 | — | — | — | — | |||||||||||||||
| Interest expense |
(1,575 | ) | (2,842 | ) | (4,037 | ) | (963 | ) | (1,025 | ) | ||||||||||
| Other income (expense), net(6) |
(57 | ) | (2,120 | ) | 278 | 126 | 190 | |||||||||||||
|
|
|
|
|
|
|
|
|
|
|
|||||||||||
| Loss from continuing operations before income taxes |
(113,243 | ) | (64,263 | ) | (22,666 | ) | (12,716 | ) | (6,093 | ) | ||||||||||
| Income tax benefit(6) |
47,463 | 22,332 | 8,084 | 4,263 | 1,879 | |||||||||||||||
|
|
|
|
|
|
|
|
|
|
|
|||||||||||
| Loss from continuing operations |
(65,780 | ) | (41,931 | ) | (14,582 | ) | (8,453 | ) | (4,214 | ) | ||||||||||
| Income (loss) from discontinued operations, net of tax benefit (provision) of $4,038, $(658), $(52), 79 and (109), respectively(7) |
(4,214 | ) | (202 | ) | 49 | (113 | ) | 157 | ||||||||||||
|
|
|
|
|
|
|
|
|
|
|
|||||||||||
| Net loss |
(69,994 | ) | (42,133 | ) | (14,533 | ) | (8,566 | ) | (4,057 | ) | ||||||||||
| Redeemable Class B Senior Preferred stock dividend |
(5,079 | ) | (4,188 | ) | (4,480 | ) | (1,100 | ) | (729 | ) | ||||||||||
| Convertible Class C Preferred stock dividend |
— | — | (5,000 | ) | (5,000 | ) | — | |||||||||||||
|
|
|
|
|
|
|
|
|
|
|
|||||||||||
| Loss attributable to common stockholders |
$ | (75,073 | ) | $ | (46,321 | ) | $ | (24,013 | ) | $ | (14,666 | ) | $ | (4,786 | ) | |||||
|
|
|
|
|
|
|
|
|
|
|
|||||||||||
| Basic and diluted loss per common share(8): |
||||||||||||||||||||
| Loss from continuing operations |
$ | (3.01 | ) | $ | (2.07 | ) | $ | (1.83 | ) | $ | (1.15 | ) | $ | (0.36 | ) | |||||
| Income (loss) from discontinued operations |
(0.18 | ) | (0.01 | ) | — | (0.01 | ) | 0.01 | ||||||||||||
|
|
|
|
|
|
|
|
|
|
|
|||||||||||
| Net loss |
$ | (3.19 | ) | $ | (2.08 | ) | $ | (1.83 | ) | $ | (1.16 | ) | $ | (0.35 | ) | |||||
|
|
|
|
|
|
|
|
|
|
|
|||||||||||
| Weighted average number of common shares outstanding, basic and diluted(8) |
23,502,470 | 22,262,337 | 13,153,446 | 12,662,556 | 13,523,270 | |||||||||||||||
49
Table of Contents
| Year ended December 31, | Three months ended
March 31, |
|||||||||||||||||||
| (in thousands, except shares and per share data) | 2010 | 2011 | 2012 | 2012 | 2013 | |||||||||||||||
| (as restated)(10) |
(as restated)(10) |
(as restated)(10) |
||||||||||||||||||
| Statements of cash flows data: |
||||||||||||||||||||
| Net cash provided by (used in): |
||||||||||||||||||||
| Operating activities |
$ | (57,999 | ) | $ | (7,001 | ) | $ | (12,243 | ) | $ | (10,900 | ) | $ | (17,641 | ) | |||||
| Investing activities |
8,093 | 7,322 | (4,861 | ) | 1,165 | 1,466 | ||||||||||||||
| Financing activities |
(20,415 | ) | 138 | 14,838 | 10,039 | 19,239 | ||||||||||||||
| Other financial data: |
||||||||||||||||||||
| Depreciation and amortization |
$ | 36,149 | $ | 16,188 | $ | 11,718 | $ | 3,030 | $ | 2,959 | ||||||||||
| Capital expenditures |
2,506 | 1,339 | 2,741 | 705 | 374 | |||||||||||||||
| EBITDA(9) |
(79,733 | ) | (45,435 | ) | (6,862 | ) | (8,836 | ) | (1,952 | ) | ||||||||||
| Adjusted EBITDA(9) |
(57,987 | ) | (30,799 | ) | 1,993 | (7,657 | ) | (1,221 | ) | |||||||||||
| Balance sheet data (at period end): |
||||||||||||||||||||
| Cash and cash equivalents |
$ | 4,498 | $ | 4,957 | $ | 2,691 | $ | 5,261 | $ | 5,755 | ||||||||||
| Total current assets |
188,227 | 155,455 | 194,345 | 189,509 | 230,255 | |||||||||||||||
| Property and equipment, net of accumulated depreciation |
72,821 | 57,759 | 55,076 | 55,492 | 54,302 | |||||||||||||||
| Total assets |
294,970 | 254,641 | 286,012 | 283,423 | 320,499 | |||||||||||||||
| Total debt |
15,174 | 35,915 | 79,182 | 45,787 | 100,292 | |||||||||||||||
| Redeemable preferred stock |
50,809 | 54,997 | 41,477 | 61,097 | 42,206 | |||||||||||||||
| Total stockholders’ equity(8) |
122,229 | 51,426 | 34,164 | 42,213 | 29,522 | |||||||||||||||
| (1) | Includes depreciation expense of $5.7 million, $2.9 million, $2.5 million, $0.6 million and $0.8 million for the years ended December 31, 2010, 2011 and 2012, and the three months ended March 31, 2012 and 2013, respectively. |
| (2) | Includes severance expense of $1.6 million, $2.0 million, $0.5 million, $0.1 million and $0 for the years ended December 31, 2010, 2011 and 2012, and the three months ended March 31, 2012 and 2013, respectively. |
| (3) | Impairment of assets held for sale represents the write down of such assets to the lower of depreciated cost or estimated fair value less expected disposition costs. See note (9) to our audited financial statements included elsewhere in this prospectus. |
| (4) | Relates to store closures and workforce reductions in continuing markets. |
| (5) | Represents the excess of the net assets acquired over the purchase price of certain assets and liabilities of NHC in April 2010. See note (4) to our audited financial statements included elsewhere in this prospectus. |
| (6) | Includes $3.1 million, $1.9 million and $0.4 million of expense related to the reduction of a tax indemnification asset, with a corresponding increase in income tax benefit, for the years ended December 31, 2010, 2011 and 2012, respectively. This indemnification asset corresponds to the long-term liability related to uncertain tax positions for which Wolseley had indemnified the Company, which was reduced upon the expiration of the statute of limitations for certain tax periods. See note (15) to our audited financial statements included elsewhere in this prospectus. |
| (7) | During the years ended December 31, 2010, 2011 and 2012, we ceased operations in certain geographic markets due to declines in residential homebuilding throughout the United States. The cessation of operations in these markets has been treated as discontinued operations as the markets had distinguishable cash flows and operations that have been eliminated from ongoing operations. See note (5) to our audited financial statements included elsewhere in this prospectus. |
| (8) | We have adjusted our historical financial statements to retroactively reflect the conversion from a limited liability company to a corporation and the change of members’ equity to stockholders’ equity. |
| (9) | EBITDA is defined as net loss before interest, income taxes and depreciation and amortization. Adjusted EBITDA is defined as EBITDA plus impairment of assets held for sale, restructuring, severance and other expenses related to store closures and business optimization, bargain purchase gain, discontinued operations, management fees, non-cash compensation, acquisition costs, other expense resulting from the reduction of a tax indemnification asset and certain other items. Adjusted EBITDA is intended as a supplemental measure of our performance that is not required by, or presented in accordance with, GAAP. We believe that EBITDA and Adjusted EBITDA provide useful information to management and investors regarding certain financial and |
50
Table of Contents
| business trends relating to our financial condition and operating results. Our management uses EBITDA and Adjusted EBITDA to compare the Company’s performance to that of prior periods for trend analyses, for purposes of determining management incentive compensation, and for budgeting and planning purposes. These measures are used in monthly financial reports prepared for management and our board of directors. We believe that the use of EBITDA and Adjusted EBITDA provides an additional tool for investors to use in evaluating ongoing operating results and trends and in comparing the Company’s financial measures with other distribution and retail companies, which may present similar non-GAAP financial measures to investors. Our management does not consider EBITDA or Adjusted EBITDA in isolation or as an alternative to financial measures determined in accordance with GAAP. The principal limitation of EBITDA and Adjusted EBITDA is that they exclude significant expenses and income that are required by GAAP to be recorded in the Company’s financial statements. Some of these limitations are: (i) EBITDA and Adjusted EBITDA do not reflect changes in, or cash requirements for, our working capital needs; (ii) EBITDA and Adjusted EBITDA do not reflect our interest expense, or the requirements necessary to service interest or principal payments on our debt; (iii) EBITDA and Adjusted EBITDA do not reflect our income tax expenses or the cash requirements to pay our taxes; (iv) EBITDA and Adjusted EBITDA do not reflect historical cash expenditures or future requirements for capital expenditure or contractual commitments; and (v) although depreciation and amortization charges are non-cash charges, the assets being depreciated and amortized will often have to be replaced in the future and EBITDA and Adjusted EBITDA do not reflect any cash requirements for such replacements. In order to compensate for these limitations, management presents EBITDA and Adjusted EBITDA in connection with GAAP results. You should review the reconciliation of net loss to EBITDA and Adjusted EBITDA below, and not rely on any single financial measure to evaluate our business. |
The following is a reconciliation of net loss to EBITDA and Adjusted EBITDA.
| Year ended December 31, | Three months ended March 31, |
|||||||||||||||||||
| (dollars in thousands) | 2010 | 2011 | 2012 | 2012 | 2013 | |||||||||||||||
| (as restated)(i) | (as restated)(i) | (as restated)(i) | ||||||||||||||||||
| Net loss |
$ | (69,994 | ) | $ | (42,133 | ) | $ | (14,533 | ) | $ | (8,566 | ) | $ | (4,057 | ) | |||||
| Interest expense |
1,575 | 2,842 | 4,037 | 963 | 1,025 | |||||||||||||||
| Income tax benefit |
(47,463 | ) | (22,332 | ) | (8,084 | ) | (4,263 | ) | (1,879 | ) | ||||||||||
| Depreciation and amortization |
36,149 | 16,188 | 11,718 | 3,030 | 2,959 | |||||||||||||||
|
|
|
|
|
|
|
|
|
|
|
|||||||||||
| EBITDA |
$ | (79,733 | ) | $ | (45,435 | ) | $ | (6,862 | ) | $ | (8,836 | ) | $ | (1,952 | ) | |||||
| Impairment of assets held for sale(a) |
2,944 | 580 | 361 | — | — | |||||||||||||||
| Restructuring, severance, other expense related to store closures and business optimization(b) |
19,731 | 8,110 | 5,228 | 287 | 233 | |||||||||||||||
| Bargain purchase gain(c) |
(11,223 | ) | — | — | — | — | ||||||||||||||
| Discontinued operations, net of tax benefit(d) |
4,214 | 202 | (49 | ) | 113 | (157 | ) | |||||||||||||
| Management fees(e) |
2,597 | 2,406 | 1,379 | 405 | 406 | |||||||||||||||
| Non-cash compensation expense |
288 | 384 | 1,305 | 328 | 146 | |||||||||||||||
| Acquisition costs(f) |
4,086 | 1,017 | 284 | 46 | 103 | |||||||||||||||
| Reduction of tax indemnification asset(g) |
3,056 | 1,937 | 347 | — | — | |||||||||||||||
| Other items(h) |
(3,947 | ) | — | — | — | — | ||||||||||||||
|
|
|
|
|
|
|
|
|
|
|
|||||||||||
| Adjusted EBITDA |
$ | (57,987 | ) | $ | (30,799 | ) | $ | 1,993 | $ | (7,657 | ) | $ | (1,221 | ) | ||||||
|
|
|
|
|
|
|
|
|
|
|
|||||||||||
| (a) | See note (3) above. |
51
Table of Contents
| (b) | See notes (2) and (4) above. Also includes (i) $7.7 million, $3.9 million, $1.8 million, $0.2 million and $0.1 million for the years ended December 31, 2010, 2011 and 2012, and the three months ended March 31, 2012 and 2013, respectively, related to closed locations, consisting of pre-tax losses incurred during closure and post-closure expenses, (ii) a $1.4 million loss on the sale of land and buildings in the year ended December 31, 2010, and (iii) $1.9 million, $0.9 million and $0 of business optimization expenses, primarily consulting fees related to cost saving initiatives, for the years ended December 31, 2010, 2011 and 2012, respectively. |
| (c) | See note (5) above. |
| (d) | See note (7) above. |
| (e) | Represents the expense for management services provided by Gores and its affiliates and by Wolseley through November 2011, other than $0.5 million that is included in income (loss) from discontinued operations the year ended December 31, 2010. |
| (f) | Represents (i) $2.1 million and $2.0 million in the year ended December 31, 2010 related to the acquisition of NHC and Bison, respectively, (ii) $0.8 million and $0.2 million in the year ended December 31, 2011 related to an abandoned acquisition and the acquisition of Bison, respectively, and (iii) $0.2 million and $0.1 million in the year ended December 31, 2012 related to the acquisitions of TBSG and Chesapeake, respectively, and (iv) $0.1 million in the three months ended March 31, 2013 related to the acquisition of TBSG. |
| (g) | See note (6) above. |
| (h) | Represents (i) $0.7 million of expenses related to the Company’s prepackaged reorganization and (ii) $4.6 million received as proceeds from the settlement of a legal proceeding. |
| (i) | See note (10) below. |
| (10) | Our consolidated financial statements and related footnotes as of December 31, 2012 and March 31, 2013, for the year ended December 31, 2012 and for the three months ended March 31, 2012 and 2013 have been restated. See note (2) to our audited and unaudited financial statements included elsewhere in this prospectus. |
52
Table of Contents
MANAGEMENT’S DISCUSSION AND ANALYSIS OF
FINANCIAL CONDITION AND RESULTS OF OPERATIONS
You should read this discussion and analysis in conjunction with our historical consolidated financial statements and the notes thereto included elsewhere in this prospectus. This discussion and analysis covers periods prior to this offering and related transactions. As a result, the discussion and analysis of historical periods does not reflect the impact that this offering, such conversion and other related transactions will have on us. Our historical results may not be indicative of our future performance. This discussion and analysis contains forward-looking statements and involves numerous risks and uncertainties, including, but not limited to, those discussed in “Risk Factors.” Our actual results may differ materially from those contained in any forward-looking statements. “Management’s Discussion and Analysis of Financial Condition and Results of Operations” has been revised for the effects of the restatement of our consolidated financial statements. See note (2) to our audited and unaudited financial statements included elsewhere in this prospectus.
Overview
We are a large, diversified LBM distributor and solutions provider that sells to new construction and repair and remodel contractors. We carry a broad line of products and have operations throughout the United States. Our primary products are lumber & lumber sheet goods and structural components, including engineered wood, trusses and wall panels, millwork, doors, flooring, windows & other exterior products. Additionally, we provide solution-based services to our customers, including design, product specification and installation management services. We serve a broad customer base, including large-scale production homebuilders, custom homebuilders and repair and remodeling contractors, and we believe we are among the top three LBM suppliers for residential construction in 80% of the geographic markets in which we operate, based on net sales. We offer over 39,000 products sourced through our strategic network of suppliers, which together with our various solution-based services represent approximately 50% of the construction cost of a typical new home. By enabling our customers to source a significant portion of their materials and services from one supplier, we have positioned ourselves as the supply partner of choice for many of our customers.
We have operations in 13 states that accounted for approximately 48% of 2012 U.S. single-family housing permits according to the U.S. Census Bureau. We operate in 20 metropolitan areas in these 13 states that we believe have an attractive potential for economic growth based on population trends, increasing business activity and above-average employment growth.
Restatement of previously issued consolidated financial statements
We have restated our previously issued consolidated financial statements and related footnotes as of December 31, 2012 and March 31, 2013, for the year ended December 31, 2012 and for the three months ended March 31, 2012 and 2013. For additional information regarding this restatement, see note (2) to our audited and unaudited financial statements included elsewhere in this prospectus.
We have restated our consolidated financial statements to account for a beneficial conversion feature for our Convertible Class C Preferred stock and related dividends for the year ended December 31, 2012 and the three months ended March 31, 2012. These dividends increased our loss attributable to common stockholders by $5.0 million and our basic and diluted loss per share by approximately $0.38 per share for the year ended December 31, 2012 and $0.39 per share for the three months ended March 31, 2012.
In addition, we have restated our consolidated financial statements to record additional compensation expense related to the modification of the exercise price of our outstanding stock options, the issuance of new options and the purchase of shares by management. Accordingly, in the
53
Table of Contents
restated consolidated statements of operations for the year ended December 31, 2012, and the three months ended March 31, 2012 and 2013, we increased stock based compensation expense by $0.5 million, $0.2 million and $0.02 million, respectively, we increased the related income tax benefit by $0.2 million, $0.06 million and $0, respectively, and increased the basic and diluted loss per share by approximately $0.03, $0.01 and $0, respectively. In the restated consolidated balance sheets as of December 31, 2012 and March 31, 2013, we increased additional paid-in capital by $0.5 million and $0.5 million and retained deficit by $0.3 million and $0.3 million, respectively, and we decreased income tax payable by $0.2 million, and $0.2 million, respectively.
All data included in “Management’s Discussion and Analysis of Financial Condition and Results of Operations” for the year ended December 31, 2012 and for the three months ended March 31, 2012 and 2013 is derived from our restated consolidated financial statements for those periods.
Factors affecting our operating results
Our operating results and financial performance are influenced by a variety of factors, including conditions in the housing market and economic conditions generally, changes in the cost of the products we sell (particularly commodity products), pricing policies of our competitors, production schedules of our customers and seasonality. Some of the more important factors are briefly discussed below.
Conditions in the housing and construction market
The building products supply and services industry is highly dependent on new home construction and repair and remodeling activity, which in turn are dependent upon a number of factors, including interest rates, consumer confidence, employment rates, foreclosure rates, housing inventory levels, housing demand, the availability of land, the availability of construction financing and the health of the economy and mortgage markets. The homebuilding industry underwent a significant downturn that began in mid-2006 and began to stabilize in late 2011. The downturn in the homebuilding industry resulted in a substantial reduction in demand for our products and services, which in turn had a significant adverse effect on our business and operating results during fiscal years 2007 through 2012 and led to our filing for bankruptcy in 2009. As of June 2013, McGraw-Hill Construction forecasts that U.S. single-family housing starts will increase to 1.1 million by 2015. There is significant uncertainty regarding the timing and extent of any recovery in construction and repair and remodel activity and resulting product demand levels. The positive impact of a recovery on our business may also be dampened to the extent the average selling price or size of new single family homes decreases, which could cause homebuilders to decrease spending. We believe that, over the long-term, there is considerable growth potential in the U.S. housing sector.
We view single-family housing starts as a leading indicator of future business, but an additional driver of our results in any period is the number of housing units under construction (“HUC”). HUC has increased in the last year as a result of the increase in housing starts, although the HUC at the end of 2012 was roughly comparable to 2010 levels and growth in this metric has lagged the growth in housing starts during the early stages of the recent housing recovery.
Due to the low levels of housing starts and HUC relative to historical averages, continued competition for homebuilder business and growth in share of production homebuilders (see “—Consolidation of large homebuilders”), we have and may continue to experience pressure on our gross margins. Many industry forecasters expect to see continued improvement in housing demand over the next few years. We believe there are several trends that indicate U.S. housing demand will likely recover in the long term and that the recent downturn in the housing industry is likely a trough in the cyclical nature of the residential construction industry. We believe that these trends are supported by
54
Table of Contents
positive economic and demographic indicators that are beginning to take hold in many of the markets in which we operate. These indicators, which are typically indicative of housing market strength, include:
| Ÿ | declining unemployment rates; |
| Ÿ | rising home values and improving household finances; |
| Ÿ | rebounding household formations; |
| Ÿ | improving sentiment towards ownership of residential real estate; |
| Ÿ | declining levels of new and existing for-sale home inventory; and |
| Ÿ | a favorable consumer interest rate environment supporting affordability and home ownership. |
Overall economic conditions in the markets where we operate
Economic changes both nationally and locally in our markets impact our financial performance. Unfavorable changes in demographics, credit markets, consumer confidence, health care costs, housing affordability, housing inventory levels, a weakening of the national economy or of any regional or local economy in which we operate, and other factors beyond our control could adversely affect consumer spending, result in decreased demand for homes, and adversely affect our business. We believe continued employment growth, prospective home buyers’ access to financing, and improved consumer confidence will be necessary to increase household formation rates. Improved household formation rates in turn will increase demand for housing and stimulate new construction.
In addition, beginning in 2007, the mortgage markets experienced substantial disruption due to increased defaults, primarily as a result of credit quality deterioration. The disruption resulted in a stricter regulatory environment and reduced availability of mortgages for potential home buyers due to a tight credit market and stricter standards to qualify for mortgages. Mortgage financing and commercial credit for smaller homebuilders as well as for the development of new residential lots continue to be constrained. As the housing industry is dependent upon the economy and employment levels as well as potential home buyers’ access to mortgage financing and homebuilders’ access to commercial credit, it is likely that the housing industry will not fully recover until conditions in the economy and the credit markets improve and unemployment rates decline.
Commodity nature of our products
Many of the building products we distribute, including lumber, OSB, plywood and particleboard, are commodities that are widely available from other manufacturers or distributors with prices and volumes determined frequently based on participants’ perceptions of short-term supply and demand factors. A shortage of capacity or excess capacity in the industry can result in significant increases or declines in market prices for those products, often within a short period of time. Prices of commodity products can also change as a result of national and international economic conditions, labor and freight costs, competition, market speculation, government regulation, and trade policies, as well as from periodic delays in the delivery of lumber and other products. Short-term changes in the cost of these materials, some of which are subject to significant fluctuations, are sometimes passed on to our customers, but our pricing quotation periods and pricing pressure from our competitors may limit our ability to pass on such price changes. For example, from time to time we enter into extended pricing commitments, which could compress our gross margins in periods of inflation.
55
Table of Contents
The following table provides changes in the average composite framing lumber prices (per thousand board feet) and average composite structural panel prices (per thousand square feet). This composite calculation is based on index prices for OSB and plywood as reflected by Random Lengths for the periods noted below.
| Year ended December 31, | Three months ended March 31, |
|||||||||||||||||||||||||||||||
| 2010 versus 2009 |
2010 average price |
2011 versus 2010 |
2011 average price |
2012 versus 2011 |
2012 average price |
2013 versus 2012 |
2013 average price |
|||||||||||||||||||||||||
| Increase (decrease) in framing lumber prices |
28 | % | $ | 284 | (4 | )% | $ | 272 | 18 | % | $ | 322 | 28 | % | $ | 413 | ||||||||||||||||
| Increase (decrease) in structural panel prices |
25 | % | $ | 324 | (10 | )% | $ | 292 | 32 | % | $ | 384 | 30 | % | $ | 501 | ||||||||||||||||
Periods of increasing prices provide the opportunity for higher sales and increased gross profit, while periods of declining prices may result in declines in sales and profitability. In particular, low market prices for wood products over a sustained period can adversely affect our financial condition, operating results and cash flows, as can excessive spikes in market prices. The increase in lumber and panel prices during the year ended December 31, 2012, compared with the same period in 2011, was one component of our improved net sales and gross profit for the year ended December 31, 2012, which increased $182.4 million and $45.8 million, respectively. For further discussion of the impact of commodity prices on historical periods, see “—Operating Results.”
Consolidation of large homebuilders
Over the past ten years, the homebuilding industry has undergone consolidation, and many larger homebuilders have increased their market share. We expect that trend to continue as larger homebuilders have better liquidity and land positions relative to the smaller, less capitalized homebuilders. Our focus is on maintaining relationships and market share with these customers while balancing the competitive pressures we face in our markets with certain profitability expectations. Our sales to production homebuilders, which include many of the country’s largest 100 homebuilders, increased 36.0% during 2012, compared to a 24.3% increase in actual U.S. single-family housing starts for the year. We expect that our ability to maintain strong relationships with the largest builders will be vital to our ability to expand into new markets as well as grow our market share. While we generate significant sales from these homebuilders, our gross margins on sales to them tend to be lower than our gross margins on sales to other market segments, which would impact our gross margins as homebuilding recovers if the market share held by the production homebuilders continues to increase.
Seasonality
Our first and fourth quarters have historically been, and are generally expected to continue to be, adversely affected by weather patterns in some of our markets, causing reduced construction activity. In addition, quarterly results historically have reflected, and are expected to continue to reflect, fluctuations from period to period arising from the following:
| Ÿ | the volatility of lumber prices; |
| Ÿ | the cyclical nature of the homebuilding industry; |
| Ÿ | general economic conditions in the markets in which we compete; |
| Ÿ | the pricing policies of our competitors; |
56
Table of Contents
| Ÿ | the production schedules of our customers; and |
| Ÿ | the effects of weather. |
The composition and level of working capital typically change during periods of increasing sales as we carry more inventory and receivables, although this is generally offset in part by higher trade payables to our suppliers. Working capital levels typically increase in the second and third quarters of the year due to higher sales during the peak residential construction season. These increases have in the past resulted in negative operating cash flows during this peak season, which historically have been financed through available cash or excess availability on our Revolver. Collection of receivables and reduction in inventory levels following the peak building and construction season have in the past positively impacted cash flow. In the past, we have also utilized our borrowing availability under credit facilities to cover working capital needs.
Our ability to control expenses
We pay close attention to managing our working capital and operating expenses. We employ a LEAN process operating philosophy, which encourages continuous improvement in our core processes to minimize waste, improve customer service, increase expense productivity, improve working capital, and maximize profitability and cash flow. We regularly analyze our workforce productivity to achieve the optimum, cost-efficient labor mix for our facilities. Further, we pay careful attention to our logistics function and have implemented GPS-based technology to improve customer service and improve productivity of our shipping and handling costs.
Mix of products sold
We typically realize greater gross margins on more highly engineered and customized products, or ancillary products that are often purchased based on convenience and are therefore less price sensitive to our customers. For example, sales of lumber & lumber sheet goods tend to generate lower gross margins due to their commodity nature and the relatively low switching costs of sourcing those products from different suppliers. Structural components and millwork & other interior products often generate higher gross profit dollars relative to other products. Prior to the housing downturn, homebuilders were increasingly using structural components in order to realize increased efficiency and improved quality. Shortening cycle time from start to completion was a key imperative of homebuilders during periods of strong consumer demand. During the housing downturn, that trend decelerated as cycle time had less relevance. Customers who traditionally used structural components, for the most part, still do. However, the conversion of customers to this product offering has slowed. We expect this trend to reverse as the residential new construction market continues to strengthen.
Changes in sales mix among construction segments
Our operating results may vary according to the amount and type of products we sell to each of our four primary construction segments: new single-family construction, remodeling, multi-family and light commercial. We tend to realize higher gross margins on sales to the remodeling segment due to the smaller product volumes purchased by those customers, as well as the more customized nature of the projects those customers generally undertake. Gross margins within the new single-family, multi-family and light commercial construction segments can vary based on a variety of factors, including the purchase volumes of the individual customer, the mix of products sold to that customer, the size and selling price of the project being constructed, and the number of upgrades added to the project before or during its construction.
57
Table of Contents
Freight costs and fuel charges
A portion of our shipping and handling costs is comprised of diesel or other fuels purchased for our delivery fleet. According to the U.S. Energy Information Administration, the average retail price per gallon for No. 2 diesel fuel was $2.99, $3.85 and $3.97 during 2010, 2011 and 2012, respectively. For the year ended December 31, 2012, we incurred costs of approximately $8.9 million within selling, general and administrative expenses for diesel and other fuels. Future increases in the cost of fuel, or inbound freight costs for the products we purchase, could impact our operating results and cash flows if we are unable to pass along these cost increases to our customers through increased prices.
Certain factors affecting our financial statements
Discontinued operations and divestitures
During the years ended December 31, 2010, 2011 and 2012, we ceased operations in certain geographic markets due to declines in residential homebuilding throughout the United States and other strategic reasons. We will have no further significant continuing operations in the sold operations and exited geographic markets. The cessation of operations in these markets has been treated as discontinued operations as the markets had distinguishable cash flows and operations that have been eliminated from ongoing operations.
On April 30, 2010, we sold our Commercial Door and Hardware operations (“CDH”) to an external party for proceeds of $26.1 million. CDH consisted of twelve locations in six states and was sold in order to focus on our core residential building materials business. We recognized a loss on the sale of CDH of $0.8 million, net of transaction fees of $1.4 million.
On January 11, 2010, we sold our subsidiary, Universal Supply, LLC (“US”), to an external party for proceeds of $20.8 million. US consisted of eight roofing and siding stores in New Jersey, and was sold in order to focus on our core residential building materials business. We recognized a gain on the sale of US of $1.5 million, net of transaction fees of $1.0 million.
Restructuring expenses
During each of 2010, 2011 and 2012, in addition to discontinuing operations in certain markets as described above, we instituted several store closures and reductions in headcount in continuing markets (the “Restructurings”) in an effort to: (i) strengthen our competitive position; (ii) reduce costs and (iii) improve operating margins within existing markets that management believes have favorable long-term growth demographics.
For the year ended December 31, 2010, we recognized restructuring charges of $7.1 million from continuing operations and $0.1 million from discontinued operations. For the year ended December 31, 2011, we recognized restructuring charges of $1.3 million from continuing operations and $1.0 million from discontinued operations. For the year ended December 31, 2012, we recognized restructuring charges of $2.9 million from continuing operations and $0.1 million from discontinued operations. For the three months ended March 31, 2013, we recognized restructuring charges of $0.1 million from continuing operations. No additional costs are expected to be incurred related to the Restructurings for future periods, other than interest costs associated with remaining restructuring reserves.
Acquisitions
During 2010 and 2012, we acquired three businesses: Bison and NHC in 2010, and TBSG in 2012. As a result of these acquisitions, our revenues for the year ended December 31, 2011 increased
58
Table of Contents
by approximately $43.2 million compared to the year ended December 31, 2010. TBSG was acquired on December 21, 2012 and did not have a material impact on our 2012 operating results. Our revenues for the three months ended March 31, 2013 increased by approximately $4.5 million compared to the three months ended March 31, 2012 as a result of the TBSG acquisition.
Operating results
The following tables set forth our operating results in dollars and as a percentage of net sales for the periods indicated.
| (dollars in thousands) | 2010 | 2011 | 2012 | Three months ended March 31, 2012 |
Three months ended March 31, 2013 |
|||||||||||||||||||||||||||||||||||
| (as restated) | (as restated) | (as restated) | ||||||||||||||||||||||||||||||||||||||
| Net sales |
$ | 751,706 | 100.0 | % | $ | 759,982 | 100.0 | % | $ | 942,398 | 100.0 | % | $ | 187,939 | 100.0 | % | $ | 248,726 | 100.0 | % | ||||||||||||||||||||
| Cost of goods sold |
587,692 | 78.2 | 591,017 | 77.8 | 727,670 | 77.2 | 144,508 | 76.9 | 194,936 | 78.4 | ||||||||||||||||||||||||||||||
|
|
|
|
|
|
|
|
|
|
|
|
|
|
|
|
|
|
|
|
|
|||||||||||||||||||||
| Gross profit |
164,014 | 21.8 | 168,965 | 22.2 | 214,728 | 22.8 | 43,431 | 23.1 | 53,790 | 21.6 | ||||||||||||||||||||||||||||||
| Operating expenses: |
||||||||||||||||||||||||||||||||||||||||
| Selling, general and administrative expenses |
246,338 | 32.8 | 213,036 | 28.0 | 221,192 | 23.5 | 52,834 | 28.1 | 56,802 | 22.8 | ||||||||||||||||||||||||||||||
| Depreciation expense |
29,337 | 3.9 | 11,844 | 1.5 | 7,759 | 0.8 | 2,067 | 1.1 | 1,639 | 0.7 | ||||||||||||||||||||||||||||||
| Amortization expense |
1,140 | 0.2 | 1,457 | 0.2 | 1,470 | 0.2 | 365 | 0.2 | 547 | 0.2 | ||||||||||||||||||||||||||||||
| Impairment of assets held for sale |
2,944 | 0.4 | 580 | 0.1 | 361 | 0.0 | — | — | — | — | ||||||||||||||||||||||||||||||
| Restructuring expense |
7,089 | 0.9 | 1,349 | 0.2 | 2,853 | 0.3 | 44 | 0.0 | 60 | 0.0 | ||||||||||||||||||||||||||||||
|
|
|
|
|
|
|
|
|
|
|
|
|
|
|
|
|
|
|
|
|
|||||||||||||||||||||
| Loss from operations |
(122,834 | ) | (16.4 | ) | (59,301 | ) | (7.8 | ) | (18,907 | ) | (2.0 | ) | (11,879 | ) | (6.3 | ) | (5,258 | ) | (2.1 | ) | ||||||||||||||||||||
| Other income (expenses): |
||||||||||||||||||||||||||||||||||||||||
| Bargain purchase gain |
11,223 | 1.5 | — | — | — | — | — | — | — | — | ||||||||||||||||||||||||||||||
| Interest expense, net |
(1,575 | ) | (0.2 | ) | (2,842 | ) | (0.4 | ) | (4,037 | ) | (0.4 | ) | (963 | ) | (0.5 | ) | (1,025 | ) | (0.4 | ) | ||||||||||||||||||||
| Other income (expense), net |
(57 | ) | (0.0 | ) | (2,120 | ) | (0.3 | ) | 278 | 0.0 | 126 | 0.1 | 190 | 0.1 | ||||||||||||||||||||||||||
|
|
|
|
|
|
|
|
|
|
|
|
|
|
|
|
|
|
|
|
|
|||||||||||||||||||||
| Loss from continuing operations before income taxes |
(113,243 | ) | (15.1 | ) | (64,263 | ) | (8.5 | ) | (22,666 | ) | (2.4 | ) | (12,716 | ) | (6.7 | ) | (6,093 | ) | (2.4 | ) | ||||||||||||||||||||
| Income tax benefit |
47,463 | 6.3 | 22,332 | 2.9 | 8,084 | 0.9 | 4,263 | 2.2 | 1,879 | 0.7 | ||||||||||||||||||||||||||||||
|
|
|
|
|
|
|
|
|
|
|
|
|
|
|
|
|
|
|
|
|
|||||||||||||||||||||
| Loss from continuing operations |
(65,780 | ) | (8.8 | ) | (41,931 | ) | (5.5 | ) | (14,582 | ) | (1.5 | ) | (8,453 | ) | (4.5 | ) | (4,214 | ) | (1.7 | ) | ||||||||||||||||||||
| Income (loss) from discontinued operations, net of tax benefit (provision) of $4,038, $(658), $(52), $79 and $(109), respectively |
(4,214 | ) | (0.6 | ) | (202 | ) | (0.0 | ) | 49 | 0.0 | (113 | ) | (0.1 | ) | 157 | 0.1 | ||||||||||||||||||||||||
|
|
|
|
|
|
|
|
|
|
|
|
|
|
|
|
|
|
|
|
|
|||||||||||||||||||||
| Net loss |
$ | (69,994 | ) | (9.3 | )% | $ | (42,133 | ) | (5.5 | )% | $ | (14,533 | ) | (1.5 | )% | $ | (8,566 | ) | (4.6 | )% | $ | (4,057 | ) | (1.6 | )% | |||||||||||||||
|
|
|
|
|
|
|
|
|
|
|
|
|
|
|
|
|
|
|
|
|
|||||||||||||||||||||
Three months ended March 31, 2013 compared to three months ended March 31, 2012
Net sales
For the three months ended March 31, 2013, net sales increased $60.8 million, or 32.3%, to $248.7 million from $187.9 million during the three months ended March 31, 2012, driven primarily by increases in housing starts in the markets we serve, as well as inflation in commodity products. According to the U.S. Census Bureau, single-family housing starts, which were the primary driver for approximately 78% of our sales for the three months ended March 31, 2013, increased 29.0% for the quarter, compared with the three months ended March 31, 2012. We estimate our sales volume increased approximately 21.1%, including approximately $4.5 million in net sales from 2012 acquisitions, while commodity price inflation resulted in an additional 11.2% increase in sales for the three months ended March 31, 2013 compared to the three months ended March 31, 2012. Increases in net sales from our locations in Texas, Georgia and North Carolina represented approximately 70% of the total increase in net sales for the three months ended March 31, 2013 compared to the three months ended March 31, 2012.
59
Table of Contents
The following table shows sales classified by major product category.
| Three months ended March 31, 2012 |
Three months ended March 31, 2013 |
|||||||||||||||||||
| (dollars in thousands) | Sales | % of Sales | Sales | % of Sales | % Change | |||||||||||||||
| Structural components |
$ | 21,578 | 11.5 | % | $ | 30,565 | 12.3 | % | 41.6 | % | ||||||||||
| Millwork and other interior products |
37,135 | 19.8 | 47,415 | 19.1 | 27.7 | |||||||||||||||
| Lumber & lumber sheet goods |
61,160 | 32.5 | 93,688 | 37.7 | 53.2 | |||||||||||||||
| Windows and other exterior products |
43,134 | 22.9 | 48,840 | 19.6 | 13.2 | |||||||||||||||
| Other building products & services |
24,932 | 13.3 | 28,218 | 11.3 | 13.2 | |||||||||||||||
|
|
|
|
|
|
|
|
|
|
|
|||||||||||
| Total sales |
$ | 187,939 | 100.0 | % | $ | 248,726 | 100.0 | % | 32.3 | % | ||||||||||
|
|
|
|
|
|
|
|
|
|
|
|||||||||||
Increased sales volume was achieved across all product categories. Average selling prices for lumber and lumber sheet goods were approximately 33.7% higher for the three months ended March 31, 2013 compared to the three months ended March 31, 2012. This commodity price inflation has resulted in sales growth for lumber & lumber sheet goods exceeding that of our other product categories. Windows and other exterior products, and other building products & services include subcategories, such as roofing, siding and hardware, which are driven more by the repair and remodeling market and therefore experienced slower growth in sales volumes than other product categories.
Cost of goods sold
For the three months ended March 31, 2013, cost of goods sold increased $50.4 million, or 34.9%, to $194.9 million from $144.5 million during the three months ended March 31, 2012. We estimate our cost of sales increased approximately 22.5% as a result of increased sales volumes, while commodity cost inflation resulted in an additional 12.4% increase in cost of goods sold.
Gross profit
For the three months ended March 31, 2013, gross profit increased $10.4 million, or 23.9%, to $53.8 million from $43.4 million for the three months ended March 31, 2012, driven primarily by increased sales volumes. Our gross profit as a percentage of net sales (“gross margin”) decreased to 21.6% for the three months ended March 31, 2013 from 23.1% for the three months ended March 31, 2012, primarily as a result of the increased percentage of net sales attributable to lumber & lumber sheet goods.
Operating expenses
For the three months ended March 31, 2013, selling, general and administrative expenses increased $4.0 million, or 7.5%, to $56.8 million from $52.8 million for the three months ended March 31, 2012. This was driven primarily by variable costs to serve higher sales volumes, such as sales commissions, shipping and handling costs and other variable compensation, which increased by $3.3 million in the aggregate for the three months ended March 31, 2013 as compared to the three months ended March 31, 2012.
For the three months ended March 31, 2013, depreciation expense decreased $0.4 million, or 20.7%, to $1.6 million from $2.1 million during the three months ended March 31, 2012, driven primarily by a reduction in the size of our distribution fleet and the full depreciation of certain fixed assets.
For the three months ended March 31, 2013, amortization expense increased to $0.5 million from $0.4 million for the three months ended March 31, 2012, due primarily to amortization of intangible assets acquired in the TBSG acquisition.
60
Table of Contents
For the three months ended March 31, 2013, restructuring expense was $0.1 million compared to $0.0 million for the three months ended March 31, 2012. The expense related primarily to interest accretion on our restructuring reserves.
Other income (expenses)
Interest expense. For the three months ended March 31, 2013, interest expense of $1.0 million was unchanged from $1.0 million for the three months ended March 31, 2012, which was a result of higher average borrowings offset by lower interest rates.
Other income, net. For the three months ended March 31, 2013, other income, net was $0.2 million compared to $0.1 million for the three months ended March 31, 2012, which was a result of increased miscellaneous income.
Income tax benefit from continuing operations
For the three months ended March 31, 2013, income tax benefit from continuing operations decreased $2.4 million, or 55.8%, to $1.9 million from $4.3 million for the three months ended March 31, 2012, driven primarily by a reduction in our loss from continuing operations before income taxes. Our effective tax rate for the three months ended March 31, 2013 was 30.8% compared to 33.5% for the three months ended March 31, 2012. The decrease in the effective tax rate is primarily due to the domestic manufacturing deduction tax benefit which was not available in the prior year due to the Company’s tax operating loss position.
2012 compared to 2011
Net sales
For the year ended December 31, 2012, net sales increased $182.4 million, or 24.0%, to $942.4 million from $760.0 million during the year ended December 31, 2011, driven primarily by increases in housing starts in the markets we serve, as well as inflation in commodity products. According to the U.S. Census Bureau, single-family housing starts, which were the primary driver for approximately 75% of our 2012 net sales, increased 24.3% for the year, compared with 2011. We estimate our sales volume increased approximately 19.5%, while commodity price inflation resulted in an additional 4.5% increase in net sales during 2012 compared to 2011. Increases in net sales from our locations in Texas, Utah, Georgia and North Carolina represented approximately 75% of the total increase in net sales for 2012 compared to 2011.
The following table shows net sales classified by major product category.
| 2011 | 2012 | |||||||||||||||||||
| (dollars in thousands) | Sales | % of Sales | Sales | % of Sales | % Change | |||||||||||||||
| Structural components |
$ | 87,542 | 11.5 | % | $ | 106,745 | 11.3 | % | 21.9 | % | ||||||||||
| Millwork & other interior products |
143,128 | 18.8 | 178,449 | 18.9 | 24.7 | |||||||||||||||
| Lumber & lumber sheet goods |
247,299 | 32.6 | 333,952 | 35.5 | 35.0 | |||||||||||||||
| Windows & other exterior products |
178,361 | 23.5 | 202,532 | 21.5 | 13.6 | |||||||||||||||
| Other building products & services |
103,652 | 13.6 | 120,720 | 12.8 | 16.5 | |||||||||||||||
|
|
|
|
|
|
|
|
|
|
|
|||||||||||
| Total net sales |
$ | 759,982 | 100.0 | % | $ | 942,398 | 100.0 | % | 24.0 | % | ||||||||||
|
|
|
|
|
|
|
|
|
|
|
|||||||||||
Increased sales volume was achieved across all product categories. Average selling prices for lumber & lumber sheet goods were approximately 13.9% higher in 2012, compared to 2011. During 2012, prices rose to a level not seen on a consistent basis since 2005 and 2006. This commodity price inflation has resulted in net sales growth for lumber & lumber sheet goods exceeding that of our other
61
Table of Contents
product categories. Windows & other exterior products, and other building products & services include subcategories, such as roofing, siding and hardware, which are driven more by the repair and remodeling market and therefore experienced slower growth in net sales volumes than other product categories.
Cost of goods sold
For the year ended December 31, 2012, cost of goods sold increased $136.7 million, or 23.1%, to $727.7 million from $591.0 million during the year ended December 31, 2011. We estimate that our cost of sales increased approximately 18.6% as a result of increased sales volumes, while commodity cost inflation resulted in an additional 4.9% increase in cost of goods sold.
Gross profit
For the year ended December 31, 2012, gross profit increased $45.8 million, or 27.1%, to $214.7 million from $169.0 million during the year ended December 31, 2011, driven primarily by increased sales volumes. Our gross margin increased to 22.8% in 2012 from 22.2% in 2011, primarily as a result of spreading fixed costs over a larger sales base and operational improvements.
Operating expenses
For the year ended December 31, 2012, selling, general and administrative expenses increased $8.2 million, or 3.8%, to $221.2 million from $213.0 million during the year ended December 31, 2011. This was driven primarily by variable costs to serve higher sales volumes, such as sales commissions, shipping and handling costs and other variable compensation, which increased by $7.3 million in the aggregate in 2012 as compared to the prior year.
For the year ended December 31, 2012, depreciation expense decreased $4.1 million, or 34.5%, to $7.8 million from $11.8 million during the year ended December 31, 2011, driven primarily by a reduction in the size of our distribution fleet and the full depreciation of certain fixed assets.
For the year ended December 31, 2012, amortization expense of $1.5 million was unchanged from $1.5 million during the year ended December 31, 2011, and represented the amortization of intangible assets arising from the acquisitions of certain businesses in prior years.
For the year ended December 31, 2012, impairment of assets held for sale of $0.4 million decreased from $0.6 million during the year ended December 31, 2011, driven primarily by a reduction in the number of assets identified as excess or underutilized and offered for sale.
For the year ended December 31, 2012, restructuring expense of $2.9 million increased from $1.3 million during the year ended December 31, 2011. This increase resulted primarily from management’s determination that subleasing closed properties could no longer be reasonably assumed, which resulted in a revised estimate of our restructuring reserves.
Other income (expenses)
Interest expense. For the year ended December 31, 2012, interest expense increased $1.2 million, or 42.0%, to $4.0 million from $2.8 million during the year ended December 31, 2011, driven primarily by increased average daily borrowings under our revolving line of credit. The increase in average daily borrowings was primarily the result of cash used by operations of $7.0 million and $12.2 million in 2011 and 2012, respectively, the redemption of Class A preferred shares and Class A common shares for $25.0 million in 2011, and the redemption of Class B preferred shares and
62
Table of Contents
payment of dividends totaling $23.0 million in 2012. These uses, partially offset by cash provided from other activities, increased the balance on the Revolver by $20.9 million in 2011 and $38.4 million in 2012.
Other income (expense), net. For the year ended December 31, 2012, other income, net was $0.3 million, compared to other expense, net of $2.1 million during the year ended December 31, 2011. This change was driven primarily by a reduction in expense associated with the write-off of a tax indemnification asset.
Income tax benefit from continuing operations
For the year ended December 31, 2012, income tax benefit from continuing operations decreased $14.2 million, or 63.7%, to $8.1 million from $22.3 million during the year ended December 31, 2011, driven primarily by a reduction in our loss from continuing operations before income taxes. Our effective tax rate for 2012 was 35.7% compared to 34.8% for 2011.
2011 compared to 2010
Net sales
For the year ended December 31, 2011, net sales increased $8.3 million, or 1.1%, to $760.0 million from $751.7 million during the year ended December 31, 2010. According to the U.S. Census Bureau, single-family housing starts, which were the primary driver for approximately 71% of our 2011 net sales, decreased 8.6% for the year, compared with 2010. We estimate our sales volume increased approximately 3.0%, including approximately $43.2 million in net sales from 2010 acquisitions, while commodity price deflation resulted in a 1.9% decrease in net sales during 2011 compared to 2010.
The following table shows net sales classified by major product category.
| 2010 | 2011 | |||||||||||||||||||
| (dollars in thousands) | Sales | % of sales | Sales | % of sales | % change | |||||||||||||||
| Structural components |
$ | 89,885 | 12.0 | % | $ | 87,542 | 11.5 | % | (2.6 | )% | ||||||||||
| Millwork & other interior products |
137,315 | 18.3 | 143,128 | 18.8 | 4.2 | |||||||||||||||
| Lumber & lumber sheet goods |
237,003 | 31.5 | 247,299 | 32.6 | 4.3 | |||||||||||||||
| Windows & other exterior products |
184,007 | 24.4 | 178,361 | 23.5 | (3.1 | ) | ||||||||||||||
| Other building products & services |
103,496 | 13.8 | 103,652 | 13.6 | 0.2 | |||||||||||||||
|
|
|
|
|
|
|
|
|
|
|
|||||||||||
| Total net sales |
$ | 751,706 | 100.0 | % | $ | 759,982 | 100.0 | % | 1.1 | % | ||||||||||
|
|
|
|
|
|
|
|
|
|
|
|||||||||||
Sales volumes for millwork & other interior products, lumber & lumber sheet goods and other building products & services increased primarily as a result of incremental net sales from 2010 acquisitions. Sales for structural components and windows & other exterior products declined primarily as a result of the decline in single-family housing starts from 2010 to 2011.
Cost of goods sold
For the year ended December 31, 2011, cost of goods sold increased $3.3 million, or 0.6%, to $591.0 million from $587.7 million during the year ended December 31, 2010, driven primarily by increased sales volumes.
Gross profit
For the year ended December 31, 2011, gross profit increased $5.0 million, or 3.0%, to $169.0 million from $164.0 million during the year ended December 31, 2010, driven primarily by increased sales volumes and a reduction in depreciation expense within our cost of goods sold. Our gross margin
63
Table of Contents
increased to 22.2% in 2011 from 21.8% in 2010, primarily due to a decrease in depreciation expense within cost of goods sold of $2.9 million, resulting from the full depreciation of certain fixed assets and a reduction in the number of manufacturing operations during 2010.
Operating expenses
For the year ended December 31, 2011, selling, general and administrative expenses decreased $33.3 million, or 13.5%, to $213.0 million from $246.3 million during the year ended December 31, 2010, driven primarily by the benefits from restructuring and other cost reduction initiatives undertaken in 2010 and 2011.
For the year ended December 31, 2011, depreciation expense decreased $17.5 million, or 59.6%, to $11.8 million from $29.3 million during the year ended December 31, 2010, driven primarily by the full depreciation of certain fixed assets and to a lesser extent, the reduction in the size of our distribution fleet.
For the year ended December 31, 2011, amortization expense increased $0.3 million, or 27.8%, to $1.5 million from $1.1 million during the year ended December 31, 2010, driven primarily by the full year impact of the amortization of intangible assets arising from the acquisitions of NHC and Bison in 2010.
For the year ended December 31, 2011, impairment of assets held for sale of $0.6 million decreased from $2.9 million during the year ended December 31, 2010, driven primarily by a reduction in the number of new assets identified as excess or underutilized and offered for sale.
For the year ended December 31, 2011, restructuring expense of $1.3 million decreased from $7.1 million during the year ended December 31, 2010. This decrease resulted primarily from a reduction in the number of store closures and workforce reductions that give rise to restructuring expense.
Other income (expenses)
Interest expense. For the year ended December 31, 2011, interest expense increased $1.3 million, or 80.4%, to $2.8 million from $1.6 million during the year ended December 31, 2010, driven primarily by increased average daily borrowings under our revolving line of credit. The increase in average daily borrowings was primarily the result of cash used by operations of $58.0 million and $7.0 million in 2010 and 2011, respectively, the redemption of Class B preferred shares and payment of dividends totaling $32.3 million in 2010, and the redemption of Class A preferred shares and Class A common shares for $25.0 million in 2011. These uses, partially offset by cash provided by other activities, reduced cash and cash equivalents by $70.3 million in 2010, and increased the balance on the Revolver by $13.0 million in 2010 and $20.9 million in 2011.
Other income (expense), net. For the year ended December 31, 2011, other expense, net increased $2.0 million, to $2.1 million from $0.1 million during the year ended December 31, 2010. This was driven primarily by a decrease in other income associated with legal settlement proceeds received in 2010, and partially offset by a decrease in other expense associated with the write-off of a tax indemnification asset.
Income tax benefit from continuing operations
For the year ended December 31, 2011, income tax benefit decreased $25.1 million, or 52.9%, to $22.3 million from $47.5 million during the year ended December 31, 2010, driven primarily by a
64
Table of Contents
reduction in our losses from continuing operations before income taxes. Our effective tax rate for 2011 was 34.8% compared to 41.9% for 2010. The decrease in our effective tax rate was primarily due to an increase in our valuation allowance and certain nondeductible (permanent) items in 2011 as compared to 2010.
Liquidity and capital resources
Our primary capital requirements are to fund working capital needs and operating expenses, meet required interest and principal payments, and fund capital expenditures. Since 2010, our capital resources have primarily consisted of cash and cash equivalents and borrowings under our Revolver.
The homebuilding industry, and therefore our business, experienced a significant downturn that started in 2006. However, activity improved as 2012 saw the first meaningful increase in housing starts since the downturn began. We are expecting increased stability and continued improvement in the housing industry in 2013. Beyond 2013, it is difficult for us to predict what will happen as our industry is dependent on a number of factors, including national economic conditions, employment levels, the availability of credit for homebuilders and potential home buyers, the level of foreclosures, existing home inventory, and interest rates. Due to the effects of the significant housing industry downturn, our operations incurred operating losses and used cash for operations for the years ended December 31, 2010, 2011 and 2012 and the three months ended March 31, 2012 and 2013. We are not expecting our cash flows from operations to be positive in 2013 due primarily to increased working capital requirements related to increasing revenues.
Our liquidity at March 31, 2013 was $42.2 million, which includes $5.8 million in cash and cash equivalents and $36.4 million of unused borrowing capacity under our Revolver.
We believe that our cash flows from operations, combined with our current cash levels, the proceeds from this offering and available borrowing capacity, will be adequate to fund debt service requirements and provide cash, as required, to support our ongoing operations, capital expenditures, lease obligations and working capital for at least the next 12 months.
Historical cash flow information
Working capital
Working capital (current assets excluding cash and cash equivalents and restricted assets minus current liabilities excluding our Revolver) was $97.9 million, $68.6 million and $81.3 million as of December 31, 2010, 2011 and 2012, respectively, and $96.5 million as of March 31, 2013, as summarized in the following table.
| As of December 31, | March 31, 2013 |
|||||||||||||||
| 2010 | 2011 | 2012 | ||||||||||||||
| (dollars in thousands) | (as restated) | (as restated) | ||||||||||||||
| Working capital: |
||||||||||||||||
| Accounts receivable, net |
$ | 66,283 | $ | 65,206 | $ | 90,297 | $ | 104,611 | ||||||||
| Inventories, net |
64,275 | 49,682 | 73,918 | 95,560 | ||||||||||||
| Income taxes receivable (payable) |
18,091 | 9,171 | (2,939 | ) | (3,223 | ) | ||||||||||
| Accounts payable |
(46,181 | ) | (45,019 | ) | (74,231 | ) | (88,757 | ) | ||||||||
| Other current assets (liabilities), net |
(4,585 | ) | (10,399 | ) | (5,740 | ) | (11,534 | ) | ||||||||
|
|
|
|
|
|
|
|
|
|||||||||
| Total |
$ | 97,883 | $ | 68,641 | $ | 81,305 | $ | 96,657 | ||||||||
|
|
|
|
|
|
|
|
|
|||||||||
65
Table of Contents
Accounts receivable, net, declined $1.1 million from December 31, 2010 to December 31, 2011 and increased $25.1 million from December 31, 2011 to December 31, 2012, primarily as a result of changes in net sales. The increase in accounts receivable, net, of $14.3 million from December 31, 2012 to March 31, 2013 is primarily a result of higher net sales and seasonal increases that are typical following the winter months. Days sales outstanding at December 31, 2010, 2011 and 2012 and March 31, 2013 (measured against net sales in the current fiscal quarter of each period) were approximately 36, 33, 33 and 38 days, respectively.
Inventories, net, declined $14.6 million from December 31, 2010 to December 31, 2011 due to a reduction in the number of days of inventory on hand and an approximately 3% decline in the Random Lengths composite lumber index in the fourth quarter of 2011 compared to the fourth quarter of 2010. Inventories, net, increased $24.2 million from December 31, 2011 to December 31, 2012 due to increases in net sales and an approximately 33% and 44% increase in the Random Lengths composite lumber and structural panel indices, respectively, in the fourth quarter of 2012 compared to the fourth quarter of 2011. Inventories, net, increased $21.7 million from December 31, 2012 to March 31, 2013 due to increases in net sales and an approximately 19% and 17% increase in the Random Lengths composite lumber and structural panel indices, respectively, in the first quarter of 2013 compared to the fourth quarter of 2012. In response to rising commodity costs, during the fourth quarter of 2012 and the first quarter of 2013, we purchased additional commodity inventory in excess of immediate needs in order to maintain a lower inventory cost basis. Inventory days on hand at December 31, 2010, 2011 and 2012 and March 31, 2013 (measured against cost of goods sold in the current fiscal quarter of each period) were approximately 43, 32, 35 and 44 days, respectively.
Income taxes receivable declined $8.9 million from December 31, 2010 to December 31, 2011 due to the collection of tax refunds related to net operating loss carrybacks totaling $24.8 million in 2011 and a reduction in the taxable losses generated by us in the tax year ended March 31, 2012 as compared to the tax year ended March 31, 2011. The change from income taxes receivable of $9.2 million at December 31, 2011 to income taxes payable of $2.9 million at December 31, 2012 primarily resulted from the collection of tax refunds totaling $16.4 million in 2012 and a $2.9 million liability as of December 31, 2012 for taxes, interest and penalties related to certain IRS audits. Income taxes payable increased $0.3 million from December 31, 2012 to March 31, 2013 due to increased liabilities related to certain IRS audits. See note (15) to our audited financial statements included elsewhere in this prospectus.
Accounts payable declined $1.2 million from December 31, 2010 to December 31, 2011, increased $29.2 million from December 31, 2011 to December 31, 2012, and increased $14.5 million from December 31, 2012 to March 31, 2013, in each case, primarily as a result of changes in the volume of inventory purchases leading up to each balance sheet date.
Other current assets (liabilities), net, increased $5.8 million from December 31, 2010 to December 31, 2011 and declined $4.7 million from December 31, 2011 to December 31, 2012 primarily as a result of a $5.0 million reserve for future share issuance to Gores Holdings at December 31, 2011. On January 26, 2012, the Company issued Gores Holdings 5,000 Class C convertible preferred shares to satisfy this liability. See notes (11), (14) and (17) to our audited financial statements included elsewhere in this prospectus. Other current assets (liabilities), net, increased $5.8 million from December 31, 2012 to March 31, 2013 primarily due to an increase in accrued expenses due to seasonality.
66
Table of Contents
Cash flows from operating activities
Net cash used by operating activities was $58.0 million during 2010, $7.0 million during 2011, $12.2 million during 2012, and $10.9 million and $17.6 million for the three months ended March 31, 2012 and 2013, respectively, as summarized in the following table.
| Year ended December 31, | Three months ended March 31, |
|||||||||||||||||||
| 2010 | 2011 | 2012 | 2012 | 2013 | ||||||||||||||||
| (dollars in thousands) | (as restated) | (as restated) | (as restated) | |||||||||||||||||
| Operating cash flows: |
||||||||||||||||||||
| Net loss |
$ | (69,994 | ) | $ | (42,133 | ) | $ | (14,533 | ) | $ | (8,566 | ) | $ | (4,057 | ) | |||||
| Non-cash expenses |
47,691 | 21,014 | 16,790 | 4,265 | 3,759 | |||||||||||||||
| (Gain) loss on bargain purchase and sale of assets and operations |
(12,351 | ) | (2,609 | ) | 169 | (249 | ) | 2 | ||||||||||||
| Change in deferred income taxes |
(25,046 | ) | (5,926 | ) | (3,633 | ) | 158 | (1,874 | ) | |||||||||||
| Change in working capital and other |
1,701 | 22,653 | (11,036 | ) | (6,508 | ) | (15,471 | ) | ||||||||||||
|
|
|
|
|
|
|
|
|
|
|
|||||||||||
| Total |
$ | (57,999 | ) | $ | (7,001 | ) | $ | (12,243 | ) | $ | (10,900 | ) | $ | (17,641 | ) | |||||
|
|
|
|
|
|
|
|
|
|
|
|||||||||||
Net cash used by operating activities increased by $6.7 million for the three months ended March 31, 2013 as compared to the three months ended March 31, 2012 primarily due to the following:
| Ÿ | Net loss declined by $4.5 million as discussed in “Operating Results” above. |
| Ÿ | Non-cash expenses declined by $0.5 million due primarily to a reduction in depreciation expense of $0.3 million, which was driven by a reduction in the size of our distribution fleet and the full depreciation of certain fixed assets. |
| Ÿ | Gain on sale of assets declined from $0.2 million for the three months ended March 31, 2012, which resulted from disposals of excess equipment and vehicles, to $0.0 million for the three months ended March 31, 2013. |
| Ÿ | Change in deferred income taxes declined by $2.0 million due to a reduction in the timing differences between our losses before income taxes under GAAP and our taxable income. The reduction in timing differences primarily resulted from the decrease in depreciation expense for the three months ended March 31, 2013 compared to the three months ended March 31, 2012. |
| Ÿ | Changes in working capital and other declined by $9.0 million due primarily to the increase in working capital discussed above. |
Net cash used by operating activities increased by $5.2 million in 2012 as compared to 2011 primarily due to the following:
| Ÿ | Net loss declined by $27.6 million as discussed in “Operating Results” above. |
| Ÿ | Non-cash expenses declined by $4.2 million due primarily to a reduction in depreciation expense of $5.0 million primarily resulting from the full depreciation of certain fixed assets. |
| Ÿ | Loss on sales of assets of $0.2 million in 2012 declined from a gain of $2.6 million in 2011 as a result of fewer disposals of excess equipment and vehicles. |
| Ÿ | Change in deferred income taxes declined by $2.3 million due to a reduction in the timing differences between our losses before income taxes under GAAP and our taxable income. The reduction in timing differences primarily resulted from the decrease in depreciation expense from 2011 to 2012. |
| Ÿ | Changes in working capital and other decreased by $33.7 million due primarily to the increase in working capital during 2012 discussed above. |
67
Table of Contents
Net cash used by operating activities declined by $51.0 million in 2011 as compared to 2010 primarily due to the following:
| Ÿ | Net loss declined by $27.9 million as discussed in “Operating results” above. |
| Ÿ | Non-cash expenses declined by $26.7 million due to a reduction in depreciation expense of $23.6 million resulting from the full depreciation of certain fixed assets and a reduction in the impairment of assets held for sale of $3.0 million, which occurred primarily in 2010 due to declines in the value of certain real estate held for sale and the discontinuation of certain operations. |
| Ÿ | Gain on bargain purchase of $11.2 million and gain on sale of operations of $3.1 million occurred in 2010 resulting from the purchase of NHC and the sale of certain operations. See notes (4) and (5) to our audited financial statements included elsewhere in this prospectus. Gain on the sale of assets of $2.6 million in 2011 primarily resulted from the sale of excess equipment and delivery vehicles. |
| Ÿ | Change in deferred income taxes declined by $19.1 million due to a reduction in the timing differences between our losses before income taxes under GAAP and our taxable income. The reduction in timing differences primarily resulted from the decrease in depreciation expense as well as the sale of certain operations in 2010. |
| Ÿ | Changes in working capital and other increased by $21.0 million due primarily to the decrease in working capital during 2011 discussed above. |
Cash flows from investing activities
Net cash provided by (used in) investing activities was $8.1 million during 2010, $7.3 million during 2011, ($4.9) million during 2012, and $1.2 million and $1.5 million for the three months ended March 31, 2012 and 2013, respectively, as summarized in the following table.
| Year ended December 31, | Three months ended March 31, |
|||||||||||||||||||
| 2010 | 2011 | 2012 | 2012 | 2013 | ||||||||||||||||
| (as restated) | (as restated) | (as restated) | ||||||||||||||||||
| (dollars in thousands) | ||||||||||||||||||||
| Investing cash flows: |
||||||||||||||||||||
| Purchases of property and equipment |
$ | (2,506 | ) | $ | (1,339 | ) | $ | (2,741 | ) | $ | (705 | ) | $ | (374 | ) | |||||
| Purchases of businesses |
(49,848 | ) | — | (6,582 | ) | — | — | |||||||||||||
| Proceeds from real estate, property and equipment |
23,513 | 6,106 | 1,393 | 483 | 7 | |||||||||||||||
| Proceeds from sale of operations |
46,831 | — | — | — | — | |||||||||||||||
| Change in restricted assets |
(9,897 | ) | 2,555 | 3,069 | 1,387 | 1,833 | ||||||||||||||
|
|
|
|
|
|
|
|
|
|
|
|||||||||||
| Total |
$ | 8,093 | $ | 7,322 | $ | (4,861 | ) | $ | 1,165 | $ | 1,466 | |||||||||
|
|
|
|
|
|
|
|
|
|
|
|||||||||||
Cash used for the purchase of property and equipment in 2010, 2011 and 2012 and the three months ended March 31, 2013 and 2012 primarily resulted from the replacement of certain aged vehicles and equipment in order to minimize maintenance costs and asset down time.
Cash used for the purchase of businesses resulted from the acquisitions of Bison and NHC in 2010 and TBSG in 2012, and also included an advance of $0.9 million to the sellers of TBSG against future earnout payments. See note (4) of our audited financial statements included elsewhere in this prospectus.
68
Table of Contents
Cash provided by the sale of real estate, property and equipment declined by $17.4 million from 2010 to 2011 and declined by $4.7 million from 2011 to 2012. The proceeds generated in 2010 primarily resulted from the sale of excess or underutilized assets arising from our restructuring and business optimization activities. In 2011 and 2012, as restructuring activities declined and sales volumes increased, fewer excess or underutilized assets were identified for disposal.
Cash provided by the sale of operations resulted from the disposal of CDH and US. See note (5) of our audited financial statements included elsewhere in this prospectus.
Cash used by restricted assets in 2010 resulted primarily from cash deposits to pre-fund expected losses for self-insured casualty and health claims, deposits for surety bonds, and proceeds from the sale of operations which were held in escrow. Cash provided by restricted assets in 2011 and 2012 and the three months ended March 31, 2013 and 2012 resulted from the use of those deposits to pay claims and the release of excess deposits and escrow funds to the Company. See note (3) of our audited financial statements included elsewhere in this prospectus.
Cash flows from financing activities
Net cash provided by (used in) financing activities was ($20.4) million during 2010, $0.1 million during 2011, $14.8 million during 2012, and $10.0 million and $19.2 million for the three months ended March 31, 2012 and 2013, respectively, as summarized in the following table.
| Year ended December 31, | Three months ended March 31, |
|||||||||||||||||||
| 2010 | 2011 | 2012 | 2012 | 2013 | ||||||||||||||||
| (as restated) | (as restated) | (as restated) | ||||||||||||||||||
| (dollars in thousands) | ||||||||||||||||||||
| Financing cash flows: |
||||||||||||||||||||
| Proceeds from Revolver, net of repayments |
$ | 13,000 | $ | 20,850 | $ | 38,368 | $ | 10,118 | $ | 20,266 | ||||||||||
| Redemption of Class A junior preferred and Class A common stock |
— | (25,000 | ) | — | — | — | ||||||||||||||
| Dividends paid and redemption of Class B senior preferred stock |
(32,300 | ) | — | (23,000 | ) | — | — | |||||||||||||
| Cash received for Class C convertible preferred stock |
— | 5,000 | — | — | — | |||||||||||||||
| Payments on capital leases and other |
(1,115 | ) | (712 | ) | (530 | ) | (79 | ) | (1,027 | ) | ||||||||||
|
|
|
|
|
|
|
|
|
|
|
|||||||||||
| Total |
$ | (20,415 | ) | $ | 138 | $ | 14,838 | $ | 10,039 | $ | 19,239 | |||||||||
|
|
|
|
|
|
|
|
|
|
|
|||||||||||
Proceeds from the Revolver were primarily used to fund cash used by operating activities in 2010, 2011 and 2012 and the three months ended March 31, 2013 and 2012 cash used by investing activities in 2012 and other uses of cash from financing activities.
In 2011, we redeemed the Class A junior preferred and Class A common shares owned by Wolseley for $25.0 million. See note (1) of our audited financial statements included elsewhere in this prospectus.
In 2010 and 2012, the Company paid accrued dividends of $6.1 million and $10.6 million, respectively, and redeemed 26,240 and 12,372 shares of Class B senior preferred stock for $26.2 million and $12.4 million, respectively.
69
Table of Contents
In 2011, the Company received $5.0 million from Gores Holdings, which was included in current liabilities at December 31, 2011 and in January 2012 issued 5,000 shares of Class C convertible preferred stock to settle this liability.
Payments on capital leases and other relate primarily to principal payments due under capital leases.
Capital expenditures
Capital expenditures vary depending on prevailing business factors, including current and anticipated market conditions. Historically, capital expenditures have for the most part remained at relatively low levels in comparison to the operating cash flows generated during the corresponding periods. We expect our 2013 capital expenditures to be approximately $10.0 to $20.0 million (including the incurrence of capital lease obligations) primarily related to rolling stock and equipment, including lease buyouts, and facility improvements to support our operations.
Revolving credit facility
On June 30, 2009, we entered into the Credit Agreement with WFCF which includes the Revolver. The Credit Agreement was amended during 2010, 2011, 2012 and 2013. The most recent amendment, which was entered into on June 13, 2013, (i) reduced the Base Rate Margin from a range of 1.25% to 1.75% to a range of 0.50% to 1.00%, (ii) reduced the Libor Rate Margin from a range of 2.25% to 2.75% to a range of 1.50% to 2.00%, (iii) amended the borrowing base calculation of the Revolver, (iv) revised the applicability of the Fixed Charge Coverage Ratio so that it only applies when the sum of availability under the Revolver plus Qualified Cash falls below $15 million at any time, and remains in effect until the sum of availability under the Revolver plus Qualified Cash exceeds $15 million for 30 consecutive days and (v) extended the maturity date from December 11, 2015 to December 31, 2016. The discussion below presents the terms of the Revolver as currently in effect.
The Revolver has a maximum availability of $150.0 million, subject to an asset borrowing formula based on eligible accounts receivable, credit card receivables and inventory. The Company was in compliance with all debt covenants for the three months ended March 31, 2013.
Borrowings under the Revolver bear interest, at our option, at either the Base Rate (which means the higher of (i) the Federal Funds Rate plus 0.5% or (ii) the prime rate) plus a Base Rate Margin (which ranges from 0.50% to 1.00% based on Revolver availability) or LIBOR plus a LIBOR Rate Margin (which ranges from 1.50% to 2.00% based on Revolver availability).
The Credit Agreement provides that we can use the Revolver availability to issue letters of credit. The fees on any outstanding letters of credit issued under the Revolver include a participation fee equal to the LIBOR Rate Margin. The fee on the unused portion of the Revolver is 0.375% if the average daily usage is $75 million or below and 0.25% if the average daily usage is above $75 million. The Credit Agreement contains customary nonfinancial covenants, including restrictions on new indebtedness, issuance of liens, investments, distributions to equityholders, asset sales and affiliate transactions. The Credit Agreement also includes financial covenants that require us to maintain a minimum Fixed Charge Coverage Ratio of 1.0x, as defined in the Credit Agreement. However, the covenants are only applicable if the sum of availability under the Revolver plus Qualified Cash falls below $15 million at any time, and remains in effect until the sum of availability under the Revolver plus Qualified Cash exceeds $15 million for 30 consecutive days. Additionally, until the earlier of August 31, 2013 or the consummation of a qualified initial public offering, up to $15 million of suppressed availability (which means, as of any date of determination, the difference between the amount of the borrowing base as of such date and the Revolver usage as of such date) will be included in availability
70
Table of Contents
for purposes of determining the applicability of financial covenant testing. While there can be no assurances, based upon the Company’s forecast, the Company does not expect the covenant to become applicable during the year ended December 31, 2013. However, while we would currently satisfy this covenant if it were applicable, should this not be the case, we would evaluate our liquidity options including, amending the Credit Agreement, seeking alternative financing arrangements of debt and/or equity, and/or sale of assets. No assurances can be given that such alternative financing would be available, or if available, under terms similar to our existing Credit Agreement or that we would be able to sell assets on a timely basis.
We had outstanding borrowings of $92.5 million with net availability of $36.4 million as of March 31, 2013. The interest rate on outstanding borrowings was 2.8% as of March 31, 2013. We had $7.6 million in letters of credit outstanding under the Credit Agreement as of March 31, 2013. The Revolver is collateralized by substantially all of our assets.
Contractual obligations and commercial commitments
In the table below, we set forth our enforceable and legally binding obligations as of December 31, 2012. Some of the amounts included in the table are based on management’s estimates and assumptions about these obligations, including their duration, the possibility of renewal, anticipated actions by third parties and other factors. Because these estimates and assumptions are necessarily subjective, our actual payments may vary from those reflected in the table. Purchase orders made in the ordinary course of business and commitments that are cancellable on 30 days’ notice are excluded from the table below. Any amounts for which we are liable under purchase orders are reflected on the consolidated balance sheets as accounts payable and accrued liabilities.
| Payments due by period | ||||||||||||||||||||
| Contractual obligations |
Total | 2013 | 2014-2015 | 2016-2017 | Thereafter | |||||||||||||||
| (in millions) | ||||||||||||||||||||
| Revolver obligations(1) |
$ | 72.6 | $ | 0.4 | $ | 72.2 | $ | — | $ | — | ||||||||||
| Capital lease obligations(2) |
9.1 | 1.7 | 2.0 | 1.4 | 4.0 | |||||||||||||||
| Operating lease obligations(3) |
77.7 | 18.9 | 29.1 | 17.3 | 12.4 | |||||||||||||||
| Purchase commitments(4) |
1.3 | 0.2 | 0.5 | 0.4 | 0.2 | |||||||||||||||
| Earn-out obligations(5) |
0.2 | — | 0.2 | — | — | |||||||||||||||
|
|
|
|
|
|
|
|
|
|
|
|||||||||||
| Total |
$ | 160.9 | $ | 21.2 | $ | 104.0 | $ | 19.1 | $ | 16.6 | ||||||||||
|
|
|
|
|
|
|
|
|
|
|
|||||||||||
| (1) | Represents principal of $72.2 million and interest payments outstanding on our Revolver of $0.4 million on December 31, 2012, based on interest rates in effect on December 31, 2012, which ranged from 3.1% to 5.0%. To the extent that a decrease in eligible accounts receivable and inventory reduces the maximum availability under the Revolver below the amount then outstanding, amounts outstanding could become due sooner than reflected in the table. On June 13, 2013, we entered into Amendment Nine to the credit agreement governing the Revolver, which extended the maturity of the Revolver to December 31, 2016. See “—Liquidity and capital resources—Revolving credit facility.” |
| (2) | Consists of payments under our capital leases for fleet vehicles and various equipment. For further information refer to note (16) to our audited financial statements included elsewhere in this prospectus. |
| (3) | Represents payments under our operating leases, primarily for buildings, improvements, and equipment. For further information refer to note (16) to our audited financial statements included elsewhere in this prospectus. |
| (4) | Consists of obligations to purchase vehicles and office equipment under capital leases, which are enforceable and legally binding on us. Excludes purchase orders made in the ordinary course of business that are short-term or cancellable. |
71
Table of Contents
| (5) | Under the asset purchase agreement to acquire the assets of TBSG, we agreed to pay the sellers a cash earn-out based on the performance of the business acquired. As of December 31, 2012, the Company estimated the undiscounted value of the earn-out to be $1.1 million, which has been reduced by $0.9 million that the Company advanced to the sellers against future earn-out payments. For further information refer to note (4) to our audited financial statements for the year ended December 31, 2012 included elsewhere in this prospectus. |
Off-balance sheet arrangements
At March 31, 2013 and December 31, 2012 and 2011, other than operating leases described above and letters of credit issued under the Credit Agreement, we had no material off-balance sheet arrangements with unconsolidated entities.
Seasonal and inflationary influences
We are exposed to fluctuations in quarterly sales volumes and expenses due to seasonal factors. These seasonal factors are common in the building products industry. Seasonal changes in levels of building activity affect our building products businesses, which are dependent on housing starts, repair and remodel activities and light commercial construction activities. We typically report lower sales in the first and fourth quarters due to the impact of poor weather on the construction market and we generally have higher sales in the second and third quarters, reflecting an increase in construction due to more favorable weather conditions. We typically have higher working capital in the second and third quarters due to the summer building season. Seasonally cold weather increases costs, especially energy consumption, at most of our manufacturing facilities.
Quantitative and qualitative disclosures about market risk
In the normal course of business, we are exposed to financial risks such as changes in interest rates and commodity price risk.
Interest rate risk
When we have loan amounts outstanding on our Revolver, we are exposed to interest rate risk arising from fluctuations in interest rates. During 2010, 2011, 2012 and the three months ended March 31, 2013 we did not use any interest rate swap contracts to manage this risk. A 1% increase in interest rates on our variable-rate debt would increase our annual forecasted interest expense by approximately $0.9 million (based on our borrowings as of March 31, 2013).
Commodity price risk
Many of the products we purchase and resell are commodities whose price is determined by the market’s supply and demand for such products. Price fluctuations in our selling prices and key costs have a significant effect on our financial performance. The markets for most of these commodities are cyclical and are affected by factors such as global economic conditions, including the strength of the U.S. housing market, changes in, or disruptions to, industry production capacity, changes in inventory levels and other factors beyond our control. During 2010, 2011, 2012 and the three months ended March 31, 2013, we did not manage commodity price risk with derivative instruments, except for certain immaterial lumber futures contracts that we entered into during 2011, 2012 and the three months ended March 31, 2013.
72
Table of Contents
Critical accounting policies and pronouncements
Our discussion and analysis of operating results and financial condition are based upon our audited financial statements. The preparation of our financial statements in accordance with GAAP requires us to make estimates and assumptions that affect the reported amounts of assets, liabilities, revenues, expenses and related disclosures of contingent assets and liabilities. We base our estimates on past experience and other assumptions that we believe are reasonable under the circumstances, and we evaluate these estimates on an ongoing basis. Our critical accounting policies are those that materially affect our financial statements and involve difficult, subjective or complex judgments by management. Although these estimates are based on management’s best knowledge of current events and actions that may impact us in the future, actual results may be materially different from the estimates.
We believe the following critical accounting policies are affected by significant judgments and estimates used in the preparation of our consolidated financial statements and that the judgments and estimates are reasonable.
Revenue recognition
We recognize revenue when products are shipped and the customer takes ownership and assumes risk of loss, collection of the relevant receivable is reasonably assured, persuasive evidence of an arrangement exists and the sales price is fixed or determinable. All sales recognized are net of allowances for discounts and estimated returns, based on historical experience.
We generally recognize revenues from construction contracts on the completed contract basis, as these contracts generally are completed within 30 days. Revenues from certain construction contracts, which are generally greater than 30 days, are recognized on the percentage-of-completion method, measured by the percentage of costs incurred to date to estimated costs for each contract. During 2010, 2011, and 2012, and the three months ended March 31, 2012 and 2013, we recognized 2.7%, 0.8%, 1.7%, 1.3% and 1.9%, respectively, of our net sales using the percentage-of-completion method. Costs of goods sold related to construction contracts include all direct material, subcontractor and labor costs and those indirect costs related to contract performance, such as indirect labor, supplies, tools and repairs. General and administrative costs are charged to expense as incurred. We record provisions for estimated losses on uncompleted contracts in the period in which such losses are determined, which are generally completed within 30 days.
The Company has accounted for revenue and costs for construction contracts, which are generally completed within 30 days, by the completed contract method in 2012 and for the three months ended March 31, 2013, whereas in all prior years all revenue and costs were determined by the percentage-of-completion method. The new method of accounting for construction contracts was determined to be preferable due to the short-term nature of most contracts, and revenues and costs in the aggregate resulting in consistent economics compared to what resulted from the use of the percentage-of-completion method.
The change in accounting method for presentation of construction contracts was completed in accordance with ASC 250, ‘‘Accounting Changes and Error Corrections.’’ Accordingly, the change in accounting principle has been applied retrospectively by adjusting the financial statement amounts for the prior periods presented.
Allowance for doubtful accounts
We maintain an allowance for doubtful accounts for estimated losses due to the failure of our customers to make required payments. Management believes the accounting estimate related to the
73
Table of Contents
allowance for doubtful accounts is a “critical accounting estimate” as it involves complex judgments about our customers’ ability to pay. The allowance for doubtful accounts is based on an assessment of individual past due accounts, historical write-off experience, accounts receivable aging, customer disputes and the business environment. Account balances are charged off when the potential for recovery is considered remote.
Management believes the allowance amounts recorded, in each instance, represents its best estimate of future outcomes. If there is a deterioration of a major customer’s financial condition, if the Company becomes aware of additional information related to the credit-worthiness of a major customer, or if future actual default rates on trade receivables in general differ from those currently anticipated, the Company may have to adjust its allowance for doubtful accounts, which would affect earnings in the period the adjustments were made.
Inventories
Inventories consist primarily of materials purchased for resale, including lumber and sheet goods, millwork, windows and doors as well as certain manufactured products and are carried at the lower of cost or market. The cost of substantially all of our inventories is determined by the average cost method, which approximates the first-in, first-out approach. We evaluate our inventory value at the end of each quarter to ensure that it is carried at the lower of cost or market. This evaluation includes an analysis of historical physical inventory results, a review of potential excess and obsolete inventories based on inventory aging and anticipated future demand. At least quarterly, each branch’s perpetual inventory records are adjusted to reflect any declines in net realizable value below inventory carrying cost. To the extent historical physical inventory results are not indicative of future results and if future events impact, either favorably or unfavorably, the salability of our products or our relationships with certain key suppliers, our inventory reserves could differ significantly, resulting in either higher or lower future inventory provisions.
Valuation of goodwill, long-lived assets and amortizable other intangible assets
Our long-lived assets consist primarily of property, equipment, purchased intangible assets and goodwill. The valuation and the impairment testing of these long-lived assets involve significant judgments and assumptions, particularly as it relates to the identification of reporting units, asset groups and the determination of fair market value.
We test our tangible and intangible long-lived assets subject to amortization for impairment whenever facts and circumstances indicate that the carrying amount of an asset may not be recoverable. We test goodwill for impairment annually, or more frequently if triggering events occur indicating that there may be impairment.
We have recorded goodwill and perform testing for potential goodwill impairment at a reporting unit level. A reporting unit is an operating segment, or a business unit one level below an operating segment for which discrete financial information is available, and for which management regularly reviews the operating results. Additionally, components within an operating segment are aggregated as a single reporting unit if they have similar economic characteristics. We have determined that our reporting units are equivalent to our four operating segments and consist of our East, South and West divisional regions and Coleman Flooring. During the third quarter of 2010, 2011 and 2012, we performed our annual impairment assessment of goodwill which did not indicate that an impairment existed. During each assessment, we determined that the fair value of our reporting unit containing goodwill substantially exceeded its carrying value.
For impairment testing of long-lived assets, we identify asset groups at the lowest level for which identifiable cash flows are largely independent of the cash flows of other groups of assets and
74
Table of Contents
liabilities. Recoverability of assets to be held and used is measured by a comparison of the carrying amount of an asset to estimated undiscounted future cash flows expected to be generated by the assets. If the carrying amount of an asset exceeds its estimated future cash flows, an impairment charge is recognized by the amount by which the carrying amount of the asset exceeds the estimated fair value of the asset.
As discussed above, changes in management intentions, market events or conditions, projected future net sales, operating results, cash flow of our reporting units and other similar circumstances could affect the assumptions used in the impairment tests. Although management currently believes that the estimates used in the evaluation of goodwill and other long-lived assets are reasonable, differences between actual and expected net sales, operating results and cash flow could cause these assets to be impaired. If any asset were determined to be impaired, this could have a material adverse effect on our results of operations and financial position, but not our cash flow from operations.
Discontinued operations
During 2010, we disposed of two businesses as described below and, in 2011 and 2012, we ceased operations in certain geographic markets due to declines in residential home building throughout the United States and for other strategic reasons. We will have no further significant continuing involvement in the sold operations and exited geographic markets. We exited the Little Rock and Fort Smith, Arkansas markets during 2011 and the Conway, Arkansas market in 2012. The cessation of operations in these markets has been treated as discontinued operations as the markets had distinguishable cash flows and operations that have been eliminated from ongoing operations. To determine if cash flows have been (or will be) eliminated from ongoing operations, we evaluate a number of qualitative and quantitative factors, including, but not limited to, proximity of a closing store to any remaining open stores and the potential sales migration from the closed store to any stores remaining open.
On January 11, 2010, we sold our subsidiary, Universal Supply, LLC (“US”), to an external party for proceeds of $20.8 million. US consisted of eight roofing and siding stores in New Jersey, and was sold in order to focus on our core residential LBM business. We recognized a gain on the sale of US of $1.5 million in income (loss) from discontinued operations on the consolidated statements of operations, net of transaction fees of $1.0 million.
On April 30, 2010, we sold our Commercial Door and Hardware operations (“CDH”) to an external party for proceeds of $26.1 million. CDH consisted of twelve locations in six states and was sold in order to focus on our core residential LBM business. We recognized a loss on the sale of CDH of $0.8 million in income (loss) from discontinued operations on the consolidated statements of operations, net of transaction fees of $1.4 million.
Equity based compensation
We account for our nonvested stock awards granted to certain employees by recording compensation expense based on the award’s fair value at the date of grant. We account for our stock options granted to employees and directors by recording compensation expense based on the award’s fair value, estimated on the date of grant using the Black-Scholes option-pricing model. Share-based compensation expense is recognized on a straight-line basis over the requisite service period of the award, which generally equals the vesting period.
75
Table of Contents
Our share-based compensation included in selling, general and administrative expense is as follows:
| Years ended December 31, | Three months ended March 31, |
|||||||||||||||||||
| (dollars in thousands) | 2010 | 2011 | 2012 | 2012 | 2013 | |||||||||||||||
| Nonvested stock |
$ | 228 | $ | 127 | $ | 580 | 54 | 82 | ||||||||||||
| Stock options |
60 | 257 | 383 | 147 | 64 | |||||||||||||||
| Stock purchases |
— | — | 342 | 127 | — | |||||||||||||||
|
|
|
|
|
|
|
|
|
|
|
|||||||||||
| Share-based compensation |
$ | 288 | $ | 384 | $ | 1,305 | $ | 328 | $ | 146 | ||||||||||
|
|
|
|
|
|
|
|
|
|
|
|||||||||||
The following table summarizes the nonvested stock awards and stock options granted from January 1, 2010 through the date of this prospectus and discusses our methodology to determine the fair value of our common stock at each grant date.
| Nonvested stock | Stock options | |||||||||||||||||||||||||||
| Date of grant |
Number of shares outstanding |
Fair value at Issuance |
Number of options granted |
Exercise price |
Fair value at issuance |
Modified exercise price |
Incremental fair value of option at modification |
|||||||||||||||||||||
| June 2010 |
29,219 | $ | 2.60 | 64,930 | $ | 2.60 | $ | 1.83 | $ | 0.97 | $ | 0.53 | ||||||||||||||||
| November 2010 |
— | — | 546,244 | $ | 2.00 | $ | 0.93 | $ | 0.97 | $ | 0.39 | |||||||||||||||||
| November 2011 |
— | — | 64,930 | $ | 1.92 | $ | 0.91 | $ | 0.97 | $ | 0.37 | |||||||||||||||||
| January 2012 |
— | — | 96,747 | $ | 0.97 | $ | 1.23 | — | — | |||||||||||||||||||
|
|
|
|
|
|||||||||||||||||||||||||
| 29,219 | 772,851 | |||||||||||||||||||||||||||
|
|
|
|
|
|||||||||||||||||||||||||
During the year ended December 31, 2012, the exercise price on all stock option agreements with exercise prices in excess of $0.97 was revised to $0.97. These transactions were accounted for as modifications under ASC 718, “Stock Compensation.”
In January 2012, our Board of Directors approved the issuance and sale of 337,636 shares of Class B common stock to certain members of management for $0.97 per share. Based on a valuation of the Class B common stock described further below, these shares were estimated to have a fair value at issuance of $1.98 per share. We recorded approximately $0.3 million in stock compensation expense in 2012 as a result of these sales of stock at a price below fair value.
As of the date hereof, 546,244 options have been exercised and the intrinsic value of all unexercised vested and unvested stock options is $3.6 million, based on an assumed initial public offering price of $17.00 per share, which is the midpoint of the price range set forth on the cover page of this prospectus.
Determining the fair value of stock options under the Black-Scholes option-pricing model requires judgment, including estimating the fair value per share of our common stock as a private company, volatility, expected term of the awards, dividend yield and the risk-free interest rate. The assumptions used in calculating the fair value of stock options represent our best estimates, based on management’s judgment and subjective future expectations. These estimates involve inherent uncertainties. If any of the assumptions used in the model change significantly, share-based compensation recorded for future awards may differ materially from that recorded for awards granted previously.
76
Table of Contents
We developed our assumptions as follows:
| Ÿ | Fair value of common stock. Because our common stock is not publicly traded, we must estimate the fair value of our common stock, as discussed in “Valuation of Common Stock” below. |
| Ÿ | Volatility. The expected price volatility for our common stock was estimated by taking the median historic price volatility for industry peers. |
| Ÿ | Expected term. The expected term was estimated to be the mid-point between the vesting date and the expiration date of the award. We believe use of this approach is appropriate as we have no prior history of option exercises upon which to base an expected term. |
| Ÿ | Risk-free interest rate. The risk free interest rate is based on the yields of United States Treasury securities with maturities similar to the expected term of the options. |
| Ÿ | Dividend yield. We have never declared or paid any cash dividends and do not presently plan to pay cash dividends in the foreseeable future. Consequently, we used an expected dividend yield of zero. |
We estimate potential forfeitures of stock options and adjust share-based compensation expense accordingly. The estimate of forfeitures is adjusted over the requisite service period to the extent that actual forfeitures differ from the prior estimates. We estimate forfeitures based upon our historical experience, and, at each period, review the estimated forfeiture rate and make changes as factors affecting the forfeiture rate calculations and assumptions change.
The fair value of employee stock options was estimated using the following weighted-average assumptions.
| Years ended December 31, | ||||||||||||
| 2010 | 2011 | 2012 | ||||||||||
| Expected dividend yield |
0 | % | 0 | % | 0 | % | ||||||
| Expected volatility factor |
59 | % | 59 | % | 58 | % | ||||||
| Risk-free interest rate |
1.51% - 2.06 | % | 0.96 | % | 0.77% - 0.89 | % | ||||||
| Expected term (in years) |
4.1 - 4.7 | 4.3 | 3.7 - 3.9 | |||||||||
Valuation of common stock
In the absence of a public trading market, our board of directors, with input from management, determined a reasonable estimate of the then-current fair value of our common stock for purposes of granting stock-based compensation. We determined the fair value of our common stock utilizing methodologies, approaches and assumptions consistent with the American Institute of Certified Public Accountants Practice Aid, “Valuation of Privately-Held-Company Equity Securities Issued as Compensation.” In addition, we exercised judgment in evaluating and assessing the foregoing based on several factors including:
| Ÿ | the nature and history of our business; |
| Ÿ | our current and historical operating performance; |
| Ÿ | our expected future operating performance; |
| Ÿ | prices for our convertible preferred stock issued to Gores Holding; |
| Ÿ | rights, preferences and privileges of our convertible preferred stock relative to those of our common stock; |
| Ÿ | our financial condition at the grant date; |
| Ÿ | the lack of marketability of our common stock; |
77
Table of Contents
| Ÿ | the likelihood of achieving different liquidity events or remaining a private company; |
| Ÿ | industry information such as market size and growth; and |
| Ÿ | macroeconomic conditions. |
We relied upon the probability-weighted expected return method (“PWERM”), and the option pricing model (“OPM”), to allocate our company value to each of our classes of stock.
Probability-weighted expected return method. PWERM values each class of equity based on an analysis of the range of potential future enterprise values of the Company and the manner in which those values would accrue to the owners of the different classes of equity. This method involves estimating the overall value of the subject company under various projected operating results scenarios and allocating the value to the various share classes based on their respective claim on the proceeds as of the date of each event. These different scenarios typically include a base case scenario and two to four additional scenarios of projected operating results, each resulting in a different value. For each scenario, the future value of each share class is calculated and discounted to a present value. The results of each scenario are then probability-weighted in order to arrive at an estimate of fair value for each share class as of a current date.
We used PWERM to allocate our estimated enterprise value between our preferred stock and common stock. At certain periods, we also utilized OPM as described below. Under PWERM, we analyzed the value of our company using several scenarios, which included a base case scenario (“Base Case Scenario”), upside scenario (“Upside Scenario”), downside scenario (“Downside Scenario”), and in certain valuations a base case + initiatives scenario (“Base + Initiatives Scenario”) and a flat case scenario (“Flat Case Scenario”). For all scenarios, we assumed an exit date on December 31 of the fourth full fiscal year following the date being valued, and we applied an exit multiple to the projected EBITDA of the exit year.
The Base Case Scenario was based on consensus housing start forecasts and other forecasted business drivers being applied to our current operating results and financial position to determine a projection of future operating results and cash flows. The Upside Scenario applied a more optimistic set of housing start and business assumptions than the Base Case Scenario to project our future operating results and cash flows, while the Downside Scenario applied a more pessimistic set of assumptions than the Base Case Scenario to project our future operating results and cash flows. In the April 2010 and November 2010 valuations, we also developed the Base + Initiatives Scenario, which utilized the same economic assumptions as the Base Case Scenario, but also included the value of certain operational improvement initiatives when projecting our future operating results and cash flows. In the April 2010 valuation, we also utilized the Flat Case Scenario, which assumed that then-current economic conditions would persist for the entirety of the forecast period.
We determined the value of our preferred stock and common stock under each scenario by allocating the equity value to each class of stock and discounting the value back to the present using a risk-adjusted discount rate. In certain scenarios, a large portion of the equity value is allocated to the convertible preferred stock to incorporate higher aggregate liquidation preferences. We then weighted the present value of the common stock under each scenario based upon the probability of each scenario occurring in order to determine a final indication of value for the common stock.
Option pricing model. OPM uses option theory to value the various classes of a company’s securities in light of their respective claims to the enterprise value. Total members’ equity value is allocated to the various share classes based upon their respective claims on a series of call options with strike prices at various value levels depending upon the rights and preferences of each class. A Black-Scholes closed-form option pricing model is typically employed in this analysis, with an option-
78
Table of Contents
term assumption that is consistent with our expected time to a liquidity event and a volatility assumption based on the estimated stock price volatility of a peer group of comparable public companies over a similar term.
Purchase of Wolseley shares and January 2012 valuation. On November 16, 2011, we purchased 11,135,495 Class A common shares held by Wolseley for $25.0 million or approximately $2.25 per Class A common share. This purchase was partially financed by $5.0 million advanced by Gores Holdings, which in January 2012 was settled by the issuance of 5,000 shares of Class C convertible preferred shares to Gores Holdings. The Class C convertible preferred shares can be converted to 4,454,889 Class A common shares, representing an equivalent price per Class A common share of approximately $1.122 per share. We determined that the difference between the price per share paid to acquire Wolseley’s interests of $2.25 and the price per share implied in our Class C convertible preferred shares of $1.122 represented a beneficial conversion feature totaling $5.0 million. The Class C convertible preferred shares can be converted to Class A common shares at any time by the stockholder and therefore, we immediately recognized the value of the beneficial conversion feature as a deemed dividend, which increased our 2012 loss attributable to common stockholders by $5.0 million, and our 2012 basic and diluted loss per share by approximately $0.38 per share.
In determining the fair value of our Class B common shares in January 2012, we utilized a PWERM, using a Base Case Scenario, Upside Scenario, and Downside Scenario (as described above), an exit date of December 31, 2016 and a terminal multiple of EBITDA of 5.50x. This valuation yielded a price per Class B common share of $1.98, which we believe was reasonable in light of the November 2011 Wolseley transaction, and after consideration of the non-voting characteristics of the Class B common shares.
The following table summarizes the significant assumptions we used in our valuations to determine the fair value of our common stock as of the dates indicated.
| Grant date | ||||||||||||||||
| June 2010 |
November 2010 |
November 2011 |
January 2012 | |||||||||||||
| Option pricing model |
50.0 | % | 50.0 | % | 50.0 | % | 0.0 | % | ||||||||
| Probability weighted expected |
50.0 | % | 50.0 | % | 50.0 | % | 100.0 | % | ||||||||
| Weighting of scenarios: |
||||||||||||||||
| Base |
25.0 | % | 45.0 | % | 65.0 | % | 65.0 | % | ||||||||
| Upside |
7.5 | % | 10.0 | % | 10.0 | % | 10.0 | % | ||||||||
| Downside |
25.0 | % | 20.0 | % | 25.0 | % | 25.0 | % | ||||||||
| Base + Initiatives |
10.0 | % | 25.0 | % | N/A | N/A | ||||||||||
| Flat |
32.5 | % | N/A | N/A | N/A | |||||||||||
| Exit date |
12/31/2014 | 12/31/2014 | 12/31/2015 | 12/31/2016 | ||||||||||||
| Terminal multiple of EBITDA |
5.25x | 4.50x | 5.75x | 5.50x | ||||||||||||
| Stock value-Class B common |
$ | 2.60 | $ | 2.00 | $ | 1.92 | $ | 1.98 | ||||||||
Our board of directors considered contemporaneous common stock valuations in determining or confirming the grant date fair value of common stock. No single event caused the valuation of our common stock to decrease from June 2010 to January 2012. Rather, it has been a combination of the following factors that led to the changes in the fair value of the underlying common stock:
| Ÿ | Single-family housing starts, a primary driver of the Company’s results, reached a new all-time low in 2011. This negatively impacted expectations for a housing construction recovery, and reduced projections of future results; |
79
Table of Contents
| Ÿ | The continuing history of losses and negative operating cash flows increased net borrowings and increased the specific company risk premium applied to the Company’s equity discount rate and increased the Company’s overall cost of capital; |
| Ÿ | The book value of stockholders’ equity declined from $197.0 million at December 31, 2009 to $51.4 million at December 31, 2011; |
| Ÿ | Cash and cash equivalents declined from $74.8 million at December 31, 2009 to $5.0 million at December 31, 2011; |
| Ÿ | Net borrowings under the revolving line of credit increased $13.0 million in 2010 and $20.8 million in 2011; and |
| Ÿ | Accretion of dividends on preferred shares was $5.1 million in 2010 and $4.2 million in 2011. |
Change in Value from January 2012 and the Offering Price
The following table summarizes the changes in our enterprise value and price per share between the January 2012 grant dates and the proposed offering price:
| 1/1/2012 Valuation |
Estimated Current Value (mid-point of price range)(1) |
Change | ||||||||||
| Reconciliation of Enterprise Value to Common Equity: |
||||||||||||
| Total Enterprise Value |
$ | 111,463 | $ | 492,966 | $ | 381,503 | ||||||
| Less: Debt |
35,850 | 58,100 | 22,250 | |||||||||
| Less: Fair Value of Preferred Shares |
35,300 | — | (35,300 | ) | ||||||||
|
|
|
|
|
|
|
|||||||
| Total Common Equity Value |
$ | 40,313 | $ | 434,866 | $ | 394,553 | ||||||
|
|
|
|
|
|
|
|||||||
| Common Equity Value by Class: |
||||||||||||
| Common A - Voting |
$ | 34,054 | $ | — | $ | (34,054 | ) | |||||
| Common B - Non-voting |
6,259 | — | (6,259 | ) | ||||||||
| New Common Stock |
— | 434,866 | 434,866 | |||||||||
|
|
|
|
|
|
|
|||||||
| Total Common Equity Value |
$ | 40,313 | $ | 434,866 | $ | 394,553 | ||||||
|
|
|
|
|
|
|
|||||||
| # of Common A Shares |
16,044,878 | |||||||||||
| Price per Share |
$ | 2.12 | ||||||||||
| # of Common B Shares |
3,155,754 | |||||||||||
| Price per Share |
$ | 1.98 | ||||||||||
| # of Common Shares (post-split, pro forma, as adjusted) |
25,580,380 | |||||||||||
| Price per share |
$ | 17.00 | ||||||||||
| (1) | Our estimated current enterprise value was determined by adding (i) our estimated net debt as of June 30, 2013 and after giving pro forma effect to the estimated net proceeds from this offering and (ii) the number of common shares outstanding after giving effect to this offering multiplied by the mid-point of the price range on the cover of this prospectus. |
The current value of our common stock, based upon the midpoint of the estimated price range of this offering, is significantly higher than the estimated fair value of our common stock as of each of the foregoing dates on which equity grants were issued. We note that, as is typical in initial public offerings, the estimated price range of this offering was not derived using a formal determination of fair value. Instead, the estimated price range has been calculated based upon discussions between us and the underwriters in the offering. Among the factors considered in determining this range were prevailing market conditions, our historical performance, estimates of our business potential and earnings
80
Table of Contents
prospects, an assessment of our management and the consideration of the above factors in relation to market valuation of companies in related businesses. In addition to this difference in purpose and methodology, we believe that the difference in value reflected between the estimated price range and the equity grant in January 2012 is principally attributed to the following significant events that have occurred since that date.
We believe that the increase in the fair value of our Class A common stock from January 2012 from $2.12 per share to the price range set forth on the cover page of this prospectus is primarily due to the increase in our net sales and Adjusted EBITDA, the increase in valuation multiples of other publicly traded companies within the markets in which we operate, reductions in the interest rate paid on our Revolver, and the conversion of our preferred stock (which eliminates future liquidation preferences and dividend commitments) and reduction in outstanding borrowings that will result from the application of the proceeds of this offering.
Since January 2012, we have seen improvements in the residential construction and home
improvement markets. For example, the seasonally adjusted annual rate for U.S. housing starts increased from 0.69 million in December 2011 (the most current data available at the time of our last stock grant) to 0.93 million in May 2013.
Due to improvements in the markets in which we operate, we have benefited from substantial improvement in our business. We reported actual net sales of $942.4 million during 2012 and Adjusted EBITDA of $2.0 million, which was significantly better than our forecasted 2012 net sales of $842.1 million and EBITDA of ($19.4) million, which was used in the Base Case Scenario in our January 2012 valuation.
Further, we reported net sales growth of 32.3% during the three months ended March 31, 2013, as compared to the prior year. We also experienced Adjusted EBITDA growth of $39.2 million from ($30.8) million in 2011 to $8.4 million in the twelve months ended March 31, 2013. We estimate that further improvements in net sales and Adjusted EBITDA were achieved in the three months ended June 30, 2013 (see “Summary—Preliminary financial results for the three months and six months ended June 30, 2013” included elsewhere in this prospectus).
As a result of improvements in the residential construction and home improvement markets and the expectations for continued growth and recovery in our end markets, the valuations of other publicly traded companies within the markets in which we operate have increased significantly. As of January 2012, the guideline public companies that were used in our valuation traded at an average enterprise value / one-year forward EBITDA multiple of 6.9x, whereas that multiple increased to 9.1x as of June 30, 2013. The combination of the increases in our actual and projected EBITDA, and the increases in enterprise value / one-year forward EBITDA multiples, resulted in an increase in our total enterprise value from $111.5 million at January 1, 2012 to a current estimated enterprise value of $493.0 million.
Furthermore, in May and December 2012 and June 2013, we made the following changes to our capital structure and Revolver, which lowered our on-going dividend commitments and interest expense and extended the maturities of our Revolver:
| Ÿ | On May 31, 2012, we amended our Revolver to lower the borrowing margin by 50 basis points. |
| Ÿ | On December 13, 2012, we amended our Revolver to lower the borrowing margin by 50 basis points and extend the maturity from June 30, 2014 to December 11, 2015. |
| Ÿ | On December 13, 2012, we redeemed Class B senior preferred stock and paid accumulated dividends totaling $23.0 million, which reduced future dividend commitments by approximately $1.8 million per year. |
81
Table of Contents
| Ÿ | On June 13, 2013, we amended our Revolver to lower the borrowing margin by 75 basis points and extend the maturity to December 31, 2016. |
Additionally, as part of this offering, we will convert our existing classes of preferred stock, totaling $42.2 million as of March 31, 2013, to common stock. Also, a portion of the net proceeds from this offering will be used to reduce the outstanding balance on our revolving line of credit by approximately $58.5 million. The conversion of preferred stock to common stock and use of proceeds to repay outstanding borrowings will reduce the total debt and fair value of preferred equity outstanding from $71.2 million at January 1, 2012 to approximately $58.1 million on a pro forma, as adjusted basis as of June 30, 2013. The reduction in borrowings and reduction in preferred equity associated with this offering will not increase our enterprise value. However, it will increase the portion of our enterprise value which is attributable to common equity. As a result, this reduction in borrowings and fair value of preferred equity of $13.1 million, combined with the increase in our enterprise value from $111.5 million at January 1, 2012 to a current estimated enterprise value of $493.0 million (as described above), results in an increase in the value of our common equity from $40.3 million at January 1, 2012 to $434.9 million on a pro forma, as adjusted basis.
Casualty and health insurance
We are self insured for general liability, auto liability and workers’ compensation exposures, as well as employee and eligible dependent health care claims, with specific excess insurance purchased from independent carriers to cover individual traumatic claims in excess of the self-insured limits. The expected liability for unpaid claims, including incurred but not reported losses, is determined using the assistance of third-party actuaries and is reflected on the consolidated balance sheets as a liability with current and long-term components. The amount recoverable from insurance providers is reflected on the consolidated balance sheets in prepaid expenses and other current assets. Our accounting policy includes an internal evaluation and adjustment of our reserve for all insured losses on a quarterly basis. At least on an annual basis, we engage external actuarial professionals to independently assess and estimate the total liability outstanding, which is compared to the actual reserve balance at that time and adjusted accordingly.
Deferred income taxes
In accordance with ASC 740 “Income Taxes,” we evaluate our deferred tax assets to determine if valuation allowances are required. In assessing the realizability of deferred tax assets, we consider both positive and negative evidence in determining whether it is more likely than not that some portion or all of the deferred tax assets will not be realized. The primary negative evidence considered includes the cumulative operating losses generated in prior periods. The primary positive evidence considered includes the reversal of deferred tax liabilities related to depreciation and amortization that would occur within the same jurisdiction and during the carry-forward period necessary to absorb the Federal and state net operating losses and other deferred tax assets. The reversal of such liabilities would utilize the Federal and state net operating losses and other deferred tax assets.
Based upon the positive and negative evidence considered, we believe it is more likely than not that we will realize the benefit of the deferred tax assets, net of the existing valuation allowances of $0.1 million, $1.4 million and $1.9 million as of December 31, 2010, 2011 and 2012, respectively, and $2.0 million as of March 31, 2013. To the extent we generate sufficient taxable income in the future to fully utilize the tax benefits of the net deferred tax assets on which a valuation allowance was recorded, our effective tax rate may decrease as the valuation allowance is reversed. As of December 31, 2012, we are no longer able to carry back our tax net operating losses; therefore, to the extent we generate future tax net operating losses, we may be required to increase the valuation allowance on net deferred tax assets and income tax benefit would be adversely affected.
82
Table of Contents
ASC 740 also prescribes a recognition threshold and certain measurement principles for the financial statements related to tax positions taken or expected to be taken on a tax return. Under ASC 740, the impact of an uncertain tax position on an income tax return must be recognized at the largest amount that is more likely than not to be sustained upon audit by the relevant taxing authority. An uncertain income tax position will not be recognized if it has less than a 50% likelihood of being sustained. Additionally, ASC 740 provides guidance on derecognition, classification, interest and penalties associated with income taxes, accounting in interim periods, disclosures and transition requirements.
At December 31, 2011 and 2012, we have recognized $0.3 million and $0.0 million, respectively, within other long-term liabilities on the consolidated balance sheets related to state uncertain tax positions with equal, corresponding amounts related to the Wolseley indemnification within other assets. All of these uncertain tax position liabilities are subject to indemnification by Wolseley. During 2012, the statute of limitations expired for certain tax periods where we had previously recognized a long-term liability related to uncertain tax positions. As a result, we increased the current income tax benefit for the year ending December 31, 2012 by $0.3 million and decreased the long-term liability related to the uncertain tax positions. We also recognized $0.3 million within other income (expense), net, on the consolidated statement of operations due to the reduction in the related Wolseley indemnity asset.
Consideration received from suppliers
We enter into arrangements with many of our suppliers providing for inventory purchase rebates (“supplier rebates”) upon achievement of specified volume purchasing levels. We accrue estimated supplier rebates monthly as part of cost of goods sold based on progress toward earning the supplier rebates, taking into consideration cumulative purchases of inventory to date and projected purchases through the end of the year. We estimate the rebates applicable to inventory on-hand at each period end based on the inventory turns of the related items.
Under certain circumstances, including if market conditions were to change, suppliers may change the terms of some or all of these programs. Although these changes would not affect the amounts which we have recorded related to product already purchased, it may impact our gross margins in future periods.
New accounting pronouncements
Under the JOBS Act, “emerging growth companies” can delay adopting new or revised accounting standards until such time as those standards apply to private companies. However, we have irrevocably elected not to take advantage of this extended transition period provided in Section 7(a)(2)(B) of the Securities Act as allowed by Section 107(b)(1) of the JOBS Act. Additionally, we are in the process of evaluating the benefits of relying on other exemptions and reduced reporting requirements provided by the JOBS Act. Subject to certain conditions set forth in the JOBS Act, as an ‘‘emerging growth company’’, we intend to rely on certain of these exemptions, including without limitation, (i) an exemption from providing an auditor’s attestation report on our system of internal controls over financial reporting pursuant to Section 404, (ii) an exemption from complying with any requirement that may be adopted by the Public Company Accounting Oversight Board regarding mandatory audit firm rotation or a supplement to the auditor’s report providing additional information about the audit and the financial statements (auditor discussion and analysis), (iii) an exemption from the requirements of holding a nonbinding advisory vote on executive compensation and stockholder approval of any golden parachute payments not previously approved and (iv) reduced disclosure obligations regarding executive compensation in our periodic reports and proxy statements. We will remain an ‘‘emerging growth company’’ for up to five years following the completion of this offering or until we achieve total annual gross revenues in excess of $1 billion during a fiscal year or become a large accelerated filer as a result of achieving a public float of at least $700 million as of the end of a
83
Table of Contents
second fiscal quarter. If the housing market continues to strengthen, we could exceed annual gross revenues of $1 billion shortly after the date of this prospectus, as we had $967 million of total gross revenues in 2012.
Fair value measurement
In May 2011, the Financial Accounting Standards Board (“FASB”) issued ASU No. 2011-04, “Amendments to Achieve Common Fair Value Measurement and Disclosure Requirements in U.S. GAAP and IFRSs” (“ASU 2011-04”). The amendments in this ASU are intended to improve the comparability of fair value measurements presented and disclosed in financial statements prepared in accordance with U.S. GAAP and International Financial Reporting Standards (“IFRS”). The amendments in this ASU explain how to measure fair value. They do not require additional fair value measurements and are not intended to establish valuation standards or affect valuation practices outside of financial reporting. We adopted the provisions of ASU 2011-04 on January 1, 2012. The adoption did not have an impact on our financial position or results of operations.
Comprehensive income: presentation
In June 2011, the FASB issued ASU No. 2011-05, “Presentation of Comprehensive Income” (“ASU 2011-05”), to increase the prominence of items reported in other comprehensive income and to facilitate convergence of U.S. GAAP and IFRS. ASU 2011-05 eliminates the option to present components of other comprehensive income as part of the statement of changes in stockholders’ equity and requires that all non-owner changes in stockholders’ equity be presented either in a single continuous statement of comprehensive income or in two separate but consecutive statements. In the two-statement approach, the first statement should present total net income and its components followed consecutively by a second statement that should present total other comprehensive income, the components of other comprehensive income, and the total of comprehensive income. We adopted the provisions of ASU 2011-05 on January 1, 2012. The adoption of ASU 2011-05 did not have an impact on our financial position or results of operations.
Comprehensive income: reclassifications
In February 2013, the FASB issued ASU No. 2013-02, “Reporting of Amounts Reclassified Out of Accumulated Other Comprehensive Income” (“ASU 2013-02”), to supersede and replace the presentation requirements for reclassifications out of accumulated other comprehensive income in ASU 2011-05, which were deferred indefinitely under ASU No. 2011-12, “Deferral of the Effective Date for Amendments to the Presentation of Reclassifications of Items Out of Accumulated Other Comprehensive Income in Accounting Standards Update No. 2011-05” (“ASU 2011-12”), issued in December 2011. The amendments in ASU 2013-02 would require an entity to provide additional information about reclassifications out of accumulated other comprehensive income by the respective line items of net income. For public entities, the amendments are effective for fiscal years, and interim periods within those years, beginning after December 15, 2012. The adoption of ASU 2013-02 will not have an impact on our financial position or results of operations.
Internal control over financial reporting
We are not currently required to comply with the SEC’s rules implementing Section 404 of the Sarbanes Oxley Act of 2002, as amended, and are therefore not required to make a formal assessment of the effectiveness of our internal control over financial reporting for that purpose. Upon becoming a public company, we will be required to comply with the SEC’s rules implementing Section 302 and 404 of the Sarbanes-Oxley Act of 2002, as amended, which will require our management to certify financial and other information in our quarterly and annual reports and provide an annual
84
Table of Contents
management report on the effectiveness of our internal control over financial reporting. We will not be required to make our first annual assessment of our internal control over financial reporting pursuant to Section 404 until the year following our first annual report required to be filed with the SEC.
We identified a material weakness in our internal control over financial reporting related to the valuation of our Class A and Class B common stock on January 1, 2012. A material weakness is a deficiency, or combination of deficiencies, in internal control over financial reporting, such that there is a reasonable possibility that a material misstatement of the annual or interim financial statements will not be prevented or detected on a timely basis. During the third quarter of 2013, we identified transactions that should have been considered in the January 1, 2012 valuation of the Company’s Class A and Class B common stock. The updated valuation of our Class A and Class B common stock led to the following restatements: (i) to correct compensation expense related to a modification of the exercise price of our outstanding stock options, the issuance of new stock options and shares purchased by management and (ii) to recognize a beneficial conversion feature for the Convertible Class C Preferred stock and related accretion of dividends, which impacted our previously reported earnings per share. We determined that our controls relating to the Company’s valuation process were not at a precise enough level to identify the proper accounting treatment for the beneficial conversion feature or its implications on the January 2012 valuation of our common stock.
The material weakness described above could result in a misstatement of our accounts or disclosures that would result in a material misstatement of our financial statements that would not be prevented or detected. We are taking steps to remediate the material weakness, including designing and implementing improved processes and controls related to the review of the underlying assumptions and inputs used by the valuation specialist and the evaluation of how different value outputs may give rise to different equity accounting treatments (such as the beneficial conversion feature noted above). We cannot assure you that the measures we have taken to date, or any measures we may take in the future, will be sufficient to remediate the material weakness described above or to avoid potential future material weaknesses. Following the completion of this offering, we will value our common stock based on the market price for such stock.
85
Table of Contents
Overview
We are a large, diversified LBM distributor and solutions provider that sells to new construction and repair and remodel contractors. We carry a broad line of products and have operations throughout the United States. Our primary products are lumber & lumber sheet goods, millwork, doors, flooring, windows, structural components, such as EWP, trusses, wall panels and other exterior products. Additionally, we provide solution-based services to our customers, including design, product specification and installation management services. We serve a broad customer base, including large-scale production homebuilders, custom homebuilders and repair and remodeling contractors, and we believe we are among the top three LBM suppliers for residential construction in 80% of the geographic markets in which we operate, based on net sales. We offer over 39,000 products sourced through our strategic network of suppliers, which together with our various solution-based services, represent approximately 50% of the construction cost of a typical new home. By enabling our customers to source a significant portion of their materials and services from one supplier, we have positioned ourselves as the supply partner of choice for many of our customers.
We have operations in 13 states that accounted for approximately 48% of 2012 U.S. single-family housing permits according to the U.S. Census Bureau. Our primary operating regions include the South and West regions of the United States (as defined by the U.S. Census Bureau), with a significant portion of our net sales derived from markets within Texas, North Carolina, California and Utah. Following our acquisition by an affiliate of Gores in 2009, we aggressively and strategically reduced our footprint to improve our profitability. Today, our facilities are strategically located in 20 metropolitan areas in these 13 states that we believe have an attractive potential for economic growth based on population trends, increasing business activity and above-average employment growth. The following map shows our current operating footprint.
86
Table of Contents
We serve our customers from 65 locations within our markets, which include 48 distribution and retail operations, 19 millwork fabrication operations, 14 structural components fabrication operations and 13 flooring operations. Given the local nature of our business, we locate our facilities in close proximity to our key customers and often co-locate multiple operations in one facility to increase customer service and efficiency.
We provide a balanced mix of products and services to U.S. production and custom homebuilders and repair and remodel, multi-family and commercial contractors. The charts below summarize our 2012 revenues by product category and customer segment.
| 2012 revenues |
2012 revenues |
87
Table of Contents
The following table demonstrates the favorable demographic trends in the metropolitan areas in which we operate and the capabilities of our facilities.
| Market |
2012 single family permits |
Year over year single family permit change |
December 2012 unemployment rate |
2012 total employment year over year change |
Distribution & retail operations |
Millwork fabrication |
Structural components fabrication |
Flooring operations |
||||||||||||||||||||||||
| Houston, TX |
28,628 | 25.1 | % | 6.0 | % | 4.0 | % | 4 | 1 | 2 | ||||||||||||||||||||||
| Washington, DC |
10,980 | 13.9 | % | 5.3 | % | 1.1 | % | 3 | 2 | 3 | (7) | |||||||||||||||||||||
| Atlanta, GA |
9,167 | 47.5 | % | 8.4 | % | 2.3 | % | 3 | 2 | 2 | ||||||||||||||||||||||
| Austin, TX |
8,229 | 32.1 | % | 5.0 | % | 3.9 | % | 1 | 1 | 1 | ||||||||||||||||||||||
| Raleigh-Durham, NC(1) |
8,020 | 27.7 | % | 7.4 | % | 2.8 | % | 4 | 1 | 1 | 3 | (8) | ||||||||||||||||||||
| Charlotte, NC |
6,703 | 36.5 | % | 9.4 | % | 3.2 | % | 1 | 2 | 1 | ||||||||||||||||||||||
| Eastern PA(2) |
5,956 | 14.8 | % | 8.2 | % | 1.0 | % | 1 | 1 | 1 | ||||||||||||||||||||||
| San Antonio, TX |
5,102 | 15.7 | % | 5.7 | % | 2.6 | % | 1 | ||||||||||||||||||||||||
| Salt Lake City, UT(3) |
5,052 | 40.6 | % | 4.9 | % | 4.4 | % | 5 | 3 | 2 | ||||||||||||||||||||||
| Los Angeles, CA |
4,946 | 20.7 | % | 9.4 | % | 2.2 | % | 11 | 2 | 1 | ||||||||||||||||||||||
| Richmond, VA |
2,840 | 20.7 | % | 6.0 | % | 1.1 | % | 1 | 1 | 1 | ||||||||||||||||||||||
| Columbia, SC |
2,791 | 16.8 | % | 7.5 | % | 1.2 | % | 2 | 1 | 2 | (9) | |||||||||||||||||||||
| Greenville, SC |
2,246 | 37.0 | % | 7.0 | % | 1.4 | % | 1 | 1 | |||||||||||||||||||||||
| Greensboro, NC(4) |
2,014 | 2.0 | % | 9.4 | % | 0.9 | % | 1 | 1 | |||||||||||||||||||||||
| Northwest AR(5) |
1,763 | 52.2 | % | 5.1 | % | 3.3 | % | 1 | 1 | 1 | ||||||||||||||||||||||
| Southern Utah(6) |
1,317 | 54.2 | % | 6.6 | % | 5.1 | % | 1 | 1 | |||||||||||||||||||||||
| Albuquerque, NM |
1,259 | (7.0 | %) | 6.7 | % | 0.2 | % | 1 | 1 | 1 | ||||||||||||||||||||||
| Spokane, WA |
963 | 30.1 | % | 8.4 | % | 1.9 | % | 2 | 1 | |||||||||||||||||||||||
| Lubbock, TX |
752 | 8.7 | % | 4.7 | % | 1.6 | % | 2 | 1 | |||||||||||||||||||||||
| Amarillo, TX |
653 | (0.5 | %) | 4.3 | % | 0.4 | % | 2 | ||||||||||||||||||||||||
|
|
|
|
|
|
|
|
|
|
|
|
|
|
|
|
|
|||||||||||||||||
| Total for Stock Building Supply markets |
109,381 | 25.3 | % | 7.5 | % | 2.2 | % | 48 | 19 | 14 | 13 | |||||||||||||||||||||
| U.S. total |
518,695 | 23.9 | % | 7.8 | % | 1.7 | % | |||||||||||||||||||||||||
Source: U.S. Census Bureau and Bureau of Labor Statistics
| (1) | Durham-Chapel Hill, NC and Raleigh-Cary, NC MSAs |
| (2) | Philadelphia-Camden-Wilmington, PA-NJ-DE-MD and Lancaster, PA MSAs. |
| (3) | Salt Lake City, UT and Provo-Orem, UT MSAs |
| (4) | Greensboro-High Point, NC and Winston-Salem, NC MSAs |
| (5) | Fayetteville-Springdale-Rogers, AR-MO MSA |
| (6) | St. George, UT MSA |
| (7) | Includes flooring location in Baltimore, MD |
| (8) | Includes flooring location in Fayetteville, NC |
| (9) | Includes flooring location in Charleston, SC |
We continue to make capital investments in our local businesses to bolster our market share, expand our distribution network, improve our service offerings and streamline our business processes. Since 2010, we have acquired four businesses and, through investments in a proprietary IT and operational platform, have improved our distribution service capability. We have also integrated each of our local branches with our headquarters in Raleigh, North Carolina, which provides centralized value-added support to our local businesses, including accounting, IT and a central sourcing and procurement function. Additionally, we have undertaken efforts to streamline and improve significantly our business processes by adopting a “LEAN” business philosophy to reduce waste and add value. These initiatives allowed us to reduce selling, general and administrative expense by $25.2 million, while net sales increased 25.4% from 2010 to 2012. We believe that, as we continue to pursue these initiatives, we will further improve the service and support we provide to our customers, increase the effectiveness of our employees and contractors and improve efficiency across all aspects of our business.
In 2006, our current footprint of facilities generated approximately $1.8 billion in sales, and we believe that we will achieve attractive growth as our markets recover to normalized levels of new home construction. From 2010 to 2012, our net sales increased $190.7 million, from $751.7 million to $942.4 million. Over the same period, our Adjusted EBITDA increased $60.0 million, from $(58.0) million to $2.0 million, while our net
88
Table of Contents
loss decreased $55.5 million, from $70.0 million to $14.5 million. For a reconciliation of net loss to Adjusted EBITDA, see “Prospectus Summary—Summary consolidated financial data.” We believe that the housing recovery in our markets will continue to drive significant increases in demand for our products and the significant growth in net sales and Adjusted EBITDA that we have experienced since 2010.
Our industry
The LBM distribution industry in the United States is highly fragmented, with a number of retailers and distributors offering a broad range of products and services. Demand for our products is principally influenced by new residential construction and residential repair and remodeling activity. Following several challenging years, single-family housing starts increased in 2012 to 0.54 million and, as a result, demand for the products we distribute and for our services has also increased. From 2005 to 2011, single-family housing starts in the United States declined by approximately 75%. According to the U.S. Census Bureau, single-family housing starts in 2009, 2010 and 2011 were 0.44 million, 0.47 million and 0.43 million, respectively, which are significantly less than the 50-year average rate of 1.0 million. Approximately 67% of the 52 economists named in the May 2013 Economic Forecasting Survey conducted by The Wall Street Journal expect housing starts in 2013 to reach or exceed 1.0 million for the first time since 2007, and recent national housing statistics confirm that a robust housing recovery is already underway. For example, U.S. single-family housing starts increased 20.2% year-over-year for the six months ended June 30, 2013. Additionally, the Case-Shiller Index, a leading measure of pricing for the U.S. residential housing market, has increased on a year-over-year basis for 11 straight months and is at its highest levels since November 2008.
We believe that these trends are supported by the following positive economic and demographic indicators, which are typically indicative of housing market strength:
| Ÿ | declining unemployment rates; |
| Ÿ | rising home values and improving household finances; |
| Ÿ | increases in total households; |
| Ÿ | improving sentiment towards ownership of residential real estate; |
| Ÿ | declining levels of new and existing for-sale home inventory; and |
| Ÿ | a favorable consumer interest rate environment supporting affordability and home ownership. |
We believe that there is considerable growth potential in the U.S. housing sector. As of June 2013, McGraw-Hill Construction forecasts that U.S. single-family housing starts will increase to 1.1 million by 2015. Many publicly-traded homebuilders, including Lennar Corporation, D. R. Horton, Inc. and Beazer Homes USA, Inc., have reported strong earnings results and positive financial outlooks in the near-term, confirming the momentum of the housing recovery. For example, net new orders for publicly-traded homebuilders increased 24% year-over-year in the three months ended March 31, 2013, with some publicly-traded homebuilders reporting order increases of over 49%.
The products we distribute are also used in professional remodeling projects. According to the HJCHS, the U.S. remodeling market reached a peak of $328 billion in 2007 before declining approximately 16% to $275 billion in 2011. Despite this decline, factors, including the overall age of the U.S. housing stock, heightened focus on energy efficiency, rising home prices and availability of consumer capital at low interest rates, are expected to drive long-term growth in repair and remodeling expenditures. As of March 2013, HIRI estimates that total U.S. sales of home maintenance, repair and improvement products to the professional market will grow at a rate of 5.0% in 2013, 6.2% in 2014 and 4.9% in 2015.
89
Table of Contents
Our competitive strengths
We believe the following key competitive strengths have contributed to our success and will position us for significant growth as part of a multi-year recovery in our end markets.
Leading distributor of building products to U.S. residential construction markets
We believe we are one of the leading LBM distributors in the United States. We serve all segments of the residential construction industry, including large-scale production homebuilders, custom homebuilders and repair and remodeling contractors. Our 65 strategically-located facilities supply products and services to many major markets in the United States and provides us with significant scale and capacity for growth. We believe that scale, strong customer relationships, and superior product and service offerings in each of our markets provide competitive advantages, enabling us to drive market share gains over time. We believe that we are among the top three LBM participants in 80% of the geographic markets in which we operate based on net sales. Because of our leading market position, we believe we are well-positioned to take advantage of the projected recovery in the residential construction market.
Low cost distribution platform with strong operating leverage
Through aggressive cost management and strategic restructuring activities implemented during the global economic downturn, we have driven significant productivity gains and positioned our company for profitable growth. Since 2009, we have closed or sold over 100 facilities in locations that we determined would not provide us with sufficient scale, or where we would otherwise not be able to compete effectively and profitably.
Beginning in 2011, our management team began implementing LEAN business practices to improve customer service, reduce waste and increase productivity. These LEAN initiatives have improved our sourcing practices and streamlined our supply chain and, along with other cost reduction efforts, have reduced our selling, general and administrative expenses as a percent of net sales from 32.8% for the fiscal year ended December 31, 2010 to 23.5% for the fiscal year ended December 31, 2012. Over the same period we have significantly increased productivity and operating leverage as net sales increased by $190.7 million, while selling, general and administrative expenses decreased by $25.1 million. We believe that our current low fixed cost position will help us to generate increased profitability as the market continues to recover.
We have also developed several innovative and proprietary eBusiness systems. Stock Logistics Solutions, a system designed to enhance the customer experience and reduce waste, was implemented in 2011, and Stock Installation Solutions, a system designed to improve the execution and customer communication of our installation services, is scheduled for implementation in 2013. Due to the implementation of Stock Logistics Solutions, we have reduced our shipping and handling costs as a percent of net sales from 6.6% in 2010 to 5.4% in 2012. These services have enabled us to track our supply chain more accurately, significantly improve customer service and reduce waste. Due in part to our LEAN initiatives and focus on efficiency, our Adjusted EBITDA has increased $60.0 million from ($58.0) million in 2010 to $2.0 million in 2012, while our net loss decreased $55.5 million, from $70.0 million in 2010 to $14.5 million in 2012. We believe that our Adjusted EBITDA will continue to increase as a percent of net sales as the residential construction sector rebounds.
Leading local businesses in attractive geographic markets
We operate in 20 metropolitan areas in 13 states that we believe have attractive potential for economic growth, with strong LBM product capabilities in each market we serve. We believe we are one of the top three LBM suppliers in 80% of these markets, based on net sales, with strong customer
90
Table of Contents
relationships and a professional team to serve our customers as they grow. Today, we serve our customers from 65 locations, which include 48 distribution and retail operations, 19 millwork fabrication operations, 14 structural components fabrication operations and 13 flooring operations. We often co-locate multiple operations in one facility to increase customer service and efficiency. Our primary operating regions include the South and West regions of the United States (as defined by the U.S. Census Bureau), which we believe are markets that are well-positioned to grow as the residential construction market recovers. McGraw-Hill Construction forecasts that the compounded annual growth rate for single-family housing starts in our 20 markets will be 24.1% from 2012 to 2015.
Proven ability to acquire and integrate complementary businesses
Our management has demonstrated a core competency in identifying, acquiring and successfully integrating businesses to provide us greater scale in our current markets and opportunities to grow in new markets. Since 2010, we have acquired the assets of four businesses with core LBM capabilities, three of which were in our current markets and one of which provided us with a strategic position in a new market.
| Ÿ | Bison, which we acquired in 2010, is located in Houston, Texas and enhanced our scale in the attractive Texas Gulf Coast market; |
| Ÿ | NHC, which we acquired in 2010, is located in Northwest Arkansas and established a strong position in the Arkansas market; |
| Ÿ | TBSG, which we acquired in December 2012, is located in Marietta, Georgia and is a provider of residential structural solutions and provides us with greater scale in the local Atlanta market, which is expected to grow significantly as the residential construction market recovers; and |
| Ÿ | Chesapeake, which we acquired in April 2013, is located outside Richmond, Virginia, and provided us with component manufacturing capability to serve our customers in our Central and Northern Virginia markets. |
While we have significant growth potential in our current operational footprint, we plan to continue to evaluate and acquire attractive businesses in our current geographic markets as well as new geographies to expand service capabilities and customer share to accelerate increases in profitability.
Extensive offering of building materials and services
We offer a comprehensive line of residential building products that are used in the construction of homes, including windows, doors and trim, and many of the products used in the interior and exterior finishing of homes. We also provide manufactured products such as roof and floor trusses, wall panels and various millwork products. We offer over 39,000 different products sourced through our strategic network of suppliers and have access to a wide range of special order products. Additionally, we provide solution-based services to our customers as needed, including design, product specification and installation management services. Furthermore, many of our facilities include product showrooms, which customers use to develop a better appreciation for our product and service offerings. Products and services that we offer represent approximately 50% of the cost of a typical new home. Because of our ability to supply a significant share of the building materials for a new home, customers look to us for both new construction and remodeling solutions. We believe that the breadth of the products we offer our customers provides us with a strategic advantage and enables us to forge deeper relationships with customers than smaller competitors who may be unable to supply a similar product range and lack access to the broad resources of a national company.
91
Table of Contents
Superior customer service and value-added capabilities
We complement our line of building products with superior customer service and value-added capabilities. Our experienced customer service professionals provide a full range of services, including customized design and installation services specific to each job site and type. Installation services are managed by our employees, but are normally provided by third parties. Other services that we provide include job estimating, take-off, structural components or millwork design, product selection and customization. We also provide order management services for in-stock and special order products or services, manage inventory, deliver and/or load materials, and provide building products and construction trend insights for our customers. We believe that the breadth of our services, our focus on individual customer needs and the integration of our supply chain and fulfillment capabilities set us apart from many of our competitors.
We offer training programs and advanced service tools for our employees in order to assist them in providing solutions for our customers. Our innovative Stock Logistics Solutions capability, in which we provide real-time delivery information and confirmation via the Internet and to mobile devices, is one example of customer service capabilities that have increased customer loyalty and helped us drive growth in our markets.
Integrated supply chain that increases efficiency and benefits customers and suppliers
Although we operate facilities in 20 metropolitan areas across 13 states, we maintain an integrated, national supply chain that we believe enables us to provide our customers with superior services, timely delivery and more favorable pricing. We have integrated our sourcing and purchasing operations into a central procurement function. Over the last ten years, we have invested in an ERP system that integrates each of our local branches with our headquarters operation. Our ERP system allows us to manage customer orders and deliver efficiently across our entire organization. It also enables central product replenishment and optimizes inventory management to improve working capital requirements. Through Stock Logistics Solutions, which includes a mobile GPS application on our delivery trucks that is integrated with our ERP software, our sales and service professionals can better schedule, dispatch and manage customer deliveries.
Our integrated sourcing and purchasing operations have enabled us to develop cost-effective national sourcing agreements with key suppliers that provide us with product delivery certainty and favorable terms. We believe our suppliers value our extensive footprint, experienced sales force and advanced service capabilities and, as a result of these operational strengths, often consider us to be a preferred distribution partner. We believe that customers also benefit greatly from our ability to source products on a national and global level through improved pricing and availability. Through these sourcing agreements we are also able to realize stronger gross margins and achieve superior inventory management, especially during periods of market growth as product supply in the industry becomes more limited. Additionally, our broad reach, efficient operations and significant growth potential offer our suppliers an opportunity to strategically partner with us for growth, which further strengthens their loyalty to us.
Experienced management team and principal equity holder
Our senior management team has more than 120 years of combined experience in manufacturing and distribution with a track record of financial and operational excellence in both favorable and challenging market conditions. Since 2010, our management team has successfully acquired and integrated businesses that have helped us gain scale in our current markets. Since 1987, our equity sponsor Gores has acquired and operated more than 80 companies while employing a consistent, operationally-oriented approach to create value in its businesses.
92
Table of Contents
Our strategy
We intend to capitalize on our strong market position in LBM distribution to increase revenues and profits and maximize operating cash flow as the U.S. housing market recovers. We seek to achieve this by executing on the following strategies:
Expand our business with existing customers by offering additional value
We plan to continue to grow our net sales by increasing our share of our existing customers’ business. By growing our scale and expanding the products and services we offer in each of our local markets, we believe that we can continue to enhance the value offering for, and relationships with, our existing customers and grow our revenues and profitability. Several of our existing facilities provide only a portion of the value-added solutions our customers need to optimize their construction projects. We believe our 2012 net sales to single-family homebuilders of $679.8 million represented approximately 7% of the overall purchases by single-family homebuilders of products and services we offer within our current geographic footprint. Products and services we intend to expand organically include millwork and structural components manufacturing, enhanced specification and design services, and additional LEAN eBusiness solutions for our customers and our sales and service professionals. By continuing to invest systematically in our core LBM capabilities and in technologies that streamline our processes and improve customer service, we believe we can provide a broader range of products and services at each of our locations and that more customers will look to us as the key solution provider for their building needs.
Expand in existing, adjacent and new geographies
We plan to expand our business through organic and acquisitive means in order to take advantage of our national supply chain and broad LBM capabilities. We intend to expand our reach and service capabilities in our current metropolitan areas by opening new locations, relocating facilities as needed and increasing capacity at existing facilities. In addition, while we have operations in 13 states that accounted for approximately 48% of 2012 U.S. single-family housing permits, our markets within those states accounted for less than half of those permits according to the U.S. Census Bureau, providing significant opportunity for growth into markets adjacent to our current markets within these states. Growth opportunities also exist through increasing our 2012 net sales to remodeling contractors of $169.4 million, which represented less than 1% of 2012 U.S. sales of home maintenance, repair and improvement products to the professional market of $74.7 billion, as reported by HIRI. We believe that our scale, integrated supply chain, product knowledge, eBusiness solutions and professional customer service will enable us to grow significantly as we expand in our existing markets and in markets adjacent to our existing markets within the states where we currently operate, as well as into additional states as market and competitive conditions support further growth. We believe that our balance sheet and liquidity position will support our growth strategy.
Deliver leading customer service, productivity and operational excellence as our business grows
We strive for continued operational excellence. We have implemented a talent training and development program focused on specific skills training, business development and LEAN initiatives. Using these skills, our branch managers, regional management and senior leadership team continually examine customer service, operating and financial metrics and use this information to optimize regional and local strategies to increase customer service and operating expense productivity. Our management team has also implemented, and will continue to pursue, LEAN business practices to increase productivity. We believe that the customer service and productivity gains we realized from these initiatives will continue to improve as they are implemented more broadly across our organization.
93
Table of Contents
We completed an ERP implementation across all branches, and our proprietary eBusiness system, which includes Stock Logistics Solutions, will provide the platform for continued service improvements. In addition, we intend to implement our Stock Installation Solutions system in 2013, which is designed to track the timing and completion of installation work and will provide further enhancements to our customer service. We will continue to leverage operational best practices and optimize our supplier network in order to improve efficiency and profitability. We believe that there is an opportunity for further margin improvement as we expand our business and continue to implement LEAN initiatives that bring value to our customers.
Selectively pursue strategic acquisitions
Our industry remains highly fragmented. We believe a significant number of small and larger acquisition opportunities will offer attractive growth characteristics and favorable synergy potential. We intend to focus on using our operating platform and proven integration capabilities to pursue additional acquisition opportunities while minimizing execution risk. We will focus on investments in markets adjacent to our existing operations or acquisitions that enhance our presence and capabilities in our 20 existing metropolitan areas. Additionally, we will consider acquiring operations or companies to enter new geographic regions. We believe our capital structure positions us to acquire businesses we find strategically attractive.
History
The Company’s predecessor was founded as Carolina Builders Corporation in Raleigh, North Carolina in 1922 and began operating under the Stock Building Supply name in 2003. In addition, certain companies acquired by us were founded as early as 1822.
In May 2009, Gores Holdings, an affiliate of Gores, acquired 51% of the voting interests of our subsidiary, Stock Building Supply Holdings, LLC through a newly formed subsidiary, Saturn Acquisition Holdings, LLC, from an affiliate of Wolseley. Immediately after the acquisition, we entered into a prepackaged reorganization plan pursuant to Chapter 11 of the Bankruptcy Code. The prepackaged reorganization was pursuant to a pre-arranged plan with the Company’s creditors, which took effect upon filing and enabled us to terminate certain real property leases in undesirable locations in exchange for payment of a statutory amount of damages. The reorganization, which was undertaken in less than two months, did not include a compromise of any claims of any suppliers, creditors or employees. In November 2011, Gores Holdings purchased the remaining minority interest in us from Wolseley. On May 2, 2013, Saturn Acquisition Holdings, LLC converted to a corporation and changed its name to Stock Building Supply Holdings, Inc. We are currently owned by Gores Holdings and members of our senior management. Stock Building Supply Holdings, Inc. is a holding company that derives all of its operating income from its subsidiaries.
Our customers
We serve a broad customer base which is a balanced mix of large-scale production homebuilders, custom homebuilders and repair and remodeling contractors. We believe we have a diverse geographic footprint as we serve 20 metropolitan areas in 13 states. Approximately 48% of U.S. housing permits in 2012 were issued in states in which we operate. We believe the 20 metropolitan areas we serve are in states that have attractive potential for economic growth based on population migration trends, increasing business activity and above-average employment growth.
Our customer base is also highly diversified. As an example, for the year ended December 31, 2012, we had over 12,000 buying accounts and our largest 100 customers accounted for approximately 47% of our net 2012 sales, with no single customer accounting for more than 6% of our 2012 net sales.
94
Table of Contents
Our largest customers are comprised primarily of the large production homebuilders, including publicly traded companies such as Beazer Homes USA, Inc., D.R. Horton, Inc., Hovnanian Enterprises, Inc., Lennar Corporation, M.D.C. Holdings, Inc., PulteGroup, Inc., and Weyerhaeuser Real Estate Company (a subsidiary of Weyerhaeuser Company). In addition to these large production homebuilders, we also service and supply regional and local custom homebuilders. Many of our homebuilder customers require and value significantly higher levels of support from our employees and utilize many of the service and product offerings we provide. Our capabilities allow us to also serve residential remodeling contractors, multi-family and light commercial contractors in each of our markets, which diversifies our customer base. Our sales and service professionals must work very closely with our customers on a day-to-day basis in order to help them scope, specify, bid, construct and complete their projects in a timely and successful manner. These customers have valued and, we believe, will continue to value and utilize the offerings we provide the U.S. residential and light-commercial construction industry.
Our products and services
We provide a wide variety of building products and services directly to homebuilder and professional contractor customers. We have a comprehensive offering of over 39,000 products which are available through our distribution locations and, in many instances, delivered to the job site. We manufacture floor trusses, roof trusses, wall panels, stairs, specialty millwork, windows, and doors. We also provide an extensive range of installation services and special order products. We believe our broad product and service offering, combined with our scale and experienced sales force, positions our company well to grow significantly as the U.S. housing market recovers.
We group our building products and services into five product categories: structural components, millwork & other interior products, lumber & lumber sheet goods, windows & other exterior products, and other building products & services. For the year ended December 31, 2012, our combined sales of structural components, millwork & other interior products, and windows & other exterior products represented 52% of net sales. Each of these categories includes both manufactured and distributed products. Products in these categories typically carry a higher margin and provide us with opportunities to cross-sell other products and services, thereby increasing sales to each customer. Sales by product category for the years ended December 31, 2010, 2011 and 2012 can be found under the caption “Management’s Discussion and Analysis of Financial Condition and Results of Operations—Operating results—2012 compared to 2011—Net sales” and “—2011 compared to 2010—Net sales.”
Structural components. Structural components are factory-built substitutes for job-site framing and include floor trusses, roof trusses, wall panels, and engineered wood that we design and cut for each home. Our manufactured structural components allow builders to build higher quality homes more efficiently. Roof trusses, floor trusses, and wall panels are built in a factory controlled environment. Engineered floors and beams are cut to the required size and packaged for the given application at many of our locations. Without structural components, builders construct these items on site, where weather and variable labor quality can negatively impact construction cost, quality and installation time.
In addition to increased efficiency and improved quality, a primary benefit of using structural components is shortening cycle time from start to completion, eliminating job-site waste and clutter and minimizing the amount of skilled labor that must be sourced for a job site. As the housing market recovers, we believe these factors will increase demand for structural components relative to total housing starts and provide opportunities for incremental revenue and gross profit growth.
Millwork & other interior products. The millwork & other interior products category includes interior doors, interior trim, custom millwork, moldings, stairs and stair parts, flooring, cabinets, gypsum and other products that are used primarily inside the structure of the home. We pre-hang interior doors in many of our markets, which consists of attaching hinges and door jambs to a door slab, thereby reducing on-site installation time and providing a higher quality finished door unit than those
95
Table of Contents
constructed on site. We also sell and install flooring products, primarily as a subcontractor for the professional homebuilder, through our Coleman Floor and several other Company locations. These and other interior products typically require a higher degree of product knowledge and training to sell. As we continue to emphasize higher value-added product lines, we expect the millwork & other interior products category to contribute increasingly to our overall sales and profitability.
Lumber & lumber sheet goods. Lumber & lumber sheet goods include dimensional lumber, plywood and OSB products used in on-site house framing. In 2012, this product line was 35.5% of our net sales, and revenue dollars increased 35.0% from 2011, partly due to increases in the cost of these goods.
Windows & other exterior products. The windows & other exterior products category includes exterior door units, as well as exterior products such as roofing and siding. Selecting, designing and managing the procurement of the proper window package for performance and architectural reasons is a key service provided by our skilled employees. Additionally, our pre-hung exterior doors consist of a door slab with hinges and door jambs attached, thereby reducing on-site installation time and providing higher quality finished door units than those constructed on site.
Other building products & services. Other building products & services consist of various products, including hardware, boards and insulation. This category also includes design assistance and professional installation services of products spanning most of our product categories. Through our installation services program, we help homebuilders realize efficiencies through improved scheduling, supplier and subcontractor management, and other services resulting in reduced cycle time, simplified administration and better cost controls.
We also provide professional estimating, product advisory and product display services that assist homebuilders and their clients in selecting the appropriate mix of products to meet their needs. We believe these services require scale, capital and sophistication that smaller competitors often do not possess.
Manufacturing
Our manufacturing facilities and related design capabilities are utilized to improve quality, cost and service to our homebuilder and repair and remodel customers. We utilize specialized assembly and manufacturing technology, building science-based material selection and various design software packages to improve product quality, increase efficiency, reduce lead times and provide cost-effective products for our customers. We manufacture and assemble products within three of our product categories: structural components, millwork & other interior products, and windows & other exterior products. As the housing recovery continues, we expect the services provided by our manufacturing and design capabilities to become more important in helping our customers to meet their client and customer commitments and improve their operations. In 2012, manufactured products represented approximately 12% of our net sales.
Sales and marketing
We seek to attract and retain customers through exceptional customer service, leading product quality, broad product and service offerings, and competitive pricing. This strategy is centered on building and maintaining strong customer relationships rather than traditional marketing and advertising. We strive to add value for homebuilders through solution-based selling, improved product selection and acquisition processes, lower material costs and general project coordination and support. By executing this strategy, we believe we will continue to generate incremental sales volumes with new and existing customers.
96
Table of Contents
Our experienced sales and service professionals are at the core of our customer growth and expansion efforts. We deploy salespeople who are skilled in housing construction to meet with a homebuilder’s construction superintendent, contractor, local purchasing agent or local executive with the goal of becoming the primary product supplier. If selected by the homebuilder or contractor, the salesperson and his or her team review blueprints for the contracted homes and advise the homebuilder or contractor in areas such as opportunities for cost optimization, increased building or project efficiencies, and regional product preferences. Next, the team determines the specific package of products that are needed to complete the project and schedules a sequence of site deliveries. Our large delivery fleet and comprehensive inventory management system enable us to provide “just-in-time” product delivery, ensuring a smoother and faster production cycle for the homebuilder. Throughout the construction process, our employees make frequent site visits to ensure timely delivery and proper installation and to provide general service support. We believe this level of service is highly valued by our customers and generates significant customer loyalty. At December 31, 2012, we employed approximately 450 sales professionals.
Materials and supplier relationships
We purchase inventory primarily for distribution, some of which is also utilized in our manufacturing plants. The key materials we purchase include dimensional lumber, OSB, engineered wood, windows, doors and millwork. Our largest suppliers are national lumber and wood products producers and distributors such as BlueLinx Holdings Inc., Boise Cascade Company, Louisiana Pacific and Weyerhaeuser Company and building products manufacturers such as Jeld-Wen, inc., Moulding and Millwork Inc., MI Windows and Doors, Inc., James Hardie and Norbord, Inc. We believe there is sufficient supply in the marketplace to competitively source most of our requirements without reliance on any particular supplier and that our diversity of suppliers affords us purchasing flexibility. We also work with our suppliers to ensure that we have sufficient adaptability and flexibility to service our customer needs as they evolve and as their markets grow. Due to our centralized oversight of purchasing and our large lumber and OSB purchasing volumes, we believe we are better able to maximize the advantages of both our, and our suppliers’, broad footprints and negotiate purchases in multiple markets to achieve more favorable contracts with respect to price, terms of sale, and supply than our regional competitors. Additionally, for certain customers, we institute purchasing programs on raw materials such as OSB to align portions of our procurement costs with our customer pricing commitments. We balance our lumber and OSB purchases with a mix of contract and spot market purchases to ensure consistent quantities of product necessary to fulfill customer contracts, to source products at the lowest possible cost, and to minimize our exposure to the volatility of commodity lumber prices.
We currently source products from over 1,000 suppliers in order to reduce our dependence on any single company and to maximize purchasing leverage. Although no materials purchases from any single supplier represented more than 10% of our total materials purchases in 2012, we believe we are one of the largest customers for many suppliers, and therefore have significant purchasing leverage. We have found that using multiple suppliers ensures a stable source of products and the best purchasing terms as the suppliers compete to gain and maintain our business.
We seek to maintain strong relationships with our suppliers, and we believe opportunities exist to improve purchasing terms in the future, including inventory storage or “just-in-time” delivery to reduce our inventory carrying costs. We will continue to pursue additional procurement cost savings and purchasing synergies which would further enhance our gross margins and cash flow.
97
Table of Contents
Competition
We compete in the professional building contractor segment of the U.S. residential new construction building products supply market (the “Pro Segment”). Our customers primarily consist of professional homebuilders and those that provide construction services to them. We focus on a distinctly different target market than home center retailers such as The Home Depot and Lowe’s, which currently primarily serve do-it-yourself and remodeling customers. The principal methods of competition in the Pro Segment are the development of long-term relationships with professional builders and retaining such customers by delivering a full range of high-quality products on time and offering trade credit, competitive pricing, flexibility in transaction processing, and integrated service and product packages, as well as offering value-added products and services such as structural components and installation. Our leading market positions in the highly competitive Pro Segment create economies of scale that allow us to supply our customers cost-effectively, which both enhances profitability and reduces the risk of losing customers to competitors.
Due to the current market conditions, we have and will continue to experience competition for homebuilder business. Many of our competitors are predominantly small, privately owned companies, local and regional materials distributors, single or multi-site lumberyards, and truss manufacturing and millwork operations. Most of these companies have limited access to capital and lack sophisticated information technology systems and large-scale procurement capabilities. We believe we have substantial competitive advantages over these smaller competitors due to our long-standing customer relationships, local market knowledge, integrated supply chain and competitive pricing. Our largest competitors in our markets include 84 Lumber Co., Builders FirstSource, Inc., Building Materials Holding Corporation and Pro-Build Holdings, Inc.
Employees
At March 31, 2013, we had approximately 2,557 full-time equivalent employees, none of whom were represented by a union. We believe that we have good relations with our employees. Additionally, we believe that the training provided through our ongoing development programs to our professional employees and an entrepreneurial, performance-based culture provide significant benefits to our customers.
Information technology systems
Our primary ERP system, which we use for all of our operations, was purchased from NxTrend (now a division of Infor) and has been highly customized for our needs. The system has been designed to operate our businesses in a highly efficient manner. The materials required for thousands of standard builder plans are stored by the system for rapid quoting or order entry. Hundreds of price lists are maintained on thousands of SKUs, facilitating rapid price changes in a changing product cost environment. A customer’s order can be tracked at each stage of the process and billing can be customized to reduce a customer’s administrative costs and speed payment. As this ERP platform supported our business in 2006 when our volumes, locations and revenues were significantly larger, we believe this platform to be scalable and able to support our growth.
We have a single financial reporting system that has been highly customized for our business. Consolidated financial, sales and workforce reporting is integrated using Oracle Business Intelligence system and custom databases, which aggregates data from our ERP systems along with workforce information from our third-party payroll administrator. This technology platform provides management with robust corporate and location level performance management by leveraging standardized metrics and analytics allowing us to plan, track and report performance and compensation measures.
We utilize proprietary software, Stock Logistics Solutions, in our distribution operations, which schedules orders from our ERP for delivery, utilizes GPS and mobile technology in our delivery fleet
98
Table of Contents
and provides customers with real-time information on their order status, including notification and pictures of completed deliveries. In addition, we have purchased several software products that have been integrated with our primary ERP system. These programs assist in the design and manufacture of structural components, analyzing blueprints to generate material lists and in purchasing lumber products at the lowest cost.
Seasonality and other factors
See “Management’s Discussion and Analysis of Financial Condition and Results of Operations—Factors affecting our operating results—Seasonality” for a discussion of seasonality and other factors contributing to variability in our quarterly results.
Intellectual property
We possess an array of intellectual property rights, including patents, trademarks, trade names, proprietary technology and know-how and other proprietary rights that are important to our brand and marketing strategy. In particular, we maintain registered trademarks for Stock Building Supply® and our logo, as well as for Fortis® and Artrim®, two of our private label lines. In addition, we maintain registered trademarks for the trade names under which many of our local branches operate. While we do not believe our business is dependent on any one of our trademarks, we believe that our trademarks are important to the development and conduct of our business as well as the marketing of our products. We vigorously protect all of our intellectual property rights.
Properties
We have a broad network of distribution and manufacturing operations across 65 facilities in 13 states throughout the eastern, southern and western United States. These branches are supported from our headquarters in Raleigh, North Carolina. Many of our operations are co-located within a single facility: we have 48 distribution and retail operations, 19 millwork fabrication operations, 14 structural component fabrication operations, and 13 flooring distribution operations. Our distribution and manufacturing facilities and their related uses are summarized in the table below.
| Facility use | ||||||||||||||||||||||||
| State |
Total # of properties |
Approximate aggregate square footage of buildings (millions) |
Distribution & retail operations |
Millwork fabrication |
Structural components fabrication |
Flooring operations |
||||||||||||||||||
| Arkansas |
1 | 0.27 | 1 | 1 | 1 | |||||||||||||||||||
| California |
13 | 0.34 | 11 | 2 | 1 | |||||||||||||||||||
| Georgia |
4 | 0.29 | 3 | 2 | 2 | |||||||||||||||||||
| Idaho |
1 | 0.04 | 1 | |||||||||||||||||||||
| Maryland |
1 | 0.01 | 1 | |||||||||||||||||||||
| New Mexico |
2 | 0.10 | 1 | 1 | 1 | |||||||||||||||||||
| North Carolina |
10 | 0.83 | 5 | 1 | 2 | 5 | ||||||||||||||||||
| Pennsylvania |
1 | 0.17 | 1 | 1 | 1 | |||||||||||||||||||
| South Carolina |
8 | 0.30 | 4 | 1 | 1 | 3 | ||||||||||||||||||
| Texas |
10 | 1.42 | 10 | 3 | 3 | |||||||||||||||||||
| Utah |
7 | 0.31 | 6 | 4 | 2 | |||||||||||||||||||
| Virginia |
6 | 0.33 | 4 | 3 | 1 | 2 | ||||||||||||||||||
| Washington |
1 | 0.05 | 1 | 1 | ||||||||||||||||||||
| Raleigh, NC Corporate Office |
1 | 0.04 | ||||||||||||||||||||||
|
|
|
|
|
|
|
|
|
|
|
|
|
|||||||||||||
| Total |
66 | 4.50 | 48 | 19 | 14 | 13 | ||||||||||||||||||
|
|
|
|
|
|
|
|
|
|
|
|
|
|||||||||||||
99
Table of Contents
Distribution and retail facilities generally include five to 25 acres of outside storage, a 30,000 to 60,000 square foot warehouse, office and product display space, and 15,000 to 30,000 square feet of covered storage. The outside area provides space for lumber storage and a staging area for delivery while the warehouse stores millwork, windows and doors. The distribution facilities are usually located in industrial areas with low cost real estate and easy access to freeways to maximize distribution efficiency and convenience. In most markets, at least one of the distribution and retail facilities is situated on a rail line to facilitate the procurement of dimensional lumber in rail car quantities and minimize our cost of goods.
Our fabrication operations produce roof and floor trusses, wall panels, pre-cut engineered wood, stairs, windows, pre-hung interior and exterior doors and custom millwork. In most cases, they are located on the same premises as our distribution and retail facilities, which facilitates the efficient distribution of product to customers. Millwork fabrication operations typically vary in size from 5,000 square feet to 50,000 square feet of warehouse space to accommodate fabrication lines and the storage of base components and finished goods. Structural component fabrication operations vary in size from 20,000 square feet to 50,000 square feet with 5 to 25 acres of outside storage for lumber and for finished goods.
We lease 55 facilities and own 11 facilities. Our leases typically have an initial operating lease term of five to ten years and most provide options to renew for specified periods of time. A majority of our leases provide for fixed annual rentals. Certain of our leases include provisions for escalating rent, as an example, based on changes in the consumer price index. Most of the leases require us to pay taxes, insurance and maintenance expenses associated with the properties.
As of December 31, 2012, we operate a fleet of approximately 565 trucks to deliver products from our distribution and manufacturing centers to job sites. Through our emphasis on efficient scheduling and material handling processes and strategically placed locations, we minimize shipping and freight costs, which are largely passed onto our customers, while maintaining a high degree of local market expertise. We also employ a sales, inventory and operations planning process to forecast local customer demand and adjust product replenishment levels, thereby minimizing working capital requirements while guarding against out-of-stock products. We believe that this reliability is highly valued by our customers and reinforces customer relationships.
Regulation and legislation
While we are not engaged in a “regulated industry,” we are subject to various federal, state and local government regulations applicable to the business generally in the jurisdictions in which we operate, including laws and regulations relating to our relationships with our employees, public health and safety, work place safety, transportation, zoning and fire codes. We strive to operate each of our distribution, manufacturing, retail and service facilities in accordance with applicable laws, codes and regulations.
Our operations in domestic interstate commerce are subject to the regulatory jurisdiction of the DOT, which has broad administrative powers with respect to our transportation operations. We are subject to safety requirements governing interstate operations prescribed by the DOT. Vehicle dimension and driver hours of service also are subject to both federal and state regulation. See “Risk Factors—Federal, state, local and other regulations could impose substantial costs and/or restrictions on our operations that would reduce our net income.” Our operations are also subject to the regulatory jurisdiction of OSHA, which has broad administrative powers with respect to workplace and jobsite safety.
Our operations and properties are also subject to federal, state and local laws and regulations relating to the use, storage, handling, generation, transportation, treatment, emission, release, discharge and disposal of hazardous materials, substances and wastes and relating to the investigation and cleanup of contaminated properties, including off-site disposal locations. We have not incurred material costs in the past to comply with environmental laws and regulations. However, we could be subject to material costs,
100
Table of Contents
liabilities or claims relating to environmental compliance in the future, especially in the event of changes in existing laws and regulations or in their interpretation or enforcement.
As owners, lessees and operators of current and former real property, we can be held liable for the investigation or remediation of contamination on or from such properties, in some circumstances irrespective of whether we knew of or caused such contamination. Our current expenditures with respect to environmental investigation and remediation at our facilities are immaterial, although no assurance can be provided that more significant investigation and remediation will not be required in the future as a result of spills or releases of petroleum products or other hazardous substances or the discovery of currently unknown environmental conditions, or changes in legislation, laws, rules or regulations or their interpretation or enforcement.
Our suppliers are subject to various laws and regulations, including in particular laws and regulations regulating labor, forestry and the environment. We consult with our suppliers as appropriate to confirm they have determined they are in material compliance with applicable laws and regulations. Generally, our suppliers agree contractually to comply with our expectations concerning environmental, labor and health and safety matters.
Products that we import into the United States are subject to laws and regulations imposed in conjunction with such importation, including those issued and/or enforced by U.S. Customs and Border Protection. In addition, certain of our products are subject to laws and regulations relating to the importation, acquisition or sale of illegally harvested agricultural products and the emissions of hazardous materials. We work closely with our suppliers to help ensure material compliance with the applicable laws and regulations in these areas.
To date, costs to comply with applicable laws and regulations relating to the protection of the environment and natural resources have not had a material adverse effect on our financial condition or operating results. However, there can be no assurance that such laws and regulations will not become more stringent in the future or that we will not incur costs in the future in order to comply with such laws and regulations. We do not anticipate material capital expenditures for environmental controls in the current or subsequent fiscal year.
Legal proceedings
We are currently involved in various claims and lawsuits incidental to the conduct of our business in the ordinary course. We carry insurance coverage in such amounts in excess of our self-insured coverage as we believe to be reasonable under the circumstances, although insurance may or may not cover any or all of our liabilities in respect of claims and lawsuits. We do not believe that the ultimate resolution of these matters will have a material adverse effect on our consolidated financial position, cash flows or operating results.
We are a defendant in various pending lawsuits and warranty claims arising from assertions of alleged product liability, product warranty, casualty, construction defects and other claims.
We and our subsidiaries may be indemnified against certain losses to the extent arising from actions taken by the Company prior to May 5, 2009. See “Certain Relationship and Related Party Transactions—Restructuring and investment agreement.”
101
Table of Contents
Below is a list of names, ages and a brief account of the business experience of our executive officers and directors, each as of July 30, 2013.
| Name |
Age | Position/title | ||
| Executive officers |
||||
| Jeffrey G. Rea |
48 | President and Chief Executive Officer and Director | ||
| James F. Major, Jr. |
41 | Executive Vice President, Chief Financial Officer and Treasurer | ||
| Bryan J. Yeazel |
38 | Executive Vice President, Chief Administrative Officer, General Counsel and Corporate Secretary | ||
| James F. Drexinger |
53 | Divisional President and General Manager — South Division | ||
| Walter Philip Randolph |
50 | Divisional President and General Manager — East Division | ||
| Duff R. Wakefield |
57 | Divisional President and General Manager — West Division | ||
| Steven W. Wilson |
49 | Divisional President and General Manager — Coleman Floor Division | ||
| Directors |
||||
| Timothy P. Meyer |
46 | Director and Chairman of the Board | ||
| Andrew Freedman |
51 | Director | ||
| Barry J. Goldstein |
70 | Director | ||
| Robert E. Mellor |
69 | Director | ||
| Ryan Wald |
38 | Director | ||
| Steven C. Yager |
59 | Director | ||
Jeffrey G. Rea, President and Chief Executive Officer and Director
Mr. Rea became our president and chief executive officer and a director in November 2010. Before joining our Company, he served as president of the specialty products group at TE Connectivity Ltd. (“TEL”) from 2008 to 2010. Prior to TEL, Mr. Rea was the senior vice president of the building products group at Johns Manville, a global manufacturer of highly engineered materials and building products, which is owned by Berkshire Hathaway Company, a position he held in 2006 and 2007. Mr. Rea joined Johns Manville in 2002 as a vice president and general manager of its building insulation business. Before joining Johns Manville, Mr. Rea served 15 years in various leadership roles at General Electric Company, including five years with its corporate audit staff. Mr. Rea received a degree in mechanical engineering from Rose-Hulman Institute of Technology. Mr. Rea’s position as our president and chief executive officer allows him to advise the board of directors on management’s perspective over a full range of issues affecting our Company.
James F. Major, Jr., Executive Vice President, Chief Financial Officer and Treasurer
Mr. Major has been an executive officer of the Company since 2005 and is currently our executive vice president, chief financial officer and treasurer, and is responsible for finance, credit and information technology activities. Mr. Major has substantial expertise in financial planning, analysis and reporting, tax planning and compliance. Mr. Major joined our Company in 1998 as assistant controller. Prior to that, he was an audit manager with PricewaterhouseCoopers LLP. Mr. Major received a bachelor’s degree from Wake Forest University in 1993. He is a certified public accountant and has attended management programs at the Darden School of Business of the University of Virginia and the International Institute for Management Development in Lausanne, Switzerland.
102
Table of Contents
Bryan J. Yeazel, Executive Vice President, Chief Administrative Officer, General Counsel and Corporate Secretary
Mr. Yeazel has been an executive officer of the Company since 2005 and is currently our executive vice president, chief administrative officer, general counsel and corporate secretary. Mr. Yeazel manages key administrative functions including legal, human resources, marketing, health and safety, and integrated supply chain. Prior to joining our Company, he was with Hunton & Williams LLP in its global capital markets and mergers and acquisitions practice group, and with Capital One Financial. Mr. Yeazel holds a bachelor’s degree from Wake Forest University and a juris doctor from the University of Notre Dame. In addition, he has attended executive education programs at the International Institute for Management Development in Lausanne, Switzerland and Harvard Business School.
James F. Drexinger, Divisional President and General Manager — South Division
Mr. Drexinger has been the divisional president and general manager of the Company’s South Division since January 2012. In this role, Mr. Drexinger oversees the Company’s operations in Texas, Arkansas and Georgia. Prior to this position, Mr. Drexinger served as executive vice president and chief supply chain officer for the Company from 2009 to 2012. From 2007 to 2009, Mr. Drexinger served as vice president of sourcing, business groups, and marketing for Wolseley Investments North America, the management group responsible for Wolseley’s North American businesses. Prior to joining Wolseley, Mr. Drexinger served as senior vice president and general manager at NIBCO, Inc., a plumbing products manufacturer, and prior to that, Mr. Drexinger spent 13 years at Armstrong World Industries, Inc. in various finance, sales management and marketing leadership positions. Mr. Drexinger received a bachelor’s degree from Lehigh University and a master’s degree in business administration from Shippensburg University. In addition, he attended the advanced management program at Harvard Business School, as well as executive education programs at the International Institute for Management Development in Lausanne, Switzerland.
Walter Philip Randolph, Divisional President and General Manager — East Division
Mr. Randolph has been the divisional president and general manager of the Company’s East Division since 2010. In this role, Mr. Randolph oversees the Company’s operations in Pennsylvania, Washington, D.C., Virginia, North Carolina and South Carolina. Mr. Randolph joined the Company in 2004 and has held a variety of positions of increasing responsibility since that time. Prior to joining the Company, from 1998 to 2003, Mr. Randolph served at The Lumber Yard, a division of The Wolf Organization, Inc., where he eventually served as president. Prior to that, he was the regional vice president for the South and Mid-Atlantic regions of 84 Lumber Company. Mr. Randolph received a bachelor’s degree from James Madison University and attended executive education programs at the Darden School of Business of the University of Virginia.
Duff R. Wakefield, Divisional President and General Manager — West Division
Mr. Wakefield has been the divisional president and general manager of the Company’s West Division since 2011. In this role, Mr. Wakefield, oversees the Company’s operations in West Texas, New Mexico, Utah, Washington, Idaho and California. Mr. Wakefield joined the Company in 1985 and has served in a variety of positions of increasing responsibility, including West Division manager and district manager overseeing the Company’s operations in Utah, Idaho, and Wyoming, and market manager for the Salt Lake City area. Mr. Wakefield has attended executive education programs at the Darden School of Business of the University of Virginia and the International Institute for Management Development in Lausanne, Switzerland.
103
Table of Contents
Steven W. Wilson, Divisional President and General Manager — Coleman Floor Division
Mr. Wilson has been the divisional president and general manager of the Company’s Coleman Floor Division since 2010 . In this role, Mr. Wilson is responsible for overseeing the flooring products and installation services for residential construction provided by the Company. Prior to joining the Company he was a branch and district manager for Creative Touch Interiors, a division of HD Supply, Inc. from 2004 to 2010. Prior to HD Supply, Inc., Mr. Wilson was a consultant with Deloitte Consulting LLP and PRTM, a management consulting subsidiary of PricewaterhouseCoopers LLP. Mr. Wilson received a bachelor’s degree from the Virginia Military Institute and a master’s degree in business administration from the Kenan Flagler Business School at the University of North Carolina, Chapel Hill.
Andrew Freedman, Director
Mr. Freedman has served as one of our directors since July 2010. Mr. Freedman has been a managing director at Glendon Partners, Inc. (“Glendon”), an affiliate of Gores, since January 2010. At Glendon, Mr. Freedman is responsible for portfolio company financial oversight and control, and leading financial due-diligence activities. Mr. Freedman also served at Gores as senior vice president finance from June 2003 until January 2010. Prior to joining Gores, Mr. Freedman was the chief financial officer of The Learning Company. From 1994 to 2002, he held various financial management roles at The Learning Company, Broderbund Software, Inc. and Mindscape Inc. From 1988 to 1994, Mr. Freedman held various financial management positions at Paramount Communications Group. Prior to that, Mr. Freedman spent four years in public accounting. Mr. Freedman serves on the boards of directors of Cosmo Specialty Fibers, Inc., Norment Security Group, Inc., ELO Touch Solutions, Inc., Sage Automotive Group and Scovill Fasteners, Inc. He was also previously a director for National Envelope Company. Mr. Freedman received a bachelor’s degree in finance and accounting from the State University of New York at Binghamton. Mr. Freedman provides strong finance skills to our board of directors and valuable experience gained from previous and current board service.
Barry J. Goldstein, Director
Mr. Goldstein has served as one of our directors since June 2013. Mr. Goldstein retired as executive vice president and chief financial officer of Office Depot, Inc. in October 2000. He first joined Office Depot, Inc. as chief financial officer in May 1987. Mr. Goldstein was previously with Grant Thornton LLP from 1969 through May 1987, where he was named a partner in 1976. Mr. Goldstein has public company accounting experience at the highest levels and has served as the chairman of six audit committees, four of them for public companies. Mr. Goldstein currently serves on the boards of directors of Generac Holdings, Inc. and Kraton Performance Polymers, Inc. In the past five years, Mr. Goldstein also served on the boards of directors of Brand Energy & Infrastructure Services, Inc., Interline Brands, Inc., and Noble Environmental Power, LLC. Mr. Goldstein received a bachelor’s degree in economics from the Wharton School at the University of Pennsylvania. Mr. Goldstein provides strong executive, financial and corporate governance skills to our board of directors and valuable experience gained from previous and current board service.
Robert E. Mellor, Director
Mr. Mellor has served as one of our directors since March 2010. Mr. Mellor served as the chief executive officer of Building Materials Holding Corporation from 1997 to January 2010 and as a director from 1991 to January 2010. As a result of the downturn in the building materials industry, Building Materials Holding Corporation went through a Chapter 11 restructuring in 2009 and emerged from the restructuring in 2010. Prior to joining Building Materials Holding Corporation, Mr. Mellor served as the executive vice president and director of Di Giorgio Corp. and as of counsel at Gibson, Dunn & Crutcher LLP, a law firm, from 1990 to February 1997. He currently serves as the non-
104
Table of Contents
executive chairman of Coeur d’Alene Mines Corporation and the lead director of Monro Muffler Brake Inc. He is also a director of The Ryland Group, Inc. and serves on the board of councilors of Save-the-Redwoods League. He received a bachelor’s degree in economics from Westminster College and a juris doctor from the Southern Methodist University School of Law. Mr. Mellor provides strong executive and managerial skills to our board of directors and valuable experience gained from previous and current board service.
Timothy P. Meyer, Chairman of the Board
Mr. Meyer has served as chairman of our board of directors since May 2009. Mr. Meyer is a member of the investment committee of Gores and a managing director of Glendon, an affiliate of Gores. He is responsible for portfolio company oversight and leading operational due diligence efforts. Mr. Meyer joined Gores in August 2005 and subsequently joined Glendon in July 2007. Prior to joining Gores, Mr. Meyer was vice president of sales operations and general manager of business services at Gateway, Inc. Prior to Gateway, Inc., Mr. Meyer spent five years with Bain & Company in the United States and Australia. From 1990 to 1996, Mr. Meyer served in various sales leadership positions with IBM and AT&T. Mr. Meyer serves on the boards of directors of Norment Security Group, Inc., Sage Automotive Group, National Envelope Company, Scovill Fasteners, Inc. and Cosmo Specialty Fibers, Inc. Previously, he served as chairman of Lineage Power Corporation and Vincotech Gmbh and director for United Road Services, Inc. Mr. Meyer received a bachelor’s degree in finance from Texas A&M University and a master’s degree in business administration from The Wharton School of the University of Pennsylvania. Mr. Meyer provides strong executive and managerial skills to our board of directors and valuable experience gained from previous and current board service.
Ryan Wald, Director
Mr. Wald has served as one of our directors since November 2010. Mr. Wald is a managing director and member of the investment committee of Gores, and responsible for leading the execution and negotiation of certain acquisitions and divestitures for Gores in the United States. Mr. Wald joined Gores in 1999. Prior to joining Gores, Mr. Wald was in CIBC Oppenheimer’s investment banking group, where he worked on a variety of assignments, including public equity, debt security underwritings, mergers and acquisitions, and other financial advisory assignments. Mr. Wald currently serves on the boards of directors of Alpheus Communications, ELO Touch Solutions, Inc., Harris Broadcast Communications, and Equinox Payments, LLC. Mr. Wald received a bachelor’s degree in finance from the McCombs School of Business at the University of Texas at Austin. Mr. Wald provides strong executive and managerial skills to our board of directors and valuable experience gained from previous and current board service.
Steven C. Yager, Director
Mr. Yager has served as one of our directors since December 2009. Mr. Yager is senior managing director and a member of the investment committee of Gores, and is responsible for overseeing the day-to-day management of the Gores private equity funds. Mr. Yager joined Gores in 2002. Prior to joining Gores, Mr. Yager served as the president and chief executive officer of Artemis International Solutions Corporation (“Artemis”) from 1997 to 2002. At Artemis, he led a turnaround and restructuring initiative and was responsible for the sale of Artemis to Proha Oyj, a publicly-traded Finnish software company. He was subsequently responsible for the reverse merger of Artemis into Opus360 Corporation and served as its chairman until 2005. From 1994 to 1996, Mr. Yager served as the executive vice president of business development for Medaphis Physician Services Corp. Mr. Yager serves on the boards of directors of Cosmo Specialty Fibers, Inc., Siemens Enterprise Communications, Tiburon, Inc., Sage Automotive Group and Therakos, Inc. He was also previously a
105
Table of Contents
director for National Envelope Company. Mr. Yager received a bachelor’s degree in business administration and economics from the University of Michigan. Mr. Yager provides strong executive and managerial skills to our board of directors and valuable experience gained from previous and current board service.
Controlled company
For purposes of NASDAQ rules, we expect to be a “controlled company” after completion of this offering. Controlled companies under those rules are companies of which more than 50% of the voting power for the election of directors is held by an individual, a group or another company. We expect that Gores Holdings, which is controlled by Gores, will continue to control more than 50% of the combined voting power of our common stock upon completion of this offering and will continue to have the right to designate a majority of the members of our board of directors for nomination for election and the voting power to elect such directors following this offering. Accordingly, we expect to be eligible to, and we intend to, take advantage of certain exemptions from corporate governance requirements provided in NASDAQ rules. Specifically, as a controlled company, we would not be required to have (i) a majority of independent directors, (ii) a Corporate Governance and Nominating Committee composed entirely of independent directors, (iii) a Compensation Committee composed entirely of independent directors or (iv) an annual performance evaluation of the Nominating and Corporate Governance and Compensation Committees. Therefore, following this offering if we are able to rely on the “controlled company” exemption, we may not have a majority of independent directors, our Nominating and Corporate Governance and Compensation Committees may not consist entirely of independent directors and such committees may not be subject to annual performance evaluations. Accordingly, you will not have the same protections afforded to stockholders of companies that are subject to all of the applicable NASDAQ rules.
The controlled company exemption does not modify the independence requirements for the Audit Committee, and we intend to comply with the requirements of the Sarbanes-Oxley Act and the NASDAQ rules, which require that our Audit Committee be composed of at least three members, one of whom will be independent upon the listing of our common stock on NASDAQ, a majority of whom will be independent within 90 days of the date of this prospectus, and each of whom will be independent within one year of the date of this prospectus.
Composition of the board of directors
Our board of directors will initially consist of seven directors. Our board of directors has determined that Messrs. Goldstein and Mellor are “independent directors” as that term is defined in the listing standards of the NASDAQ. The authorized number of directors may be changed by resolution of our board of directors. Vacancies on our board of directors can be filled by resolution of our board of directors. Upon the completion of this offering, our board of directors will be divided into three classes, each serving staggered, three-year terms:
| Ÿ | Our Class I directors will be Robert E. Mellor and Jeffrey G. Rea, and their terms will expire at the first annual meeting of stockholders following the date of this prospectus; |
| Ÿ | Our Class II directors will be Barry J. Goldstein and Andrew Freedman, and their terms will expire at the second annual meeting of stockholders following the date of this prospectus; and |
| Ÿ | Our Class III directors will be Timothy P. Meyer, Ryan Wald and Steven C. Yager, and their terms will expire at the third annual meeting of stockholders following the date of this prospectus. |
As a result, only one class of directors will be elected at each annual meeting of stockholders, with the other classes continuing for the remainder of their respective terms.
106
Table of Contents
In connection with this offering, we will enter into a Director Nomination Agreement with Gores Holdings that provides Gores Holdings the right to designate nominees for election to our board of directors for so long as Gores Holdings beneficially owns 10% or more of the total number of shares of our common stock then outstanding. Gores may cause Gores Holdings to assign its designation rights under the Director Nomination Agreement to Gores or to a Gores affiliate so long as Gores and its affiliates are the beneficial owners of 50% or more of Gores Holding’s voting equity interests.
The number of nominees that Gores Holdings is entitled to designate under this agreement will bear the same proportion to the total number of members of our board of directors as the number of shares of common stock beneficially owned by Gores Holdings bears to the total number of shares of common stock outstanding, rounded up to the nearest whole number. In addition, Gores Holdings shall be entitled to designate the replacement for any of its board designees whose board service terminates prior to the end of the director’s term regardless of Gores Holdings’ beneficial ownership at such time. Gores Holdings shall also have the right to have its designees participate on committees of our board of directors proportionate to its stock ownership, subject to compliance with applicable law and stock exchange rules. This agreement will terminate at such time as Gores Holdings owns less than 10% of our outstanding common stock.
Committees of the board of directors
We expect that, immediately following this offering, the standing committees of our board of directors will consist of an Audit Committee, a Compensation Committee and a Corporate Governance and Nominating Committee. Each of the committees will report to the board of directors as they deem appropriate and as the board of directors may request. The expected composition, duties and responsibilities of these committees are set forth below.
Audit committee
The Audit Committee will be responsible for, among other matters: (i) appointing, retaining and evaluating our independent registered public accounting firm and approving all services to be performed by them; (ii) overseeing our independent registered public accounting firm’s qualifications, independence and performance; (iii) overseeing the financial reporting process and discussing with management and our independent registered public accounting firm the interim and annual financial statements that we file with the SEC; (iv) reviewing and monitoring our accounting principles, accounting policies, financial and accounting controls and compliance with legal and regulatory requirements; (v) establishing procedures for the confidential anonymous submission of concerns regarding questionable accounting, internal controls or auditing matters; (vi) overseeing risk of financial misstatement and discussing the policies governing the process by which risk assessment and risk management is undertaken and (vii) reviewing and approving related person transactions.
Immediately following this offering, our Audit Committee will consist of Messrs. Freedman, Goldstein and Mellor. We believe that Messrs. Goldstein and Mellor qualify as an independent directors according to the rules and regulations of the SEC with respect to audit committee membership. We expect to have a fully independent Audit Committee within one year of the effective date of the registration statement in order to comply with applicable rules and regulations of our stock exchange.
We also believe that Mr. Goldstein qualifies as our “audit committee financial expert,” as such term is defined in Item 401(h) of Regulation S-K. Our board of directors will adopt a written charter for the Audit Committee in connection with this offering, which will be available on our corporate website at www.stocksupply.com upon the completion of this offering. The information on our website is not part of this prospectus.
107
Table of Contents
Compensation committee
The Compensation Committee will be responsible for, among other matters: (i) reviewing key employee compensation goals, policies, plans and programs; (ii) reviewing and approving the compensation of our directors, chief executive officer and other executive officers; (iii) reviewing and approving employment agreements and other similar arrangements between us and our executive officers and (iv) administering our stock plans and other incentive compensation plans.
Immediately following this offering, our Compensation Committee will consist of Messrs. Meyer, Mellor and Wald. Our board of directors will adopt a written charter for the Compensation Committee in connection with this offering, which will be available on our corporate website at www.stocksupply.com upon the completion of this offering. The information on our website is not part of this prospectus.
Corporate governance and nominating committee
Our Corporate Governance and Nominating Committee will be responsible for, among other matters: (i) identifying individuals qualified to become members of our board of directors, consistent with criteria approved by our board of directors; (ii) overseeing the organization of our board of directors to discharge the board’s duties and responsibilities properly and efficiently; (iii) identifying best practices and recommending corporate governance principles and (iv) developing and recommending to our board of directors a set of corporate governance guidelines and principles applicable to us.
Immediately following this offering, our Corporate Governance and Nominating Committee will consist of Messrs. Freedman, Meyer and Rea. Our board of directors will adopt a written charter for the Corporate Governance and Nominating Committee in connection with this offering, which will be available on our corporate website at www.stocksupply.com upon the completion of this offering. The information on our website is not part of this prospectus.
Compensation committee interlocks and insider participation
During 2012, no officer or employee served as a member of our Compensation Committee. None of our executive officers serve as a member of the board of directors or compensation committee of any entity that has one or more executive officers serving on our board of directors or Compensation Committee.
Other committees
Our board of directors may establish other committees as it deems necessary or appropriate from time to time.
Risk oversight
Our board of directors will oversee the risk management activities designed and implemented by our management. The board of directors will execute its oversight responsibility for risk management both directly and through its committees. The full board of directors will also consider specific risk topics, including risks associated with our strategic plan, business operations and capital structure. In addition, the board of directors will receive detailed regular reports from members of our senior management and other personnel that include assessments and potential mitigation of the risks and exposures involved with their respective areas of responsibility.
Our board of directors will delegate to the Audit Committee oversight of our risk management process. Our other board committees will also consider and address risk as they perform their respective committee responsibilities. All committees will report to the full board of directors as appropriate, including when a matter rises to the level of a material or enterprise level risk.
108
Table of Contents
Family relationships
There are no family relationships among any of our executive officers or any of the persons to be nominated as our directors prior to the consummation of this offering.
Code of business ethics and conduct
We expect our board of directors to adopt a code of business ethics and conduct. The code of business ethics and conduct will apply to all of our employees, officers and directors. The full text of our code of business ethics and conduct will be posted on our website. If we amend or grant a waiver of one or more of the provisions of our code of business ethics and conduct, we intend to satisfy the requirements under Item 5.05 of Form 8-K regarding the disclosure of amendments to or waivers from provisions of our code of business ethics and conduct that apply to our principal executive officer, financial and accounting officers by posting the required information on our website. The information contained on our website is not part of this prospectus.
Director compensation
The following table presents the total compensation for each person who served as a non-employee member of our board of directors during 2012. Other than as set forth in the table and described more fully below, we did not pay any compensation, make any equity awards or non-equity awards to, or pay any other compensation to any of the other non-employee members of our board of directors in 2012. Mr. Rea, our Chief Executive Officer, receives no compensation for his service as a director. The compensation received by Jeff Rea as an employee of the Company is presented in “Executive Compensation—Summary compensation table.”
Director compensation table
| Name |
Fees earned or paid in cash ($) |
Stock awards ($)(1) |
Option awards ($)(1) |
Non-equity incentive plan compensation ($) |
Nonqualified deferred compensation earnings ($) |
All other compensation ($) |
Total ($) |
|||||||||||||||||||||
| Timothy P. Meyer |
— | — | — | — | — | — | — | |||||||||||||||||||||
| Andrew Freedman |
— | — | — | — | — | — | — | |||||||||||||||||||||
| Robert E. Mellor |
$ | 60,000 | (2) | — | — | — | — | — | $ | 60,000 | ||||||||||||||||||
| Ryan Wald |
— | — | — | — | — | — | — | |||||||||||||||||||||
| Steven C. Yager |
— | — | — | — | — | — | — | |||||||||||||||||||||
| (1) | As of December 31, 2012, Mr. Mellor had 38,595 shares and 64,930 options outstanding. |
| (2) | Consists of a $15,000 and $12,500 fee for each board meeting attended in person or telephonically, respectively. |
Prior to this offering, the fees earned by Mr. Mellor were determined according to the rate customarily paid to outside directors of Gores portfolio companies at the time Mr. Mellor joined our board.
We will adopt a compensation policy with respect to our directors in contemplation of the completion of this offering. All members of our board of directors that are not employed by the Company or one of its subsidiaries will be entitled to receive compensation for their services to the board of directors and related committees pursuant to the policy described below.
109
Table of Contents
Following this offering, the annual fees paid to our non-employee directors will be as follows:
| Description |
Amount | |
| Annual retainer |
$50,000 | |
| Additional annual retainer for chair of the board of directors |
$40,000 | |
| Additional annual retainer for committee membership |
$10,000 for membership on the Audit Committee, Compensation Committee or Nominating and Corporate Governance Committee | |
| Additional annual retainer for chair of committee |
$10,000 for chair of Audit Committee, Compensation Committee or Nominating and Corporate Governance Committee |
All of the annual fees payable to our non-employee directors who are affiliated with Gores may be paid directly to Gores or as otherwise directed by Gores.
All directors will also be entitled to be reimbursed for their reasonable expenses to attend meetings of our board of directors and related committees and otherwise attend to our business.
All directors will also be eligible to receive stock options and other equity or cash-based awards, when and as determined by the Compensation Committee, pursuant to the 2013 Incentive Plan. In addition, following this offering, our non-employee directors unaffiliated with Gores will be entitled to the following equity awards:
Initial Restricted Stock Unit Grant. Concurrently with or upon completion of this offering, Messrs. Goldstein and Mellor will each receive a grant of $70,000 worth of restricted stock units. The actual number of restricted stock units awarded will be based upon the price at which the underlying shares of common stock are sold to the public in this offering. Upon first appointment or election to the board of directors, we expect that each non-employee director will also receive a grant of $70,000 worth of restricted stock units. These restricted stock units will vest on the second anniversary of the grant date.
Annual Restricted Stock Grant. On an annual basis, we expect that each of our non-employee directors unaffiliated with Gores then in office will receive a grant of $70,000 worth of restricted stock units on the date of our annual meeting of stockholders. These restricted stock units will vest on the date of the next annual meeting of stockholders.
All of our non-employee directors will have the option to defer all or any portion of their annual fees in exchange for receipt of fully vested deferred stock units, which will provide for payment of shares of common stock on a future date selected by the non-employee director at the time of the deferral election.
All of our non-employee directors unaffiliated with Gores will also be expected to comply with stock ownership guidelines, under which they are expected to hold at least two times the annual cash retainer in stock or stock equivalents, subject to a three-year phase-in period following this offering or from the date of appointment for newly-elected directors.
110
Table of Contents
The following section provides compensation information pursuant to the scaled disclosure rules applicable to “emerging growth companies” under the rules of the SEC and may contain statements regarding future individual and company performance targets and goals. These targets and goals should not be understood to be statements of management’s expectations or estimates of results or other guidance. We specifically caution investors not to apply these statements to other contexts.
Overview
Historically, our board of directors has set the compensation of our executive officers. The primary objectives of our executive compensation program have been to:
| Ÿ | attract, engage, and retain superior talent who contribute to our long-term success; |
| Ÿ | motivate, inspire and reward executive officers whose knowledge, skills and performance are critical to our business; |
| Ÿ | ensure compensation is aligned with our corporate strategies and business objectives; and |
| Ÿ | provide our executive officers with incentives that effectively align their interests with those of our stockholders. |
Executive compensation design overview
Historically, our executive compensation program has reflected our growth and development oriented corporate culture. To date, the compensation of our Named Executive Officers has consisted of a combination of base salary, discretionary cash bonuses and long-term incentive compensation in the form of restricted stock or stock options. Our executive officers and all salaried employees also are eligible to receive health and welfare benefits. Pursuant to employment agreements, the Named Executive Officers are also eligible to receive certain payments and benefits upon termination of employment under certain circumstances, as well as acceleration of vesting of certain outstanding equity awards in connection with a change in control of the Company. As we transition from a private company to a publicly-traded company, we will evaluate our philosophy and compensation plans and arrangements as circumstances require. At a minimum, we expect to review executive compensation annually.
Risk assessment and compensation practices
Our management assesses and discusses with the board of directors our compensation policies and practices for our employees as they relate to our overall risk management, and based upon this assessment, we believe that any risks arising from such policies and practices are not reasonably likely to have a material adverse effect on us.
Compensation of named executive officers
Base salaries
Our board of directors reviews the base salaries of our executive officers, including the Named Executive Officers, from time to time and makes adjustments as it determines to be reasonable and necessary. The current base salaries of the Named Executive Officers are as follows:
| Named Executive Officer |
Base Salary | |||
| Jeffrey G. Rea |
$ | 600,000 | ||
| James F. Major, Jr. |
$ | 325,000 | ||
| Bryan J. Yeazel |
$ | 300,000 | ||
111
Table of Contents
Our board of directors has authorized an increase in the base salaries of Messrs. Major and Yeazel, to be effective upon completion of this offering, in connection with the amendment and restatement of their respective employment agreements. See “—Employment and post-termination arrangements.” The base salaries for each of our Named Executive Officers at completion of this offering will be as follows:
| Named Executive Officer |
Base Salary | |||
| Jeffrey G. Rea |
$ | 600,000 | ||
| James F. Major, Jr. |
$ | 350,000 | ||
| Bryan J. Yeazel |
$ | 350,000 | ||
Management Incentive Plan
We maintain an annual cash incentive compensation plan, the Management Incentive Plan (the “MIP”), for purposes of providing cash incentive compensation opportunities to our executive officers for the achievement of performance goals established by our board of directors at the beginning of each fiscal year. Under the MIP for 2012 (the “2012 MIP”) and pursuant to their employment agreements, our board of directors established the following target bonus opportunities for each of our Named Executive Officers.
| Named Executive Officer |
Target award as a percentage of base salary |
|||
| Jeffrey G. Rea |
75 | % | ||
| James F. Major, Jr. |
100 | % | ||
| Bryan J. Yeazel |
100 | % | ||
Under the 2012 MIP, each Named Executive Officer was eligible to receive a maximum award equal to 200% of his target award opportunity based on the Company’s achievement against financial targets established by our board of directors for (i) Adjusted Gross Profit, (ii) Adjusted EBITDA and (iii) Ending Liquidity. In addition, the board also took into consideration each of the following performance goals: (i) the Company’s safety performance, as measured by OSHA recordable rate and CSA Basic scores; (ii) the Company’s customer service rating, as measured by our On-Time, In-Full metrics and (iii) each Named Executive Officer’s individual rating, based on a 9-block grid based on performance and leadership. The performance goals were not thresholds required to be satisfied in order to receive a bonus, but were factors to be considered by the board in determining whether an adjustment to an individual’s award should be made in the board’s discretion.
As used in the 2012 MIP, Adjusted Gross Profit means gross profit plus an adjustment of $2.5 million to add back depreciation expense included in cost of goods sold.
As used in the 2012 MIP, Ending Liquidity means excess availability on the Revolver plus cash and cash equivalents and includes a pro forma adjustment of $8.0 million to add back $23.0 million related to the payment of dividends and redemption of Class B Senior Preferred Shares and deduct $15.0 million related to the elimination of an availability restriction on the Revolver.
Under the 2012 MIP, the goal for safety performance was an OSHA incident rate of less than 3.5 with no significant DOT or fleet issues, while the goal for customer service was greater than 91% of deliveries made on-time and in-full. In 2012, the Company’s OSHA incident rate was 3.92 and the Company had no significant DOT or fleet issues. In 2012, the Company made 92.1% of its deliveries on-time and in-full.
In order to calculate the percentage of the target award to be paid out, or payout factor, for our Named Executive Officers (prior to any individual adjustment by the board of directors), the payout
112
Table of Contents
percentage for each performance metric is multiplied by its respective weight, the product of which is the payout factor for each performance metric. The payout factors for each performance metric are added to create the overall payout factor, which was 167% for 2012. For 2012, the board of directors determined that the goals had all been substantially satisfied by each of our Named Executive Officers and accordingly did not adjust the overall payout factor in light of such goals. The following table shows the financial metrics established for determining payouts under the 2012 MIP, and the calculation of the 2012 MIP payouts based on actual performance.
| Performance metrics |
Threshold | Target | Maximum | Actual 2012 results |
Weight | Factor | ||||||||||||||||||
| (dollars in thousands) | ||||||||||||||||||||||||
| Adjusted gross profit |
$ 183,150 | $203,500 | $213,675 | $217,217 | ||||||||||||||||||||
| Payout % |
25 | % | 100 | % | 200 | % | 200 | % | 33 | % | 66 | % | ||||||||||||
| Adjusted EBITDA |
$ (10,000 | ) | $ 1,300 | $ 5,000 | $ 1,993 | |||||||||||||||||||
| Payout % |
25 | % | 100 | % | 200 | % | 102 | % | 34 | % | 35 | % | ||||||||||||
| Ending liquidity |
$ 28,260 | $ 31,400 | $ 35,200 | $ 42,035 | ||||||||||||||||||||
| Payout % |
25 | % | 100 | % | 200 | % | 200 | % | 33 | % | 66 | % | ||||||||||||
|
|
|
|||||||||||||||||||||||
| Payout factor |
167 | % | ||||||||||||||||||||||
Starting with the payout factor percentage of 167% as a guideline, the board also considered the Company’s continued operational performance, the strategic transformation of the corporate headquarters and the significant progress made on our strategy, and determined that Messrs. Major and Yeazel would each receive the same award under the 2012 MIP of $450,000 (which resulted in payout factors of 164% and 180%, respectively, for Messrs. Major and Yeazel based on their target awards of 100% base salary). The board of directors did not adjust Mr. Rea’s payout factor, which remained at 167%, resulting in an award of $750,000 based on his target award of 75% base salary.
Equity awards
We use equity awards to incentivize and reward our executive officers, including the Named Executive Officers, for long-term corporate performance based on the value of our common stock and, thereby, to align the interests of our executive officers with those of our stockholders. These equity awards have either been in the form of restricted stock or stock options to purchase shares of our common stock. Messrs. Major and Yeazel were granted restricted stock at the time that Gores made its investment in 2009. Gores believed that the restricted stock more closely aligned management’s interests with Gores’ interests. At the time of these grants, Messrs. Major and Yeazel made elections under Section 83(b) of the U.S. Internal Revenue Code of 1986, as amended (the “Code”) and were therefore required to pay income tax on the fair market value of the awards. The Company advanced the amount to Messrs. Major and Yeazel in the form of loans, which were subsequently repaid. Subsequent issuances of equity to Mr. Rea in 2010 and each of our Named Executive Officers in 2012 were made in the form of options. Management expressed a preference for options rather than restricted stock because it eliminated the administrative burden associated with the loans from the Company to cover taxes triggered upon making a Section 83(b) election. Restricted stock and stock options typically vest over a four year period from the date of grant, 10% on the first anniversary, 20% on the second anniversary, 25% on the third anniversary and the remaining 45% on the fourth anniversary, subject to such Named Executive Officers’ continued employment with us.
The size of equity awards to each of the Named Executive Officers reflects such officer’s importance as an executive officer and also takes into account, among other factors, such officer’s role and responsibilities, the competitive market for executive officers, and the size, value and vesting status of existing equity awards at the time new equity awards are made. The market for quality executive officers is competitive and the Board relies on several factors to assess the competitiveness of the market including
113
Table of Contents
our primary stockholder’s experience recruiting executive officers for all of its portfolio companies and the board’s own experiences in recruiting and retaining qualified executive officers.
Compensation tables
The following table presents summary information regarding the total compensation awarded to, earned by, and paid to each individual who served as our Chief Executive Officer and the two most highly compensated executive officers (other than the Chief Executive Officer) who were serving as executive officers as of December 31, 2012 for services rendered in all capacities to the Company for the year ended December 31, 2012. These individuals are our “Named Executive Officers.”
Summary compensation table
| Name and principal position |
Year | Salary ($) |
Bonus ($) |
Stock awards ($)(1) |
Option awards ($)(2) |
Nonequity incentive plan compensation ($)(3) |
Total ($) |
|||||||||||||||||||||
| Jeffrey G. Rea |
2012 | $ | 600,000 | — | $ | 279,572 | $ | 362,082 | $ | 750,000 | $ | 1,991,654 | ||||||||||||||||
| President and Chief Executive Officer |
||||||||||||||||||||||||||||
| James F. Major, Jr. |
2012 | $ | 275,000 | — | $ | 52,540 | $ | 30,362 | $ | 450,000 | $ | 807,902 | ||||||||||||||||
| Executive Vice President, Chief Financial Officer and Treasurer |
||||||||||||||||||||||||||||
| Bryan J. Yeazel |
2012 | $ | 250,000 | $ | 32,500 | (4) | $ | 52,540 | $ | 30,362 | $ | 417,500 | $ | 782,902 | ||||||||||||||
| Executive Vice President, Chief Administrative Officer, General Counsel and Corporate Secretary |
||||||||||||||||||||||||||||
| (1) | During 2012, we cancelled 78,046 vested options and 156,040 options scheduled to vest on November 15, 2012 held by Mr. Rea, and issued, in replacement, 234,086 Class B non-voting common shares to Mr. Rea (the “Replacement Shares”) for a purchase price of $90.13. The amounts reported in this column include the repricing-date incremental fair value of the Replacement Shares, as computed in accordance with Financial Accounting Standards Board Accounting Standards Codification Topic 718 (“ASC 718”). During 2012, Mr. Rea, Mr. Major and Mr. Yeazel purchased 103,888, 51,944 and 51,944 shares of Class B common stock, respectively, for $0.97 per share. These shares were estimated to have a fair value at issuance of $1.98 per share. The amounts reported in this column include the fair value of the shares purchased in excess of the purchase price. For a discussion of valuation assumptions, see note (18) to our audited financial statements included elsewhere in this prospectus. |
| (2) | The amounts reported in this column represent the grant date fair value and repricing-date incremental fair value of the stock options granted or repriced during 2012 as computed in accordance with ASC 718. The amounts reported in this column reflect the accounting cost for these stock options and do not correspond to the actual economic value that may be received by the Named Executive Officers for the stock options. During 2012, Mr. Rea was granted 47,399 stock options with a fair value of $0.42 per share, Mr. Major was granted 24,674 stock options with a fair value of $0.42 per share and Mr. Yeazel was granted 24,674 stock options with a fair value of $0.42 per share. During 2012, we also repriced 780,329 options held by Mr. Rea. The incremental fair value of the stock options repriced for Mr. Rea was $0.19 per share. For a discussion of valuation assumptions, see note (18) to |
114
Table of Contents
| our audited financial statements included elsewhere in this prospectus. The option award amounts have been adjusted as part of the restatement of financial statements at December 31, 2012. See note (2) to our audited financial statements included elsewhere in this prospectus for further discussion. |
| (3) | The amounts reported in this column represent the actual payout earned by each of our Named Executive Officers under our 2012 MIP. |
| (4) | Represents the amount paid to Mr. Yeazel under the 2012 MIP in excess of the amount earned pursuant to the formula under the 2012 MIP. |
Outstanding equity awards at fiscal year end
The following table summarizes, for each of the Named Executive Officers, the number of shares of restricted stock and the number of shares of our common stock underlying outstanding stock options held as of December 31, 2012.
| Option awards | Stock awards | |||||||||||||||||||||||||||||||||||||||
| Name |
Vesting commencement date |
Number of securities underlying unexercised options (#) exercisable |
Number of securities underlying unexercised options (#) unexercisable |
Equity incentive plan awards: Number of securities underlying unexercised unearned options (#) |
Option exercise price ($) |
Option expiration date |
Number of shares or units of stock that have not vested (#) |
Market value of shares or units of stock that have not vested ($)(5) |
Equity incentive plan awards: Number of unearned shares, units or other rights that have not vested (#) |
Equity incentive plan awards: Market or payout value of unearned shares, units or other rights that have not vested ($) |
||||||||||||||||||||||||||||||
| Jeffrey G. Rea |
1/26/2012 | (1) | — | 47,399 | — | $ | 0.97 | 3/1/2022 | 546,244 | (2) | $ | 9,286,148 | — | — | ||||||||||||||||||||||||||
| James F. Major, Jr. |
1/26/2012 | (1) | — | 24,674 | — | $ | 0.97 | 4/11/2022 | 116,874 | (3) | $ | 1,986,858 | — | — | ||||||||||||||||||||||||||
| Bryan J. Yeazel |
1/26/2012 | (1) | — | 24,674 | — | $ | 0.97 | 4/16/2022 | 116,874 | (4) | $ | 1,986,858 | — | — | ||||||||||||||||||||||||||
| (1) | The options vest over a four-year period: as to 10% of the shares underlying the option award on the first anniversary of the vesting commencement date, 20% on the second anniversary, 25% on the third anniversary and the remaining 45% on the fourth anniversary, subject to such Named Executive Officer’s continued employment with us. |
| (2) | 195,102 of these restricted shares vest on November 15, 2013 and the remaining 351,142 shares vest on November 15, 2014. |
| (3) | These restricted shares vested on May 5, 2013. |
| (4) | These restricted shares vested on May 5, 2013. |
| (5) | There was no public market for our common stock at December 31, 2012. Accordingly, the value of the restricted stock awards is based on the midpoint of the price range set forth on the cover page of this prospectus. |
Employment and post-termination arrangements
We have employment agreements with each of our Named Executive Officers, which include provisions requiring us to make post-termination payments upon certain qualifying termination events. The employment agreements are for indefinite terms but may be terminated by either party at any time subject to the terms and conditions of each agreement. Each agreement sets forth a compensation package that includes an annual base salary and an annual bonus. The employment agreements provide for a base salary of at least $600,000, $275,000 and $250,000 and a target bonus of 75%, 100% and 100% of base salary, for Messrs. Rea, Major and Yeazel, respectively. The actual amount of the annual bonus is to be determined by the board of directors based upon percentage achievement of certain company-wide and individual performance goals for each respective calendar year. Under the employment agreements, each Named Executive Officer is eligible to participate in applicable benefit plans, policies or contracts that we adopt for U.S. employees, including our 401(k) plan, and other
115
Table of Contents
benefits and fringe benefits generally available for executive personnel. The employment agreements also provide that we are obligated to reimburse each executive for all reasonable expenses incurred in connection with performing their respective duties.
If Mr. Rea’s employment is terminated without “cause” or due to death or disability, any unvested portion of Mr. Rea’s options and restricted shares will be forfeited and we have the right to redeem any vested portion. If his employment is terminated by us for “cause,” the entire equity award will be forfeited.
If a Named Executive Officer’s employment is terminated by us without “cause” or he resigns with “good reason,” the Named Executive Officer shall be entitled to receive his annual bonus for any completed fiscal year at the same time annual bonuses would have been paid had the Named Executive Officer remained employed. If we terminate a Named Executive Officer without “cause” or if the Named Executive Officer resigns for “good reason,” then, such Named Executive Officer would be entitled to continue receiving his base salary and to be reimbursed for the marginal cost of COBRA benefits for 12 months following the separation, conditioned upon execution and delivery of a general release.
Under the employment agreements, termination for “cause” requires that the Named Executive Officer: (i) has been convicted of, or has entered a pleading of guilty or nolo contendere to, a felony (other than DUI or a similar felony) or any crime involving fraud, theft, embezzlement or other act of dishonesty involving the Company; (ii) has knowingly and intentionally participated in fraud, embezzlement or other act of dishonesty involving the Company; (iii) materially fails to attempt in good faith to perform duties required of his employment; (iv) fails to attempt in good faith to comply with a lawful directive of the board of directors, or in the case of Messrs. Major and Yeazel, the chief executive officer; (v) engages in willful misconduct as a result of which the Named Executive Officer receives a material and improper personal benefit at the expense of the Company, or accidental misconduct resulting in such a benefit which the Named Executive Officer does not promptly report and redress; (vi) in carrying out duties, engages in willful misconduct or omissions constituting gross negligence or willful misconduct resulting in substantial economic harm to the Company; (vii) has failed for any reason to correct, cease or alter any action or omission that constitutes (A) a material breach of the agreement or (B) a material breach of his duty of loyalty to the Company or (viii) has improperly disclosed any material proprietary information without authorization.
Under the employment agreements, resignation for “good reason” requires that, without the Named Executive Officer’s prior written consent, there has been: (i) a material diminution of each Named Executive Officer’s base salary or target annual bonus; (ii) a material diminution in title or authority, duties or responsibilities of the Named Executive Officer, including, in the case of Mr. Rea, the Company becoming a subsidiary or division of any other entity and the Named Executive Officer not having his current position in that entity; (iii) in the case of Mr. Rea, any requirement that Mr. Rea report to anyone but the board of directors, and in the case of Messrs. Major and Yeazel, any requirement that they report to anyone but the chief executive officer or the board of directors; (iv) any material breach by the Company of the employment agreement or other agreements with the Company or (v) in the case of Messrs. Major and Yeazel, any requirement that the Named Executive Officer relocate his personal residence to any city more than 50 miles from Raleigh, North Carolina.
The employment agreements also contain intellectual property and non-disclosure provisions and non-competition provisions that extend for 12 months after a termination of employment.
Pursuant to various equity agreements with each of our Named Executive Officers, if a Named Executive Officer’s employment is terminated without “cause” or due to death or disability, any unvested portion of such Named Executive Officer’s restricted stock and stock options will be forfeited
116
Table of Contents
and we will have the right to redeem any vested portion. If a Named Executive Officer’s employment is terminated by us for “cause,” both the vested and unvested restricted stock and stock options of such Executive will be forfeited for no consideration. However, if a “change in control” occurs and within twelve months a Named Executive Officer’s employment is terminated by us without “cause” or by such Named Executive Officer “for good reason,” the Named Executive Officer’s restricted stock and stock options will vest as if he had worked for an additional twelve months following such change in control. In the event of a liquidity event that constitutes a change in the ownership or effective control of the Company, all of the outstanding options of each Named Executive Officer will become fully vested and exercisable.
In connection with this offering, we intend to amend and restate the employment agreements with each of our Named Executive Officers. We expect that each agreement will be on substantially the same terms as the employment agreements currently in effect, except for the terms described below. We have filed a form of the amended and restated employment agreement to be entered into by each of our Named Executive Officers as an exhibit to this registration statement.
The amended and restated agreements will provide that a Named Executive Officer may resign for “good reason” upon a material diminution in the Named Executive Officer’s title, authority, duties and responsibilities compared to the title, authority, duties and responsibilities at the time of execution of the agreements; provided, however, in the case of Messrs. Major and Yeazel, that resignation for “good reason” will not include resignation, at any time before the second anniversary of the consummation of this offering, resulting from diminution of any expanded duties and responsibilities derived from the Company’s status as a public company if the Named Executive Officer has failed to adequately perform such public company duties.
Under the amended and restated agreements, upon termination without “cause” or for “good reason,” each Named Executive Officer will be entitled to (i) an amount equal to the product of (a) 2.0 in the case of Mr. Rea and 1.5 in the case of Messrs. Major and Yeazel and (b) the sum of (x) the highest annual base salary rate for such Named Executive Officer in effect over the prior two years and (y) the highest target annual bonus over the prior two years, which shall be paid over the 24 month period in the case of Mr. Rea and the 18 month period in the case of Messrs. Major and Yeazel following the separation and (ii) reimbursement for the marginal cost of COBRA benefits for 18 months following the separation. In addition, in the event that such termination occurs within 90 days preceding or 12 months following a “change in control,” or is due to death or disability, the Company will accelerate the vesting of the Named Executive Officer’s then-outstanding and unvested stock options or any other equity compensation award, to the extent that such awards would have vested solely upon the Named Executive Officer’s continued employment, such that 100% of such awards become vested in full. The term “change in control” will include the following events: (i) approval by the board of directors of a plan of liquidation, dissolution or winding-up of the Company, (ii) the consummation of a sale or other disposition of all or substantially all of the assets of the Company and its subsidiaries, (iii) any person (other than the Company, Gores Holdings or its affiliates, or any company owned, directly or indirectly, by the stockholders of the Company in substantially the same proportions as their ownership of common stock of the Company), becoming the beneficial owner, directly or indirectly, of securities of the Company representing more than 50% of the combined voting power of the Company’s then outstanding securities, and (iv) subject to certain exceptions, a merger or consolidation of the Company. Under the amended and restated agreements, the consummation of this offering or the decrease of the equity holdings of Gores Holdings or any of its affiliates in the Company, will not constitute a “change in control,” unless such reduction in equity holdings is part of a transaction that constitutes a “change in control” pursuant to clause (iii) above.
Mr. Rea’s amended and restated employment agreement will increase his target bonus to 100% of base salary.
117
Table of Contents
401(k) plan
We maintain a qualified 401(k) savings plan which allows participants to defer from 0% to 50% of cash compensation up to the maximum amount allowed under Internal Revenue Service guidelines. From time to time, we make contributions to our employees’ individual 401(k) accounts as a performance incentive. Participants are always vested in their own contributions to the plan and are fully vested in contributions by us generally after a five-year vesting period.
2013 Incentive Plan
In connection with this offering, we expect to adopt the 2013 Incentive Plan. The 2013 Incentive Plan is expected to provide for grants of stock options, stock appreciation rights, restricted stock, other stock-based awards, other cash-based compensation and performance awards. Directors, officers and other employees of us and our subsidiaries, as well as others performing consulting or advisory services for us, will be eligible for grants under the 2013 Incentive Plan. The purpose of the 2013 Incentive Plan will be to provide incentives that attract, retain and motivate high-performing officers, directors, employees and consultants by providing them a proprietary interest in our long-term success or compensation based on their performance in fulfilling their responsibilities to our company. This summary may not include all of the provisions of the 2013 Incentive Plan. For further information about the 2013 Incentive Plan, we refer you to the complete copy of the form of the 2013 Incentive Plan, which we have filed as an exhibit to the registration statement.
Administration. The 2013 Incentive Plan will be administered by a committee designated by our board of directors. The committee’s powers will include: (i) determining the form, amount and other terms and conditions of awards; (ii) construing or interpreting any provision of the 2013 Incentive Plan or any award agreement; (iii) amending the terms of outstanding awards and (iv) adopting such rules, guidelines and practices for administering the 2013 Incentive Plan as it deems advisable. The committee will have full authority to administer and interpret the 2013 Incentive Plan, to grant discretionary awards under the 2013 Incentive Plan, to determine the persons to whom awards will be granted, to determine the types of awards to be granted, to determine the terms and conditions of each award, to determine the number of shares of common stock to be covered by each award, to make all other determinations in connection with the 2013 Incentive Plan and the awards thereunder as the committee deems necessary or desirable and to delegate authority under the 2013 Incentive Plan to our executive officers.
Available shares. The aggregate number of shares of common stock which may be issued or used for reference purposes under the 2013 Incentive Plan or with respect to which awards may be granted may not exceed 1,800,000 shares. The maximum number of shares of our common stock with respect to which any stock option, stock appreciation right, shares of restricted stock or other stock-based awards that are subject to the attainment of specified performance goals and intended to satisfy Section 162(m) of the Code and may be granted under the 2013 Incentive Plan during any fiscal year to any eligible individual will be 500,000 (or, with respect to non-employee directors, 100,000) shares (per type of award); provided that the total number of shares of our common stock with respect to all such awards that may be granted under the 2013 Incentive Plan during any fiscal year to any eligible individual will be 500,000 (or, with respect to non-employee directors, 100,000) shares. There are no annual limits on the number of shares of our common stock with respect to an award of restricted stock that are not subject to the attainment of specified performance goals to eligible individuals. The maximum number of shares of our common stock subject to any performance award which may be granted under the 2013 Incentive Plan during any fiscal year to any eligible individual will be 500,000 (or, with respect to non-employee directors, 100,000) shares. The maximum value of a cash payment made under a performance award which may be granted under the 2013 Incentive Plan during any fiscal year to any eligible individual will be $5,000,000 (or, with respect to non-employee directors, $1,000,000).
118
Table of Contents
The number of shares available for issuance under the 2013 Incentive Plan may be subject to adjustment in the event of a reorganization, stock split, merger or similar change in our corporate structure or the number of outstanding shares of our common stock. In the event of any of these occurrences, we will make any adjustments we consider appropriate to, among other things, the number and kind of shares, options or other property available for issuance under the plan or covered by grants previously made under the plan. The shares available for issuance under the plan may be, in whole or in part, either authorized and unissued shares of our common stock or shares of common stock held in or acquired for our treasury. In general, if awards under the 2013 Incentive Plan are for any reason cancelled, or expire or terminate unexercised, the shares covered by such awards may again be available for the grant of awards under the 2013 Incentive Plan.
Eligibility for participation. Members of our board of directors, as well as employees of, and consultants to, us or any of our subsidiaries and affiliates will be eligible to receive awards under the 2013 Incentive Plan.
Award agreement. Awards granted under the 2013 Incentive Plan will be evidenced by award agreements, which need not be identical, and that provide additional terms, conditions, restrictions or limitations covering the grant of the award, including, without limitation, additional terms providing for the acceleration of exercisability or vesting of awards in the event of a change in control or conditions regarding the participant’s employment, as determined by the committee.
Stock options. The committee may grant nonqualified stock options to any individuals eligible to participate in the 2013 Incentive Plan and incentive stock options to purchase shares of our common stock only to eligible employees. The committee will determine: (i) the number of shares of our common stock subject to each option; (ii) the term of each option, which may not exceed ten years, or five years in the case of an incentive stock option granted to a 10% or greater stockholder; (iii) the exercise price; (iv) the vesting schedule, if any and (v) the other material terms of each option. No incentive stock option or nonqualified stock option may have an exercise price less than the fair market value of a share of our common stock at the time of grant or, in the case of an incentive stock option granted to a 10% or greater stockholder, 110% of such share’s fair market value. Options will be exercisable at such time or times and subject to such terms and conditions as determined by the committee at grant and the exercisability of such options may be accelerated by the committee.
Stock appreciation rights. The committee may grant stock appreciation rights, or “SARs,” either with a stock option, which may be exercised only at such times and to the extent the related option is exercisable (a “Tandem SAR”) or independent of a stock option (a “Non-Tandem SAR”). A SAR is a right to receive a payment in shares of our common stock or cash, as determined by the committee, equal in value to the excess of the fair market value of one share of our common stock on the date of exercise over the exercise price per share established in connection with the grant of the SAR. The term of each SAR may not exceed ten years. The exercise price per share covered by a SAR will be the exercise price per share of the related option in the case of a Tandem SAR and will be the fair market value of our common stock on the date of grant in the case of a Non-Tandem SAR. The committee may also grant limited SARs, either as Tandem SARs or Non-Tandem SARs, which may become exercisable only upon the occurrence of a change in control, as defined in the 2013 Incentive Plan, or such other event as the committee may designate at the time of grant or thereafter.
Restricted stock. The committee may award shares of restricted stock. Except as otherwise provided by the committee upon the award of restricted stock, the recipient generally will have the rights of a stockholder with respect to the shares, including the right to receive dividends, the right to vote the shares of restricted stock and, conditioned upon full vesting of shares of restricted stock, the right to tender such shares, subject to the conditions and restrictions generally applicable to restricted stock or specifically set forth in the recipient’s restricted stock agreement. The committee may
119
Table of Contents
determine at the time of award that the payment of dividends, if any, will be deferred until the expiration of the applicable restriction period. Recipients of restricted stock will be required to enter into a restricted stock agreement with us that states the restrictions to which the shares are subject, which may include satisfaction of pre-established performance goals, and the criteria or date or dates on which such restrictions will lapse. If the grant of restricted stock or the lapse of the relevant restrictions is based on the attainment of performance goals, the committee will establish for each recipient the applicable performance goals, formulae or standards and the applicable vesting percentages with reference to the attainment of such goals or satisfaction of such formulae or standards while the outcome of the performance goals are substantially uncertain. Such performance goals may incorporate provisions for disregarding, or adjusting for, changes in accounting methods, corporate transactions, including, without limitation, dispositions and acquisitions, and other similar events or circumstances. Section 162(m) of the Code requires that performance awards be based upon objective performance measures. The performance goals for performance-based restricted stock will be based on one or more of the objective criteria discussed in general below.
Other stock-based awards. The committee may, subject to limitations under applicable law, make a grant of such other stock-based awards, including, without limitation, performance units, dividend equivalent units, stock equivalent units, restricted stock and deferred stock units under the 2013 Incentive Plan that are payable in cash or denominated or payable in or valued by shares of our common stock or factors that influence the value of such shares. The committee may determine the terms and conditions of any such other awards, which may include the achievement of certain minimum performance goals for purposes of compliance with Section 162(m) of the Code and a minimum vesting period. The performance goals for performance-based other stock-based awards will be based on one or more of the objective criteria discussed in general below.
Other cash-based awards. The committee may grant awards payable in cash. Cash-based awards shall be in such form, and dependent on such conditions, as the committee shall determine, including, without limitation, being subject to the satisfaction of vesting conditions or awarded purely as a bonus and not subject to restrictions or conditions. If a cash-based award is subject to vesting conditions, the committee may accelerate the vesting of such award in its discretion.
Performance awards. The committee may grant a performance award to a participant payable upon the attainment of specific performance goals. The committee may grant performance awards that are intended to qualify as performance-based compensation under Section 162(m) of the Code as well as performance awards that are not intended to qualify as performance-based compensation under Section 162(m) of the Code. If the performance award is payable in cash, it may be paid upon the attainment of the relevant performance goals either in cash or in shares of restricted stock, based on the then current fair market value of such shares, as determined by the committee. Based on service, performance or other factors or criteria, the committee may, at or after grant, accelerate the vesting of all or any part of any performance award.
Performance goals. The committee may grant awards of restricted stock, performance awards, and other stock-based awards that are intended to qualify as performance-based compensation for purposes of Section 162(m) of the Code. These awards may be granted, vest and be paid based on attainment of specified performance goals established by the committee. These performance goals may be based on the attainment of a certain target level of, or a specified increase or decrease in, one or more of the following measures selected by the committee: (1) earnings per share; (2) operating income; (3) gross income; (4) net income, before or after taxes; (5) cash flow; (6) gross profit; (7) gross profit return on investment; (8) gross margin return on investment; (9) gross margin; (10) operating margin; (11) working capital; (12) earnings before interest and taxes; (13) earnings before interest, tax, depreciation and amortization; (14) return on equity; (15) return on assets; (16) return on capital; (17) return on invested capital; (18) net revenues; (19) gross revenues; (20) revenue growth, as to
120
Table of Contents
either gross or net revenues; (21) annual recurring net or gross revenues; (22) recurring net or gross revenues; (23) license revenues; (24) sales or market share; (25) total shareholder return; (26) economic value added; (27) specified objectives with regard to limiting the level of increase in all or a portion of our bank debt or other long-term or short-term public or private debt or other similar financial obligations, which may be calculated net of cash balances and other offsets and adjustments as may be established by the committee; (28) fair market value of a share of common stock; (29) the growth in the value of an investment in the common stock assuming the reinvestment of dividends; (30) reduction in operating expenses or (31) other objective criteria determined by the committee in accordance with the 2013 Incentive Plan.
To the extent permitted by law, the committee may also exclude the impact of an event or occurrence which the committee determines should be appropriately excluded, such as (i) restructurings, discontinued operations, extraordinary items and other unusual or non-recurring charges; (ii) an event either not directly related to our operations or not within the reasonable control of management or (iii) a change in tax law or accounting standards required by GAAP. Performance goals may also be based on an individual participant’s performance goals, as determined by the committee. In addition, all performance goals may be based upon the attainment of specified levels of our performance, or the performance of a subsidiary, division or other operational unit, under one or more of the measures described above relative to the performance of other corporations. The committee may designate additional business criteria on which the performance goals may be based or adjust, modify or amend those criteria.
Change in control. In connection with a change in control, as will be defined in the 2013 Incentive Plan, the committee may accelerate vesting of outstanding awards under the 2013 Incentive Plan. In addition, such awards may be, in the discretion of the committee, (i) assumed and continued or substituted in accordance with applicable law; (ii) purchased by us for an amount equal to the excess of the price of a share of our common stock paid in a change in control over the exercise price of the awards or (iii) cancelled if the price of a share of our common stock paid in a change in control is less than the exercise price of the award. The committee may also provide for accelerated vesting or lapse of restrictions of an award at any time.
Stockholder rights. Except as otherwise provided in the applicable award agreement, and with respect to an award of restricted stock, a participant will have no rights as a stockholder with respect to shares of our common stock covered by any award until the participant becomes the record holder of such shares.
Amendment and termination. Notwithstanding any other provision of the 2013 Incentive Plan, our board of directors may at any time amend any or all of the provisions of the 2013 Incentive Plan, or suspend or terminate it entirely, retroactively or otherwise; provided, however, that, unless otherwise required by law or specifically provided in the 2013 Incentive Plan, the rights of a participant with respect to awards granted prior to such amendment, suspension or termination may not be adversely affected without the consent of such participant.
Transferability. Awards granted under the 2013 Incentive Plan generally will be nontransferable, other than by will or the laws of descent and distribution, except that the committee may provide for the transferability of nonqualified stock options at the time of grant or thereafter to certain family members.
Recoupment of awards. The 2013 Incentive Plan will provide that awards granted under the 2013 Incentive Plan are subject to any recoupment policy we may have, including the clawback of “incentive-based compensation” under the Securities Exchange Act of 1934, as amended, or under any applicable rules and regulations promulgated by the SEC.
121
Table of Contents
Effective date. We expect that the 2013 Incentive Plan will be adopted and become effective in connection with the completion of this offering.
Upon completion of this offering, we expect to award Messrs. Rea, Major and Yeazel $333,333, $133,333 and $133,333 worth of restricted stock and $666,667, $266,667 and $266,667 worth of options, respectively, pursuant to the 2013 Incentive Plan. The actual number of restricted shares awarded will be based upon the initial public offering price. The actual number of options to be awarded will be determined based on their grant date fair value, calculated using the Black-Scholes option pricing model. Assuming an initial public offering price of $17.00 per share, which is the midpoint of the price range listed on the cover page of this prospectus, and a grant date fair value of $7.70 per option, Messrs. Rea, Major and Yeazel would be awarded 19,608, 7,843 and 7,843 restricted shares and options to purchase 86,580, 34,632 and 34,632 shares of common stock, respectively. We also expect to award restricted shares or options to purchase up to 600,000 shares of our common stock collectively, less the $0.6 million worth of restricted shares and $1.2 million worth of options awarded to our executive officers and directors, upon completion of this offering. The restricted stock and options granted upon completion of the offering to Messrs. Major and Yeazel and employees other than Mr. Rea will be unvested as of the date of grant, and will vest at the rate one-third per year over three years beginning on the first anniversary of the grant date, subject to the recipient continuously providing services to us through each such date. The restricted shares and options granted upon completion of the offering to Mr. Rea will be unvested as of the date of grant, and will vest over four years with one-third vesting on the second, third and fourth anniversaries, respectively, subject to Mr. Rea continuously providing services to us through each such date. The exercise price of the options will be the initial public offering price.
122
Table of Contents
PRINCIPAL AND SELLING STOCKHOLDERS
The following table contains information about the beneficial ownership of our common stock as of July 30, 2013, after giving effect to (i) the effectiveness of our amended and restated certificate of incorporation, (ii) the conversion of all outstanding shares of our Class A junior preferred stock, Class B senior preferred stock and Class C convertible preferred stock (assuming an initial public offering price of $ 17.00 per share, which is the midpoint of the price range set forth on the cover of this prospectus, and assuming a closing date of August 12, 2013, as applicable) and (iii) the conversion of all outstanding shares of our Class A voting common stock and Class B non-voting common stock into a single class of common stock; each immediately prior to, or upon, the consummation of this offering, by:
| Ÿ | each person, or group of persons, who beneficially owns more than 5% of our capital stock, including one of the selling stockholders; |
| Ÿ | each of our Named Executive Officers; |
| Ÿ | each of our directors; |
| Ÿ | all directors and executive officers as a group; and |
| Ÿ | the other selling stockholders. |
For further information regarding material transactions between us and certain of our stockholders, see “Certain Relationships and Related Party Transactions.”
Each stockholder’s percentage ownership before the offering is based on 21,168,615 shares of our common stock outstanding as of July 30, 2013, as adjusted to give effect to this offering. Each stockholder’s percentage ownership after this offering is based on 25,580,380 shares of our common stock outstanding immediately after the completion of this offering, assuming no exercise of the underwriters’ option to purchase additional shares. The selling stockholders have granted the underwriters an option to purchase up to 1,323,530 additional shares of our common stock and the table below assumes no exercise of that option. The following table does not reflect any shares of our common stock that directors, officers, employees and certain other persons who are associated with us may purchase in this offering through the directed share program described under ‘‘Underwriting.”
Beneficial ownership for the purposes of the following table is determined in accordance with the rules and regulations of the SEC. These rules generally provide that a person is the beneficial owner of securities if such person has or shares the power to vote or direct the voting thereof, or to dispose or direct the disposition thereof or has the right to acquire such powers within 60 days. Common stock subject to options that are currently exercisable or exercisable within 60 days of July 30, 2013 are deemed to be outstanding and beneficially owned by the person holding the options. These shares, however, are not deemed outstanding for the purposes of computing the percentage ownership of any other person. Percentage of beneficial ownership is based on 25,580,380 shares of common stock to be outstanding after the completion of this offering. Except as disclosed in the footnotes to this table and subject to applicable community property laws, we believe that each stockholder identified in the table possesses sole voting and investment power over all shares of common stock shown as beneficially owned by the stockholder.
123
Table of Contents
Unless otherwise indicated, the address of each of the individuals named below is c/o Stock Building Supply Holdings, Inc., 8020 Arco Corporate Drive, Suite 400, Raleigh, North Carolina 27617.
| Name |
Shares beneficially owned prior to the offering |
Percentage of shares beneficially owned prior to the offering |
Shares being sold in this offering |
Shares beneficially owned after the offering |
Percentage of shares beneficially owned after the offering |
|||||||||||||||
| 5% stockholder: |
||||||||||||||||||||
| Gores Building Holdings, LLC |
19,057,584 | (1) | 89.6 | % | 4,266,155 | 14,791,429 | 57.6 | % | ||||||||||||
| Named Executive Officers and directors: |
||||||||||||||||||||
| Jeffrey G. Rea |
888,957 | (2) | 4.2 | % | 51,944 | 837,013 | 3.3 | % | ||||||||||||
| James F. Major, Jr. |
314,131 | (3) | 1.5 | % | 32,829 | 281,302 | 1.1 | % | ||||||||||||
| Bryan J. Yeazel |
314,131 | (4) | 1.5 | % | 32,829 | 281,302 | 1.1 | % | ||||||||||||
| Timothy Meyer(5) |
19,057,584 | 89.6 | % | 4,266,155 | 14,791,429 | 57.6 | % | |||||||||||||
| Andrew Freedman(5) |
759,681 | 3.6 | % | 79,393 | 680,288 | 2.6 | % | |||||||||||||
| Barry J. Goldstein |
— | — | — | — | — | |||||||||||||||
| Robert E. Mellor |
103,525 | (6) | * | — | 103,525 | * | ||||||||||||||
| Ryan Wald(5) |
19,057,584 | 89.6 | % | 4,266,155 | 14,791,429 | 57.6 | % | |||||||||||||
| Steven C. Yager(5) |
19,057,584 | 89.6 | % | 4,266,155 | 14,791,429 | 57.6 | % | |||||||||||||
| All executive officers and directors as a group (13 Persons) |
21,126,345 | (7) | 99.4 | % | 4,409,729 | 16,716,616 | 65.1 | % | ||||||||||||
| Other selling stockholders: |
||||||||||||||||||||
| Daniel P. Buttars |
19,479 | (8) | * | 2,036 | 17,443 | * | ||||||||||||||
| James F. Drexinger |
285,692 | (8) | 1.3 | % | 25,972 | 259,720 | 1.0 | % | ||||||||||||
| * | Represents beneficial ownership of less than 1% of our outstanding shares of common stock. |
| (1) | Represents (i) 6,707,898 shares of common stock issuable upon conversion of the Class A junior preferred stock, Class B senior preferred stock and Class C convertible preferred stock and 11,590,005 shares of common stock issuable upon conversion of Class A voting common stock held of record by Gores Holdings and (ii) 759,681 shares of common stock issuable upon conversion of Class B non-voting common stock held of record by Glendon Saturn Holdings, LLC (“Glendon Saturn”). Gores is the manager of Gores Holdings and Glendon Saturn and Alec E. Gores is the manager of Gores. Gores Capital Partners II, L.P. (“Gores II”) is the controlling member of Gores Holdings. Gores Capital Advisors II, LLC (“Gores Advisors”) is the general partner of Gores II. Gores is the manager of Gores Advisors. Gores has a seven member investment committee that has voting and dispositive authority over the common stock. The members of the investment committee include Alec E. Gores, Mark R. Stone, Joseph P. Page, Vance W. Diggins, Timothy Meyer, Ryan Wald and Steven C. Yager. Each of the foregoing persons may be deemed to share voting and dispositive power with respect to the shares held of record by Gores Holdings and Glendon Saturn. Andrew Freedman is a Managing Director at Glendon, an affiliate of Gores, and may be deemed to share voting and dispositive power with respect to the shares held of record by Glendon Saturn. The address of each of the foregoing persons is c/o The Gores Group, LLC, 10877 Wilshire Blvd, 18th Floor, Los Angeles, California 90024. |
| (2) | Represents shares of common stock issuable upon conversion of Class B non-voting common stock. Includes 4,740 shares of common stock issuable upon exercise of existing options that have vested. Does not include $333,333 worth of restricted stock to be awarded upon completion of this offering. The actual number of restricted shares to be awarded will be based upon the price at which the shares are sold to the public in this offering. See “Executive Compensation—2013 Incentive Plan.” |
124
Table of Contents
| (3) | Represents shares of common stock issuable upon conversion of Class B non-voting common stock. Includes 2,467 shares of common stock issuable upon exercise of existing options that have vested. Does not include $133,333 worth of restricted stock to be awarded upon completion of this offering. The actual number of restricted shares to be awarded will be based upon the price at which the shares are sold to the public in this offering. See “Executive Compensation—2013 Incentive Plan.” |
| (4) | Represents shares of common stock issuable upon conversion of Class B non-voting common stock. Includes 2,467 shares of common stock issuable upon exercise of existing options that have vested. Does not include $133,333 worth of restricted stock to be awarded upon completion of this offering. The actual number of restricted shares to be awarded will be based upon the price at which the shares are sold to the public in this offering. See “Executive Compensation—2013 Incentive Plan.” |
| (5) | Messrs. Meyer, Wald and Yager are members of the investment committee of Gores and as such each may be deemed to share voting and dispositive power with respect to the shares held of record by Gores Holdings and Glendon Saturn. Mr. Freedman is a Managing Director of Glendon, and as such, he may be deemed to share voting and dispositive power with respect to the shares held of record by Glendon Saturn. |
| (6) | Represents shares of common stock issuable upon conversion of Class B non-voting common stock. Includes 64,930 shares of common stock issuable upon exercise of existing options that have vested. |
| (7) | Includes 19,479 shares of common stock issuable upon exercise of existing options that have vested. |
| (8) | Represents shares of common stock issuable upon conversion of Class B non-voting common stock. |
125
Table of Contents
CERTAIN RELATIONSHIPS AND RELATED PARTY TRANSACTIONS
Approval policies
Following this offering, our Audit Committee will be responsible for the review, approval and ratification of “related person transactions” between us and any related person pursuant to a written Related Person Transaction Policy adopted by our board of directors. Under SEC rules, a related person is an officer, director, nominee for director or beneficial holder of more than of 5% of any class of our voting securities since the beginning of the last fiscal year or an immediate family member of any of the foregoing. In the course of its review and approval or ratification of a related-person transaction, the Audit Committee will consider:
| Ÿ | the nature of the related person’s interest in the transaction; |
| Ÿ | the material terms of the transaction, including the amount involved and type of transaction; |
| Ÿ | the importance of the transaction to the related person and to our Company; |
| Ÿ | whether the transaction would impair the judgment of a director or executive officer to act in our best interest and the best interest of our stockholders; and |
| Ÿ | any other matters the audit committee deems appropriate. |
Any member of the Audit Committee who is a related person with respect to a transaction under review will not be able to participate in the deliberations or vote on the approval or ratification of the transaction. However, such a director may be counted in determining the presence of a quorum at a meeting of the committee that considers the transaction.
Other than compensation agreements and other arrangements which are described under “Executive Compensation,” and the transactions described below, since January 1, 2010, there has not been, and there is not currently proposed, any transaction or series of similar transactions to which we were or will be a party in which the amount involved exceeded or will exceed $120,000 and in which any related person had or will have a direct or indirect material interest.
Plan of conversion and certificate of incorporation
Plan of conversion
On May 2, 2013, we entered into a Plan of Conversion with Gores Holdings, pursuant to which we and Gores Holdings agreed to convert the Company from a limited liability company to a corporation. Pursuant to the terms of the Company’s former Second Amended and Restated Limited Liability Company Agreement, the Company could be converted to a corporation with the consent of Gores Holdings. In connection with the conversion, the Company adopted a certificate of incorporation and bylaws, which replaced the Second Amended and Restated Limited Liability Company Agreement, other than the provisions granting Gores Holdings and other holders of the Company’s securities registration rights as described below.
Pursuant to the Plan of Conversion, we have granted Gores Holdings and our other stockholders prior to this offering (each, a “Holder of Registrable Securities”) certain registration rights. The holders of a majority of the Registrable Securities will be entitled to request that the Company register their shares on a long-form or short-form registration statement on one or more occasions in the future, which registrations may be “shelf registrations.” Holders of Registrable Securities will also be entitled to participate in certain registered offerings by the Company, subject to the restrictions in the registration rights agreement. The Company will pay the expenses of the Holders of Registrable Securities in connection with their exercise of their rights under the Registration Rights Agreement. The registration
126
Table of Contents
rights described in this paragraph apply to (i) shares of our common stock held by Gores Holdings and its affiliates, (ii) shares of common stock held by any holder of Registrable Securities other than Gores Holdings as of the date of the Plan of Conversion, (iii) any shares of common stock issued or issuable upon conversion of our preferred stock and (iv) any of our capital stock (or that of our subsidiaries) issued or issuable with respect to the common stock described in clauses (i) through (iii) with respect to any dividend, distribution, recapitalization, reorganization or certain other corporate transactions (“Registrable Securities”). These registration rights are also for the benefit of any subsequent holder of Registrable Securities; provided that any particular securities will cease to be Registrable Securities when they have been sold in a registered public offering, sold in compliance with Rule 144 of the Securities Act or repurchased by us or our subsidiaries. In addition, at the Company’s election and with the consent of the holders of a majority of Registrable Securities, any Registrable Securities held by a person other than Gores Holdings and its affiliates will cease to be Registrable Securities if they can be sold without limitation under Rule 144 of the Securities Act.
Certificate of incorporation
Pursuant to our certificate of incorporation, the preemptive rights, the tag-along and drag-along rights and the restrictions on the transfer of our shares described in this paragraph, cease to be effective following the consummation of an initial public offering of our stock and would not apply to our initial public offering. In the event that we propose to issue additional shares, our certificate of incorporation grants preemptive rights to each of our stockholders to subscribe for additional shares in such issuance, on a pro rata basis. In addition, if Gores Holdings or its affiliates enter into an agreement to sell, directly or indirectly, any of their common stock or any interest therein, other than to an affiliate or in connection with an initial public offering, each stockholder has the right to participate in such sale on a pro-rata basis (“tag-along sale”). In the event that Gores Holdings or its affiliates determine to accept an offer from any person to acquire a majority of our outstanding common stock, subject to applicable law, each of our stockholders is entitled to include shares of common stock in such sale on a pro-rata basis (“drag-along sale”). The aggregate percentage of shares to be sold by participating stockholders in a tag-along or drag-along sale is to be determined by Gores Holdings and its affiliates. Except for the registration rights described below, our certificate of incorporation restricts our stockholders from transferring all or any portion of their shares prior to an initial public offering without the written consent of our board of directors, except to an affiliate of such stockholder.
Fees paid to Wolseley
In accordance with the Second Amended and Restated Limited Liability Company Agreement, affiliates of Wolseley provided management services to us until 2011. We paid fees to Wolseley for management services of $0.5 million and $0.4 million in 2010 and 2011, respectively.
Management services agreement with Gores
On May 4, 2009, in connection with Gores Holdings’ investment in our Company, we entered into a management services agreement with Gores. Under the management services agreement, Gores provides consulting, administrative services, oversight, advice and support. In exchange for these services, we agreed to pay Gores an annual fee of $1.0 million. We also agreed to reimburse Gores for certain out-of-pocket expenses incurred in connection with the provision of services pursuant to the management services agreement. The management agreement provided that it would terminate on March 31, 2010 but would automatically renew annually for an additional one-year term unless we and Gores agreed not to renew the agreement prior to the expiration of the then-current term. For each of the years ended December 31, 2010, 2011 and 2012, the fees we paid under the management services agreement were $1.0 million. In addition, in 2010, we paid Gores a fee of $1.5 million in connection with services performed in connection with acquisitions by the Company.
127
Table of Contents
On June 13, 2013, we entered into an agreement with Gores to terminate the management services agreement effective upon consummation of this offering. In connection with the termination, and in accordance with the management services agreement, Gores will receive a termination fee of $9.0 million from us.
Amended and restated professional services agreement with Glendon
On May 5, 2009, in connection with Gores Holdings’ investment in our Company, we entered into a professional services agreement with Glendon, an affiliate of Gores. The agreement was amended and restated on June 13, 2013. Under the professional services agreement, Glendon provides consulting services related to operations, mergers and acquisitions and financial matters. In exchange for these services, we have agreed to pay Glendon consulting fees based on the hours spent by Glendon employees providing the consulting services. We have also agreed to reimburse Glendon for out-of-pocket expenses incurred in connection with the provision of services pursuant to the professional services agreement. The professional services agreement as amended and restated provides for a one-year term subject to automatic annual renewals for additional one-year terms unless we and Glendon agree not to renew the agreement prior to expiration of the prior one-year term. In addition, Glendon may terminate the agreement prior to its expiration in the event of any sale of all or substantially all of the assets of the Company or if Gores and its affiliates cease to beneficially own at least 50% of the Company’s outstanding voting securities. For the years ended December 31, 2010, 2011 and 2012, the fees and out-of-pocket expenses we paid under the professional services agreement were $2.2 million, $0.9 million and $0.4 million, respectively. The fees for the year ended December 31, 2010 include $0.9 million for services performed in connection with acquisitions by the Company.
Restructuring and investment agreement
On May 5, 2009, an affiliate of Wolseley, as seller, Saturn Acquisition Holdings, LLC, then, a newly formed subsidiary wholly-owned by Gores Holdings, as purchaser, and our predecessor, entered into a restructuring and investment agreement pursuant to which Saturn Acquisition Holdings, LLC acquired substantially all of our assets and 51% of our voting interests from Wolseley and Wolseley retained a 49% voting interest. The closing of the transaction occurred on May 5, 2009.
Pursuant to the restructuring and investment agreement, Wolseley and its affiliates released us and our subsidiaries from any and all guarantees or liens associated with all loans and indebtedness between us or our subsidiaries and Wolseley or its affiliates, and certain credit agreements arranged for Wolseley that were outstanding at May 5, 2009. All other agreements and transactions between us and Wolseley were also terminated, except that concurrently with the closing of the transaction, we entered into a transition services agreement whereby Wolseley and Saturn Acquisition Holdings, LLC agreed to continue to provide certain management services that such parties had been providing at the time of execution of the agreement.
Pursuant to the restructuring and investment agreement, Wolseley agreed to indemnify us for, among other things, losses arising from any third-party claim (i) existing as of May 5, 2009 or (ii) brought or asserted against the Company arising from actions taken by Wolseley or the Company prior to May 5, 2009. In accordance with the agreement Wolseley was not liable for any claim for indemnification until the aggregate amount to be recovered by us exceeded $3 million, which occurred in 2011.
In addition, under the agreement, Wolseley agreed that, subject to certain exceptions, for a period of three years following the closing, neither it, nor its affiliates would engage in the business of supplying building materials and construction services to professional builders and contractors in the United States, other than through the ownership of our securities.
128
Table of Contents
Contribution agreement
On November 16, 2011, we purchased all of Wolseley’s remaining interests in us, for cash consideration of $25 million. The purchase was financed by $15 million in borrowings under the Revolver, $5 million of cash and $5 million of cash contributed by Gores Holdings pursuant to a contribution agreement dated November 16, 2011. In exchange for Gores Holding’s contribution, we issued to Gores Holdings 5 million shares of our Class C preferred stock. At December 31, 2011, we had accrued $5 million in accrued expenses and other liabilities on the consolidated balance sheets related to this contribution. The shares of Class C preferred stock were issued in January 2012.
Director Nomination Agreement
In connection with this offering, we will enter into a Director Nomination Agreement with Gores Holdings that provides Gores Holdings the right to designate nominees for election to our board of directors for so long as Gores Holdings beneficially owns 10% or more of the total number of shares of our common stock then outstanding.
The number of nominees that Gores Holdings is entitled to designate under this agreement will bear the same proportion to the total number of members of our board of directors as the number of shares of common stock beneficially owned by Gores Holdings bears to the total number of shares of common stock outstanding, rounded up to the nearest whole number. In addition, Gores Holdings shall be entitled to designate the replacement for any of its board designees whose board service terminates prior to the end of the director’s term regardless of Gores Holdings’ beneficial ownership at such time. Gores Holdings shall also have the right to have its designees participate on committees of our board of directors proportionate to its stock ownership, subject to compliance with applicable law and stock exchange rules. This agreement will terminate at such time as Gores Holdings owns less than 10% of our outstanding common stock.
Promissory notes
On May 5, 2009, we made a $213,627 loan to Glendon Saturn in the form of a secured promissory note, which matures on or before May 5, 2018 and bears interest at 2.05%, compounded annually. The loan was made to Glendon Saturn in connection with its purchase of shares of our Class B common stock. As of April 30, 2013, the outstanding principal and accrued interest on Glendon Saturn’s loan was $231,628. Messrs. Meyer and Freedman, directors of the Company, are members of Glendon Saturn. Glendon Saturn repaid the loan prior to the filing of the registration statement of which this prospectus is part.
On July 1, 2012, we made a $531,058 loan to Mr. Rea in the form of a secured promissory note, which matures on or before June 30, 2021 and bears interest at 0.92%, compounded annually. The loan was made to Mr. Rea in connection with his purchase of shares of our Class B common stock. As of April 30, 2013, the outstanding principal and accrued interest on Mr. Rea’s loan was $535,129. Pursuant to a pledge agreement dated July 1, 2012, Mr. Rea pledged the Class B common stock purchased with the loan as collateral for the loan. This loan was forgiven by the Company prior to the filing of the registration statement of which this prospectus is part.
Redemption of Class B preferred stock
On June 23, 2010 and December 19, 2012, we redeemed $26.2 million and $12.4 million, respectively, of Class B senior preferred stock held by Gores Holdings, and also paid out $6.1 million and $10.6 million, respectively, of accrued and unpaid dividends on the redeemed shares.
129
Table of Contents
The Group Health Plan
The Company was part of a group health plan with Gores. As of December 31, 2012, the Company had $0.8 million on deposit as a reserve with Gores for the payment of run-off health care claims in the event of a plan termination. The Company has terminated its relationship with the Gores Group Health Plan and entered into a separate Stock Building Supply Group Health Plan.
Software, Services, License and Maintenance Services Agreement with United Road Services Inc.
On February 22, 2010 the Company entered into a Software, Services, License and Maintenance Services Agreement with United Road Services Inc. and its subsidiary Vehix Transvision, LLC (collectively “URS”) for the development, implementation, maintenance and support of customized software related to our SLS capability. The agreement with URS was subsequently amended and restated on March 3, 2013 to update certain services and deliverables. When we entered into the original agreement in 2010, URS was also owned by our sponsor, Gores, as one of its portfolio companies. Gores divested its ownership interest in URS on December 14, 2012 and URS is no longer under common ownership with the Company. The agreement gives us the exclusive right to use the software services related to our SLS capability throughout the United States in the residential and commercial construction supply and services industry. The agreement does not have a fixed term but URS may terminate it if we fail to pay amounts due thereunder. We are entitled to terminate the agreement in the event of a material breach by URS, upon certain insolvency and bankruptcy events with respect to URS, upon a change of control (including an initial public offering) affecting URS or us, and at our convenience by providing a 30-days’ prior written notice and by paying a termination fee. Under the agreement, we have the option to acquire the license at any point during the term of the agreement upon written notice to URS and payment of a one-time license fee. The Company paid URS approximately $0.8 million in 2012, $0.8 million in 2011 and $0.3 million in 2010.
130
Table of Contents
The following is a summary of our capital stock and provisions of our amended and restated certificate of incorporation and our amended and restated bylaws, as each will be in effect prior to the closing of this offering, and certain provisions of Delaware law. This summary does not purport to be complete and is qualified in its entirety by the provisions of our amended and restated certificate of incorporation and amended and restated bylaws, copies of which have been or will be filed with the SEC as exhibits to the registration statement of which this prospectus is a part. References in this section to the “Company,” “we,” “us” and “our” refer to Stock Building Supply Holdings, Inc. and not to any of its subsidiaries.
Authorized capitalization
Our amended and restated certificate of incorporation will provide that our authorized capital stock will consist of 300,000,000 shares of common stock, par value $0.01 per share and 50,000,000 shares of undesignated preferred stock, par value $0.01 per share. Upon the completion of this offering, after giving effect to (i) the conversion of all outstanding shares of our Class A junior preferred stock, Class B senior preferred stock and Class C convertible preferred stock into common stock, (ii) the conversion of all outstanding shares of our Class A voting common stock and Class B non-voting common stock into a single class of common stock and (iii) the issuance and sale of shares of common stock in this offering, we will have 25,580,380 shares of common stock outstanding and no shares of preferred stock outstanding.
Common stock
Voting rights
Each share of common stock will entitle the holder to one vote with respect to each matter presented to our stockholders on which the holders of common stock are entitled to vote. Our common stock will vote as a single class on all matters relating to the election of directors on our board of directors and as provided by law. Holders of our common stock will not have cumulative voting rights. Except in respect of matters relating to the election and removal of directors on our board of directors and as otherwise provided in our amended and restated certificate of incorporation or required by law, all matters to be voted on by our stockholders must be approved by a majority of the shares present in person or by proxy at the meeting and entitled to vote on the subject matter. In the case of the election of directors, all matters to be voted on by our stockholders must be approved by a plurality of the votes entitled to be cast by all shares of common stock.
Dividend rights
The holders of our outstanding shares of common stock will be entitled to receive dividends, if any, as may be declared from time to time by our board of directors out of legally available funds. See “Dividend Policy.” Because we are a holding company, our ability to pay dividends on our common stock will be limited by restrictions on the ability of our subsidiaries to pay dividends or make distributions to us, including restrictions under the terms of the agreements governing our indebtedness.
Liquidation rights
In the event of any voluntary or involuntary liquidation, dissolution or winding up of our affairs, holders of our common stock would be entitled to share ratably in our assets that are legally available for distribution to stockholders after payment of our debts and other liabilities. If we have any preferred stock outstanding at such time, holders of the preferred stock may be entitled to distribution and/or liquidation preferences. In either such case, we must pay the applicable distribution to the holders of our preferred stock before we may pay distributions to the holders of our common stock.
131
Table of Contents
Other rights
Our stockholders will have no preemptive, conversion or other rights to subscribe for additional shares. All outstanding shares are and all shares registered by this prospectus will be, when sold, validly issued, fully paid and nonassessable. The rights, preferences and privileges of the holders of our common stock are subject to and may be adversely affected by, the rights of the holders of shares of any series of our preferred stock that we may designate and issue in the future.
Listing
We have been approved to have our common stock listed on the NASDAQ under the symbol “STCK.”
Transfer agent and registrar
The transfer agent and registrar for our common stock will be Computershare Shareowner Services, LLC.
Preferred stock
Our amended and restated certificate of incorporation will authorize our board of directors to provide for the issuance of shares of preferred stock in one or more series and to fix the preferences, powers and relative, participating, optional or other special rights and qualifications, limitations or restrictions thereof, including the dividend rate, conversion rights, voting rights, redemption rights and liquidation preference and to fix the number of shares to be included in any such series without any further vote or action by our stockholders. Any preferred stock so issued may rank senior to our common stock with respect to the payment of dividends or amounts upon liquidation, dissolution or winding up, or both. The issuance of preferred stock may have the effect of delaying, deferring or preventing a change in control of our Company without further action by the stockholders and may adversely affect the voting and other rights of the holders of common stock. The issuance of preferred stock with voting and conversion rights may adversely affect the voting power of the holders of common stock, including the loss of voting control to others. At present, we have no plans to issue any preferred stock.
Composition of the board of directors
Following the completion of this offering, we will be deemed to be a “controlled company” under the rules of the NASDAQ because more than 50% of our outstanding voting power will be held by Gores Holdings. See “Principal and Selling Stockholders.” We intend to rely upon the “controlled company” exception to the NASDAQ board of directors and committee independence requirements. Pursuant to this exception, we will be exempt from the rules that would otherwise require that its board of directors consist of a majority of independent directors and that our Compensation Committee and Governance and Nominating Committee be composed entirely of independent directors. The “controlled company” exception does not modify the independence requirements for the Audit Committee, and we intend to comply with the requirements of the Sarbanes-Oxley Act and the stock exchange rules, which require that our Audit Committee consist exclusively of independent directors within one year of our initial public offering.
Upon the completion of this offering, our board of directors will be divided into three classes, with each class serving three-year staggered terms and one class being elected at each year’s annual meeting of stockholders. Messrs. Mellor and Rea will be in the class of directors whose term expires at the first annual meeting of stockholders following the date of this prospectus. Messrs. Goldstein and Freedman will be in the class of directors whose term expires at the second annual meeting of
132
Table of Contents
stockholders following the date of this prospectus. Messrs. Meyer, Wald and Yager will be in the class of directors whose term expires at the third annual meeting of stockholders following the date of this prospectus. At each annual meeting of our stockholders, successors to the class of directors whose term expires at such meeting will be elected to serve for three-year terms or until their respective successors are elected and qualified.
Corporate opportunity
Messrs. Freedman, Meyer, Wald and Yager, who are officers or employees of Gores or its affiliates serve on our board of directors. Gores is the ultimate principal equityholder of Gores Holdings, our majority stockholder (after giving effect to this offering). Gores and entities controlled by it may hold equity interests in entities that directly or indirectly compete with us, and companies in which they currently invest may begin competing with us. As a result of these relationships, when conflicts between the interests of Gores, on the one hand, and of other stockholders, on the other hand, arise, these directors may not be disinterested. Although our directors and officers have a duty of loyalty to us under Delaware law and our amended and restated certificate of incorporation that will be adopted in connection with this offering, transactions that we enter into in which a director or officer has a conflict of interest are generally permissible so long as (i) the material facts relating to the director’s or officer’s relationship or interest as to the transaction are disclosed to our board of directors and a majority of our disinterested directors approves the transaction, (ii) the material facts relating to the director’s or officer’s relationship or interest as to the transaction are disclosed to our stockholders and a majority of our disinterested stockholders approve the transaction or (iii) the transaction is otherwise fair to us. Our amended and restated certificate of incorporation will also provide that any principal, officer, member, manager and/or employee of Gores or any entity that controls, is controlled by or under common control with, Gores (other than the Company or any Company that is controlled by the Company) or any investment funds managed by Gores will not be required to offer any transaction opportunity of which they become aware to us and could take any such opportunity for themselves or offer it to other companies in which they have an investment.
Anti-takeover effects of Delaware law and our amended and restated certificate of incorporation and amended and restated bylaws
Our amended and restated certificate of incorporation and our amended and restated bylaws will also contain provisions that may delay, defer or discourage another party from acquiring control of us. We expect that these provisions, which are summarized below, will discourage coercive takeover practices or inadequate takeover bids. These provisions are also designed to encourage persons seeking to acquire control of us to first negotiate with our board of directors, which we believe may result in an improvement of the terms of any such acquisition in favor of our stockholders. However, they also give our board of directors the power to discourage acquisitions that some stockholders may favor.
Undesignated preferred stock
The ability to authorize undesignated preferred stock will make it possible for our board of directors to issue preferred stock with super voting, special approval, dividend or other rights or preferences on a discriminatory basis that could impede the success of any attempt to acquire us. These and other provisions may have the effect of deferring, delaying or discouraging hostile takeovers, or changes in control or management of our Company.
Classified board of directors
Our amended and restated certificate of incorporation will provide that our board of directors will be divided into three classes, with each class serving three-year staggered terms. In addition, under our
133
Table of Contents
amended and restated certificate of incorporation, on and after the date that Gores Holdings and its affiliates cease to beneficially own a majority of the voting power of our then outstanding capital stock entitled to vote generally in the election of directors (the “Trigger Date”), our directors may only be removed for cause and only upon the affirmative vote of the majority of our outstanding voting stock, at a meeting of our stockholders called for that purpose. These provisions may have the effect of deferring, delaying or discouraging hostile takeovers, or changes in control or management of our Company.
Special meetings of stockholders
Our amended and restated certificate of incorporation will provide that special meetings of the stockholders may be called only upon a resolution approved by a majority of the total number of directors that we would have if there were no vacancies or, prior to the Trigger Date, at the request of the holders of a majority of the voting power of our then outstanding shares of voting capital stock.
Requirements for nominations and proposals at stockholder meetings
Our amended and restated bylaws will prohibit the conduct of any business at a special meeting other than as specified in the notice for such meeting. Our amended and restated bylaws will also provide that nominations of persons for election to our board of directors may be made at a special meeting of stockholders at which directors are to be elected pursuant to the notice of meeting (i) by or at the direction of our board of directors or (ii) provided that our board of directors has determined that directors shall be elected at such meeting, by any stockholder who (1) is a stockholder of record both at the time the notice is delivered and on the record date for the determination of stockholders entitled to vote at the special meeting, (2) is entitled to vote at the meeting and upon such election and (3) complies with the notice procedures set forth in our amended and restated bylaws. These provisions may have the effect of deferring, delaying or discouraging hostile takeovers, or changes in control or management of our Company. These provisions will not apply to nominations by Gores Holdings pursuant to the Director Nomination Agreement.
Stockholder action by written consent
Pursuant to Section 228 of the DGCL, any action required to be taken at any annual or special meeting of the stockholders may be taken without a meeting, without prior notice and without a vote if a consent or consents in writing, setting forth the action so taken, is signed by the holders of outstanding stock having not less than the minimum number of votes that would be necessary to authorize or take such action at a meeting at which all shares of our stock entitled to vote thereon were present and voted, unless our Company’s amended and restated certificate of incorporation provides otherwise. Our amended and restated certificate of incorporation will provide that, prior to the Trigger Date, any action required or permitted to be taken by our stockholders may be effected by written consent. From and after the Trigger Date, any action required or permitted to be taken by the stockholders may be effected only at a duly called annual or special meeting.
Business combinations with interested stockholders
We will elect in our amended and restated certificate of incorporation not to be subject to Section 203 of the DGCL, an anti-takeover law. In general, Section 203 prohibits a publicly held Delaware corporation from engaging in a business combination, such as a merger, with a person or group owning 15% or more of the corporation’s voting stock for a period of three years following the date the person became an interested stockholder, unless (with certain exceptions) the business combination or the transaction in which the person became an interested stockholder is approved in a prescribed manner. Accordingly, we will not be subject to any anti-takeover effects of Section 203. However, our amended and restated certificate of incorporation will contain provisions that have the
134
Table of Contents
same effect as Section 203, except that they will provide that (i) Gores and any of its affiliates or associates, including any investment funds managed by Gores, (ii) any other person with whom any of the foregoing are acting as a group or in concert for the purpose of acquiring, holding, voting or disposing of shares of our stock and (iii) any person who would otherwise be an interested stockholder because of a transfer of 5% or more of our outstanding voting stock by any person described in clause (i) or (ii) to such person will be excluded from the “interested stockholder” definition in our amended and restated certificate of incorporation and will therefore not be subject to the restrictions therein that have the same effect as Section 203.
Requirements for amendments to our amended and restated certificate of incorporation and amended and restated bylaws
Prior to the Trigger Date, our amended and restated certificate of incorporation will provide that our amended and restated bylaws may be adopted, amended, altered or repealed by the vote of a majority of the voting power of our then outstanding voting stock, voting together as a single class. After the Trigger Date, our amended and restated bylaws may be adopted, amended, altered or repealed by either (i) a vote of a majority of the total number of directors that the Company would have if there were no vacancies or (ii) in addition to any other vote otherwise required by law, the affirmative vote of the holders of at least 66 2/3% of the voting power of our then outstanding capital stock entitled to vote generally in the election of directors, voting together as a single class.
Following the Trigger Date, our amended and restated certificate of incorporation will provide that the provisions of our amended and restated certificate of incorporation relating to the size and composition of our board of directors, limitation on liabilities of directors, stockholder action by written consent, the ability of stockholders to call special meetings, business combinations with interested persons, amendment of our amended and restated bylaws or amended and restated certificate of incorporation and the Court of Chancery as the exclusive forum for certain disputes, may only be amended, altered, changed or repealed by the affirmative vote of the holders of at least 66 2/3% of the voting power of all of our outstanding shares of capital stock entitled to vote generally in the election of directors, voting together as a single class. Prior to the Trigger Date, our amended and restated certificate of incorporation will provide that such provisions may be amended, altered, changed or repealed by the affirmative vote of the holders of a majority of the voting power of our then outstanding capital stock entitled to vote generally in the election of directors, voting together as a single class. Our amended and restated certificate of incorporation will also provide that the provision of our amended and restated certificate of incorporation that deals with corporate opportunity may only be amended, altered or repealed by a vote of 80% of the voting power of our then outstanding capital stock entitled to vote generally in the election of directors, voting together as a single class.
Exclusive jurisdiction of certain actions
Our amended and restated certificate of incorporation provides that the exclusive forum for derivative actions brought on behalf of the Company, actions against directors, officers and employees for breach of fiduciary duty and other similar actions will be a state court located within the State of Delaware (or, if no state court located within the State of Delaware has jurisdiction, the federal district court for the District of Delaware). Although we believe this provision benefits the Company by providing increased consistency in the application of Delaware law in the types of lawsuits to which it applies, the provision may have the effect of discouraging lawsuits against our directors and officers. The enforceability of similar exclusive jurisdiction provisions in other companies’ certificates of incorporation has been challenged in legal proceedings, and it is possible that, in connection with any action, a court could find the exclusive jurisdiction provision contained in our amended and restated certificate of incorporation to be inapplicable or unenforceable in such action.
135
Table of Contents
SHARES ELIGIBLE FOR FUTURE SALE
Prior to this offering, there has been no public market for our common stock. Future sales of substantial amounts of our common stock in the public market, or the perception that such sales may occur, could adversely affect the prevailing market price of our common stock. No prediction can be made as to the effect, if any, future sales of shares, or the availability of shares for future sales, will have on the market price of our common stock prevailing from time to time. The sale of substantial amounts of our common stock in the public market, or the perception that such sales could occur, could harm the prevailing market price of our common stock.
Sale of restricted shares
Upon completion of this offering, we will have 25,580,380 shares of common stock outstanding. Of these shares of common stock, the 8,823,530 shares of common stock being sold in this offering, plus any shares sold upon exercise of the underwriters’ option to purchase additional shares, will be freely tradable without restriction under the Securities Act, except for any such shares held or acquired by an “affiliate” of ours, as that term is defined in Rule 144 promulgated under the Securities Act, which shares will be subject to the volume limitations and other restrictions of Rule 144 described below. The remaining 16,756,850 shares of common stock held by our existing stockholders upon completion of this offering, or 15,433,320 shares if the underwriters exercise their option to purchase additional shares in full, will be “restricted securities,” as that phrase is defined in Rule 144, and may be resold only after registration under the Securities Act or pursuant to an exemption from such registration, including, among others, the exemptions provided by Rule 144 and 701 under the Securities Act, which rules are summarized below. These remaining shares of common stock held by our existing stockholders upon completion of this offering will be available for sale in the public market after the expiration of the lock-up agreements described in “Underwriting,” taking into account the provisions of Rules 144 and 701 under the Securities Act.
Rule 144
In general, under Rule 144 of the Securities Act as currently in effect, once we have been subject to public company reporting requirements for at least 90 days, a person who is not deemed to have been one of our affiliates for purposes of the Securities Act at any time during 90 days preceding a sale and who has beneficially owned the shares proposed to be sold for at least six months, including the holding period of any prior owner other than our affiliates, is entitled to sell such shares without complying with the manner of sale, volume limitation or notice provisions of Rule 144, subject to compliance with the public information requirements of Rule 144. If such a person has beneficially owned the shares proposed to be sold for at least one year, including the holding period of any prior owner other than our affiliates, then such person is entitled to sell such shares without complying with any of the requirements of Rule 144.
In general, under Rule 144, as currently in effect, our affiliates or persons selling shares on behalf of our affiliates are entitled to sell within any three-month period beginning 90 days after the date of this prospectus, a number of shares that does not exceed the greater of:
| Ÿ | 1% of the number of shares of common stock then outstanding; or |
| Ÿ | the average weekly trading volume of the common stock during the four calendar weeks preceding the filing of a notice on Form 144 with respect to such sale. |
Rule 144 also provides that a person who is not deemed to have been an affiliate of ours at any time during the three months preceding a sale and who has for at least six months beneficially owned shares of our common stock that are restricted securities, will be entitled to freely sell such shares of
136
Table of Contents
our common stock subject only to the availability of current public information regarding us. A person who is not deemed to have been an affiliate of ours at any time during the three months preceding a sale and who has beneficially owned for at least one year shares of our common stock that are restricted securities, will be entitled to freely sell such shares of our common stock under Rule 144 without regard to the current public information requirements of Rule 144.
Registration rights
Gores Holdings and the holders of our equity securities prior to this offering are entitled to various rights with respect to the registration of shares under the Securities Act. Registration of these shares under the Securities Act would result in these shares becoming fully tradable under the Securities Act immediately upon the effectiveness of the registration, except for shares held by affiliates. See “Certain Relationships and Related Party Transactions—Plan of conversion—Certificate of incorporation.” Shares covered by a registration statement will be eligible for sales in the public market upon the expiration or release from the terms of the lock-up agreement referred to below.
Rule 701
Rule 701 generally allows a stockholder who purchased shares of our common stock pursuant to a written compensatory plan or contract and who is not deemed to have been an affiliate of our Company during the immediately preceding 90 days to sell these shares in reliance upon Rule 144, but without being required to comply with the public information, holding period, volume limitation or notice provisions of Rule 144. Rule 701 also permits affiliates of our Company to sell their Rule 701 shares under Rule 144 without complying with the holding period requirements of Rule 144.
Stock plans
We intend to file registration statements on Form S-8 under the Securities Act covering all of the shares of our common stock reserved for issuance under the 2013 Incentive Plan we intend to adopt in connection with this offering. We expect to file this registration statement as soon as practicable after this offering and adoption of the 2013 Incentive Plan. Accordingly, shares registered under the registration statement on Form S-8 will be available for sale in the open market following its effective date, subject to the Rule 144 limitations applicable to affiliates.
Lock-up agreements
In connection with this offering, we, our directors and executive officers and the selling stockholders will enter into 180-day lock-up agreements with the underwriters of this offering under which neither we nor they may, for a period of 180 days after the date of this prospectus, directly or indirectly sell, dispose of or hedge any shares of common stock or any securities convertible into or exchangeable or exercisable for shares of common stock without the prior written consent of Goldman, Sachs & Co., Barclays Capital Inc. and Citigroup Global Markets Inc. on behalf of the underwriters, subject to certain exceptions. See “Underwriting.”
137
Table of Contents
CERTAIN U.S. FEDERAL INCOME TAX CONSIDERATIONS TO NON-U.S. HOLDERS
The following is a discussion of certain U.S. federal income tax consequences of the purchase, ownership and disposition of our common stock to a non-U.S. holder that purchases shares of our common stock in this offering. This discussion applies only to a non-U.S. holder that holds our common stock as a capital asset, within the meaning of Section 1221 of the Code. For purposes of this discussion, a “non-U.S. holder” means any beneficial owner of our common stock that is, for U.S. federal income tax purposes, an individual, corporation, estate or trust other than:
| Ÿ | an individual citizen or resident of the United States, as defined for U.S. federal income tax purposes; |
| Ÿ | a corporation or other entity treated as a corporation for U.S. federal income tax purposes created or organized in the United States or under the laws of the United States or any political subdivision thereof; |
| Ÿ | an estate whose income is subject to U.S. federal income tax regardless of its source; or |
| Ÿ | a trust if it (i) is subject to the primary supervision of a court within the United States and one or more United States persons have the authority to control all substantial decisions of the trust or (ii) has a valid election in place to be treated as a U.S. person for U.S. federal income tax purposes. |
In the case of a beneficial owner that is classified as a partnership for U.S. federal income tax purposes, the tax treatment of a partner in such partnership generally will depend upon the status of the partner and the activities of the partner and the partnership. If you are a partner in a partnership considering an investment in our common stock, then you should consult your tax advisor.
This discussion is based upon the provisions of the Code, the Treasury regulations promulgated thereunder and administrative and judicial interpretations thereof, all as of the date hereof. Those authorities may be changed, perhaps retroactively, so as to result in U.S. federal income tax consequences different from those summarized below. We cannot assure you that a change in law, possibly with retroactive application, will not alter significantly the tax considerations that we describe herein. We have not sought and do not plan to seek any ruling from the U.S. Internal Revenue Service, which we refer to as the IRS, with respect to statements made and the conclusions reached in the following discussion, and there can be no assurance that the IRS or a court will agree with our statements and conclusions.
This discussion does not address all aspects of U.S. federal income taxes that may be relevant to non-U.S. holders in light of their personal circumstances, and does not deal with federal taxes other than the U.S. federal income tax (such as U.S. federal estate and gift tax laws or the Medicare tax on certain investment income) or with non-U.S., state or local tax considerations. Special rules, not discussed here, may apply to certain non-U.S. holders, including:
| Ÿ | former citizens or residents of the United States; |
| Ÿ | brokers, dealers or traders in securities, commodities or currencies; |
| Ÿ | persons who hold our common stock as a position in a “straddle,” “conversion transaction” or other risk reduction transaction; |
| Ÿ | controlled foreign corporations, passive foreign investment companies; and |
| Ÿ | tax exempt organizations. |
Such non-U.S. holders should consult their tax advisors to determine the U.S. federal, state, local and other tax consequences that may be relevant to them.
138
Table of Contents
If you are considering the purchase of our common stock, you should consult your tax advisor concerning the particular U.S. federal income tax consequences to you of the purchase, ownership and disposition of our common stock, as well as the consequences to you arising under the laws of any state, local or non-U.S. taxing jurisdiction.
Dividends
As discussed under the section entitled “Dividend Policy” above, we do not currently anticipate paying dividends. In the event that we do make a distribution of cash or property (other than certain stock distributions) with respect to our common stock (or that we engage in certain redemptions that are treated as distributions with respect to common stock), any such distribution or redemption will be treated as a dividend for U.S. federal income tax purposes to the extent paid from our current or accumulated earnings and profits (as determined under U.S. federal income tax principles). Dividends paid to you generally will be subject to withholding of U.S. federal income tax at a 30% rate or such lower rate as may be specified by an applicable income tax treaty. However, dividends that are effectively connected with the conduct of a trade or business by you within the United States are not subject to the withholding tax, but instead are subject to U.S. federal income tax on a net-income basis at applicable graduated individual or corporate rates, unless an applicable income tax treaty provides otherwise. Certain certification and disclosure requirements, including delivery of a properly executed IRS Form W-8ECI, must be satisfied for effectively connected income to be exempt from withholding. Any such effectively connected dividends received by a foreign corporation may be subject to an additional “branch profits tax” at a 30% rate or such lower rate as may be specified by an applicable income tax treaty.
If the amount of a distribution paid on our common stock exceeds our current and accumulated earnings and profits, such excess will be allocated ratably among your shares of common stock with respect to which the distribution is paid and treated first as a tax-free return of capital to the extent of your adjusted tax basis in each such share, and thereafter as capital gain from a sale or other taxable disposition of such share of common stock that is taxed to you as described below under the heading “Gain on disposition of common stock.” Your adjusted tax basis in a share is generally the purchase price of such share, reduced by the amounts of any such tax-free returns of capital.
If you wish to claim the benefit of an applicable treaty rate to avoid or reduce withholding of U.S. federal income tax for dividends, then you must (a) provide the withholding agent with a properly completed IRS Form W-8BEN (or other applicable form) and certify under penalties of perjury that you are not a U.S. person and are eligible for treaty benefits, or (b) if our common stock is held through certain foreign intermediaries, satisfy the relevant certification requirements of applicable U.S. Treasury regulations. Special certification and other requirements apply to certain non-U.S. holders that act as intermediaries (including partnerships).
If you are eligible for a reduced rate of U.S. federal income tax pursuant to an income tax treaty, then you may obtain a refund or credit of any excess amounts withheld by filing timely an appropriate claim with the IRS.
Gain on disposition of common stock
You generally will not be subject to U.S. federal income tax with respect to gain realized on the sale or other taxable disposition of our common stock, unless:
| Ÿ | the gain is effectively connected with a trade or business you conduct in the United States, and, where a tax treaty applies, is attributable to a U.S. permanent establishment or fixed base; |
| Ÿ | if you are an individual, you are present in the United States for 183 days or more in the taxable year of the sale or other taxable disposition and certain other conditions are met; or |
139
Table of Contents
| Ÿ | we are or have been during a specified testing period a “U.S. real property holding corporation” for U.S. federal income tax purposes, and certain other conditions are met. |
We believe that we are not, and we do not anticipate becoming, a “U.S. real property holding corporation” for U.S. federal income tax purposes. Even if we are or become a U.S. real property holding corporation, a non-U.S. holder generally will not be subject to U.S. federal income tax on any gain in respect of our common stock as long as our common stock is traded on an established securities market and such non-U.S. holder actually or constructively owned no more than 5% of our common stock during the specified testing period. If we are or become a U.S. real property holding corporation and you actually or constructively owned more than 5% of our common stock at any time during the specified testing period, you will be subject to tax on the net gain derived from the sale under regular graduated U.S. federal income tax rates. If you are a person described in the first bullet point above, you will be subject to tax on the net gain derived from the sale under regular graduated U.S. federal income tax rates. In addition, a non-U.S. holder that is a corporation may be subject to the branch profits tax at a 30% rate on its effectively connected earnings and profits or such lower rate as may be specified by an applicable income tax treaty. If you are an individual described in the second bullet point above, you will be subject to a flat 30% tax on the gain derived from the sale, which may be offset by U.S.-source capital losses.
Information reporting and backup withholding
The applicable withholding agent must file information returns with the IRS in connection with dividends paid to you on shares of our common stock. The IRS may make this information available to the tax authorities in the country in which you are resident. In addition, you may be subject to backup withholding (currently at a rate of 28%) with respect to dividends paid on shares of common stock, unless, generally, you certify under penalties or perjury (usually on IRS Form W-8BEN) that you are not a U.S. person or you otherwise establish an exemption.
Additional rules relating to information reporting requirements and backup withholding with respect to payments of the proceeds from the disposition of shares of our common stock are as follows:
| Ÿ | If the proceeds are paid to or through the U.S. office of a broker, the proceeds generally will be subject to backup withholding and information reporting, unless you certify under penalties of perjury (usually on IRS Form W-8BEN) that you are not a U.S. person or you otherwise establish an exemption. |
| Ÿ | If the proceeds are paid to or through a non-U.S. office of a broker that is not a U.S. person and is not a foreign person with certain specified U.S. connections (a “U.S.-related person”), information reporting and backup withholding generally will not apply. |
| Ÿ | If the proceeds are paid to or through a non-U.S. office of a broker that is a U.S. person or a U.S.-related person, the proceeds generally will be subject to information reporting and may be subject to backup withholding, unless you certify under penalties of perjury (usually on IRS Form W-8BEN) that you are not a U.S. person or you otherwise establish an exemption. |
Any amounts withheld under the backup withholding rules may be allowed as a refund or a credit against your U.S. federal income tax liability, provided the required information is timely furnished by you to the IRS.
Legislation affecting taxation of common stock held by or through foreign entities
In addition to the withholding discussed above, provisions commonly referred to as “FATCA” will impose withholding of 30% on dividend income from our common stock (beginning in 2014) and the
140
Table of Contents
gross proceeds of a disposition of our common stock (beginning in 2017) paid to “foreign financial institutions” and certain other non-U.S. entities unless various U.S. information reporting and due diligence requirements (generally relating to ownership by U.S. persons of interests in or accounts with those entities) have been satisfied or an exemption applies. If FATCA withholding is imposed, a beneficial owner that is not a foreign financial institution generally will be entitled to a refund of any amounts withheld by filing a U.S. federal income tax return (which may entail significant administrative burden). Investors are encouraged to consult their tax advisors regarding the implications of this legislation on their investment in our common stock.
POTENTIAL PURCHASERS OF OUR COMMON STOCK ARE URGED TO CONSULT THEIR TAX ADVISORS TO DETERMINE THE U.S. FEDERAL, STATE, LOCAL AND NON-U.S. TAX CONSIDERATIONS OF PURCHASING, OWNING AND DISPOSING OF OUR COMMON STOCK.
141
Table of Contents
The Company, the selling stockholders and the underwriters named below will enter into an underwriting agreement with respect to the shares being offered. Subject to certain conditions, each underwriter will severally agree to purchase the number of shares indicated in the following table. Goldman, Sachs & Co., Barclays Capital Inc. and Citigroup Global Markets Inc. are the representatives of the underwriters.
| Underwriters |
Number of Shares | |||
| Goldman, Sachs & Co. |
||||
| Barclays Capital Inc. |
||||
| Citigroup Global Markets Inc. |
||||
| Robert W. Baird & Co. Incorporated |
||||
| Stephens Inc. |
||||
| Wells Fargo Securities, LLC |
||||
|
|
|
|||
| Total |
8,823,530 | |||
|
|
|
|||
The underwriters are committed to take and pay for all of the shares being offered, if any are taken, other than the shares covered by the option described below unless and until this option is exercised.
The underwriters have an option to buy up to an additional 1,323,530 shares from the selling stockholders to cover sales by the underwriters of a greater number of shares than the total number set forth in the table above. They may exercise that option for 30 days. If any shares are purchased pursuant to this option, the underwriters will severally purchase shares in approximately the same proportion as set forth in the table above.
The following tables show the per share and total underwriting discounts and commissions to be paid to the underwriters by the Company and the selling stockholders. Such amounts are shown assuming both no exercise and full exercise of the underwriters’ option to purchase 1,323,530 additional shares.
Paid by the Company
| No Exercise | Full Exercise | |||||||
| Per Share |
$ | $ | ||||||
| Total |
$ | $ | ||||||
Paid by the Selling Stockholders
| No Exercise | Full Exercise | |||||||
| Per Share |
$ | $ | ||||||
| Total |
$ | $ | ||||||
Shares sold by the underwriters to the public will initially be offered at the initial public offering price set forth on the cover of this prospectus. Any shares sold by the underwriters to securities dealers may be sold at a discount of up to $ per share from the initial public offering price. After the initial offering of the shares, the representatives may change the offering price and the other selling terms. The offering of the shares by the underwriters is subject to receipt and acceptance and subject to the underwriters’ right to reject any order in whole or in part.
The Company and its officers, directors, the selling stockholders and holders of substantially all of the Company’s common stock have agreed with the underwriters, subject to certain exceptions, not to
142
Table of Contents
dispose of or hedge any of their common stock or securities convertible into or exchangeable for shares of common stock during the period from the date of this prospectus continuing through the date 180 days after the date of this prospectus, except with the prior written consent of the representatives. However, the foregoing will not apply to, among other things, (i) the sale or issuance of securities of the Company pursuant to employee benefit plans and stock option, restricted stock and other equity plans described in this prospectus, (ii) the filing of any registration statement on Form S-8 and (iii) offers, sales and issuances of up to 10% of the Company’s stock outstanding at the time of the issuance as consideration or partial consideration for acquisitions of businesses, properties or assets or in connection with the formation of joint ventures. In addition, our directors and executive officers and our existing stockholders may make transfers of our common stock during the 180-day restricted period, among other things, (i) as a bona fide gift or gifts, (ii) by will or other testamentary document or intestate succession, (iii) to any trust, partnership, limited liability company or other entity for the direct or indirect benefit of such director, officer or stockholder or the immediate family of such person, (iv) to any immediate family member or other dependent, (v) for bona fide tax planning purposes, (vi) to such director’s, officer’s or stockholder’s direct or indirect affiliates, provided that such transferee agrees to be bound in writing by such restrictions, (vii) to a nominee or custodian of a person or entity to whom a disposition or transfer would be permissible under clauses (i) through (vi) above, (viii) pursuant to an order of a court or regulatory agency, (ix) in connection with transactions by any person other than the Company relating to shares acquired in open market transactions after the completion of this offering, or (x) from an executive officer to the Company or its parent entities (A) upon death, disability or termination of employment, in each case, of such executive officer or (B) to satisfy tax withholding and other obligations in connection with the exercise of stock options awarded under to executive; provided that in the case of each transfer or distribution pursuant to clauses (i) through (vii) above, (a) each donee, trustee, distributee or transferee, as the case may be, agrees to be bound in writing by such restrictions and (b) any such transfer or distribution shall not involve a disposition for value, and, in the case of each transfer or distribution pursuant to clauses (i), (ii), (iii), (iv), (v), (vi), (vii), (ix) and (x) above, no public reports or filings reporting a reduction in beneficial ownership of stock shall be required or shall be voluntarily made during the 180-day period (other than a filing on Form 5 made after the expiration of the 180-day period). See “Shares Eligible for Future Sale” for a discussion of certain transfer restrictions.
Prior to the offering, there has been no public market for the shares. The initial public offering price has been negotiated among the Company and the representatives. Among the factors to be considered in determining the initial public offering price of the shares, in addition to prevailing market conditions, will be the Company’s historical performance, estimates of the business potential and earnings prospects of the Company, an assessment of the Company’s management and the consideration of the above factors in relation to market valuation of companies in related businesses.
We have been approved to list the common stock on NASDAQ under the symbol “STCK.” In order to meet one of the requirements for listing the common stock on NASDAQ, the underwriters have undertaken to sell lots of 100 or more shares to a minimum of 450 beneficial holders.
In connection with the offering, the underwriters may purchase and sell shares of common stock in the open market. These transactions may include short sales, stabilizing transactions and purchases to cover positions created by short sales. Short sales involve the sale by the underwriters of a greater number of shares than they are required to purchase in the offering, and a short position represents the amount of such sales that have not been covered by subsequent purchases. A “covered short position” is a short position that is not greater than the amount of additional shares for which the underwriters’ option described above may be exercised. The underwriters may cover any covered short position by either exercising their option to purchase additional shares or purchasing shares in the open market. In determining the source of shares to cover the covered short position, the underwriters will consider, among other things, the price of shares available for purchase in the open
143
Table of Contents
market as compared to the price at which they may purchase additional shares pursuant to the option described above. “Naked” short sales are any short sales that create a short position greater than the amount of additional shares for which the option described above may be exercised. The underwriters must cover any such naked short position by purchasing shares in the open market. A naked short position is more likely to be created if the underwriters are concerned that there may be downward pressure on the price of the common stock in the open market after pricing that could adversely affect investors who purchase in the offering. Stabilizing transactions consist of various bids for or purchases of common stock made by the underwriters in the open market prior to the completion of the offering.
The underwriters may also impose a penalty bid. This occurs when a particular underwriter repays to the underwriters a portion of the underwriting discount received by it because the representatives have repurchased shares sold by or for the account of such underwriter in stabilizing or short covering transactions.
Purchases to cover a short position and stabilizing transactions, as well as other purchases by the underwriters for their own accounts, may have the effect of preventing or retarding a decline in the market price of the Company’s stock, and together with the imposition of the penalty bid, may stabilize, maintain or otherwise affect the market price of the common stock. As a result, the price of the common stock may be higher than the price that otherwise might exist in the open market. The underwriters are not required to engage in these activities and may end any of these activities at any time. These transactions may be effected on NASDAQ or relevant exchange, in the over-the-counter market or otherwise.
European Economic Area
In relation to each Member State of the European Economic Area which has implemented the Prospectus Directive (each, a “Relevant Member State”), an offer to the public of any shares which are the subject of the offering contemplated by this Prospectus (the “shares”) may not be made in that Relevant Member State, except that an offer to the public in that Relevant Member State of any shares may be made at any time under the following exemptions under the Prospectus Directive, if they have been implemented in that Relevant Member State:
| (a) | to any legal entity which is a qualified investor as defined in the Prospectus Directive; |
| (b) | to fewer than 100 or, if the Relevant Member State has implemented the relevant provision of the 2010 PD Amending Directive, 150, natural or legal persons (other than qualified investors as defined in the Prospectus Directive), as permitted under the Prospectus Directive, subject to obtaining the prior consent of the representatives for any such offer; or |
| (c) | in any other circumstances falling within Article 3(2) of the Prospectus Directive, provided that no such offer of shares shall result in a requirement for the publication by the Company or any representative of a prospectus pursuant to Article 3 of the Prospectus Directive. |
For the purposes of this provision, the expression an “offer of shares to the public” in relation to any shares in any Relevant Member State means the communication in any form and by any means of sufficient information on the terms of the offer and any shares to be offered so as to enable an investor to decide to purchase any shares, as the same may be varied in that Relevant Member State, the expression “Prospectus Directive” means Directive 2003/71/EC (and amendments thereto, including the 2010 PD Amending Directive, to the extent implemented in the Relevant Member State) and includes any relevant implementing measure in each Relevant Member State, and the expression “2010 PD Amending Directive” means Directive 2010/73/EU.
144
Table of Contents
Each underwriter has represented and agreed that:
| (a) | it has only communicated or caused to be communicated and will only communicate or cause to be communicated an invitation or inducement to engage in investment activity (within the meaning of Section 21 of the FSMA) received by it in connection with the issue or sale of the shares in circumstances in which Section 21(1) of the FSMA would not, if the Issuer was not an authorised person, apply to the Issuer; and |
| (b) | it has complied and will comply with all applicable provisions of the FSMA with respect to anything done by it in relation to the shares in, from or otherwise involving the United Kingdom. |
The shares may not be offered or sold by means of any document other than (i) in circumstances which do not constitute an offer to the public within the meaning of the Companies Ordinance (Cap.32, Laws of Hong Kong), or (ii) to “professional investors” within the meaning of the Securities and Futures Ordinance (Cap.571, Laws of Hong Kong) and any rules made thereunder or (iii) in other circumstances which do not result in the document being a “prospectus” within the meaning of the Companies Ordinance (Cap.32, Laws of Hong Kong), and no advertisement, invitation or document relating to the shares may be issued or may be in the possession of any person for the purpose of issue (in each case whether in Hong Kong or elsewhere), which is directed at, or the contents of which are likely to be accessed or read by, the public in Hong Kong (except if permitted to do so under the laws of Hong Kong) other than with respect to shares which are or are intended to be disposed of only to persons outside Hong Kong or only to “professional investors” within the meaning of the Securities and Futures Ordinance (Cap. 571, Laws of Hong Kong) and any rules made thereunder.
This prospectus has not been registered as a prospectus with the Monetary Authority of Singapore. Accordingly, this prospectus and any other document or material in connection with the offer or sale, or invitation for subscription or purchase, of the shares may not be circulated or distributed, nor may the shares be offered or sold, or be made the subject of an invitation for subscription or purchase, whether directly or indirectly, to persons in Singapore other than (i) to an institutional investor under Section 274 of the Securities and Futures Act, Chapter 289 of Singapore (the “SFA”), (ii) to a relevant person, or any person pursuant to Section 275(1A), and in accordance with the conditions, specified in Section 275 of the SFA or (iii) otherwise pursuant to, and in accordance with the conditions of, any other applicable provision of the SFA.
Where the shares are subscribed or purchased under Section 275 by a relevant person which is: (a) a corporation (which is not an accredited investor) the sole business of which is to hold investments and the entire share capital of which is owned by one or more individuals, each of whom is an accredited investor; or (b) a trust (where the trustee is not an accredited investor) whose sole purpose is to hold investments and each beneficiary is an accredited investor, shares, debentures and units of shares and debentures of that corporation or the beneficiaries’ rights and interest in that trust shall not be transferable for 6 months after that corporation or that trust has acquired the shares under Section 275 except: (1) to an institutional investor under Section 274 of the SFA or to a relevant person, or any person pursuant to Section 275(1A), and in accordance with the conditions, specified in Section 275 of the SFA; (2) where no consideration is given for the transfer or (3) by operation of law.
The securities have not been and will not be registered under the Financial Instruments and Exchange Law of Japan (the Financial Instruments and Exchange Law) and each underwriter has agreed that it will not offer or sell any securities, directly or indirectly, in Japan or to, or for the benefit of, any resident of Japan (which term as used herein means any person resident in Japan, including any corporation or other entity organized under the laws of Japan), or to others for re-offering or resale, directly or indirectly, in Japan or to a resident of Japan, except pursuant to an exemption from the registration requirements of, and otherwise in compliance with, the Financial Instruments and Exchange Law and any other applicable laws, regulations and ministerial guidelines of Japan.
145
Table of Contents
At the Company’s request, the underwriters have reserved up to 5% of the shares offered hereby for sale at the initial public offering price to persons who are directors, officers or other employees, or who are otherwise associated with the Company, through a directed share program. The number of shares available for sale to the general public will be reduced by the number of directed shares purchased by participants in the program. The directed share program will be arranged through one of the underwriters, Barclays Capital Inc. Except for the Company’s officers and directors at the time of consummation of the offering who have entered into lock-up agreements, each person buying shares through the directed share program has agreed that, for a period of 180 days from the date of this prospectus, he or she will not, without the prior written consent of each of the representatives, dispose of or hedge any shares of the Company’s common stock or any securities convertible into or exchangeable for the Company’s common stock.
The underwriters do not expect sales to discretionary accounts to exceed five percent of the total number of shares offered.
The Company and the selling stockholders estimate that their share of the total expenses of the offering, excluding underwriting discounts and commissions, will be approximately $2,250,000.
The Company has agreed to reimburse the underwriters for all expenses relating to the clearance of this offering with FINRA up to $35,000.
The Company and the selling stockholders have agreed to indemnify the several underwriters against certain liabilities, including liabilities under the Securities Act.
The underwriters and their respective affiliates are full service financial institutions engaged in various activities, which may include sales and trading, commercial and investment banking, advisory, investment management, investment research, principal investment, hedging, market making, brokerage and other financial and non-financial activities and services. Certain of the underwriters and their respective affiliates have provided, and may in the future provide, a variety of these services to the issuer and to persons and entities with relationships with the issuer, for which they received or will receive customary fees and expenses.
In the ordinary course of their various business activities, the underwriters and their respective affiliates, officers, directors and employees may purchase, sell or hold a broad array of investments and actively trade securities, derivatives, loans, commodities, currencies, credit default swaps and other financial instruments for their own account and for the accounts of their customers, and such investment and trading activities may involve or relate to assets, securities and/or instruments of the issuer (directly, as collateral securing other obligations or otherwise) and/or persons and entities with relationships with the issuer. The underwriters and their respective affiliates may also communicate independent investment recommendations, market color or trading ideas and/or publish or express independent research views in respect of such assets, securities or instruments and may at any time hold, or recommend to clients that they should acquire, long and/or short positions in such assets, securities and instruments.
Conflicts of Interest
Because more than 5% of the net offering proceeds will be paid to an affiliate of Wells Fargo Securities, LLC, this offering is being conducted in accordance with the applicable provisions of Rule 5121 of the Conduct Rules of FINRA. Wells Fargo Securities, LLC will have a “conflict of interest” pursuant to Rule 5121(f)(5)(C)(i) by virtue of the role of its affiliate as a lender under our Revolver, since a portion of the net proceeds of this offering will be received by such affiliate according to its proportionate share in its capacity as lender. As such, Wells Fargo Securities, LLC will not confirm sales to accounts in which it exercises discretionary authority without the prior written consent of the customer.
146
Table of Contents
The validity of the common stock offered hereby will be passed upon for us by Kirkland & Ellis LLP (a partnership that includes professional corporations), Chicago, Illinois. The underwriters are being represented by Davis Polk & Wardwell LLP, New York, New York. Kirkland & Ellis LLP has from time to time represented and may continue to represent, Gores and some of its affiliates in connection with various legal matters.
The consolidated financial statements as of December 31, 2012 and 2011, and for each of the three years in the period ended December 31, 2012 included in this prospectus have been so included in reliance on the report (which contains an explanatory paragraph relating to the Company’s restatement of its consolidated financial statements as described in note (2) to the financial statements) of PricewaterhouseCoopers LLP, an independent registered public accounting firm, given on the authority of said firm as experts in auditing and accounting.
WHERE YOU CAN FIND MORE INFORMATION
We have filed a registration statement on Form S-1 with the SEC with respect to our common stock being distributed as contemplated by this prospectus. This prospectus is a part of and does not contain all of the information set forth in the registration statement and the exhibits and schedules to the registration statement. For further information with respect to the Company and our common stock, please refer to the registration statement, including its exhibits and schedules. Statements made in this prospectus relating to any contract or other document are not necessarily complete and you should refer to the exhibits attached to the registration statement for copies of the actual contract or document. You may read and copy all materials that we file with the SEC, including the registration statement and its exhibits and schedules, at the SEC’s public reference room, located at 100 F Street, N.E., Washington, D.C. 20549, as well as on the Internet website maintained by the SEC at www.sec.gov. Please call the SEC at 1-800-SEC-0330 for more information on the public reference room. Information contained on any website referenced in this prospectus does not and will not constitute a part of this prospectus or the registration statement on Form S-1 of which this prospectus is a part.
In addition, we will file periodic reports and other information with the SEC.
You may request a copy of any of our filings with the SEC at no cost, by writing or telephoning us at the following address:
Stock Building Supply Holdings, Inc.
8020 Arco Corporate Drive, Suite 400
Raleigh, North Carolina 27617
Attention: General Counsel
Phone: (919) 431-1000
You should rely only on the information contained in this prospectus or to which we have referred you. We have not authorized any person to provide you with different information or to make any representation not contained in this prospectus.
147
Table of Contents
Audited Consolidated Financial Statements
Unaudited Consolidated Financial Statements
F-1
Table of Contents
REPORT OF INDEPENDENT REGISTERED PUBLIC ACCOUNTING FIRM
To the Board of Directors and
Stockholders of Stock Building Supply Holdings, Inc. and Subsidiaries (the “Company”):
In our opinion, the accompanying consolidated balance sheets and the related consolidated statements of operations, of stockholders’ equity and of cash flows present fairly, in all material respects, the financial position of Stock Building Supply Holdings, Inc. and its subsidiaries at December 31, 2011 and December 31, 2012, and the results of their operations and their cash flows for each of the three years in the period ended December 31, 2012 in conformity with accounting principles generally accepted in the United States of America. These financial statements are the responsibility of the Company’s management. Our responsibility is to express an opinion on these financial statements based on our audits. We conducted our audits of these statements in accordance with the standards of the Public Company Accounting Oversight Board (United States). Those standards require that we plan and perform the audit to obtain reasonable assurance about whether the financial statements are free of material misstatement. An audit includes examining, on a test basis, evidence supporting the amounts and disclosures in the financial statements, assessing the accounting principles used and significant estimates made by management, and evaluating the overall financial statement presentation. We believe that our audits provide a reasonable basis for our opinion.
As discussed in Note 3 to the consolidated financial statements, the Company changed the manner in which it accounts for revenue from contracts with service elements.
As discussed in Note 2 to the consolidated financial statements, the Company has restated its 2012 consolidated financial statements to correct an error.
/s/ PricewaterhouseCoopers LLP
Raleigh, North Carolina
May 7, 2013, except for the effects of the earnings per share revision described in Note 3, as to which the date is June 14, 2013 and except for the effects of the restatement described in Note 2 and the stock split described in Note 21, as to which the date is July 29, 2013
F-2
Table of Contents
STOCK BUILDING SUPPLY HOLDINGS, INC. AND SUBSIDIARIES
CONSOLIDATED BALANCE SHEETS
| December 31, | ||||||||
| 2011 | 2012 | |||||||
| (in thousands of dollars, except share and per share amounts) | as restated (Note 2) |
|||||||
| Assets |
||||||||
| Current assets |
||||||||
| Cash and cash equivalents |
$ | 4,957 | $ | 2,691 | ||||
| Restricted assets |
4,348 | 3,821 | ||||||
| Accounts receivable, net |
65,206 | 90,297 | ||||||
| Inventories, net |
49,682 | 73,918 | ||||||
| Costs in excess of billings on uncompleted contracts |
3,888 | 5,176 | ||||||
| Assets held for sale |
6,180 | 6,198 | ||||||
| Prepaid expenses and other current assets |
7,897 | 8,682 | ||||||
| Income taxes receivable |
9,171 | — | ||||||
| Deferred income taxes |
4,126 | 3,562 | ||||||
|
|
|
|
|
|||||
| Total current assets |
155,455 | 194,345 | ||||||
| Property and equipment, net of accumulated depreciation |
57,759 | 55,076 | ||||||
| Intangible assets, net of accumulated amortization |
19,752 | 25,865 | ||||||
| Goodwill |
6,511 | 6,511 | ||||||
| Restricted assets |
4,744 | 2,202 | ||||||
| Other assets |
10,420 | 2,013 | ||||||
|
|
|
|
|
|||||
| Total assets |
$ | 254,641 | $ | 286,012 | ||||
|
|
|
|
|
|||||
| Liabilities and Stockholders’ Equity |
||||||||
| Current liabilities |
||||||||
| Accounts payable |
$ | 45,019 | $ | 74,231 | ||||
| Accrued expenses and other liabilities |
28,555 | 25,277 | ||||||
| Revolving line of credit |
33,850 | 72,218 | ||||||
| Income taxes payable |
— | 2,939 | ||||||
| Current portion of restructuring reserve |
1,584 | 1,513 | ||||||
| Current portion of capital lease obligation |
1,243 | 1,329 | ||||||
| Billings in excess of costs on uncompleted contracts |
1,108 | 1,239 | ||||||
|
|
|
|
|
|||||
| Total current liabilities |
111,359 | 178,746 | ||||||
| Deferred income taxes |
21,180 | 16,983 | ||||||
| Other long-term liabilities |
15,679 | 14,642 | ||||||
|
|
|
|
|
|||||
| Total liabilities |
148,218 | 210,371 | ||||||
|
|
|
|
|
|||||
| Commitments and contingencies (Note 16) |
||||||||
| Redeemable Class A Junior Preferred stock, $.01 par value, 10,000 shares authorized and issued, 5,100 shares outstanding at December 31, 2011 and 2012 |
— | — | ||||||
| Redeemable Class B Senior Preferred stock, $.01 par value, 500,000 shares authorized, 75,000 shares issued, 48,760 and 36,388 shares outstanding at December 31, 2011 and 2012, respectively |
54,997 | 36,477 | ||||||
| Convertible Class C Preferred stock, $.01 par value, 5,000 shares authorized and issued, 0 and 5,000 shares outstanding at December 31, 2011 and 2012, respectively |
— | 5,000 | ||||||
| Stockholders’ equity |
||||||||
| Class A common stock, $.01 par value, 22,725,500 shares authorized and issued, 11,590,005 shares outstanding at December 31, 2011 and 2012 |
$ | 116 | $ | 116 | ||||
| Class B common stock, $.01 par value, 3,246,500 shares authorized, 1,700,803 and 2,870,712 shares issued and outstanding at December 31, 2011 and 2012, respectively |
17 | 29 | ||||||
| Additional paid-in capital |
49,275 | 46,534 | ||||||
| Retained earnings (deficit) |
2,018 | (12,515 | ) | |||||
|
|
|
|
|
|||||
| Total stockholders’ equity |
51,426 | 34,164 | ||||||
|
|
|
|
|
|||||
| Total liabilities and stockholders’ equity |
$ | 254,641 | $ | 286,012 | ||||
|
|
|
|
|
|||||
The accompanying notes are an integral part of these consolidated financial statements.
F-3
Table of Contents
STOCK BUILDING SUPPLY HOLDINGS, INC. AND SUBSIDIARIES
CONSOLIDATED STATEMENTS OF OPERATIONS
| Years ended December 31, | ||||||||||||
| (in thousands of dollars, except share and per share amounts) | 2010 | 2011 | 2012 | |||||||||
| as restated (Note 2) |
||||||||||||
| Net sales |
$ | 751,706 | $ | 759,982 | $ | 942,398 | ||||||
| Cost of goods sold |
587,692 | 591,017 | 727,670 | |||||||||
|
|
|
|
|
|
|
|||||||
| Gross profit |
164,014 | 168,965 | 214,728 | |||||||||
|
|
|
|
|
|
|
|||||||
| Selling, general and administrative expenses |
246,338 | 213,036 | 221,192 | |||||||||
| Depreciation expense |
29,337 | 11,844 | 7,759 | |||||||||
| Amortization expense |
1,140 | 1,457 | 1,470 | |||||||||
| Impairment of assets held for sale |
2,944 | 580 | 361 | |||||||||
| Restructuring expense |
7,089 | 1,349 | 2,853 | |||||||||
|
|
|
|
|
|
|
|||||||
| 286,848 | 228,266 | 233,635 | ||||||||||
|
|
|
|
|
|
|
|||||||
| Loss from operations |
(122,834 | ) | (59,301 | ) | (18,907 | ) | ||||||
| Other income (expenses) |
||||||||||||
| Bargain purchase gain |
11,223 | — | — | |||||||||
| Interest expense |
(1,575 | ) | (2,842 | ) | (4,037 | ) | ||||||
| Other income (expense), net |
(57 | ) | (2,120 | ) | 278 | |||||||
|
|
|
|
|
|
|
|||||||
| Loss from continuing operations before income taxes |
(113,243 | ) | (64,263 | ) | (22,666 | ) | ||||||
| Income tax benefit |
47,463 | 22,332 | 8,084 | |||||||||
|
|
|
|
|
|
|
|||||||
| Loss from continuing operations |
(65,780 | ) | (41,931 | ) | (14,582 | ) | ||||||
| Income (loss) from discontinued operations, net of tax benefit (provision) of $4,038, ($658) and ($52), respectively |
(4,214 | ) | (202 | ) | 49 | |||||||
|
|
|
|
|
|
|
|||||||
| Net loss |
(69,994 | ) | (42,133 | ) | (14,533 | ) | ||||||
| Redeemable Class B Senior Preferred stock dividend |
(5,079 | ) | (4,188 | ) | (4,480 | ) | ||||||
| Convertible Class C Preferred stock dividend |
— | — | (5,000 | ) | ||||||||
|
|
|
|
|
|
|
|||||||
| Loss attributable to common stockholders |
(75,073 | ) | (46,321 | ) | (24,013 | ) | ||||||
|
|
|
|
|
|
|
|||||||
| Weighted average common shares outstanding basic and diluted |
23,502,470 | 22,262,337 | 13,153,446 | |||||||||
| Basic and diluted loss per share |
||||||||||||
| Loss from continuing operations |
$ | (3.01 | ) | $ | (2.07 | ) | $ | (1.83 | ) | |||
| Loss from discontinued operations |
(0.18 | ) | (0.01 | ) | — | |||||||
|
|
|
|
|
|
|
|||||||
| Net loss |
$ | (3.19 | ) | $ | (2.08 | ) | $ | (1.83 | ) | |||
|
|
|
|
|
|
|
|||||||
| Proforma net loss per share, basic and diluted (unaudited) |
$ | (0.70 | ) | |||||||||
|
|
|
|||||||||||
| Weighted average shares used in computing pro forma net loss per share, basic and diluted (unaudited) |
20,843,758 | |||||||||||
The accompanying notes are an integral part of these consolidated financial statements.
F-4
Table of Contents
STOCK BUILDING SUPPLY HOLDINGS, INC. AND SUBSIDIARIES
CONSOLIDATED STATEMENTS OF STOCKHOLDERS’ EQUITY
| Common Stock | Additional Paid-in Capital |
Retained Earnings (Deficit) |
Total | |||||||||||||||||||||||||
| Class A | Class B | |||||||||||||||||||||||||||
| (in thousands of dollars, except share amounts) | Shares | Amount | Shares | Amount | ||||||||||||||||||||||||
| Stockholders’ equity as of December 31, 2009 |
22,725,500 | $ | 227 | 2,272,550 | $ | 23 | $ | 73,351 | $ | 123,412 | $ | 197,013 | ||||||||||||||||
| Dividends accrued on Class B Preferred stock |
— | — | — | — | — | (5,079 | ) | (5,079 | ) | |||||||||||||||||||
| Issuance of common stock |
— | — | 38,595 | — | 100 | — | 100 | |||||||||||||||||||||
| Stockholder loans related to tax withholding on stock issuance |
— | — | — | — | (99 | ) | — | (99 | ) | |||||||||||||||||||
| Issuance of nonvested stock awards, net of forfeitures |
— | — | (337,636 | ) | (3 | ) | 3 | — | — | |||||||||||||||||||
| Stock compensation expense |
— | — | — | 288 | — | 288 | ||||||||||||||||||||||
| Net loss |
— | — | — | — | — | (69,994 | ) | (69,994 | ) | |||||||||||||||||||
|
|
|
|
|
|
|
|
|
|
|
|
|
|
|
|||||||||||||||
| Stockholders’ equity as of December 31, 2010 |
22,725,500 | 227 | 1,973,509 | 20 | 73,643 | 48,339 | 122,229 | |||||||||||||||||||||
| Dividends accrued on Class B Preferred stock |
— | — | — | — | — | (4,188 | ) | (4,188 | ) | |||||||||||||||||||
| Purchase of shares from existing stockholders |
(11,135,495 | ) | (111 | ) | — | — | (24,889 | ) | — | (25,000 | ) | |||||||||||||||||
| Stockholder loans related to tax withholding on stock issuance |
— | — | — | — | 134 | — | 134 | |||||||||||||||||||||
| Issuance of nonvested stock awards, net of forfeitures |
— | — | (272,706 | ) | (3 | ) | 3 | — | — | |||||||||||||||||||
| Stock compensation expense |
— | — | — | — | 384 | — | 384 | |||||||||||||||||||||
| Net loss |
— | — | — | — | — | (42,133 | ) | (42,133 | ) | |||||||||||||||||||
|
|
|
|
|
|
|
|
|
|
|
|
|
|
|
|||||||||||||||
| Stockholders’ equity as of December 31, 2011 |
11,590,005 | 116 | 1,700,803 | 17 | 49,275 | 2,018 | 51,426 | |||||||||||||||||||||
| Recognition of beneficial conversion feature on Convertible Class C Preferred stock |
— | — | — | — | 5,000 | — | 5,000 | |||||||||||||||||||||
| Deemed dividend on Convertible Class C Preferred stock |
— | — | — | — | (5,000 | ) | — | (5,000 | ) | |||||||||||||||||||
| Dividends accrued on Class B Preferred stock |
— | — | — | — | (4,480 | ) | — | (4,480 | ) | |||||||||||||||||||
| Issuance of common stock to related party (Note 14) |
— | — | 110,381 | 1 | 106 | — | 107 | |||||||||||||||||||||
| Issuance of shares to existing stockholders |
— | — | 337,636 | 3 | 325 | — | 328 | |||||||||||||||||||||
| Stockholder loans related to tax withholding on stock issuance |
— | — | — | — | 11 | — | 11 | |||||||||||||||||||||
| Issuance of nonvested stock awards, net of forfeitures |
— | — | 175,648 | 2 | (2 | ) | — | — | ||||||||||||||||||||
| Exercise of stock options (Note 18) |
— | — | 546,244 | 6 | (6 | ) | — | — | ||||||||||||||||||||
| Stock compensation expense |
— | — | — | — | 1,305 | — | 1,305 | |||||||||||||||||||||
| Net loss |
— | — | — | — | — | (14,533 | ) | (14,533 | ) | |||||||||||||||||||
|
|
|
|
|
|
|
|
|
|
|
|
|
|
|
|||||||||||||||
| Stockholders’ equity as of December 31, 2012 (as restated, Note 2) |
11,590,005 | $ | 116 | 2,870,712 | $ | 29 | $ | 46,534 | $ | (12,515 | ) | $ | 34,164 | |||||||||||||||
|
|
|
|
|
|
|
|
|
|
|
|
|
|
|
|||||||||||||||
The accompanying notes are an integral part of these consolidated financial statements.
F-5
Table of Contents
STOCK BUILDING SUPPLY HOLDINGS, INC. AND SUBSIDIARIES
CONSOLIDATED STATEMENTS OF CASH FLOWS
| Years ended December 31, | ||||||||||||
| (in thousands of dollars) | 2010 | 2011 | 2012 | |||||||||
| as restated (Note 2) |
||||||||||||
| Cash flows from operating activities |
||||||||||||
| Net loss |
$ | (69,994 | ) | $ | (42,133 | ) | $ | (14,533 | ) | |||
| Adjustments to reconcile net loss to net cash used in operating activities |
||||||||||||
| Depreciation expense |
38,915 | 15,257 | 10,299 | |||||||||
| Amortization of intangible assets |
1,166 | 1,457 | 1,470 | |||||||||
| Amortization of debt issuance costs |
1,252 | 1,553 | 902 | |||||||||
| Change in deferred income taxes |
(25,046 | ) | (5,926 | ) | (3,633 | ) | ||||||
| Noncash stock compensation expense |
288 | 384 | 1,305 | |||||||||
| Impairment of assets held for sale |
3,607 | 610 | 481 | |||||||||
| (Gain) loss on sale of property, equipment and real estate held for sale |
1,970 | (2,609 | ) | 169 | ||||||||
| Bad debt expense |
2,463 | 1,753 | 2,333 | |||||||||
| Gain on bargain purchase |
(11,223 | ) | — | — | ||||||||
| Gain on sale of operations |
(3,098 | ) | — | — | ||||||||
| Change in assets and liabilities, net of effects of companies acquired |
||||||||||||
| Restricted cash for payment of leases rejected in bankruptcy |
14,786 | — | — | |||||||||
| Accounts receivable |
35,410 | (677 | ) | (27,026 | ) | |||||||
| Inventories, net |
7,472 | 14,593 | (22,712 | ) | ||||||||
| Costs in excess of billings on uncompleted contracts |
(444 | ) | (1,165 | ) | (1,288 | ) | ||||||
| Prepaid expenses and other current assets |
5,894 | 1,022 | (784 | ) | ||||||||
| Current income taxes receivable/payable |
(54,107 | ) | 8,920 | 12,110 | ||||||||
| Other assets |
3,383 | (5,771 | ) | 2,314 | ||||||||
| Accounts payable |
5,114 | (1,162 | ) | 24,821 | ||||||||
| Accrued expenses and other liabilities |
(2,379 | ) | (699 | ) | 1,798 | |||||||
| Restructuring reserve |
(1,329 | ) | (462 | ) | 1,125 | |||||||
| Billings in excess of costs on uncompleted contracts |
74 | 47 | 131 | |||||||||
| Lease rejection reserve |
(11,165 | ) | — | — | ||||||||
| Other long-term liabilities |
(1,008 | ) | 8,007 | (1,525 | ) | |||||||
|
|
|
|
|
|
|
|||||||
| Net cash used in operating activities |
(57,999 | ) | (7,001 | ) | (12,243 | ) | ||||||
|
|
|
|
|
|
|
|||||||
| Cash flows from investing activities |
||||||||||||
| Restricted assets |
(9,897 | ) | 2,555 | 3,069 | ||||||||
| Proceeds from sale of operations |
46,831 | — | — | |||||||||
| Purchase of businesses |
(49,848 | ) | — | (5,732 | ) | |||||||
| Loan to seller of TBSG (Note 4) |
— | — | (850 | ) | ||||||||
| Proceeds from sale of property and equipment |
18,201 | 5,220 | 952 | |||||||||
| Proceeds from sale of real estate held for sale |
5,312 | 886 | 441 | |||||||||
| Purchases of property and equipment |
(2,506 | ) | (1,339 | ) | (2,741 | ) | ||||||
|
|
|
|
|
|
|
|||||||
| Net cash provided by (used in) investing activities |
8,093 | 7,322 | (4,861 | ) | ||||||||
|
|
|
|
|
|
|
|||||||
F-6
Table of Contents
STOCK BUILDING SUPPLY HOLDINGS, INC. AND SUBSIDIARIES
CONSOLIDATED STATEMENTS OF CASH FLOWS
| Years ended December 31, | ||||||||||||
| (in thousands of dollars) | 2010 | 2011 | 2012 | |||||||||
| as restated (Note 2) |
||||||||||||
| Cash flows from financing activities |
||||||||||||
| Proceeds from revolving line of credit |
219,350 | 787,394 | 1,042,850 | |||||||||
| Repayments of proceeds from revolving line of credit |
(206,350 | ) | (766,544 | ) | (1,004,482 | ) | ||||||
| Redemption of Class B Preferred stock |
(26,240 | ) | — | (12,372 | ) | |||||||
| Redemption of Class A Preferred stock and Class A common stock (Note 1) |
— | (25,000 | ) | — | ||||||||
| Cash received from stockholder |
— | 5,000 | — | |||||||||
| Loans from related parties |
171 | 134 | 11 | |||||||||
| Sale of Class B common stock |
100 | — | 328 | |||||||||
| Dividends paid on Class B Preferred stock |
(6,060 | ) | — | (10,628 | ) | |||||||
| Payments of debt issuance costs |
(213 | ) | — | (555 | ) | |||||||
| Payments on capital leases |
(1,173 | ) | (1,511 | ) | (1,311 | ) | ||||||
| Secured borrowings |
— | 665 | 997 | |||||||||
|
|
|
|
|
|
|
|||||||
| Net cash provided by (used in) financing activities |
(20,415 | ) | 138 | 14,838 | ||||||||
|
|
|
|
|
|
|
|||||||
| Net increase (decrease) in cash and cash equivalents |
(70,321 | ) | 459 | (2,266 | ) | |||||||
| Cash and cash equivalents |
||||||||||||
| Beginning of period |
74,819 | 4,498 | 4,957 | |||||||||
|
|
|
|
|
|
|
|||||||
| End of period |
$ | 4,498 | $ | 4,957 | $ | 2,691 | ||||||
|
|
|
|
|
|
|
|||||||
| Supplemental disclosure of cash flow information |
||||||||||||
| Interest paid |
$ | 291 | $ | 1,165 | $ | 3,046 | ||||||
| Income taxes paid |
31,107 | 2,049 | 244 | |||||||||
| Income tax refunds received |
— | 24,782 | 16,399 | |||||||||
| Noncash investing and financing transactions |
||||||||||||
| Disposals of capital lease assets |
1,032 | 198 | — | |||||||||
| Capital lease obligations |
1,246 | 1,401 | 6,135 | |||||||||
| Issuance of Convertible Class C Preferred stock (Note 14) |
— | — | 5,000 | |||||||||
| Issuance of Class B common stock (Note 14) |
— | — | 107 | |||||||||
| Dividends accrued on Class B Preferred stock (Note 14) |
5,079 | 4,188 | 4,480 | |||||||||
| Dividends on Convertible Class C Preferred stock (Note 14) |
— | — | 5,000 | |||||||||
| Beneficial conversion feature on Convertible Class C Preferred stock (Note 14) |
— | — | 5,000 | |||||||||
| Fair value of earnout agreement (Note 4) |
— | — | 1,075 | |||||||||
The accompanying notes are an integral part of these consolidated financial statements.
F-7
Table of Contents
STOCK BUILDING SUPPLY HOLDINGS, INC. AND SUBSIDIARIES
NOTES TO CONSOLIDATED FINANCIAL STATEMENTS
(All amounts are presented in thousands except share and per share amounts.)
1. Organization
Stock Building Supply Holdings, Inc., formerly known as Saturn Acquisition Holdings, LLC (“Saturn”), was organized as a limited liability company on April 16, 2009, under the laws of the State of Delaware and had no principal operations prior to the acquisition of Stock Building Supply Holdings, LLC and Subsidiaries (“SBS”) on May 5, 2009 (“Acquisition Date”). Prior to May 5, 2009, SBS was an indirect wholly-owned subsidiary of Wolseley plc (“Wolseley”). On May 5, 2009, Wolseley entered into a transaction with Gores Building Holdings, LLC (“Gores”), whereby Gores contributed $1 for a 51% voting interest in Saturn and Wolseley transferred 100% of the membership interest in SBS to Saturn in exchange for $1 and a 49% voting interest in Saturn pursuant to the terms of the Restructuring and Investment Agreement dated May 5, 2009.
On May 6, 2009, SBS filed voluntary petitions for relief under Chapter 11 of the U.S. Bankruptcy Code in the United States Bankruptcy Court (collectively “Bankruptcy”). The plan of reorganization enabled SBS to reject certain operating leases for real property in locations where operations were being discontinued. SBS emerged from Chapter 11 Reorganization on June 30, 2009. For the years ended December 31, 2010, 2011 and 2012, the Company incurred Bankruptcy related fees of $675, $0 and $0, respectively, which are included in selling, general and administrative expenses on the consolidated statements of operations.
On November 16, 2011, Saturn purchased all of Wolseley’s shareholder interests, which included 11,135,495 Class A Voting Common shares and 4,900 Class A Junior Preferred shares, for cash consideration of $25,000. The purchase was financed by $15,000 in borrowings under the revolving line of credit, $5,000 of cash and $5,000 of cash contributed by Gores (Note 17).
On April 23, 2013, the Board of Directors approved an amendment to the Company’s Certificate of Incorporation to effect a change in the name of the Company to Stock Building Supply Holdings, Inc., which was effective May 2, 2013.
Stock Building Supply Holdings, Inc. and Subsidiaries (the “Company,” “we,” “us,” “our,” and “management”) distributes lumber and building materials to new construction and repair and remodel contractors. Additionally, we provide solution-based services to our customers, including design, production specification, and installation management services.
2. Restatement of previously issued consolidated financial statements
The Company has restated its previously issued consolidated financial statements and related footnotes as of and for the year ended December 31, 2012, as set forth in these consolidated financial statements. The Company has updated the methodology utilized in the January 1, 2012 valuation, as well as placed additional weighting on the purchase of Wolseley’s stockholder interests in November 2011 (Note 1). The updated valuation of the Company’s Class A and Class B Common stock resulted in the correction of the following: (i) to correct compensation expense related to a modification of the exercise price of the Company’s outstanding stock options, the issuance of new stock options and shares purchased by management and (ii) to recognize a beneficial conversion feature (“BCF”) for the Convertible Class C Preferred stock and related impact on earnings per share.
The Company recorded additional compensation expense related to the modification of the exercise price of outstanding stock options, the issuance of new options and the purchase of shares by
F-8
Table of Contents
STOCK BUILDING SUPPLY HOLDINGS, INC. AND SUBSIDIARIES
NOTES TO CONSOLIDATED FINANCIAL STATEMENTS
(All amounts are presented in thousands except share and per share amounts.)
management. The Company determined that the increase in the estimated fair value of the Class B Common stock increased the Company’s total compensation expense recognized as a result of these transactions. Accordingly, in the restated consolidated financial statements for the year ended December 31, 2012, the Company increased stock based compensation expense by $506, increased additional paid-in capital by $506, increased income tax benefit by $177, decreased income taxes payable by $177, and increased 2012 basic and diluted loss per share by $0.03 per share.
In addition, the Company has restated its consolidated financial statements to account for a BCF for the Convertible Class C Preferred stock and related accretion of dividends in the first quarter of 2012. On November 16, 2011, the Company purchased 11,135,495 Class A Common stock held by Wolseley for $25,000, or approximately $2.25 per Class A Common share. This purchase was partially financed by $5,000 advanced by Gores Holdings, which in January 2012 was settled by the issuance of 5,000 Convertible Class C Preferred shares to Gores Holdings. The Convertible Class C Preferred shares can be converted to 4,454,889 Class A Common shares, representing an equivalent price of approximately $1.122 per Class A Common share. The Company determined that the difference between the price per share paid to acquire Wolseley’s Class A Common shares of $2.25 and the price per Class A Common share implied in the Convertible Class C Preferred shares of $1.122 represented a BCF totalling $5,000. The Convertible Class C Preferred shares can be converted to Class A Common shares at any time by the stockholder and therefore, the Company immediately recognized the value of the BCF as a deemed dividend, which increased the Company’s 2012 loss attributable to common stockholders by $5,000 and 2012 basic and diluted loss per share by approximately $0.38 per share.
F-9
Table of Contents
STOCK BUILDING SUPPLY HOLDINGS, INC. AND SUBSIDIARIES
NOTES TO CONSOLIDATED FINANCIAL STATEMENTS
(All amounts are presented in thousands except share and per share amounts.)
The accompanying December 31, 2012 basic and diluted loss per share amounts were previously revised by $0.03 in order to properly account for weighted average common shares outstanding. As the adjustment was included in the previously issued consolidated financial statements and related footnotes as of and for the year ended December 31, 2012 as a revision, the adjustment has not been presented in the table below.
The following tables present the effects of the restatement adjustments on the affected line items in the previously reported consolidated statement of operations for the year ended December 31, 2012. The restatement adjustments did not affect the consolidated statements of cash flows for the year ended December 31, 2012 or the December 31, 2012 consolidated balance sheet with the exception of the increase in retained deficit of $329, the decrease in income taxes payable of $177 and the increase in additional paid-in capital of $506 as a result of additional stock based compensation expense recognized. All related amounts have been restated as appropriate within these financial statements.
| Year ended December 31, 2012 |
As reported | Adjustments | Restated | |||||||||
| Selling, general and administrative expense |
$ | 220,686 | $ | 506 | $ | 221,192 | ||||||
| Loss from operations |
(18,401 | ) | (506 | ) | (18,907 | ) | ||||||
| Loss from continuing operations before income taxes |
(22,160 | ) | (506 | ) | (22,666 | ) | ||||||
| Income tax benefit |
7,907 | 177 | 8,084 | |||||||||
| Loss from continuing operations |
(14,253 | ) | (329 | ) | (14,582 | ) | ||||||
| Net loss |
(14,204 | ) | (329 | ) | (14,533 | ) | ||||||
| Redeemable Class B Senior Preferred stock dividend |
(4,480 | ) | — | (4,480 | ) | |||||||
| Accretion of beneficial conversion feature on Convertible Class C Preferred stock |
— | (5,000 | ) | (5,000 | ) | |||||||
|
|
|
|
|
|
|
|||||||
| Loss attributable to common stockholders |
$ | (18,684 | ) | $ | (5,329 | ) | $ | (24,013 | ) | |||
| Basic and diluted income (loss) per share (before impact of 25.972:1 stock split): |
||||||||||||
| Loss from continuing operations |
$ | (36.99 | ) | $ | (10.52 | ) | $ | (47.51 | ) | |||
| Income from discontinued operations |
0.10 | — | 0.10 | |||||||||
|
|
|
|
|
|
|
|||||||
| Net loss |
$ | (36.89 | ) | $ | (10.52 | ) | $ | (47.41 | ) | |||
| Basic and diluted loss per share (after impact of 25.972:1 stock split): |
||||||||||||
| Loss from continuing operations(i) |
$ | (1.42 | ) | $ | (0.41 | ) | $ | (1.83 | ) | |||
| Income from discontinued operations(i) |
— | — | — | |||||||||
|
|
|
|
|
|
|
|||||||
| Net loss(i) |
$ | (1.42 | ) | $ | (0.41 | ) | $ | (1.83 | ) | |||
|
|
|
|
|
|
|
|||||||
| (i) | These figures were not previously reported. |
3. Summary of significant accounting policies
Basis of presentation
The accompanying consolidated financial statements have been prepared by management in conformity with accounting principles generally accepted in the United States of America (“U.S. GAAP”).
Principles of consolidation
The consolidated financial statements include all accounts of Saturn and its subsidiaries. All material intercompany accounts and transactions have been eliminated in consolidation.
F-10
Table of Contents
STOCK BUILDING SUPPLY HOLDINGS, INC. AND SUBSIDIARIES
NOTES TO CONSOLIDATED FINANCIAL STATEMENTS
(All amounts are presented in thousands except share and per share amounts.)
Unaudited pro forma information
Upon the filing of an amended and restated certificate of incorporation in connection with the closing of a qualified initial public offering, all of the outstanding Redeemable Class A Junior Preferred stock will convert into shares of new voting common stock in an amount equal to the liquidation preference thereof divided by the initial public offering price per share to the public (the “IPO Price”), all of the outstanding Redeemable Class B Senior Preferred stock will convert into shares of new voting common stock in an amount equal to the liquidation preference thereof plus accumulated and unpaid dividends thereon divided by the IPO Price, and all of the outstanding Convertible Class C Preferred stock will convert into 4,454,889 shares of new voting common stock. In the accompanying statements of operations, unaudited pro forma basic and diluted net loss per share attributable to common stockholders for the year ended December 31, 2012 has been prepared to give effect to the conversion of all the outstanding shares of all classes of Preferred stock into shares of new voting common stock as though the proposed initial public offering had occurred on January 1, 2012.
The Redeemable Class A Junior Preferred stock and Redeemable Class B Senior Preferred stock have been converted to new voting common stock using the expected mid-point of the initial public offering price, calculated as follows (all amounts used in these calculations are presented as actual, unrounded amounts):
| Redeemable Class A Junior Preferred stock |
5,100 | |||
| Liquidation preference |
$ | 1.00 | ||
|
|
|
|||
| 5,100 | ||||
| Expected mid-point of the initial public offering price |
$ | 17.00 | ||
|
|
|
|||
| Equivalent shares of new voting common stock |
300 | |||
|
|
|
|||
| Redeemable Class B Senior Preferred stock |
48,760 | |||
| Liquidation preference |
$ | 1,000 | ||
|
|
|
|||
| 48,760,000 | ||||
| Accumulated and unpaid dividends |
$ | 6,237,098 | ||
|
|
|
|||
| 54,997,098 | ||||
| Expected mid-point of the initial public offering price |
$ | 17.00 | ||
|
|
|
|||
| Equivalent shares of new voting common stock |
3,235,123 | |||
|
|
|
Earnings per share revision
The accompanying December 31, 2010 and 2011 basic and diluted income(loss) per share amounts have been revised by $0.02 and $0.03, respectively, from previously reported amounts in order to properly account for weighted average common shares outstanding. The revisions, which management has determined to be immaterial, had no impact on the previously reported consolidated balance sheets, consolidated statements of operations or consolidated statements of cash flows.
Balance sheet revision
The accompanying December 31, 2011 balance sheet has been revised from its previous presentation to present certain insurance-related assets and liabilities on a gross rather than net basis, and to classify them as long-term. The revisions, which management has determined to be immaterial, had no impact on previously reported sales, operating expenses, operating cash flow or cash position.
F-11
Table of Contents
STOCK BUILDING SUPPLY HOLDINGS, INC. AND SUBSIDIARIES
NOTES TO CONSOLIDATED FINANCIAL STATEMENTS
(All amounts are presented in thousands except share and per share amounts.)
The revisions to present these insurance-related assets and liabilities on a gross basis included a $575 increase to prepaid expenses and other current assets and accrued expenses and other liabilities. The revision to present these insurance related assets and liabilities as long-term included a $4,744 decrease to restricted assets, a $4,744 increase to other assets, a $2,892 decrease to accrued expenses and other liabilities and a $2,892 increase to other long-term liabilities.
Use of estimates
The preparation of financial statements in conformity with accounting principles generally accepted in the United States of America requires management to make estimates and assumptions that affect the reported amounts of assets and liabilities and disclosure of contingent assets and liabilities at the date of the financial statements and the reported amounts of revenues and expenses during the reporting period. The Company evaluates these estimates and judgments on an ongoing basis and bases its estimates on historical experience, current conditions and various other assumptions that are believed to be reasonable under the circumstances. The results of these estimates form the basis for making judgments about the carrying values of assets and liabilities as well as identifying and assessing the accounting treatment with respect to commitments and contingencies. The significant estimates which could change by a material amount in the near term include reserves for accounts receivable, inventory, supplier rebates and goodwill impairment. Actual results may differ materially from these estimates under different assumptions or conditions.
Business and credit concentrations
The Company maintains cash at financial institutions in excess of federally insured limits. Accounts receivable potentially expose the Company to concentrations of credit risk. Mitigating this credit risk is collateral underlying certain accounts receivable (perfected liens or lien rights) as well as the Company’s analysis of a customer’s credit history prior to extending credit. Concentrations of credit risk with respect to accounts receivable are limited due to the Company’s large number of customers and their dispersion across various regions of the United States. At December 31, 2010, 2011 and 2012, no customer represented more than 10% of accounts receivable or revenue.
The Company’s future results could be adversely affected by a number of factors including: competitive pressure on sales and pricing, weather conditions, consumer spending and debt levels, interest rates, existing residential home sales and new home construction, lumber prices and product mix.
Cash and cash equivalents
Cash equivalents are highly liquid investments that are readily convertible to known amounts of cash and have a maturity of three months or less from the time of purchase.
Restricted assets
Restricted assets consisted of the following at December 31, 2011 and 2012:
| 2011 | 2012 | |||||||
| Deposits for payment of casualty & health insurance claims |
$ | 7,505 | $ | 5,690 | ||||
| Escrow related to sale of operations |
1,250 | — | ||||||
| Other deposits |
337 | 333 | ||||||
|
|
|
|
|
|||||
| $ | 9,092 | $ | 6,023 | |||||
|
|
|
|
|
|||||
F-12
Table of Contents
STOCK BUILDING SUPPLY HOLDINGS, INC. AND SUBSIDIARIES
NOTES TO CONSOLIDATED FINANCIAL STATEMENTS
(All amounts are presented in thousands except share and per share amounts.)
Restricted assets are classified as current or non-current assets based on their designated purpose.
Fair value of financial instruments
The Company has adopted ASC 820, Fair Value Measurements and Disclosures (“ASC 820”). ASC 820 clarifies the definition of fair value, prescribes methods for measuring fair value, and establishes a fair value hierarchy to classify the inputs used in measuring fair value as follows:
| Level 1 | Inputs are unadjusted quoted prices in active markets for identical assets or liabilities available at the measurement date. | |
| Level 2 | Inputs are unadjusted quoted prices for similar assets and liabilities in active markets, quoted prices for identical or similar assets and liabilities in markets that are not active, inputs other then quoted prices that are observable, and inputs derived from or corroborated by observable market data. | |
| Level 3 | Inputs are unobservable inputs which reflect the reporting entity’s own assumptions on what assumptions the market participants would use in pricing the asset or liability based on the best available information. | |
If a financial instrument uses inputs that fall in different levels of the hierarchy, the instrument will be categorized based upon the lowest level of input that is significant to the fair value calculation.
Accounts receivable
Accounts receivable result from the extending of credit to trade customers for the purchase of goods and services. The terms generally provide for payment within 30 days of being invoiced. On occasion, when necessary to compete in certain circumstances, the Company will sell product under extended payment terms. Accounts receivable are stated at estimated net realizable value. The allowance for doubtful accounts is based on an assessment of individual past due accounts, historical write-off experience, accounts receivable aging, customer disputes and the business environment. Account balances are charged off when the potential for recovery is considered remote. The Company grants trade discounts on a percentage basis. The Company records an allowance against accounts receivable for the amount of discounts it estimates will be taken by customers. The discounts are recorded as a reduction to revenue when products are sold.
Consideration received from suppliers
The Company enters into agreements with many of its suppliers providing for inventory purchase rebates (“supplier rebates”) upon achievement of specified volume purchasing levels. Supplier rebates are accrued as part of cost of goods sold based on progress towards earning the supplier rebates, taking into consideration cumulative purchases of inventory to date and projected purchases through the end of the year. Total rebates receivable at December 31, 2011 and 2012 are $2,585 and $2,599, respectively, included in prepaid expenses and other current assets. The Company estimates the rebates applicable to inventory on-hand at each period end based on the inventory turns of the related items.
F-13
Table of Contents
STOCK BUILDING SUPPLY HOLDINGS, INC. AND SUBSIDIARIES
NOTES TO CONSOLIDATED FINANCIAL STATEMENTS
(All amounts are presented in thousands except share and per share amounts.)
Revenue recognition
The Company recognizes revenue when products are shipped and the customer takes ownership and assumes risk of loss, collection of the relevant receivable is reasonably assured, persuasive evidence of an arrangement exists and the sales price is fixed or determinable. All sales recognized are net of allowances for discounts and estimated returns, based on historical experience.
Revenues from construction contracts generally are recognized on the completed contract basis, as these contracts generally are completed within 30 days. Revenues from certain construction contracts, which are generally greater than 30 days, are recognized on the percentage-of-completion method, measured by the percentage of costs incurred to date to estimated costs for each contract. Costs of goods sold related to construction contracts include all direct material, subcontractor and labor costs and those indirect costs related to contract performance, such as indirect labor, supplies, tools and repairs. General and administrative costs are charged to expense as incurred. Provisions for estimated losses on uncompleted contracts are made in the period in which such losses are determined.
The Company has accounted for revenue and costs for construction contracts, which are generally completed within 30 days, by the completed contract method in 2012, whereas in all prior years, revenue and costs for construction contracts were determined by the percentage-of-completion method. The new method of accounting for construction contracts was determined to be preferable due to the short-term nature of most contracts, and revenue and cost in the aggregate resulting in consistent economics to what resulted from the use of the percentage-of-completion method.
The change in accounting method for presentation of contracts was completed in accordance with ASC 250, Accounting Changes and Error Corrections (“ASC 250”). Accordingly, the change in accounting principle has been applied retrospectively by adjusting the financial statement amounts for the prior periods presented. The cumulative effect of the change in accounting for contracts was a decrease in retained earnings as of December 31, 2009 of $1,111.
F-14
Table of Contents
STOCK BUILDING SUPPLY HOLDINGS, INC. AND SUBSIDIARIES
NOTES TO CONSOLIDATED FINANCIAL STATEMENTS
(All amounts are presented in thousands except share and per share amounts.)
The following tables detail the retrospective application on previously reported amounts:
| As of and for the year ended December 31, 2010 |
As previously reported |
Effect of accounting principle change |
As reported |
|||||||||
| Inventories, net |
$ | 64,725 | $ | (450 | ) | $ | 64,275 | |||||
| Costs in excess of billings on uncompleted contracts |
— | 2,723 | 2,723 | |||||||||
| Costs and estimated profits in excess of billings |
2,298 | (2,298 | ) | — | ||||||||
| Total current assets |
188,252 | (25 | ) | 188,227 | ||||||||
| Total assets |
294,995 | (25 | ) | 294,970 | ||||||||
| Billings in excess of costs on uncompleted contracts |
— | 1,061 | 1,061 | |||||||||
| Total current liabilities |
87,576 | 1,061 | 88,637 | |||||||||
| Total liabilities |
120,871 | 1,061 | 121,932 | |||||||||
| Retained earnings |
49,425 | (1,086 | ) | 48,339 | ||||||||
| Total stockholders’ equity |
123,315 | (1,086 | ) | 122,229 | ||||||||
| Net sales |
751,358 | 348 | 751,706 | |||||||||
| Cost of goods sold |
587,369 | 323 | 587,692 | |||||||||
|
|
|
|
|
|
|
|||||||
| Gross profit |
163,989 | 25 | 164,014 | |||||||||
| Loss from operations |
(122,859 | ) | 25 | (122,834 | ) | |||||||
| Loss from continuing operations before income taxes |
(113,268 | ) | 25 | (113,243 | ) | |||||||
| Loss from continuing operations |
(65,805 | ) | 25 | (65,780 | ) | |||||||
| Basic and diluted income (loss) per share |
||||||||||||
| Loss from continuing operations |
$ | (3.01 | ) | $ | 0.00 | $ | (3.01 | ) | ||||
| As of and for the year ended December 31, 2011 |
As previously reported |
Effect of accounting principle change |
As reported | |||||||||
| Inventories, net |
$ | 50,378 | $ | (696 | ) | $ | 49,682 | |||||
| Costs in excess of billings on uncompleted contracts |
— | 3,888 | 3,888 | |||||||||
| Costs and estimated profits in excess of billings |
3,490 | (3,490 | ) | — | ||||||||
| Total current assets |
155,753 | (298 | ) | 155,455 | ||||||||
| Total assets |
254,939 | (298 | ) | 254,641 | ||||||||
| Billings in excess of costs on uncompleted contracts |
— | 1,108 | 1,108 | |||||||||
| Billings in excess of costs and estimated profits |
452 | (452 | ) | — | ||||||||
| Total current liabilities |
110,703 | 656 | 111,359 | |||||||||
| Total liabilities |
147,562 | 656 | 148,218 | |||||||||
| Retained earnings |
2,972 | (954 | ) | 2,018 | ||||||||
| Total stockholders’ equity |
52,380 | (954 | ) | 51,426 | ||||||||
| Net sales |
762,626 | (2,644 | ) | 759,982 | ||||||||
| Cost of goods sold |
593,793 | (2,776 | ) | 591,017 | ||||||||
|
|
|
|
|
|
|
|||||||
| Gross profit |
168,833 | 132 | 168,965 | |||||||||
| Loss from operations |
(59,433 | ) | 132 | (59,301 | ) | |||||||
| Loss from continuing operations before income taxes |
(64,395 | ) | 132 | (64,263 | ) | |||||||
| Loss from continuing operations |
(42,063 | ) | 132 | (41,931 | ) | |||||||
| Basic and diluted income (loss) per share |
||||||||||||
| Loss from continuing operations |
$ | (2.08 | ) | $ | 0.01 | $ | (2.07 | ) | ||||
F-15
Table of Contents
STOCK BUILDING SUPPLY HOLDINGS, INC. AND SUBSIDIARIES
NOTES TO CONSOLIDATED FINANCIAL STATEMENTS
(All amounts are presented in thousands except share and per share amounts.)
Shipping and handling costs
The Company includes shipping and handling costs in selling, general and administrative expenses on the consolidated statements of operations. Shipping and handling costs were $49,305, $48,139 and $50,943 for the years ended December 31, 2010, 2011 and 2012, respectively.
Property and equipment
Property and equipment are stated at cost. Expenditures for renewals and betterments, which extend the useful lives of assets, are capitalized while maintenance and repairs are charged to expense as incurred. Property and equipment obtained through acquisition are stated at estimated fair market value as of the acquisition date, and are depreciated over their estimated remaining useful lives, which may differ from our stated policies for certain assets.
Property and equipment are depreciated using the straight-line method over the following estimated service lives:
| Buildings and improvements |
40 years | |
| Leasehold improvements |
Lesser of life of the asset or remaining | |
| lease term, and not to exceed 10 years | ||
| Furniture, fixtures and equipment |
2–10 years | |
| Vehicles |
4–7 years |
Assets are classified as held for sale if the Company commits to a plan to sell the asset within one year and actively markets the asset in its current condition for a price that is reasonable in comparison to its estimated fair value. Assets held for sale are stated at the lower of depreciated cost or estimated fair value less expected disposition costs. The significant remaining assets classified as held for sale as of December 31, 2012, are under contract to be sold during 2013.
Goodwill and other intangible assets
At least annually or more frequently, as changes in circumstances indicate, the Company evaluates the estimated fair value of goodwill. Regarding goodwill, to the extent that the carrying value of the net assets of any of the reporting units having goodwill is greater than their estimated fair value, the Company may be required to take goodwill impairment charges. The Company’s reporting units are its East, South and West geographic divisions and Coleman Flooring. The Company is required to make certain assumptions and estimates regarding the fair value of goodwill when assessing for impairment. Changes in the fact patterns underlying such assumptions and estimates could ultimately result in the recognition of additional impairment losses.
For purposes of testing goodwill, the Company estimates fair value using the income approach. The income approach uses a reporting unit’s projection of estimated future cash flows that is discounted at a market derived weighted average cost of capital. The projection uses management’s best estimates of economic and market conditions over the projected period including growth rates in sales, costs, estimates of future expected changes in operating margins and cash expenditures. The income approach has been determined to be the most representative because we do not have an active trading market for our equity or debt.
F-16
Table of Contents
STOCK BUILDING SUPPLY HOLDINGS, INC. AND SUBSIDIARIES
NOTES TO CONSOLIDATED FINANCIAL STATEMENTS
(All amounts are presented in thousands except share and per share amounts.)
During the third quarter of 2010, 2011 and 2012, the Company performed its annual impairment assessment of goodwill which did not indicate that an impairment existed. During each assessment, the Company determined that the fair value of its reporting unit containing goodwill substantially exceeded its carrying value.
Acquired intangible assets other than goodwill are amortized over their weighted average amortization period unless they are determined to be indefinite. Acquired intangible assets are carried at cost, less accumulated amortization. For intangible assets purchased in a business combination, the estimated fair values of the assets received are used to establish the carrying value. The fair value of acquired intangible assets is determined using common valuation techniques, and the Company employs assumptions developed using the perspective of a market participant.
Impairment of long-lived assets
Long-lived assets, such as property, equipment and purchased intangible assets subject to amortization are reviewed for impairment whenever facts and circumstances indicate that the carrying amount of an asset may not be recoverable. For impairment testing of long-lived assets, the Company identifies asset groups at the lowest level for which identifiable cash flows are largely independent of the cash flows of other groups of assets and liabilities. Recoverability of assets to be held and used is measured by a comparison of the carrying amount of an asset to estimated undiscounted future cash flows expected to be generated by the assets. If the carrying amount of an asset exceeds its estimated future cash flows, an impairment charge is recognized by the amount by which the carrying amount of the asset exceeds the estimated fair value of the asset.
Income taxes
The Company computes income taxes using the asset and liability method in accordance with ASC 740, Income Taxes (“ASC 740”). Deferred taxes represent the difference between the tax basis of assets or liabilities, calculated under tax laws, and the reported amounts in the Company’s consolidated financial statements. The Company will establish a valuation allowance for deferred tax assets if it is more likely than not that these items will either expire before the Company is able to realize their benefits, or that future deductibility is uncertain. Periodically, the valuation allowance is reviewed and adjusted based on management’s assessments of realizable deferred tax assets.
ASC 740 also prescribes a recognition threshold and certain measurement principles for the financial statements related to tax positions taken or expected to be taken on a tax return. Under ASC 740, the impact of an uncertain tax position on an income tax return must be recognized at the largest amount that is more likely than not to be sustained upon audit by the relevant taxing authority. An uncertain income tax position will not be recognized if it has less than a 50% likelihood of being sustained. Additionally, ASC 740 provides guidance on derecognition, classification, interest and penalties associated with income taxes, accounting in interim periods, disclosures and transition requirements.
The Company’s policy is to recognize interest and penalties related to income tax liabilities and unrecognized tax benefits in income tax expense.
Casualty and health insurance
The Company is self insured for general liability, auto liability and workers’ compensation exposures, as well as health care claims, with specific excess insurance purchased from independent
F-17
Table of Contents
STOCK BUILDING SUPPLY HOLDINGS, INC. AND SUBSIDIARIES
NOTES TO CONSOLIDATED FINANCIAL STATEMENTS
(All amounts are presented in thousands except share and per share amounts.)
carriers to cover individual traumatic claims in excess of the self-insured limits. The expected liability for unpaid claims, including incurred but not reported losses, is reflected on the consolidated balance sheets as a liability with current and long-term components. The amount recoverable from insurance providers is reflected on the consolidated balance sheets in prepaid expenses and other current assets. Provisions for losses are developed from valuations that rely upon the Company’s past claims experience, which considers both the frequency and settlement of claims. The casualty and health insurance liabilities are recorded at their undiscounted value.
Retirement savings program
The Company sponsors a defined contribution retirement savings plan. Employees who have attained the age of 18 and have completed 90 days of service prior to the plan entry date are eligible to participate in the plan. No employer contributions were made to the plan for the years ended December 31, 2010, 2011 and 2012.
Lease obligations
The Company recognizes lease obligations with fixed escalations of rental payments on a straight-line basis over the lease term, with the amount of rental expense in excess of lease payments recorded as a deferred rent liability. As of December 31, 2011 and 2012, the Company had a deferred rent liability of $1,852 and $1,927, respectively, included in accrued expenses and other liabilities and other long-term liabilities on the consolidated balance sheets.
Advertising and promotion
Costs associated with advertising and promoting products and services are expensed in the period incurred and totaled $5,795, $399 and $1,323 for the years ended December 31, 2010, 2011 and 2012, respectively. These costs are included in selling, general and administrative expenses on the consolidated statements of operations.
Stock-based compensation
In accordance with the requirements of ASC 718, Compensation—Stock Compensation (“ASC 718”), the Company measures and recognizes compensation expense for all share-based payment awards made to employees using a fair value based pricing model. The compensation expense is recognized over the requisite service period.
Restructuring and related expenses
The Company accounts for costs associated with exit or disposal in accordance with ASC 420, Exit or Disposal Cost Obligations (“ASC 420”), which requires that: (i) liabilities associated with exit and disposal activities be measured at fair value; (ii) one-time termination benefits be expensed at the date the entity notifies the employee, unless the employee must provide future service, in which case the benefits are expensed ratably over the future service period; (iii) liabilities related to an operating lease/contract be recognized and measured at its fair value when the contract does not have any future economic benefit to the entity (i.e., the entity ceases to utilize the rights conveyed by the contract); and (iv) for typically all other costs related to an exit or disposal activity to be expensed as incurred.
F-18
Table of Contents
STOCK BUILDING SUPPLY HOLDINGS, INC. AND SUBSIDIARIES
NOTES TO CONSOLIDATED FINANCIAL STATEMENTS
(All amounts are presented in thousands except share and per share amounts.)
Debt issuance costs
Costs incurred in connection with the Company’s secured credit agreement are capitalized and amortized over the term of the agreement. Total debt issuance costs, net of accumulated amortization, included in other assets on the consolidated balance sheets were $2,284 and $1,937 as of December 31, 2011 and 2012, respectively. Amortization of debt issuance costs for the years ended December 31, 2010, 2011 and 2012 was $1,252, $1,553 and $902, respectively, and is included in interest expense on the consolidated statements of operations.
Derivatives
The Company recognizes all derivative instruments as assets or liabilities in the Company’s balance sheets at fair value. Changes in the fair value of derivative instruments that are not designated as hedges or that do not meet the hedge accounting criteria are reported in earnings. The Company elected not to designate any new derivative instruments as hedges for the years 2010, 2011 or 2012, and therefore all changes in the fair market value of the hedge contracts have been reported in cost of goods sold, on the consolidated statements of operations. The Company may decide to designate these instruments as hedges in future periods. The Company does not enter into any derivatives for speculative or trading purposes; all derivatives are used to offset existing or expected risks associated with fluctuations in interest rates or commodities.
Warranty expense
We have warranty obligations with respect to most manufactured products; however, the liability for the warranty obligations is not significant as a result of third-party inspection and acceptance processes.
Comprehensive loss
Comprehensive loss is equal to the net loss for all periods presented.
Recently issued accounting pronouncements
Fair value measurement—In May 2011, the Financial Accounting Standards Board (“FASB”) issued ASU No. 2011-04, “Amendments to Achieve Common Fair Value Measurement and Disclosure Requirements in U.S. GAAP and IFRSs” (“ASU 2011-04”). The amendments in this ASU are intended to improve the comparability of fair value measurements presented and disclosed in financial statements prepared in accordance with U.S. GAAP and International Financial Reporting Standards (“IFRS”). The amendments in this ASU explain how to measure fair value. They do not require additional fair value measurements and are not intended to establish valuation standards or affect valuation practices outside of financial reporting. The Company adopted the provisions of ASU 2011-04 on January 1, 2012. The adoption did not have an impact on the Company’s financial position or results of operations.
Comprehensive income: Presentation—In June 2011, the FASB issued ASU No. 2011-05, “Presentation of Comprehensive Income” (“ASU 2011-05”), to increase the prominence of items reported in other comprehensive income and to facilitate convergence of U.S. GAAP and IFRS. ASU 2011-05 eliminates the option to present components of other comprehensive income as part of the statement of members’ equity and requires that all non-owner changes in members’ equity be
F-19
Table of Contents
STOCK BUILDING SUPPLY HOLDINGS, INC. AND SUBSIDIARIES
NOTES TO CONSOLIDATED FINANCIAL STATEMENTS
(All amounts are presented in thousands except share and per share amounts.)
presented either in a single continuous statement of comprehensive income or in two separate but consecutive statements. In the two-statement approach, the first statement should present total net income and its components followed consecutively by a second statement that should present total other comprehensive income, the components of other comprehensive income, and the total of comprehensive income. The Company adopted the provisions of ASU 2011-05 on January 1, 2012. The adoption of ASU 2011-05 did not have an impact on the Company’s financial position or results of operations.
Comprehensive income: Reclassifications—In February 2013, the FASB issued ASU No. 2013-02, “Reporting of Amounts Reclassified Out of Accumulated Other Comprehensive Income” (“ASU 2013-02”), to supersede and replace the presentation requirements for reclassifications out of accumulated other comprehensive income in ASU 2011-05, which were deferred indefinitely under ASU No. 2011-12, “Deferral of the Effective Date for Amendments to the Presentation of Reclassifications of Items Out of Accumulated Other Comprehensive Income in Accounting Standards Update No. 2011-05” (“ASU 2011-12”), issued in December 2011. The amendments in ASU 2013-02 would require an entity to provide additional information about reclassifications out of accumulated other comprehensive income by the respective line items of net income. For public entities, the amendments are effective for fiscal years, and interim periods within those years, beginning after December 15, 2012. The adoption of ASU 2013-02 will not have an impact on the Company’s financial position or results of operations.
4. Acquisitions
For all acquisitions, the Company allocates the purchase price to the estimated fair values of the assets acquired and liabilities assumed as of the date of acquisition. The market approach, which indicates value based on available market pricing for comparable assets, is utilized to estimate the fair value of inventory, property and equipment. The income approach, which indicates value based on the present value of future cash flows, is primarily used to value intangible assets. The cost approach, which estimates value by determining the current cost of replacing an asset with another of equivalent economic utility, is used, as appropriate, for certain assets for which the market and income approaches could not be applied due to the nature of the asset.
National Home Centers, Inc.
On April 5, 2010, Stock Building Supply of Arkansas, LLC, a wholly-owned subsidiary of the Company, purchased certain assets and liabilities of National Home Centers, Inc. (“NHC”) for $15,000 in cash pursuant to Section 363 of Chapter 11 of the U.S. Bankruptcy Code. NHC consists of four locations in Arkansas which sell building materials primarily to residential contractors. The Company incurred transaction costs of $1,535 during the year ended December 31, 2010, which are included in selling, general and administrative expenses on the consolidated statements of operations. This amount includes $1,211 related to management services performed by Gores and Glendon Saturn Holdings, LLC (“Glendon”), an affiliate of Gores (Note 14). Revenue and net loss of NHC for the period April 5, 2010 through December 31, 2010 was $44,772 and $4,001, respectively.
F-20
Table of Contents
STOCK BUILDING SUPPLY HOLDINGS, INC. AND SUBSIDIARIES
NOTES TO CONSOLIDATED FINANCIAL STATEMENTS
(All amounts are presented in thousands except share and per share amounts.)
The following table summarizes the final allocation of the purchase price to the estimated fair values of the assets acquired and liabilities assumed on April 5, 2010.
| Accounts receivable |
$ | 10,381 | ||
| Inventories |
10,373 | |||
| Prepaid expenses and other current assets |
773 | |||
| Property and equipment |
9,721 | |||
| Intangible assets—customer relationships |
1,946 | |||
|
|
|
|||
| Total assets acquired |
33,194 | |||
|
|
|
|||
| Accrued expenses and other liabilities |
(869 | ) | ||
| Deferred income taxes |
(6,102 | ) | ||
|
|
|
|||
| Total liabilities assumed |
(6,971 | ) | ||
|
|
|
|||
| Net assets acquired |
26,223 | |||
| Less: Purchase price |
15,000 | |||
|
|
|
|||
| Bargain purchase gain |
$ | 11,223 | ||
|
|
|
Bison Building Materials, LLC
On July 1, 2010, the Company purchased certain assets and liabilities of Bison Building Materials, LLC (“Bison”) for $34,848. Bison consists of three locations in Texas that sell building materials primarily to residential contractors. The Company incurred transaction costs of $1,587 during the year ended December 31, 2010, which are included in selling, general and administrative expenses on the consolidated statements of operations. These costs include $1,237 related to management services performed by Gores and Glendon (Note 14). Revenue and net loss of Bison for the period July 1, 2010 through December 31, 2010 was $44,233 and $5,052, respectively.
The following table summarizes the final allocation of the purchase price to the estimated fair values of the assets acquired and liabilities assumed on July 1, 2010.
| Accounts receivable |
$ | 12,254 | ||
| Inventories |
9,994 | |||
| Prepaid expenses and other current assets |
76 | |||
| Property and equipment |
6,007 | |||
| Intangible assets—trademarks |
2,431 | |||
| Intangible assets—customer relationships |
5,036 | |||
|
|
|
|||
| Total assets acquired |
35,798 | |||
|
|
|
|||
| Accrued expenses and other liabilities |
(7,461 | ) | ||
|
|
|
|||
| Total liabilities assumed |
(7,461 | ) | ||
|
|
|
|||
| Net assets acquired |
28,337 | |||
| Less: Purchase price |
34,848 | |||
|
|
|
|||
| Goodwill |
$ | 6,511 | ||
|
|
|
Goodwill of $6,511 arising from the acquisition consists of expected synergies and cost savings from excess purchase price over identifiable intangible net assets, as well as intangible assets that do not qualify for separate recognition, such as assembled workforce.
F-21
Table of Contents
STOCK BUILDING SUPPLY HOLDINGS, INC. AND SUBSIDIARIES
NOTES TO CONSOLIDATED FINANCIAL STATEMENTS
(All amounts are presented in thousands except share and per share amounts.)
Total Building Services Group, LLC
On December 22, 2012, the Company purchased certain assets and liabilities of Total Building Services Group, LLC (“TBSG”) for $6,807. TBSG consists of one location in Georgia and sells framing, millwork and building materials and services primarily to residential contractors. The purchase of TBSG includes an earnout agreement (“Earnout”) in which the seller of TBSG participates in earnings over certain thresholds during the three fiscal years beginning January 1, 2013. The Company estimated the value of the Earnout to be $1,075 using discounted future cash flows. The Earnout has been classified as a Level 2 measurement in accordance with ASC 820. The Company advanced $850 against future Earnout payments and earns 9% interest on the advanced amount. The Company incurred transaction costs of $183 during the year ended December 31, 2012, which are included in selling, general and administrative expenses on the consolidated statements of operations. As the acquisition occurred on December 22, 2012, the revenue and net income of TBSG from the date of acquisition through December 31, 2012 is not significant.
The following table summarizes the final allocation of the purchase price to the estimated fair values of the assets acquired and liabilities assumed on December 22, 2012.
| Accounts receivable |
$ | 398 | ||
| Inventories |
1,524 | |||
| Property and equipment |
6,128 | |||
| Intangible assets—trademarks |
1,132 | |||
| Intangible assets—supply agreement |
4,484 | |||
| Intangible assets—customer relationships |
1,967 | |||
|
|
|
|||
| Total assets acquired |
15,633 | |||
|
|
|
|||
| Accounts payable |
(3,395 | ) | ||
| Accrued expenses and other liabilities |
(56 | ) | ||
| Current portion of capital lease obligation |
(423 | ) | ||
| Long-term capital lease obligation |
(4,952 | ) | ||
|
|
|
|||
| Total liabilities assumed |
(8,826 | ) | ||
|
|
|
|||
| Net assets acquired |
$ | 6,807 | ||
|
|
|
Pro forma financial information (unaudited)
The following unaudited pro forma combined results of operations give effect to the acquisitions of TBSG, Bison and NHC by the Company as if TBSG had been acquired on January 1, 2011, and as if Bison and NHC had been acquired on January 1, 2009, the beginning of the respective comparable prior annual periods, applying certain assumptions and pro forma adjustments. These pro forma adjustments primarily relate to depreciation expense on stepped up fixed assets and amortization of acquired intangibles, and the estimated impact on the Company’s income tax provision. The unaudited pro forma consolidated results of operations are provided for illustrative purposes only and are not indicative of the Company’s actual consolidated results of operations or consolidated financial position. In addition, the unaudited pro forma combined results of operations do not reflect the costs of any integration activities, nonrecurring charges directly attributable to purchase accounting, or any synergies or other restructuring activities that may result from the acquisition.
F-22
Table of Contents
STOCK BUILDING SUPPLY HOLDINGS, INC. AND SUBSIDIARIES
NOTES TO CONSOLIDATED FINANCIAL STATEMENTS
(All amounts are presented in thousands except share and per share amounts.)
Unaudited pro forma financial information is as follows:
| Pro forma year ended December, 31 | ||||||||||||
| 2010 | 2011 | 2012 | ||||||||||
| Net sales |
$ | 837,105 | $ | 775,852 | $ | 962,876 | ||||||
| Loss from continuing operations |
(66,518 | ) | (42,056 | ) | (15,364 | ) | ||||||
| Redeemable Class B Senior Preferred stock dividends |
(5,079 | ) | (4,188 | ) | (4,480 | ) | ||||||
| Convertible Class C Preferred stock dividend |
— | — | (5,000 | ) | ||||||||
|
|
|
|
|
|
|
|||||||
| Loss attributable to common stockholders from continuing operations |
(71,597 | ) | (46,244 | ) | (24,844 | ) | ||||||
|
|
|
|
|
|
|
|||||||
| Basic and diluted loss per share from continuing operations |
$ | (3.05 | ) | $ | (2.08 | ) | $ | (1.89 | ) | |||
|
|
|
|
|
|
|
|||||||
5. Discontinued operations
During the years ended December 31, 2010, 2011 and 2012, the Company ceased operations in certain geographic markets due to declines in residential home building throughout the U.S. and other strategic reasons. The Company will have no further significant continuing involvement in the sold operations and exited geographic markets. The cessation of operations in these markets has been treated as discontinued operations as the markets had distinguishable cash flows and operations that have been eliminated from ongoing operations.
On January 11, 2010, the Company sold its subsidiary, Universal Supply, LLC (“US”), to an external party for proceeds of $20,771. US consisted of eight roofing and siding stores in New Jersey, and was sold in order to focus on the Company’s core residential building materials business. The Company recognized a gain on the sale of US of $1,461 in income (loss) from discontinued operations on the consolidated statements of operations, net of transaction fees of $1,009.
On April 30, 2010, the Company sold its Commercial Door and Hardware operations (“CDH”) to an external party for proceeds of $26,060. CDH consisted of twelve locations in six states and was sold in order to focus on the Company’s core residential building materials business. The Company recognized a loss on the sale of CDH of $771 in income (loss) from discontinued operations on the consolidated statements of operations, net of transaction fees of $1,399.
The operating results of the discontinued operations for the years ended December 31, 2010, 2011 and 2012 are as follows:
| 2010 | 2011 | 2012 | ||||||||||
| Net sales |
$ | 74,996 | $ | 14,670 | $ | 1,103 | ||||||
| Restructuring charges |
(103 | ) | (1,033 | ) | (55 | ) | ||||||
| Gain (loss) before income taxes |
(8,252 | ) | 456 | 101 | ||||||||
| Income tax benefit (expense) |
4,038 | (658 | ) | (52 | ) | |||||||
| Net income (loss) |
(4,214 | ) | (202 | ) | 49 | |||||||
F-23
Table of Contents
STOCK BUILDING SUPPLY HOLDINGS, INC. AND SUBSIDIARIES
NOTES TO CONSOLIDATED FINANCIAL STATEMENTS
(All amounts are presented in thousands except share and per share amounts.)
The assets and liabilities of discontinued operations reflected on the consolidated balance sheets at December 31, 2011 and 2012 are as follows:
| 2011 | 2012 | |||||||
| Accounts receivable, net |
$ | 1,786 | $ | — | ||||
| Inventories, net |
961 | 20 | ||||||
| Real estate held for sale |
1,290 | 700 | ||||||
| Prepaid expenses and other current assets |
71 | 35 | ||||||
|
|
|
|
|
|||||
| Current assets of discontinued operations |
4,108 | 755 | ||||||
|
|
|
|
|
|||||
| Property and equipment, net of accumulated depreciation |
1,640 | 28 | ||||||
|
|
|
|
|
|||||
| Noncurrent assets of discontinued operations |
1,640 | 28 | ||||||
|
|
|
|
|
|||||
| Accounts payable |
45 | 2 | ||||||
| Accrued expenses and other liabilities |
888 | 167 | ||||||
| Restructuring reserve |
432 | 277 | ||||||
|
|
|
|
|
|||||
| Current liabilities of discontinued operations |
1,365 | 446 | ||||||
|
|
|
|
|
|||||
| Long-term restructuring reserve |
604 | 384 | ||||||
| Other long-term liabilities |
— | 4 | ||||||
|
|
|
|
|
|||||
| Noncurrent liabilities of discontinued operations |
$ | 604 | $ | 388 | ||||
|
|
|
|
|
|||||
6. Restructuring costs
During the years ended December 31, 2010, 2011 and 2012, in addition to discontinuing operations in certain markets, the Company instituted several store closures and reductions in headcount in continuing markets (the “Restructurings”) in an effort to: (i) strengthen the Company’s competitive position; (ii) reduce costs; and (iii) improve operating margins within existing markets that management believe have favorable long-term growth demographics.
For the year ended December 31, 2010, the Company recognized restructuring charges of $7,089 from continuing operations and $103 from discontinued operations. For the year ended December 31, 2011, the Company recognized restructuring charges of $1,349 from continuing operations and $1,033 from discontinued operations. For the year ended December 31, 2012, the Company recognized restructuring charges of $2,853 from continuing operations and $55 from discontinued operations. These restructuring charges primarily relate to management’s determination that subleasing closed properties is no longer reasonably assumed which resulted in revised estimates. No additional costs are expected to be incurred related to the Restructurings.
F-24
Table of Contents
STOCK BUILDING SUPPLY HOLDINGS, INC. AND SUBSIDIARIES
NOTES TO CONSOLIDATED FINANCIAL STATEMENTS
(All amounts are presented in thousands except share and per share amounts.)
The following table summarizes the restructuring expenses incurred in connection with the Restructurings and the remaining reserves as of December 31, 2010, 2011 and 2012.
| Work force reductions |
Store closures |
Total | ||||||||||
| Restructuring reserves, December 31, 2010 |
671 | 3,791 | 4,462 | |||||||||
| Restructuring charges incurred |
97 | 2,285 | 2,382 | |||||||||
| Cash payments |
(703 | ) | (2,141 | ) | (2,844 | ) | ||||||
|
|
|
|
|
|
|
|||||||
| Restructuring reserves, December 31, 2011 |
65 | 3,935 | 4,000 | |||||||||
| Restructuring charges incurred |
353 | 2,555 | 2,908 | |||||||||
| Cash payments |
(65 | ) | (1,718 | ) | (1,783 | ) | ||||||
|
|
|
|
|
|
|
|||||||
| Restructuring reserves at December 31, 2012 |
$ | 353 | $ | 4,772 | $ | 5,125 | ||||||
|
|
|
|
|
|
|
|||||||
The remaining accrual for work force reduction of $353 is expected to be fully paid by December 2014. The remaining accrual for store closures of $4,772 is expected to be fully paid by January 2017 as the related leases expire.
7. Accounts receivable
Accounts receivable consist of the following at December 31, 2011 and 2012:
| 2011 | 2012 | |||||||
| Trade receivables |
$ | 69,379 | $ | 94,962 | ||||
| Allowance for doubtful accounts |
(2,669 | ) | (3,095 | ) | ||||
| Allowance for sales returns and discounts |
(1,504 | ) | (1,570 | ) | ||||
|
|
|
|
|
|||||
| $ | 65,206 | $ | 90,297 | |||||
|
|
|
|
|
|||||
The following table shows the changes in our allowance for doubtful accounts.
| 2010 | 2011 | 2012 | ||||||||||
| Balance at January 1 |
$ | 38,131 | $ | 4,826 | $ | 2,669 | ||||||
| Additions charged to expense |
2,463 | 1,753 | 2,333 | |||||||||
| Deductions (write-offs) |
(35,768 | ) | (3,910 | ) | (1,907 | ) | ||||||
|
|
|
|
|
|
|
|||||||
| $ | 4,826 | $ | 2,669 | $ | 3,095 | |||||||
|
|
|
|
|
|
|
|||||||
8. Inventories
Inventories consist principally of materials purchased for resale, including lumber, sheet goods, millwork, windows and doors, as well as certain manufactured products and are valued at the lower of cost or market, with cost being measured using an average cost approach, which approximates the first-in, first-out approach. A provision for excess and obsolete inventory of $3,458 and $1,833 is recorded as of December 31, 2011 and 2012, respectively. The provision as of December 31, 2011 includes $763 related to inventory at closed stores which was sold at auction during 2012 for less than its cost.
F-25
Table of Contents
STOCK BUILDING SUPPLY HOLDINGS, INC. AND SUBSIDIARIES
NOTES TO CONSOLIDATED FINANCIAL STATEMENTS
(All amounts are presented in thousands except share and per share amounts.)
9. Property and equipment
Property and equipment consists of the following at December 31, 2011 and 2012.
| 2011 | 2012 | |||||||
| Land |
$ | 18,580 | $ | 18,210 | ||||
| Buildings and improvements |
19,477 | 24,992 | ||||||
| Leasehold improvements |
8,195 | 7,178 | ||||||
| Furniture, fixtures and equipment |
53,881 | 51,554 | ||||||
| Vehicles |
26,934 | 25,387 | ||||||
| Construction-in-progress |
275 | 293 | ||||||
|
|
|
|
|
|||||
| 127,342 | 127,614 | |||||||
| Less: Accumulated depreciation |
(69,583 | ) | (72,538 | ) | ||||
|
|
|
|
|
|||||
| $ | 57,759 | $ | 55,076 | |||||
|
|
|
|
|
|||||
Depreciation expense for the years ended December 31, 2010, 2011 and 2012 amounted to $38,915, $15,257 and $10,299 including amortization expense related to capital leases. Depreciation expense of $5,672, $2,887 and $2,489 was included in cost of goods sold, in 2010, 2011 and 2012, respectively.
As of December 31, 2011, the Company had real estate held for sale of $4,890 and $1,290 included in continuing operations and discontinued operations, respectively, related to closed branches. As of December 31, 2012, the Company had real estate held for sale of $5,117 and $700 included in continuing operations and discontinued operations, respectively, related to closed branches. During the years ended December 31, 2011 and 2012, the Company reclassified $0 and $970, respectively, of property and equipment to assets held for sale, as the assets met the held for sale criteria as set forth in ASC 360, Property, Plant and Equipment (“ASC 360”).
As of December 31, 2011 and 2012, the Company had other assets held for sale of $0 and $381, respectively, in continuing operations, consisting primarily of information technology equipment.
For the years ended December 31, 2010, 2011 and 2012 the Company recorded impairment charges related to assets held for sale of $3,607, $610 and $481, respectively. The impairment charges arose primarily from declining commercial real estate values. The Company estimated the fair value of the assets classified as held for sale using recent sales data for similar properties in the area and analyzed the expected cash flows from different sales scenarios.
During the years ended December 31, 2010, 2011 and 2012, the Company had proceeds from the sale of property and equipment of $18,201, $5,220 and $952, respectively and proceeds from the sales of real estate held for sale of $5,312, $886 and $441, respectively. These disposals were primarily related to assets of stores closed as part of the restructuring events discussed in Note 6.
10. Goodwill and intangible assets, net
Goodwill
Goodwill of $6,511 represents the excess of the purchase price over the fair value of identifiable net assets acquired in connection to the purchase of Bison in July 2010 (Note 4). All of the goodwill from this transaction is expected to be deductible for income tax purposes.
F-26
Table of Contents
STOCK BUILDING SUPPLY HOLDINGS, INC. AND SUBSIDIARIES
NOTES TO CONSOLIDATED FINANCIAL STATEMENTS
(All amounts are presented in thousands except share and per share amounts.)
Intangible assets
Intangible assets represent the value assigned to trademarks acquired in connection to the purchases of SBS, Bison and TBSG, the value assigned to customer relationships acquired in connection to the purchases of NHC, Bison and TBSG and the value assigned to a supply agreement acquired in connection to the purchase of TBSG. The trademark intangible assets will be amortized over a weighted-average period of 17.3 years. The customer relationship intangible assets will be amortized over a weighted-average period of 11.5 years. The supply agreement will be amortized over a period of 13 years. The following table provides the gross carrying amount and related accumulated amortization of definite-lived intangible assets.
| Trademarks | Customer relationships | Supply agreement | Total | |||||||||||||||||||||||||
| Gross carrying amount |
Accumulated amortization |
Gross carrying amount |
Accumulated amortization |
Gross carrying amount |
Accumulated amortization |
|||||||||||||||||||||||
| December 31, 2010 |
$ | 15,853 | $ | (1,313 | ) | $ | 6,982 | $ | (313 | ) | $ | — | $ | — | $ | 21,209 | ||||||||||||
| Amortization |
— | (908 | ) | — | (549 | ) | — | — | (1,457 | ) | ||||||||||||||||||
|
|
|
|
|
|
|
|
|
|
|
|
|
|
|
|||||||||||||||
| December 31, 2011 |
15,853 | (2,221 | ) | 6,982 | (862 | ) | — | — | 19,752 | |||||||||||||||||||
| Acquisitions |
1,132 | — | 1,967 | — | 4,484 | — | 7,583 | |||||||||||||||||||||
| Amortization |
— | (909 | ) | — | (552 | ) | — | (9 | ) | (1,470 | ) | |||||||||||||||||
|
|
|
|
|
|
|
|
|
|
|
|
|
|
|
|||||||||||||||
| December 31, 2012 |
$ | 16,985 | $ | (3,130 | ) | $ | 8,949 | $ | (1,414 | ) | $ | 4,484 | $ | (9 | ) | $ | 25,865 | |||||||||||
|
|
|
|
|
|
|
|
|
|
|
|
|
|
|
|||||||||||||||
Aggregate amortization expense was $1,166, $1,457 and $1,470 for the years ended December 31, 2010, 2011 and 2012, respectively. Based upon current assumptions, the Company expects that its definite-lived intangible assets will be amortized according to the following schedule:
| 2013 |
2,164 | |||
| 2014 |
2,164 | |||
| 2015 |
2,164 | |||
| 2016 |
2,164 | |||
| 2017 |
2,164 | |||
| Thereafter |
15,045 | |||
|
|
|
|||
| $ | 25,865 | |||
|
|
|
11. Accrued expenses and other liabilities
Accrued expenses and other liabilities consisted of the following at December 31, 2011 and 2012:
| 2011 | 2012 | |||||||
| Accrued payroll and other employee related expenses |
$ | 7,073 | $ | 6,940 | ||||
| Reserve for future share issuance to Gores (Note 14) |
5,000 | — | ||||||
| Accrued taxes |
4,691 | 4,156 | ||||||
| Self-insurance reserve (Note 16) |
3,176 | 3,365 | ||||||
| Advances from customers |
2,838 | 2,981 | ||||||
| Accrued professional fees |
913 | 1,214 | ||||||
| Accrued rebates payable |
747 | 826 | ||||||
| Accrued short-term deferred rent |
359 | 593 | ||||||
| Accrued related party management fees (Note 14) |
201 | 119 | ||||||
| Accrued lending fees |
105 | 445 | ||||||
| Litigation reserve (Note 16) |
— | 2,146 | ||||||
| Other |
3,452 | 2,492 | ||||||
|
|
|
|
|
|||||
| $ | 28,555 | $ | 25,277 | |||||
|
|
|
|
|
|||||
F-27
Table of Contents
STOCK BUILDING SUPPLY HOLDINGS, INC. AND SUBSIDIARIES
NOTES TO CONSOLIDATED FINANCIAL STATEMENTS
(All amounts are presented in thousands except share and per share amounts.)
12. Secured Credit Agreement
On June 30, 2009, the Company entered into a Secured Credit Agreement with Wells Fargo Capital Finance (the “Credit Agreement”) which includes a revolving line of credit (the “Revolver”). The Revolver was amended during 2010, 2011 and 2012 for changes in financial covenants and maximum availability. The following is a summary of the significant terms of the Revolver:
| Maturity |
December 11, 2015 | |
| Interest/Usage Rate |
Company’s option of Base Rate(a) plus a Base Rate Margin (ranges from 1.25%–1.75% based on Revolver availability) or LIBOR plus a LIBOR Rate Margin (ranges from 2.25%–2.75% based on Revolver availability) | |
| Maximum Availability |
Lesser of $150,000 or the borrowing base(b) | |
| Periodic Principal Payments |
None | |
| (a) | Base Rate is the higher of (i) the Federal Funds Rate plus 0.5% or (ii) the prime rate |
| (b) | The Revolver’s borrowing base is calculated as the sum of (i) 85% of the Company’s eligible accounts receivable, plus (ii) the lesser of $125,000, 65% of the eligible inventory or the liquidation value of eligible inventory as defined in the Credit Agreement minus (iii) reserves from time to time set by the administrative agent. The eligible accounts receivable and inventories are further adjusted as specified in the agreement. The Company’s borrowing base can also be increased pursuant to certain terms outlined in the Credit Agreement. |
The Credit Agreement provides that the Company can use the Revolver availability to issue letters of credit. The fees on any outstanding letters of credit issued under the Revolver include a participation fee equal to the LIBOR Rate Margin. The fee on the unused portion of the Revolver is 0.375% if the average daily usage is $75,000 or below, and 0.25% if the average daily usage is above $75,000. The Revolver includes a financial covenant that requires the Company to maintain a minimum Fixed Charge Coverage Ratio of 1.0 as defined by the Credit Agreement. However, the covenant is only applicable if the sum of availability under the Revolver plus qualified cash i) falls below $15,000 or ii) is between $15,000 and $20,000 for a period of five consecutive business days, and remains in effect until the sum of availability under the Revolver plus qualified cash exceeds $20,000 for 30 consecutive days. The Company has incurred operating losses and has used cash for operating activities for the years ended December 31, 2010, 2011 and 2012. While there can be no assurances, based upon the Company’s forecast, the Company does not expect the covenants to become applicable during the year ended December 31, 2013. However, should this not be the case, the Company would evaluate its liquidity options including, amendment to the credit agreement, seeking alternative financing arrangements of debt and/or equity, and/or sale of assets. No assurances can be given that such alternative financing would be available, or if available, under terms similar to the Company‘s existing Credit Agreement or that the Company would be able to sell assets on a timely basis.
The Company had outstanding borrowings of $33,850 and $72,218 with net availability of $21,603 and $31,344 as of December 31, 2011 and 2012, respectively. The interest rate on outstanding LIBOR Rate borrowings of $65,000 ranged from 3.1%-3.3% and the interest rate on outstanding Base Rate borrowings of $7,218 was 5.0% as of December 31, 2012. The Company had $5,100 and $7,550 in letters of credit outstanding under the Credit Agreement as of December 31,
F-28
Table of Contents
STOCK BUILDING SUPPLY HOLDINGS, INC. AND SUBSIDIARIES
NOTES TO CONSOLIDATED FINANCIAL STATEMENTS
(All amounts are presented in thousands except share and per share amounts.)
2011 and 2012, respectively. The Revolver is collateralized by substantially all assets of the Company. The carrying value of the Revolver at December 31, 2012 approximates fair value as the Revolver contains a variable interest rate. As such, the fair value of the Revolver was classified as a Level 2 measurement in accordance with ASC 820.
The Company obtained an extension from Wells Fargo Capital Finance subsequent to year end related to its requirement to file its financial statements and related certifications no later than 120 days after its year end. This agreement has extended the requirement to provide December 31, 2012 financial statements and related certifications to 150 days after the Company’s year end. The Company was in compliance with all other debt covenants for the year ended December 31, 2012.
The Company entered into Amendment Nine to the Credit Agreement on June 13, 2013. See Note 21 for the material terms included in the amendment.
13. Other long-term liabilities
Other long-term liabilities consisted of the following at December 31, 2011 and 2012.
| 2011 | 2012 | |||||||
| Litigation reserve (Note 16) |
$ | 7,708 | $ | — | ||||
| Self-insurance reserve (Note 16) |
2,893 | 3,866 | ||||||
| Long-term restructuring reserve (Note 6) |
2,416 | 3,612 | ||||||
| Long-term deferred rent |
1,493 | 1,334 | ||||||
| Long-term capital lease obligation |
822 | 5,635 | ||||||
| Reserve for uncertain tax positions (Note 15) |
347 | — | ||||||
| Other |
— | 195 | ||||||
|
|
|
|
|
|||||
| $ | 15,679 | $ | 14,642 | |||||
|
|
|
|
|
|||||
14. Related party transactions
The Company leases operating facilities from partnerships or corporations that are partially or fully owned by certain employees. During the years ended December 31, 2010, 2011 and 2012, the Company made rental payments of $2,848, $188 and $188, respectively, to these related parties.
On February 22, 2010 the Company entered into a Software, Services, License and Maintenance Services Agreement with United Road Services Inc. and its subsidiary Vehix Transvision, LLC (collectively “URS”) for the development, implementation, maintenance and support of customized software related to our SLS capability. The agreement with URS was subsequently amended and restated on March 3, 2013 to update certain services and deliverables. When we entered into the original agreement in 2010, URS was also owned by Gores as one of its portfolio companies. Gores divested its ownership interest in URS on December 14, 2012 and URS is no longer under common ownership with the Company. The Company paid URS approximately $276, $833 and $773 during the years ended December 31, 2010, 2011 and 2012, respectively.
The Company incurs expenses related to management services provided by Gores and Glendon. The Company incurred expenses related to management services provided by Wolseley through November 16, 2011. For the years ended December 31, 2011 and 2012, these expenses were $2,406 and $1,379, respectively, and are included in selling, general and administrative expenses on the
F-29
Table of Contents
STOCK BUILDING SUPPLY HOLDINGS, INC. AND SUBSIDIARIES
NOTES TO CONSOLIDATED FINANCIAL STATEMENTS
(All amounts are presented in thousands except share and per share amounts.)
consolidated statements of operations. For the year ended December 31, 2010, these expenses totaled $5,545, of which $5,045 is included in selling, general and administrative expenses and $500 is included in loss from discontinued operations on the consolidated statements of operations. The fees for the year ended December 31, 2010, include $1,237 and $1,211 related to management services incurred in connection with the purchases of Bison and NHC, respectively (Note 4). As of December 31, 2011 and 2012, the Company had accrued expenses of $201 and $119, respectively, related to these management services. These payables are included in accrued expenses and other liabilities on the consolidated balance sheets.
As of December 31, 2011 and 2012, the Company had related party promissory note balances of $412 and $401, respectively, which represent advances, and accrued interest thereon, due from Glendon and other stockholders of the Company. These notes accrue interest at rates of 0.50%-2.72% per annum and have maturity dates ranging from May 5, 2018 to May 31, 2019. The notes are due immediately if the Company undergoes a change of control. The notes are recorded as a reduction of additional paid in capital on the consolidated balance sheets.
On July 1, 2012, the Company made a $531 loan to an executive of the Company related to an exercise of stock options. The note accrues interest at a rate of 0.92% per annum, and matures on or before June 30, 2021. The note is due immediately if the Company undergoes a change of control. While the stock options were legally exercised, they were not considered exercised for accounting purposes under ASC 718. As a result, the related loan is not reflected on the consolidated balance sheets.
As described in Note 1, Gores contributed $5,000 in connection with the Company’s purchase of Wolseley’s stockholder interests on November 16, 2011. At December 31, 2011, the Company had recorded $5,000 in accrued expenses and other liabilities on the consolidated balance sheets related to this contribution. On January 26, 2012, the Company issued Gores 5,000 Class C Convertible Preferred shares (Note 17) to satisfy the liability.
On March 1, 2012, the Company issued Glendon 110,381 Class B Common shares.
The Company is part of a group health care plan with Gores. As of December 31, 2011 and 2012, the Company has $0 and $750 on deposit with Gores as a reserve for the payment of run-off health care claims in the event of a Plan termination, which is included in restricted assets on the consolidated balance sheets.
15. Income taxes
The components of income tax expense (benefit) are as follows.
| 2010 | 2011 | 2012 | ||||||||||
| Current |
||||||||||||
| Federal |
$ | (21,541 | ) | $ | (16,300 | ) | $ | (4,596 | ) | |||
| State |
(4,914 | ) | 552 | 197 | ||||||||
|
|
|
|
|
|
|
|||||||
| (26,455 | ) | (15,748 | ) | (4,399 | ) | |||||||
|
|
|
|
|
|
|
|||||||
| Deferred |
||||||||||||
| Federal |
(20,616 | ) | (4,513 | ) | (2,759 | ) | ||||||
| State |
(4,430 | ) | (1,413 | ) | (874 | ) | ||||||
|
|
|
|
|
|
|
|||||||
| (25,046 | ) | (5,926 | ) | (3,633 | ) | |||||||
|
|
|
|
|
|
|
|||||||
| $ | (51,501 | ) | $ | (21,674 | ) | $ | (8,032 | ) | ||||
|
|
|
|
|
|
|
|||||||
F-30
Table of Contents
STOCK BUILDING SUPPLY HOLDINGS, INC. AND SUBSIDIARIES
NOTES TO CONSOLIDATED FINANCIAL STATEMENTS
(All amounts are presented in thousands except share and per share amounts.)
The 2010 income tax benefit of $51,501 consists of $47,463 related to continuing operations and $4,038 related to discontinued operations. The 2011 income tax benefit of $21,674 consists of $22,332 related to continuing operations and ($658) related to discontinued operations. The 2012 income tax benefit of $8,032 consists of $8,084 related to continuing operations and ($52) related to discontinued operations.
A reconciliation of differences between the statutory U.S. Federal income tax rate of 35% and the Company’s effective tax rate from continuing operations for the years ended December 31, 2010, 2011, and 2012 follows.
| 2010 | 2011 | 2012 | ||||||||||
| Income tax expense at statutory rate |
35.0 | % | 35.0 | % | 35.0 | % | ||||||
| State taxes, net of federal tax |
2.3 | 2.7 | 2.2 | |||||||||
| Nondeductible (permanent) items |
(0.2 | ) | (0.2 | ) | (1.0 | ) | ||||||
| Indemnity tax asset |
(0.9 | ) | (1.1 | ) | (0.5 | ) | ||||||
| Uncertain tax positions |
2.6 | 3.0 | 1.5 | |||||||||
| Bargain purchase gain |
3.5 | 0.0 | 0.0 | |||||||||
| Other Items |
(0.4 | ) | (2.5 | ) | 0.8 | |||||||
| Valuation allowance |
0.0 | (2.1 | ) | (2.3 | ) | |||||||
|
|
|
|
|
|
|
|||||||
| 41.9 | % | 34.8 | % | 35.7 | % | |||||||
|
|
|
|
|
|
|
|||||||
Significant components of the Company’s deferred tax assets and liabilities are as follows at December 31, 2011 and 2012.
| 2011 | 2012 | |||||||
| Deferred tax assets related to: |
||||||||
| Accounts receivable |
$ | 480 | $ | 516 | ||||
| Inventory |
2,481 | 1,763 | ||||||
| Accrued expenses |
5,200 | 5,218 | ||||||
| Other reserves and liabilities |
1,388 | 3,913 | ||||||
| Net operating loss and credit carryforwards |
2,309 | 3,325 | ||||||
|
|
|
|
|
|||||
| 11,858 | 14,735 | |||||||
| Valuation allowance |
(1,418 | ) | (1,946 | ) | ||||
|
|
|
|
|
|||||
| Total deferred tax assets |
10,440 | 12,789 | ||||||
|
|
|
|
|
|||||
| Deferred tax liabilities related to: |
||||||||
| Real estate held for sale |
(2,354 | ) | (2,296 | ) | ||||
| Intangible assets |
(4,667 | ) | (4,391 | ) | ||||
| Property and equipment |
(19,383 | ) | (18,735 | ) | ||||
| Other assets |
(1,090 | ) | (788 | ) | ||||
|
|
|
|
|
|||||
| Total deferred tax liabilities |
(27,494 | ) | (26,210 | ) | ||||
|
|
|
|
|
|||||
| Net deferred tax liability |
$ | (17,054 | ) | $ | (13,421 | ) | ||
|
|
|
|
|
|||||
At December 31, 2012, the Company has $59,602 of state net operating loss carry-forwards expiring at various dates through 2032. At December 31, 2012, the Company also has $1,679 of Federal net operating loss carry-forwards and credits that will expire at various dates through 2032.
F-31
Table of Contents
STOCK BUILDING SUPPLY HOLDINGS, INC. AND SUBSIDIARIES
NOTES TO CONSOLIDATED FINANCIAL STATEMENTS
(All amounts are presented in thousands except share and per share amounts.)
Section 382 of the Internal Revenue Code (“IRC”) imposes annual limitations on the utilization of net operating loss carry-forwards, other tax carry-forwards, and certain built-in losses upon an ownership change as defined under that section. In general terms, an ownership change may result from transactions that increase the aggregate ownership of certain stockholders in the Company’s stock by more than 50 percentage points over a three year testing period. If the Company were to experience an IRC section 382 ownership change, an annual limitation could be imposed on certain of the Company’s tax attributes, including its net operating losses, capital loss carry-forwards, and certain other losses, credits, deductions or tax basis.
The Company recognized a current income tax receivable of $9,171 at December 31, 2011 and a current income tax payable of $2,939 at December 31, 2012.
During 2010, 2011 and 2012, the Company paid $31,107, $2,049 and $244 in Federal and state income tax payments, respectively. During 2011 and 2012, the Company carried back Federal and certain state tax net operating losses as a tax deduction to offset taxable income in prior taxable periods. As a result of this tax loss carry back, the Company received tax refunds of $24,782 in 2011 and $16,399 in 2012. As of December 31, 2012, the Company is no longer able to carry back its tax net operating losses; therefore, to the extent the Company generates future tax net operating losses, the Company may be required to increase the valuation allowance on net deferred tax assets and income tax benefit would be adversely affected.
In accordance with ASC 740, the Company evaluates its deferred tax assets to determine if valuation allowances are required. In assessing the realizability of deferred tax assets, the Company considers both positive and negative evidence in determining whether it is more likely than not that some portion or all of the deferred tax assets will not be realized. The primary negative evidence considered includes the cumulative operating losses generated in prior periods. The primary positive evidence considered includes the reversal of deferred tax liabilities related to depreciation and amortization that would occur within the same jurisdiction and during the carry forward period necessary to absorb the Federal and state net operating losses and other deferred tax assets. The reversal of such liabilities would utilize the Federal and state net operating losses and other deferred tax assets.
Based upon the positive and negative evidence considered, the Company believes it is more likely than not that it will realize the benefit of the deferred tax assets, net of the existing valuation allowances of $50, $1,418, and $1,946 as of December 31, 2010, 2011 and 2012, respectively. To the extent the Company generates sufficient taxable income in the future to fully utilize the tax benefits of the net deferred tax assets on which a valuation allowance was recorded, the Company’s effective tax rate may decrease as the valuation allowance is reversed.
The following table shows the changes in the amount of the Company’s valuation allowance.
| 2010 | 2011 | 2012 | ||||||||||
| Balance at January 1, |
$ | — | $ | 50 | $ | 1,418 | ||||||
| Additions charged to expense |
50 | 1,368 | 528 | |||||||||
| Deductions |
— | — | — | |||||||||
|
|
|
|
|
|
|
|||||||
| Balance at December 31, |
$ | 50 | $ | 1,418 | $ | 1,946 | ||||||
|
|
|
|
|
|
|
|||||||
F-32
Table of Contents
STOCK BUILDING SUPPLY HOLDINGS, INC. AND SUBSIDIARIES
NOTES TO CONSOLIDATED FINANCIAL STATEMENTS
(All amounts are presented in thousands except share and per share amounts.)
At December 31, 2011 and 2012, the Company has recognized $347 and $0, respectively, within other long-term liabilities related to state uncertain tax positions with equal, corresponding amounts related to the Wolseley indemnification within other assets. All of these uncertain tax position liabilities are subject to indemnification by Wolseley. During 2012, the statute of limitations expired for certain tax periods where the Company had previously recognized a long-term liability related to uncertain tax positions. As a result, the Company increased current income tax benefit for the year ended December 31, 2012 by $347 and decreased the long-term liability related to the uncertain tax positions. The Company also recognized $347 within other income (expense), net, on the consolidated statement of operations due to the reduction in the related Wolseley indemnity asset.
At December 31, 2010 and 2011, the Company’s liability for unrecognized tax benefits reflects the uncertainty as to whether certain deductions will be respected by state taxing authorities on the Company‘s prior tax returns.
A reconciliation of the beginning and ending amount of gross unrecognized tax benefits (exclusive of the effect of interest and penalties) is as follows.
| 2010 | 2011 | 2012 | ||||||||||
| Balance at January 1, |
$ | 5,146 | $ | 2,027 | $ | 266 | ||||||
| Tax positions taken in prior periods: |
||||||||||||
| Gross increases |
89 | — | — | |||||||||
| Gross decreases |
— | — | — | |||||||||
| Tax positions taken in current period: |
||||||||||||
| Gross increases |
— | — | — | |||||||||
| Settlements with taxing authorities |
— | — | — | |||||||||
| Lapse of applicable statute of limitations |
(3,208 | ) | (1,761 | ) | (266 | ) | ||||||
|
|
|
|
|
|
|
|||||||
| Balance at December 31, |
$ | 2,027 | $ | 266 | $ | — | ||||||
|
|
|
|
|
|
|
|||||||
Certain state tax returns are under examination by various regulatory authorities. The Company‘s state tax returns are open to examination for an average of three years. However, certain jurisdictions remain open to examination longer than three years due to the existence of net operating losses and statutory waivers. The Company’s Federal returns are open to examination for three years; however, due to statutory waivers, SBS’ tax years ended July 31, 2008 and May 5, 2009 remain open until December 31, 2013 with the Federal tax authorities. SBS is currently under examination by the IRS for its tax years ended July 31, 2008, May 5, 2009, March 31, 2010, March 31, 2011 and March 31, 2012. At December 31, 2011 and 2012, the Company has recognized $2,864 and $2,923, respectively, related to expected tax and interest payments as a result of the IRS audits in its current income tax payable.
The Company’s policy is to recognize interest and penalties related to income tax liabilities and unrecognized tax benefits in income tax expense and to the extent the liability relates to pre-Acquisition Date tax periods, the Company recognizes a corresponding benefit related to the indemnity agreement from a subsidiary of Wolseley. Included in the balance of unrecognized tax benefits for the year ended December 31, 2010 are $871 and $444 of interest and penalties related to these taxes, respectively. Included in the balance of the unrecognized tax benefits for the year ended December 31, 2011 are $184 and $64 of interest and penalties related to these taxes, respectively. As of December 31, 2012 the Company has neither material unrecognized tax benefits nor any associated interest and penalties. During the years ended December 31, 2010, 2011 and 2012, the Company recognized penalties and interest related to income tax liabilities and uncertain tax benefits of $568, $213 and $73, respectively.
F-33
Table of Contents
STOCK BUILDING SUPPLY HOLDINGS, INC. AND SUBSIDIARIES
NOTES TO CONSOLIDATED FINANCIAL STATEMENTS
(All amounts are presented in thousands except share and per share amounts.)
16. Commitments and contingencies
The Company is obligated under capital leases covering fleet vehicles and certain equipment, as well as one facility. The fleet vehicles and equipment leases generally have terms ranging from three to six years and the facility lease has a term of eleven years. The carrying value of property and equipment under capital leases was $1,946 and $6,999 at December 31, 2011 and 2012, respectively, net of accumulated depreciation of $3,079 and $2,799, respectively. Amortization of assets held under capital leases is included with depreciation expense on the consolidated statements of operations.
The Company also has several noncancelable operating leases, primarily for buildings, improvements, and equipment. These leases generally contain renewal options for periods ranging from one to five years and require the Company to pay all executory costs such as property taxes, maintenance and insurance.
Future minimum lease payments under noncancelable operating leases (with initial or remaining lease terms in excess of one year) and future minimum capital lease payments as of December 31, 2012 are as follows:
| Capital leases |
Operating leases |
|||||||
| 2013 |
$ | 1,732 | $ | 18,849 | ||||
| 2014 |
1,127 | 17,549 | ||||||
| 2015 |
862 | 11,588 | ||||||
| 2016 |
716 | 10,922 | ||||||
| 2017 |
700 | 6,373 | ||||||
| Thereafter |
3,971 | 12,424 | ||||||
|
|
|
|
|
|||||
| 9,108 | $ | 77,705 | ||||||
|
|
|
|||||||
| Less: Amounts representing interest |
(2,144 | ) | ||||||
|
|
|
|||||||
| Total obligation under capital leases |
6,964 | |||||||
| Less: Current portion of capital lease obligation |
(1,329 | ) | ||||||
|
|
|
|||||||
| Long term capital lease obligation |
$ | 5,635 | ||||||
|
|
|
|||||||
Total rent expense under these operating leases for the years ended December 31, 2010, 2011 and 2012 was $23,394, $21,070 and $18,616, respectively, which are included in selling, general and administrative expenses on the consolidated statements of operations. Future payments for certain leases will be adjusted based on increases in the consumer price index.
In December 2012, the Company entered into a commitment to lease certain vehicles and equipment for which the lease term has not yet commenced. Total future minimum lease payments under these leases will be $1,334 and are expected to extend through 2018.
In 2012, the Company was a defendant in various pending lawsuits arising from assertions of defective drywall manufactured in China and purchased and installed by certain of the Company’s subcontractors, including In re: Chinese-Manufactured Drywall Products Liability Litigation, MDL Case No. 2047, in the United States District Court Eastern District of Louisiana (the “MDL”). The Company has sought and continues to seek reimbursement from Wolseley, the manufacturer, intermediate distributors, insurers, and others related to any costs incurred to investigate and repair defective Chinese drywall and
F-34
Table of Contents
STOCK BUILDING SUPPLY HOLDINGS, INC. AND SUBSIDIARIES
NOTES TO CONSOLIDATED FINANCIAL STATEMENTS
(All amounts are presented in thousands except share and per share amounts.)
resulting damage. As of December 31, 2012, the Company had recorded a liability of $1,638 in accrued expenses and other liabilities on the consolidated balance sheets as an estimate of probable future payouts related to the MDL. As of December 31, 2012, the Company had also recorded an indemnification asset of $1,638 in prepaid expenses and other current assets on the consolidated balance sheets as it expected full indemnification for any amounts paid related to these claims. The MDL was resolved in March 2013 without any impact to the Company’s income statement or cash flows and the Company no longer holds the liability nor the asset relating to the aforementioned matter.
In January 2012, an amended judgment was entered against the Company in the amount of $5,746 related to the assertion of alleged construction defects. As of December 31, 2011, the Company recorded a liability of $5,746 in other long-term liabilities on the consolidated balance sheets as an estimate of probable future payouts related to these claims. The Company also recorded an indemnification asset of $5,746 as of December 31, 2011 in other assets on the consolidated balance sheets as it expected full indemnification for any amounts paid related to this claim. This matter was resolved in 2012 without any impact on the Company’s statements of income or cash flows and, as of December 2012, the Company holds neither the liability nor asset relating to the aforementioned amended judgment.
In 2010, the Company received approximately $4,600 from the settlement of a class action lawsuit against various manufacturers of oriented strand board. The Company recorded this amount as other income on the consolidated statements of operations.
From time to time, various claims and litigation are asserted or commenced against the Company principally arising from contractual matters, product warranties and personnel and employment disputes. In determining loss contingencies, management considers the likelihood of loss as well as the ability to reasonably estimate the amount of such loss or liability. An estimated loss is recorded when it is considered probable that such a liability has been incurred and when the amount of loss can be reasonably estimated. It is not certain that the Company will prevail in these matters. However, the Company does not believe that the ultimate outcome of any pending matters, will have a material adverse effect on its consolidated financial position, results of operations or cash flows.
17. Equity and redeemable securities
Common Stock
Saturn has authorized 22,725,500 Class A Voting Common shares and 3,246,500 Class B Nonvoting Common shares with a par value of $0.01 per share.
Preferred Stock
Class A Junior Preferred Stock
On May 5, 2009, the Company authorized 10,000 Class A Junior Preferred shares available for issuance with a par value of $0.01 per share, of which 10,000 were initially issued and outstanding. At December 31, 2011 and 2012, the number of Class A Junior Preferred shares issued and outstanding was 5,100. These preferred shares, held by Gores, are redeemable by the Company at any time after July 31, 2012 for the liquidation preference of $1.00 per share, but have no voting or participation rights other than in the event of a liquidation.
F-35
Table of Contents
STOCK BUILDING SUPPLY HOLDINGS, INC. AND SUBSIDIARIES
NOTES TO CONSOLIDATED FINANCIAL STATEMENTS
(All amounts are presented in thousands except share and per share amounts.)
In the event of an involuntary liquidation, these shares are entitled to the liquidation preference which is to be paid out after Class B Senior Preferred shares and Class C Convertible Preferred shares but before all common shares. Further, these preferred shares have no conversion features into common shares and are recorded as redeemable securities (outside of permanent equity) on the accompanying consolidated balance sheets.
Class B Senior Preferred Stock
On June 30, 2009, the Company authorized 500,000 Class B Senior Preferred shares available for issuance with a par value of $0.01 per share, of which 75,000 were initially issued and outstanding. At December 31, 2011 and 2012, the number of Class B Senior Preferred shares issued and outstanding was 48,760 and 36,388, respectively. These preferred shares, held by Gores, are redeemable at any time after May 5, 2011 by the Company for the liquidation preference of $1,000 per share plus accumulated and unpaid dividends.
These shares have no voting or participating rights, but are eligible to receive cumulative preferential distributions of 8% annually when authorized by the board. Dividends earned, but not declared or paid by the Class B Preferred shares as of December 31, 2010, 2011 and 2012 were $2,049, $6,237 and $89, respectively. In the event of an involuntary liquidation, these shares are entitled to the liquidation preference which is to be paid out before all other Preferred and Common shares. These shares are also mandatorily redeemable at the liquidation preference upon an initial public offering. These preferred shares have no conversion features into common shares and are recorded as redeemable securities (outside of permanent equity) on the accompanying consolidated balance sheets.
Class C Convertible Preferred Stock
On January 26, 2012, the Company authorized 5,000 Class C Convertible Preferred shares available for issuance with a par value of $0.01 per share, of which 5,000 were initially issued and outstanding. At December 31, 2012, the number of Class C Convertible Preferred shares issued and outstanding was 5,000. These preferred shares, held by Gores, have the same voting rights as the Class A Voting Common shares. The shares are entitled to receive distributions equal to the amount of distributions as if the shares have been converted into Class A Voting Common shares. In the event of an involuntary liquidation, these shares are entitled to the liquidation which is to be paid out after Class B Preferred shares but before all other Preferred and Common shares. These shares also provide Gores with the option to convert into 4,454,889 Class A Voting Common shares at any time at a conversion price of $1.1223625. The Class C Convertible Preferred shares are recorded as redeemable securities (outside of permanent equity) on the accompanying consolidated balance sheets. As discussed in Note 3, the Class C Convertible Preferred shares will automatically convert to Class A Voting Common shares upon the completion of a public offering.
As the conversion rate was less than the deemed fair value of the Class A Common shares of $2.25, the Class C Convertible Preferred shares contained a BCF as described in ASC 470. The difference in the stated conversion price and estimated fair value of the Class A Common shares of $5,000 was accounted for as a BCF. As the option to convert the shares belonged to the holder, the BCF was recognized in the year ended December 31, 2012 as a deemed dividend, which increased the Company’s net loss attributable to common stockholders by $5,000 as well as the Company’s net loss per share by $0.38.
F-36
Table of Contents
STOCK BUILDING SUPPLY HOLDINGS, INC. AND SUBSIDIARIES
NOTES TO CONSOLIDATED FINANCIAL STATEMENTS
(All amounts are presented in thousands except share and per share amounts.)
The following table shows the changes in preferred stock:
| Class A | Class B | Class C | ||||||||||||||||||||||
| (in thousands of dollars, except share amounts) | Shares | Amount | Shares | Amount | Shares | Amount | ||||||||||||||||||
| December 31, 2009 |
10,000 | $ | — | 75,000 | $ | 78,030 | — | $ | — | |||||||||||||||
| Dividends accrued on Class B Preferred stock |
— | — | — | 5,079 | — | — | ||||||||||||||||||
| Redemption of Class B Preferred stock |
— | — | (26,240 | ) | (26,240 | ) | — | — | ||||||||||||||||
| Dividends paid on Class B Preferred stock |
— | — | — | (6,060 | ) | — | — | |||||||||||||||||
|
|
|
|
|
|
|
|
|
|
|
|
|
|||||||||||||
| December 31, 2010 |
10,000 | — | 48,760 | 50,809 | — | — | ||||||||||||||||||
| Purchase of shares from existing stockholders |
(4,900 | ) | — | — | — | — | — | |||||||||||||||||
| Dividends accrued on Class B Preferred stock |
— | — | — | 4,188 | — | — | ||||||||||||||||||
|
|
|
|
|
|
|
|
|
|
|
|
|
|||||||||||||
| December 31, 2011 |
5,100 | — | 48,760 | 54,997 | — | — | ||||||||||||||||||
| Issuance of Convertible Class C Preferred stock |
— | — | — | — | 5,000 | 5,000 | ||||||||||||||||||
| Recognition of beneficial conversion feature on Convertible Class C Preferred stock |
— | — | — | — | — | (5,000 | ) | |||||||||||||||||
| Deemed dividend on Convertible Class C Preferred stock |
— | — | — | — | — | 5,000 | ||||||||||||||||||
| Dividends accrued on Class B Preferred stock |
— | — | — | 4,480 | — | — | ||||||||||||||||||
| Redemption of Class B Preferred stock |
— | — | (12,372 | ) | (12,372 | ) | — | — | ||||||||||||||||
| Dividends paid on Class B Preferred stock |
— | — | — | (10,628 | ) | — | — | |||||||||||||||||
|
|
|
|
|
|
|
|
|
|
|
|
|
|||||||||||||
| December 31, 2012 |
5,100 | $ | — | 36,388 | $ | 36,477 | 5,000 | $ | 5,000 | |||||||||||||||
|
|
|
|
|
|
|
|
|
|
|
|
|
|||||||||||||
18. Equity based compensation
Nonvested stock awards
Certain employees of the Company were granted nonvested Class B Nonvoting Common shares during the years ended December 31, 2010, 2011 and 2012. These shares vest over a period of four years based on continued employment with the Company and the related compensation expense is amortized over the vesting period and included in selling, general and administrative expense on the consolidated statements of operations. There was no cash impact related to the nonvested stock awards during the years ended December 31, 2010, 2011 and 2012.
Stock option awards
During the years ended December 31, 2010, 2011 and 2012, certain directors and employees of the Company were awarded options to purchase Class B Nonvoting Common shares. There was no cash impact related to the stock option awards during the years ended December 31, 2010, 2011 and 2012.
Stock purchases
In January 2012, the Company’s board of directors approved the issuance and sale of 337,636 Class B Common shares to certain members of management for $0.97 per share. These shares were
F-37
Table of Contents
STOCK BUILDING SUPPLY HOLDINGS, INC. AND SUBSIDIARIES
NOTES TO CONSOLIDATED FINANCIAL STATEMENTS
(All amounts are presented in thousands except share and per share amounts.)
estimated to have a fair value at issuance of $1.98 per share. The Company recorded approximately $342 in stock compensation expense in 2012 as a result of these sales of stock at a price below fair value.
Shares awarded that revert to the Company as a result of forfeiture or termination, expiration or cancellation of an award or that are used to exercise an award or for tax withholding, will be again available for issuance. The following table highlights the expense related to share-based payment.
| 2010 | 2011 | 2012 | ||||||||||
| Nonvested stock |
$ | 228 | $ | 127 | $ | 580 | ||||||
| Stock options |
60 | 257 | 383 | |||||||||
| Stock purchases |
— | — | 342 | |||||||||
|
|
|
|
|
|
|
|||||||
| Stock based compensation |
$ | 288 | $ | 384 | $ | 1,305 | ||||||
|
|
|
|
|
|
|
|||||||
The fair value of stock options was estimated using the Black-Scholes option pricing model. The Company used the following assumptions to value the stock options issued during the years ended December 31, 2010, 2011 and 2012:
| 2010 | 2011 | 2012 | ||||||||||
| Expected dividend yield |
0 | % | 0 | % | 0 | % | ||||||
| Expected volatility factor(1) |
59 | % | 59 | % | 58 | % | ||||||
| Risk-free interest rate(2) |
1.51% - 2.06 | % | 1 | % | 0.77% - 0.89 | % | ||||||
| Expected term (in years) |
4.1 - 4.7 | 4.3 | 3.7 - 3.9 | |||||||||
| (1) | The Company estimated its volatility factor based on the average volatilities of similar public entities. |
| (2) | The risk-free interest rate is based on U.S. Treasury yields in effect at the time of grant. |
The following is a summary of nonvested stock awards and stock option awards.
| Nonvested stock | Stock options | |||||||||||||||
| Number of shares outstanding |
Weighted average grant date fair value |
Number of options outstanding |
Weighted average exercise price |
|||||||||||||
| December 31, 2009 |
1,623,250 | $ | 0.85 | — | $ | — | ||||||||||
| Granted |
129,860 | 2.60 | 845,259 | 2.05 | ||||||||||||
| Vested/exercised |
(162,325 | ) | 0.85 | — | — | |||||||||||
| Forfeited/cancelled |
(467,496 | ) | 0.83 | — | — | |||||||||||
|
|
|
|
|
|
|
|
|
|||||||||
| December 31, 2010 |
1,123,289 | 1.06 | 845,259 | 2.05 | ||||||||||||
| Granted |
64,930 | 1.92 | 64,930 | 1.92 | ||||||||||||
| Vested/exercised |
(181,804 | ) | 0.98 | — | — | |||||||||||
| Forfeited/cancelled |
(337,636 | ) | 1.16 | — | — | |||||||||||
|
|
|
|
|
|
|
|
|
|||||||||
| December 31, 2011 |
668,779 | 1.11 | 910,189 | 2.04 | ||||||||||||
| Granted |
234,086 | 1.98 | 1,006,936 | 0.97 | ||||||||||||
| Vested/exercised |
(448,355 | ) | 1.51 | — | — | |||||||||||
| Forfeited/cancelled |
(58,437 | ) | 1.92 | (1,144,274 | ) | 1.82 | ||||||||||
|
|
|
|
|
|
|
|
|
|||||||||
| December 31, 2012 |
396,073 | $ | 1.06 | 772,851 | $ | 0.97 | ||||||||||
|
|
|
|
|
|
|
|
|
|||||||||
F-38
Table of Contents
STOCK BUILDING SUPPLY HOLDINGS, INC. AND SUBSIDIARIES
NOTES TO CONSOLIDATED FINANCIAL STATEMENTS
(All amounts are presented in thousands except share and per share amounts.)
There were 149,184 shares available for future stock and stock option award issuance as of December 31, 2012.
On July 1, 2012, 546,244 options were legally exercised, but were not considered exercised for accounting purposes under ASC 718 (Note 14).
During the year ended December 31, 2012, the exercise price on all stock option agreements was revised to $0.97, and 234,086 options were cancelled and reissued as nonvested shares. These transactions were accounted for as modifications under ASC 718.
The outstanding stock options at December 31, 2012 have a weighted average remaining contractual life of 8.2 years. 71,423 options were exercisable as of December 31, 2012 at a weighted average exercise price of $0.97.
The following table summarizes the Company’s total unrecognized compensation cost related to equity based compensation as of December 31, 2012.
| Unearned Compensation |
Weighted Average Remaining Period of Expense Recognition (in years) |
|||||||
| Nonvested Stock |
$ | 146 | 0.6 | |||||
| Stock Options |
526 | 2.1 | ||||||
|
|
|
|||||||
| $ | 672 | |||||||
|
|
|
|||||||
19. Segments
ASC 280, Segment Reporting (“ASC 280”) defines operating segments as components of an enterprise about which separate financial information is available that is evaluated regularly by the chief operating decision maker in deciding how to allocate resources and in assessing performance.
Our operating segments consist of the East, South, and West geographic divisions along with Coleman Flooring. In accordance with ASC 280, due to the similar economic characteristics, nature of products, distribution methods, and customers, we have aggregated our East, South and West operating segments into one reportable segment.
In addition to our reportable segment, the Company’s consolidated results include “Other,” and is comprised of our corporate activities and Coleman Flooring, which offers professional flooring installation services.
The following tables present Net Sales, Adjusted EBITDA and certain other measures for the reportable segment and total continuing operations for the period indicated.
| 2010 | December 31, 2010 |
|||||||||||||||||||
| Net sales | Gross profit | Depreciation & amortization |
Adjusted EBITDA |
Total assets | ||||||||||||||||
| Geographic divisions |
$ | 726,623 | $ | 157,250 | $ | 33,145 | $ | (21,932 | ) | $ | 240,355 | |||||||||
| Other |
25,083 | 6,764 | 3,004 | (36,055 | ) | 54,614 | ||||||||||||||
|
|
|
|
|
|
|
|
|
|
|
|||||||||||
| $ | 751,706 | $ | 164,014 | $ | 36,149 | $ | (57,987 | ) | $ | 294,969 | ||||||||||
|
|
|
|
|
|
|
|
|
|
|
|||||||||||
F-39
Table of Contents
STOCK BUILDING SUPPLY HOLDINGS, INC. AND SUBSIDIARIES
NOTES TO CONSOLIDATED FINANCIAL STATEMENTS
(All amounts are presented in thousands except share and per share amounts.)
| 2011 | December 31, 2011 |
|||||||||||||||||||
| Net sales | Gross profit | Depreciation & amortization |
Adjusted EBITDA |
Total assets | ||||||||||||||||
| Geographic divisions |
$ | 733,947 | $ | 163,400 | $ | 14,152 | $ | (3,342 | ) | $ | 215,051 | |||||||||
| Other |
26,035 | 5,565 | 2,036 | (27,457 | ) | 39,590 | ||||||||||||||
|
|
|
|
|
|
|
|
|
|
|
|||||||||||
| $ | 759,982 | $ | 168,965 | $ | 16,188 | $ | (30,799 | ) | $ | 254,641 | ||||||||||
|
|
|
|
|
|
|
|
|
|
|
|||||||||||
| 2012 | December 31, 2012 |
|||||||||||||||||||
| Net sales | Gross profit | Depreciation & amortization |
Adjusted EBITDA |
Total assets | ||||||||||||||||
| Geographic divisions |
$ | 905,278 | $ | 206,407 | $ | 9,901 | $ | 23,992 | $ | 263,019 | ||||||||||
| Other |
37,120 | 8,321 | 1,817 | (21,999 | ) | 22,993 | ||||||||||||||
|
|
|
|
|
|
|
|
|
|
|
|||||||||||
| $ | 942,398 | $ | 214,728 | $ | 11,718 | $ | 1,993 | $ | 286,012 | |||||||||||
|
|
|
|
|
|
|
|
|
|
|
|||||||||||
Reconciliation to consolidated financial statements:
| 2010 | 2011 | 2012 | ||||||||||
| Adjusted EBITDA |
$ | (57,987 | ) | $ | (30,799 | ) | $ | 1,993 | ||||
| Interest expense |
(1,575 | ) | (2,842 | ) | (4,037 | ) | ||||||
| Income tax benefit |
47,463 | 22,332 | 8,084 | |||||||||
| Depreciation and amortization |
(36,149 | ) | (16,188 | ) | (11,718 | ) | ||||||
| Impairment of assets held for sale |
(2,944 | ) | (580 | ) | (361 | ) | ||||||
| Restructuring expense |
(7,089 | ) | (1,349 | ) | (2,853 | ) | ||||||
| Management fees |
(2,597 | ) | (2,406 | ) | (1,379 | ) | ||||||
| Non-cash compensation expense |
(288 | ) | (384 | ) | (1,305 | ) | ||||||
| Acquisition costs |
(4,086 | ) | (1,017 | ) | (284 | ) | ||||||
| Severance and other expense related to store closures and business optimization |
(12,642 | ) | (6,761 | ) | (2,375 | ) | ||||||
| Reduction of tax indemnification asset |
(3,056 | ) | (1,937 | ) | (347 | ) | ||||||
| Bargain purchase gain |
11,223 | — | — | |||||||||
| Other |
3,947 | — | — | |||||||||
|
|
|
|
|
|
|
|||||||
| Loss from continuing operations |
$ | (65,780 | ) | $ | (41,931 | ) | $ | (14,582 | ) | |||
|
|
|
|
|
|
|
|||||||
The Company does not earn revenues or have long-lived assets located in foreign countries. In accordance with the enterprise-wide disclosure requirements of the accounting standard, the Company’s net sales from external customers by main product lines are as follows for the years ended December 31, 2010, 2011 and 2012:
| 2010 | 2011 | 2012 | ||||||||||
| Structural components |
$ | 89,885 | $ | 87,542 | $ | 106,745 | ||||||
| Millwork & other interior products |
137,315 | 143,128 | 178,449 | |||||||||
| Lumber & lumber sheet goods |
237,003 | 247,299 | 333,952 | |||||||||
| Windows & other exterior products |
184,007 | 178,361 | 202,532 | |||||||||
| Other building products & services |
103,496 | 103,652 | 120,720 | |||||||||
|
|
|
|
|
|
|
|||||||
| Total sales |
$ | 751,706 | $ | 759,982 | $ | 942,398 | ||||||
|
|
|
|
|
|
|
|||||||
F-40
Table of Contents
STOCK BUILDING SUPPLY HOLDINGS, INC. AND SUBSIDIARIES
NOTES TO CONSOLIDATED FINANCIAL STATEMENTS
(All amounts are presented in thousands except share and per share amounts.)
20. Loss per common share
Basic net loss per share is calculated in accordance with ASC Topic 260, Earnings Per Share, (“ASC 260”) by dividing net loss attributable to common stockholders by the weighted average shares outstanding during the period, without consideration for common stock equivalents. Diluted net loss per share is calculated by adjusting weighted average shares outstanding for the dilutive effect of common share equivalents outstanding for the period, determined using the treasury-stock method. For purposes of the diluted net loss per share calculation, Convertible Class C Preferred shares, stock options and nonvested stock awards are considered to be common stock equivalents but are excluded from the calculation of diluted net loss per share because their effect would be anti-dilutive and therefore, basic and diluted net loss per share were the same for all periods presented.
The basic and diluted earnings per share calculations for the years ended December 31, 2010, 2011 and 2012 are presented below (in thousands, except per share amounts).
| 2010 | 2011 | 2012 | ||||||||||
| Loss from continuing operations |
$ | (65,780 | ) | $ | (41,931 | ) | $ | (14,582 | ) | |||
| Redeemable Class B Senior Preferred stock dividends |
(5,079 | ) | (4,188 | ) | (4,480 | ) | ||||||
| Convertible Class C Preferred stock dividends |
— | — | (5,000 | ) | ||||||||
|
|
|
|
|
|
|
|||||||
| Loss attributable to common stockholders from continuing operations |
(70,859 | ) | (46,119 | ) | (24,062 | ) | ||||||
| Income (loss) from discontinued operations, net of tax |
(4,214 | ) | (202 | ) | 49 | |||||||
|
|
|
|
|
|
|
|||||||
| Loss attributable to common stockholders |
$ | (75,073 | ) | $ | (46,321 | ) | $ | (24,013 | ) | |||
|
|
|
|
|
|
|
|||||||
| Weighted average outstanding shares of common stock |
23,502,470 | 22,262,337 | 13,153,446 | |||||||||
| Basic and diluted income (loss) per share |
||||||||||||
| Loss from continuing operations |
$ | (3.01 | ) | $ | (2.07 | ) | $ | (1.83 | ) | |||
| Income (loss) from discontinued operations |
(0.18 | ) | (0.01 | ) | — | |||||||
|
|
|
|
|
|
|
|||||||
| Net loss |
$ | (3.19 | ) | $ | (2.08 | ) | $ | (1.83 | ) | |||
|
|
|
|
|
|
|
|||||||
The following table provides the securities that could potentially dilute basic earnings per share in the future, but were not included in the computation of diluted earnings per share because to do so would have been anti-dilutive.
| 2010 | 2011 | 2012 | ||||||||||
| Stock option awards |
845,259 | 910,189 | 772,851 | |||||||||
| Nonvested stock awards |
1,123,289 | 668,779 | 396,073 | |||||||||
| Convertible Class C Preferred stock (as converted basis) |
— | — | 4,454,889 | |||||||||
21. Subsequent events
The Company evaluated subsequent events and transactions for potential recognition or disclosure in the financial statements through May 7, 2013, which was the original date of issuance of the financial statements. The Company also evaluated subsequent events through June 14, 2013 for the effects of the revision to earnings per share described in Note 3. The Company also evaluated subsequent events through July 29, 2013 for the effects of the restatement described in Note 2 and the 25.972-for-1 stock split of the Company’s common stock.
F-41
Table of Contents
STOCK BUILDING SUPPLY HOLDINGS, INC. AND SUBSIDIARIES
NOTES TO CONSOLIDATED FINANCIAL STATEMENTS
(All amounts are presented in thousands except share and per share amounts.)
On April 8, 2013, Commonwealth Acquisition Holdings, LLC, a wholly-owned subsidiary of the Company, purchased certain assets and assumed certain liabilities of Chesapeake Structural Systems, Inc., Creative Wood Products, LLC and Chestruc, LLC (collectively “Chesapeake”) for an adjusted purchase price of $2,623. The acquisition provides the Company with component manufacturing capability to serve customers in the Central and Northern Virginia markets. The allocation of the purchase price to the estimated fair values of the assets acquired and liabilities assumed was not complete as of the date of the issuance of these financial statements.
On April 23, 2013, the Board of Directors approved an amendment to the Company’s Certificate of Incorporation to effect a conversion from a Delaware limited liability company to a Delaware corporation and a change in the name of the Company to Stock Building Supply Holdings, Inc. On May 2, 2013, the Company filed the executed Certificate of Incorporation in the office of the Secretary of State of the State of Delaware. Upon the filing on May 2, 2013, the conversion became effective and the name of the Company was changed to Stock Building Supply Holdings, Inc. On that date, each one share of Class A common stock, Class B common stock, Class A Junior Preferred stock and Class C Preferred stock converted into one share of the same class of the converted entity. Each share of Class B Senior Preferred stock converted into 1.02966258 shares of the same class of the converted entity.
On June 13, 2013, the Company forgave a promissory note in the amount of $531 related to a loan issued on July 1, 2012 to an executive of the Company (Note 14).
On June 13, 2013, the Company entered into Amendment Nine to its Credit Agreement. The main provisions included in the amendment are as follows:
| Ÿ | The Base Rate Margin was reduced to a range of 0.50%-1.00%. |
| Ÿ | The LIBOR Rate Margin was reduced to a range of 1.50%-2.00%. |
| Ÿ | The Revolver’s borrowing base calculation was amended to include the lesser of (i) 90% of the amount of eligible credit card receivables and (ii) $5,000. |
| Ÿ | The Fixed Charge Coverage Ratio is only applicable if adjusted liquidity is less than $15,000, and remains in effect until the date on which adjusted liquidity has been greater than or equal to $15,000 for a period of 30 consecutive days. Adjusted liquidity is defined as the sum of (i) availability under the Revolver, (ii) qualified cash and (iii) for all periods from June 13, 2013 through the earlier of the date of consummation of a qualified initial public offering by the Company and August 31, 2013, up to $15,000 of suppressed availability. Suppressed availability means, as of any date of determination, the difference between the amount of the borrowing base as of such date and the revolver usage as of such date, provided that if the result is a negative number, then suppressed availability shall be $0. |
| Ÿ | The maturity date was extended to December 31, 2016. |
On June 13, 2013, the Company entered into an agreement with Gores to terminate the management services agreement effective upon consummation of an initial public offering. In connection with the termination, and in accordance with the management services agreement, Gores will receive a termination fee of $9,000.
On July 29, 2013, the Company filed an amendment to its Certificate of Incorporation effecting a 25.972-for-1 stock split of the Company’s common stock. The consolidated financial statements give retroactive effect to the stock split.
F-42
Table of Contents
STOCK BUILDING SUPPLY HOLDINGS, INC. AND SUBSIDIARIES
CONSOLIDATED BALANCE SHEETS (UNAUDITED)
| December 31, 2012 |
March 31, 2013 |
Pro Forma stockholders’ equity at March 31, 2013 |
||||||||||
| (in thousands of dollars, except share and per share amounts) | as restated (Note 2) |
as restated (Note 2) |
(Note 3) | |||||||||
| Assets |
||||||||||||
| Current assets |
||||||||||||
| Cash and cash equivalents |
$ | 2,691 | $ | 5,755 | ||||||||
| Restricted assets |
3,821 | 2,232 | ||||||||||
| Accounts receivable, net |
90,297 | 104,611 | ||||||||||
| Inventories, net |
73,918 | 95,560 | ||||||||||
| Costs in excess of billings on uncompleted contracts |
5,176 | 5,338 | ||||||||||
| Assets held for sale |
6,198 | 5,893 | ||||||||||
| Prepaid expenses and other current assets |
8,682 | 6,047 | ||||||||||
| Deferred income taxes |
3,562 | 4,819 | ||||||||||
|
|
|
|
|
|||||||||
| Total current assets |
194,345 | 230,255 | ||||||||||
| Property and equipment, net of accumulated depreciation |
55,076 | 54,302 | ||||||||||
| Intangible assets, net of accumulated amortization |
25,865 | 25,318 | ||||||||||
| Goodwill |
6,511 | 6,511 | ||||||||||
| Restricted assets |
2,202 | 1,958 | ||||||||||
| Other assets |
2,013 | 2,155 | ||||||||||
|
|
|
|
|
|||||||||
| Total assets |
$ | 286,012 | $ | 320,499 | ||||||||
|
|
|
|
|
|||||||||
| Liabilities and Stockholders’ Equity |
||||||||||||
| Current liabilities |
||||||||||||
| Accounts payable |
$ | 74,231 | $ | 88,757 | ||||||||
| Accrued expenses and other liabilities |
25,277 | 29,348 | ||||||||||
| Revolving line of credit |
72,218 | 92,484 | ||||||||||
| Income taxes payable |
2,939 | 3,223 | ||||||||||
| Current portion of restructuring reserve |
1,513 | 1,546 | ||||||||||
| Current portion of capital lease obligation |
1,329 | 1,411 | ||||||||||
| Billings in excess of costs on uncompleted contracts |
1,239 | 1,326 | ||||||||||
|
|
|
|
|
|||||||||
| Total current liabilities |
178,746 | 218,095 | ||||||||||
| Deferred income taxes |
16,983 | 16,366 | ||||||||||
| Other long-term liabilities |
14,642 | 14,310 | ||||||||||
|
|
|
|
|
|||||||||
| Total liabilities |
210,371 | 248,771 | ||||||||||
|
|
|
|
|
|||||||||
| Commitments and contingencies (Note 9) |
||||||||||||
| Redeemable Class A Junior Preferred stock, $.01 par value, 10,000 shares authorized and issued, 5,100 shares outstanding at December 31, 2012 and March 31, 2013 |
— | — | ||||||||||
| Redeemable Class B Senior Preferred stock, $.01 par value, 500,000 shares authorized, 75,000 shares issued, 36,388 shares outstanding at December 31, 2012 and March 31, 2013 |
36,477 | 37,206 | ||||||||||
| Convertible Class C Preferred stock, $.01 par value, 5,000 shares authorized and issued, 5,000 shares outstanding at December 31, 2012 and March 31, 2013 |
5,000 | 5,000 | ||||||||||
| Stockholders’ equity |
||||||||||||
| Class A common stock, $.01 par value, 22,725,500 shares authorized and issued, 11,590,005 shares outstanding at December 31, 2012 and March 31, 2013 |
$ | 116 | $ | 116 | $ | 183 | ||||||
| Class B common stock, $.01 par value, 3,246,500 shares authorized, 2,870,712 shares issued and outstanding at December 31, 2012 and March 31, 2013 |
29 | 29 | 29 | |||||||||
| Additional paid-in capital |
46,534 | 45,949 | 88,088 | |||||||||
| Retained deficit |
(12,515 | ) | (16,572 | ) | (16,572 | ) | ||||||
|
|
|
|
|
|
|
|||||||
| Total stockholders’ equity |
34,164 | 29,522 | $ | 71,728 | ||||||||
|
|
|
|
|
|
|
|||||||
| Total liabilities and stockholders’ equity |
$ | 286,012 | $ | 320,499 | ||||||||
|
|
|
|
|
|||||||||
The accompanying notes are an integral part of these consolidated financial statements.
F-43
Table of Contents
STOCK BUILDING SUPPLY HOLDINGS, INC. AND SUBSIDIARIES
CONSOLIDATED STATEMENTS OF OPERATIONS (UNAUDITED)
| Three Months Ended March 31, | ||||||||
| (in thousands of dollars, except share and per share amounts) | 2012 | 2013 | ||||||
| as restated (Note 2) |
as restated (Note 2) |
|||||||
| Net sales |
$ | 187,939 | $ | 248,726 | ||||
| Cost of goods sold |
144,508 | 194,936 | ||||||
|
|
|
|
|
|||||
| Gross profit |
43,431 | 53,790 | ||||||
|
|
|
|
|
|||||
| Selling, general and administrative expenses |
52,834 | 56,802 | ||||||
| Depreciation expense |
2,067 | 1,639 | ||||||
| Amortization expense |
365 | 547 | ||||||
| Restructuring expense |
44 | 60 | ||||||
|
|
|
|
|
|||||
| 55,310 | 59,048 | |||||||
|
|
|
|
|
|||||
| Loss from operations |
(11,879 | ) | (5,258 | ) | ||||
| Other income (expenses) |
||||||||
| Interest expense |
(963 | ) | (1,025 | ) | ||||
| Other income (expense), net |
126 | 190 | ||||||
|
|
|
|
|
|||||
| Loss from continuing operations before income taxes |
(12,716 | ) | (6,093 | ) | ||||
| Income tax benefit |
4,263 | 1,879 | ||||||
|
|
|
|
|
|||||
| Loss from continuing operations |
(8,453 | ) | (4,214 | ) | ||||
| Income (loss) from discontinued operations, net of tax benefit (provision) of $79 and ($109), respectively |
(113 | ) | 157 | |||||
|
|
|
|
|
|||||
| Net loss |
(8,566 | ) | (4,057 | ) | ||||
| Redeemable Class B Senior Preferred stock dividend |
(1,100 | ) | (729 | ) | ||||
| Accretion of beneficial conversion feature on Convertible Class C Preferred stock |
(5,000 | ) | — | |||||
|
|
|
|
|
|||||
| Loss attributable to common stockholders |
(14,666 | ) | (4,786 | ) | ||||
| Weighted average common shares outstanding basic and diluted |
12,662,556 | 13,523,270 | ||||||
| Basic and diluted income (loss) per share |
||||||||
| Loss from continuing operations |
$ | (1.15 | ) | $ | (0.36 | ) | ||
| Income (loss) from discontinued operations |
(0.01 | ) | 0.01 | |||||
|
|
|
|
|
|||||
| Net loss |
$ | (1.16 | ) | $ | (0.35 | ) | ||
|
|
|
|
|
|||||
| Proforma net loss per share, basic and diluted (unaudited) |
$ | (0.20 | ) | |||||
|
|
|
|||||||
| Weighted average shares used in computing pro forma net loss per share, basic and diluted (unaudited) |
20,124,160 | |||||||
The accompanying notes are an integral part of these consolidated financial statements.
F-44
Table of Contents
STOCK BUILDING SUPPLY HOLDINGS, INC. AND SUBSIDIARIES
CONSOLIDATED STATEMENTS OF STOCKHOLDERS’ EQUITY (UNAUDITED)
| Common Stock | Additional Paid-in Capital |
Retained Earnings (Deficit) |
||||||||||||||||||||||||||
| Class A | Class B | |||||||||||||||||||||||||||
| (in thousands of dollars, except share amounts) | Shares | Amount | Shares | Amount | Total | |||||||||||||||||||||||
| Stockholders’ equity as of December 31, 2011 |
11,590,005 | $ | 116 | 1,700,803 | $ | 17 | $ | 49,275 | $ | 2,018 | $ | 51,426 | ||||||||||||||||
| Recognition of beneficial conversion feature on Convertible Class C Preferred stock |
|
— |
|
|
— |
|
|
— |
|
|
— |
|
|
5,000 |
|
— | 5,000 | |||||||||||
| Dividend on Convertible Class C Preferred stock |
— | — | — | — | (5,000 | ) | — | (5,000 | ) | |||||||||||||||||||
| Dividends accrued on Class B Preferred stock |
— | — | — | — | (4,480 | ) | — | (4,480 | ) | |||||||||||||||||||
| Issuance of common stock to related party (Note 7) |
— | — | 110,381 | 1 | 106 | — | 107 | |||||||||||||||||||||
| Issuance of shares to existing stockholders |
— | — | 337,636 | 3 | 325 | — | 328 | |||||||||||||||||||||
| Stockholder loans related to tax withholding on stock issuance |
— | — | — | — | 11 | — | 11 | |||||||||||||||||||||
| Issuance of nonvested stock awards, net of forfeitures |
— | — | 175,648 | 2 | (2 | ) | — | — | ||||||||||||||||||||
| Exercise of stock options (Note 7) |
— | — | 546,244 | 6 | (6 | ) | — | — | ||||||||||||||||||||
| Stock compensation expense |
— | — | — | — | 1,305 | — | 1,305 | |||||||||||||||||||||
| Net loss |
— | — | — | — | — | (14,533 | ) | (14,533 | ) | |||||||||||||||||||
|
|
|
|
|
|
|
|
|
|
|
|
|
|
|
|||||||||||||||
| Stockholders’ equity as of December 31, 2012 (as restated, Note 2) |
11,590,005 | 116 | 2,870,712 | 29 | 46,534 | (12,515 | ) | 34,164 | ||||||||||||||||||||
| Dividends accrued on Class B Preferred stock |
— | — | — | — | (729 | ) | — | (729 | ) | |||||||||||||||||||
| Shareholder loans related to tax withholding on stock issuance |
— | — | — | — | (2 | ) | — | (2 | ) | |||||||||||||||||||
| Stock compensation expense |
— | — | — | — | 146 | — | 146 | |||||||||||||||||||||
| Net loss |
— | — | — | — | — | (4,057 | ) | (4,057 | ) | |||||||||||||||||||
|
|
|
|
|
|
|
|
|
|
|
|
|
|
|
|||||||||||||||
| Stockholders’ equity as of March 31, 2013 (as restated, Note 2) |
11,590,005 | $ | 116 | 2,870,712 | $ | 29 | $ | 45,949 | $ | (16,572 | ) | $ | 29,522 | |||||||||||||||
|
|
|
|
|
|
|
|
|
|
|
|
|
|
|
|||||||||||||||
The accompanying notes are an integral part of these consolidated financial statements.
F-45
Table of Contents
STOCK BUILDING SUPPLY HOLDINGS, INC. AND SUBSIDIARIES
CONSOLIDATED STATEMENTS OF CASH FLOWS (UNAUDITED)
| Three Months Ended March 31, |
||||||||
| (in thousands of dollars) | 2012 | 2013 | ||||||
| Cash flows from operating activities | as restated (Note 2) |
as restated (Note 2) |
||||||
| Net loss |
$ | (8,566 | ) | $ | (4,057 | ) | ||
| Adjustments to reconcile net loss to net cash used in operating activities |
||||||||
| Depreciation expense |
2,717 | 2,414 | ||||||
| Amortization of intangible assets |
365 | 547 | ||||||
| Amortization of debt issuance costs |
229 | 164 | ||||||
| Change in deferred income taxes |
158 | (1,874 | ) | |||||
| Noncash stock compensation expense |
328 | 146 | ||||||
| (Gain) loss on sale of property, equipment and real estate held for sale |
(249 | ) | 2 | |||||
| Bad debt expense |
626 | 488 | ||||||
| Change in assets and liabilities |
||||||||
| Accounts receivable |
(11,297 | ) | (14,802 | ) | ||||
| Inventories, net |
(19,051 | ) | (21,642 | ) | ||||
| Accounts payable |
25,469 | 15,119 | ||||||
| Other current assets and liabilities |
(1,892 | ) | 6,559 | |||||
| Other long-term liabilities |
263 | (705 | ) | |||||
|
|
|
|
|
|||||
| Net cash used in operating activities |
(10,900 | ) | (17,641 | ) | ||||
|
|
|
|
|
|||||
| Cash flows from investing activities |
||||||||
| Restricted assets |
1,387 | 1,833 | ||||||
| Proceeds from sale of property and equipment |
483 | 7 | ||||||
| Purchases of property and equipment |
(705 | ) | (374 | ) | ||||
|
|
|
|
|
|||||
| Net cash provided by investing activities |
1,165 | 1,466 | ||||||
|
|
|
|
|
|||||
| Cash flows from financing activities |
||||||||
| Proceeds from revolving line of credit |
206,710 | 273,050 | ||||||
| Repayments of proceeds from revolving line of credit |
(196,592 | ) | (252,784 | ) | ||||
| Other financing activities |
(79 | ) | (1,027 | ) | ||||
|
|
|
|
|
|||||
| Net cash provided by financing activities |
10,039 | 19,239 | ||||||
|
|
|
|
|
|||||
| Net increase in cash and cash equivalents |
304 | 3,064 | ||||||
| Cash and cash equivalents |
||||||||
| Beginning of period |
4,957 | 2,691 | ||||||
|
|
|
|
|
|||||
| End of period |
$ | 5,261 | $ | 5,755 | ||||
|
|
|
|
|
|||||
The accompanying notes are an integral part of these consolidated financial statements.
F-46
Table of Contents
STOCK BUILDING SUPPLY HOLDINGS, INC. AND SUBSIDIARIES
NOTES TO CONSOLIDATED FINANCIAL STATEMENTS
(All amounts are presented in thousands except share and per share amounts.)
1. Organization
Stock Building Supply Holdings, Inc., formerly known as Saturn Acquisition Holdings, LLC (“Saturn”), was organized as a limited liability company on April 16, 2009, under the laws of the State of Delaware and had no principal operations prior to the acquisition of Stock Building Supply Holdings, LLC and Subsidiaries (“SBS”) on May 5, 2009 (“Acquisition Date”). Prior to May 5, 2009, SBS was an indirect wholly-owned subsidiary of Wolseley plc (“Wolseley”). On May 5, 2009, Wolseley entered into a transaction with Gores Building Holdings, LLC (“Gores”), whereby Gores contributed $1 for a 51% voting interest in Saturn and Wolseley transferred 100% of the membership interest in SBS to Saturn in exchange for $1 and a 49% voting interest in Saturn pursuant to the terms of the Restructuring and Investment Agreement dated May 5, 2009.
On November 16, 2011, Saturn purchased all of Wolseley’s stockholder interests, which included 11,135,495 Class A Voting Common shares and 4,900 Class A Junior Preferred shares, for cash consideration of $25,000. The purchase was financed by $15,000 in borrowings under the revolving line of credit, $5,000 of cash and $5,000 of cash contributed by Gores (Note 7 and Note 10).
On April 23, 2013, the Board of Directors approved an amendment to the Company’s Certificate of Incorporation to effect a change in the name of the Company to Stock Building Supply Holdings, Inc., which was effective May 2, 2013.
Stock Building Supply Holdings, Inc. and Subsidiaries (the “Company,” “we,” “us,” “our,” and “management”) distributes lumber and building materials to new construction and repair and remodel contractors. Additionally, we provide solution-based services to our customers, including design, production specification, and installation management services.
Due to the seasonal nature of our industry, sales are usually lower in the first and fourth quarters than in the second and third quarters.
2. Restatement of previously issued consolidated financial statements
The Company has restated its previously issued consolidated financial statements and related footnotes as of December 31, 2012 and March 31, 2013 and for the three months ended March 31, 2012 and 2013, as set forth in these consolidated financial statements. The Company has updated the methodology utilized in the January 1, 2012 valuation, as well as placed additional weighting on the purchase of Wolseley’s stockholder interests in November 2011 (Note 1). The updated valuation of the Company’s Class A and Class B Common stock resulted in the correction of the following: (i) to correct compensation expense related to a modification of the exercise price of the Company’s outstanding stock options, the issuance of new stock options and shares purchased by management in January 2012 and (ii) to recognize a beneficial conversion feature (“BCF”) for the Convertible Class C Preferred stock and related impact on earnings per share.
The Company recorded additional compensation expense related to the modification of the exercise price of outstanding stock options, the issuance of new options and the purchase of shares by management. The Company determined that the increase in the estimated fair value of the Class B Common stock increased the Company’s total compensation expense recognized as a result of these transactions. Accordingly, in the restated consolidated financial statements for the three months ended March 31, 2012 and 2013, the Company increased stock based compensation expense by $177 and $16, respectively and increased income tax benefit by $62 and $0, respectively. In the restated consolidated financial statements as of December 31, 2012 and March 31, 2013, the Company
F-47
Table of Contents
STOCK BUILDING SUPPLY HOLDINGS, INC. AND SUBSIDIARIES
NOTES TO CONSOLIDATED FINANCIAL STATEMENTS
(All amounts are presented in thousands except share and per share amounts.)
decreased income tax payable by $177 and $177, respectively, increased additional paid-in capital by $506 and $522, respectively, and increased the basic and diluted loss per share by approximately $0.02 and $0.00 per share, respectively.
In addition, the Company has restated its consolidated financial statements to account for a BCF in the Convertible Class C Preferred stock and related accretion of dividends in the three months ended March 31, 2012. On November 16, 2011, the Company purchased 11,135,495 Class A Common shares held by Wolseley for $25,000, or approximately $2.25 per Class A Common share. This purchase was partially financed by $5,000 advanced by Gores Holdings, which in January 2012 was settled by the issuance of 5,000 Convertible Class C Preferred shares to Gores Holdings. The Convertible Class C Preferred shares can be converted to 4,454,889 Class A Common shares, representing an equivalent price of approximately $1.122 per Class A Common share. The Company determined that the difference between the price per share paid to acquire Wolseley’s Class A Common shares of $2.25 and the price per Class A Common share implied in the Convertible Class C Preferred shares of $1.122 represented a BCF totaling $5,000. The Convertible Class C Preferred shares can be converted to Class A Common shares at any time by the stockholder and therefore, the Company immediately recognized the value of the BCF as a deemed dividend, which increased the Company’s 2012 loss attributable to common stockholders by $5,000 and 2012 basic and diluted loss per share by approximately $0.39 per share.
The following tables present the effects of the restatement adjustments on the effected line items in the previously reported consolidated statement of operations for the three months ended March 31, 2012 and 2013. The restatement adjustments did not affect the consolidated statements of cash flows for the three months ended March 31, 2012 and 2013, or the consolidated balance sheets as of December 31, 2012 and March 31, 2013 with the exception of the changes described above. All related amounts have been restated as appropriate within these financial statements.
| Three months ended March 31, 2012 |
As reported |
Adjustment | Restated | |||||||||
| Selling, general and administrative expense |
$ | 52,657 | $ | 177 | $ | 52,834 | ||||||
| Loss from operations |
(11,702 | ) | (177 | ) | (11,879 | ) | ||||||
| Loss from continuing operations before income taxes |
(12,539 | ) | (177 | ) | (12,716 | ) | ||||||
| Income tax benefit |
4,201 | 62 | 4,263 | |||||||||
| Loss from continuing operations |
(8,338 | ) | (115 | ) | (8,566 | ) | ||||||
| Net loss |
(8,451 | ) | (115 | ) | (8,566 | ) | ||||||
| Redeemable Class B Senior Preferred stock dividend |
(1,100 | ) | — | (1,100 | ) | |||||||
| Accretion of beneficial conversion feature on Class C Preferred shares |
— | (5,000 | ) | (5,000 | ) | |||||||
|
|
|
|
|
|
|
|||||||
| Loss attributable to common stockholders |
$ | (9,551 | ) | $ | (5,115 | ) | $ | (14,666 | ) | |||
|
|
|
|
|
|
|
|||||||
| Basic and diluted loss per share (before impact of 25.972:1 stock split): |
||||||||||||
| Loss from continuing operations |
$ | (19.36 | ) | $ | (10.49 | ) | $ | (29.85 | ) | |||
| Loss from discontinued operations |
(0.23 | ) | — | (0.23 | ) | |||||||
|
|
|
|
|
|
|
|||||||
| Net loss |
$ | (19.59 | ) | $ | (10.49 | ) | $ | (30.08 | ) | |||
| Basic and diluted loss per share (after impact of 25.972:1 stock split): |
||||||||||||
| Loss from continuing operations(i) |
$ | (0.75 | ) | $ | (0.40 | ) | $ | (1.15 | ) | |||
| Loss from discontinued operations(i) |
(0.01 | ) | — | (0.01 | ) | |||||||
|
|
|
|
|
|
|
|||||||
| Net loss(i) |
$ | (0.76 | ) | $ | (0.40 | ) | $ | (1.16 | ) | |||
|
|
|
|
|
|
|
|||||||
| (i) | These figures were not previously reported |
F-48
Table of Contents
STOCK BUILDING SUPPLY HOLDINGS, INC. AND SUBSIDIARIES
NOTES TO CONSOLIDATED FINANCIAL STATEMENTS
(All amounts are presented in thousands except share and per share amounts.)
| Three months ended March 31, 2013 |
As reported |
Adjustment | Restated | |||||||||
| Selling, general and administrative expense |
$ | 56,786 | $ | 16 | $ | 56,802 | ||||||
| Loss from operations |
(5,242 | ) | (16 | ) | (5,258 | ) | ||||||
| Loss from continuing operations before income taxes |
(6,077 | ) | (16 | ) | (6,093 | ) | ||||||
| Income tax benefit |
1,879 | — | 1,879 | |||||||||
| Loss from continuing operations |
(4,198 | ) | (16 | ) | (4,214 | ) | ||||||
| Net loss |
(4,041 | ) | (16 | ) | (4,057 | ) | ||||||
| Redeemable Class B Senior Preferred stock dividend |
(729 | ) | — | (729 | ) | |||||||
|
|
|
|
|
|
|
|||||||
| Loss attributable to common stockholders |
$ | (4,770 | ) | $ | (16 | ) | $ | (4,786 | ) | |||
|
|
|
|
|
|
|
|||||||
| Basic and diluted loss per share (before impact of 25.972:1 stock split): |
||||||||||||
| Loss from continuing operations |
$ | (9.46 | ) | $ | (0.03 | ) | $ | (9.49 | ) | |||
| Loss from discontinued operations |
0.30 | — | 0.30 | |||||||||
|
|
|
|
|
|
|
|||||||
| Net loss |
$ | (9.16 | ) | $ | (0.03 | ) | $ | (9.19 | ) | |||
| Basic and diluted loss per share (after impact of 25.972:1 stock split): |
||||||||||||
| Loss from continuing operations(i) |
$ | (0.36 | ) | $ | — | $ | (0.36 | ) | ||||
| Loss from discontinued operations(i) |
0.01 | — | 0.01 | |||||||||
|
|
|
|
|
|
|
|||||||
| Net loss(i) |
$ | (0.35 | ) | $ | — | $ | (0.35 | ) | ||||
|
|
|
|
|
|
|
|||||||
| (i) | These figures were not previously reported. |
3. Basis of presentation
The consolidated financial statements have been prepared pursuant to the rules and regulations of the U.S. Securities and Exchange Commission (“SEC”) that permit reduced disclosure for interim periods. The consolidated balance sheet as of December 31, 2012 was derived from audited financial statements, but does not include all necessary disclosures required by accounting principles generally accepted in the United States of America (“U.S. GAAP”). The unaudited consolidated financial statements include all accounts of the Company and its subsidiaries and, in the opinion of management, include all recurring adjustments and normal accruals necessary for a fair presentation of the Company’s financial position, results of operations and cash flows for the dates and periods presented. These financial statements should be read in conjunction with the Company’s most recent audited annual financial statements. Results for interim periods are not necessarily indicative of the results to be expected during the remainder of the current year or for any future period. All material intercompany accounts and transactions have been eliminated in consolidation.
Unaudited pro forma information
Upon the filing of an amended and restated certificate of incorporation in connection with the closing of a qualified initial public offering, all of the outstanding Redeemable Class A Junior Preferred stock will convert into shares of new voting common stock in an amount equal to the liquidation preference thereof divided by the initial public offering price per share to the public (the “IPO Price”), all of the outstanding Redeemable Class B Senior Preferred stock will convert into shares of new voting common stock in an amount equal to the liquidation preference thereof plus accumulated and unpaid dividends thereon divided by the IPO Price, and all of the outstanding Convertible Class C Preferred stock will convert into 4,454,889 shares of new voting common stock. The unaudited pro forma balance sheet information at March 31, 2013 gives effect to the conversion of all shares of all classes of Preferred stock into new voting common stock as though the proposed public offering had occurred on March 31, 2013. In the accompanying statements of operations, unaudited pro forma basic and diluted net loss per share attributable to common stockholders for the three months ended March 31,
F-49
Table of Contents
STOCK BUILDING SUPPLY HOLDINGS, INC. AND SUBSIDIARIES
NOTES TO CONSOLIDATED FINANCIAL STATEMENTS
(All amounts are presented in thousands except share and per share amounts.)
2013 has been prepared to give effect to the conversion of all the outstanding shares of all classes of Preferred stock into shares of new voting common stock as though the proposed initial public offering had occurred on January 1, 2013.
The Redeemable Class A Junior Preferred stock and Redeemable Class B Senior Preferred stock have been converted to new voting common stock using the expected mid-point of the initial public offering price, calculated as follows (all amounts used in these calculations are presented as actual, unrounded amounts):
| Redeemable Class A Junior Preferred stock |
5,100 | |||
| Liquidation preference |
$ | 1.00 | ||
|
|
|
|||
| 5,100 | ||||
| Expected mid-point of the initial public offering price |
$ | 17.00 | ||
|
|
|
|||
| Equivalent shares of new voting common stock |
300 | |||
|
|
|
|||
| Redeemable Class B Senior Preferred stock |
36,388 | |||
| Liquidation preference |
$ | 1,000 | ||
|
|
|
|||
| 36,388,000 | ||||
| Accumulated and unpaid dividends |
$ | 88,909 | ||
|
|
|
|||
| 36,476,909 | ||||
| Expected mid-point of the initial public offering price |
$ | 17.00 | ||
|
|
|
|||
| Equivalent shares of new voting common stock |
2,145,701 | |||
|
|
|
Comprehensive loss
Comprehensive loss is equal to the net loss for all periods presented.
Recently issued accounting pronouncements
Comprehensive income: Reclassifications—In February 2013, the FASB issued ASU No. 2013- 02, “Reporting of Amounts Reclassified Out of Accumulated Other Comprehensive Income” (“ASU 2013-02”), to supersede and replace the presentation requirements for reclassifications out of accumulated other comprehensive income in ASU 2011-05, which were deferred indefinitely under ASU No. 2011-12, “Deferral of the Effective Date for Amendments to the Presentation of Reclassifications of Items Out of Accumulated Other Comprehensive Income in Accounting Standards Update No. 2011-05” (“ASU 2011-12”), issued in December 2011. The amendments in ASU 2013-02 would require an entity to provide additional information about reclassifications out of accumulated other comprehensive income by the respective line items of net income. For public entities, the amendments are effective for fiscal years, and interim periods within those years, beginning after December 15, 2012. The adoption of ASU 2013-02 will not have an impact on the Company’s financial position or results of operations.
4. Discontinued operations
During 2012, the Company ceased operations in certain geographic markets due to declines in residential home building throughout the U.S. and other strategic reasons. The Company will have no further significant continuing involvement in the sold operations and exited geographic markets. The cessation of operations in these markets has been treated as discontinued operations as the markets had distinguishable cash flows and operations that have been eliminated from ongoing operations.
F-50
Table of Contents
STOCK BUILDING SUPPLY HOLDINGS, INC. AND SUBSIDIARIES
NOTES TO CONSOLIDATED FINANCIAL STATEMENTS
(All amounts are presented in thousands except share and per share amounts.)
The operating results of the discontinued operations for the three months ended March 31, 2012 and 2013 are as follows:
| 2012 | 2013 | |||||||
| Net sales |
$ | 273 | $ | — | ||||
| Restructuring charges |
38 | (9 | ) | |||||
| Gain (loss) before income taxes |
(192 | ) | 266 | |||||
| Income tax benefit (expense) |
79 | (109 | ) | |||||
| Net income (loss) |
(113 | ) | 157 | |||||
The assets and liabilities of discontinued operations reflected on the consolidated balance sheets at December 31, 2012 and March 31, 2013 are as follows:
| December 31, 2012 |
March 31, 2013 |
|||||||
| Inventories, net |
$ | 20 | $ | — | ||||
| Real estate held for sale |
700 | 700 | ||||||
| Prepaid expenses and other current assets |
35 | 34 | ||||||
|
|
|
|
|
|||||
| Current assets of discontinued operations |
755 | 734 | ||||||
|
|
|
|
|
|||||
| Property and equipment, net of accumulated depreciation |
28 | 26 | ||||||
|
|
|
|
|
|||||
| Noncurrent assets of discontinued operations |
28 | 26 | ||||||
|
|
|
|
|
|||||
| Accounts payable |
2 | 3 | ||||||
| Accrued expenses and other liabilities |
167 | 217 | ||||||
| Restructuring reserve |
277 | 281 | ||||||
|
|
|
|
|
|||||
| Current liabilities of discontinued operations |
446 | 501 | ||||||
|
|
|
|
|
|||||
| Long-term restructuring reserve |
384 | 312 | ||||||
| Other long-term liabilities |
4 | — | ||||||
|
|
|
|
|
|||||
| Noncurrent liabilities of discontinued operations |
$ | 388 | $ | 312 | ||||
|
|
|
|
|
|||||
5. Restructuring costs
In addition to discontinuing operations in certain markets, the Company instituted several store closures and reductions in headcount in continuing markets (the “Restructurings”) in an effort to: (i) strengthen the Company’s competitive position; (ii) reduce costs; and (iii) improve operating margins within existing markets that management believe have favorable long-term growth demographics.
For the three months ended March 31, 2012, the Company recognized restructuring charges of $44 from continuing operations and income of $38 from discontinued operations. For the three months ended March 31, 2013, the Company recognized restructuring charges of $60 from continuing operations and $9 from discontinued operations. These restructuring charges primarily relate to interest accretion. No additional costs, other than interest accretion, are expected to be incurred related to the Restructurings.
F-51
Table of Contents
STOCK BUILDING SUPPLY HOLDINGS, INC. AND SUBSIDIARIES
NOTES TO CONSOLIDATED FINANCIAL STATEMENTS
(All amounts are presented in thousands except share and per share amounts.)
The following table summarizes the restructuring expenses incurred in connection with the Restructurings and the remaining reserves as of March 31, 2012 and 2013:
| Work force reductions |
Store closures |
Total | ||||||||||
| Restructuring reserves, December 31, 2011 |
$ | 65 | $ | 3,935 | $ | 4,000 | ||||||
| Restructuring charges incurred |
— | 6 | 6 | |||||||||
| Cash payments |
(64 | ) | (523 | ) | (587 | ) | ||||||
|
|
|
|
|
|
|
|||||||
| Restructuring reserves, March 31, 2012 |
$ | 1 | $ | 3,418 | $ | 3,419 | ||||||
|
|
|
|
|
|
|
|||||||
| Work force reductions |
Store closures |
Total | ||||||||||
| Restructuring reserves, December 31, 2012 |
$ | 353 | $ | 4,772 | $ | 5,125 | ||||||
| Restructuring charges incurred |
— | 69 | 69 | |||||||||
| Cash payments |
(25 | ) | (400 | ) | (425 | ) | ||||||
|
|
|
|
|
|
|
|||||||
| Restructuring reserves, March 31, 2013 |
$ | 328 | $ | 4,441 | $ | 4,769 | ||||||
|
|
|
|
|
|
|
|||||||
The remaining accrual for work force reduction of $328 is expected to be fully paid by December 2014. The remaining accrual for store closures of $4,441 is expected to be fully paid by January 2017 as the related leases expire.
The restructuring reserve at March 31, 2013 consists of a current portion of $1,546 and a long-term portion of $3,223, which is included in other long-term liabilities on the consolidated balance sheets.
6. Secured Credit Agreement
On June 30, 2009, the Company entered into a Secured Credit Agreement with Wells Fargo Capital Finance (the “Credit Agreement”) which includes a revolving line of credit (the “Revolver”). The Revolver was amended during 2012 for changes in financial covenants and maximum availability. The following is a summary of the significant terms of the Revolver:
| Maturity | December 11, 2015 | |
| Interest/Usage Rate |
Company’s option of Base Rate(a) plus a Base Rate Margin (ranges from 1.25%–1.75% based on Revolver availability) or LIBOR plus a LIBOR Rate Margin (ranges from 2.25%–2.75% based on Revolver availability) | |
| Maximum Availability |
Lesser of $150,000 or the borrowing base(b) | |
| Periodic Principal Payments |
None | |
| (a) | Base Rate is the higher of (i) the Federal Funds Rate plus 0.5% or (ii) the prime rate |
| (b) | The Revolver’s borrowing base is calculated as the sum of (i) 85% of the Company’s eligible accounts receivable, plus (ii) the lesser of $125,000, 65% of the eligible inventory or the liquidation value of eligible inventory as defined in the Credit Agreement minus (iii) reserves from time to time set by the administrative agent. The eligible accounts receivable and inventories are further adjusted as specified in the agreement. The Company’s borrowing base can also be increased pursuant to certain terms outlined in the Credit Agreement. |
F-52
Table of Contents
STOCK BUILDING SUPPLY HOLDINGS, INC. AND SUBSIDIARIES
NOTES TO CONSOLIDATED FINANCIAL STATEMENTS
(All amounts are presented in thousands except share and per share amounts.)
The Credit Agreement provides that the Company can use the Revolver availability to issue letters of credit. The fees on any outstanding letters of credit issued under the Revolver include a participation fee equal to the LIBOR Rate Margin. The fee on the unused portion of the Revolver is 0.375% if the average daily usage is $75,000 or below, and 0.25% if the average daily usage is above $75,000. The Revolver includes a financial covenant that requires the Company to maintain a minimum Fixed Charge Coverage Ratio of 1.0 as defined by the Credit Agreement. However, the covenant is only applicable if the sum of availability under the Revolver plus qualified cash i) falls below $15,000 or ii) is between $15,000 and $20,000 for a period of five consecutive business days, and remains in effect until the sum of availability under the Revolver plus qualified cash exceeds $20,000 for 30 consecutive days. The Company has incurred operating losses and has used cash for operating activities for the three months ended March 2012 and 2013. While there can be no assurances, based upon the Company’s forecast, the Company does not expect the covenants to become applicable during the year ended December 31, 2013. However, should this not be the case, the Company would evaluate its liquidity options including, amendment to the credit agreement, seeking alternative financing arrangements of debt and/or equity, and/or sale of assets. No assurances can be given that such alternative financing would be available, or if available, under terms similar to the Company‘s existing Credit Agreement or that the Company would be able to sell assets on a timely basis.
The Company had outstanding borrowings of $72,218 and $92,484 with net availability of $31,344 and $36,471 as of December 31, 2012 and March 31, 2013, respectively. The interest rate on outstanding LIBOR Rate borrowings of $65,000 ranged from 3.1%-3.3% and the interest rate on outstanding Base Rate borrowings of $7,218 was 5.0% as of December 31, 2012. The interest rate on outstanding borrowings at March 31, 2013, all of which were LIBOR Rate borrowings, was 2.8%. The Company had $7,550 in letters of credit outstanding under the Credit Agreement as of December 31, 2012 and March 31, 2013. The Revolver is collateralized by substantially all assets of the Company. The carrying value of the Revolver at December 31, 2012 and March 31, 2013 approximates fair value as the Revolver contains a variable interest rate. As such, the fair value of the Revolver was classified as a Level 2 measurement in accordance with ASC 820.
The Company entered into Amendment Nine to the Credit Agreement on June 13, 2013. See Note 14 for the main provisions included in the amendment.
7. Related party transactions
Prior to December 31, 2012, the Company leased an operating facility from a partnership that was partially owned by an employee. During the three months ended March 31, 2012, the Company made rental payments of $47 to this related party. No rental payments were made to this related party during the three months ended March 31, 2013.
On February 22, 2010 the Company entered into a Software, Services, License and Maintenance Services Agreement with United Road Services Inc. and its subsidiary Vehix Transvision, LLC (collectively “URS”) for the development, implementation, maintenance and support of customized software related to our SLS capability. The agreement with URS was subsequently amended and restated on March 3, 2013 to update certain services and deliverables. When we entered into the original agreement in 2010, URS was also owned by Gores as one of its portfolio companies. Gores divested its ownership interest in URS on December 14, 2012 and URS is no longer under common ownership with the Company. The Company paid URS approximately $196 during the three months ended March 31, 2012.
F-53
Table of Contents
STOCK BUILDING SUPPLY HOLDINGS, INC. AND SUBSIDIARIES
NOTES TO CONSOLIDATED FINANCIAL STATEMENTS
(All amounts are presented in thousands except share and per share amounts.)
The Company incurs expenses related to management services provided by Gores and Glendon Saturn Holdings, LLC (“Glendon”), an affiliate of Gores. For the three months ended March 31, 2012 and 2013, these expenses were $405 and $406, respectively, and are included in selling, general and administrative expenses on the consolidated statements of operations. As of December 31, 2012 and March 31, 2013, the Company had accrued expenses of $119 and $167, respectively, related to these management services. These payables are included in accrued expenses and other liabilities on the consolidated balance sheets.
As of December 31, 2012 and March 31, 2013, the Company had related party promissory note balances of $401 and $403, respectively, which represent advances, and accrued interest thereon, due from Glendon and other shareholders of the Company. These notes accrue interest at rates of 0.50%-2.72% per annum and have maturity dates ranging from May 5, 2018 to May 31, 2019. The notes are due immediately if the Company undergoes a change of control. The notes are recorded as a reduction of additional paid in capital on the consolidated balance sheets.
On July 1, 2012, the Company made a $531 loan to an executive of the Company related to an exercise of stock options. The note accrues interest at a rate of 0.92% per annum, and matures on or before June 30, 2021. The note is due immediately if the Company undergoes a change of control. While the stock options were legally exercised, they were not considered exercised for accounting purposes. As a result, the related loan is not reflected on the consolidated balance sheets.
As described in Note 1, Gores contributed $5,000 in connection with the Company’s purchase of Wolseley’s stockholder interests on November 16, 2011. On January 26, 2012, in consideration for this contribution, the Company issued Gores 5,000 Class C Convertible Preferred shares (Note 10).
On March 1, 2012, the Company issued Glendon 110,381 Class B Common shares in consideration for services performed during 2011.
The Company is part of a group health care plan with Gores. As of December 31, 2012 and March 31, 2013, the Company has $750 and $1,075, respectively, on deposit with Gores as a reserve for the payment of run-off health care claims in the event of a Plan termination, which is included in restricted assets on the consolidated balance sheets.
8. Income taxes
Under ASC 740-270, Income Taxes—Interim Reporting (“ASC 740-270”), each interim period is considered an integral part of the annual period and tax expense/(benefit) is measured using an estimated annual effective income tax rate. Estimates of the annual effective income tax rate at the end of interim periods are, of necessity, based on evaluation of possible future events and transactions and may be subject to subsequent refinement or revision. The Company forecasts its estimated annual effective income tax rate and then applies that rate to its year-to-date pre-tax ordinary income/(loss), subject to certain loss limitation provisions. In addition, certain specific transactions are excluded from the Company’s estimated annual effective tax rate computation, but are discretely recognized within income tax expense/(benefit) in their respective interim period. Future changes in the forecasted annual income/ (loss) projections, tax rate changes, or discrete tax items could result in significant adjustments to quarterly income tax expense (benefit) in future periods.
The Company evaluates its deferred tax assets quarterly to determine if valuation allowances are required. In assessing the realizability of deferred tax assets, the Company considers both positive and
F-54
Table of Contents
STOCK BUILDING SUPPLY HOLDINGS, INC. AND SUBSIDIARIES
NOTES TO CONSOLIDATED FINANCIAL STATEMENTS
(All amounts are presented in thousands except share and per share amounts.)
negative evidence in determining whether it is more likely than not that some portion or all of the deferred tax assets will not be realized. The primary negative evidence considered includes the cumulative operating losses generated in prior periods. The primary positive evidence considered includes the reversal of deferred tax liabilities related to depreciation and amortization that would occur within the same jurisdiction and during the carry forward period necessary to absorb the Federal and state net operating losses and other deferred tax assets. The reversal of such liabilities would utilize the Federal and state net operating losses and other deferred tax assets.
The Company recognized valuation allowances of $1,946 and $1,952 against its deferred tax assets related to certain tax jurisdictions as of December 31, 2012 and March 31, 2013, respectively. To the extent the Company generates sufficient taxable income in the future to utilize the tax benefits of the net deferred tax assets on which a valuation allowance is recorded, the effective tax rate may decrease as the valuation allowance is reversed. As of March 31, 2013, the Company is no longer able to carry back our tax net operating losses; therefore, to the extent the Company generates future tax net operating losses, the Company may be required to increase the valuation allowance on net deferred tax assets and income tax benefit would be adversely affected.
For the three months ended March 31, 2012, the Company’s annual estimated effective income tax rate was 35.1%, which varied from the federal statutory rate of 35% primarily due to state income tax expense and valuation allowance. For the three months ended March 31, 2012, the Company’s effective income tax rate including discontinuing operations and other discrete items was 33.6%.
For the three months ended March 31, 2013, the Company’s annual estimated effective income tax rate was 31.0%, which varied from the federal statutory rate of 35% primarily due to state income tax expense, valuation allowance and the permanent domestic manufacturing deduction under Internal Revenue Code (“IRC”) Section 199. For the three months ended March 31, 2013, the Company’s effective income tax rate including discontinuing operations and other discrete items was 30.4%.
As instituted by the American Jobs Creation Act of 2004 (PL 108-357) for tax years beginning after 2004, IRC Section 199 allows certain taxpayers to claim permanent tax deductions for qualifying domestic manufacturing or construction service activities in tax years where the taxpayer is paying federal income tax. The Company anticipates a tax benefit from this deduction for the current tax year and recognizes a reduction of 4.9% in its annual effective income tax rate as of March 31, 2013. To the extent the Company continues to generate sufficient taxable income, future periods may reflect a similar reduction in the Company’s effective income tax rate related to this benefit.
The effective income tax rate on continuing operations for the three months ended March 31, 2012 was 33.5% compared to an effective income tax rate of 30.8% for the three months ended March 31, 2013. The decrease in the year to date tax rate is primarily due to the domestic manufacturing deduction tax benefit which was not available in the prior year due to the Company’s tax operating loss position. In addition, when calculating its annual estimated effective income tax rate for the three months ended March 31, 2012, the Company was subject to a loss limitation rule because its year-to-date ordinary loss exceeded the full year expected ordinary loss. The tax benefit for that year-to-date ordinary loss was limited to the amount that would be recognized if the year-to-date ordinary loss were the anticipated ordinary loss for the full year. For the three months ended March 31, 2012, the Company’s effective income tax rate including discontinued operations and other discrete items without any loss limitation impact would have been 35.0%.
F-55
Table of Contents
STOCK BUILDING SUPPLY HOLDINGS, INC. AND SUBSIDIARIES
NOTES TO CONSOLIDATED FINANCIAL STATEMENTS
(All amounts are presented in thousands except share and per share amounts.)
The Company has no material uncertain tax positions as of December 31, 2012 and March 31, 2013.
9. Commitments and contingencies
In 2012, the Company was a defendant in various pending lawsuits arising from assertions of defective drywall manufactured in China and purchased and installed by certain of the Company’s subcontractors, including In re: Chinese-Manufactured Drywall Products Liability Litigation, MDL Case No. 2047, in the United States District Court Eastern District of Louisiana (the “MDL”). The Company sought reimbursement from Wolseley, the manufacturer, intermediate distributors, insurers, and others related to any costs incurred to investigate and repair defective Chinese drywall and resulting damage. As of December 31, 2012, the Company had recorded a liability of $1,638 in accrued expenses and other liabilities on the consolidated balance sheets as an estimate of probable future payouts related to the MDL. As of December 31, 2012, the Company had also recorded an indemnification asset of $1,638 in prepaid expenses and other current assets on the consolidated balance sheets as it expected full indemnification for any amounts paid related to these claims. The MDL was resolved in March 2013 without any impact to the Company’s income statement or cash flows. As of March 31, 2013, the liability and indemnification asset are no longer included on the consolidated balance sheets.
From time to time, various claims and litigation are asserted or commenced against the Company principally arising from contractual matters, product warranties and personnel and employment disputes. In determining loss contingencies, management considers the likelihood of loss as well as the ability to reasonably estimate the amount of such loss or liability. An estimated loss is recorded when it is considered probable that such a liability has been incurred and when the amount of loss can be reasonably estimated. It is not certain that the Company will prevail in these matters. However, the Company does not believe that the ultimate outcome of any pending matters will have a material adverse effect on its consolidated financial position, results of operations or cash flows.
10. Equity and redeemable securities
Common Stock
Saturn has authorized 22,725,500 Class A Voting Common shares and 3,246,500 Class B Nonvoting Common shares with a par value of $0.01 per share.
Preferred Stock
Class A Junior Preferred Stock
On May 5, 2009, the Company authorized 10,000 Class A Junior Preferred shares available for issuance with a par value of $0.01 per share. At December 31, 2012 and March 31, 2013, the number of Class A Junior Preferred shares issued and outstanding was 5,100. These preferred shares, held by Gores, are redeemable by the Company at any time after July 31, 2012 for the liquidation preference of $1.00 per share, but have no voting or participation rights other than in the event of a liquidation.
In the event of an involuntary liquidation, these shares are entitled to the liquidation preference which is to be paid out after Class B Senior Preferred shares and Class C Convertible Preferred shares but before all common shares. Further, these preferred shares have no conversion features into common shares and are recorded as redeemable securities (outside of permanent equity) on the accompanying consolidated balance sheets.
F-56
Table of Contents
STOCK BUILDING SUPPLY HOLDINGS, INC. AND SUBSIDIARIES
NOTES TO CONSOLIDATED FINANCIAL STATEMENTS
(All amounts are presented in thousands except share and per share amounts.)
Class B Senior Preferred Stock
On June 30, 2009, the Company authorized 500,000 Class B Senior Preferred shares available for issuance with a par value of $0.01 per share. At December 31, 2012 and March 31, 2013, the number of Class B Senior Preferred shares issued and outstanding was 36,388. These preferred shares, held by Gores, are redeemable at any time after May 5, 2011 by the Company for the liquidation preference of $1,000 per share plus accumulated and unpaid dividends.
These shares have no voting or participating rights, but are eligible to receive cumulative preferential distributions of 8% annually when authorized by the board. Dividends earned, but not declared or paid by the Class B Preferred shares as of December 31, 2012 and March 31, 2013 were $89 and $818, respectively. In the event of an involuntary liquidation, these shares are entitled to the liquidation preference which is to be paid out before all other Preferred and Common shares. These shares are also mandatorily redeemable at the liquidation preference upon an initial public offering. These preferred shares have no conversion features into common shares and are recorded as redeemable securities (outside of permanent equity) on the accompanying consolidated balance sheets.
Class C Convertible Preferred Stock
On January 26, 2012, the Company authorized 5,000 Class C Convertible Preferred shares available for issuance with a par value of $0.01 per share. At December 31, 2012 and March 31, 2013, the number of Class C Convertible Preferred shares issued and outstanding was 5,000. These preferred shares, held by Gores, have the same voting rights as the Class A Voting Common shares. The shares are entitled to receive distributions equal to the amount of distributions as if the shares have been converted into Class A Voting Common shares. In the event of an involuntary liquidation, these shares are entitled to the liquidation which is to be paid out after Class B Preferred shares but before all other Preferred and Common shares. These shares also provide Gores with the option to convert into 4,454,889 Class A Voting Common shares at any time at a conversion price of $1.122. The Class C Convertible Preferred shares are recorded as redeemable securities (outside of permanent equity) on the accompanying consolidated balance sheets. As discussed in Note 3, the Class C Convertible Preferred shares will automatically convert to Class A Voting Common shares upon the completion of a public offering.
As the conversion rate was less than the deemed fair value of the Class A Common shares of $2.25, the Class C Convertible Preferred shares contained a BCF as described in ASC 470. The difference in the stated conversion price and estimated fair value of the Class A Common shares of $5,000 was accounted for as a BCF. As the option to convert the shares belonged to the holder, the BCF was recognized during the three months ended March 31, 2012 as a deemed dividend, which increased the Company’s net loss attributable to common stockholders by $5,000 as well as the Company’s net loss per share by $0.39.
F-57
Table of Contents
STOCK BUILDING SUPPLY HOLDINGS, INC. AND SUBSIDIARIES
NOTES TO CONSOLIDATED FINANCIAL STATEMENTS
(All amounts are presented in thousands except share and per share amounts.)
The following table shows the changes in preferred stock:
| Class A | Class B | Class C | ||||||||||||||||||||||
| (in thousands of dollars, except share amounts) | Shares | Amount | Shares | Amount | Shares | Amount | ||||||||||||||||||
| December 31, 2011 |
5,100 | $ | — | 48,760 | $ | 54,997 | — | $ | — | |||||||||||||||
| Issuance of Convertible Class C Preferred stock |
— | — | — | — | 5,000 | 5,000 | ||||||||||||||||||
| Recognition of beneficial conversion feature on Convertible Class C Preferred stock |
— | — | — | — | — | (5,000 | ) | |||||||||||||||||
| Dividend on Convertible Class C Preferred stock |
— | — | — | — | — | 5,000 | ||||||||||||||||||
| Dividends accrued on Class B Preferred stock |
— | — | — | 4,480 | — | — | ||||||||||||||||||
| Redemption of Class B Preferred stock |
— | — | (12,372 | ) | (12,372 | ) | — | — | ||||||||||||||||
| Dividends paid on Class B Preferred stock |
— | — | — | (10,628 | ) | — | — | |||||||||||||||||
|
|
|
|
|
|
|
|
|
|
|
|
|
|||||||||||||
| December 31, 2012 |
5,100 | — | 36,388 | 36,477 | 5,000 | 5,000 | ||||||||||||||||||
| Dividends accrued on Class B Preferred stock |
— | — | — | 729 | — | — | ||||||||||||||||||
|
|
|
|
|
|
|
|
|
|
|
|
|
|||||||||||||
| March 31, 2013 |
5,100 | $ | — | 36,388 | $ | 37,206 | 5,000 | $ | 5,000 | |||||||||||||||
|
|
|
|
|
|
|
|
|
|
|
|
|
|||||||||||||
11. Equity based compensation
Nonvested Stock Awards
The Company grants certain directors and employees nonvested Class B Nonvoting Common shares. These shares vest over a period of four years based on continued employment with the Company and the related compensation expense is amortized over the vesting period and included in selling, general and administrative expense on the consolidated statements of operations. There was no cash impact related to the nonvested stock awards during the three months ended March 31, 2012 and 2013.
Stock Option Awards
The Company grants certain directors and employees options to purchase Class B Nonvoting Common shares. There was no cash impact related to the stock option awards during the three months ended March 31, 2012 and 2013.
In January 2012, the Company’s board of directors approved the issuance and sale of 337,636 Class B Common shares to certain members of management for $0.97 per share. These shares were estimated to have a fair value at issuance of $1.98 per share. The Company recorded approximately $127 in stock compensation expense for the three months ended March 31, 2012 as a result of these sales of stock at a price below fair value.
Shares awarded that revert to the Company as a result of forfeiture or termination, expiration or cancellation of an award or that are used to exercise an award or for tax withholding, will be again available for issuance. The following table highlights the expense related to share-based payment for the three months ended March 31:
| 2012 | 2013 | |||||||
| Nonvested stock |
$ | 54 | $ | 82 | ||||
| Stock options |
147 | 64 | ||||||
| Stock purchases |
127 | — | ||||||
|
|
|
|
|
|||||
| Stock based compensation |
$ | 328 | $ | 146 | ||||
|
|
|
|
|
|||||
F-58
Table of Contents
STOCK BUILDING SUPPLY HOLDINGS, INC. AND SUBSIDIARIES
NOTES TO CONSOLIDATED FINANCIAL STATEMENTS
(All amounts are presented in thousands except share and per share amounts.)
The fair value of stock options was estimated using the Black-Scholes option pricing model. The Company used the following assumptions to value the stock options issued during the three months ended March 31, 2012 (no stock options were granted during the three months ended March 31, 2013):
| Expected dividend yield |
0 | % | ||
| Expected volatility factor (1) |
58 | % | ||
| Risk-free interest rate (2) |
0.77% - 0.89 | % | ||
| Expected term (in years) |
3.7 - 3.9 |
| (1) | The Company estimated its volatility factor based on the average volatilities of similar public entities. |
| (2) | The risk-free interest rate is based on U.S. Treasury yields in effect at the time of grant. |
The following is a summary of nonvested stock awards and stock option awards:
| Nonvested Stock | Stock Options | |||||||||||||||
| Number of shares outstanding |
Weighted average grant date fair value |
Number of options outstanding |
Weighted average exercise price |
|||||||||||||
| December 31, 2011 |
668,779 | $ | 1.11 | 910,189 | $ | 2.04 | ||||||||||
| Granted |
— | — | 1,006,936 | 0.97 | ||||||||||||
| Vested/exercised |
(12,986 | ) | 2.60 | — | — | |||||||||||
| Forfeited/cancelled |
— | — | (910,189 | ) | 2.04 | |||||||||||
|
|
|
|
|
|
|
|
|
|||||||||
| March 31, 2012 |
655,793 | $ | 1.08 | 1,006,936 | $ | 0.97 | ||||||||||
|
|
|
|
|
|
|
|
|
|||||||||
| Nonvested Stock | Stock Options | |||||||||||||||
| Number of shares outstanding |
Weighted average grant date fair value |
Number of options outstanding |
Weighted average exercise price |
|||||||||||||
| December 31, 2012 |
396,073 | $ | 1.06 | 772,851 | $ | 0.97 | ||||||||||
| Granted |
— | — | — | — | ||||||||||||
| Vested/exercised |
(16,232 | ) | 2.60 | — | — | |||||||||||
| Forfeited/cancelled |
— | — | — | — | ||||||||||||
|
|
|
|
|
|
|
|
|
|||||||||
| March 31, 2013 |
379,841 | $ | 0.99 | 772,851 | $ | 0.97 | ||||||||||
|
|
|
|
|
|
|
|
|
|||||||||
There were 149,184 shares available for future stock and stock option award issuance as of March 31, 2013.
During the three months ended March 31, 2012, the exercise price on all stock option agreements was revised to $0.97. This transaction was accounted for as a modification of the existing awards.
The outstanding stock options at March 31, 2013 have a weighted average remaining contractual life of 8.0 years. 81,097 options were exercisable as of March 31, 2013 at a weighted average exercise price of $0.97.
F-59
Table of Contents
STOCK BUILDING SUPPLY HOLDINGS, INC. AND SUBSIDIARIES
NOTES TO CONSOLIDATED FINANCIAL STATEMENTS
(All amounts are presented in thousands except share and per share amounts.)
The following table summarizes the Company’s total unrecognized compensation cost related to equity based compensation as of March 31, 2013:
| Unearned Compensation |
Weighted Average Remaining Period of Expense Recognition (in years) |
|||||||
| Nonvested Stock |
$ | 64 | 0.6 | |||||
| Stock Options |
462 | 1.9 | ||||||
|
|
|
|||||||
| $ | 526 | |||||||
|
|
|
|||||||
12. Segments
ASC 280, Segment Reporting (“ASC 280”) defines operating segments as components of an enterprise about which separate financial information is available that is evaluated regularly by the chief operating decision maker in deciding how to allocate resources and in assessing performance.
Our operating segments consist of the East, South, and West geographic divisions along with Coleman Flooring. Due to the similar economic characteristics, nature of products, distribution methods, and customers, we have aggregated our East, South and West operating segments into one reportable segment.
In addition to our reportable segment, the Company’s consolidated results include “Other,” and is comprised of our corporate activities and Coleman Flooring, which offers professional flooring installation services.
The following tables present Net Sales, Adjusted EBITDA and certain other measures for the reportable segment and total continuing operations for the three months ended March 31, 2012 and 2013.
| 2012 | March 31, 2012 |
|||||||||||||||||||
| Net sales | Gross Profit |
Depreciation & Amortization |
Adjusted EBITDA |
Total Assets |
||||||||||||||||
| Geographic divisions |
$ | 180,808 | $ | 41,921 | $ | 2,566 | $ | (1,001 | ) | $ | 244,888 | |||||||||
| Other |
7,131 | 1,510 | 464 | (6,656 | ) | 38,535 | ||||||||||||||
|
|
|
|
|
|
|
|
|
|
|
|||||||||||
| $ | 187,939 | $ | 43,431 | $ | 3,030 | $ | (7,657 | ) | $ | 283,423 | ||||||||||
|
|
|
|
|
|
|
|
|
|
|
|||||||||||
| 2013 | March 31, 2013 |
|||||||||||||||||||
| Net sales | Gross Profit |
Depreciation & Amortization |
Adjusted EBITDA |
Total Assets |
||||||||||||||||
| Geographic divisions |
$ | 238,503 | $ | 51,517 | $ | 2,622 | $ | 4,584 | $ | 297,288 | ||||||||||
| Other |
10,223 | 2,273 | 337 | (5,805 | ) | 23,211 | ||||||||||||||
|
|
|
|
|
|
|
|
|
|
|
|||||||||||
| $ | 248,726 | $ | 53,790 | $ | 2,959 | $ | (1,221 | ) | $ | 320,499 | ||||||||||
|
|
|
|
|
|
|
|
|
|
|
|||||||||||
F-60
Table of Contents
STOCK BUILDING SUPPLY HOLDINGS, INC. AND SUBSIDIARIES
NOTES TO CONSOLIDATED FINANCIAL STATEMENTS
(All amounts are presented in thousands except share and per share amounts.)
Reconciliation to consolidated financial statements:
| 2012 | 2013 | |||||||
| Adjusted EBITDA |
$ | (7,657 | ) | $ | (1,221 | ) | ||
| Interest expense |
(963 | ) | (1,025 | ) | ||||
| Income tax benefit |
4,263 | 1,879 | ||||||
| Depreciation and amortization |
(3,030 | ) | (2,959 | ) | ||||
| Restructuring expense |
(44 | ) | (60 | ) | ||||
| Management fees |
(405 | ) | (406 | ) | ||||
| Non-cash compensation expense |
(328 | ) | (146 | ) | ||||
| Acquisition costs |
(46 | ) | (103 | ) | ||||
| Severance and other expense related to store closures and business optimization |
(243 | ) | (173 | ) | ||||
|
|
|
|
|
|||||
| Loss from continuing operations |
$ | (8,453 | ) | $ | (4,214 | ) | ||
|
|
|
|
|
|||||
The Company does not earn revenues or have long-lived assets located in foreign countries. In accordance with the enterprise-wide disclosure requirements of the accounting standard, the Company’s net sales from external customers by main product lines for the three months ended March 31, 2012 and 2013 are as follows:
| March 31, 2012 |
March 31, 2013 |
|||||||
| Structural components |
$ | 21,578 | $ | 30,565 | ||||
| Millwork and other interior products |
37,135 | 47,415 | ||||||
| Lumber & lumber sheet goods |
61,160 | 93,688 | ||||||
| Windows & other exterior products |
43,134 | 48,840 | ||||||
| Other building products and services |
24,932 | 28,218 | ||||||
|
|
|
|
|
|||||
| Total sales |
$ | 187,939 | $ | 248,726 | ||||
|
|
|
|
|
|||||
13. Loss per common share
Basic net loss per share is calculated by dividing net loss attributable to common stockholders by the weighted average shares outstanding during the period, without consideration for common stock equivalents. Diluted net loss per share is calculated by adjusting weighted average shares outstanding for the dilutive effect of common share equivalents outstanding for the period, determined using the treasury-stock method. For purposes of the diluted net loss per share calculation, Convertible Class C Preferred shares, stock options and nonvested stock awards are considered to be common stock equivalents but are excluded from the calculation of diluted net loss per share because their effect would be anti-dilutive and therefore, basic and diluted net loss per share were the same for all periods presented.
F-61
Table of Contents
STOCK BUILDING SUPPLY HOLDINGS, INC. AND SUBSIDIARIES
NOTES TO CONSOLIDATED FINANCIAL STATEMENTS
(All amounts are presented in thousands except share and per share amounts.)
The basic and diluted earnings per share calculations for the three months ended March 31, 2012 and 2013 are presented below (in thousands, except per share amounts):
| 2012 | 2013 | |||||||
| Loss from continuing operations |
$ | (8,453 | ) | $ | (4,214 | ) | ||
| Redeemable Class B Senior Preferred stock dividends |
(1,100 | ) | (729 | ) | ||||
| Convertible Class C Preferred stock dividends |
(5,000 | ) | — | |||||
|
|
|
|
|
|||||
| Loss attributable to common stockholders, from continuing operations |
(14,553 | ) | (4,943 | ) | ||||
| Income (loss) from discontinued operations, net of tax |
(113 | ) | 157 | |||||
|
|
|
|
|
|||||
| Loss attributable to common stockholders |
$ | (14,666 | ) | $ | (4,786 | ) | ||
|
|
|
|
|
|||||
| Weighted average outstanding shares of common stock |
12,662,556 | 13,523,270 | ||||||
| Basic and diluted income (loss) per share |
||||||||
| Loss from continuing operations |
$ | (1.15 | ) | $ | (0.36 | ) | ||
| Income (loss) from discontinued operations |
(0.01 | ) | 0.01 | |||||
|
|
|
|
|
|||||
| Net loss |
$ | (1.16 | ) | $ | (0.35 | ) | ||
|
|
|
|
|
|||||
The following table provides the securities that could potentially dilute basic earnings per share in the future, but were not included in the computation of diluted earnings per share because to do so would have been anti-dilutive:
| 2012 | 2013 | |||||||
| Stock option awards |
1,006,936 | 772,851 | ||||||
| Nonvested stock awards |
655,793 | 379,841 | ||||||
| Convertible Class C Preferred Stock (as converted basis) |
4,454,889 | 4,454,889 | ||||||
14. Subsequent events
The Company evaluated subsequent events and transactions for potential recognition or disclosure in the financial statements through June 14, 2013, which was the original date of issuance of the financial statements. The Company also evaluated subsequent events through July 29, 2013 for the effects of the restatement described in Note 2 and the 25.972-for-1 stock split of the Company’s common stock.
On April 8, 2013, Commonwealth Acquisition Holdings, LLC, a wholly-owned subsidiary of the Company, purchased certain assets and assumed certain liabilities of Chesapeake Structural Systems, Inc., Creative Wood Products, LLC and Chestruc, LLC (collectively “Chesapeake”) for an adjusted purchase price of $2,623. The acquisition provides the Company with component manufacturing capability to serve customers in the Central and Northern Virginia markets. The allocation of the purchase price to the estimated fair values of the assets acquired and liabilities assumed was not complete as of the date of the issuance of these financial statements.
On April 23, 2013, the Board of Directors approved an amendment to the Company’s Certificate of Incorporation to effect a conversion from a Delaware limited liability company to a Delaware corporation and a change in the name of the Company to Stock Building Supply Holdings, Inc. On May 2, 2013, the Company filed the executed Certificate of Incorporation in the office of the Secretary of State of the State of Delaware. Upon the filing on May 2, 2013, the conversion became effective and the name of the Company was changed to Stock Building Supply Holdings, Inc. On that date, each one
F-62
Table of Contents
STOCK BUILDING SUPPLY HOLDINGS, INC. AND SUBSIDIARIES
NOTES TO CONSOLIDATED FINANCIAL STATEMENTS
(All amounts are presented in thousands except share and per share amounts.)
share of Class A common stock, Class B common stock, Class A Junior Preferred stock and Class C Preferred stock converted into one share of the same class of the converted entity. Each share of Class B Senior Preferred stock converted into 1.02966258 shares of the same class of the converted entity.
On June 13, 2013, the Company forgave a promissory note in the amount of $531 related to a loan issued on July 1, 2012 to an executive of the Company (Note 7).
On June 13, 2013, the Company entered into Amendment Nine to its Credit Agreement. The main provisions included in the amendment are as follows:
| Ÿ | The Base Rate Margin was reduced to a range of 0.50%-1.00%. |
| Ÿ | The LIBOR Rate Margin was reduced to a range of 1.50%-2.00%. |
| Ÿ | The Revolver’s borrowing base calculation was amended to include the lesser of (i) 90% of the amount of eligible credit card receivables and (ii) $5,000. |
| Ÿ | The Fixed Charge Coverage Ratio is only applicable if adjusted liquidity is less than $15,000, and remains in effect until the date on which adjusted liquidity has been greater than or equal to $15,000 for a period of 30 consecutive days. Adjusted liquidity is defined as the sum of (i) availability under the Revolver, (ii) qualified cash and (iii) for all periods from June 13, 2013 through the earlier of the date of consummation of a qualified initial public offering by the Company and August 31, 2013, up to $15,000 of suppressed availability. Suppressed availability means, as of any date of determination, the difference between the amount of the borrowing base as of such date and the revolver usage as of such date, provided that if the result is a negative number, then suppressed availability shall be $0. |
| Ÿ | The maturity date was extended to December 31, 2016. |
On June 13, 2013, the Company entered into an agreement with Gores to terminate the management services agreement effective upon consummation of an initial public offering. In connection with the termination, and in accordance with the management services agreement, Gores will receive a termination fee of $9,000.
On July 29, 2013, the Company filed an amendment to its Certificate of Incorporation effecting a 25.972-for-1 stock split of the Company’s common stock. The consolidated financial statements give retroactive effect to the stock split.
F-63
Table of Contents
8,823,530 Shares
Stock Building Supply Holdings, Inc.
Common Stock
| Goldman, Sachs & Co. | ||||||||||
| Barclays | ||||||||||
| Citigroup | ||||||||||
| Baird | Stephens Inc. | Wells Fargo Securities |
Through and including , 2013 (the 25th day after the date of this prospectus), all dealers effecting transactions in these securities, whether or not participating in this offering, may be required to deliver a prospectus. This is in addition to a dealer’s obligation to deliver a prospectus when acting as an underwriter and with respect to an unsold allotment or subscription.
Table of Contents
PART II
| Item 13. | Other expenses of issuance and distribution |
The following table sets forth all costs and expenses, other than the underwriting discounts and commissions payable by us, in connection with the offer and sale of the securities being registered. All amounts shown are estimates except for the SEC registration fee and the FINRA filing fee.
| Amount | ||||
| SEC registration fee |
$ | 24,913 | ||
| FINRA filing fee |
27,897 | |||
| Exchange listing fee |
99,500 | |||
| Legal fees and expenses |
1,000,000 | |||
| Accounting fees and expenses |
500,000 | |||
| Printing expenses |
325,000 | |||
| Miscellaneous expenses |
272,690 | |||
|
|
|
|||
| Total |
$ | 2,250,000 | ||
|
|
|
|||
| Item 14. | Indemnification of directors and officers |
Section 102(b)(7) of the DGCL allows a corporation to provide in its amended and restated certificate of incorporation that a director of the corporation will not be personally liable to the corporation or its stockholders for monetary damages for breach of fiduciary duty as a director, except where the director breached the duty of loyalty, failed to act in good faith, engaged in intentional misconduct or knowingly violated a law, authorized the payment of a dividend or approved a stock repurchase in violation of Delaware corporate law or obtained an improper personal benefit. Our amended and restated certificate of incorporation provides for this limitation of liability.
Section 145 of the DGCL (“Section 145”), provides that a Delaware corporation may indemnify any person who was, is or is threatened to be made, party to any threatened, pending or completed action, suit or proceeding, whether civil, criminal, administrative or investigative (other than an action by or in the right of such corporation), by reason of the fact that such person is or was an officer, director, employee or agent of such corporation or is or was serving at the request of such corporation as a director, officer, employee or agent of another corporation or enterprise. The indemnity may include expenses (including attorneys’ fees), judgments, fines and amounts paid in settlement actually and reasonably incurred by such person in connection with such action, suit or proceeding, provided such person acted in good faith and in a manner he reasonably believed to be in or not opposed to the corporation’s best interests and, with respect to any criminal action or proceeding, had no reasonable cause to believe that his or her conduct was illegal. A Delaware corporation may indemnify any persons who are, were or are threatened to be made a party to any threatened, pending or completed action or suit by or in the right of the corporation by reason of the fact that such person is or was a director, officer, employee or agent of another corporation or enterprise. The indemnity may include expenses (including attorneys’ fees) actually and reasonably incurred by such person in connection with the defense or settlement of such action or suit, provided such person acted in good faith and in a manner he reasonably believed to be in or not opposed to the corporation’s best interests, provided that no indemnification is permitted without judicial approval if the officer, director, employee or agent is adjudged to be liable to the corporation. Where an officer or director is successful on the merits or otherwise in the defense of any action referred to above, the corporation must indemnify him against the expenses which such officer or director has actually and reasonably incurred.
Section 145 further authorizes a corporation to purchase and maintain insurance on behalf of any person who is or was a director, officer, employee or agent of the corporation or is or was serving at the request of the corporation as a director, officer, employee or agent of another corporation or
Table of Contents
enterprise, against any liability asserted against him and incurred by him in any such capacity, or arising out of his or her status as such, whether or not the corporation would otherwise have the power to indemnify him under Section 145.
Our amended and restated bylaws will provide that we must indemnify our directors and officers to the fullest extent authorized by the DGCL and must also pay expenses incurred in defending any such proceeding in advance of its final disposition; provided, that if and to the extent required by the DGCL, such an advance shall be made only upon delivery of an undertaking, by or on behalf of an indemnified person, to repay all amounts so advanced if it should be determined ultimately by final judicial decision from which there is no further right to appeal that such person is not entitled to be indemnified under such section or otherwise.
We intend to enter into indemnification agreements with each of our current directors and officers. These agreements will require us to indemnify these individuals to the fullest extent permitted under Delaware law against liabilities that may arise by reason of their service to us, and to advance expenses incurred as a result of any proceeding against them as to which they could be indemnified.
The indemnification rights set forth above shall not be exclusive of any other right which an indemnified person may have or hereafter acquire under any statute, provision of our amended and restated certificate of incorporation, our amended and restated bylaws, agreement, vote of stockholders or disinterested directors or otherwise.
We expect to maintain standard policies of insurance that provide coverage (1) to our directors and officers against loss rising from claims made by reason of breach of duty or other wrongful act and (2) to us with respect to indemnification payments that we may make to such directors and officers.
The proposed form of Underwriting Agreement previously filed as Exhibit 1.1 to this registration statement provides for indemnification to our directors and officers by the underwriters against certain liabilities.
| Item 15. | Recent sales of unregistered securities |
Since May 1, 2010, the registrant has issued and sold the following unregistered securities:
(1) In June 2010, the registrant issued 38,595 shares of Class B non-voting common stock to Mr. Mellor for an aggregate purchase price of $100,000.
(2) In January 2012, the registrant issued 5,000 shares of Class C preferred stock to Gores Building Holdings, LLC for an aggregate purchase price of $5 million.
(3) From March 2012 to July 2012, the registrant issued an aggregate 337,636 shares of Class B non-voting common stock to certain of the registrants’ employees for an aggregate purchase price of $328,250.
No underwriters were involved in the foregoing sales of securities. The issuances of the securities described above were deemed to be exempt from registration under the Securities Act in reliance on Rule 701 promulgated under Section 3(b) of the Securities Act or on Section 4(2) of the Securities Act. The recipients of securities in each such transaction represented their intention to acquire the securities for investment only and not with a view to or for sale in connection with any distribution thereof and appropriate legends were affixed to the stock certificates.
| Item 16. | Exhibits and financial statement schedules |
| (a) | The list of exhibits is set forth under “Exhibit Index” at the end of this registration statement and is incorporated herein by reference. |
Table of Contents
| (b) | See the Index to Consolidated Financial Statements included on page F-1 for a list of the financial statements included in this registration statement. All schedules not identified above have been omitted because they are not required, are inapplicable, or the information is included in the consolidated financial statements or notes contained in this registration statement. |
Certain of the agreements included as exhibits to this prospectus contain representations and warranties by each of the parties to the applicable agreement. These representations and warranties have been made solely for the benefit of the other parties to the applicable agreement and:
| Ÿ | should not in all instances be treated as categorical statements of fact, but rather as a way of allocating the risk to one of the parties if those statements prove to be inaccurate; |
| Ÿ | have been qualified by disclosures that were made to the other party in connection with the negotiation of the applicable agreement, which disclosures are not necessarily reflected in the agreement; |
| Ÿ | may apply standards of materiality in a way that is different from what may be viewed as material to you or other investors; and |
| Ÿ | were made only as of the date of the applicable agreement or such other date or dates as may be specified in the agreement and are subject to more recent developments. |
The registrant acknowledges that, notwithstanding the inclusion of the foregoing cautionary statements, it is responsible for considering whether additional specific disclosures of material information regarding material contractual provisions are required to make the statements in this registration statement not misleading.
| Item 17. | Undertakings |
The undersigned registrant hereby undertakes to provide to the underwriters at the closing specified in the underwriting agreement certificates in such denominations and registered in such names as required by the underwriters to permit prompt delivery to each purchaser.
Insofar as indemnification for liabilities arising under the Securities Act may be permitted to directors, officers and controlling persons of the registrant pursuant to the foregoing provisions, or otherwise, the registrant has been advised that in the opinion of the Securities and Exchange Commission, such indemnification is against public policy as expressed in the Securities Act, and is, therefore, unenforceable. In the event that a claim for indemnification against such liabilities (other than the payment by the registrant of expenses incurred or paid by a director, officer or controlling person of the registrant in the successful defense of any action, suit or proceeding) is asserted by such director, officer or controlling person in connection with the securities being registered, the registrant will, unless in the opinion of its counsel the matter has been settled by controlling precedent, submit to a court of appropriate jurisdiction the question of whether such indemnification is against public policy as expressed in the Securities Act and will be governed by the final adjudication of such issue.
The undersigned registrant hereby undertakes that:
(i) for purposes of determining any liability under the Securities Act, the information omitted from the form of prospectus filed as part of this registration statement in reliance upon Rule 430A and contained in a form of prospectus filed by the registrant pursuant to Rule 424(b)(1) or (4) or 497(h) under the Securities Act shall be deemed to be part of this registration statement as of the time it was declared effective; and
(ii) for the purpose of determining any liability under the Securities Act, each post-effective amendment that contains a form of prospectus shall be deemed to be a new registration statement relating to the securities offered therein, and the offering of such securities at that time shall be deemed to be the initial bona fide offering thereof.
Table of Contents
SIGNATURES
Pursuant to the requirements of the Securities Act of 1933, Stock Building Supply Holdings, Inc., a Delaware corporation, has duly caused this Amendment No. 3 to Registration Statement on Form S-1 to be signed on its behalf by the undersigned, thereunto duly authorized, in the City of Raleigh, North Carolina, on July 30, 2013.
| STOCK BUILDING SUPPLY HOLDINGS, INC. | ||||||
| By: | /s/ Jeffrey G. Rea | |||||
| Name: | Jeffrey G. Rea | |||||
| Title: | President and Chief Executive Officer | |||||
Pursuant to the requirements of the Securities Act of 1933, this Amendment No. 3 to Registration Statement on Form S-1 has been signed by the following persons in their capacities and on July 30, 2013.
| Signature |
Title | |
| /s/ Jeffrey G. Rea Jeffrey G. Rea |
President and Chief Executive Officer and Director (principal executive officer) | |
| * James F. Major, Jr. |
Executive Vice President, Chief Financial Officer and Treasurer (principal financial officer and principal accounting officer) | |
| * Timothy Meyer |
Chairman | |
| * Andrew Freedman |
Director | |
| * Barry J. Goldstein |
Director | |
| * Robert E. Mellor |
Director | |
| * Ryan Wald |
Director | |
| * Steven C. Yager |
Director | |
| * | The undersigned, by signing his name hereto, signs and executes this Amendment No. 3 to Registration Statement on Form S-1 pursuant to the Powers of Attorney executed by the above named signatories and previously filed with the Securities and Exchange Commission on June 14, 2013. |
| By: | /s/ Jeffrey G. Rea | |
| Jeffrey G. Rea | ||
| Attorney-in-fact | ||
Table of Contents
EXHIBIT INDEX
| Exhibit |
Exhibit description | |
| 1.1– | Form of Underwriting Agreement | |
| 2.1*– | Restructuring and Investment Agreement, dated as of May 5, 2009, by and among Wolseley Investments North America, Stock Building Supply Holdings, LLC and Saturn Acquisition Holdings, LLC | |
| 2.2– | Plan of Conversion of Saturn Acquisition Holdings, LLC | |
| 3.1– | Certificate of Conversion of Stock Building Supply Holdings, Inc. into a corporation | |
| 3.2– | Certificate of Incorporation of Stock Building Supply Holdings, Inc. | |
| 3.3– | Bylaws of Stock Building Supply Holdings, Inc. | |
| 3.4 | Form of Amended and Restated Certificate of Incorporation of Stock Building Supply Holdings, Inc. to become effective upon consummation of this offering | |
| 3.5– | Form of Amended and Restated Bylaws of Stock Building Supply Holdings, Inc. to become effective upon consummation of this offering | |
| 3.6– | Certificate of Amendment to Certificate of Incorporation of Stock Building Supply Holdings, Inc. | |
| 4.1– | Form of stock certificate | |
| 5.1– | Opinion of Kirkland & Ellis LLP | |
| 10.1**– | Credit Agreement, dated as of June 30, 2009, by and among Stock Building Supply Holdings II, LLC, as parent, the subsidiaries of parent party thereto, as borrowers, the lenders party thereto, and Wells Fargo Capital Finance (f/k/a Wells Fargo Foothill, LLC), as the co-lead arranger and administrative agent | |
| 10.2– | Amendment No. 1 and Waiver to Credit Agreement, dated as of January 11, 2010, by and among Stock Building Supply Holdings II, LLC, as parent, the subsidiaries of parent party thereto, as borrowers, the lenders party thereto, and Wells Fargo Capital Finance (f/k/a Wells Fargo Foothill, LLC), as the co-lead arranger and administrative agent | |
| 10.3– | Amendment No. 2 and Waiver to Credit Agreement, dated as of April 2, 2010, by and among Stock Building Supply Holdings II, LLC, as parent, the subsidiaries of parent party thereto, as borrowers, the lenders party thereto, and Wells Fargo Capital Finance (f/k/a Wells Fargo Foothill, LLC), as the co-lead arranger and administrative agent | |
| 10.4– | Amendment No. 3 to Credit Agreement and Consent, dated as of June 30, 2010, by and among Stock Building Supply Holdings II, LLC, as parent, the subsidiaries of parent party thereto, as borrowers, the lenders party thereto, and Wells Fargo Capital Finance (f/k/a Wells Fargo Foothill, LLC), as the co-lead arranger and administrative agent | |
| 10.5– | Amendment No. 4 to Credit Agreement and Consent, dated as of November 16, 2011, by and among Stock Building Supply Holdings II, LLC, as parent, the subsidiaries of parent party thereto, as borrowers, the lenders party thereto, and Wells Fargo Capital Finance (f/k/a Wells Fargo Foothill, LLC), as the co-lead arranger and administrative agent | |
| 10.6– | Amendment No. 5 to Credit Agreement, dated as of May 31, 2012, by and among Stock Building Supply Holdings II, LLC, as parent, the subsidiaries of parent party thereto, as borrowers, the lenders party thereto, and Wells Fargo Capital Finance (f/k/a Wells Fargo Foothill, LLC), as the co-lead arranger and administrative agent | |
| 10.7**– | Amendment No. 6 to Credit Agreement and Consent, dated as of December 13, 2012, by and among Stock Building Supply Holdings II, LLC, as parent, the subsidiaries of parent party thereto, as borrowers, the lenders party thereto, and Wells Fargo Capital Finance (f/k/a Wells Fargo Foothill, LLC), as the co-lead arranger and administrative agent | |
| 10.8– | Amendment No. 7 to Credit Agreement and Consent, dated as of December 21, 2012, by and among Stock Building Supply Holdings II, LLC, as parent, the subsidiaries of parent party thereto, as borrowers, the lenders party thereto, and Wells Fargo Capital Finance (f/k/a Wells Fargo Foothill, LLC), as the co-lead arranger and administrative agent | |
Table of Contents
| Exhibit |
Exhibit description | |
| 10.9– | Amendment No. 8 to Credit Agreement and Consent, dated as of May 31, 2013, by and among Stock Building Supply Holdings II, LLC, as parent, the subsidiaries of parent party thereto, as borrowers, the lenders party thereto, and Wells Fargo Capital Finance (f/k/a Wells Fargo Foothill, LLC), as the co-lead arranger and administrative agent | |
| 10.10– | Amendment No. 9 to Credit Agreement and Amendment No. 2 to Security Agreement and Consent, dated as of June 13, 2013, by and among Stock Building Supply Holdings II, LLC, as parent, the subsidiaries of parent party thereto, as borrowers, the lenders party thereto, and Wells Fargo Capital Finance (f/k/a Wells Fargo Foothill, LLC), as the co-lead arranger and administrative agent | |
| 10.11– | Amended and Restated Professional Services Agreement, dated as of June 13, 2013, by and between Glendon Partners, Inc. and Stock Building Supply Holdings, Inc. | |
| 10.12– | Management Services Agreement, dated as of May 4, 2009, by and between The Gores Group, LLC and Saturn Acquisition Holdings, LLC | |
| 10.13– | Termination of Management Services Agreement, dated as of June 13, 2013, by and between The Gores Group, LLC and Stock Building Supply Holdings, Inc. | |
| 10.14– | Contribution Agreement, dated as of November 16, 2011, by and between Saturn Acquisition Holdings, LLC and Gores Building Holdings, LLC | |
| 10.15– | Registration rights provisions applicable to certain stockholders of Stock Building Supply Holdings, Inc. (incorporated by reference from Exhibit D of Exhibit 2.2 hereof) | |
| 10.16– | Form of Director Nomination Agreement, by and among Stock Building Supply Holdings, Inc., Gores Building Holdings, LLC and The Gores Group, LLC | |
| 10.17†– | Employment Agreement, dated as of November 11, 2010, between Stock Building Supply Holdings, LLC and Jeffrey G. Rea | |
| 10.18†– | Employment Agreement, dated as of April 14, 2011, between Stock Building Supply Holdings, LLC and James F. Major, Jr. | |
| 10.19†– | Amended and Restated Employment Agreement, dated as of April 1, 2012, between Stock Building Supply Holdings, LLC and Bryan J. Yeazel | |
| 10.20†– | Form of Indemnification Agreement (between Stock Building Supply Holdings, Inc. and its directors and officers) | |
| 10.21†– | Form of Stock Building Supply Holdings, Inc. 2013 Incentive Compensation Plan | |
| 10.22†– | Description of Management Incentive Plan for Executive Officers | |
| 10.23†– | Form of Nonqualified Stock Option Agreement Pursuant to the Stock Building Supply Holdings, Inc. 2013 Incentive Compensation Plan | |
| 10.24†– | Form of Restricted Stock Agreement Pursuant to the Stock Building Supply Holdings, Inc. 2013 Incentive Compensation Plan | |
| 10.25†– | Form of Restricted Stock Unit Agreement Pursuant to the Stock Building Supply Holdings, Inc. 2013 Incentive Compensation Plan | |
| 10.26†–
|
Form of Amended and Restated Employment Agreement between Stock Building Supply Holdings, Inc. and Jeffrey G. Rea | |
| 10.27†– | Form of Amended and Restated Employment Agreement between Stock Building Supply Holdings, Inc. and James F. Major, Jr. | |
| 10.28†–
|
Form of Amended and Restated Employment Agreement between Stock Building Supply Holdings, Inc. and Bryan J. Yeazel | |
| 21.1– | List of subsidiaries of Stock Building Supply Holdings, Inc. | |
| 23.1 | Consent of PricewaterhouseCoopers LLP | |
| 23.2– | Consent of Kirkland & Ellis LLP (included in Exhibit 5.1) | |
| 24.1– | Powers of Attorney | |
| * | Exhibits and schedules have been omitted pursuant to Item 601(b)(2) of Regulation S-K and will be furnished to the Securities and Exchange Commission upon request. |
| ** | Certain portions have been omitted pursuant to a confidential treatment request filed separately with the Securities and Exchange Commission. Omitted information has been filed separately with the Securities and Exchange Commission. |
| † | Indicates exhibits that constitute management contracts or compensatory plans or arrangements. |
| – | Indicates exhibits that were previously filed by the registrant. |