Attached files
| file | filename |
|---|---|
| 8-K - FORM 8-K - NTELOS HOLDINGS CORP. | d575091d8k.htm |
| EX-99.1 - EX-99.1 - NTELOS HOLDINGS CORP. | d575091dex991.htm |
 NASDAQ: NTLS
2Q 2013 Earnings Presentation
July 30, 2013
Exhibit 99.2 |
 Presentation of Financial and Other Important Information
2
NASDAQ: NTLS
USE OF NON-GAAP FINANCIAL MEASURES
Included in this presentation are certain non-GAAP financial measures that are not determined in
accordance with US generally accepted accounting principles (“GAAP”). These financial
performance measures are not indicative of cash provided or used by operating activities and exclude the effects of certain operating,
capital and financing costs and may differ from comparable information provided by other companies,
and they should not be considered in isolation, as an alternative to, or more meaningful than
measures of financial performance determined in accordance with US generally accepted accounting principles. These
financial performance measures are commonly used in the industry and are presented because NTELOS
believes they provide relevant and useful information to investors. NTELOS utilizes these
financial performance measures to assess its ability to meet future capital expenditure and working capital requirements, to incur
indebtedness if necessary, and to fund continued growth. NTELOS also uses these financial
performance measures to evaluate the performance of its business, for budget planning purposes
and as factors in its employee compensation programs. Adjusted EBITDA is defined as net income attributable to NTELOS Holdings
Corp. before interest, income taxes, depreciation and amortization, accretion of asset retirement
obligations, gain/loss on derivatives, net income attributable to non-controlling
interests, other expenses/income, equity based compensation charges, acquisition related charges, gain/loss on sale of assets and net loss from
discontinued operations and costs related to the separation of the wireless and wireline companies.
Please review the reconciliations and other definitions of non- GAAP financial measures
contained in the press releases filed by the Company with the SEC, including those filed on Form 8-K on August 1, 2012, November 8,
2012, February 28, 2013, May 7, 2013 and July 30, 2013.
SPECIAL NOTE REGARDING FORWARD-LOOKING STATEMENTS
Any statements contained in this presentation that are not statements of historical fact, including
statements about our beliefs and expectations, are forward-looking statements and should be
evaluated as such. The words “anticipates,” “believes,” “expects,” “intends,” “plans,” “estimates,” “targets,” “projects,” “should,” “may,”
“will” and similar words and expressions are intended to identify forward-looking
statements. Such forward-looking statements reflect, among other things, our current
expectations, plans and strategies, and anticipated financial results, all of which are subject to known and unknown risks, uncertainties and factors that may
cause our actual results to differ materially from those expressed or implied by these
forward-looking statements. Many of these risks are beyond our ability to control or
predict. Because of these risks, uncertainties and assumptions, you should not place undue reliance on these forward-looking statements. Furthermore,
forward-looking statements speak only as of the date they are made. We do not undertake any
obligation to update or review any forward-looking information, whether as a result of new
information, future events or otherwise. Important factors with respect to any such forward-looking statements, including certain risks
and uncertainties that could cause actual results to differ from those contained in the
forward-looking statements, include, but are not limited to: our ability to attract
and retain retail subscribers to our services; our dependence on our strategic relationship and the
potential outcome of any disputes with Sprint Nextel (“Sprint”); a potential increase
in roaming rates and wireless handset subsidy costs; rapid development and intense competition in the telecommunications industry; our ability
to finance, design, construct and realize the benefits of any planned network technology upgrade; our
ability to acquire or gain access to additional spectrum; the potential to experience a high
rate of customer turnover; the potential for Sprint and others to build networks in our markets; cash and capital requirements;
operating and financial restrictions imposed by our senior credit facility; adverse economic
conditions; federal and state regulatory fees, requirements and developments; loss of ability
to use our current cell sites; our continued reliance on indirect channels of retail distribution; our reliance on certain suppliers and
vendors; and other unforeseen difficulties that may occur. These risks and uncertainties are not
intended to represent a complete list of all risks and uncertainties inherent in our business,
and should be read in conjunction with the more detailed cautionary statements and risk factors included in our SEC filings, including our
most recent Annual Report filed on Form 10-K.
|
 Agenda
NASDAQ: NTLS
3
•
Jim Hyde, Chief Executive Officer
•
Steb Chandor, Chief Financial Officer
•
Conrad Hunter, Chief Operating Officer
Review Financial and Operational Highlights
Guidance Update
Q&A Session |
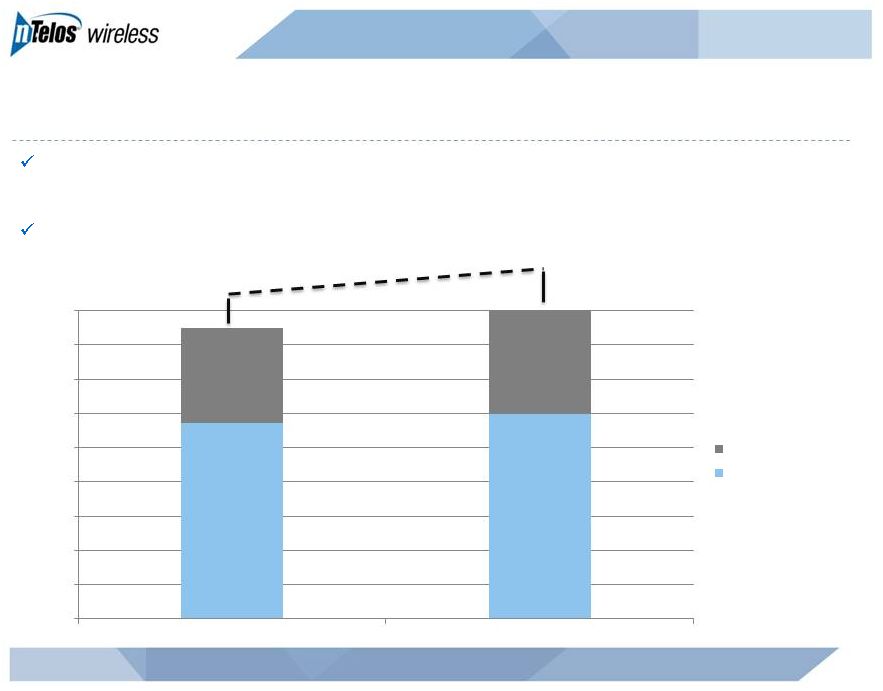
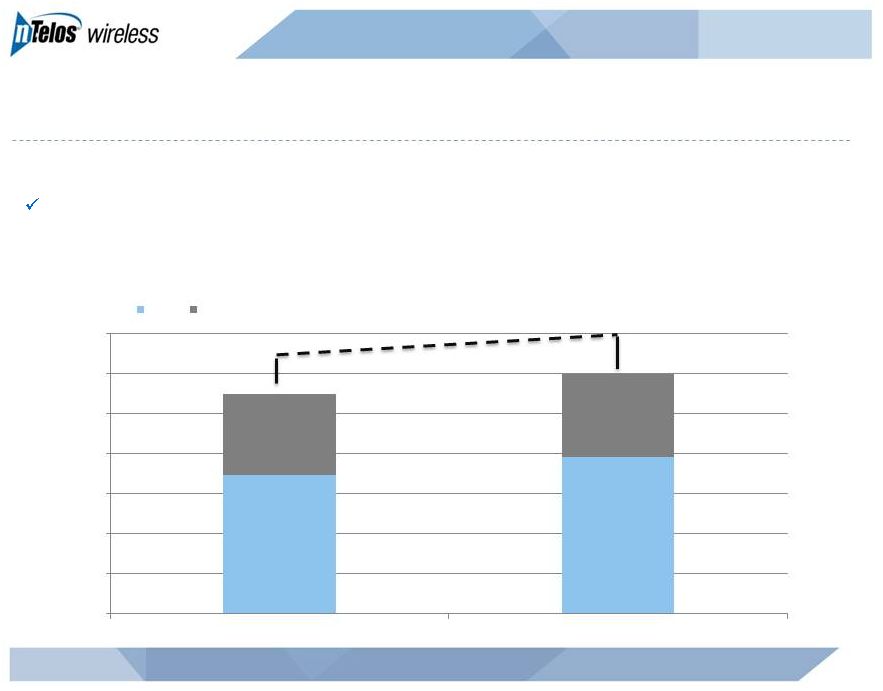 Continuing Growth in Operating Revenues
4
NASDAQ: NTLS
millions
+7%
2Q13 revenue increased 7% from 2Q12 to $119.9 million
$0.0
$20.0
$40.0
$60.0
$80.0
$100.0
$120.0
$140.0
2Q 2012
2Q 2013
Retail
Wholesale & Other |
 Retail Revenue Gains Continue
5
NASDAQ: NTLS
millions
Subscriber revenue growth continues to be driven by both:
ARPU growth
Subscriber growth
2Q13 retail revenue increased 1% sequentially and 13% from 2Q12 to $78.4
million Highest level in four years
+13%
$64.0
$66.0
$68.0
$70.0
$72.0
$74.0
$76.0
$78.0
$80.0
2Q 2012
2Q 2013 |
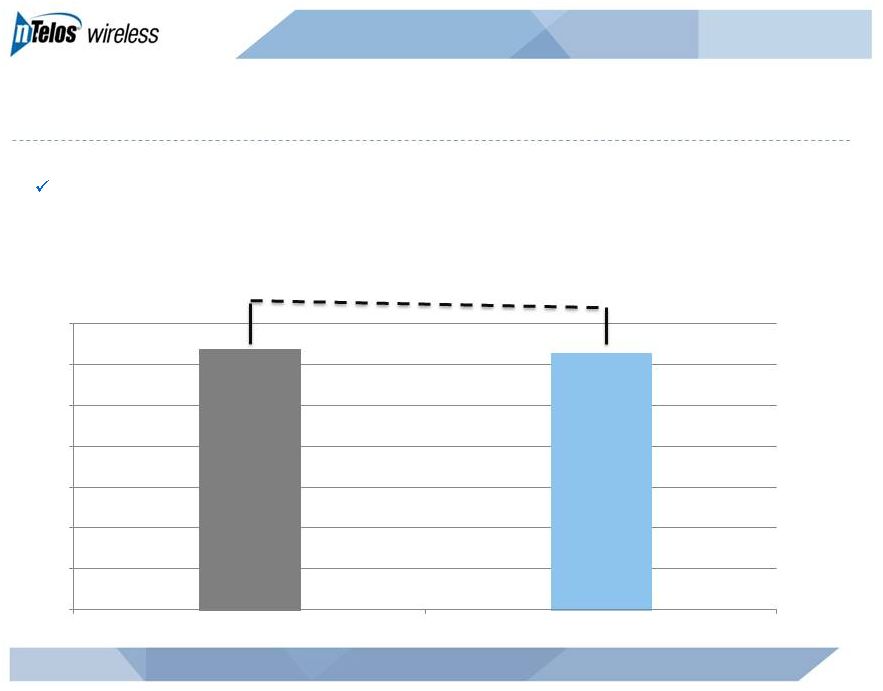 Wholesale/Other Revenue Remains Strong
6
NASDAQ: NTLS
millions
-1%
2Q13 wholesale/other revenue decreased 1% from 2Q12 to $41.4 million
$10.0
$15.0
$20.0
$25.0
$30.0
$35.0
$40.0
$45.0
2Q 2012
2Q 2013 |
 Sprint Disputes Update
7
NASDAQ: NTLS
Data rate reset dispute
Still outstanding
Ranges updated to:
Sprint’s favor: $12.0 million
nTelos’s favor: $19.0 million
$4.2 million unrelated dispute raised during 3Q 2012, isolated to historical
billing issues $18.3 million accrual recorded for the disputes, included in
current liabilities |
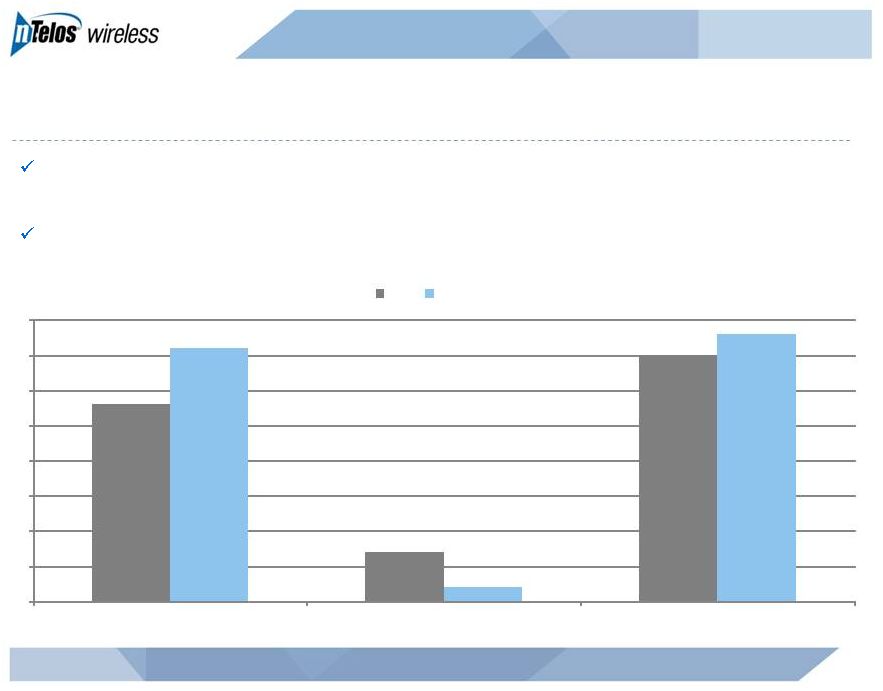
 Subscribers –
Net Additions Trend
8
NASDAQ: NTLS
Subscribers up 7% year-over year to approximately 454,800
As of June 30, 2013, postpaid made up 66% of subscriber base
+7%
0
50,000
100,000
150,000
200,000
250,000
300,000
350,000
400,000
450,000
2Q 2012
2Q 2013
Prepaid Subscribers
Postpaid Subscribers |
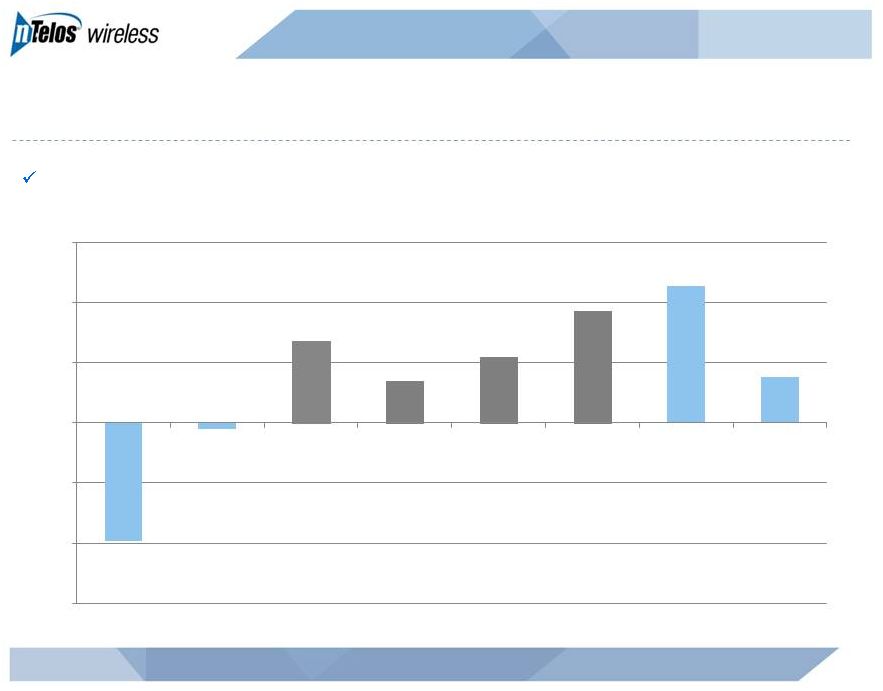 Subscribers –
Net Additions Trend (Continued)
9
NASDAQ: NTLS
Sixth consecutive quarter of positive net adds
(9,800)
(500)
6,800
3,500
5,500
9,300
11,400
3,800
(15,000)
(10,000)
(5,000)
0
5,000
10,000
15,000
3Q 2011
4Q 2011
1Q 2012
2Q 2012
3Q 2012
4Q 2012
1Q 2013
2Q 2013 |
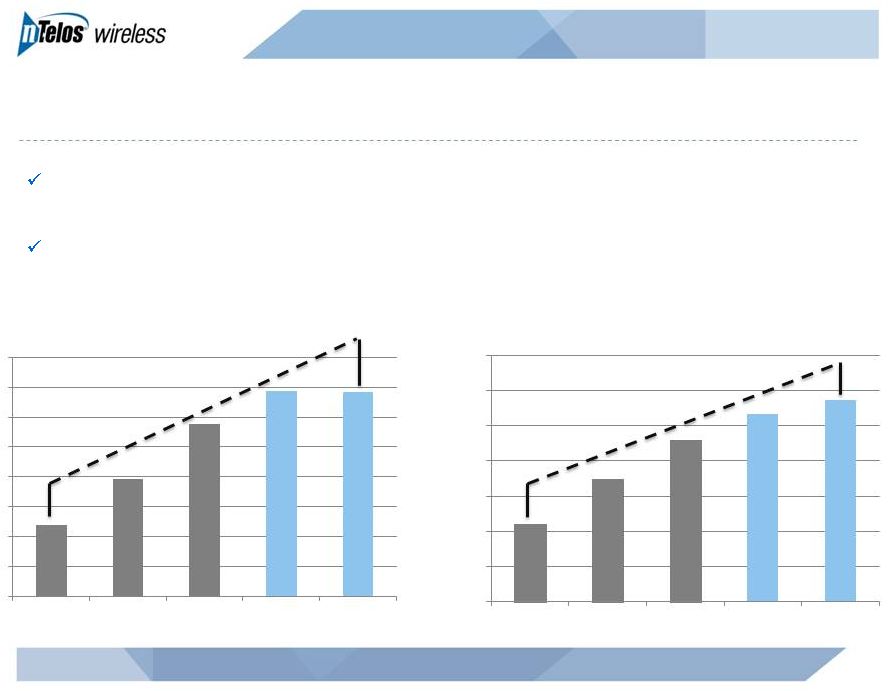 Average Revenue Per User (ARPU)
10
NASDAQ: NTLS
2Q13 Blended ARPU up 9% year-over-year to $53.82
2Q13 Postpaid ARPU up 13% year-over-year to $63.48
+9%
+13%
$47.00
$48.00
$49.00
$50.00
$51.00
$52.00
$53.00
$54.00
$55.00
2Q 2012
3Q 2012
4Q 2012
1Q 2013
2Q 2013
Blended ARPU
$52.00
$54.00
$56.00
$58.00
$60.00
$62.00
$64.00
$66.00
2Q 2012
3Q 2012
4Q 2012
1Q 2013
2Q 2013
Postpaid ARPU |
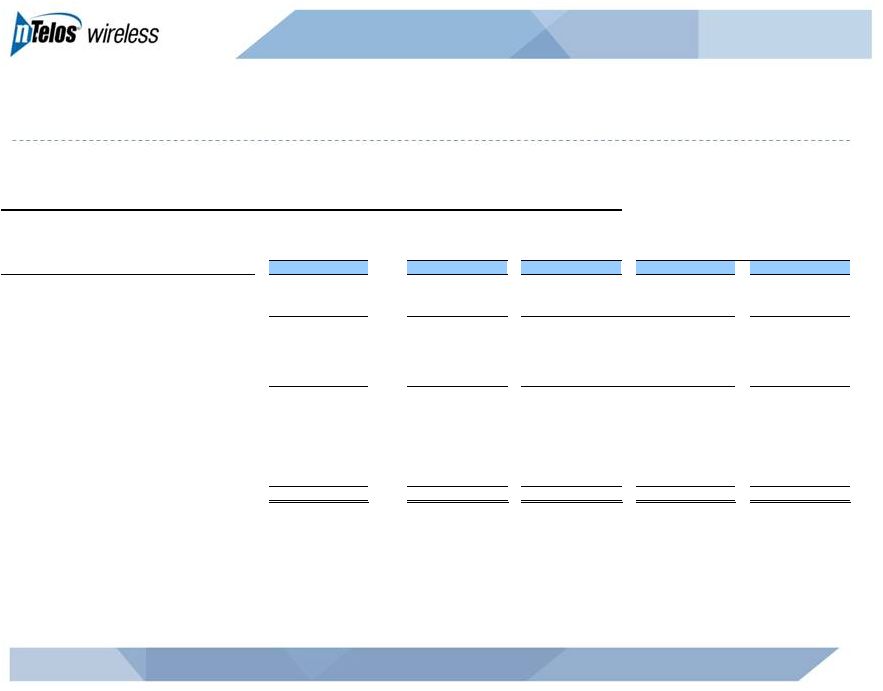
 Operational Expenses
NASDAQ: NTLS
11
($ in millions)
2Q13
2Q12
Cost of sales and services
$42.6
$41.8
Customer operations
$30.0
$29.8
Corporate operations
$7.7
$8.3
Depreciation & Amortization
$20.4
$15.1
Gain on sale of intangible assets
($4.4)
-
$96.3
$95.0
Increase of 1% primarily driven by:
Increased depreciation tied to replacement of legacy network equipment
Increased expenses related to network access and cell sites
Offset by gain on sale of intangible assets |
 Adjusted EBITDA
12
NASDAQ: NTLS
millions
Continued investments in the business resulted in higher Adjusted EBITDA
$34
$32
$33
$37
$41
$0
$5
$10
$15
$20
$25
$30
$35
$40
$45
2Q 2012
3Q 2012
4Q 2012
1Q 2013
2Q 2013 |
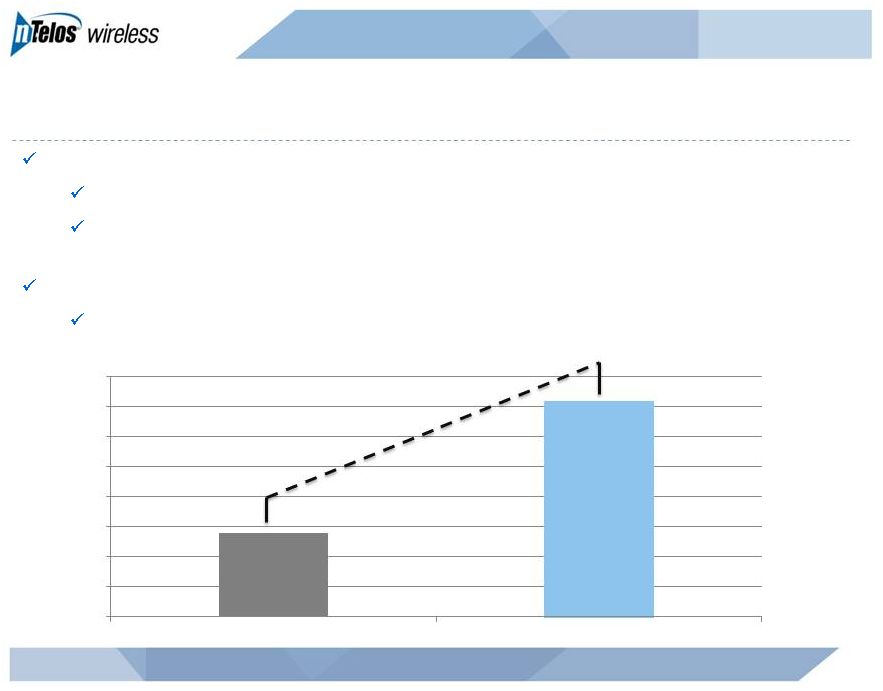
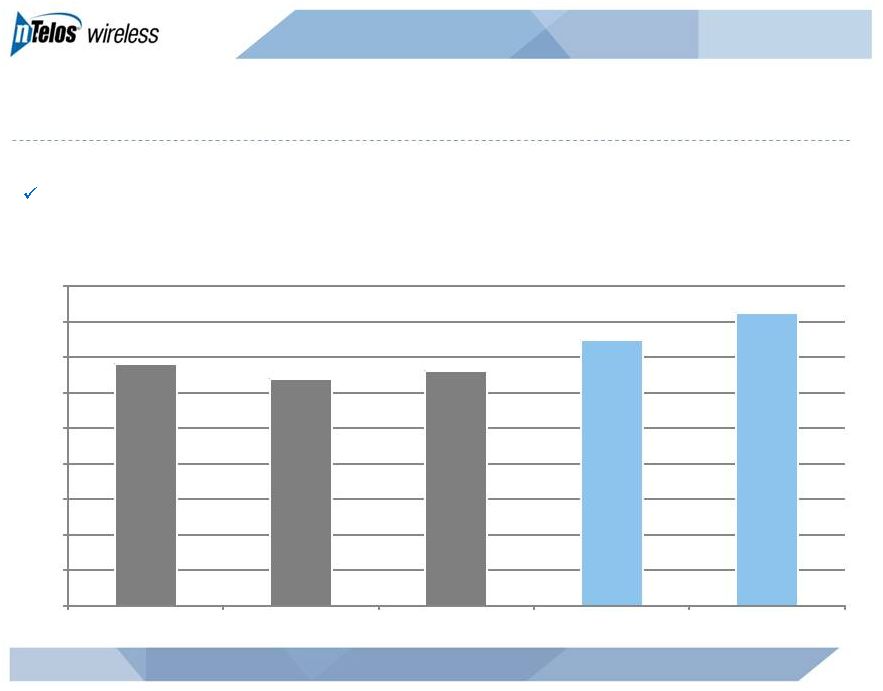
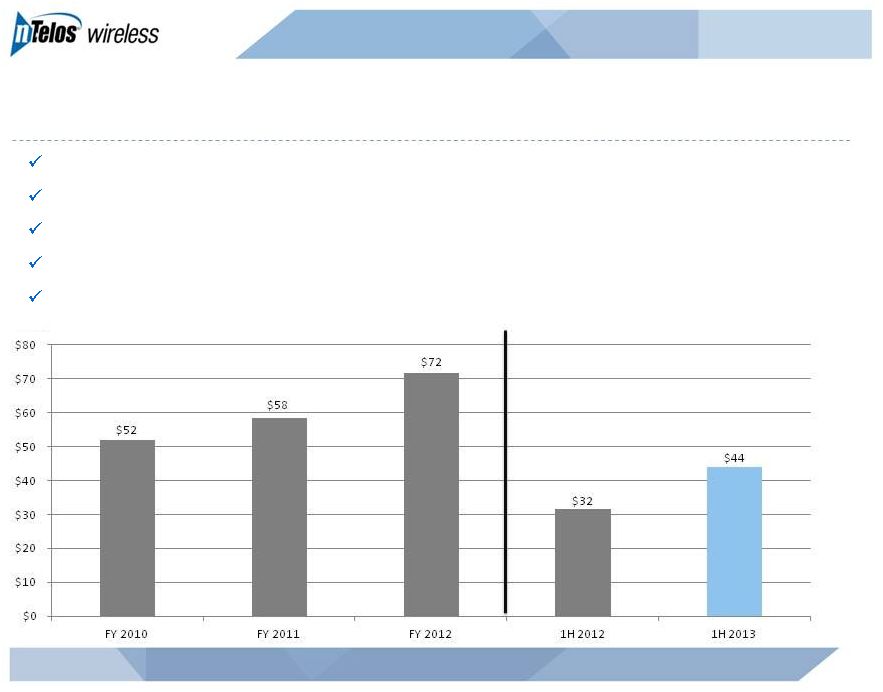 Capital Investment
13
NASDAQ: NTLS
Expands wholesale coverage
Controls roaming costs
Mitigates churn risk
As of June 30, 2013, 100% of cell sites support 3G EV-DO
1,432 cell sites as of June 30, 2013
millions |
  Capitalization Overview
($ in millions)
June 30, 2013
Cash
$98.2
Total Debt
$492.5
Net Debt
$394.3
LTM Adjusted EBITDA
$143.5
Secured Term Loan
$491.5
Net Debt Leverage
2.7x
NASDAQ: NTLS
14 |
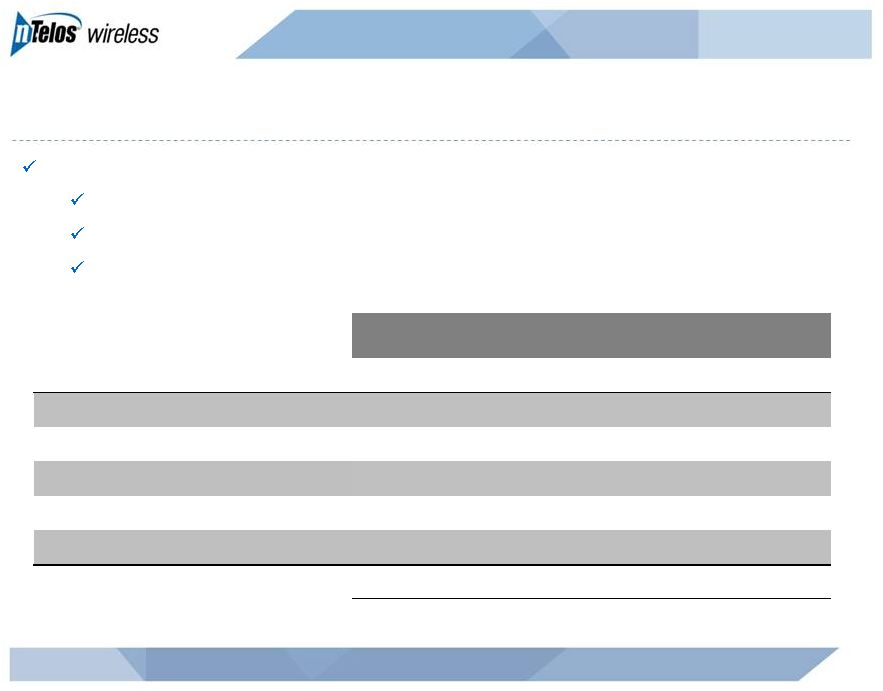
 Competitively Differentiated Retail Model
SAVINGS
SIMPLICITY
SERVICE
Driving consideration for
“the best value in
wireless”
proposition
Making it “easy”
to switch
Creating “raving fans”
through superior
customer service
15
NASDAQ: NTLS |
 2Q
2013 Net Adds 16
NASDAQ: NTLS
2Q13 prepaid net adds increased 800 year-over-year
2Q13 postpaid net adds decreased 500 year-over-year
2,800
700
3,500
3,600
200
3,800
0
500
1,000
1,500
2,000
2,500
3,000
3,500
4,000
Prepaid Net Adds
Postpaid Net Adds
Total Net Adds
2Q12
2Q13 |
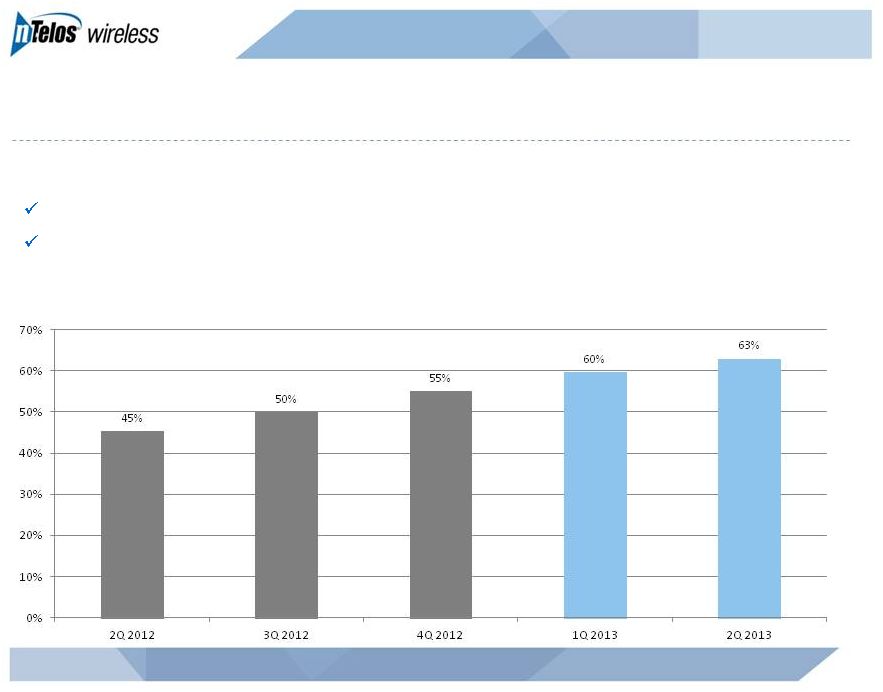 Smartphone Penetration
17
NASDAQ: NTLS
As of June 30, 2013:
66% of postpaid subscribers have a smartphone
56% of prepaid subscribers have a smartphone |
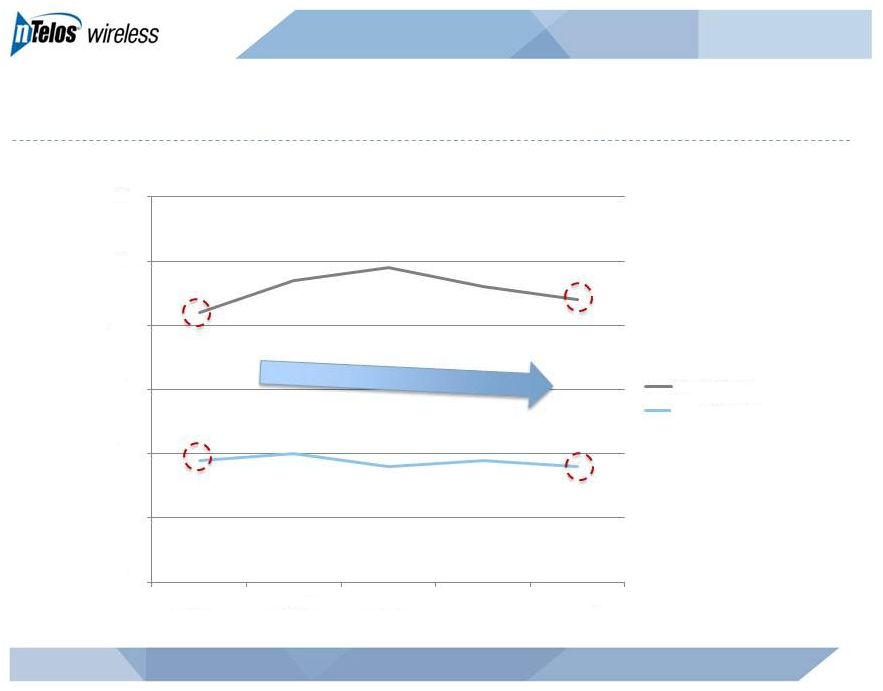 Churn Remains Stable
18
NASDAQ: NTLS
0.0%
1.0%
2.0%
3.0%
4.0%
5.0%
6.0%
2Q 2012
3Q 2012
4Q 2012
1Q 2013
2Q 2013
Prepaid Churn
Postpaid Churn |
 Guidance (as of July 30, 2013)
NASDAQ: NTLS
19
For the year ended December 31, 2013
Adjusted
EBITDA
of
$140
million
-
$145
million
Previously $135 million -
$145 million
CapEx of $75 million -
$85 million
2013 net adds expected to be at or about 2012 net adds
|
 Appendix |
 21
NASDAQ: NTLS
NTELOS Holdings Corp.
Reconciliation of Net Income Attributable to NTELOS Holdings Corp. to Adjusted EBITDA
(In thousands)
2Q13
1Q13
4Q12
3Q12
2Q12
9,386
$
5,493
$
321
$
4,608
$
5,606
$
Net income attributable to noncontrolling interests
541
529
443
488
881
Net Income
9,927
6,022
764
5,096
6,487
Interest expense
7,398
7,361
6,651
5,432
5,433
Income taxes
6,380
3,744
(454)
3,141
4,609
Other expense (income), net
(151)
369
7,038
50
44
Operating income
23,554
17,496
13,999
13,719
16,573
Depreciation and amortization
20,443
18,456
17,440
15,810
15,101
Gain on sale of intangible assets
(4,442)
-
-
-
-
Accretion of asset retirement obligations
173
143
174
163
151
Equity-based compensation
1,460
1,321
1,346
1,478
1,536
Business separation charges¹
-
-
56
684
635
Adjusted EBITDA
41,188
$
37,416
$
33,015
$
31,854
$
33,996
$
1
Charges for legal and consulting services costs in connection with the separation
of the wireless and wireline operations. Net Income Attributable to NTELOS
Holdings Corp. |
 22
NASDAQ: NTLS
NTELOS Holdings Corp.
ARPU Reconciliation
Average Monthly Revenue per User (ARPU) ¹
2Q13
1Q13
4Q12
3Q12
2Q12
FY 2012
FY 2011
(In thousands, except for subscribers and ARPU)
Operating Revenues
119,859
$
119,345
$
117,398
$
114,466
$
111,585
$
453,989
$
422,629
$
Less: Equipment revenue from sales to new customers
(3,104)
(3,521)
(3,808)
(3,333)
(4,026)
(15,041)
(9,091)
Less: Equipment revenue from sales to existing customers
(2,395)
(3,117)
(3,315)
(3,416)
(3,903)
(15,037)
(17,793)
Less: Wholesale, other and adjustments
(41,179)
(40,918)
(41,488)
(42,380)
(41,061)
(165,765)
(143,477)
Gross subscriber revenue
73,181
71,789
68,787
65,337
62,595
258,146
252,268
Less: prepay subscriber revenue
(15,879)
(15,205)
(14,823)
(14,103)
(14,001)
(56,330)
(48,758)
Less: adjustments to prepay subscriber revenue
(303)
(479)
(237)
(434)
(382)
(1,706)
(1,175)
Gross postpay subscriber revenue
56,999
$
56,105
$
53,727
$
50,800
$
48,212
$
200,110
$
202,335
$
Prepay subscriber revenue
15,879
15,205
14,823
14,103
14,001
56,330
48,758
Plus: adjustments to prepay subscriber revenue
303
479
237
434
382
1,706
1,175
Gross prepay subscriber revenue
16,182
$
15,684
$
15,060
$
14,537
$
14,383
$
58,036
$
49,933
$
Average number of subscribers
453,262
444,244
434,457
427,610
422,247
425,377
422,256
Total ARPU
53.82
$
53.87
$
52.78
$
50.93
$
49.41
$
50.57
$
49.79
$
Average number of postpay subscribers
299,304
298,414
292,668
287,165
284,834
288,428
298,992
Postpay ARPU
63.48
$
62.67
$
61.19
$
58.97
$
56.42
$
57.82
$
56.39
$
Average number of prepay subscribers
153,958
145,831
141,789
140,446
137,413
136,949
123,264
Prepay ARPU
35.04
$
35.85
$
35.41
$
34.50
$
34.89
$
35.31
$
33.76
$
Gross subscriber revenue
73,181
71,789
68,787
65,337
62,595
258,146
252,268
Less: voice and other feature revenue
(43,078)
(42,658)
(41,379)
(39,366)
(37,708)
(156,032)
(171,882)
Data revenue
30,103
$
29,131
$
27,408
$
25,971
$
24,887
$
102,114
$
80,386
$
Average number of subscribers
453,262
444,244
434,457
427,610
422,247
425,377
422,256
Total Data ARPU
22.14
$
21.86
$
21.03
$
20.25
$
19.65
$
20.00
$
15.86
$
Gross postpay subscriber revenue
56,999
56,105
53,727
50,800
48,212
200,110
202,335
Less: postpay voice and other feature revenue
(36,170)
(35,952)
(34,651)
(33,028)
(31,490)
(130,601)
(144,114)
Postpay data revenue
20,829
$
20,153
$
19,076
$
17,772
$
16,722
$
69,509
$
58,221
$
Gross prepay subscriber revenue
16,182
15,684
15,060
14,537
14,383
58,036
49,933
Less: prepay voice and other feature revenue
(6,908)
(6,706)
(6,728)
(6,338)
(6,218)
(25,431)
(27,768)
Prepay data revenue
9,274
$
8,978
$
8,332
$
8,199
$
8,165
$
32,605
$
22,165
$
Average number of postpay subscribers
299,304
298,414
292,668
287,165
284,834
288,428
298,992
Postpay data ARPU
23.20
$
22.51
$
21.73
$
20.63
$
19.57
$
20.08
$
16.23
$
Average number of prepay subscribers
153,958
145,831
141,789
140,445
137,413
136,949
123,264
Prepay data ARPU
20.08
$
20.52
$
19.59
$
19.46
$
19.81
$
19.84
$
14.99
$
Average monthly revenue per user is(ARPU) computed by dividing service revenues per period by
the average number of subscribers during that period. ARPU as defined may not be similar to ARPU measures of other companies, is
not a measurement under GAAP and should be considered in addition to, but not as a substitute
for, the information contained in the Company’s consolidated statements of operations. The Company closely monitors the effects of new
rate plans and service offerings on ARPU in order to determine their effectiveness. ARPU
provides management useful information concerning the appeal of NTELOS rate plans and service offerings and the Company’s performance in
attracting and retaining high-value customers.
1 |
 NASDAQ: NTLS
July 30, 2013
2Q 2013 Earnings Presentation |