Attached files
| file | filename |
|---|---|
| 8-K - FORM 8-K - COMMUNITY HEALTH SYSTEMS INC | d575538d8k.htm |
| EX-2.1 - EX-2.1 - COMMUNITY HEALTH SYSTEMS INC | d575538dex21.htm |
| EX-99.1 - EX-99.1 - COMMUNITY HEALTH SYSTEMS INC | d575538dex991.htm |
| EX-10.1 - EX-10.1 - COMMUNITY HEALTH SYSTEMS INC | d575538dex101.htm |
 Acquisition of
Health Management Associates: Acquisition of Health Management Associates:
A Compelling Opportunity for Value Creation
A Compelling Opportunity for Value Creation
July 30, 2013
July 30, 2013
Exhibit 99.2 |
 1
1
1
Forward-Looking Statements
Forward-Looking Statements
Certain statements contained in this communication may constitute “forward-looking
statements” within the meaning of the Private Securities Litigation Reform Act of
1995. These statements include, but are not limited to, statements regarding the
expected timing of the completion of the merger, the benefits of the merger, including future financial and
operating results, the combined company’s plans, objectives, expectations and other
statements that are not historical facts. Such statements are based on the views
and assumptions of the management of CHS and HMA and are subject to significant risks and
uncertainties. Actual future events or results may differ materially from these statements. Such
differences may result from the following factors: the ability to close the transaction on the
proposed terms and within the anticipated time period, or at all, which is dependent on
the parties’ ability to satisfy certain closing conditions, including the receipt of
governmental approvals; the risk that the benefits of the transaction, including cost savings and
other synergies may not be fully realized or may take longer to realize than expected; the
impact of the transaction on third-party relationships; actions taken by either of
the companies; changes in regulatory, social and political conditions, as well as general
economic conditions. Additional risks and factors that may affect results are set forth in HMA’s and
CHS’s filings with the Securities and Exchange Commission, including each company’s
Annual Report on Form 10-K for the fiscal year ending December 31, 2012. The
forward-looking statements speak only as of the date of this communication. Neither CHS nor HMA undertakes any
obligation to update these statements. The
presentation also contains certain non-GAAP financial measures. This presentation and the Company’s earning
releases for the quarter and year ended December 31, 2012, and the quarter and six months ended
June 30, 2013, located on the company’s investor relations page at www.chs.net,
include a reconciliation of the difference between certain non-GAAP financial
measures with the most directly comparable financial measure calculated in accordance with
GAAP. These non-GAAP financial measures should not be considered an alternative to the GAAP
financial measures. References to “Company” or “CHS” used herein refer to Community Health
Systems, Inc. and its affiliates, unless otherwise stated or indicated by context.
References to “HMA” used herein refer to Health Management Associates, Inc. and
its affiliates, unless otherwise stated or indicated by context. |
 2
2
2
Important Information and Where to Find It
Important Information and Where to Find It
Community Health Systems, Inc. (“CHS”) intends to file with the Securities and
Exchange Commission (the “SEC”) a registration statement on Form S-4 that
will include a proxy statement of Health Management Associates, Inc. (“HMA”)
and a prospectus of CHS relating to the merger. INVESTORS AND SECURITY HOLDERS ARE URGED TO READ
THE REGISTRATION STATEMENT AND PROXY STATEMENT/PROSPECTUS AND ANY OTHER RELEVANT
DOCUMENTS WHEN THEY BECOME AVAILABLE, BECAUSE THEY WILL CONTAIN IMPORTANT INFORMATION
ABOUT CHS, HMA AND THE MERGER. Investors and security holders will be able to obtain
these materials (when they are available) and other documents filed with the SEC free of
charge at the SEC’s website, www.sec.gov. In addition, stockholders will be able to
obtain copies of the registration statement and proxy statement/prospectus (when they become
available) and other documents filed with the SEC from CHS’s website at www.chs.net
or and HMA’s website at www.hma.com or by directing such request to CHS at 4000
Meridian Boulevard, Franklin, Tennessee 37067, Attention: Investor Relations, or to HMA
at 5811 Pelican Bay Boulevard, Naples, Florida 34108, Attention: Investor Relations.
CHS, HMA and certain of their respective directors, executive officers and other persons may be
deemed to be participants in the solicitation of proxies in respect of the merger.
Information regarding CHS’s directors and executive officers is available in
CHS’s proxy statement filed with the SEC on April 5, 2013 in connection with its 2013 annual
meeting of stockholders, and information regarding HMA’s directors and executive officers
is available in (i) HMA’s proxy statement filed with the SEC on April 8, 2013 in
connection with its 2013 annual meeting of stockholders and (ii) HMA’s consent
revocation statement filed with the SEC on July 19, 2013 in response to the consent solicitation conducted by
Glenview Capital Partners, L.P. and certain of its affiliates. Other information regarding
persons who may be deemed participants in the proxy solicitation and a description of
their direct and indirect interests, by security holdings or otherwise, will be contained
in the registration statement and proxy statement/prospectus and other relevant materials
to be filed with the SEC when they become available.
This communication shall not constitute an offer to sell or the solicitation of an offer to sell
or the solicitation of an offer to buy any securities, nor shall there be any sale of
securities in any jurisdiction in which such offer, solicitation or sale would be
unlawful prior to registration or qualification under the securities laws of any such jurisdiction. No offer of
securities shall be made except by means of a prospectus meeting the requirements of Section 10
of the Securities Act of 1933, as amended.
|
 3
3
3
3
Transaction Summary
Transaction Summary
CHS is acquiring HMA for an aggregate purchase price of $7.6bn plus a contingent value right
(“CVR”) of up to ~$270mm
Total consideration:
$13.78 per share before CVR
Consideration mix:
Cash:
$10.50 per share
Stock:
0.06942 shares of CHS stock per HMA share,
or $3.28 based on CHS’ stock price of $47.23
as of 7/29/13
CVR:
Up to $1.00 per share
Pro forma ownership:
CHS:
84%
HMA:
16%
$150mm – $180mm of annual synergies expected within 2.5 years Committed financing by Bank of America Merrill Lynch
and Credit Suisse
Leverage ratio post-closing projected to return to current levels within 12 – 18
months
Transaction unanimously approved by both Boards of Directors Expected to close by end of Q1 2014 |
   4
4
4
4
Compelling Strategic Rationale
Compelling Strategic Rationale
Unique opportunity
to acquire well
developed hospital
system
•
71 facilities spread across attractive non-urban and suburban markets
•
Complementary geographic fit
Establishes largest
hospital footprint
Creates platform
well positioned for
Health Care Reform
•
206 facilities across 29 states
•
Enhances economies of scale and operating efficiencies
•
Strengthens hospital and physician networks
•
Adds highly accredited hospitals to existing portfolio
69 Joint Commission accredited with Gold Seal of Approval
18 received chest pain center accreditation by Society of Cardiovascular
Patient Care
•
Pro forma, 91 hospitals (~45%) named Top Performers on Key Quality Measures by
The Joint Commission
•
Supported by CHS’
successful track record of acquiring and integrating
hospitals/systems
•
Successfully
integrated
Triad
–
$5bn
revenue
company
•
Expect breakeven EPS year 1; meaningfully accretive thereafter
Excluding amortization of asset write-up (cash EPS), single-digit accretion in year
1 •
Modest increase in leverage post-closing; de-levers meaningfully within 12–18
months Apply best practices
to maximize synergy
potential
Financially attractive
transaction |
 5
5
5
($MM)
Revenues
EBITDA
($MM)
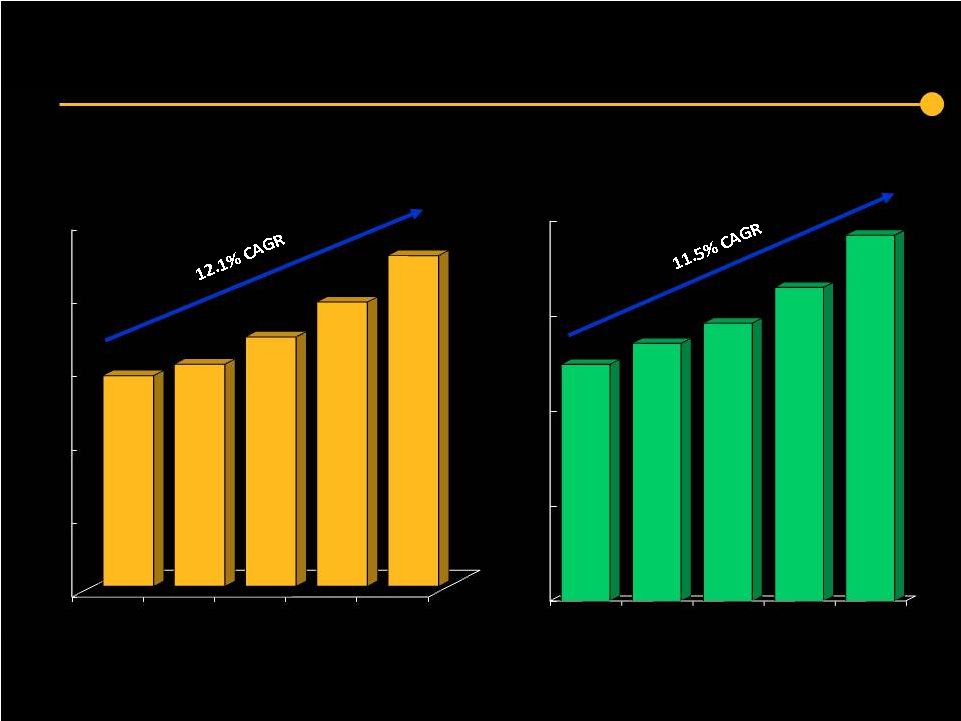
HMA Revenue and EBITDA Performance
Note: Revenues before adjustments for bad debt and do not reflect the accounting
change. 0
1,500
3,000
4,500
6,000
7,500
2008
2009
2010
2011
2012
$4,302
$4,536
$5,092
$5,804
$6,753
0
250
500
750
1,000
2008
2009
2010
2011
2012
$623
$678
$732
$826
$963 |
 6
6
6
Revenues
EBITDA **
($MM)
CHS Has Successfully Grown the Company
** See the Unaudited Supplemental Information contained in this presentation for a definition of
EBITDA and a reconciliation of Adjusted EBITDA, as defined, to our net cash provided by operating
activities as derived directly from our consolidated financial statements for the six months
ended June 30, 2013 and 2012. For purposes of this presentation, EBITDA means Adjusted EBITDA.
Note: Revenues before adjustments for bad debt and do not reflect the accounting
change. 2010, 2011, and 2012 net operating revenues after bad debt was $11,092,
$11,906, and $13,029, respectively. Revenue and EBITDA for 2009 and prior years
have not been adjusted for discontinued operations. 2007 amounts include
adjustments for change in estimate taken inQ407. 2006 EBITDA excludes increase in
allowance for doubtful accounts of $65 million taken in Q306.
|
 7
7
7
7
Combined Company
Combined Company
Note:
Revenues based on twelve months ended 6/30/13.
($ in millions)
CHS
Pro Forma
HMA
Revenues
$13,037
$18,905
Hospitals
135
206
States
29
29
Licensed Beds
20,176
31,241
11,065
71
15
$5,868 |
 8
8
8
8
HMA has an Attractive Portfolio of Hospitals
HMA has an Attractive Portfolio of Hospitals
Cardiology / Respiratory
General Practices
Oncology
Orthopedic
Renal
Surgery
Women's Health
Hospitals = 71
Clinics = 472
Behavioral Health
Neurology
Neurosurgery
Others
Pediatrics
Urgent Care
•
71 facilities with over 11,000 beds in 15 states
•
Non-urban focus primarily in southeastern US
•
Establishing broad delivery models in several key markets
Source: HMA website.
Note:
Pro forma for recent acquisition of Bayfront. |
 9
9
9
9
Complementary Geographic Fit
Complementary Geographic Fit
CHS
HMA
Overlapping States
23
2
2
8
2
9
3
2
1
3
2
2
10
2
3
1
7
3
2
6
9
11
1
17
2
2
1
3
1
3
1
1
1
4
6
3
9
9
1
3
1
3
17
4
IN
206 hospitals with over 31,000 beds across 29 states
Note:
Pro forma for recent HMA acquisition of Bayfront.
Top 5 states
Pro forma 2012 revenue
Florida
12%
Pennsylvania
11%
Texas
9%
Tennessee
8%
Indiana
8%
Total
48%
FL
PA
TX
TN |
 10
10
10
Strong Market Presence and Diversification
Strong Market Presence and Diversification
•
13 states with revenue greater than $500 million
—
Over 75% of CHS’
and 85% of HMA’s hospital revenues from these markets
PF 2012 Combined
($ in millions)
CHS
HMA
Combined
Revenue
%
Florida
2
23
25
$2,320
12%
Pennsylvania
17
3
20
2,095
11%
Texas
17
1
18
1,780
9%
Tennessee
11
9
20
1,475
8%
Indiana
9
–
9
1,460
8%
Alabama
9
2
11
1,115
6%
Mississippi
2
10
12
1,070
6%
Arkansas
8
2
10
775
4%
South Carolina
6
2
8
690
4%
Illinois
9
–
9
685
4%
Washington
2
2
4
670
4%
Oklahoma
3
7
10
600
3%
Arizona
4
–
4
545
3%
Total
99
61
160
$15,275
80%
Hospitals |
 11
11
11
CHS Commitment to Quality
CHS Commitment to Quality
Consistent improvement in inpatient core measures
Significant reductions in readmissions and hospital acquired conditions
4Q 2008
4Q 2009
4Q 2010
4Q 2011
4Q 2012
Readmission Rates
AMI down 23.0%
HF down 20.1%
Pneumonia down 17.8%
19.8%
Combined
Decrease
Hospital Acquired Conditions
Selected Measures:
11.7% reduction in pressure ulcers
27.5% reduction in central line associated infections
18.1% Reduction in catheter associated UTIs
16.3%
Combined
Decrease
in all
HACs
2011-2012
2011-2012
* For consistency, new Core Measures mandated as of 2012 not represented.
91.9%
95.4%
96.6%
97.6%
98.9% |
 12
12
12
CHS Physicians –
CHS Physicians –
Trusted Partners in Care
Trusted Partners in Care
employed physicians
physician satisfaction rate
employed physician practice locations
Physician
Leadership
•
Physician Leadership Groups in affiliated hospitals
•
Annual Chiefs of Staff Meeting
•
Physician Advisory Boards in Selected Specialties
physicians serving on affiliated medical staffs
17,000
2,500
89%
650 |
 13
13
13
Cleveland Clinic National Strategic Alliance
Cleveland Clinic National Strategic Alliance
•
Vast National
Hospital Network
•
Growing Physician
Base
•
Recognized for
Operational
Excellence
•
Financial Strength
and Success
•
Nationally Acclaimed
Academic Medical
Center
•
Aligned Physician
Strategy
•
Sophisticated
Clinical Expertise
•
Innovative Approaches
to Patient Care
CHS
Collaboration
to identify
synergies and
develop
solutions for
the changing
health care
landscape |
 14
14
14
HMA Regional Clinical Affiliations and Strategic Partners
HMA Regional Clinical Affiliations and Strategic Partners
Hospital Clinical
Affiliations
Selected Strategic
Partners
(Oklahoma) |
 15
15
15
CHS Growth Through Acquisitions
CHS Growth Through Acquisitions
* Excludes a small number of divestures.
Focused on
State Network
Development,
Clinical
Excellence
and Value
in Order to
Succeed in
the Era of
Health Care
Reform
2013-Future
Select
Divestitures
Strategic
Acquisitions
Development
of Integrated
Networks
2008-2012
50+
Hospitals
Added in
Triad
Hospitals
Acquisition
Larger, More
Competitive
Markets
2007
Significant
Growth
through
Acquisitions
IPO on the
NYSE in
2000
1997-2006
Collection
of Small
Rural
Hospitals
Sole
Community
Providers
1985-1996
1996 Number of
Hospitals:
36
2006 Number of
Hospitals:
77
Number of Hospitals
following Triad
Acquisition:
128
2012 Number
of Hospitals:
135 |
 16
16
16
16
CHS has a History of Successfully Integrating Acquisitions
CHS has a History of Successfully Integrating Acquisitions
** See the Unaudited Supplemental Information contained in this presentation for a definition
of EBITDA and a reconciliation of Adjusted EBITDA, as defined, to our net cash provided
by operating activities as derived directly from our consolidated financial statements. For purposes of this presentation, EBITDA means Adjusted EBITDA.
*
Revenues have not been restated to reflect the change in bad debt.
|
 17
17
17
Recent Acquisitions Provide Opportunity to Improve
Recent Acquisitions Provide Opportunity to Improve
Profitability and Drive Growth
Profitability and Drive Growth
CHS
HMA
Total
Number of hospitals acquired
4
5
9
8
5
1
19
4
12
4
9
–
1
12
31
~$1.4bn
~$1.3bn
~$2.7bn
2010
Revenue
acquired
since 2010
2011
2012
2013
Total |
 18
18
18
•
Acquisitions
•
Ancillary Services
—
Pharmacy
—
Laboratory
—
Surgery
—
Imaging
•
Billing and Collections
•
Compliance
•
Community Cares
•
Customer Service
•
ER Management
•
Executive Recruitment
•
Facilities Management
•
Financial Reporting and Control
•
Group Purchasing
•
Health Information Management
•
Home Health
•
Information Systems
•
Insurance Programs
•
Joint Commission
•
Legal Services
•
Managed Care
•
Marketing
•
Patient and Physician Satisfaction
•
Physician Advisory and Leadership
Board
•
Physician Recruiting and Support
•
Quality & Clinical Transformation
•
Revenue Strategies
•
Senior Circle
•
Specialty Services
Improve Hospital Operations
Improve Hospital Operations |
 19
19
19
Name
Title
Years of
Industry
Experience
Background
Wayne T. Smith
Chairman, President and CEO
30+
President and Chief Operating Officer at Humana
W. Larry Cash
Executive Vice President and CFO
30+
Vice President and Group CFO at HCA;
Senior Vice President of Finance & Operations at Humana
Rachel A. Seifert
Executive Vice President, Secretary
and General Counsel
20
William S. Hussey
President, Division IV
30+
David L. Miller
President, Division I
30+
Thomas D. Miller
President, Division V
20
Michael T. Portacci
President, Division II
25
Joined as Hospital CEO in 1987;
Became Group VP in 1991
Martin D. Smith
President, Division III
15
Joined as Hospital CEO in 1998 and became Division III VP
of Operations in 2005; Various positions with HMA
T. Mark Buford
Senior Vice President –
Internal Audit
25
Joined as Corporate Controller in 1986 and became Chief Accounting Officer in
1988 and Senior Vice President –
Internal Audit in 2012
Larry M. Carlton
Senior Vice President –
Revenue Management
30
Director of Health Financing with Humana, Galen and HCA
Kenneth D. Hawkins
and Development
20
Barbara Paul, MD
Senior Vice President &
Chief Medical Officer
20
Martin G. Schweinhart
25
CFO of Denver and Kentucky Divisional Markets;
Various positions with HCA and Humana
J. Gary Seay
Senior Vice President &
Chief Information Officer
25
Vice
President
–
Cigna;
Various positions with Humana
Lynn T. Simon, MD
Senior Vice President &
Chief Quality Officer
20
Senior Vice President & Chief Medical Officer –
Jewish Hospital & St. Mary’s HealthCare in Louisville, Kentucky
Kevin J. Hammons
Vice President &
Chief Accounting Officer
15
Various positions with Ernst & Young.; joined as Director of Financial
Reporting in 1997, became Vice President of Financial Reporting in 2005 and
Chief Accounting Officer in 2012
Deep and Experienced Management Team
Deep and Experienced Management Team
Senior Vice President – Acquisitions
Senior Vice President – Operations
Joined as AVP in 2001; Divisional President – Tampa Bay Division, HCA Divisional Vice President – HMA; Various
positions with Humana
President & CEO – Lutheran Health; CEO of Tri Cities Market in northeast
Tennessee CEO of Tri Cities Market in northeast Tennessee Vice
President of Development – Champion Healthcare
Director of Quality Measurement & Health Assessment Group – CMS
Department of HHS
Vice President – Legal Operations, HCA
|
 20
20
20
20
CHS Management Significantly Improved Triad’s
CHS Management Significantly Improved Triad’s
Operating Results
Operating Results
Substantial corporate cost savings and
purchasing synergies achieved
–
First Calendar Year: $145mm
–
Peak Synergies: Over $275mm
Recruited ~2,400 physicians to Triad
facilities since acquisition
Focused CapEx on high ROI projects
Delevered ~1.5x Debt/EBITDA within
2.5 years |
 21
21
21
21
Attractive Financial Profile
Attractive Financial Profile
•
Expect to realize $150mm –
$180mm of annual synergies within 2.5 years
Over 40% expected to be realized in year 1
•
Expect transaction to be break-even EPS in year 1; meaningfully accretive thereafter
Excluding amortization of asset write-up (cash EPS), single-digit accretion in year
1 •
Pro forma debt / EBITDA mid-5x and expected to return to current levels within
12–18 months post closing
•
Committed to deleveraging balance sheet
•
Overhead reduction
•
Supply management
•
Case management
•
Revenue cycle management
Run-rate Synergies
$150mm –
$180mm |
 22
22
22
22
Contingent Value Right (CVR)
Contingent Value Right (CVR)
•
HMA shareholders may receive up to $1.00 per share in cash less
90% of any Losses post CHS’
deductible of $18mm
–
Losses are defined as legal expenses, fees, fines and settlement
amounts relating to HMA’s Existing Litigation with DOJ, SEC and
related litigation and claims
•
First $18mm of costs related to Losses would not reduce the CVR
payment amount
•
After the first $18mm of Losses, the CVR payment amount would
be reduced by 90% of such Losses
•
Settled in cash after CVR Payment Date which is the final resolution
of all Existing Litigation |
 23
23
23
Imperatives of Health Care Reform
Imperatives of Health Care Reform
23
* Congressional Budget Office: July 2012
*
Commit to
Quality
Deliver Care
More
Efficiently
Build
Services and
Infrastructure
for Value-
Based Care
Clinical
Integration &
Collaboration
14 Million Newly Insured
Patients in 2014 |
 24
24
24
24
Next Steps
Next Steps
•
Regulatory approval process
–
Hart-Scott-Rodino
–
State and local approvals as required
•
HMA shareholder vote
–
70% vote required
–
HMA
shareholders
own
~60%
of
CHS’
stock
today
–
Break-up fees exist
•
Prior integration experience will be helpful
•
Closing expected by end of Q1 2014 |
 25
25
25
25
Transaction Enhances Shareholder Value
Transaction Enhances Shareholder Value
•
Increased scale
•
Complementary geographic fit
•
Strong market presence and diversification
•
Network opportunities
•
Synergies
•
Attractive financial profile
•
History of successfully integrating acquisitions |
 26
26
26
Unaudited Supplemental Information
Unaudited Supplemental Information
EBITDA consists of net income attributable to CHS before interest, income taxes, and
depreciation and amortization. Adjusted EBITDA is EBITDA adjusted to exclude
discontinued operations, gain/loss from early extinguishment of debt and net income
attributable to noncontrolling interests. The Company has from time to time sold
noncontrolling interests in certain of its subsidiaries or acquired subsidiaries with existing
noncontrolling interest ownership positions. The Company believes that it is useful to
present adjusted EBITDA because it excludes the portion of EBITDA attributable to these
third party interests and clarifies for investors the Company’s portion of EBITDA
generated by continuing operations. The Company uses adjusted EBITDA as a measure of
liquidity. The Company has included this measure because it believes it provides investors with
additional information about the Company’s ability to incur and service debt and make
capital expenditures. Adjusted EBITDA is the basis for a key component in the
determination of the Company’s compliance with some of the covenants under the
Company’s senior secured credit facility, as well as to determine the interest rate
and commitment fee payable under the senior secured credit facility.
Adjusted EBITDA is not a measurement of financial performance or liquidity under generally
accepted accounting principles. It should not be considered in isolation or as a
substitute for net income, operating income, cash flows from operating, investing or
financing activities, or any other measure calculated in accordance with generally
accepted accounting principles. The items excluded from adjusted EBITDA are
significant components in understanding and evaluating financial performance and
liquidity. This calculation of adjusted EBITDA may not be comparable to similarly
titled measures reported by other companies. |
 27
27
27
27
Unaudited Supplemental Information Continued
Unaudited Supplemental Information Continued
The following table reconciles ADJUSTED EBITDA, as defined, to net cash provided by operating
activities as derived directly from the condensed consolidated financial statements (in
thousands): 2012
2011
Adjusted EBITDA
1,977,715
$
1,836,650
$
Interest expense, net
(622,933)
(644,410)
Provision for income taxes
(157,502)
(137,653)
Loss from operations of entities sold, net of taxes
(466)
(7,769)
Other non-cash expenses, net
70,174
70,959
Net changes in operating assets and liabilities,
net of effects of acquisitions and divestitures
13,132
144,131
Net cash provided by operating activities
1,280,120
$
1,261,908
$
Year Ended
December 31, |