Attached files
| file | filename |
|---|---|
| 8-K - FORM 8-K - Bridge Capital Holdings | v351286_8-k.htm |
Daniel P. Myers President Chief Executive Officer Thomas A. Sa Executive Vice President Chief Financial Officer Chief Strategy Officer NASDAQ: BBNK www.bridgecapitalholdings.com Investor Update 2 nd Quarter 2013
Forward Looking Statements Certain matters discussed herein constitute forward - looking statements within the meaning of the Private Securities Litigation Reform Act of 1995, and are subject to the safe harbors created by that Act. Forward - looking statements describe future plans, strategies, and expectations, and are based on currently available information, expectations, assumptions, projections, and management's judgment about the Bank, the banking industry and general economic conditions. These forward looking statements are subject to certain risks and uncertainties that could cause the actual results, performance or achievements to differ materially from those expressed, suggested or implied by the forward looking statements. These risks and uncertainties include, but are not limited to: (1) competitive pressures in the banking industry; (2) changes in interest rate environment; (3) general economic conditions, nationally, regionally, and in operating markets; (4) changes in the regulatory environment; (5) changes in business conditions and inflation; (6) changes in securities markets; (7) future credit loss experience; (8) the ability to satisfy requirements related to the Sarbanes - Oxley Act and other regulation on internal control; (9) civil disturbances or terrorist threats or acts, or apprehension about the possible future occurrences of acts of this type; and (10) the involvement of the United States in war or other hostilities. The reader should refer to the more complete discussion of such risks in Bridge Capital Holdings reports on Forms 10 - K and 10 - Q on file with the SEC. 2
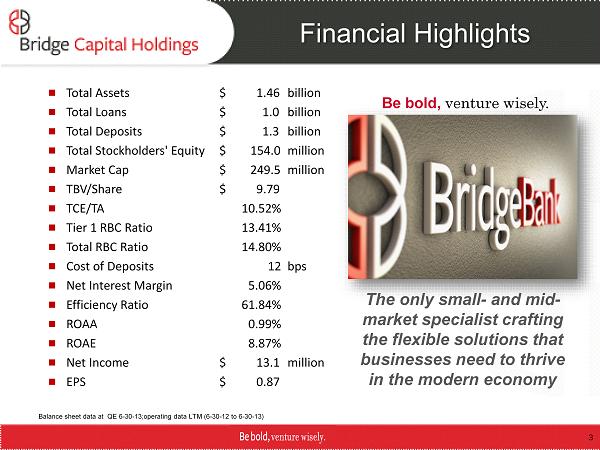
■ Total Assets $ 1.46 billion ■ Total Loans $ 1.0 b illion ■ Total Deposits $ 1.3 billion ■ Total Stockholders' Equity $ 154.0 million ■ Market Cap $ 249.5 million ■ TBV/Share $ 9.79 ■ TCE/TA 10.52% ■ Tier 1 RBC Ratio 13.41% ■ Total RBC Ratio 14.80% ■ Cost of Deposits 12 bps ■ Net Interest Margin 5.06% ■ Efficiency Ratio 61.84% ■ ROAA 0.99% ■ ROAE 8.87% ■ Net Income $ 13.1 million ■ EPS $ 0 .87 Financial Highlights Balance sheet data at QE 6 - 30 - 13;operating data LTM (6 - 30 - 12 to 6 - 30 - 13) The only small - and mid - market specialist crafting the flexible solutions that businesses need to thrive in the modern economy Be bold, venture wisely. 3
Bridge Bank Franchise ▪ Focus Business banking • 70% business C&I loan portfolio Silicon Valley geography and technology - centric regions ▪ Fundamental Value Drivers Relationship banking model Core deposit - centric model to fund the business • 96% core deposits • 62% DDA • 12 bps cost of deposits “Fit” among diversified revenue streams ▪ Execution Full range of corporate banking products delivered through experienced advisors 2 regional business centers + 5 business offices Effective use of banking technology 4
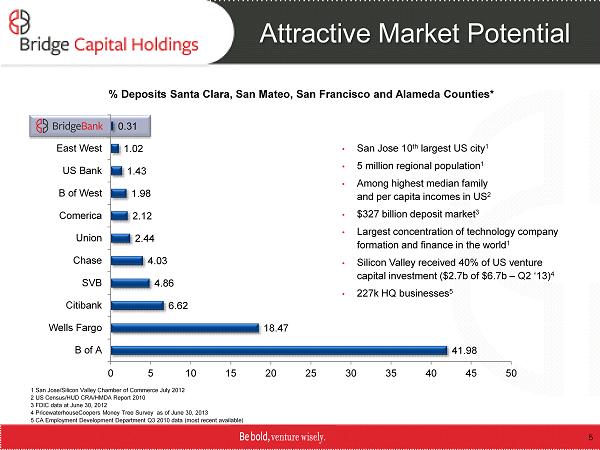
Attractive Market Potential 41.98 18.47 6.62 4.86 4.03 2.44 2.12 1.98 1.43 1.02 0.31 0 5 10 15 20 25 30 35 40 45 50 B of A Wells Fargo Citibank SVB Chase Union Comerica B of West US Bank East West • San Jose 10 th largest US city 1 • 5 million regional population 1 • Among highest median family and per capita incomes in US 2 • $327 billion deposit market 3 • Largest concentration of technology company formation and finance in the world 1 • Silicon Valley received 40% of US venture capital investment ($2.7b of $6.7b – Q2 ‘ 13) 4 • 227k HQ businesses 5 1 San Jose/Silicon Valley Chamber of Commerce July 2012 2 US Census/HUD CRA/HMDA Report 2010 3 FDIC data at June 30, 2012 4 PricewaterhouseCoopers Money Tree Survey as of June 30, 2013 5 CA Employment Development Department Q3 2010 data (most recent available) % Deposits Santa Clara, San Mateo, San Francisco and Alameda Counties* 5
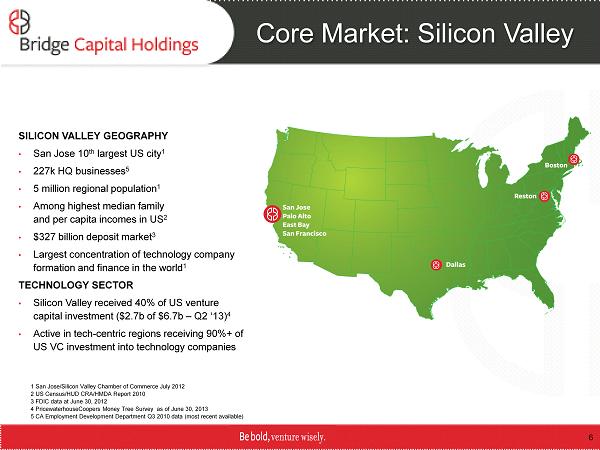
Core Market: Silicon Valley SILICON VALLEY GEOGRAPHY • San Jose 10 th largest US city 1 • 227k HQ businesses 5 • 5 million regional population 1 • Among highest median family and per capita incomes in US 2 • $327 billion deposit market 3 • Largest concentration of technology company formation and finance in the world 1 TECHNOLOGY SECTOR • Silicon Valley received 40% of US venture capital investment ($2.7b of $6.7b – Q2 ‘ 13) 4 • Active in tech - centric regions receiving 90%+ of US VC investment into technology companies 1 San Jose/Silicon Valley Chamber of Commerce July 2012 2 US Census/HUD CRA/HMDA Report 2010 3 FDIC data at June 30, 2012 4 PricewaterhouseCoopers Money Tree Survey as of June 30, 2013 5 CA Employment Development Department Q3 2010 data (most recent available) 6
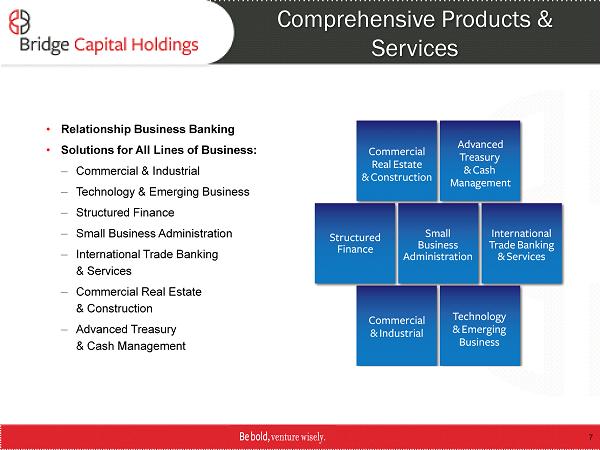
Comprehensive Products & Services • Relationship Business Banking • Solutions for All Lines of Business: – Commercial & Industrial – Technology & Emerging Business – Structured Finance – Small Business Administration – I nternational Trade Banking & Services – Commercial Real Estate & Construction – Advanced Treasury & Cash Management 7
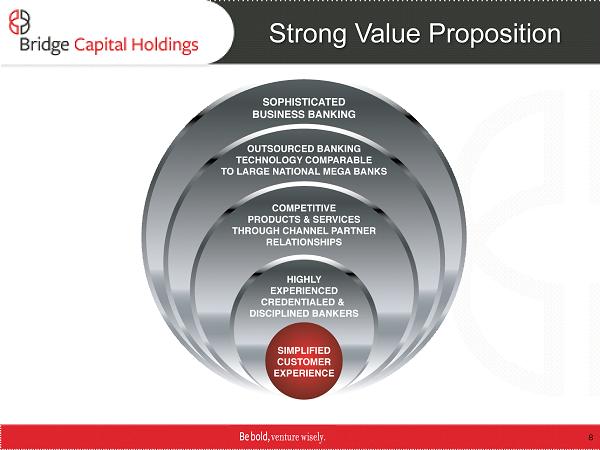
Strong Value Proposition 8
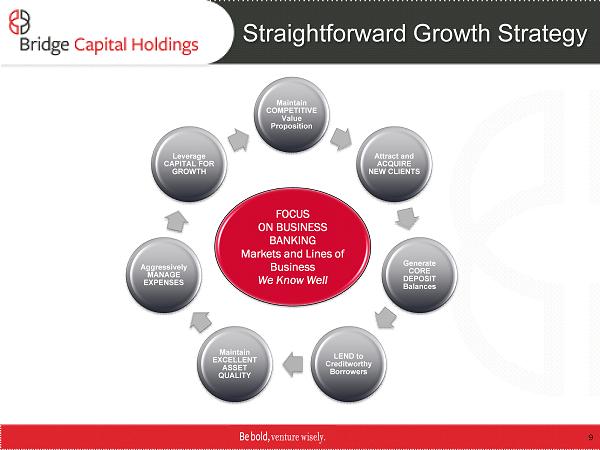
Maintain COMPETITIVE Value Proposition Attract and ACQUIRE NEW CLIENTS Generate CORE DEPOSIT Balances LEND to Creditworthy Borrowers Maintain EXCELLENT ASSET QUALITY Aggressively MANAGE EXPENSES Leverage CAPITAL FOR GROWTH FOCUS ON BU SINESS BANKING Markets and Lines of Business We Know Well Straightforward Growth Strategy 9
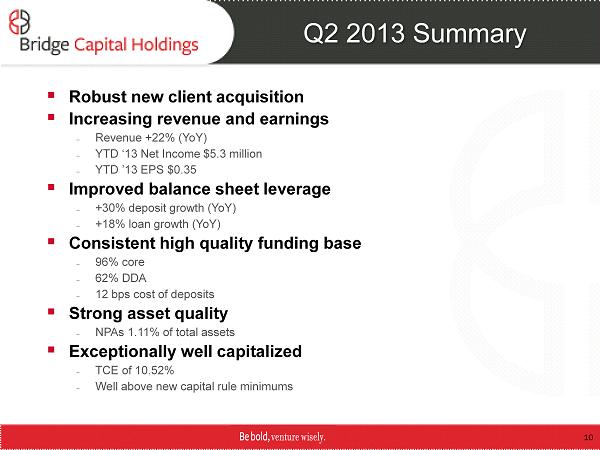
Q2 2013 Summary ▪ Robust new client acquisition ▪ Increasing revenue and earnings – Revenue +22% ( YoY ) – YTD ‘13 Net Income $5.3 million – YTD ’13 EPS $0.35 ▪ Improved balance sheet leverage – +30% deposit growth ( YoY ) – +18% loan growth ( YoY ) ▪ Consistent high quality funding base – 96% core – 62% DDA – 12 bps cost of deposits ▪ Strong asset quality – NPAs 1.11% of total assets ▪ Exceptionally well capitalized – TCE of 10.52% – Well above new capital rule minimums 10
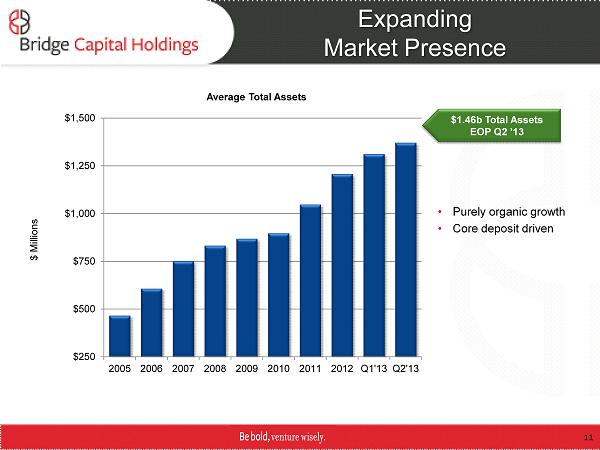
Expanding Market Presence $250 $500 $750 $1,000 $1,250 $1,500 2005 2006 2007 2008 2009 2010 2011 2012 Q1'13 Q2'13 $ Millions Average Total Assets • Purely organic growth • Core deposit driven $ 1.46b Total Assets EOP Q2 ’13 11
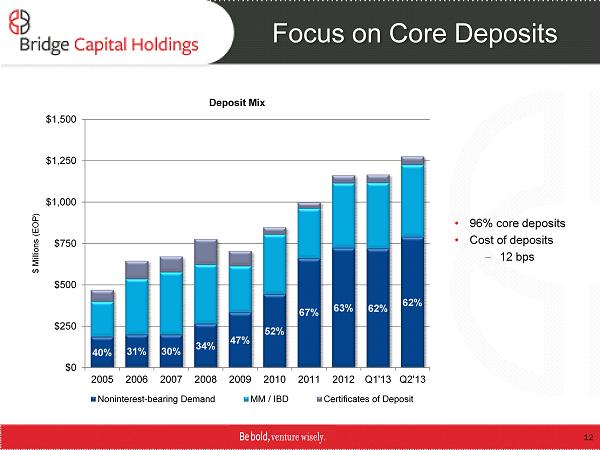
Focus on Core Deposits 40% 31% 30% 34% 47% 52% 67% 63% 62% 62% $0 $250 $500 $750 $1,000 $1,250 $1,500 2005 2006 2007 2008 2009 2010 2011 2012 Q1'13 Q2'13 $ Millions (EOP) Deposit Mix Noninterest-bearing Demand MM / IBD Certificates of Deposit • 96% core deposits • Cost of deposits – 12 bps 12
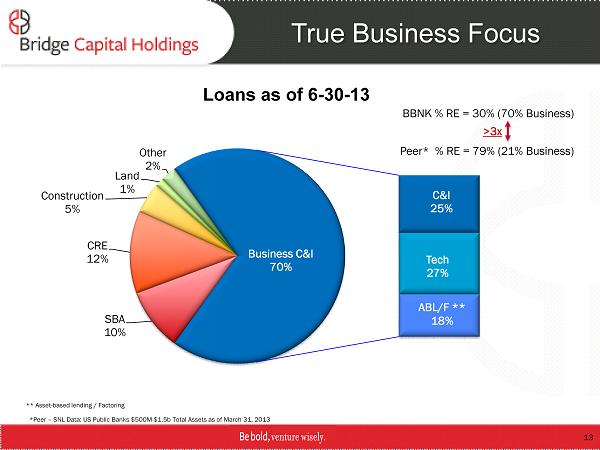
SBA 10% CRE 12% Construction 5% Land 1% Other 2% C&I 25% Tech 27% ABL/F ** 18% Business C&I 70% Loans as of 6 - 30 - 13 True Business Focus BBNK % RE = 30% (70% Business) Peer* % RE = 79% (21% Business) * Peer – SNL Data: US Public Banks $500M - $1.5b Total Assets as of March 31, 2013 ** Asset - based lending / Factoring >3x 13
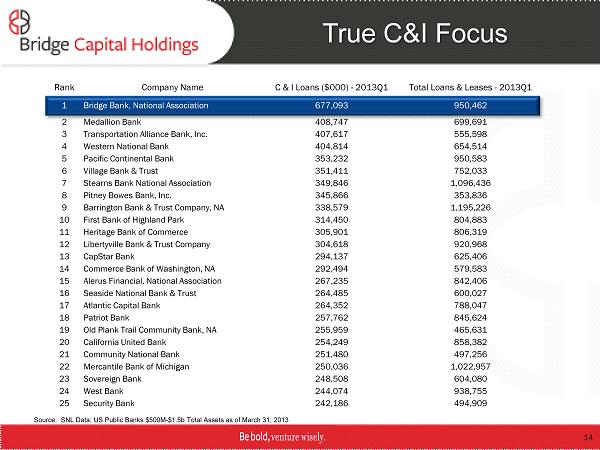
Rank Company Name C & I Loans ($000) - 2013Q1 Total Loans & Leases - 2013Q1 1 Bridge Bank, National Association 677,093 950,462 2 Medallion Bank 408,747 699,691 3 Transportation Alliance Bank, Inc. 407,617 555,598 4 Western National Bank 404,814 654,514 5 Pacific Continental Bank 353,232 950,583 6 Village Bank & Trust 351,411 752,033 7 Stearns Bank National Association 349,846 1,096,436 8 Pitney Bowes Bank, Inc. 345,866 353,836 9 Barrington Bank & Trust Company, NA 338,579 1,195,226 10 First Bank of Highland Park 314,450 804,883 11 Heritage Bank of Commerce 305,901 806,319 12 Libertyville Bank & Trust Company 304,618 920,968 13 CapStar Bank 294,137 625,406 14 Commerce Bank of Washington, NA 292,494 579,583 15 Alerus Financial, National Association 267,235 842,406 16 Seaside National Bank & Trust 264,485 600,027 17 Atlantic Capital Bank 264,352 788,047 18 Patriot Bank 257,762 845,624 19 Old Plank Trail Community Bank, NA 255,959 465,631 20 California United Bank 254,249 858,382 21 Community National Bank 251,480 497,256 22 Mercantile Bank of Michigan 250,036 1,022,957 23 Sovereign Bank 248,508 604,080 24 West Bank 244,074 938,755 25 Security Bank 242,186 494,909 True C&I Focus Source: SNL Data: US Public Banks $500M - $1.5b Total Assets as of March 31, 2013 14
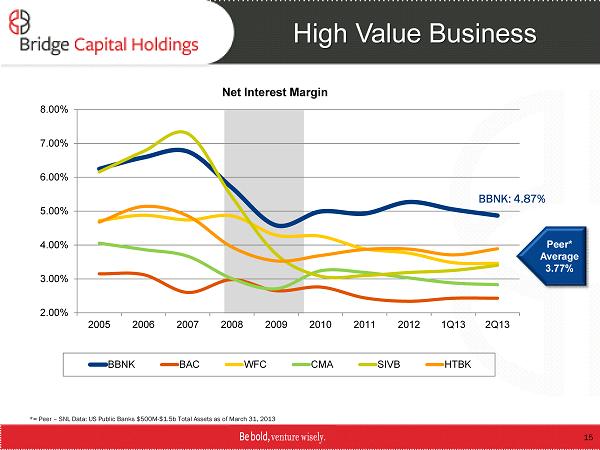
2.00% 3.00% 4.00% 5.00% 6.00% 7.00% 8.00% 2005 2006 2007 2008 2009 2010 2011 2012 1Q13 2Q13 Net Interest Margin BBNK BAC WFC CMA SIVB HTBK High Value Business BBNK: 4.87% *= Peer – SNL Data: US Public Banks $500M - $1.5b Total Assets as of March 31, 2013 Peer* Average 3.77% 15
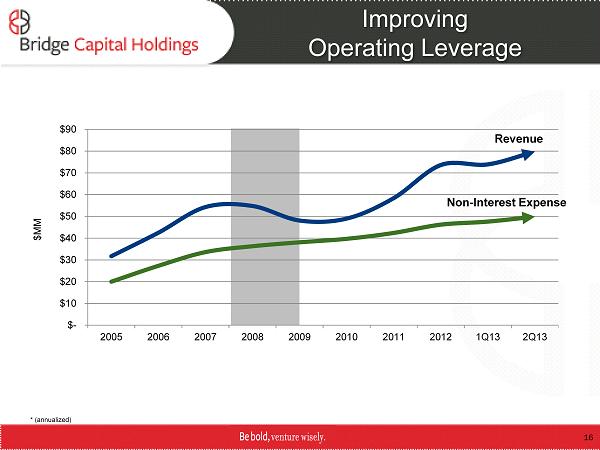
Improving Operating Leverage Revenue Non - Interest Expense * (annualized) 16 $- $10 $20 $30 $40 $50 $60 $70 $80 $90 2005 2006 2007 2008 2009 2010 2011 2012 1Q13 2Q13 $MM
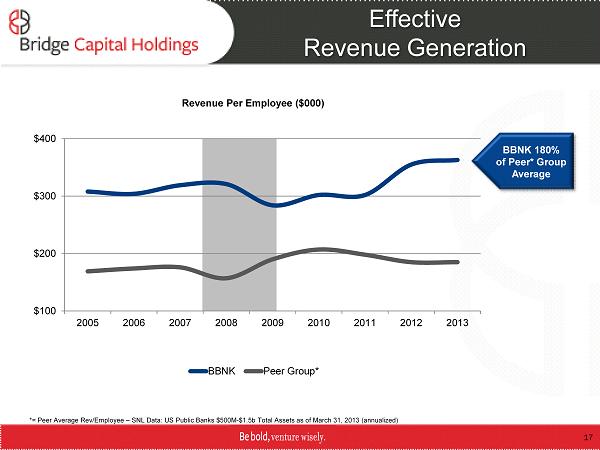
$100 $200 $300 $400 2005 2006 2007 2008 2009 2010 2011 2012 2013 Revenue Per Employee ( $000) BBNK Peer Group* Effective Revenue Generation *= Peer Average Rev/Employee – SNL Data: US Public Banks $500M - $1.5b Total Assets as of March 31, 2013 (annualized) BBNK 180% of Peer* Group Average 17
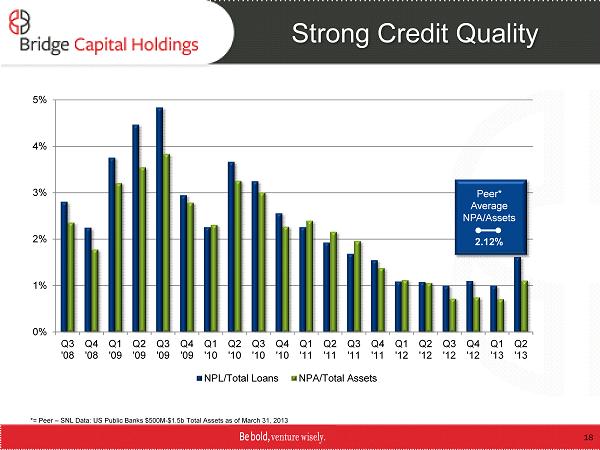
0% 1% 2% 3% 4% 5% Q3 '08 Q4 '08 Q1 '09 Q2 '09 Q3 '09 Q4 '09 Q1 '10 Q2 '10 Q3 '10 Q4 '10 Q1 '11 Q2 '11 Q3 '11 Q4 '11 Q1 '12 Q2 '12 Q3 '12 Q4 '12 Q1 '13 Q2 '13 NPL/Total Loans NPA/Total Assets Strong Credit Quality Peer* Average NPA/Assets 2.12% *= Peer – SNL Data: US Public Banks $500M - $1.5b Total Assets as of March 31, 2013 18
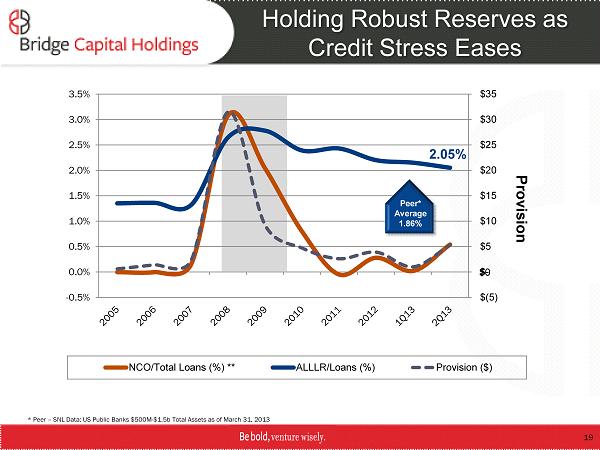
$(5) $- $5 $10 $15 $20 $25 $30 $35 -0.5% 0.0% 0.5% 1.0% 1.5% 2.0% 2.5% 3.0% 3.5% Provision NCO/Total Loans (%) ** ALLLR/Loans (%) Provision ($) Holding Robust Reserves as Credit Stress Eases 2.05% * Peer – SNL Data: US Public Banks $500M - $1.5b Total Assets as of March 31, 2013 $0 Peer* Average 1.86% 19
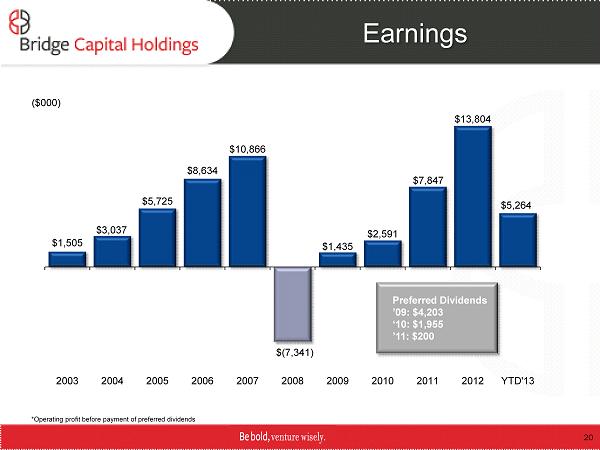
$(7,341) $1,505 $3,037 $5,725 $8,634 $10,866 $ 1,435 $2,591 $ 7,847 $13,804 $5,264 2003 2004 2005 2006 2007 2008 2009 2010 2011 2012 YTD'13 Earnings Preferred Dividends ’09: $4,203 ‘ 10: $ 1,955 ’11: $200 ($000) *Operating profit before payment of preferred dividends 20
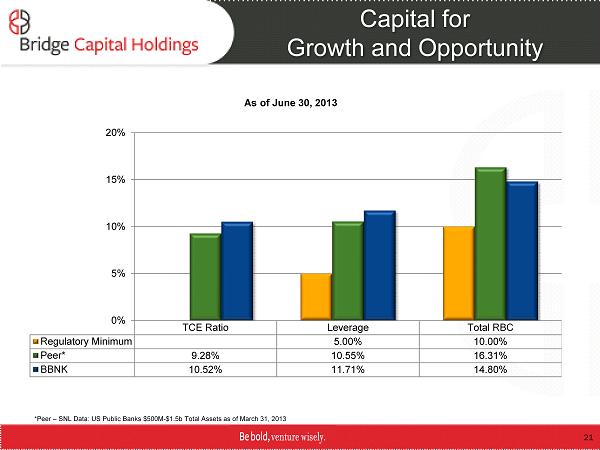
Capital for Growth and Opportunity * Peer – SNL Data: US Public Banks $500M - $1.5b Total Assets as of March 31, 2013 TCE Ratio Leverage Total RBC Regulatory Minimum 5.00% 10.00% Peer* 9.28% 10.55% 16.31% BBNK 10.52% 11.71% 14.80% 0% 5% 10% 15% 20% As of June 30, 2013 21
Catalysts for Earnings Growth ▪ Continued organic balance sheet growth ▪ Utilization rates on LOC at low ebb – Utilization currently in the mid 30% range, well below historical levels ▪ NIM expansion – Will benefit from asset sensitivity when rates rise ▪ Lower levels of credit stress – Normalizing of credit costs ▪ Noninterest income opportunities 22
Contact Information Investor Relations Contact Thomas A. Sa Bridge Capital Holdings 55 Almaden Blvd., Suite 100 San Jose, CA 95113 (408) 423 - 8500 ir@bridgebank.com 23