Attached files
| file | filename |
|---|---|
| 8-K - 8-K - BERKSHIRE HILLS BANCORP INC | a13-17494_18k.htm |
Exhibit 99.1
|
|
KBW Community Bank Conference July 30-31, 2013 |

|
|
Contacts 1 Michael P. Daly Chairman, President & CEO mdaly@berkshirebank.com 413-236-3194 David H. Gonci Capital Markets Director dgonci@berkshirebank.com 413-281-1973 Allison P. O’Rourke VP, Investor Relations Officer aorourke@berkshirebank.com 413-236-3149 |

|
|
Who We Are Full Service Regional Bank with a distinctive brand and culture, strong middle market opportunities and a solid foundation Assets: $5.2 billion Loans: $3.8 billion Annualized Core Revenue: $220 million Deposits: $3.8 billion AUM: $1.2 billion Branches: 74 plus 10 lending offices Additional 20 branch purchase pending Footprint: New England and Central New York Market Capitalization: $660 million NYSE: BHLB 2 BHLB Branches Pending Branches |

|
|
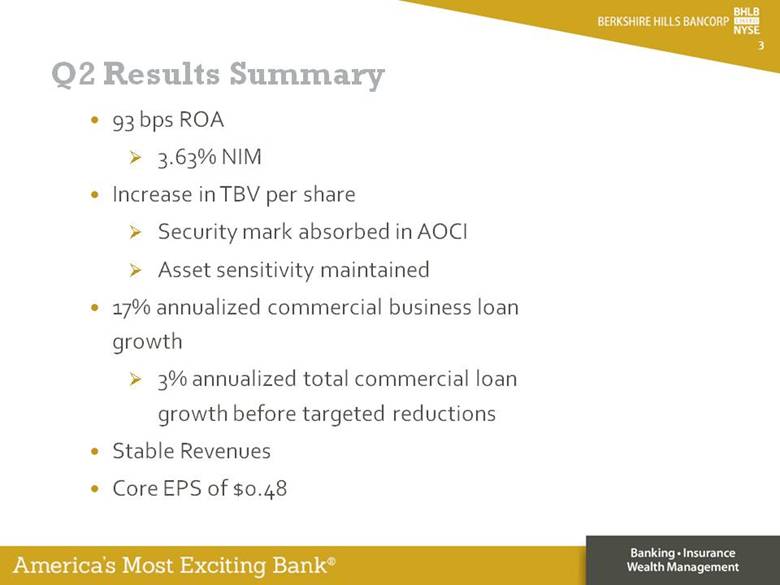
Q2 Results Summary 3 93 bps ROA 3.63% NIM Increase in TBV per share Security mark absorbed in AOCI Asset sensitivity maintained 17% annualized commercial business loan growth 3% annualized total commercial loan growth before targeted reductions Stable Revenues Core EPS of $0.48 |
|
|
4 Current Initiatives 20 Branch Acquisition from Bank of America Financially and strategically compelling Loan Growth Focus on C&I Recruitment of commercial lending teams Middle-market leasing Building for the Future Executive Changes Restructuring Initiative Expense focus |

|
|
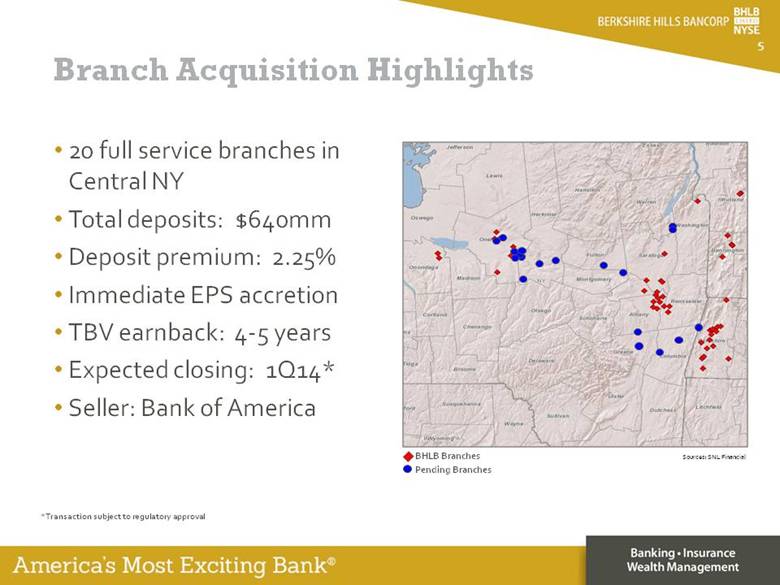
Branch Acquisition Highlights 20 full service branches in Central NY Total deposits: $640mm Deposit premium: 2.25% Immediate EPS accretion TBV earnback: 4-5 years Expected closing: 1Q14* Seller: Bank of America *Transaction subject to regulatory approval BHLB Branches Pending Branches Sources: SNL Financial 5 |
|
|
Branch Acquisition Highlights 6 |

|
|
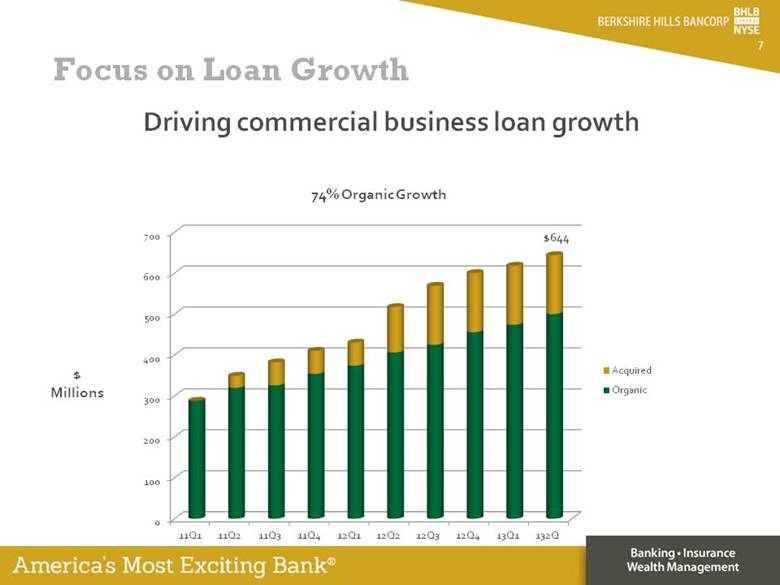
Focus on Loan Growth 7 Driving commercial business loan growth $644 $ Millions 74% Organic Growth |
|
|
Disciplined recruitment of commercial lending teams in middle-market space drives profitability 8 Key Characteristics Established, well respected teams formerly attached to large banks focused outside of our regions Solid relationships within community Breakeven within first year Focus on Loan Growth |

|
|
Building for the Future 9 |

|
|
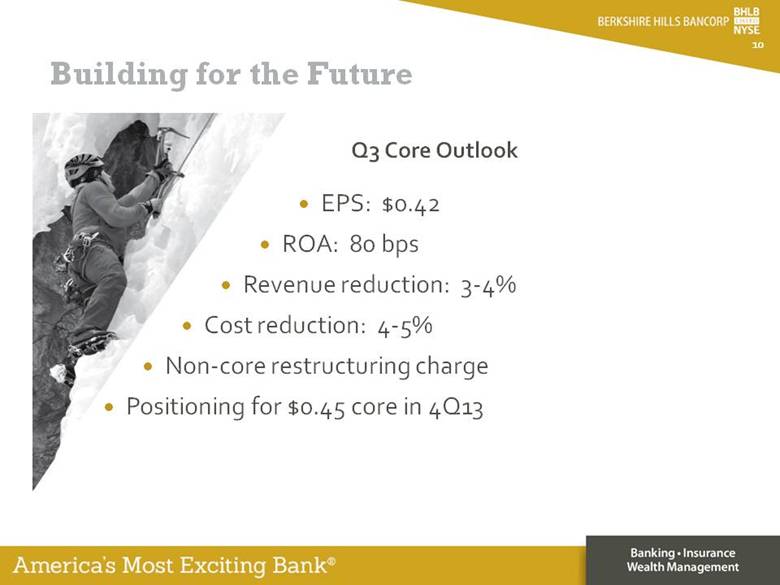
Building for the Future EPS: $0.42 ROA: 80 bps Revenue reduction: 3-4% Cost reduction: 4-5% Non-core restructuring charge Positioning for $0.45 core in 4Q13 Q3 Core Outlook 10 |
|
|
Why Invest in Us Strong financial condition Diversified income drivers A leading regional bank in our footprint Experienced leadership team AMEB culture Well positioned for growth Demonstrated profitability 11 |

|
|
Forward Looking Statements. This document contains certain forward-looking statements as defined in the Private Securities Litigation Reform Act of 1995. These statements include statements about anticipated financial results. Forward-looking statements can be identified by the fact that they do not relate strictly to historical or current facts. They often include words like "believe," "expect," "anticipate," "estimate," and "intend" or future or conditional verbs such as "will," "would," "should," "could" or "may.“ There are several factors that could cause actual results to differ significantly from expectations described in the forward-looking statements. For a discussion of such factors, please see Berkshire’s most recent reports on Forms 10-K and 10-Q filed with the Securities and Exchange Commission and available on the SEC's website at www.sec.gov. Berkshire does not undertake any obligation to update forward-looking statements made in this document. NON-GAAP FINANCIAL MEASURES. This presentation references non-GAAP financial measures incorporating tangible equity and related measures, and core earnings excluding merger and other non-recurring costs. These measures are commonly used by investors in evaluating business combinations and financial condition. GAAP earnings are lower than core earnings primarily due to non-recurring merger and systems conversion related expenses. Reconciliations are in earnings releases at www.berkshirebank.com. 12 |

|
|
Financial Performance & Goals 13 2010 2011 2012 2013 H1 Financial Goals Core revenue growth 9% 31% 40% 27% 7 - 10%+ ann Net interest margin 3.28% 3.57% 3.62% 3.68% 3.30 - 3.50%+ Fee income/revenue 28% 24% 26% 25% 25 - 30%+ Efficiency ratio 71% 63% 59% 60% 53 - 57% Core ROA 0.51% 0.80% 0.98% 0.97% 1.10%+ Core ROE 3.6% 5.8% 7.5% 7.6% 10.0%+ Core ROTE 7.6% 11.3% 13.8% 13.7% 15.0%+ Core EPS annualized $1.00 $1.54 $1.98 $2.02 10%+ann growth Dividends/share ann. $0.64 $0.65 $0.69 $0.72 N/A Tangible BV per share $15.22 $15.53 $15.63 $15.96 $18.00+ Note: Core results exclude merger, divestiture, and systems conversion net charges after tax totaling $0.4 million in 2010, $10.4 million in 2011, $11.1 million in 2012 and $2.9 million in H1 2013. GAAP EPS for those periods was $0.98, $0.97, $1.49 and $0.90 respectively. Core ROTE includes after-tax amortization of intangible assets in core return. Book value per share was $27.52, $26.09, $26.53 and $26.82 for the above respective periods. Financial goals are targeted run rate at end of 2015 and beyond. |

|
|
14 Non-GAAP Reconciliation (Dollars in thousands) 2010 2011 2012 2013 H1 Net income 13,615 $ 17,348 $ 33,188 $ 22,502 $ Gain on securities and other nonrecurring gains - (2,113) (1,485) (1,005) Non-recurring and merger related expense 447 19,928 18,019 5,839 Income taxes (87) (6,547) (6,114) (1,949) Net (income) loss from discontinued operations - (914) 637 - Total core income (A) 13,975 $ 27,714 $ 44,245 $ 25,387 $ Amortization of intangible assets (after tax) 1,813 $ 2,542 $ 3,203 $ 1,769 $ Total core tangible income (B) 15,788 $ 30,256 $ 47,448 $ 27,156 $ Total non-interest income 29,751 $ 35,803 $ 54,056 $ 30,404 $ Gain on securities and other nonrecurring gains - (2,113) (1,485) (1,005) Net interest income 76,947 106,520 143,388 83,041 Total core revenue 106,698 $ 140,210 $ 195,959 $ 112,440 $ Total non-interest expense 82,137 $ 116,442 $ 140,806 $ 77,418 $ Less: Non-recurring and merger related expense (447) (19,928) (18,019) (5,839) Core non-interest expense 81,690 96,514 122,787 71,579 (Dollars in millions, except per share data) Total average assets (C) 2,743 $ 3,484 $ 4,532 $ 5,220 $ Total average equity (D) 383 $ 476 $ 586 $ 667 $ Total average intangible assets 174 207 242 (272) Total average tangible equity (E) 209 $ 269 $ 344 $ 395 $ Total stockholders' equity, period-end 387 $ 552 $ 667 $ 673 $ Less: Intangible assets, period-end (173) (223) (274) (272) Total tangible stockholders' equity, period-end (F) 214 $ 329 $ 393 $ 401 $ Total shares outstanding, period-end (thousands) (G) 14,076 21,148 25,148 25,096 Average diluted shares outstanding (thousands) (H) 13,896 17,952 22,329 25,049 Core earnings per common share, diluted (A/H) 1.00 $ 1.54 $ 1.98 $ 1.01 $ Tangible book value per share, period-end (F/G) 15.22 $ 15.53 $ 15.63 $ 15.96 $ Core return on assets (A/C) 0.51 % 0.80 % 0.98 % 0.97 % Core return on equity (A/D) 3.65 5.76 7.52 7.61 Core return on tangible equity (B/E) 7.57 11.27 13.78 13.74 |

|
|
If you have any questions, please contact: Allison O’Rourke 99 North Street Pittsfield, MA 01202 Investor Relations Officer (413) 236-3149 aorourke@berkshirebank.com Committed to the RIGHT core values: Respect Integrity Guts Having Fun Teamwork |
