Attached files
| file | filename |
|---|---|
| 8-K - FORM 8-K - Ameris Bancorp | d575050d8k.htm |
 2
Quarter 2013
Investor Presentation
nd
Exhibit 99.1 |
 2
Cautionary Statements
This presentation contains certain performance measures
determined by methods other than in accordance with
accounting principles generally accepted in the United States of
America (“GAAP”). Management of Ameris Bancorp (the
“Company”) uses these non-GAAP measures in its analysis of
the Company’s performance. These measures are useful when
evaluating the underlying performance and efficiency of the
Company’s operations and balance sheet. The Company’s
management believes that these non-GAAP measures provide a
greater understanding of ongoing operations, enhance
comparability of results with prior periods and demonstrate the
effects of significant gains and charges in the current period.
The Company’s management believes that investors may use
these non-GAAP financial measures to evaluate the Company’s
financial performance without the impact of unusual items that
may obscure trends in the Company’s underlying performance.
These disclosures should not be viewed as a substitute for
financial measures determined in accordance with GAAP, nor
are they necessarily comparable to non-GAAP performance
measures that may be presented by other companies. Tangible
common equity and Tier 1 capital ratios are non-GAAP
measures. The Company calculates the Tier 1 capital using
current call report instructions. The Company’s management
uses these measures to assess the quality of capital and believes
that investors may find them useful in their evaluation of the
Company. These capital measures may, or
may not be necessarily comparable to similar capital measures
that may be presented by other companies.
This presentation may contain statements that constitute
“forward-looking
statements”
within
the
meaning
of
Section
27A of the Securities Act of 1933, as amended, and
Section
21E
of
the
Securities
Exchange
Act
of
1934,
as
amended. The words “believe”, “estimate”, “expect”,
“intend”, “anticipate”
and similar expressions and variations thereof
identify certain of such forward-looking statements, which speak
only as of the dates which they were made. The Company
undertakes no obligation to publicly update or revise any
forward-looking statements, whether as a result of new
information, future events or otherwise. Readers are cautioned
that any such forward-looking statements are not guarantees of
future performance and involve risks and uncertainties and that
actual results may differ materially from those indicated in the
forward-looking statements as a result of various factors.
Readers are cautioned not to place undue reliance on these
forward-looking statements and are referred to the Company’s
periodic filings with the Securities and Exchange Commission for
a summary of certain factors that may impact the Company’s
results of operations and financial condition. |
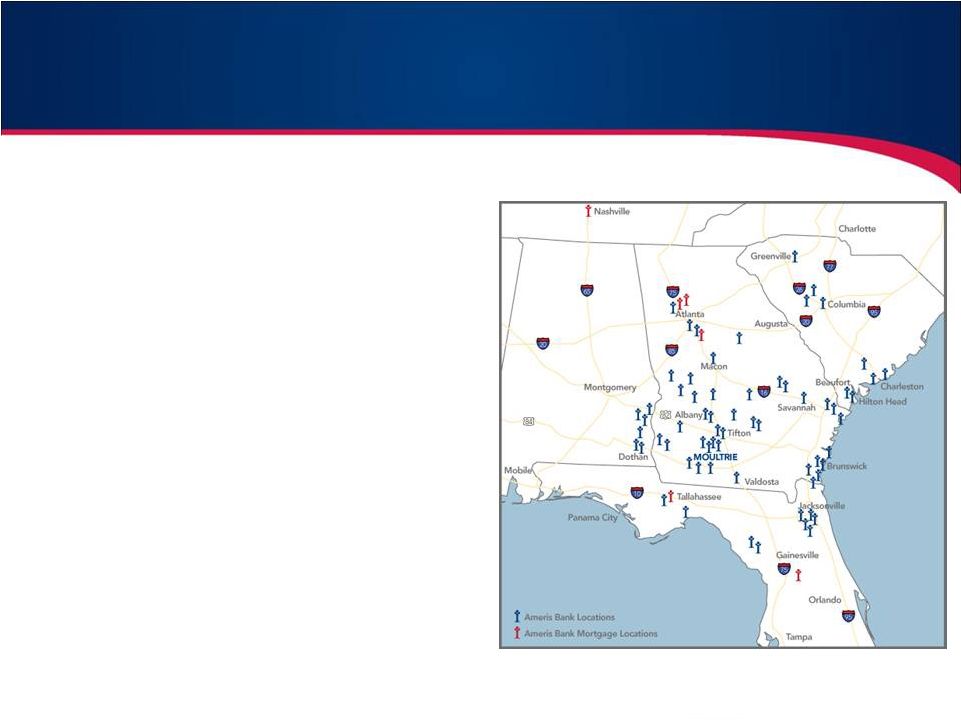 Corporate
Profile 3
•
Headquartered in Moultrie, Georgia
•
Founded in 1971 as American Banking Company
•
Historically grown through acquisitions of smaller
banks in areas close to existing operations
•
Recently announced merger with Prosperity (St.
Augustine, FL) adds 12 Florida offices and $750
million in assets
•
Recent growth through de novo expansion strategy
and 10 FDIC-assisted transactions
•
Four state footprint with 57 offices
•
Approximately 838 FTEs managing 200,000 core
customer accounts |
 4
Management and Board Ownership of Approximately 7%
Experienced Management Team
Name, Position
Experience
(Banking / Ameris)
Edwin W. Hortman Jr.
Chief Executive Officer
Andrew B. Cheney
EVP & Chief Operating Officer
Dennis J. Zember Jr.
EVP & Chief Financial Officer
Jon S. Edwards
EVP & Chief Credit Officer
Stephen A. Melton
EVP, Chief Risk Officer
Cindi H. Lewis
EVP, Chief Administrative Officer
T. Stan Limerick
EVP, Chief Information Officer
32/14
36/4
20/8
28/13
32/2
36/36
7/1 |
 Continue to
Realize the Positive Impacts of our Earnings Strategies: •
Continue to drive double digit growth in loans and low-cost/no-cost funding.
•
Maintain improving slope line on operating efficiency believing that the advantage of
lower costs will make us more competitive at acquiring
higher quality assets. •
Improve credit quality metrics to allow for a return to normalized credit costs in
2014. •
Continue success with current non-interest income strategies; pursue additional
strategies. Complete merger with Prosperity and capitalize on our three acquisition
themes: •
Leverage the existing staff/resources of Ameris Bank to gain significant operating
leverage. •
Accelerate the liquidation of remaining problem assets.
•
Gain a normalized NIM on the incremental assets by restructuring their balance sheet (FHLB
advances and investment portfolio).
5
Current Focus |
 6
2 Quarter Update –
Financial Condition
dollars in millions, except per share data
Q2 '12
Q3 '12
Q4 '12
Q1 '13
Q2 '13
Change
BALANCE SHEET
Total Assets
$2,920
$2,949
$3,019
$2,862
$2,809
(3.80)
%
S/T assets & investments
546
492
628
461
418
(23.44)
Loans -
noncovered
1,385
1,469
1,499
1,535
1,618
16.84
Loans -
covered
602
546
507
461
444
(26.25)
Reserve for loan losses
26
26
24
23
24
(7.69)
Indemnification asset
204
198
159
161
106
(48.04)
Non-interest bearing deposits
429
465
511
491
475
10.72
Interest bearing deposits
2,116
2,116
2,114
1,999
1,968
(6.99)
Tang Common Equity / Assets
8.41
%
8.27
%
8.23
%
8.83
%
9.15
%
8.80
Tangible Book Value
$10.29
$10.23
$10.39
$10.57
$10.74
4.37
%
nd |
 7
2
Quarter Update –
Operating Results
dollars in millions, except per share data
Q2 '12
Q3 '12
Q4 '12
Q1 '13
Q2 '13
Change
PERFORMANCE
Net Income
$2,495
$1,903
$4,672
$5,285
$6,678
167.66
%
Net interest income
$28,881
$28,238
$29,559
$28,338
$29,476
2.06
Provision for loan losses
$7,225
$6,540
$4,442
$2,923
$4,165
(42.35)
Non-interest income
$8,875
$9,831
$11,582
$11,188
$11,385
28.28
Mortgage revenues
3,006
3,740
4,768
4,464
5,001
66.37
Service charges on deposits
4,770
5,121
5,299
4,837
4,695
(1.57)
Non-interest expense
$26,623
$28,810
$29,791
$28,884
$26,688
0.24
Salaries & Benefits
12,125
13,766
15,785
13,806
13,381
10.36
Occupancy & DP costs
5,785
5,939
6,907
5,501
5,814
0.50
OREO and problem loan expense
3,423
3,706
2,548
4,844
2,349
(31.38)
Return on Avg Assets
0.34%
0.26%
0.63%
0.74%
0.95%
181.48
Return on Avg TCE
4.18%
3.19%
7.89%
8.54%
10.77%
157.70
Diluted earnings per share
0.07
0.04
0.15
0.20
0.26
271.43
Net interest margin (TE)
4.66%
4.52%
4.72%
4.79%
4.96%
6.44
Efficiency ratio (ex credit costs)
61.45%
65.94%
66.22%
60.82%
59.57%
(3.06)
Net Overhead (ex credit costs)
1.96%
2.07%
2.07%
1.80%
1.84%
(6.00)
%
nd |
 8
dollars in millions, except per share data
Q2 '12
Q3 '12
Q4 '12
Q1 '13
Q2 '13
Change
CREDIT QUALITY
(1)
Non-performing assets
80,818
75,550
78,735
77,910
71,696
(11.29)
Non-accrual loans
44,421
38,225
38,885
37,476
31,811
(28.39)
OREO
36,397
37,325
39,850
40,434
39,885
9.58
NPAs / Assets
2.77
%
2.56
%
2.61
%
2.72
%
2.55
%
(7.94)
Classified Assets / Capital
32.05
%
31.44
%
33.45
%
31.7
%
28.7
%
(10.45)
Reserves / Loans
1.92
%
1.80
%
1.63
%
1.57
%
1.56
%
(18.75)
Reserves / NPLs
58.98
%
67.76
%
60.67
%
62.39
%
76.13
%
29.08
Net Charge-offs
8,561
5,987
6,399
2,814
2,860
(66.59)
as a % of average loans
2.52
%
1.65
%
1.75
%
0.76
%
0.74
%
(70.63)
New Non-accrual loans
15,325
11,829
15,687
8,113
5,749
(62.49)
2
Quarter Update –
Credit Quality
nd |
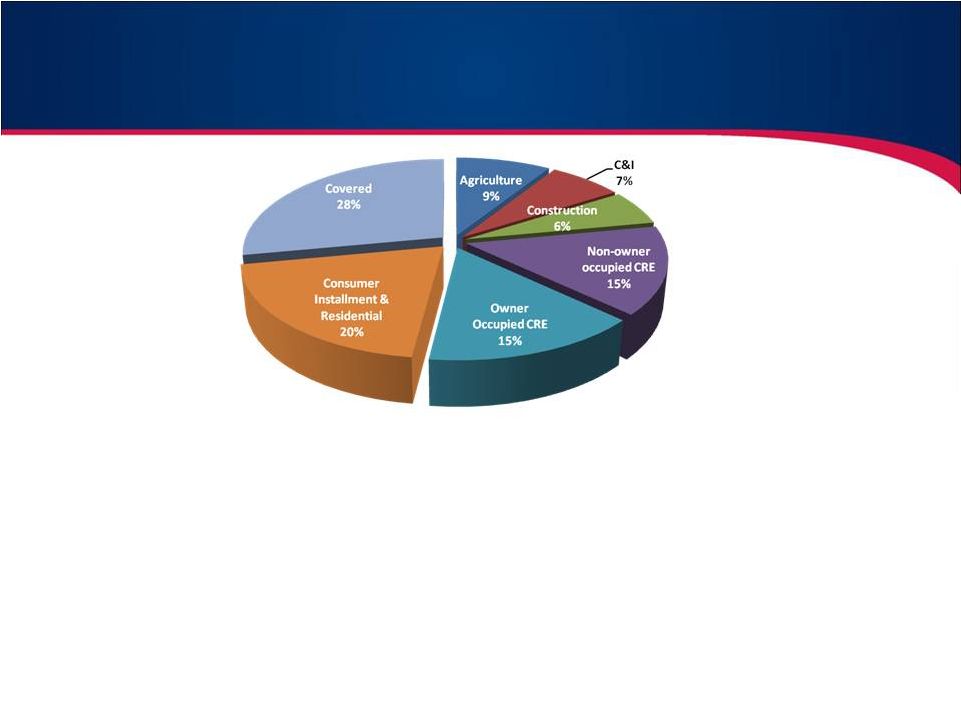 •
Diversified loan portfolio across five regions
–
Inland Georgia –
50%
–
Coastal Georgia –
14%
–
Alabama –
8%
•
In-house lending limit of $10.0 million versus $75 million legal limit
–
7 loans greater than $5 million
•
Loan participations less than 1.00% of total loans
•
Aggressive management of concentrations of credit
•
Top 25 relationships
are only 10.8% of total loans, with avg. DSC of 1.98% and LTV
of 63.4%
9
–
South Carolina –
15%
–
Florida –
13%
Loan Portfolio Detail |
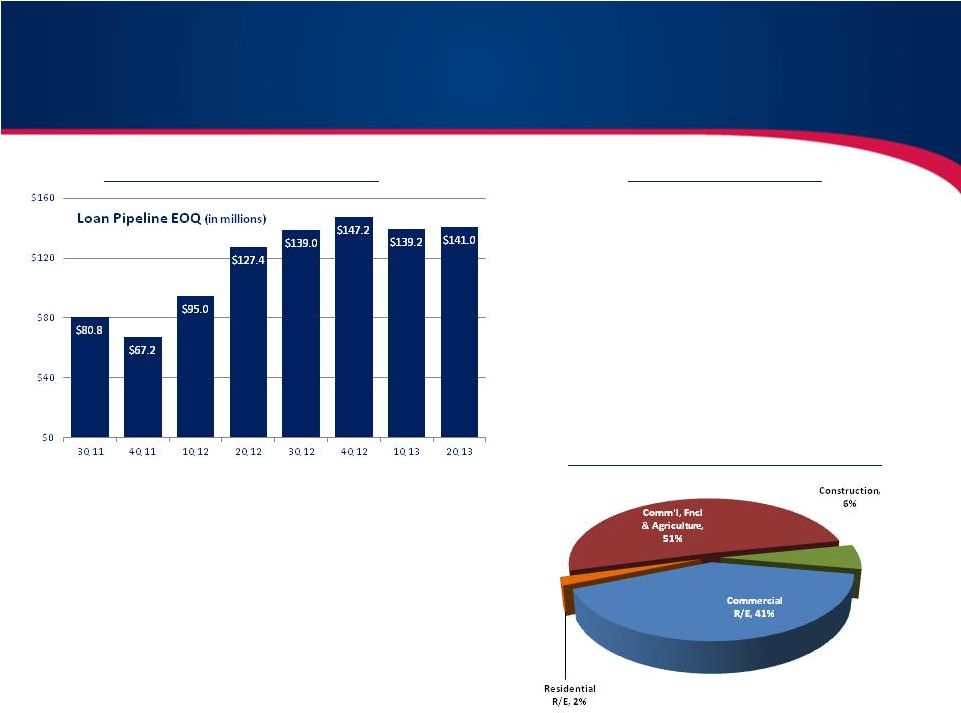 •
Leveraging presence in new markets (top five markets
account for 70% of pipeline: Atlanta, Jacksonville,
Columbia, Savannah, Charleston
•
Upgrading production positions in key markets: limited
changes to expense base but higher levels of quality
production
•
Expanding Mortgage Strategy: Jumbo mortgages,
wholesale, warehouse LOC
•
Leveraging Agricultural expertise: better yields than in
CRE due to limited competition
•
Specialty lines of business that would diversify loan
portfolio
•
Yields on current production approximately
5.01%
•
2/3
rds
of production is with existing customers –
higher rates (40bps-50bps from relationships)
•
Diversified
loan
types
–
not
solely
chasing
CRE
or competing with low rates that do not
compensate for term or quality
10
Loan Portfolio –
strong loan pipelines
Consistent Loan Pipelines¹
Lending
Strategies
Pipeline
Opportunities
by
Type
1 –
Loan pipeline amounts consist of all loans management has deemed a 75% or better likelihood of
closing. |
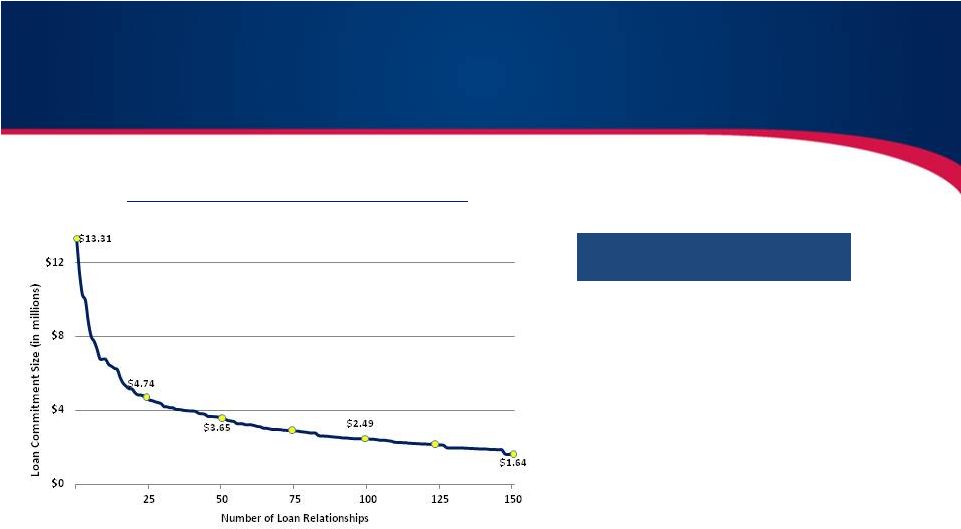 11
•
$13.3 million
-
Largest Relationship has over 3.0x debt coverage, backed by taxing authority of one of
our local markets.
•
1.98x
–
Weighted average debt coverage of our 25 largest relationships.
•
63% -
Weighted average loan to value on our 25 largest relationships.
Loan Portfolio
Diversified through smaller relationships as well
Portfolio
comprised
of
smaller
relationships
Relationship
Totals
in
Legacy
Portfolio
(in
millions)
Rank
Total O/S
% of total
Top 10
$ 90.6
5.94%
Top 50
$ 275.3
18.06%
Top 100
$ 421.7
27.63%
Top 200
$ 612.0
40.10%
Top 300
$ 738.4
48.38% |
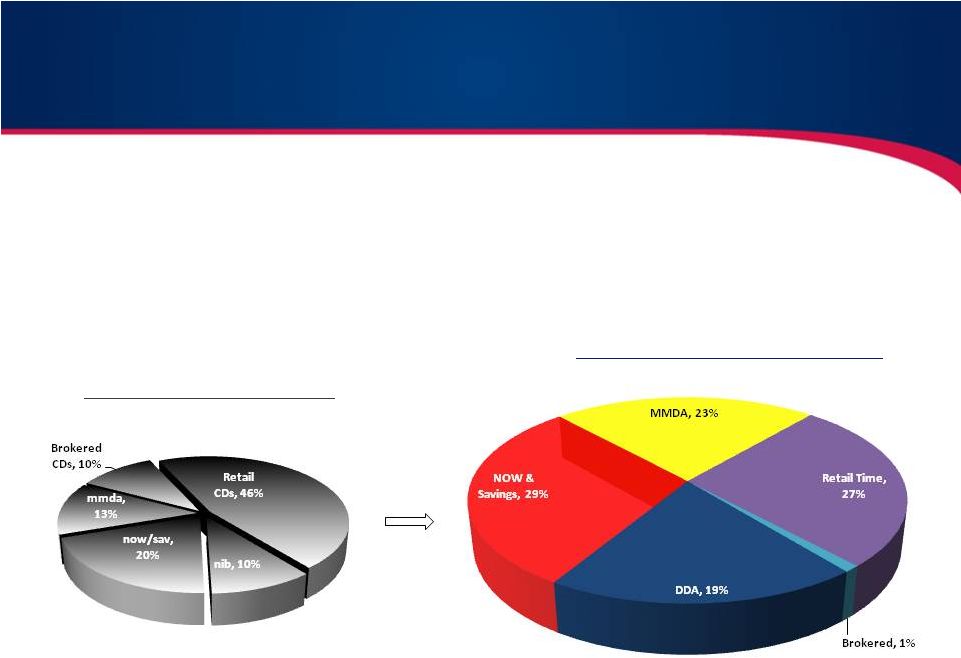 12
•
$0.44 per share –
Additional earnings embedded in today’s Balance Sheet vs. 2008.
Today’s deposit mix would have reduced interest expense by 30% in 2008, or $16.0
million. •
Built significant value in our core deposit base
•
Focused largely on “Non-Rate Sensitive”
deposits
Significant Value in Deposit Portfolio
Future revenue opportunity is large, and growing
Deposit Composition –
6/30/13
Deposit Composition –
12/31/08 |
 13
FDIC Indemnification Asset
Managing towards the end of loss share protection
I/A
–
Indemnification
Asset
for
reimbursement
on
expected
losses
from
the
FDIC
1-
Months remaining to collect remainder of indemnification asset is a weighted average based on
the indemnification asset at 6/30/2013.
2
-
Current
Estimate
of
losses
includes
all
losses
incurred
to
date
as
well
as
reimbursable
expenses
plus
expected
losses
not
incurred for
which there is a corresponding indemnification asset. Original estimate of losses
includes gross losses identified in due diligence and 10% for workout expenses.
Classifieds
Maturing
After L/S
All Loans
Bank
Original I/A
(000's)
Current I/A
(000's)
% of Original
I/A
Remaining
Months to
Collect
Original
Estimate of
Losses (000's)
Current
Estimate of
Losses (000's)
Current
Estimate as a
% of Original
NBV
I/A
NBV
I/A
on
loans
AUB
24,200
1,691
7.0%
14.2
33,275
25,826
77.6%
1,028
39
21,607
1,691
USB
21,640
2,153
10.0%
15.2
29,755
39,095
131.4%
3
-
20,746
2,042
SCB
22,400
2,550
11.4%
21.2
30,800
28,811
93.5%
620
14
35,596
2,305
FBJ
11,307
4,236
37.5%
27.2
15,547
10,819
69.6%
12
50
24,069
4,068
TBC
22,807
3,885
17.0%
28.2
31,360
27,310
87.1%
132
62
34,318
2,565
DBT
112,404
23,512
20.9%
28.2
160,577
135,173
84.2%
1,105
368
105,182
21,895
HTB
49,485
10,511
21.2%
35.1
68,042
52,364
77.0%
1,094
625
65,165
7,762
OGB
45,488
12,319
27.1%
35.1
62,546
34,770
55.6%
216
78
59,194
9,160
CBG
52,664
18,889
35.9%
42.2
72,413
48,780
67.4%
1,565
662
77,848
17,210
362,395
79,746
22.0%
32.6
504,315
402,949
79.9%
5,775
1,899
443,725
68,699 |
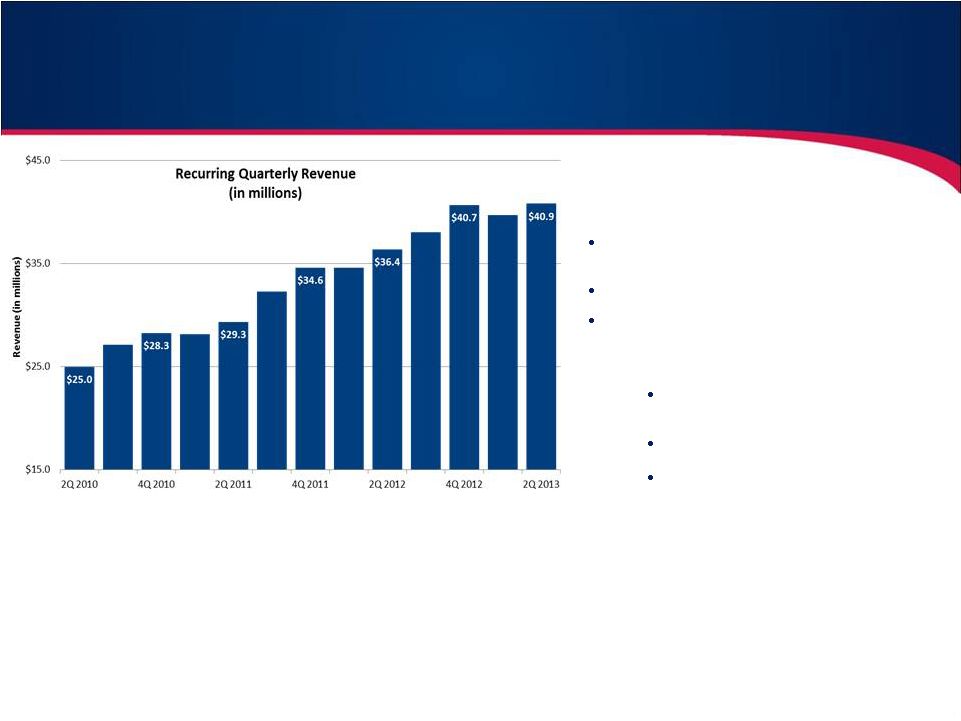 •
2012 -
2013 revenue gains boosted by growing loan portfolio and success in
non-interest income strategies.
•
2013-2015 strategy demands:
•
Diversification of revenue with more emphasis on highly profitable
non-interest income LOB’s that enhance ROA and reduce burden on
capital leverage
•
Protect our advantage from strong net interest margins with emphasis on
creating a highly favorable funding mix
14
Earnings –
Continued Growth in Revenue
Revenue growth through this cycle with
opportunistic strategies:
15%+ compounded annual growth rate in
total revenue over the last three
years Revenue has grown faster than earning
assets Significant amount of assets that
will be deployed over the next
3 years that will
significantly boost revenue and earnings >30% - CGR for mortgage related
revenue
>21% - CGR for debit interchange fees
>8% - CGR for analysis and overdraft
fees
|
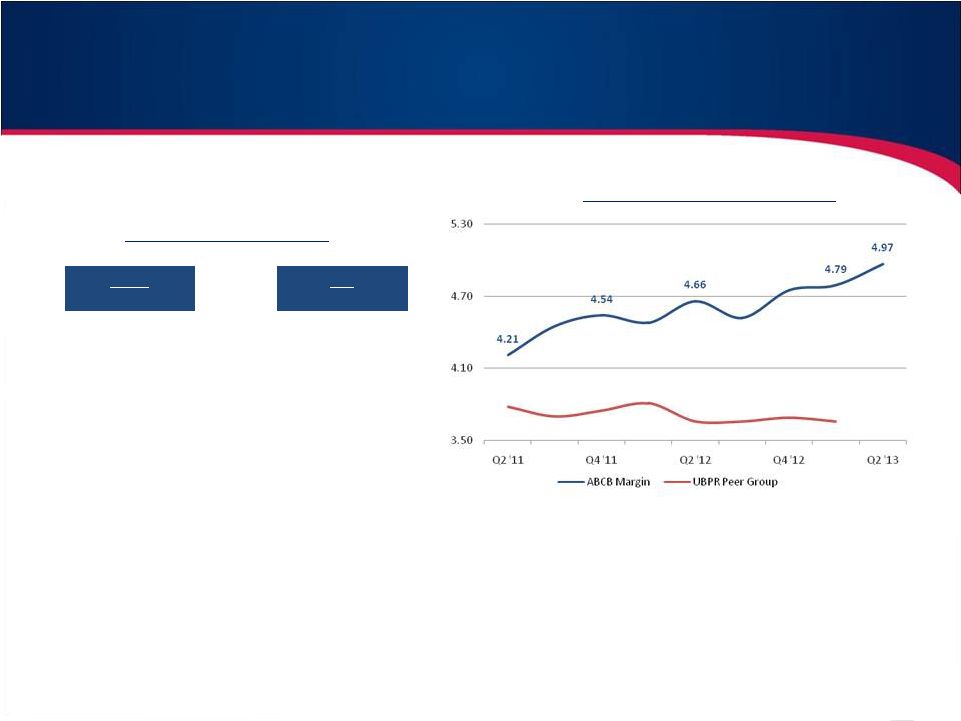 15
(1)
Maturity and Repricing Opportunity are amounts and yields maturing in the designated
quarter (2)
Ameris Bank net interest margin on a fully taxable-equivalent basis, excludes H/C level
TRUPs .
Loans
CDs
Quarter
Yield
Quarter
Yield
Q4 '11
5.38%
Q4 '11
0.67%
Q1 '12
5.48%
Q1 '12
0.65%
Q2 '12
5.45%
Q2 '12
0.54%
Q3 '12
5.28%
Q3 '12
0.51%
Q4 '12
5.11%
Q4 '12
0.44%
Q1 '13
5.13%
Q1 '13
0.49%
Q2 '13
5.01%
Q2 '13
0.42%
•
79.6% of lost revenue from loan repricing covered by CD renewal savings.
•
Management expects limited dilution (5-10bps) in NIM from balance sheet repricing and
believes volume expansion can more than offset revenue impacts.
Earnings -
Net Interest Margin
Net Interest Margin
(2)
(%)
“Acquisition Yields” |
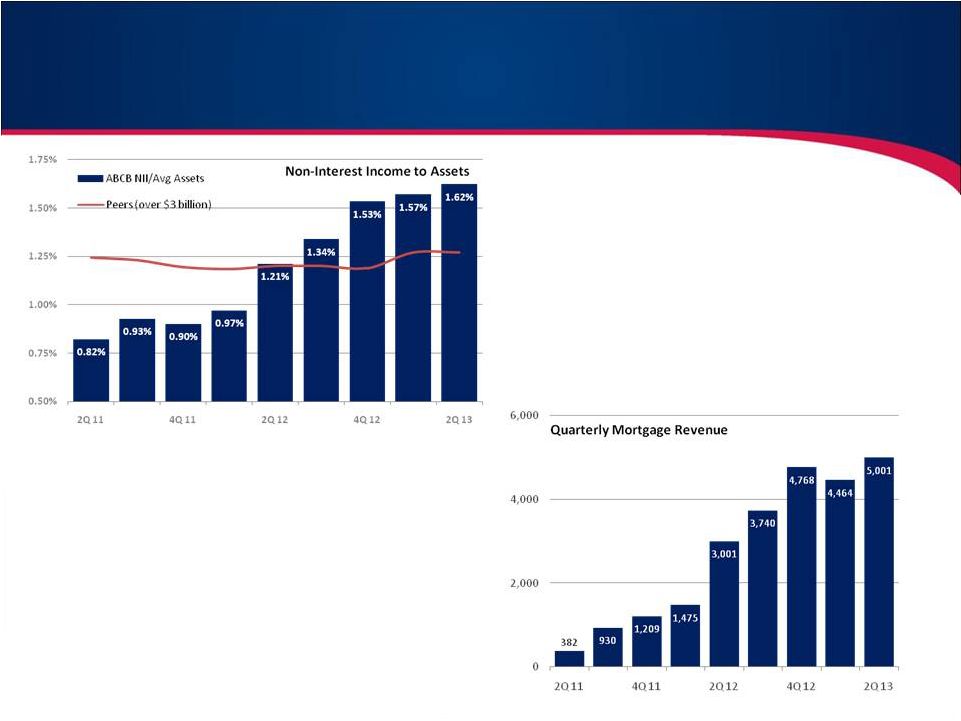 16
Serious about building strength and diversification in non-
interest income sources
•
Moving away from deposit charges
•
Researching unique lines of business
•
Momentum in our numbers coming from mortgage
revenue; we believe we can duplicate that strategy
with other LOBs by hiring expertise
Earnings –
Non-Interest Income
2Q 2013 Mortgage Stats:
•
•
•
•
Pretax profit of 32.2% of fee revenue. Believe this is
sustainable in the short-term, trending to industry
average long-term.
70%
purchase
business
vs.
64%
in
the
2
quarter
of
2012.
28% Government
72% Conventional
nd |
 17
Details regarding the recently announced Corporate Restructuring:
•
Closed 13 branches
since mid-2012.
•
Reduced
banking
division
and
corporate
headcount
by
85
since
3Q
2012.
(11.2%
of
workforce)
•
To date, we have
retained 75%+ of the loans and deposits.
•
Future efficiency efforts include:
•
RE-engineering loan production and loan maintenance systems
•
Continued downsizing of SAD department commensurate with problem
assets
•
Continue evaluating branch network for underperforming offices or markets
Earnings -
Corporate Restructure & Improved Efficiency
Three Months Ended
Six Months Ended
Jun.
Mar.
Dec.
Sept.
Jun.
Jun.
Jun.
2013
2013
2012
2012
2012
2013
2012
Total Operating Expenses
26,688
28,884
29,791
28,810
26,623
55,572
60,869
Less: Credit related expenses
(2,349)
(4,844)
(2,548)
(3,706)
(3,423)
(7,193)
(16,162)
Less: Mortgage related expenses
(4,717)
(3,721)
(3,589)
(2,958)
(1,861)
(8,438)
(3,344)
Core
Operating
Expenses
-
Ameris
Bank
19,622
20,319
23,654
22,146
21,339
39,941
41,363
Reported Efficiency Ratio
65.32%
72.76%
71.85%
75.68%
70.51%
68.98%
65.63%
Operating efficiency net of credit costs
59.57%
60.56%
65.70%
65.94%
61.45%
60.05%
61.49% |
 M&A
Opportunities (Significant opportunity building in our 4-State Footprint)
Southeast Banking Statistics show positive and
negative trends.
(Data
for
563
banks
smaller
than
Ameris
Bank
in
our
four
states)
Improving Ratios:
20%
–
Banks with Texas ratios still over 75%. Down from 28%
one year ago.
18%
–
Banks with capital ratios below 8.00% T1 Leverage.
Down from 22% one year ago. (virtually all from deleveraging)
8%
–
Improvement in the median ROAA (from 0.53% to
0.57%)
Indicators that Consolidation is necessary:
60%
–
Banks with less revenue in 1Q 2013 compared to 1Q
2012.
58%
–
Banks with worse efficiency ratios in 1Q 2013
compared to 1Q 2012.
59%
–
Banks with smaller loan books today than in 1Q
2012.
62%
–
Banks that failed to expand the distance between
net interest income and non-interest expense.
•
Improvement in credit quality and capital levels
of targets and the earnings and multiples of
acquirers should produce continued ramp in
M&A.
•
More banks are shrinking than growing. Fierce
competition for higher quality assets being won
by those that can afford it (those with better
efficiency and funding sources)
•
Too few banks have come to grips with need for
better efficiency. Because growth is constrained,
M&A is evaluated positively against branch
closures, reduction in force strategies, etc.
18 |
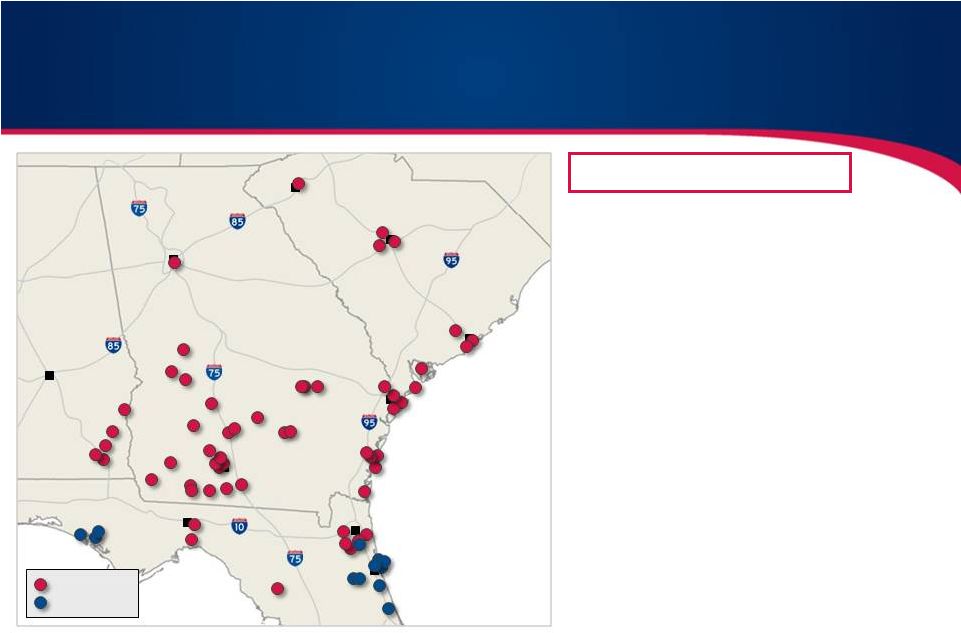 Pro Forma
Highlights (1)
•
Natural market extension
adds meaningful scale
•
Improves the value of our
franchise
•
Exceptional pro forma
financial profile
Financial data as of most recent quarter available
(1)
Excludes purchase accounting adjustments
Assets
……………………………
$3.6
billion
Loans
……………………………
2.5
Deposits
……………………………
3.0
Branches
……………………………
69
Acquisition of Prosperity Banking Company -
Proforma
19
Charleston
Columbia
Greenville
Atlanta
Montgomery
Moultrie
Tallahassee
Savannah
Jacksonville
St. Augustine
Ameris
Prosperity |
 •
Adds to our growing Northeast Florida presence
•
Higher-growth Florida markets represent a natural connection with our current
footprint •
Opportunity to become one of a few mid-sized community banks in the Jacksonville
MSA •
20+% accretive to EPS
•
Manageable tangible book value dilution and earnback period
approximately 3.25 years •
Ameris to remain “well-capitalized”
•
Market extension with like-minded community bank
•
Leverages management experience in Northeast Florida
•
Experienced
Southeast
acquiror
–
10
deals
in
the
last
4
years
•
Thorough due diligence process completed with 75% of the loan portfolio
and 100% of OREO reviewed
Franchise
Accretive
Financially
Accretive
Low-Risk
Acquisition of Prosperity Banking Company -
Rationale
20 |
 Acquiror:
Ameris Bancorp (NASDAQ: ABCB)
Target:
Prosperity Banking Company (Private)
Transaction Value:
(1)
$15.7 million
Consideration Mix:
Up to 50% cash at shareholder election
Per Share Consideration:
3.125 shares ABCB stock or $41.50 in cash per each Prosperity share
Price / Tangible Book Value (%):
88.7%
Capital Raise:
No additional capital required to complete the transaction
Required Approvals:
Customary Regulatory and Prosperity shareholder approvals
Expected Closing:
Late third quarter of 2013
(1)
Assumes stock consideration of 100%; based on ABCB's closing price of $13.32 as of 5/1/13 and
a fixed exchange ratio of 3.1250x Prosperity common shares outstanding of 377,960 as of
12/31/12 Acquisition of Prosperity Banking Company -
Terms
21 |
 First Quarter 2013
Investor Presentation |