Attached files
| file | filename |
|---|---|
| 8-K - FORM 8-K - United Financial Bancorp, Inc. | d573420d8k.htm |
 Forward Looking Statements
Holding Company for
NASDAQ: UBNK
Keefe, Bruyette & Woods
2013 Community Bank Conference
July 30 –
31, 2013
Certain
comments
made
in
the
course
of
this
presentation
by
UBNK
may
be
forward-looking
in
nature.
These
include
statements
about
realizing
cost
savings
in
connection
with
our
recent
acquisition
and
UBNK’s
operating
results
or
financial condition for periods ending or on dates occurring after June 30, 2013 and
usually use words such as “expect”, “anticipate”, “believe”, and similar expressions. These comments represent management’s current beliefs, based upon
information available to it at the time the statements are made with regard to the
matters addressed. All forward looking statements are subject to risks and
uncertainties that could cause UBNK’s actual results or financial condition to differ materially from those expressed in or implied by such statements. Factors of particular importance to
UBNK include, but are not limited to: (1) changes in general economic conditions,
including interest rates; (2) competition among providers of financial services; (3) changes in the interest rate environment that reduce our margins or reduce
the
fair
value
of
financial
instruments;
(4)
adverse
changes
in
the
securities
markets;
and
(5)
our
ability
to
enter
new
markets
successfully
and
capitalize
on
growth
opportunities.
UBNK
does
not
undertake
any
obligation
to
update
or
revise
any forward-looking statements, whether as a result of new information, future
events or otherwise. Exhibit 99.1 |
 Thirty-seven
branches in six counties in MA and CT 2 |
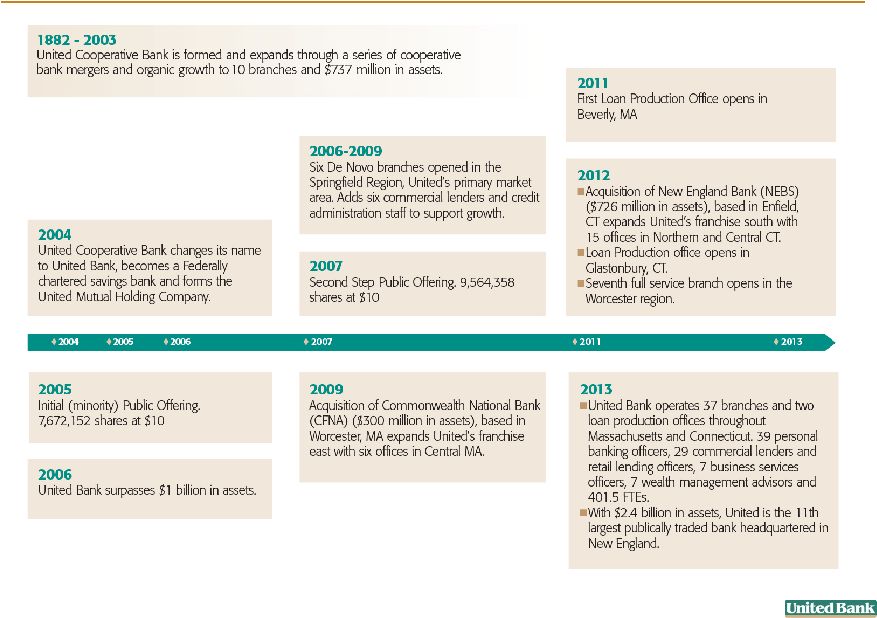 History of
Expansion through Organic Growth and Acquisitions 3 |
 Integration of
Connecticut into United Franchise 4
•
5.6% increase in total deposits during first half of 2013
($30.3MM)
•
4.7% increase in core deposits ($14.1MM)
•
$32MM of commercial loans closed
•
No loss of significant customer relationships
Execution of Cross Selling Initiatives
•
5% increase in average deposit balances
•
14% reduction in single-service households during first six
months of 2013
•
Commercial pipeline still strong
Balance Sheet Growth |
 Worcester Trends
Since February 2010 Conversion 5
Deposits
•
74% overall growth in core deposits
•
Account cross sell metrics similar to Western
Massachusetts (5+ accounts per household)
Worcester Commercial Lending
•
No major loss of account relationships
•
Worcester loan totals now exceed $270MM, up more than
30% since acquisition of Commonwealth National Bank
•
Commercial loan outstandings growing at 9%
compounded rate |
 Next Steps for
Organic Growth 6
•
Cost saves from branch closures will benefit future earnings
•
High
level
of
investment
in
branches,
technology
and
advertising
in
new
markets
•
2008 stock-based incentive plan has fully vested
•
Impact of rising rates on Mortgage Banking will be muted ($213k pre-tax gain in
first six months -
$126k after-tax or less than 1 cent per share)
•
Dodd-Frank impact on debit card income exceeds 1 cent per share each quarter
at present
•
Revenue generation being studied across business lines
•
Process analysis of all divisions, increasing efficiency as we build capacity
•
Opportunities for additional cost reductions in facilities maintenance, technology
and work flow
•
CT cross selling and on-boarding of customers will continue, market
demographics favorable to Western Massachusetts
Profitability Continues to Evolve
Profitability and Efficiency Improvements Underway |
 Shift Toward
Bank-Like Mix for Loans Total Loans $1,860
QTD Yield 4.61%
Total Loans $825
QTD Yield 6.24% |
 Commercial Real
Estate Portfolio Analysis* *In millions
•
CRE concentration= 244%
•
36% Owner Occupied
8 |
 Diversified
Construction and C&I Mix Total Commercial Construction Loans: $67 million
4% of Overall Loan Portfolio
Total C&I Loans: $305 million
9
$25 |
 Asset
Quality-Non Performing Loans 10 |
 Asset Quality
- Net Charge-Offs
11 |
 Deposit Mix as
of June 30, 2013 (in millions)
Total Deposits $1,925, 62% Core Deposits
QTD Cost of Deposits 0.60%
Deposit Mix as of December 31, 2007
(in millions)
Total Deposits $719, 52% Core Deposits
QTD Cost of Deposits 3.11%
12
Strong and Balanced Deposit Base with 38% Reliance on CDs |
 5 YR
CAGR = EPS 26.1%, Core Net Income 24.0% (1)
13
(1)
Please refer to appendix for the reconciliation of GAAP and non-GAAP results.
|
 Quarterly Core EPS and Net Income
(1)
14
(1)
Please refer to appendix for the reconciliation of GAAP and non-GAAP results.
|
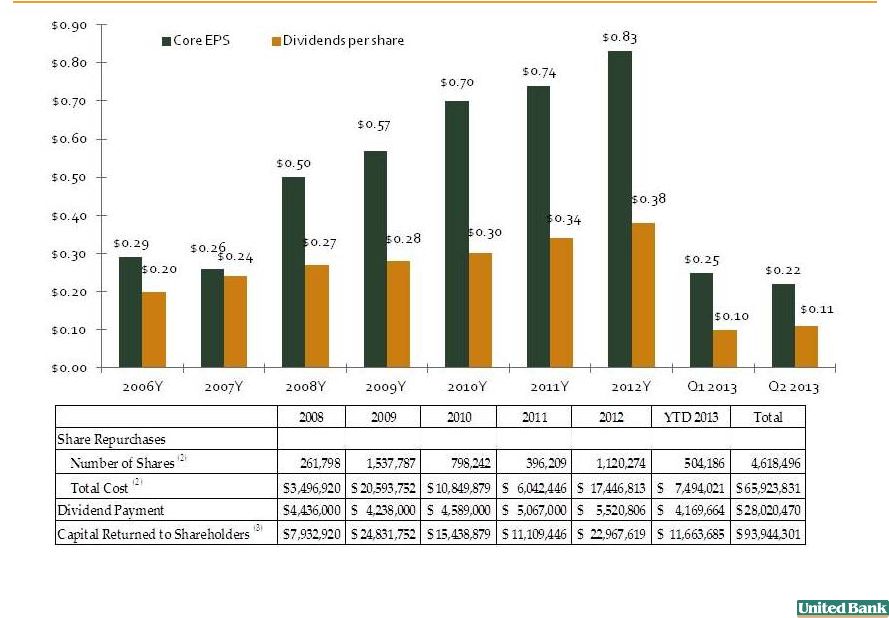 Dividend
History & Share Buybacks (1)
(1)
Please refer to appendix for the reconciliation of GAAP and non-GAAP
results (2)
Includes ESOP Plan Termination Share Repurchases in Q4 2012
(3)
Total capital returned to shareholders exceeded net income
15 |
 Financial
Performance (1)
2007
2008
2009
2010
2011
2012
Q1 2013
Q2 2013
Earnings Data (in mm except EPS):
Core Net Income
4.4
$
8.1
$
8.7
$
10.9
$
11.2
$
12.8
$
5.2
$
4.3
$
Core Earnings Per Share
$0.26
$0.50
$0.57
$0.70
$0.74
$0.83
$0.25
$0.22
Net Interest Income
29.2
$
39.8
$
41.0
$
52.9
$
52.8
$
56.2
$
20.5
$
19.7
$
Provision for Loan Losses
1.4
1.8
3.0
2.3
3.2
3.1
1.0
0.9
Normalized Non-interest Income
5.7
6.6
8.7
8.7
9.3
10.8
2.8
2.8
Normalized Non-interest Expenses
26.0
30.7
33.5
42.7
44.1
46.6
15.2
15.7
Profitability Data and Ratios:
Average Earning Assets (mm)
$1,001
$1,147
$1,208
$1,448
$1,504
$1,893
$2,218
$2,230
Net Interest Margin
2.91%
3.47%
3.39%
3.65%
3.51%
3.43%
3.70%
3.53%
Efficiency Ratio
74.02%
66.16%
68.49%
69.55%
71.08%
70.49%
65.34%
69.93%
Asset Quality:
Non-performing Assets/Total Assets
0.25%
0.46%
1.16%
0.69%
0.65%
0.72%
0.64%
0.65%
Allowance for Loan Losses/ Total Loans
(excluding purchased loans)
0.94%
0.95%
1.07%
1.18%
1.17%
1.05%
1.04%
1.03%
Net Charge-offs/Total Average Loans
0.12%
0.15%
0.23%
0.13%
0.19%
0.18%
0.07%
0.11%
Capital:
Tangible Equity/Tangible Assets
20.95%
18.03%
14.13%
13.54%
13.53%
11.15%
11.00%
10.62%
Tangible Book Value Per Share
12.73
$
13.01
$
12.93
$
13.30
$
13.90
$
13.04
$
13.15
$
13.00
$
Dividends Per Share
0.24
$
0.27
$
0.28
$
0.30
$
0.34
$
0.38
$
0.10
$
0.11
$
Period End Stock Price
11.10
$
15.14
$
13.11
$
15.27
$
16.09
$
15.72
$
15.20
$
15.15
$
(1)
Please refer to the appendix for the reconciliation of GAAP and non-GAAP
results. 16 |
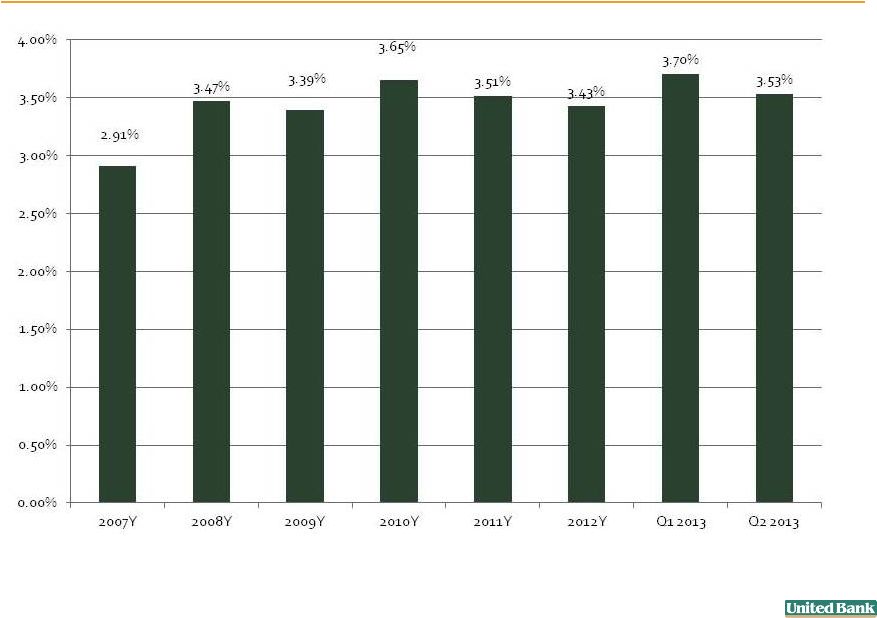 Net Interest
Margin 17 |
 Efficiency
Ratio (1)
18
(1)
Please refer to the appendix for the reconciliation of GAAP and non-GAAP
results. |
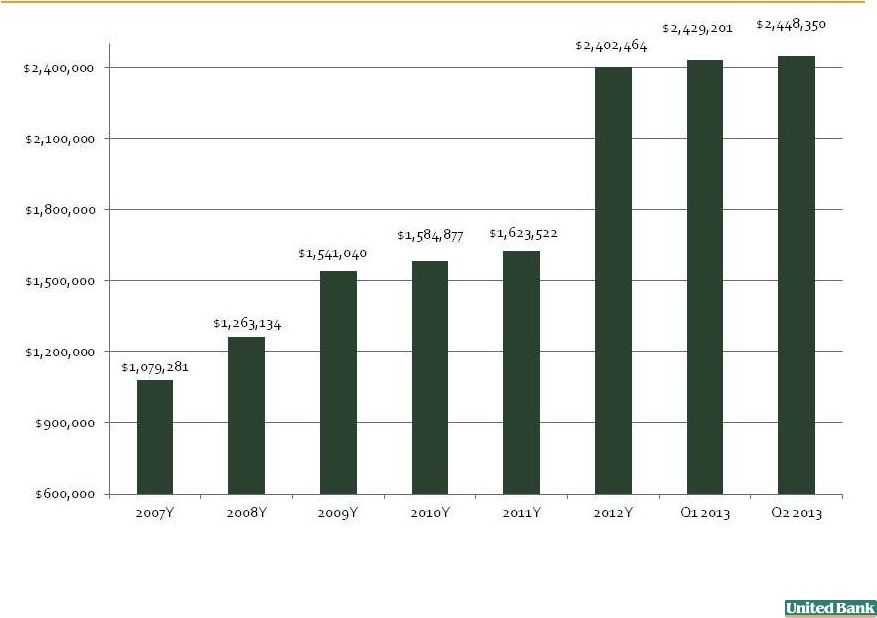 Total Assets
(2007 – Q2 2013 CAGR = 16.1%)
19 |
 Tangible
Equity/Tangible Assets (1)
20
(1)
Please refer to the appendix for the reconciliation of GAAP and non-GAAP
results. |
 Summary
– Why Invest In UBNK?
21
Experienced management team focused on creating shareholder value
•
Superior
return
on
your
investment:
CAGR
5.9%
vs.
S&P
CAGR
3.5%
August
2005
–
June
2013
(excl.
dividends)
•
Good track record of increasing dividends (quarterly dividends increased 120% since February
2006) •
Increased quarterly cash dividend by 10% to $0.11 per share in April, 2013
Effective capital management strategies
•
Successful stock repurchase program (acquired 4.6 million shares
at an average price of $14.27 since June 2008)
•
Competitive dividend yield (2.8% as of 07/19/13)
•
Repurchased 67% of authorized shares under October 2012 repurchase program
Prudent
Deployment
of
Excess
Capital
to
Increase
Franchise
Value
through
Strategic
Transactions
•
Acquisition of CNB Financial in November 2009
•
Acquisition of New England Bancshares in November 2012
•
New loan production offices: Beverly, MA (2011) and Glastonbury,
CT (Q3 2012)
•
New branch opened in Northborough, MA (December 2012)
Remain Well Capitalized (TCE ratio of 10.6%)
•
Ability and capacity to continue to execute capital deployment strategies
•
Well positioned for organic and strategic growth opportunities
Strong Asset quality
•
Largest seven NPLs comprise 35% of 06/30/12 total (workout strategies in place)
•
85%
of Investment portfolio is agency backed |
 Appendix
22 |
 Reconciliation
of GAAP and Non-GAAP Results 23
Mar. 31
Jun. 30
Sep. 30
Dec. 31
Mar. 31
Jun. 30
($ in thousands)
2012
2012
2012
2012
2013
2013
Non-Interest Income (GAAP)
2,573
$
2,570
$
2,511
$
2,969
$
2,798
$
3,015
$
Cost Basis Gain on Venture Capital Investment
-
-
-
-
-
(200)
Other Than Temporary Impairment Charge
-
-
202
-
-
-
Normalized Non-Interest Income
(Non-GAAP) 2,573
2,570
2,713
2,969
2,798
2,815
Non-Interest Expense (GAAP)
11,275
11,468
11,192
22,305
15,850
16,269
Acquisition Costs
-
(592)
(366)
(3,994)
(158)
(123)
Branch Closing Expenses
-
-
-
-
(510)
(477)
ESOP Plan Termination
-
-
-
(4,482)
-
-
FHLBB Prepayment Penalty
-
-
-
(207)
-
-
Special FDIC Insurance Assessment
-
-
-
-
-
-
Normalized Non-Interest Expense
(Non-GAAP) 11,275
10,876
10,826
13,622
15,182
15,669
Net Income (GAAP)
2,849
2,582
2,929
(4,732)
4,701
4,049
Adjustments to GAAP Net Income:
Other Than Temporary Impairment Charge
-
-
202
-
-
-
Cost Basis Gain on Venture Capital
Investment -
-
-
-
-
(200)
Acquisition Costs
-
592
366
3,994
158
123
Branch Closing Costs
-
-
-
-
510
477
ESOP Plan Termination
-
-
-
4,482
-
-
FLHBB Prepayment Penalty
-
-
-
207
-
-
Special FDIC Assessment
-
-
-
-
-
-
Income Tax Effect - All Items
-
-
(195)
(465)
(214)
(119)
Normalized Net Income (Non-GAAP)
2,849
3,174
3,302
3,486
5,155
4,330
Per Share Data:
Diluted earnings per share (GAAP)
0.19
$
0.17
$
0.20
$
(0.28)
$
0.23
$
0.20
$
Diluted earnings per share (Non-GAAP)
0.19
$
0.21
$
0.22
$
0.20
$
0.25
$
0.22
$
Performance Ratios (annualized):
Return on average assets (GAAP)
0.70%
0.62%
0.71%
(0.93)%
0.78%
0.67%
Return on average assets (Normalized)
0.70%
0.77%
0.80%
0.68%
0.86%
0.72%
Return on average equity (GAAP)
5.00%
4.53%
5.10%
(7.00)%
6.13%
5.32%
Return on average equity (Normalized)
5.00%
5.57%
5.75%
5.15%
6.73%
5.69%
Efficiency ratio (GAAP)
72.44%
73.04%
69.74%
117.84%
68.22%
72.61%
Efficiency ratio (Normalized)
72.44%
69.27%
67.46%
71.97%
65.34%
69.93%
At or For the Quarters Ended |
 Reconciliation
of GAAP and Non-GAAP Results 24
Mar. 31
Jun. 30
Sep. 30
Dec. 31
Mar. 31
Jun. 30
($ in thousands)
2012
2012
2012
2012
2013
2013
Total Loans (Gross)
1,139,344
$
1,162,356
$
1,218,007
$
1,816,076
$
1,839,331
$
1,860,760
$
Acquired Loans
(136,393)
(126,394)
(118,611)
(659,614)
(611,250)
(583,553)
Purchased Loans (GE Loans)
(18,284)
(6,443)
(6,348)
(5,021)
(4,913)
(4,837)
Total Loans (Non-GAAP)
984,667
1,029,519
1,093,048
1,151,441
1,223,168
1,272,370
Total Equity
227,248
228,129
230,163
307,189
306,355
300,319
Goodwill
(8,192)
(8,192)
(8,192)
(39,852)
(39,585)
(40,663)
Other Intangible Assets
(712)
(741)
(699)
(4,514)
(4,387)
(4,304)
Tangible Equity (Non-GAAP)
218,344
219,196
221,272
262,823
262,383
255,352
Total Assets
1,660,198
1,653,626
1,683,684
2,402,303
2,429,201
2,448,350
Goodwill
(8,192)
(8,192)
(8,192)
(39,852)
(39,585)
(40,663)
Other Intangible Assets
(712)
(741)
(699)
(4,514)
(4,387)
(4,304)
Tangible Assets (Non-GAAP)
1,651,294
1,644,693
1,674,793
2,357,937
2,385,229
2,403,383
Asset Quality:
Allowance for Loan Losses/Total Loans
0.99%
1.01%
1.03%
0.67%
0.69%
0.70%
Allowance for Loan Losses/Total Loans excl. Purchased Loans
1.15%
1.14%
1.15%
1.05%
1.04%
1.03%
Capital:
Total Equity/Total Assets
13.69%
13.80%
13.67%
12.79%
12.61%
12.27%
Tangible Equity/Tangible Assets
13.22%
13.33%
13.21%
11.15%
11.00%
10.62%
Book Value Per Share
14.57
$
14.70
$
14.88
$
15.24
$
15.36
$
15.28
$
Tangible Book Value Per Share
14.00
$
14.12
$
14.31
$
13.04
$
13.16
$
13.00
$
At or For the Quarters Ended |
 Reconciliation
of GAAP and Non-GAAP Results 25
($ in thousands)
2006
2007
2008
2009
2010
2011
2012
Non-Interest Income (GAAP)
5,392
5,735
5,220
8,676
8,716
9,343
10,623
Cost Basis Gain on Venture Capital Investment
-
-
-
-
-
-
-
Other Than Temporary Impairment
Charge -
-
1,377
-
-
-
202
Normalized Non-Interest Income
(Non-GAAP) 5,392
5,735
6,597
8,676
8,716
9,343
10,825
Non-Interest Expense (GAAP)
24,036
26,039
30,690
36,858
43,841
44,062
56,240
Acquisition Costs
-
-
-
(2,863)
(1,148)
-
(4,952)
Branch Closing Costs
-
-
-
-
-
-
-
ESOP Plan Termination
-
-
-
-
-
-
(4,482)
FHLBB Prepayment Penalty
-
-
-
-
-
-
(207)
Special FDIC Insurance Assessment
-
-
-
(538)
-
-
-
Normalized Non-Interest Expense
(Non-GAAP) 24,036
26,039
30,690
33,458
42,693
44,062
46,599
Net Income (GAAP)
4,924
4,377
7,298
5,806
10,032
11,184
3,628
Adjustments to GAAP Net Income:
Other Than Temporary Impairment Charge
-
-
1,377
-
-
-
202
Cost Basis Gain on Venture
Capital Investment -
-
-
-
-
Acquisition Costs
-
-
-
2,863
1,148
-
4,952
Branch Closing Costs
-
-
-
-
-
-
-
ESOP Plan Termination
-
-
-
-
-
-
4,482
FLHBB Prepayment Penalty
-
-
-
-
-
-
207
Special FDIC
Assessment -
-
-
538
-
-
-
Income Tax Effect - All
Items -
-
(527)
(556)
(329)
-
(660)
Normalized Net Income (Non-GAAP)
4,924
4,377
8,148
8,650
10,851
11,184
12,811
Per Share Data:
Diluted earnings per share (GAAP)
0.29
$
0.26
$
0.44
$
0.38
$
0.65
$
0.74
$
0.24
$
Diluted earnings per share (Non-GAAP)
0.29
$
0.26
$
0.50
$
0.57
$
0.70
$
0.74
$
0.83
$
Performance Ratios (annualized):
Return on average assets (GAAP)
0.51%
0.42%
0.62%
0.46%
0.65%
0.70%
0.21%
Return on average assets (Normalized)
0.51%
0.42%
0.69%
0.68%
0.71%
0.70%
0.73%
Return on average equity (GAAP)
3.59%
2.99%
3.23%
2.67%
4.49%
4.94%
1.51%
Return on average equity (Normalized)
3.59%
2.99%
3.60%
3.97%
4.85%
4.94%
5.34%
Efficiency ratio (GAAP)
72.95%
74.02%
66.16%
75.45%
71.42%
71.08%
85.08%
Efficiency ratio (Normalized)
72.95%
74.02%
66.16%
68.49%
69.55%
71.08%
70.49%
At or For the Years Ended December 31, |
 Reconciliation
of GAAP and Non-GAAP Results 26
($ in thousands)
2006
2007
2008
2009
2010
2011
2012
Total Loans (Gross)
762,113
824,695
870,276
1,122,241
1,074,111
1,121,879
1,816,076
Acquired Loans
-
-
-
(242,930)
(209,785)
(148,925)
(659,614)
Purchased Loans (GE Loans)
-
-
-
(22,655)
(21,448)
(19,066)
(5,021)
Total Loans (Non-GAAP)
762,113
824,695
870,276
856,656
842,878
953,888
1,151,441
Total Equity
137,711
226,120
227,714
225,246
222,576
227,361
307,189
Goodwill
-
-
-
(7,844)
(8,192)
(8,192)
(39,852)
Other Intangible Assets
-
-
-
(927)
(976)
(752)
(4,514)
Tangible Equity (Non-GAAP)
137,711
226,120
227,714
216,475
213,408
218,417
262,823
Total Assets
1,009,433
1,079,281
1,263,134
1,541,040
1,584,877
1,623,522
2,402,303
Goodwill
-
-
-
(7,844)
(8,192)
(8,192)
(39,852)
Other Intangible Assets
-
-
-
(927)
(976)
(752)
(4,514)
Tangible Assets (Non-GAAP)
1,009,433
1,079,281
1,263,134
1,532,269
1,575,709
1,614,578
2,357,937
Asset Quality:
Allowance for Loan Losses/Total Loans
0.95%
0.94%
0.95%
0.82%
0.93%
0.99%
0.67%
Allowance for Loan Losses/Total Loans excl. Purchased Loans
0.95%
0.94%
0.95%
1.07%
1.18%
1.17%
1.05%
Capital:
Total Equity/Total Assets
13.65%
20.95%
18.03%
14.62%
14.04%
14.00%
12.79%
Tangible Equity/Tangible Assets
13.65%
20.95%
18.03%
14.13%
13.54%
13.53%
11.15%
Book Value Per Share
8.03
$
12.73
$
13.01
$
13.38
$
13.82
$
14.47
$
15.24
$
Tangible Book Value Per Share
8.03
$
12.73
$
13.01
$
12.93
$
13.30
$
13.90
$
13.04
$
At or For the Years Ended December 31, |
 Thank you.
27 |