Attached files
| file | filename |
|---|---|
| 8-K - FORM 8-K - OCEANFIRST FINANCIAL CORP | d566737d8k.htm |
 OceanFirst Financial Corp.
KEEFE, BRUYETTE & WOODS
KEEFE, BRUYETTE & WOODS
COMMUNITY BANK INVESTOR CONFERENCE
COMMUNITY BANK INVESTOR CONFERENCE
JULY 30, 2013
JULY 30, 2013
Exhibit 99.1
NASDAQ: OCFC 1
|
 OceanFirst Financial Corp.
Forward Looking Statements:
This presentation contains certain forward-looking statements within the
meaning of the Private Securities Reform Act of 1995 which are based on
certain assumptions and describe future plans, strategies and expectations
of the Company. These forward-looking statements are generally
identified by use of the words "believe," "expect,"
"intend," "anticipate," "estimate," "project," "will,"
"should," "may," "view," "opportunity,"
"potential," or similar expressions or expressions of confidence.
The Company's ability to predict results or the actual effect of
future plans or strategies is inherently
uncertain. Factors which could have a material adverse effect on the
operations of the Company and its subsidiaries include, but are not limited
to, changes in interest rates, general economic conditions, levels of
unemployment in the Bank’s lending area, real estate market values in the Bank’s lending
area, the level of prepayments on loans and mortgage-backed securities,
legislative/regulatory changes, monetary and fiscal policies of the U.S.
Government including policies of the U.S. Treasury and the Board of
Governors of the Federal Reserve System, the quality or composition of the loan or
investment portfolios, demand for loan products, deposit flows, competition, demand
for financial services in the Company's market area and accounting
principles and guidelines. These risks and uncertainties are further
discussed in the Company’s Annual Report on Form 10-K for the year ended
December 31, 2012 and should be considered in evaluating forward-looking
statements and undue reliance
should
not
be
placed
on
such
statements.
The
Company
does
not
undertake
-
and
specifically
disclaims
any
obligation
-
to
publicly
release
the
result
of
any
revisions
which
may
be
made to any forward-looking statements to reflect events or circumstances after
the date of such statements or to reflect the occurrence of anticipated or
unanticipated events. NASDAQ: OCFC 2 |
 111
Years of Growth and Capital Management 111 Years of Growth and Capital
Management Founded in Point Pleasant, NJ, in 1902, OceanFirst has grown from a
small one-town savings and loan to a full-service community bank
serving the Central New Jersey shore. Rebuilt capital through the Great
Recession with retained earnings and completion of a
follow-on common stock offering in November 2009.
OceanFirst
issued
stock
for
the
first
time
in
1996
and
over
the
ensuing
years
generated
value
for
shareholders,
largely
through
the
successful
implementation
and
execution
of
our
community
bank
model,
and
the
strategic
repurchase
of
62.4%
of
original
IPO
shares.
2011 and 2012 share repurchase plans begin the redeployment of the excess capital
rebuilt since 2008. Under the current authorization, 519,823 shares
remain available for repurchase. NASDAQ: OCFC 3 |
 NASDAQ: OCFC
Community Bank serving the Central
Jersey Shore -
$2.3 billion in assets
and 25 branch offices
Market Cap $308 million (as of
July 24, 2013)
Core deposit funded –
87.5%
of total
deposits
Locally originated loan portfolio with
no brokered loans
Residential and commercial
mortgages
Consumer equity loans and lines
C&I loans and lines
Corporate Profile
Corporate Profile
Note: See Appendix 1 for Market Demographic information.
Philadelphia
New York
Ocean
Burlington
Morris
Sussex
Atlantic
Salem
Warren
Monmouth
Hunterdon
Cumberland
Bergen
Mercer
Somerset
Middlesex
Gloucester
Camden
Passaic
Cape May
Essex
Union
Hudson
NASDAQ: OCFC 4
|
 Experienced Executive Management Team
Substantial
insider
ownership
of
27.3%
–
aligned
with
shareholders’
interest
OceanFirst Bank ESOP 10.5%
Directors & Senior Executive Officers 9.7% (CEO 5.7%)
Director and Proxy Officer Stock Ownership Guidelines
OceanFirst Foundation 7.1%
Succession
planning
refreshed
in
2013
–
new
President
recruited
and
2 new
Executive
Vice
Presidents
promoted*
As of the March 12, 2013 proxy
record date.
Name
Position
# of Years in
Banking
# of Years
at OCFC
John R. Garbarino
Chairman, Chief Executive Officer
42
42
Christopher D. Maher
President, Chief Operating Officer
25
-
Michael J. Fitzpatrick
Executive Vice President, Chief Financial Officer
31
20
Joseph R. Iantosca
*Executive Vice President, Chief Administrative Officer
35
9
Joseph J. Lebel III
*Executive Vice President, Chief Lending Officer
29
7
NASDAQ: OCFC 5
|
 Our
Strategy Our Strategy
Positioned as the leading Community Bank in attractive Central
Jersey
Shore
market
–
growing
revenue
and
creating
additional
value for our shareholders
Offering a full range of consumer and commercial banking products
generating diversified income streams
Guarding
credit
quality
in
ALL
business
cycles
Transitioning the balance sheet with emphasis on core deposit
funding and commercial lending growth
On the watch for roll-up opportunities presented by in-market
“regulatory fatigued”
competitors
NASDAQ: OCFC 6
|
 Substantial Primary Market Deposit Share
Source: FDIC
NASDAQ: OCFC 7
June 30, 2012
# of
Dep. In Mkt.
Mkt. Shr.
Rank
Institution
Branches
($000)
(%)
Ocean County, NJ
1
Hudson City Bancorp Inc. (NJ)
14
2,610,613
18.65
2
Wells Fargo Bank NA (CA)
26
2,360,712
16.87
3
TD Bank, National Association (Canada)
21
2,149,131
15.36
4
OceanFirst Financial Corp. (NJ)
19
1,477,780
10.56
5
Banco Santander S.A. (Spain)
25
1,321,262
9.44
6
Bank of America Corp. (NC)
22
1,161,899
8.30
7
Investors Bancorp Inc. (MHC) (NJ)
8
654,369
4.68
8
PNC Financial Services Group (PA)
14
436,177
3.12
9
Manasquan Savings Bank (NJ)
3
252,922
1.81
10
JPMorgan Chase Bank, National Association (OH)
10
230,732
1.65
Total For Institutions In Market
200
13,996,221 |
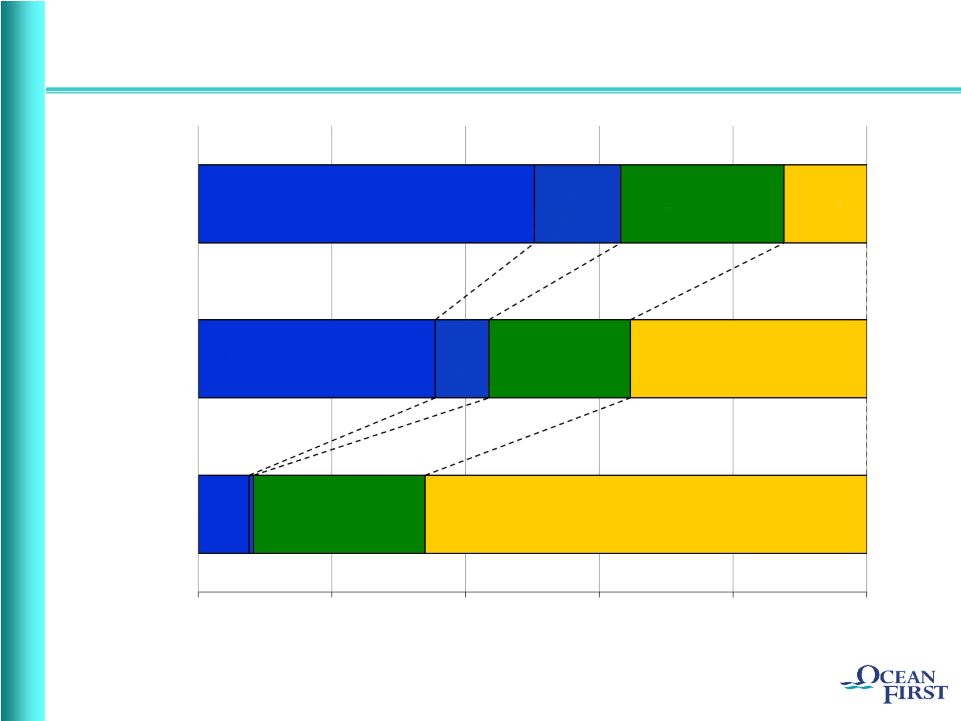 Strategic Deposit Composition Transition
Time
Deposits
MMDA & Savings
Non-
Interest
Checking
Interest Checking
Interest Checking
Non-
Interest
Checking
MMDA & Savings
Time Deposits
Interest
Checking
MMDA & Savings
Time Deposits
June 2013
Dec 2007
Dec 1996
0%
20%
40%
60%
80%
100%
NASDAQ: OCFC 8
|
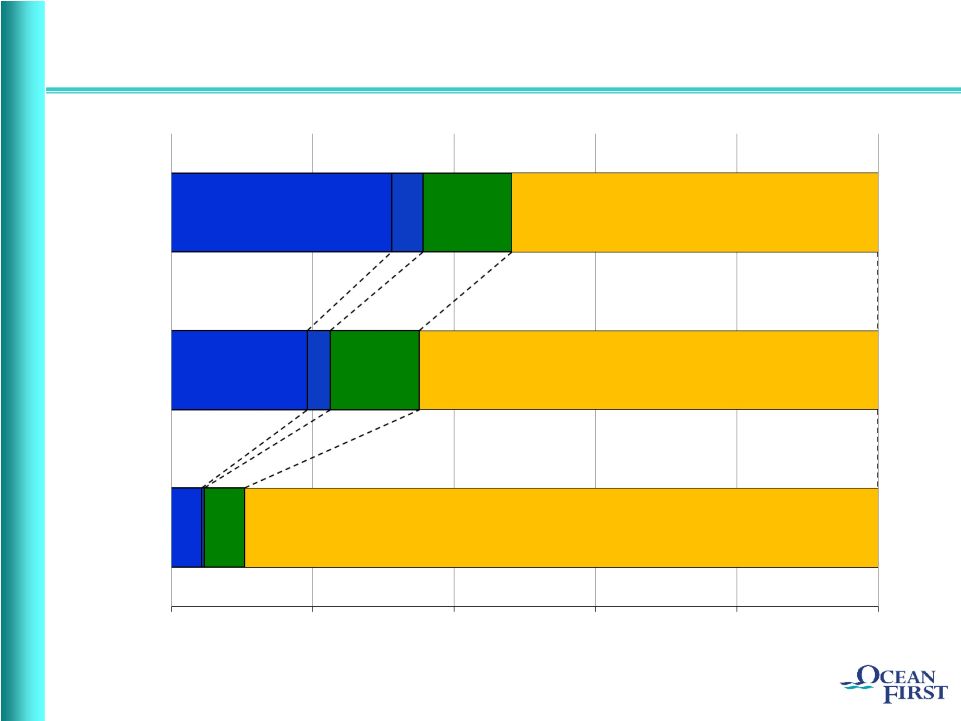 Strategic Loan Composition Transition
C&I
CRE
CRE
C&I
Consumer &
Other
CRE
Consumer &
Other
Residential R.E.
Residential R.E.
Residential R.E.
June 2013
Dec 2007
Dec 1996
0%
20%
40%
60%
80%
100%
NASDAQ: OCFC 9
Consumer &
Other |
 Earnings
per
share
of
$0.29
–
ROE
of
9.1%
Net interest margin stabilized, growing to 3.21%, from 3.16%
Grew commercial loan portfolio and increased the commercial loan
pipeline by $19.9 million, or 69%
Credit quality stabilizing with NPL’s decreasing $1.5 million and net
charge-offs decreasing $642,000
Strong
capital
position
–
tangible
common
equity
of
9.4%
of
assets
Returning
Excess
Capital
–
314,961
shares
repurchased
YTD
Highlights –
Highlights –
Second Quarter 2013
Second Quarter 2013
NASDAQ: OCFC
10 |
 Stabilized NPL’s in a Diversified Portfolio
Non-performing loan (“NPL”).
Data as of December 31, unless otherwise noted.
(A)
Increase traceable to superstorm Sandy.
Exposure
Primarily
in
Lower
Risk
Residential
$3.7M
Sandy Impact
(A)
3.50%
3.00%
2.50%
2.00%
1.50%
1.00%
0.50%
0.00%
2009
2010
2011
2012
6/30/2013
Residential
Consumer
Commercial Real Estate and Construction
Commercial
NASDAQ: OCFC
11 |
 Prudently Provisioning for Credit Costs
$0
$1
$2
$3
$4
$5
$6
$7
$8
$9
$10
Recoveries
Residential & Consumer C/O's
Commercial C/O's
Provision for Loan Losses
$1.8M
Sandy
Impact
(A)
12/31/09
12/31/10
12/31/11
(1)
12/31/12
6/30/13
(Annualized)
(1)
Increase in charge-offs was primarily due to a change in the Company’s charge-off policy
to recognize the charge-off when the loan is deemed uncollectible rather than when the
foreclosure process is complete. The additional charge-off relating to the change in
policy through 2011 was $5.7 million, all of which was previously specifically reserved for by the Company.
(A)
Increase attributable to superstorm Sandy.
NASDAQ: OCFC
12 |
 Net
Interest Margin Net Interest Margin
Stabilizing
After
Two-Year
Decline
2009
2010
2011
2012
2013
3.90%
3.80%
3.70%
3.60%
3.50%
3.40%
3.30%
3.20%
3.10%
3.00%
2.90%
2.80%
NASDAQ: OCFC 13 |
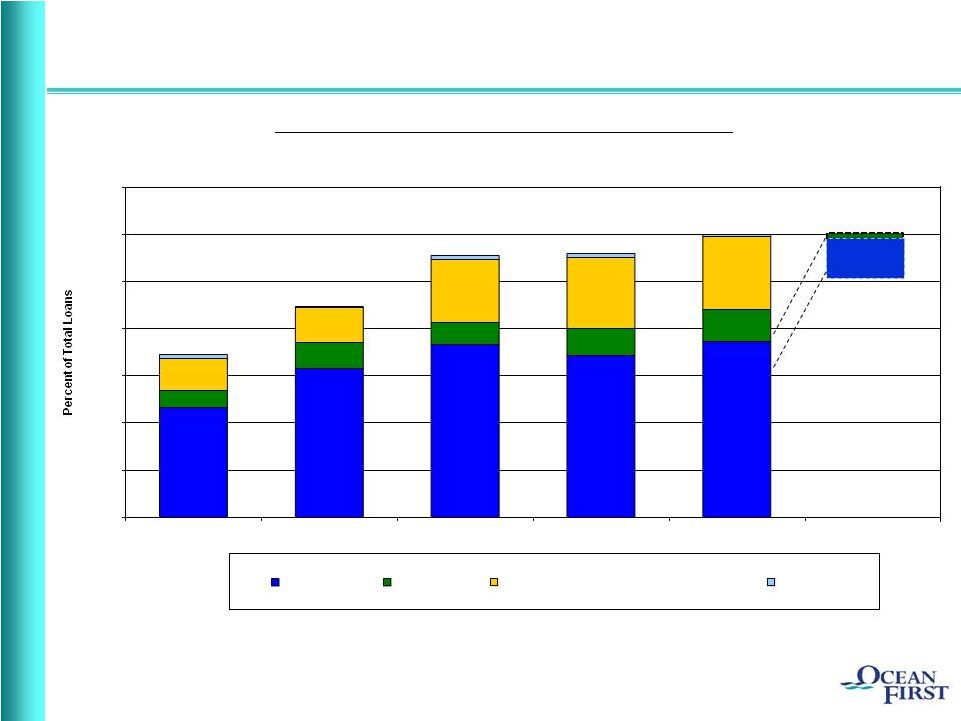
 Diversified Streams of Non-Interest Income
Non-Interest Income excludes gain/loss from other real estate operations, gain
on sale of equity securities and provision for repurchased loans.
$2.5M
$18.0M
Targeted
Growth
Areas
0.90%
0.80%
0.70%
0.60%
0.50%
0.40%
0.30%
0.20%
0.10%
0.00%
1996
6/30/13 (Annualized)
Fees and Service Charges
Other
Trust
Gain on Sale of Loans
BankCard Services
BOLI
Investment Services
NASDAQ: OCFC 14 |
 Generating Consistent Attractive Returns
0.0%
2.0%
4.0%
6.0%
8.0%
10.0%
12.0%
14.0%
2009
2010
2011
2012
6/30/13
(Annualized)
Return on Equity
Return on Assets
0.0%
0.20%
0.40%
0.60%
0.80%
1.00%
1.20%
1.40%
NASDAQ: OCFC 15 |
 Challenge Today is to Grow Revenue
Build Shareholder Value
Build Shareholder Value
Target growth within existing market –
increasing share
Fourteen
de
novo
branches
since
2000
have
performed
well
–
still
present
opportunity for additional growth
Expanding presence in Monmouth County with the Red Bank Financial
Solutions Center opened in May
Opportunity
to
meet
extraordinary
loan
demand
–
Sandy
recovery
Non-interest income streams have been diversified, ever more important
as margin remains under pressure
Assessing opportunistic roll-up of community banks in market
Share repurchases safely return excess capital in the short term
Financial performance to Plan builds value and preserves the right to
remain independent
NASDAQ: OCFC 16 |
 (1)
Peers include: DCOM, FFIC, FLIC, HVB, LBAI, ORIT, PBNY, PGC, RCKB, SNBC,
SUBK, UVSP and WSFS Note:Financial data as of the most recent period
available; market data as of July 24, 2013. Source: Sandler
O’Neill. Peer Valuation Metrics
Peer Valuation Metrics
OCFC
Peers
(1)
Valuation
Price / Tang. Book Value
142%
148%
Price / LQA EPS
15.1x
16.4x
Price / Estimated EPS
15.8x
16.7x
Cash Dividend Yield
2.7%
2.6%
NASDAQ: OCFC 17 |
 Why
OCFC…? Why OCFC…?
Fundamental
franchise
value
–
superior
market
demographics
Crisis tested management team
Sandy response and experience
Substantial
insider
ownership
–
aligned
with
shareholders
Succession planning refreshed
Attractive deposit mix and market share
Conservative credit culture and profile
Solid
financial
performance
–
developing
shareholder
value
Strong balance sheet and capital base
NASDAQ: OCFC 18 |
 THANK YOU
FOR YOUR INTEREST IN
FOR YOUR INTEREST IN
OCEANFIRST FINANCIAL CORP.
OCEANFIRST FINANCIAL CORP.
NASDAQ: OCFC 19 |
 Market Demographics
APPENDIX 1
Ocean
Monmouth
Middlesex
New Jersey
National
Number of Offices
19
4
1
% of OceanFirst Deposits
85.7
11.1
3.2
Market Rank
4
18
34
Market Share (%)
10.6
1.0
0.2
Population
578,728
649,429
794,605
Projected 2010-2015
Population Growth (%)
4.0
2.0
1.8
1.2
3.8
Median Household Income ($)
60,936
82,974
78,561
72,519
54,442
Projected 2010-2015 Median
Household Income Growth (%)
15.5
14.3
17.5
14.7
12.4
Deposit data as of June 30, 2012.
Demographic data as of June 30, 2010.
Source: SNL Financial
NASDAQ: OCFC
20 |
 One-to-Four Family (1-4)
Average size of mortgage loans
$186,000
Interest-only loans - Amount
$35.3 million
- % of total 1-4 family loans
4.4%
- Weighted average loan-to-value ratio
(using original or most recent appraisal) 61%
Stated income loans - Amount
$42.2 million
- % of total 1-4 family
loans 5.3%
Portfolio weighted average loan-to-value ratio (using original or most recent appraisal)
56%
- Originated for the six months ended June 30,
2013 60%
Portfolio average FICO score
748
- Loans originated for the six months ended June
30, 2013 766
% of loans outside the New York/New Jersey market
4.4%
% of loans outside Ocean/Monmouth Counties
33.0%
% of loans exceeding agency conforming amounts
44.5%
% of loans for second homes
7.5%
APPENDIX 2
Residential Portfolio Metrics
Residential Portfolio Metrics
As of June 30, 2013, unless
otherwise noted.
NASDAQ: OCFC
21 |
 Commercial Real Estate (CRE)
Total portfolio
$477.6 million
Average size of CRE loans
$762,000
Largest CRE loan
$15.9 million
(Secured by local university dormitory housing)
Current Pipeline
$42.5 million
Weighted Average Yield
4.50%
Weighted Average Repricing Term
5.3 years
Total portfolio
$66.9 million
Average size of commercial loan
$273,000
Largest commercial loan
$4.6 million
Current Pipeline
$6.3 million
Weighted Average Yield
4.17%
Weighted Average Repricing Term
1.4 years
Commercial portfolio relationships total 383. APPENDIX 2
(Cont’d)
Commercial Portfolio Metrics
Commercial Portfolio Metrics
As of June 30, 2013.
(1)
(1)
(1)
Commercial Loans
NASDAQ: OCFC 22
|
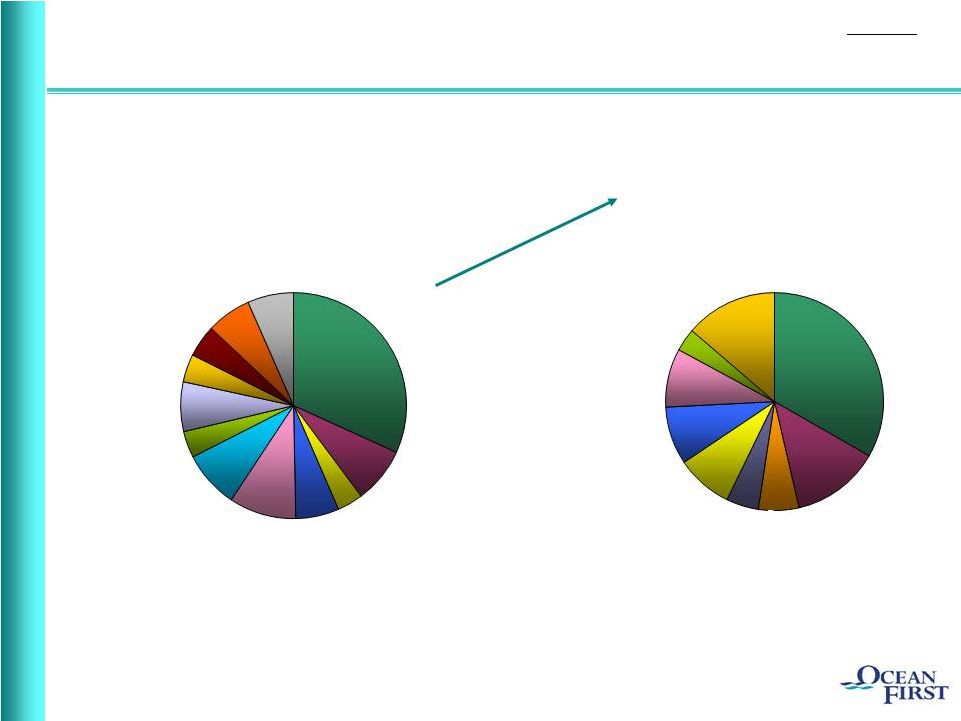 Commercial Portfolio Segmentation
Total Commercial Loan Exposure
by Industry Concentration
Real Estate Investment by
Property Concentration
As of June 30, 2013.
APPENDIX 2
(Cont’d)
Real Estate
Investment, 31.8%
Miscellaneous, 6.6%
Public
Administration, 6.4%
Educational Services,
4.6%
Manufacturing, 4.0%
Arts/Entertainment/
Recreation, 7.1%
Accommodations/
Food Services, 8.2%
Other Services, 3.8%
Healthcare, 9.6%
Wholesale Trade,
6.2%
Retail Trade, 3.7%
Construction, 8.0%
Miscellaneous, 13.7%
Multi-Family, 3.4%
Retail Store, 8.7%
Shopping Center, 8.6%
Commercial
Development, 8.4%
Land, 4.8%
Residential
Development, 6.0%
Industrial/
Warehouse, 13.1%
Office, 33.3%
NASDAQ: OCFC 23
|
 Impact of Superstorm Sandy
APPENDIX 3
Commercial loans as of June 30, 2013:
No adverse impact on portfolio quality.
Residential loans as of June 30, 2013:
Borrowers impacted by the storm
Principal Balance
Average Loan Size
Loan Status:
Loans repaid or brought current
Loan is 30-89 days delinquent
Loan is 90 days or more delinquent
Total
124
$30.1 million
$243,000
Borrowers
98
11
15
124
Balance (000’s)
$24,019
2,354
3,716
$30,089
Using conservative assumptions, specific impairments total $443,000. These
impairments are covered by a year-end provision of $1.8 million related to
the adverse impact of Sandy and expectation of increasing levels of
non-performing loans in the recovery period. NASDAQ: OCFC 24 |