Attached files
| file | filename |
|---|---|
| 8-K - FORM 8-K - MOSAIC CO | d574173d8k.htm |
 1
The Mosaic Company
Investor Presentation
Third Calendar Quarter, 2013
Exhibit 99.1 |
 2
Safe Harbor Statement
Safe Harbor
This presentation contains forward-looking statements within the meaning of the Private Securities
Litigation Reform Act of 1995. Such statements include, but are not limited to, statements
about future financial and operating results. Such statements are based upon the current
beliefs and expectations of The Mosaic Company’s management and are subject to significant
risks and uncertainties. These risks and uncertainties include but are not limited to the predictability and
volatility of, and customer expectations about, agriculture, fertilizer, raw material, energy and
transportation markets that are subject to competitive and other pressures and economic and
credit market conditions; the level of inventories in the distribution channels for crop
nutrients; changes in foreign currency and exchange rates; international trade risks; changes
in government policy; changes in environmental and other governmental regulation, including greenhouse gas
regulation, implementation of the numeric water quality standards for the discharge of nutrients into
Florida waterways or possible efforts to reduce the flow of excess nutrients into the
Mississippi River basin or the Gulf of Mexico; further developments in judicial or
administrative proceedings, or complaints that Mosaic’s operations are adversely impacting
nearby farms, business operations or properties; difficulties or delays in receiving, increased costs
of or challenges to necessary governmental permits or approvals or increased financial
assurance requirements; resolution of global tax audit activity; the effectiveness of the
Company’s processes for managing its strategic priorities; the ability of Mosaic,
Ma’aden and SABIC to agree upon definitive agreements relating to the prospective Northern
Promise joint venture, the final terms of any such definitive agreements, the ability of the
joint venture to obtain project financing in acceptable amounts and upon acceptable terms, the
future success of current plans for the joint venture and any future changes in those plans;
adverse weather conditions affecting operations in Central Florida or the Mississippi River basin or the Gulf
Coast of the United States, and including potential hurricanes, excess rainfall or drought; actual
costs of various items differing from management’s current estimates, including, among
others, asset retirement, environmental remediation, reclamation or other environmental
regulation, or Canadian resources taxes and royalties; brine inflows at Mosaic’s
Esterhazy, Saskatchewan, potash mine or other potash shaft mines; other accidents and disruptions
involving Mosaic’s operations, including potential mine fires, floods, explosions, seismic
events or releases of hazardous or volatile chemicals, as well as other risks and uncertainties
reported from time to time in The Mosaic Company’s reports filed with the Securities and
Exchange Commission. Actual results may differ from those set forth in the forward-looking
statements.
|
 3
Well positioned to benefit from projected positive long term fundamentals
Largest combined phosphate and potash player in the world
High quality assets
Scale
Geographically diverse
Leading position in premium products
Strong financial track record
Robust operating cash flows
Clearly outlined capital priorities
Experienced management team focused on execution and operational
excellence
Investment Highlights |
 The Food Story Remains
Compelling •
Pent up demand with 2012/13
US Corn exports down 54%
year-to-date
•
The likely case builds back
one-half of the inventory
drawdown this year
•
Agricultural commodity prices
likely to remain elevated in
2013/14
Considerations
607
579
494
406
469
462
426
437
514
570
548
536
502
350
400
450
500
550
600
650
00/01
02/03
04/05
06/07
08/09
10/11
12/13F
Mil Tonnes
World Grain & Oilseed Stocks
Historical
2013/14 Range
2013/14 Medium Scenario
USDA
Source: USDA and Mosaic
4
2013/14 Grain and Oilseed Scenario Assumptions
Low
Medium
High
Harvested Area Change
1.25%
1.50%
1.75%
Yield Deviation from Trend *
Largest Negative
0.00
Largest Positve
Demand Growth
2.50%
3.25%
3.75%
* Largest deviation from the 13-year trend 2000-2012 in MT HA |
 5
Limited
arable land
Mosaic’s Role in Feeding the World
Optimum use of crop nutrients is essential
to growing the food the world needs today
and tomorrow
Crop nutrients directly account for 40 to 60
percent of crop yields
World population is expected reach
9+ billion people by 2050*
* Source: IHS Global Insight
Need to
Improve
Yield
Population
Growth
Long-Term
Sustainability |
 6
Focused on Phosphate & Potash
Mosaic is in great position to be
the world’s leading crop nutrition company
Agriculture
Crop
Nutrition
Phosphate
& Potash
•
Attractive sector
•
Best business
within agriculture
•
Most compelling
nutrients |
 7
Top 4 Global Potash Producer
Potash: The Regulator
Obtained through underground or
solution mining
80 percent of reserves in Canada
and Russia
Over a century of reserves
10.7 million tonnes of operational
capacity
One of the largest potash producers
in the world
Potash expansions:
•
~$3 billion in capital, 3 million tonnes
•
On time, on scope, on budget
•
Delaying future 2 million tonne
projects
55-57
Source: Fertecon and Mosaic
0
10
20
30
40
50
60
95
96
97
98
99
00
01
02
03
04
05
06
07
08
09
10
11
12F
13F
Million tonnes KCL
World Muriate of Potash Shipments
China
North Am
Brazil
India
Indo/Malay
Other
Estimated long-term growth 2.5 to 3.5 percent |
 8
The Leading Global Phosphates Producer
Phosphate: The Energizer
Sedimentary and igneous
formations
Large economically viable reserves:
North Africa, Western China,
Central Florida and Russia
Largest producer of concentrated
phosphate crop nutrients with 12
percent of world capacity
Over 35 years of rock reserves
Low cost manufacturer
Premium products
Global distribution facilities
JV in Peru and announced
Saudi Arabia JV
63-65
Source: Fertecon and Mosaic
Estimated long-term growth 2.5 to 3.0 percent
0
10
20
30
40
50
60
70
95
96
97
98
99
00
01
02
03
04
05
06
07
08
09
10
11
12F
13F
Million tonnes
DAP/MAP/TSP
World Processed Phosphate Shipments
China
India
North Am
Brazil
Europe/FSU
Other |
 9
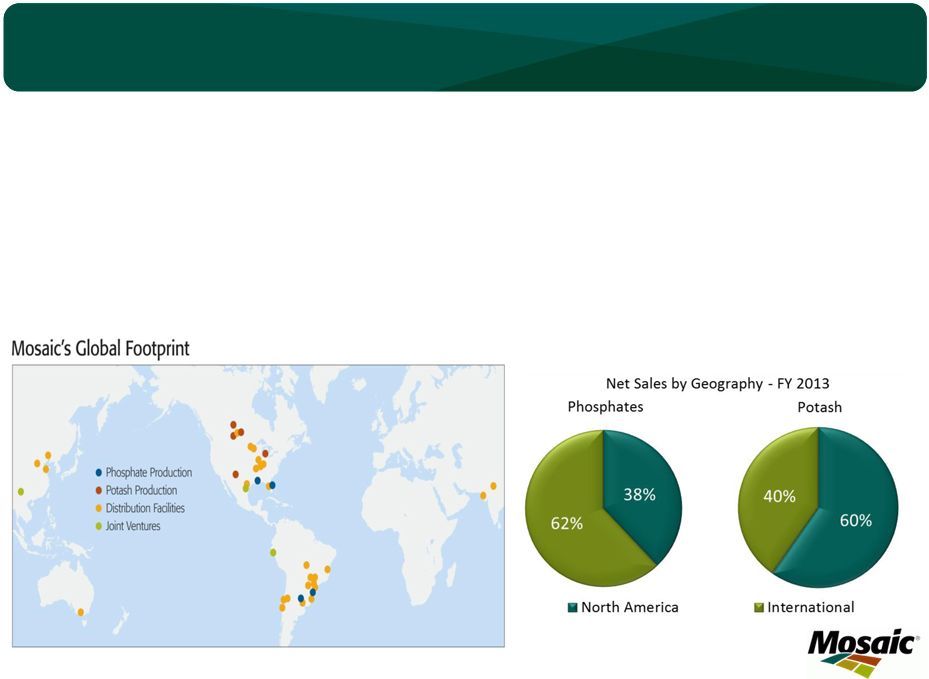
A Global Presence
•
Ship product to approximately 40 countries
•
Member of Canpotex and PhosChem
export associations
•
Balance seasonal demand to improve
operating efficiency
•
Market intelligence to improve decision
making
Mines and Chemical plants in stable
geopolitical regions
Global distribution capabilities with local
presence provides additional flexibility to
maximize cash flow generation: |
 10
MicroEssentials
®
Growth
Source: Mosaic
North America
Brazil
MicroEssentials
®
Share of Phosphate Sales (Fiscal Year)
1.7%
3.3%
5.5%
6.9%
9.3%
>10%
0%
2%
4%
6%
8%
10%
12%
2008
2009
2010
2011
2012
2013
0.7%
0.7%
1.7%
4.0%
5.0%
>6%
0%
1%
2%
3%
4%
5%
6%
7%
2008
2009
2010
2011
2012
2013 |
 11
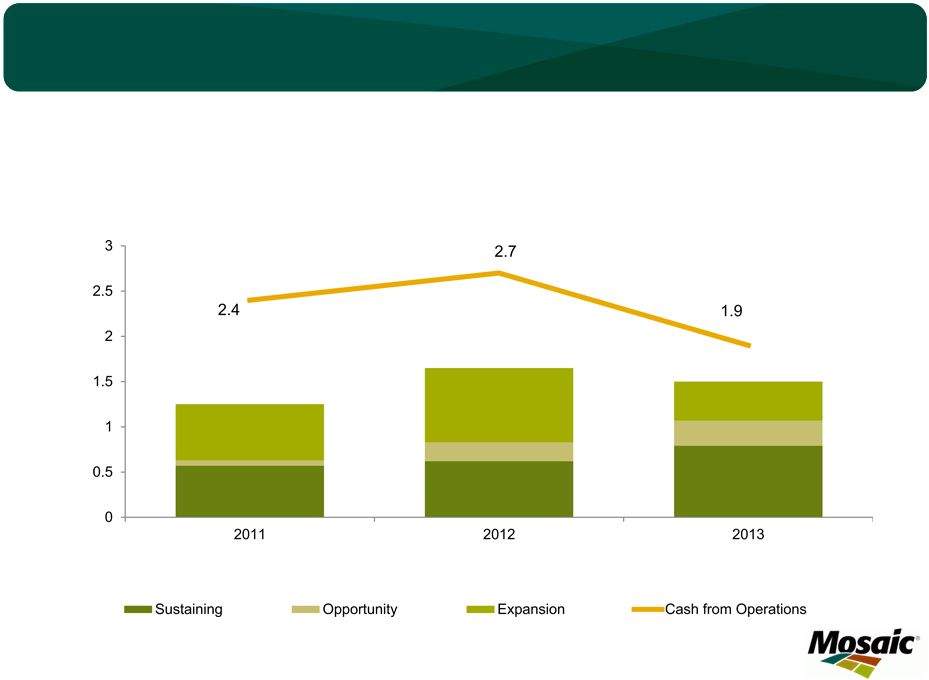
Operating Cash Flow vs. Investments
$ In Billions
CAPITAL EXPENDITURES
AND NET OPERATING CASH FLOW |
 12
Investing for Growth
The company expects to generate appropriate risk-adjusted
returns for each investment.
* Not fully approved investments
Calendar year
$ in billions
$0.0
$0.5
$1.0
$1.5
2013
2014
2015
2016
Potash Mines
Ma'aden JV
Ammonia Plant*
International & Supply Chain* |
 13
Surplus Cash & Capacity
*See additional detail on reconciliation at back of slides
$2 billion of Excess Cash
$3 billion of Debt Capacity
Share Repurchases
ARO Escrow
Strategic Investments |
 14
Our Strategic Priorities
People
Growth
Market Access
Innovation
Total Shareholder
Return |
 2013 –
A Year of Success!
New safety record
Potash expansions on track on budget
Benefits of tolling agreement reversion
Northern Promise JV (Saudi Arabia)
Continued
MicroEssentials
momentum
South Fort Meade productivity
AEIS –
a stepping stone to new permits
Strategic review completion and capital philosophy
rollout
Accomplishments
Focused on:
execution and
delivering results
15
® |
 16
Strategic Priority: Shareholder Value
Our TSR goal:
Top 3 among 10 global crop nutrient peers
Execute our
strategy
Deliver
strong value
Return
capital to
shareholders |
 Supplemental Mosaic Information |
 18
Potash Segment Highlights
In millions, except MOP price
Q4 FY13
Q3 FY13
Q4 FY12
Net sales
$1,031
$758
$1,037
Gross Margin
$489
$308
$514
Percent of net sales
47%
41%
50%
Operating earnings
$445
$216
$464
Sales volumes
2.6
1.8
2.0
Production volume
2.5
2.0
1.9
Production operating rate
95%
78%
85%
Avg MOP selling price
$368
$385
$455
1.
Net sales were roughly flat year over year as record potash sales volumes were
offset by lower realized prices. Decline in realized prices was driven
by both lower market prices for MOP, as well as higher mix of international
volumes which are mostly standard grade.
2.
Operating earnings decline was driven by lower realized prices, as well as higher
labor and depreciation expenses, partially offset by higher volumes.
Fourth quarter highlights: |
 19
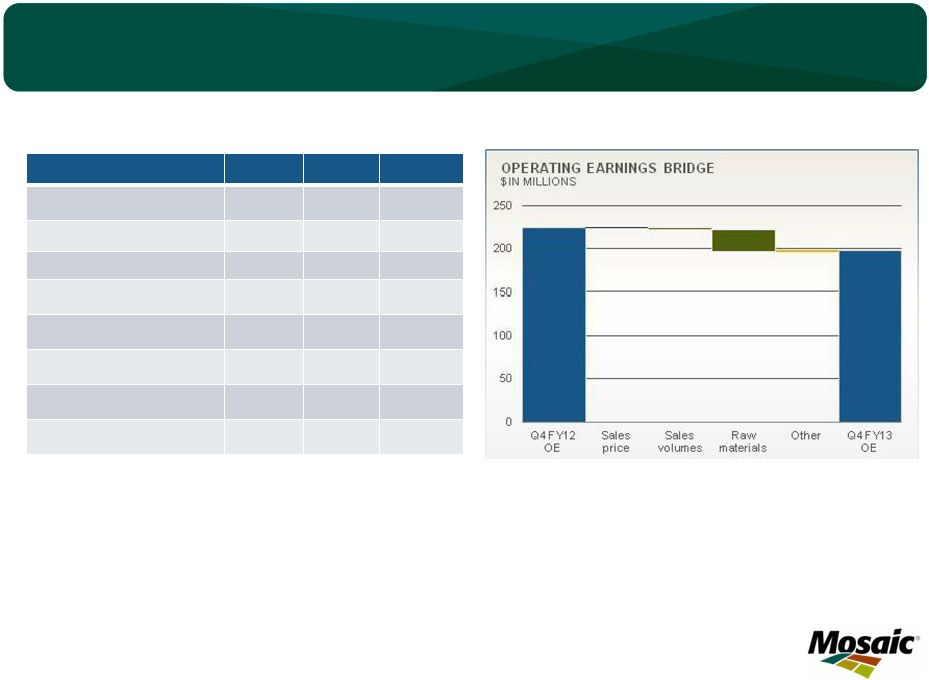
Phosphates Segment Highlights
In millions, except DAP price
Q4 FY13
Q3 FY13
Q4 FY12
Net sales
$1,670
$1,502
$1,789
Gross Margin
$290
$266
$322
Percent of net sales
17%
18%
18%
Operating earnings
$198
$197
$224
Sales volumes
2.9
2.6
2.9
NA
production
volume
2.1
2.1
2.1
Finished product operating rate
85%
87%
86%
Avg DAP selling price
$483
$496
$494
(a)
Includes crop nutrient dry concentrates and animal feed ingredients
Fourth quarter highlights:
1.
(a)
Gross margin and operating earnings decline was driven by lower realized prices,
higher ammonia costs and higher plant spending, partially offset by lower
phosphate rock and sulfur costs. |
 20
Category
Guidance –
Calendar Q3 2013
Potash
Q3
Sales
volume
1.8
–
2.1
million
tonnes
Q3
MOP
selling
price
$330
-
360
per
tonne
Q3 Gross margin rate in the mid to high 30
percent range
Q3 Operating rate below 75 percent
Turnaround days
Curtailing production at the Colonsay mine
Canadian Resource Taxes
and Royalties
$60 -
80 million
Brine Management
$50 -
60 million
Financial Guidance Summary |
 21
Category
Guidance –
Calendar Q3 2013
Phosphates
Q3
Sales
volume
2.9
–
3.3
million
tonnes
Q3
DAP
selling
price
$430
-
$465
per
tonne
Q3 Operating rate in the mid 80 percent range
Q3 Gross margin rate to be flat with last quarter
Corporate
Total SG&A –
Q3CY13
$95 -
105 million
CAPEX & Investments –
7 month
$900 million to $1.1 billion
Effective Tax Rate –
7 month
Mid 20-percent range, excluding notable items
Financial Guidance Summary |
 22
Potash Expansion
•
Expansions on time,
on budget
•
Postpone
indefinitely
remaining two
million tonne
expansions
0
2
4
6
8
10
12
14
2012
2013
2014
2015
2016
2017
2018
2019
2020
2021
FISCAL YEAR
CUMULATIVE CAPACITY ADDITIONS
MILLION TONNES
CONSTRUCTION IN PROGRESS
REVERSION OF TOLLING AGREEMENT
EXISTING AND CONSTRUCTION COMPLETE |
 Market Data and Outlook |
 24
Farmers will need to harvest record
area and reap ever increasing yields in
order for global grain and oilseed supply
to keep pace with projected demand
The Food Story by the Numbers
The Food Story by the Numbers
•
Steady and predictable demand growth
•
Population and per capital income key
drivers
•
Our long term forecasts consistent with
those from several other sources
Long Term Grain and Oilseed Demand
1,000
1,500
2,000
2,500
3,000
3,500
4,000
4,500
5,000
5,500
80
85
90
95
00
05
10
15
20
25
30
50
Mil Tonnes
Source: USDA and Mosaic
World Grain and Oilseed Use
Actual for U.S. Ethanol
Actual
Forecast for U.S. Ethanol
Forecast
1.75
2.00
2.25
2.50
2.75
3.00
3.25
3.50
3.75
750
775
800
825
850
875
900
925
950
80
85
90
95
00
05
10
15
20
25
30
MT Ha
Mil Ha
Source: USDA and Mosaic
World Harvested Area and Average Yield
Actual Area
Forecast Area
Actual Yield
Required Yield
1980-10 Yield Trend
24 |
 25
Crop Nutrient Affordability Near Record Levels
•
Revenue per acre
matters!
•
Strong farm income even
with lower commodity
prices
•
Near record crop nutrient
affordability
Considerations
0.50
0.75
1.00
1.25
1.50
1.75
05
06
07
08
09
10
11
12
13
Plant Nutrient Affordability
Plant Nutrient Price Index / Crop Price Index
Affordability Metric
Average
Source: Green Markets, CME,
USDA, AAPFCO, Mosaic |
 26
North America
Fears of large drought-related declines prove unfounded
Outstanding fall and spring application seasons
Outstanding North American shipments
Source: Mosaic Estimates |
 27
Brazil
Record Brazilian shipments and P&K import forecasts for 2013
0.0
0.5
1.0
1.5
2.0
2.5
3.0
3.5
4.0
4.5
95
96
97
98
99
00
01
02
03
04
05
06
07
08
09
10
11
12E
13F
Mil Tonnes
Brazil Processed Phosphate Import Demand
TSP
MAP/MES
DAP
Source: Fertecon, ANDA and Mosaic
0.0
1.0
2.0
3.0
4.0
5.0
6.0
7.0
8.0
95
96
97
98
99
00
01
02
03
04
05
06
07
08
09
10
11
12E
13F
Mil Tonnes
KCl
Brazil Muriate of Potash Imports
Source: Fertecon,
IFA and Mosaic
27 |
 India
•
Indian Nutrient Based Subsidy program
increased the farm price of:
-
MOP by 280%
-
DAP by 160%
-
But left the price of urea flat
•
Subsidy changes cause a serious
nutrient imbalance
-
Over application of N
-
Under application of P&K
-
Target N-P-K ratio: 1-.50-.25
-
Actual N-P-K ratio: 1-.40-.13
•
Implies target vs. actual use gap of:
-
3.1 mmt of MOP
-
2.8 mmt of DAP
Subsidy Changes Stunt P&K Demand Growth |
 29
•
Positive demand outlook
-
2.3%-3.1% CAGR
-
Most likely scenario: Shipments
increase from 58 mmt in 2010 to
75 mmt in 2020
•
New capacity outpaces
demand growth in near term
-
Demand growth stunted by India
-
China builds its last plants
-
Ma’aden I reaches capacity
-
New OCP granulation units and
first Jorf Lasfar hubs on line
-
Ma’aden and OCP account for
75% of non-Chinese additional
capacity this decade
•
How quickly demand absorbs
new capacity depends on:
-
Ag commodity prices and the pace
of demand growth
-
Chinese production and exports
-
Performance of Ma’aden I
-
Timing of Ma’aden II
-
Timing of OCP JPH developments
P: Will supply keep pace with demand?
Source: Mosaic Estimates
-2.5
0.0
2.5
5.0
7.5
10.0
12.5
15.0
17.5
20.0
22.5
11
12
13
14
15
16
17
18
19
20
Mil Tonnes
DAP/MAP/TSP
Most Likely Phosphate Capacity vs. Shipment Scenarios
Cumulative Change 2010-20
Other
India (JV Acid)
China
Ma'aden
OCP (P 1&2 + JPH 1&2)
OCP (JPH 3&4)
Shipments
-
Low
(2.3%
CAGR)
Shipments
-
Medium (2.6% CAGR)
Shipments
-
High
(3.1%
CAGR)
Long Term Prospects |
 30
K: Will demand keep pace with supply?
•
Positive demand outlook
-
3.3%-3.4% CAGR
-
Most likely scenario: MOP
shipments increase from 53 mmt
in 2010 to 71 mmt in 2020
•
Significant new capacity this
decade (most likely scenario):
-
MOP operational capacity
increases from 60 mmt in 2010 to
80-81 mmt KCl in 2020
-
Potential brownfields account for
80% of the projected increase
-
Potential greenfield projects from
large mining or plant nutrient
companies for strategic reasons
•
How quickly demand absorbs
new capacity depends on:
-
Ag commodity prices and the pace
of demand growth
-
Timing of later stage brownfield
expansions in Canada and FSU
-
Timing of potential greenfield
developments
Source: Mosaic Estimates
-2
0
2
4
6
8
10
12
14
16
18
20
22
24
11
12
13
14
15
16
17
18
19
20
Mil Tonnes KCl
Most Likely Potash Capacity vs. Shipment Scenarios
Cumulative Change 2011-20
Canada Brownfield
FSU Brownfield
Other Brownfield
Eurochem
-
Russia
K&S -
Legacy
BHP
-
Jansen Lake (after 2020)
PRC
-
Argentina (after 2020)
Shipments
Low
-
2.3%
CAGR
Shipments
Medium
-
2.9%
CAGR
Shipments High
-
3.4% CAGR
Long Term Prospects |
 |
 Selected Non-GAAP Financial Measures and Reconciliations
As of May 31, 2012
US$ Millions
US$ Millions
FY12
FY11
FY10
FY09
FY08
Net earnings
1,930
$
2,515
$
827
$
2,350
$
2,083
$
+ Interest (income) expense, net
(19)
5
50
43
91
+ Income tax expense (benefit)
711
753
347
649
715
+ Depreciation, depletion & amortization
508
447
445
361
358
EBITDA
3,130
$
3,720
$
1,669
$
3,403
$
3,247
$
Short Term Debt
43
$
Long Term Debt
1,011
Unfunded Pension Obligations
89
Lease Obligations (Annual Rental Expense x 6)
480
Total Adjusted Debt *
1,623
$
* Estimated based on written description of rating agency methodology
EBITDA 5-Year Average
3,034
$
32 |
