Attached files
| file | filename |
|---|---|
| 8-K - 8-K - Guaranty Bancorp | a13-17362_18k.htm |
Exhibit 99.1
|
|
KBW Community Bank Investor Conference New York City July 30-31, 2013 |
|
|
This presentation contains forward-looking statements, which are included in accordance with the “safe harbor” provisions of the Private Securities Litigation Reform Act of 1995. In some cases, you can identify forward-looking statements by terminology such as “may,” “will,” “should,” “could,” “can,” “expects,” “plans,” “intends,” “anticipates,” “believes,” “estimates,” “predicts,” “potential,” or “continue,” or the negative of such terms and other comparable terminology. These forward-looking statements involve known and unknown risks, uncertainties and other factors that may cause the Company’s actual results, performance or achievements to be materially different from any future results, performance or achievements expressed or implied by such forward-looking statements. Such factors include, among others, the following: failure to maintain adequate levels of capital and liquidity to support Company’s operations; general economic and business conditions in those areas in which the Company operates; success or lack of success of any future acquisitions; demographic changes; competition; fluctuations in interest rates; continued ability to attract and employ qualified personnel; ability to receive regulatory approval for our bank subsidiary to declare dividends to the Company; adequacy of our allowance for loan losses, changes in credit quality and the effect of credit quality on our provision for credit losses and allowance for loan losses; changes in governmental legislation or regulation, including, but not limited to, any increase in FDIC insurance premiums and regulatory capital standards; changes in accounting policies and practices; changes in business strategy or development plans; changes in the securities markets; changes in consumer spending, borrowing and savings habits; the availability of capital from private or government sources; competition for loans and deposits and failure to attract or retain loans and deposits; changes in the financial performance and/or condition of our borrowers and the ability of our borrowers to perform under the terms of their loans and other terms of credit agreements; political instability, acts of war or terrorism and natural disasters; and additional “Risk Factors” referenced in the Company’s most recent Annual Report on Form 10-K filed with the Securities and Exchange Commission, as supplemented from time to time. When relying on forward-looking statements to make decisions with respect to the Company, investors and others are cautioned to consider these and other risks and uncertainties. The Company can give no assurance that any goal or plan or expectation set forth in forward-looking statements can be achieved and readers are cautioned not to place undue reliance on such statements, which speak only as of the date made. The forward-looking statements are made as of the date of these materials, and the Company does not intend, and assumes no obligation, to update the forward-looking statements or to update the reasons why actual results could differ from those projected in the forward-looking statements. Investors and security holders are urged to read the Company’s Annual Report on Form 10-K, quarterly reports on Form 10-Q and other documents filed by the Company with the SEC. The documents filed by the Company with the SEC may be obtained at the Company’s website at www.gbnk.com or at the SEC's website at www.sec.gov. These documents may also be obtained free of charge from the Company by directing a request to: Guaranty Bancorp, 1331 Seventeenth St., Suite 345, Denver, CO 80202, Attention: Christopher Treece/Investor Relations; Telephone 303-675-1194. Forward Looking Statements 2 |
|
|
Recent Price $ 12.991 Tangible Book Value Per Share $ 8.292 Price to Tangible Book Value Per Share 1.57x Second Quarter 2013 EPS $ 0.18 Year to Date 2013 EPS $ 0.29 May 31, 2013 Quarterly Per Share Dividend Payment $ 0.025 Market Capitalization: $ 277.9 million 1, 3 About Us - GBNK 3 1 Closing Price on July 23, 2013. 2 See the accompanying reconciliation of non-GAAP measurements to GAAP. 3 Based on 21,392,485 Shares Outstanding (Voting and Non-Voting) on June 30, 2013. |
|
|
Guaranty Bancorp is uniquely positioned in the Colorado market: Strategically located on the thriving Colorado Front Range, which encompasses 85% of the state’s population Asset Size: $1.9 billion Gross Loans: $1.2 billion Total Deposits: $1.4 billion Well positioned for anticipated market consolidation About Us - GBNK 4 |
|
|
Positive pre-tax operating earnings trend Net interest margin of 3.61% remained unchanged in the second quarter 2013 compared to the first quarter 2013 Noninterest income growth of $0.8 million, or 27.5%, in the second quarter 2013 compared to second quarter 2012 Improved tax-equivalent efficiency ratio to 65.6% in second quarter 2013 compared with 73.4% in first quarter 2013 Paid first quarterly cash dividend of 2.5 cents per share in May 2013 Loan growth momentum Year-to-date 2013 net loan growth of 14.2% annualized Second quarter 2013 net loan growth of 20.4% annualized compared to the prior linked quarter Year-to-date 2013 net commercial loan growth of 27.9% annualized Strong asset quality (ratios as of June 30, 2013) Nonperforming loans to total loans of 1.57% Nonperforming assets to total assets of 1.39% Classified asset ratio of 16.48% Texas ratio of 11.70% Allowance to total loans of 1.63% Investment Considerations 5 |
|
|
Strong core deposit mix Noninterest bearing deposits comprised 34.9% of total deposits at June 30, 2013 Time deposits comprised 12.8% of total deposits at June 30, 2013 Second quarter 2013 cost of deposits of 0.17% Noninterest income growth Investment advisory fees Growth in Private Capital Management assets under management of 60.3% annualized through the first six months of 2013 Purchased $15 million of bank-owned life insurance in April 2013 Earnings are reflected as noninterest income and are tax-exempt Anticipated tax-equivalent earnings of approximately $1.0 million annually Growing treasury management and customer service fees Premium income from the sale of Small Business Administration (SBA) guaranteed loans Investment Considerations 6 |
|
|
Strong capital structure supportive of future growth (ratios as of June 30, 2013) Tangible Common Equity Ratio of 9.55%1 Total Risk-Based Capital Ratio of 14.96% Leverage Ratio of 11.46% GAAP Equity Ratio of 9.93% Expense management Redeemed $15 million of 10.47% Trust Preferred Securities in first quarter 2013 – savings of $1.6 million annually Closed six branches in 2012, with $1.4 million in net annual savings Additional branch closure in September 2013, with anticipated annual savings of $0.4 million Continued reduction in troubled asset related expenses Review of all significant cost areas of the bank including information technology, communication, processing and occupancy to identify cost saving opportunities Continue to pursue bank and non-bank acquisition opportunities Investment Considerations 1 See accompanying reconciliation of non-GAAP measurements to GAAP. 7 |
|
|
Pre-Tax Operating Earnings1 1 See accompanying reconciliation of non-GAAP measurements to GAAP. 8 |
|
|
Core Noninterest Income1 1 Core noninterest income excludes the gain or loss recognized on the sale of securities. See accompanying reconciliation of non-GAAP measurements to GAAP. 9 |
|
|
Efficiency Ratio Trend Note: Tax Equivalent Efficiency Ratio excludes a $0.6 million prepayment penalty on the early redemption of high-cost trust preferred securities in Q1 2013, a $3 million impairment charge on a single OREO property in Q4 2012 and a $2.8 million .impairment of long-lived assets in Q2 2012. 10 |
|
|
Deposit Composition June 30, 2013 11 |
|
|
Deposit Trends 0.17% 12 |
|
|
June 30, 2013 Loans by Type Loan Composition 13 |
|
|
1 Excludes Loans Held for Sale. 2010 2011 2012 Q2 2013 YTD Loans - Beginning Balance $1,519,608 $1,204,580 $1,098,140 $1,158,749 New Credit Extended and Advances on Existing Lines 276,604 388,088 522,679 294,105 Net Paydowns & Maturities (505,078) (457,442) (450,623) (205,259) Net Loan Charge-Offs (39,322) (17,408) (7,519) (4,924) Transfers to OREO (47,232) (19,678) (3,928) (2,116) Loans - Ending Balance1 $1,204,580 $1,098,140 $1,158,749 $1,240,555 Annualized Loan (Shrinkage) Growth (9%) 6% 14% Loan Portfolio Activity (in thousands) 14 |
|
|
Net Interest Margin 1 Cost of Funds calculated as interest expense over interest bearing liabilities plus demand deposits. 4.01% 3.61% 0.17% 15 |
|
|
Note: Classified Assets / Tier 1 Capital + ALLL is computed for our subsidiary bank, Guaranty Bank and Trust Company. Classified Asset Trend 16 $36,590 16.48% 11.70% |
|
|
Income Statement 2Q11 3Q11 4Q11 1Q12 2Q12 3Q12 4Q12 1Q13 2Q13 Net Interest Income $ 14,747 $ 15,112 $ 15,325 $ 15,300 $ 15,383 $ 14,511 $ 15,217 $ 15,378 $ 15,739 Provision for Loan Losses 1,000 1,000 1,000 1,000 500 - (3,500) - - Noninterest Income 2,336 5,529 2,800 3,099 2,911 3,815 3,766 2,950 3,711 Noninterest Expense 14,674 17,488 14,849 14,482 17,516 14,194 17,922 15,192 13,879 Tax Expense (Benefit) - - - - (5,914) 1,302 1,441 864 1,753 Net Income $ 1,409 $ 2,153 $ 2,276 $ 2,917 $ 6,192 $ 2,830 $ 3,120 $ 2,272 $ 3,818 Balance Sheet 6/30/11 9/30/11 12/31/11 3/31/12 6/30/12 9/30/12 12/31/12 3/31/13 6/30/13 Cash and Equivalents $ 134,896 $ 93,226 $ 109,225 $ 105,273 $ 142,133 $ 167,823 $ 171,217 $ 60,891 $ 35,613 Investments 408,806 314,420 386,141 401,357 398,151 436,386 458,927 512,188 484,971 Loans 1,091,132 1,088,358 1,098,140 1,109,897 1,110,161 1,118,968 1,158,749 1,180,607 1,240,555 Allowance for Loan Losses (38,855) (35,852) (34,661) (30,075) (29,307) (28,597) (25,142) (24,060) (20,218) Other Assets 151,081 232,216 130,823 129,992 129,401 140,398 123,187 107,214 125,207 Total Assets $1,747,060 $1,692,368 $1,689,668 $1,716,444 $1,750,539 $1,834,978 $1,886,938 $1,836,840 $1,866,128 Deposits $1,346,183 $1,330,661 $1,313,786 $1,338,928 $1,378,937 $1,395,096 $1,454,756 $1,442,317 $1,449,251 Other Liabilities 235,143 192,257 204,871 203,243 191,481 254,809 243,982 204,981 231,553 Total Liabilities $1,581,326 $1,522,918 $1,518,657 $1,542,171 $1,570,418 $1,649,905 $1,698,738 $1,647,298 $1,680,804 Stockholders’ Equity $165,734 $169,450 $171,011 $174,273 $180,121 $185,073 $188,200 $189,542 $185,324 Total Liabilities and Stockholders’ Equity $1,747,060 $1,692,368 $1,689,668 $1,716,444 $1,750,539 $1,834,978 $1,886,938 $1,836,840 $1,866,128 Quarterly Financial Statement Summary Trends (in thousands) 17 |
|
|
Colorado Market 18 |

|
|
Demographics Colorado National Current Population (2013 estimate)1 5,119,000 316,153,000 Historical Population Change (April 2010-July 2012)1 3.1% 1.7% Projected Population Change (2010-2015)1 7.8% 3.9% Median Household Income (2007-2011)1 $57,685 $52,762 Projected Household Income Change (2010-2015)1 14.6% 12.4% Current Unemployment Rate (June 2013)2 7.0% 7.6% Market Data 19 1 US Census Bureau 2 Bureau of Labor Statistics |
|
|
Business Climate Colorado is the third top state for business – CNBC 2012 Colorado ranks fifth overall in the Forbes best states for business report – Forbes 2012 Colorado is the nation’s third-most economically competitive state – Beacon Hill Institute 2012 Denver is third best city for startups – Venture Beat 2012 Denver’s employment forecast is fifth best in the nation – Manpower 2012 Colorado is one of ten states poised to create new jobs and see an economic boom in five to 10 years – Enterprising States study, National Chamber Foundation, 2012 In the first quarter of 2013, results from the Manpower Employment Outlook Survey show that the percent of employers planning to hire new workers has jumped to the highest point since 2008 – Metro Denver Economic Development Corporation Home resale activity in Metro Denver increased 20.3 percent year-over-year in November 2012 – Metro Denver Economic Development Corporation Denver is one of the top 20 national cities to watch, according to the Urban Land Institute / Price Waterhouse Cooper’s 2012 Emerging Trends in Real Estate report – 2012 ULI & PWC Study Market Data 20 |

|
|
Growth Colorado was the fourth fastest growing state in 2011 – U.S. Census Bureau 2012 Metro Denver has a population of 2.8 million people, and has a growth rate that has consistently outpaced the national rate every decade since the 1930s – Metro Denver Economic Development Corporation Metro Denver ranked first among 337 metro areas for absolute increase in construction employment from February 2011 to February 2012 – Associated General Contractors of America 2012 Current Downtown Denver development projects include: Union Station redevelopment, 16th Street mall renovation and multiple multi-use development projects. Ardent Mills, the new flour milling joint venture of ConAgra Foods Inc., Cargill and CHS Inc., recently chose the Denver area for its headquarters Highly Educated Workforce Colorado ranks first for labor prospects – Forbes 2012 Colorado is the nation’s third-most highly educated state for residents with a bachelors degree or higher - U.S. Census Bureau 2012 Colorado has the third highest concentration of scientists and engineers in the nation - Milken Institute, 2010 Denver is among the top-five “Best Cities for Young Adults” for job growth, highly educated people and low living costs – Kiplinger’s Personal Finance 2012 Market Data 21 |
|
|
Reconciliation of Non-GAAP Measures 22 |
|
|
Tangible Book Value as of June 30, 2013 Stockholders’ Equity $185.324 Less Intangible Assets (7,935) Tangible Stockholders’ Equity $177,389 Shares Outstanding 21,392,485 Book Value per common share $8.66 Tangible Book Value per common share $8.29 Tangible Common Equity Ratio at June 30, 2013 Stockholders’ Equity $185,324 Less Intangible Assets (7,935) Tangible Stockholders’ Equity $177,389 Total Assets $1,866,128 Less Intangible Assets (7,935) Total Tangible Assets $1,858,193 Equity Ratio – GAAP1 9.93% Tangible Common Equity/ Tangible Assets 9.55% 1 Total stockholders’ equity / total assets Non-GAAP Measure Reconcilements ($ in thousands, share data excepted) 23 |
|
|
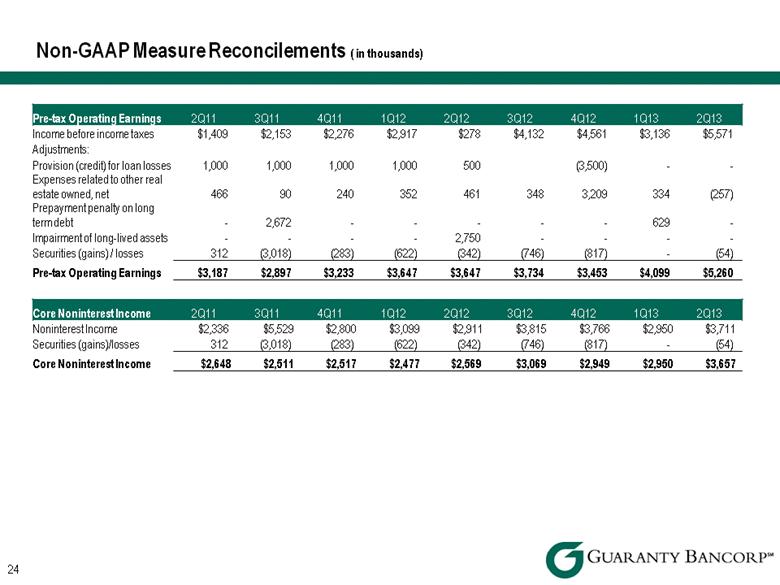
Pre-tax Operating Earnings 2Q11 3Q11 4Q11 1Q12 2Q12 3Q12 4Q12 1Q13 2Q13 Income before income taxes $1,409 $2,153 $2,276 $2,917 $278 $4,132 $4,561 $3,136 $5,571 Adjustments: Provision (credit) for loan losses 1,000 1,000 1,000 1,000 500 (3,500) - - Expenses related to other real estate owned, net 466 90 240 352 461 348 3,209 334 (257) Prepayment penalty on long term debt - 2,672 - - - - - 629 - Impairment of long-lived assets - - - - 2,750 - - - - Securities (gains) / losses 312 (3,018) (283) (622) (342) (746) (817) - (54) Pre-tax Operating Earnings $3,187 $2,897 $3,233 $3,647 $3,647 $3,734 $3,453 $4,099 $5,260 Non-GAAP Measure Reconcilements ( in thousands) Core Noninterest Income 2Q11 3Q11 4Q11 1Q12 2Q12 3Q12 4Q12 1Q13 2Q13 Noninterest Income $2,336 $5,529 $2,800 $3,099 $2,911 $3,815 $3,766 $2,950 $3,711 Securities (gains)/losses 312 (3,018) (283) (622) (342) (746) (817) - (54) Core Noninterest Income $2,648 $2,511 $2,517 $2,477 $2,569 $3,069 $2,949 $2,950 $3,657 24 |