Attached files
| file | filename |
|---|---|
| EX-8.2 - EX-8.2 - FRANK'S INTERNATIONAL N.V. | d527343dex82.htm |
| EX-8.1 - EX-8.1 - FRANK'S INTERNATIONAL N.V. | d527343dex81.htm |
| EX-5.1 - EX-5.1 - FRANK'S INTERNATIONAL N.V. | d527343dex51.htm |
| EX-23.1 - EX-23.1 - FRANK'S INTERNATIONAL N.V. | d527343dex231.htm |
Table of Contents
Index to Financial Statements
As filed with the Securities and Exchange Commission on July 26, 2013
Registration No. 333-188536
UNITED STATES
SECURITIES AND EXCHANGE COMMISSION
Washington, D.C. 20549
Amendment No. 5
to
FORM S-1
REGISTRATION STATEMENT
UNDER
THE SECURITIES ACT OF 1933
Frank’s International N.V.
(Exact name of registrant as specified in its charter)
| The Netherlands | 1389 | 98-1107145 | ||
| (State or other jurisdiction of incorporation or organization) |
(Primary Standard Industrial Classification Code Number) |
(IRS Employer Identification No.) |
Prins Bernhardplein 200
1097 JB Amsterdam, The Netherlands
+31 (0)20 52 14 777
(Address, including zip code, and telephone number, including area code, of registrant’s principal executive offices)
Brian D. Baird
Vice President and Chief Legal Officer
Prins Bernhardplein 200
1097 JB Amsterdam, The Netherlands
+31 (0)20 52 14 777
(Name, address, including zip code, and telephone number, including area code, of agent for service)
Copies to:
| Douglas E. McWilliams Jeffery K. Malonson Vinson & Elkins L.L.P. 1001 Fannin, Suite 2500 Houston, Texas 77002-6760 (713) 758-2222 |
Sean T. Wheeler Latham & Watkins LLP 811 Main Street, Suite 3700 Houston, Texas 77002 (713) 546-5400 |
Approximate date of commencement of proposed sale to the public: As soon as practicable after the effective date of this Registration Statement.
If any of the securities being registered on this Form are to be offered on a delayed or continuous basis pursuant to Rule 415 under the Securities Act of 1933 check the following box: ¨
If this Form is filed to register additional securities for an offering pursuant to Rule 462(b) under the Securities Act, please check the following box and list the Securities Act registration statement number of the earlier effective registration statement for the same offering. ¨
If this Form is a post-effective amendment filed pursuant to Rule 462(c) under the Securities Act, check the following box and list the Securities Act registration statement number of the earlier effective registration statement for the same offering. ¨
If this Form is a post-effective amendment filed pursuant to Rule 462(d) under the Securities Act, check the following box and list the Securities Act registration statement number of the earlier effective registration statement for the same offering. ¨
Indicate by check mark whether the registrant is a large accelerated filer, an accelerated filer, a non-accelerated filer, or a smaller reporting company. See the definitions of “large accelerated filer,” “accelerated filer” and “smaller reporting company” in Rule 12b-2 of the Exchange Act.
| Large accelerated filer | ¨ | Accelerated filer | ¨ | |||
| Non-accelerated filer | x (Do not check if a smaller reporting company) | Smaller reporting company | ¨ | |||
CALCULATION OF REGISTRATION FEE
|
| ||||||||
| Title of Each Class of Securities to be Registered |
Amount to
be Registered(1) |
Proposed Maximum Offering Price Per Share(2) |
Proposed Maximum Offering Price(1)(2) |
Amount of Registration Fee(3) | ||||
| Common Stock, par value €0.01 per share |
34,500,000 | $21.00 | $724,500,000 | $98,822 | ||||
|
| ||||||||
| (1) | Estimated pursuant to Rule 457(a) under the Securities Act of 1933, as amended. Includes 4,500,000 additional shares of common stock that the underwriters have the option to purchase. |
| (2) | Estimated solely for the purpose of calculating the registration fee. |
| (3) | The Registrant previously paid $68,200 of the total registration fee in connection with the previous filing of this Registration Statement. |
The registrant hereby amends this Registration Statement on such date or dates as may be necessary to delay its effective date until the registrant shall file a further amendment which specifically states that this Registration Statement shall thereafter become effective in accordance with Section 8(a) of the Securities Act of 1933 or until this Registration Statement shall become effective on such date as the Securities and Exchange Commission, acting pursuant to said Section 8(a), may determine.
Table of Contents
Index to Financial Statements
The information in this prospectus is not complete and may be changed. We may not sell these securities until the registration statement filed with the Securities and Exchange Commission is effective. This prospectus is not an offer to sell these securities and it is not soliciting an offer to buy these securities in any jurisdiction where the offer or sale is not permitted.
Subject to Completion, dated July 29, 2013
PROSPECTUS
30,000,000 Shares

Frank’s International N.V.
Common Stock
This is the initial public offering of Frank’s International N.V. We are offering 30,000,000 shares of our common stock. No public market currently exists for our common stock.
Our common stock has been approved for listing on the New York Stock Exchange under the symbol “FI.”
We anticipate that the initial public offering price will be between $19.00 and $21.00 per share.
Investing in our common stock involves risks. Please read “Risk Factors” beginning on page 16.
| Per share | Total | |||||||
| Price to the public |
$ | $ | ||||||
| Underwriting discounts and commissions(1) |
$ | $ | ||||||
| Proceeds to us, before expenses |
$ | $ | ||||||
| (1) | Please read “Underwriting” for a description of all underwriting compensation payable in connection with this offering. |
We have granted the underwriters the option to purchase additional 4,500,000 shares of common stock on the same terms and conditions set forth above if the underwriters sell more than 30,000,000 shares of common stock in this offering.
Neither the Securities and Exchange Commission nor any state securities commission has approved or disapproved of these securities or passed on the adequacy or accuracy of this prospectus. Any representation to the contrary is a criminal offense.
The underwriters expect to deliver the shares on or about , 2013.
| Barclays |
Credit Suisse | Simmons & Company International |
| Citigroup |
Morgan Stanley | Goldman, Sachs & Co. | UBS Investment Bank |
| Capital One Southcoast |
Tudor, Pickering, Holt & Co. |
Global Hunter Securities |
| Johnson Rice & Company L.L.C. |
FBR | Scotiabank / Howard Weil |
Prospectus dated , 2013
Table of Contents
Index to Financial Statements

Table of Contents
Index to Financial Statements
| Page | ||||
| 1 | ||||
| 16 | ||||
| 37 | ||||
| 38 | ||||
| 42 | ||||
| 42 | ||||
| 43 | ||||
| 44 | ||||
| Selected Historical Combined and Unaudited Pro Forma Financial Data |
45 | |||
| Management’s Discussion and Analysis of Financial Condition and Results of Operations |
49 | |||
| 70 | ||||
| 93 | ||||
| 99 | ||||
| 111 | ||||
| 119 | ||||
| 126 | ||||
| 128 | ||||
| 135 | ||||
| 136 | ||||
| 142 | ||||
| 147 | ||||
| 155 | ||||
| 155 | ||||
| 156 | ||||
| F-1 | ||||
| A-1 | ||||
You should rely only on the information contained in this prospectus and any free writing prospectus prepared by us or on our behalf or to which we have referred you. We have not, and the underwriters have not, authorized anyone to provide you with information different from that contained in this prospectus and any free writing prospectus. We are offering to sell shares of common stock and seeking offers to buy shares of common stock only in jurisdictions where offers and sales are permitted. The information in this prospectus is accurate only as of the date of this prospectus, regardless of the time of delivery of this prospectus or any sale of the common stock.
Until , 2013, all dealers that buy, sell or trade our common stock, whether or not participating in this offering, may be required to deliver a prospectus. This requirement is in addition to the dealers’ obligation to deliver a prospectus when acting as underwriters and with respect to their unsold allotments or subscriptions.
Industry and Market Data
A portion of the market data and certain other statistical information used throughout this prospectus is based on independent industry publications, government publications or other published independent sources. Some data is also based on our good faith estimates and our management’s understanding of industry conditions. While we are not aware of any misstatements regarding our market, industry or similar data presented herein, such data involve risks and uncertainties and are subject to change based on various factors, including those discussed under the headings “Cautionary Note Regarding Forward-Looking Statements” and “Risk Factors” in this prospectus.
i
Table of Contents
Index to Financial Statements
This summary provides a brief overview of information contained elsewhere in this prospectus. Because it is abbreviated, this summary does not contain all of the information that you should consider before investing in our common stock. You should read the entire prospectus carefully before making an investment decision, including the information presented in “Risk Factors,” “Cautionary Note Regarding Forward-Looking Statements” and “Management’s Discussion and Analysis of Financial Condition and Results of Operations” and the historical combined and pro forma financial statements and related notes thereto included elsewhere in this prospectus. Unless otherwise indicated, information presented in this prospectus assumes that the underwriters’ option to purchase additional shares of common stock is not exercised. We have provided definitions for certain industry terms used in this prospectus in the Glossary beginning on page A-1 of this prospectus.
In this prospectus, unless the context otherwise requires, the terms “we,” “us,” “our,” “Frank’s International” and the “Company” when used in a historical context refer to the combined businesses of Frank’s International N.V. (“FINV”), Frank’s International, Inc. (“FII”), Frank’s Casing Crew and Rental Tools, Inc. (“FCC”), Frank’s Tong Service, Inc. (“FTS”) and their wholly owned subsidiaries, prior to the transactions being entered into in connection with this offering as described in “Organizational Structure.” When used in the present tense, the terms “we,” “us,” “our,” “Frank’s International” and the “Company” refer to FINV and its consolidated subsidiaries, following the reorganization and transactions described in “Organizational Structure.”
Frank’s International
Overview
We are a 75 year-old, industry-leading global provider of highly engineered tubular services to the oil and gas industry. We provide our services to leading exploration and production companies in both offshore and onshore environments, with a focus on complex and technically demanding wells. We believe that we are one of the largest global providers of tubular services to the oil and gas industry.
Tubular services involve the handling and installation of multiple joints of pipe to establish a cased wellbore and the installation of smaller diameter pipe inside a cased wellbore to provide a conduit for produced oil and gas to reach the surface. The casing of a wellbore isolates the wellbore from the surrounding geologic formations and water table, provides well structure and pressure integrity, and allows well operators to target specific zones for production. Given the central role that our services play in the structural integrity, reliability and safety of a well, and the importance of efficient tubular services to managing the overall cost of a well, we believe that our role is vital to the overall process of producing oil and gas. For more information regarding tubular services, see “Business—Industry—Tubular Services.”
Our specially trained employees provide our services using a suite of highly technical, purpose-built equipment, much of which we design and manufacture for our proprietary use. Most of our manufactured equipment and products use patented, advanced technologies that enable us to service complex wells, increase efficiency, enhance well integrity and improve safety. We currently have 104 U.S. patents and 136 related international patents and 37 U.S. patent applications pending and 111 related international patent applications pending for equipment that our engineers have developed.
Recent developments in well construction and completion requirements have resulted in increased technical demands associated with tubular services. For onshore wells, these developments include long horizontal laterals
1
Table of Contents
Index to Financial Statements
and deviated well bores that seek to maximize the wells’ exposure to hydrocarbon-bearing geologic formations. In the offshore environment, these developments include increasing water and well depths, which require lengthier and heavier strings, as well as tubular handling equipment capable of accommodating a more complex array of equipment and hydraulic control lines that are deployed inside the well. We believe that we are a market leader in the development of equipment and services that facilitate and accommodate recent developments in well construction and completion requirements, and this is reflected in our extensive suite of patent-protected, innovative products and equipment. We continuously work with our customers to develop new products, improve efficiency and safety and solve complex well construction and completion problems.
In addition to our tubular handling equipment, we also design and manufacture certain products that we sell or rent directly to external customers, including large outside diameter (“OD”) pipe connectors and casing attachments. We also provide specialized fabrication and welding services in support of deep water projects in the U.S. Gulf of Mexico, including drilling and production risers, flowlines and pipeline end terminations, as well as long length tubulars (up to 300 feet in length) for use as caissons or pilings. Finally, we distribute large OD pipe manufactured by third parties, and generally maintain an inventory of this pipe in order to support our pipe sales and distribution operations.
Spears & Associates, Inc. (“Spears”) estimates that the global market for tubular services (excluding product sales) was approximately $3.3 billion in annual revenues in 2012 and will grow to $3.8 billion in 2013. Spears projects that this market will grow at an annual rate of approximately 11% between 2012 and 2015. There are a limited number of companies that provide these services on a global basis. We serve our customers through a network of over 90 sales and support offices in approximately 60 countries. Our customer base includes major international oil companies, such as Anadarko, BP, Chevron, ConocoPhillips, ExxonMobil, Shell, Total and Murphy Oil Corporation, and national oil companies, such as PDVSA, Statoil and Saudi Aramco, as well as numerous independent oil and gas producers.
We believe we differentiate ourselves from our competitors on the basis of the quality and reliability of our service, our proprietary technology, and our ability to perform in the most demanding environments, including deep water and ultra-deep water projects. Our expertise stems from years of experience, a focus on technical innovation and our highly trained and dedicated workforce. Representative examples of the trusted, critical services we have been selected to provide to our customers include:
| • | In March 2013, we successfully completed the casing installation for the Chevron Northwood well in the Green Canyon Block 945 area of the Gulf of Mexico, to a total depth of 31,866 feet in a water depth of 6,000 feet, which is the deepest oil and gas well of which we are aware. |
| • | In August 2012, we broke our own record for greatest hook load recorded at approximately 1,140 tons while lifting 24,500 feet of combined casing and landing string for Shell’s Stones 4 well in the U.S. Gulf of Mexico. |
| • | In June 2010, we successfully provided all tubular services for the relief well drilled by BP to contain the Macondo well in the U.S. Gulf of Mexico. |
| • | In 2006, we were selected to provide tubular installation services on the BP Shah Deniz project in offshore Azerbaijan, which is an ongoing multiple well project. We believe we were selected for the project due to our highly regarded technical capabilities, including our proprietary Fluid Grip Power Tong gripping technology combined with our Collar Load Support tubular handling system. These proprietary technologies are critical for this project due to their ability to provide “zero marking” handling of the specialized corrosion resistant alloy (“CRA”) completion tubulars required in wells with high hydrogen sulfide content. CRA services have also been increasingly common in other corrosive high-pressure, high-temperature applications, both onshore and offshore. |
2
Table of Contents
Index to Financial Statements
We have a long history of strong revenue growth. Our revenue grew by 43% to $1,055.9 million for the twelve months ended December 31, 2012 compared to $739.1 million for the twelve months ended December 31, 2011, and Adjusted EBITDA grew by 79% to $446.6 million from $249.5 million over the same period. During the twelve months ended December 31, 2012, 45% of our revenue was generated outside North America, and 69% was generated from products and services provided offshore. For an explanation of how we calculate Adjusted EBITDA, see “—Summary Historical Combined and Unaudited Pro Forma Financial Data—Non-GAAP Financial Measures.”
Competitive Strengths
We believe that we are well positioned to execute our strategy based on the following competitive strengths:
| • | Global market leader. We are a leading provider of tubular services in many of the regions in which we operate, including the U.S. Gulf of Mexico and almost every significant international offshore market, almost all of the major U.S. onshore resource basins and in targeted active international onshore regions. Moreover, we believe that we are one of only a few tubular service companies with true global capabilities. According to Spears, we have the number one or number two market share in each of the U.S. and international markets, both onshore and offshore. We currently provide our services in approximately 60 countries on six continents. Our customers include most of the world’s largest integrated oil companies and many of the largest national oil companies. We have no significant customer or geographic concentration. Our global presence allows us to quickly expand to additional regions that experience increases in drilling and production activity. |
| • | Focused service provider with highly differentiated engineering capabilities. We have an in-house engineering team responsible for developing new products that add value to our service capabilities and expand our portfolio of products and services. Our engineers typically work closely with our field personnel and customers in order to identify specific equipment needs related to the services we provide. We believe that we are a market leader in the development of equipment and services that facilitate and accommodate recent developments in well construction and completion requirements, and this is reflected in our extensive suite of patent-protected, innovative products and equipment. We believe that our engineering expertise and our service and product line focus give us a competitive advantage in quickly designing and manufacturing custom solutions in response to our customers’ unique requirements and applications. We have received a number of customer and industry awards recognizing the achievements of our engineering group and our custom designed solutions. |
| • | Favorable reputation developed over eight decades. We believe our customers select Frank’s International because of our reputation for safety, reliability, quality service and proprietary technology. While generally a small portion of the overall well cost, properly performed tubular services are critical to protecting the producer’s investment in the well, as well as its safe operation during production. The economic stakes are especially high for deep water wells, where day rates for offshore drilling rigs and other associated services can approach $1 million per day, and a producer’s investment in a single offshore well can exceed $80 million. The difference between efficiently executed tubular services and less efficiently executed services can save producers days or even weeks, which can translate directly into significant and measurable savings. The producer’s environmental, safety and regulatory risks associated with operating offshore are also heightened. In connection with their customer feedback-based survey, EnergyPoint Research has ranked Frank’s International first in customer satisfaction in one or more oilfield service or product categories every year since 2004, the first year in which the survey was conducted. Our reputation for safety is further demonstrated by our ability to meet and exceed the stringent safety requirements of our customers, some of which have been Frank’s International customers for over 40 years. |
3
Table of Contents
Index to Financial Statements
| • | Strong position in favorable deep water offshore markets. We believe Frank’s International will continue to benefit from the continued development of oil and gas resources located offshore. As a result of the long development lead times associated with deep water projects, they are generally less likely to be cancelled or delayed due to volatility in commodity or financial markets. Also, due to their technical complexity and often remote locations, offshore projects typically provide us with a greater opportunity to differentiate our capabilities from those of our competitors. According to Spears, offshore development spending will increase at an annual rate of approximately 12% between 2011 and 2018. Approximately 67% of our services revenue from external customers in 2012 was generated from offshore services, and our global market share in offshore services was approximately 29% in 2012, according to Spears. Moreover, the significant majority of our offshore services revenue in 2012 was from deep water markets. We believe the economic opportunity for deep water services will continue to be favorable given the technical challenges associated with constructing and completing wells offshore, and the risk of potential negative economic consequences to our customers if tubular services are poorly performed. |
| • | Attractive financial results reflect value of our differentiated and critical services. For the year ended December 31, 2012 and the three months ended March 31, 2013, our Adjusted EBITDA margin was approximately 42% and 43%, respectively, which we believe reflects the economic value to our customers of our differentiated and critical services and the benefits of a diversified, global customer base. Because our business is not capital intensive, we generate significant free cash flow. Consequently, we intend to pay a regular quarterly dividend on our common stock of $0.075 per share. As of March 31, 2013, after giving effect to this offering, we expect to have approximately $241.7 million of cash and cash equivalents and approximately $7.9 million of outstanding indebtedness. |
| • | Significant experience selectively acquiring and integrating companies. We have a long history of evaluating and acquiring companies that expand or complement our geographic footprint and product and service offerings. Since 1982, we have successfully acquired and integrated more than 50 private companies. We believe that being a public company will enhance our acquisition strategy and allow us to target larger acquisition candidates. |
| • | Experienced management team with proven track record. Our executive officers and senior operational managers have extensive experience at Frank’s International and in the oilfield service industry generally. Our executive officers and senior operational managers have an average of 25 years of experience in the oilfield services industry with us. Our chief executive officer, Keith Mosing, is a third generation owner and manager who successfully led our expansion into international operations. The Mosing family will continue to own the majority equity interest in us following the completion of this offering, which we believe aligns their interests with the interests of our public investors. |
Business Strategy
Our objective is to maximize shareholder value by expanding our leading global oilfield services company and continuing to supply high-quality services and products to our customers. We intend to accomplish that objective by capitalizing on the key long-term industry growth trends through the execution of the following strategies:
| • | Continue to focus on customer service. We have a long track record of being responsive to our customers’ unique requirements. We believe that focusing on our customers’ needs and continuing to provide industry-leading technological and safety innovations will enable us to expand our customer base and increase our revenues. |
| • | Sustain our track record of technical innovation. Our team of over 70 in-house engineers and engineering technicians works to develop new products and technologies and provides operational support. We currently have 104 U.S. patents and 136 related international patents and 37 U.S. patent applications pending and 111 related international patent applications pending for equipment that our |
4
Table of Contents
Index to Financial Statements
| engineers have developed. In addition, we currently have more than 50 new technologies and product improvements under development. We have developed strong working relationships with oil and gas producers throughout the world, many of which have approached us with requests for solutions to specific well construction and completion challenges. To address these needs, we continue to invest in new product engineering capabilities. In addition to our own efforts to continuously enhance our equipment and procedures, we expect to continue to develop innovative products and solutions driven by our customers’ needs. |
| • | Pursue disciplined growth organically and through acquisitions. We intend to selectively pursue acquisitions that complement our geographic footprint and product and service offerings, with a focus on businesses that would benefit from our global presence and international sales capabilities. We intend to continue to grow organically by leveraging our customer base, investing in additional equipment and geographically expanding our existing global facilities in order to continue to grow our cash flows and satisfy incremental customer demand. |
| • | Maintain and expand our worldwide presence. We are committed to being on the ground in strategic markets to provide services on a global basis. We intend to build upon our existing presence in Africa, the Asia-Pacific region, the Middle East, North America, the North Sea and South America through deployment of sales, distribution, and service resources. We believe this organic expansion will provide more points of contact with our customers, allowing us to respond more quickly to their needs. |
Segments
We conduct our business through three operating segments:
| • | International Services. We currently provide our services in approximately 60 countries on six continents. Our customers in these international markets are primarily large exploration and production companies, including integrated oil and gas companies and national oil and gas companies, with a significant focus on complex, high profile projects. Our International Services segment accounted for approximately 49% and 50%, respectively, of our Adjusted EBITDA in 2012 and the first three months of 2013. Approximately 82% and 83%, respectively, of our revenue from external customers in this segment was generated in offshore markets in 2012 and the first three months of 2013, the significant majority of which was from deep water markets. |
| • | U.S. Services. Approximately 51% and 63%, respectively, of our 2012 and first quarter 2013 U.S. Services segment revenue from external customers was generated in the technically challenging deep water areas of the U.S. Gulf of Mexico. In addition, we have a significant presence in almost all of the active onshore oil and gas drilling regions in the U.S., including the Permian Basin, Bakken Shale, Barnett Shale, Eagle Ford Shale, Haynesville Shale, Marcellus Shale and Utica Shale. Our U.S. Services segment accounted for approximately 45% and 42%, respectively, of our Adjusted EBITDA in 2012 and the first three months of 2013. |
| • | Pipe and Products. We also design and manufacture certain products that we sell or rent directly to external customers, including large OD pipe connectors and casing attachments. We also provide specialized fabrication and welding services in support of deep water projects in the U.S. Gulf of Mexico, including drilling and production risers, flowlines and pipeline end terminations, as well as long length tubulars (up to 300 feet in length) for use as caissons or pilings. Finally, we distribute large OD pipe manufactured by third parties. A significant majority of our sales to external customers occur in deep water markets. Our Pipe and Products segment accounted for approximately 6% and 8%, respectively, of our Adjusted EBITDA in 2012 and the first three months of 2013. |
5
Table of Contents
Index to Financial Statements
Trends in the Industry
We believe that the following trends will positively affect the oilfield services industry, and consequently the demand for tubular installation services, in the coming years.
| • | Increasing global demand for crude oil and natural gas has spurred increases in energy development spending. The crude oil and natural gas industry benefits from increased consumption of hydrocarbons, caused in part by the industrialization of China, India and other developing countries. Spears estimates that annual global spending on drilling and development activities increased from $236 billion in 2009 to $326 billion in 2012, and is projected to increase to $482 billion in 2018, representing a compound annual growth rate of approximately 8% from 2009 to 2018. |
| • | Significant new well development is required to replace naturally declining production. Despite elevated exploration and development activity in recent years, oil supply has only experienced modest gains, highlighting the difficulty in overcoming the natural decline rates of large legacy fields. The International Energy Agency (the “IEA”) estimates that in order to overcome the decline in production from existing fields, and to keep pace with projected demand increases, new production of approximately 40 million barrels of oil per day (an amount equal to nearly 60% of 2011 global oil production) must be added by 2035. A significant number of new wells will be required to make up for declines in production from existing fields and the projected increase in global oil demand. |
| • | Increasing offshore and deep water drilling and development activity. Worldwide offshore rig counts continue to increase as crude oil supply and demand fundamentals encourage new drilling. Moreover, many of these new rigs are bigger and more efficient and designed to drill deeper to previously unrecoverable reserves. According to the IEA, 55% of remaining recoverable conventional oil outside of the Organization of Petroleum Exporting Countries (“OPEC”) is offshore. According to Spears, offshore spending will increase from $80.1 billion in 2011 to $179.7 billion in 2018, a compound annual growth rate of 12%. Offshore discoveries are expected to play an important role in the future, particularly deep water discoveries at depths greater than 1,000 feet. |
| • | Increasing complexity and costs of well construction. As conventional sources of oil and gas are depleted, the oil and gas industry continues to develop new technologies and techniques that allow operators to develop a wider range of unconventional oil and gas resources, such as oil and gas shales. Certain of these techniques include drilling deeper and horizontal well paths with long lateral lengths and multi-stage completions, often in high temperature and high pressure environments. These types of unconventional drilling generally require additional tubular services compared to conventional drilling, and tubular installation services have become increasingly complex to execute, and have required the development of new techniques and specialized tools. |
| • | Heightened focus on quality, safety and environmental factors. Our customers are increasingly focused on the quality of wellbore construction, operational safety and environmental stewardship, particularly in offshore environments where we routinely operate. The tubular services we provide are critical in achieving these goals. As such, our reputation as a high-quality, trusted service provider positions us well to benefit from this trend. |
Recent Developments
While we have not finalized our financial statements or results of operations for the quarter ended June 30, 2013, the following preliminary information reflects management’s estimates with respect to such period based on currently available information.
In June 2013, we sold a component of our Pipe and Products segment that manufactured centralizers for sales to third parties. That sale is expected to result in a pre-tax gain of approximately $41 million. The attributable operations and the gain will be reported as discontinued operations. Revenues associated with this
6
Table of Contents
Index to Financial Statements
component were $16.9 million and $4.2 million for the year ended December 31, 2012 and three months ended March 31, 2013, respectively.
Based upon our preliminary analysis, we currently expect revenues from continuing operations of between $288.0 million and $298.0 million for the three months ended June 30, 2013 compared to revenues of $262.7 million for the three months ended June 30, 2012. The estimated increase was primarily the result of increased demand for our services and products and an increase in international pipe sales. Based upon our preliminary analysis, we currently expect income from continuing operations of between $99.0 million and $104.0 million for the three months ended June 30, 2013, compared to income from continuing operations of $89.2 million for the three months ended June 30, 2012. Income from continuing operations for the second quarter of 2013 was positively affected by the estimated increase in revenue on comparable cost of revenues and an increase in other income, which is expected to include the receipt of approximately $3 million of underpaid royalty payments.
We are currently in the process of preparing our combined financial statements as of and for the six months ended June 30, 2013. These financial statements are not currently available and are not expected to be available and filed with the Securities and Exchange Commission (the “SEC”) until after consummation of this offering. Estimates of financial results and position are inherently uncertain and subject to change, and adjustments may arise and actual results may differ materially from these estimates. The preliminary financial data included in this prospectus has been prepared by, and is the responsibility of, management. PricewaterhouseCoopers LLP has not audited, reviewed, compiled or performed any procedures with respect to the accompanying preliminary financial data. Accordingly, PricewaterhouseCoopers LLP does not express an opinion or any other form of assurance with respect thereto. You are cautioned not to place undue reliance on these estimates. This information is a summary of estimated financial data and should be read in conjunction with the “Risk Factors,” “Summary Historical Combined and Unaudited Pro Forma Financial Data,” “Management’s Discussion and Analysis of Financial Conditional and Results of Operations,” and our unaudited and audited combined financial statements and the accompanying notes appearing elsewhere in this prospectus.
Business History
We believe that our long and successful history in the industry is a testament to the quality of the services and the innovative technology that we provide our customers. Frank’s International traces its roots to the founding of FCC by Frank Mosing in 1938. In 1950, Donald E. Mosing joined his father in the business. Later, Donald’s younger brothers, Billy and Larry, joined their father and brother to help manage the growing operations. As an engineering and safety innovator, Donald was a driving force for many years in the development of many of our proprietary tools and processes, and he is named as an inventor on 45 of the U.S. patents that have been issued to us. In 1973, Donald Keith Mosing, Donald E. Mosing’s eldest son, established our third office, in Alvin, Texas. Keith Mosing quickly embarked on the expansion of operations across North America and into South America, Asia, Europe, Africa and the Middle East. Our international operations were formally organized into a separate company in 1981, with Keith Mosing being named Chairman, President and Chief Executive Officer. Since the early 1980s, our U.S. and international operations have continued to grow, both organically and through strategic acquisitions. Upon Donald’s retirement in July 2011, Keith Mosing was named Chairman, President and Chief Executive Officer of the U.S. operations. Until this offering, we have been owned solely by members of the Mosing family.
Risk Factors
An investment in our common stock involves a number of risks. You should carefully consider the risks described in “Risk Factors,” in addition to the other information contained in this prospectus, including “Management’s Discussion and Analysis of Financial Condition and Results of Operations” and our combined financial statements and related notes, before investing in our common stock. These risks could materially affect our business, financial condition and results of operations, and cause the trading price of our common stock to decline. You could lose part or all of your investment. You should bear in mind, in reviewing this prospectus, that past experience is no indication of future performance. You should read the section titled “Cautionary Note
7
Table of Contents
Index to Financial Statements
Regarding Forward-Looking Statements” for a discussion of what types of statements are forward-looking statements, as well as the significance of such statements in the context of this prospectus.
Organization
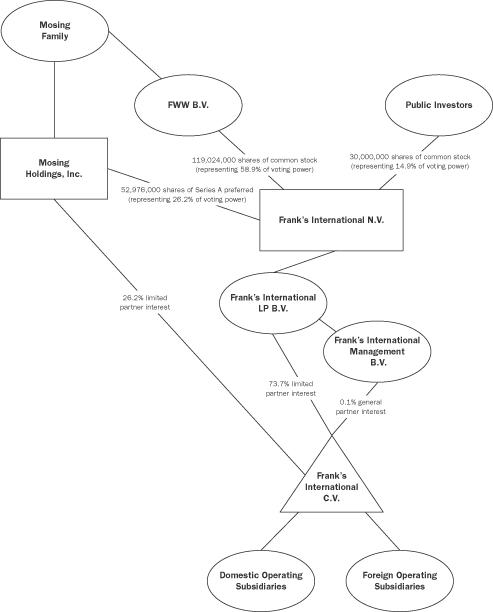
The diagram below depicts our simplified organizational structure immediately following the completion of this offering (assuming that the underwriters’ option to purchase additional shares of common stock is not exercised and without giving effect to the grant of restricted stock units representing an aggregate of 3,900,000 shares of common stock (based upon the midpoint of the price range set forth on the cover page of this prospectus) to our officers and employees concurrently with this offering as described in “Compensation Discussion and Analysis—Components of Our Executive Compensation Program—Long-Term Incentive Plan”):
8
Table of Contents
Index to Financial Statements
Following completion of this offering, FINV, the issuer of common stock in this offering, will act as a holding company whose sole material assets will consist of indirect general and limited partnership interests in Frank’s International C.V. (“FICV”). As the indirect sole shareholder of the general partner of FICV, FINV will be responsible for all operational, management and administrative decisions relating to FICV’s business and will consolidate the financial results of FICV and its subsidiaries.
The articles of association of FINV authorize two classes of stock, common stock and Series A preferred stock. See “Description of Capital Stock.” Only common stock will be sold to investors pursuant to this offering. Shares of our common stock will also be held indirectly by members of the Mosing family through FWW B.V. (“FWW”). Shares of Series A preferred stock will be held by Mosing Holdings, Inc. (“Mosing Holdings”) as described below. Each share of Series A preferred stock will have a liquidation preference equal to its par value of €0.01 per share (or €529,760 in the aggregate) and will be entitled to an annual dividend equal to 0.25% of its par value (or €1,324 per annum in the aggregate). Additionally, each share of Series A preferred stock will entitle its holder to vote together with the common stock as a single class on all matters presented to FINV’s shareholders for their vote. The common stock and the preferred stock are collectively referred to herein as the “FINV Stock.”
FICV is a newly formed limited partnership that was formed to act as a holding company of various U.S. and foreign operating companies engaged in our business. Prior to this offering, our foreign operating companies have been owned directly or indirectly by FINV, and our U.S. operating companies have been owned directly or indirectly by Mosing Holdings, which is owned by members of the Mosing family. In connection with this offering, FINV will contribute all of our foreign operating subsidiaries and a portion of the proceeds from this offering to FICV, and Mosing Holdings will contribute all of our U.S. operating subsidiaries (excluding certain assets that generate a de minimis amount of revenue, including aircraft, real estate and life insurance policies) to FICV. We intend to enter into real estate lease agreements and an aviation services agreement with customary terms for continued use of the real estate and aircraft. See “Certain Relationships and Related Party Transactions—Transactions with Our Directors, Executive Officers and Affiliates.”
In exchange for this contribution (and after giving effect to this offering assuming the underwriters’ option to purchase additional shares of common stock is not exercised),
| (i) | FINV will (indirectly) hold a 73.7% limited partnership interest and a 0.1% general partnership interest in FICV; and |
| (ii) | Mosing Holdings will hold a 26.2% limited partnership interest in FICV. |
In order to give Mosing Holdings a percentage vote in FINV that is equal to the percentage limited partnership interest in FICV that Mosing Holdings will receive in exchange for its contribution to FICV, Mosing Holdings will also receive 52,976,000 shares of Series A preferred stock of FINV in the exchange.
Following the completion of this offering, the Mosing family will own, indirectly through Mosing Holdings and FWW, FINV Stock and FICV limited partnership interests that in the aggregate will represent approximately 85.1% of the economic interests in and voting power of our combined company (or 83.3% if the underwriters’ option to purchase additional shares of common stock is exercised in full).
For purposes of any transfer or exchange of Series A preferred stock and limited partnership interests in FICV, the articles of association of FINV and the partnership agreement of FICV contain provisions linking each share of Series A preferred stock in FINV to a proportionate portion of the limited partnership interest in FICV held by Mosing Holdings or its permitted transferee, which portion at any time will equal the total limited partnership interest in FICV held by Mosing Holdings or its permitted transferee divided by the total number of issued and outstanding shares of Series A preferred stock of FINV (each such portion being referred to as an
9
Table of Contents
Index to Financial Statements
“FICV Portion”). Shares of Series A preferred stock cannot be transferred unless simultaneously with an equal number of FICV Portions and vice versa.
Mosing Holdings (or any of its permitted transferees) will have the right (the “Conversion Right”) to convert all or a portion of its Series A preferred stock into FINV common stock by delivery to FINV of an equivalent number of FICV Portions. In connection with such conversion, Mosing Holdings or its permitted transferees will also be entitled to receive an amount of cash equal to the par value of each share of Series A preferred stock so converted plus any accrued but unpaid dividends thereon.
The above mechanism is subject to customary conversion rate adjustments for stock splits, stock dividends and reclassifications.
See “Certain Relationships and Related Party Transactions—Limited Partnership Agreement of FICV.”
Also in connection with our formation transactions, we will enter into a Tax Receivable Agreement with Mosing Holdings. This agreement generally will provide for the payment by FINV of 85% of actual reductions, if any, in payments of U.S. federal, state and local income tax or franchise tax (which reductions we refer to as “cash savings”) in periods after this offering as a result of (i) the tax basis increases from the transfer of FICV interests to us in connection with a conversion of shares of Series A preferred stock into shares of our common stock and (ii) imputed interest deemed to be paid by us as a result of, and additional tax basis arising from, any payments we make under the Tax Receivable Agreement. FINV will retain the benefit of the remaining 15% of these cash savings. See “Certain Relationships and Related Party Transactions—Tax Receivable Agreement.”
Corporate Information
Our principal executive offices are located at Prins Bernhardplein 200, 1097 JB Amsterdam, The Netherlands, and our telephone number at that address is +31 (0)20 52 14 777. Our primary U.S. offices are located at 10260 Westheimer Rd., Houston, Texas 77042, and our telephone number at that address is (281) 966-7300. Our website is located at www.franksinternational.com. We expect to make our periodic reports and other information filed or furnished to the SEC available free of charge through our website as soon as reasonably practicable after those reports and other information are electronically filed with or furnished to the SEC. Information on our website or any other website is not incorporated by reference herein and does not constitute a part of this prospectus.
10
Table of Contents
Index to Financial Statements
The Offering
| Common stock offered by us |
30,000,000 shares (34,500,000 shares if the underwriters’ option to purchase additional shares of common stock is exercised in full). | |
| Over-allotment option |
We have granted the underwriters the option to purchase up to an additional 4,500,000 shares of common stock if the underwriters sell more than 30,000,000 shares of common stock in this offering. | |
| Common stock to be outstanding after the offering |
149,024,000 shares (153,524,000 shares if the underwriters’ option to purchase additional shares of common stock is exercised in full), without giving effect to the grant of restricted stock units representing an aggregate of 3,900,000 shares of common stock (based upon the midpoint of the price range set forth on the cover page of this prospectus) to our officers and employees concurrently with this offering as described in “Compensation Discussion and Analysis—Components of Our Executive Compensation Program—Long-Term Incentive Plan.” | |
| Series A preferred stock to be outstanding after the offering |
| |
| Voting power of common stock after giving effect to this offering |
| |
| Voting power of Series A preferred stock after giving effect to this offering |
| |
11
Table of Contents
Index to Financial Statements
| described in “Compensation Discussion and Analysis—Components of Our Executive Compensation Program—Long-Term Incentive Plan.” | ||
| Use of proceeds |
We expect to receive net proceeds of approximately $562.0 million from the sale of the common stock by us in this offering, assuming an initial public offering price of $20.00 per share (the midpoint of the price range set forth on the cover page of this prospectus) and after deducting estimated expenses payable by us and underwriting discounts and commissions. Each $1.00 increase (decrease) in the public offering price would increase (decrease) our net proceeds by approximately $28.3 million. We intend to use the net proceeds from this offering to repay in full the outstanding notes payable to FWW, under which there was an aggregate of $443.7 million outstanding as of March 31, 2013. Any remaining net proceeds (including any proceeds attributable to the underwriters’ exercise of their option to purchase additional shares of common stock) will be contributed to FICV. FICV will use any such proceeds for general corporate purposes. See “Use of Proceeds.” | |
| Dividend policy |
Following the completion of this offering, we intend to pay a regular quarterly dividend on our common stock of $0.075 per share. | |
| Listing and trading symbol |
Our common stock has been approved for listing on the New York Stock Exchange (the “NYSE”) under the symbol “FI.” | |
| Risk factors |
You should carefully read and consider the information beginning on page 16 of this prospectus set forth under the heading “Risk Factors” and all other information set forth in this prospectus before deciding to invest in our common stock. | |
12
Table of Contents
Index to Financial Statements
Summary Historical Combined and Unaudited Pro Forma Financial Data
The following table shows summary historical combined financial data of Frank’s International as of and for the years ended December 31, 2010, 2011 and 2012. The summary historical combined financial data of Frank’s International as of December 31, 2011 and 2012 and for the years ended December 31, 2010, 2011 and 2012 has been derived from our audited financial statements and the related notes thereto included elsewhere in this prospectus. The audited financial data as of December 31, 2010 has been derived from our audited combined financial statements and related notes thereto that are not included in this prospectus. The summary historical combined financial data presented as of March 31, 2013 and for the three months ended March 31, 2012 and 2013 are derived from the unaudited historical combined financial statements included elsewhere in this prospectus. Under the combined method of accounting, the historical consolidated financial statements of FINV, FII, FCC and FTS and their wholly owned subsidiaries are combined as if Frank’s International operated as a single entity. All intercompany accounts and transactions have been eliminated for purposes of preparing these combined financial statements.
The summary unaudited pro forma financial data presented below has been derived by the application of pro forma adjustments to the historical combined statements of Frank’s International included elsewhere in this prospectus. The summary unaudited pro forma financial data for the year ended December 31, 2012 and as of and for the three months ended March 31, 2013 give effect to our reorganization in connection with this offering as described in “Organizational Structure” and the use of the estimated net proceeds from this offering as described in “Use of Proceeds” as if all such transactions had occurred on January 1, 2012, in the case of the unaudited pro forma condensed statement of income, and on March 31, 2013, in the case of the unaudited pro forma condensed balance sheet.
You should read these tables in conjunction with “Management’s Discussion and Analysis of Financial Condition and Results of Operations,” which includes a discussion of factors materially affecting the comparability of the information presented, “Organizational Structure,” “Selected Historical Combined and Unaudited Pro Forma Financial Data” and our historical and pro forma financial statements and notes thereto included elsewhere in this prospectus. Our summary unaudited pro forma financial data is presented for informational purposes only. The pro forma adjustments are based upon available information and certain assumptions that we believe are reasonable. Our summary unaudited pro forma financial data does not purport to represent what our results of operations or financial position would have been if we operated as a public company during the period presented and may not be indicative of our future performance.
13
Table of Contents
Index to Financial Statements
| FINV | ||||||||||||||||||||||||||||
| Frank’s International | Pro Forma | |||||||||||||||||||||||||||
| Year Ended December 31, | Three Months Ended March 31, |
Year Ended December 31, 2012 |
Three Months Ended March 31, 2013 |
|||||||||||||||||||||||||
| 2010 | 2011 | 2012 | 2012 | 2013 | ||||||||||||||||||||||||
| Statements of income data (in thousands): |
||||||||||||||||||||||||||||
| Revenues: |
||||||||||||||||||||||||||||
| Equipment rentals and services |
$ | 490,902 | $ | 613,541 | $ | 880,084 | $ | 203,755 | $ | 205,878 | $ | 878,938 | $ | 205,643 | ||||||||||||||
| Products |
117,306 | 125,534 | 175,841 | 36,773 | 30,882 | 175,841 | 30,882 | |||||||||||||||||||||
|
|
|
|
|
|
|
|
|
|
|
|
|
|
|
|||||||||||||||
| Total revenues |
608,208 | 739,075 | 1,055,925 | 240,528 | 236,760 | 1,054,779 | 236,525 | |||||||||||||||||||||
|
|
|
|
|
|
|
|
|
|
|
|
|
|
|
|||||||||||||||
| Operating expenses: |
||||||||||||||||||||||||||||
| Cost of revenues, exclusive of depreciation and amortization |
||||||||||||||||||||||||||||
| Equipment rentals and services |
222,345 | 256,515 | 314,950 | 72,731 | 75,781 | 314,950 | 75,781 | |||||||||||||||||||||
| Products |
70,697 | 76,368 | 119,527 | 24,184 | 18,019 | 119,527 | 18,019 | |||||||||||||||||||||
| General and administrative expenses |
134,449 | 160,506 | 187,033 | 41,608 | 44,145 | 188,409 | 45,434 | |||||||||||||||||||||
| Depreciation and amortization |
48,197 | 54,581 | 66,215 | 15,424 | 17,783 | 64,148 | 17,364 | |||||||||||||||||||||
| (Gain) loss on sale of assets |
(164 | ) | (47 | ) | (2,608 | ) | 195 | 23 | (2,608 | ) | 23 | |||||||||||||||||
|
|
|
|
|
|
|
|
|
|
|
|
|
|
|
|||||||||||||||
| Operating income |
132,684 | 191,152 | 370,808 | 86,386 | 81,009 | 370,353 | 79,904 | |||||||||||||||||||||
|
|
|
|
|
|
|
|
|
|
|
|
|
|
|
|||||||||||||||
| Other income (expense): |
||||||||||||||||||||||||||||
| Other income |
3,906 | 3,786 | 12,189 | 670 | 2,127 | 12,189 | 2,127 | |||||||||||||||||||||
| Interest income (expense), net |
(1,658 | ) | (655 | ) | 264 | 260 | (201 | ) | 1,038 | 83 | ||||||||||||||||||
| Foreign currency gain (loss) |
(1,930 | ) | (3,209 | ) | (450 | ) | 2,626 | (3,587 | ) | (450 | ) | (3,587 | ) | |||||||||||||||
|
|
|
|
|
|
|
|
|
|
|
|
|
|
|
|||||||||||||||
| Total other income (expense) |
318 | (78 | ) | 12,003 | 3,556 | (1,661 | ) | 12,777 | (1,377 | ) | ||||||||||||||||||
|
|
|
|
|
|
|
|
|
|
|
|
|
|
|
|||||||||||||||
| Income before income tax |
133,002 | 191,074 | 382,811 | 89,942 | 79,348 | 383,130 | 78,527 | |||||||||||||||||||||
| Income tax expense |
14,601 | 20,287 | 31,877 | 7,687 | 6,303 | 89,569 | 17,834 | |||||||||||||||||||||
|
|
|
|
|
|
|
|
|
|
|
|
|
|
|
|||||||||||||||
| Net income |
118,401 | 170,787 | 350,934 | 82,255 | 73,045 | 293,561 | 60,693 | |||||||||||||||||||||
| Non-controlling interest |
— | — | — | — | — | (92,059 | ) | (18,915 | ) | |||||||||||||||||||
|
|
|
|
|
|
|
|
|
|
|
|
|
|
|
|||||||||||||||
| Net income attributable to Frank’s International |
118,401 | 170,787 | 350,934 | 82,255 | 73,045 | 201,502 | 41,778 | |||||||||||||||||||||
| Preferred stock dividends |
— | — | — | — | — | (2 | ) | — | ||||||||||||||||||||
|
|
|
|
|
|
|
|
|
|
|
|
|
|
|
|||||||||||||||
| Net income attributable to common stockholders |
$ | 118,401 | $ | 170,787 | $ | 350,934 | $ | 82,255 | $ | 73,045 | $ | 201,500 | $ | 41,778 | ||||||||||||||
|
|
|
|
|
|
|
|
|
|
|
|
|
|
|
|||||||||||||||
| Balance sheet data (as of period end) (in thousands): |
||||||||||||||||||||||||||||
| Total assets |
$ | 710,543 | $ | 847,500 | $ | 1,107,961 | $ | 1,129,318 | $ | 1,184,022 | ||||||||||||||||||
| Long-term debt—excluding affiliates |
46,579 | 9,204 | 7,368 | 5,858 | 5,059 | |||||||||||||||||||||||
| Long-term debt—affiliate(1) |
907 | 3,618 | 469,268 | 448,838 | 2,881 | |||||||||||||||||||||||
| Total liabilities(2) |
174,530 | 180,372 | 660,973 | 635,667 | 189,598 | |||||||||||||||||||||||
| Total stockholders’ equity |
536,013 | 667,128 | 446,988 | 493,651 | 994,424 | |||||||||||||||||||||||
| Other financial data (in thousands): |
||||||||||||||||||||||||||||
| Net cash provided by operating activities |
$ | 163,414 | $ | 180,710 | $ | 344,776 | $ | 78,669 | $ | 50,664 | ||||||||||||||||||
| Net cash used in investing activities |
(69,130 | ) | (126,655 | ) | (182,533 | ) | (47,541 | ) | (42,014 | ) | ||||||||||||||||||
| Net cash used in financing activities |
(79,261 | ) | (71,874 | ) | (107,210 | ) | (14,742 | ) | (44,235 | ) | ||||||||||||||||||
| Adjusted EBITDA(3) (unaudited) |
184,623 | 249,472 | 446,604 | 102,675 | 100,942 | $ | 444,082 | $ | 99,418 | |||||||||||||||||||
| (1) | In 2012, FINV made a non-cash distribution of $484.0 million to its owners in the form of two unsecured promissory notes payable. As of December 31, 2012 and March 31, 2013, there was an aggregate of approximately $464.0 million and $443.7 million, respectively, outstanding under these notes. |
| (2) | Includes Series A preferred stock. |
| (3) | Adjusted EBITDA is a non-GAAP financial measure. For a definition and a reconciliation of Adjusted EBITDA to our net income, see “—Non-GAAP Financial Measure” below. |
14
Table of Contents
Index to Financial Statements
Non-GAAP Financial Measures
Adjusted EBITDA is a supplemental non-GAAP financial measure that is used by management and external users of our financial statements, such as industry analysts, investors, lenders and rating agencies.
We define Adjusted EBITDA as net income before net interest income or expense, depreciation and amortization, income tax benefit or expense, asset impairments, gain or loss on sale of assets, foreign currency gain or loss and other non-cash adjustments. We define Adjusted EBITDA margin as Adjusted EBITDA divided by revenues. Adjusted EBITDA is not a measure of net income or cash flows as determined by U.S. generally accepted accounting principles (“GAAP”).
Management believes Adjusted EBITDA is useful because it allows us to more effectively evaluate our operating performance and compare the results of our operations from period to period without regard to our financing methods or capital structure. We exclude the items listed above from net income in arriving at Adjusted EBITDA because these amounts can vary substantially from company to company within our industry depending upon accounting methods and book values of assets, capital structures and the method by which the assets were acquired. Adjusted EBITDA and Adjusted EBITDA margin have limitations as analytical tools and should not be considered as an alternative to, or more meaningful than, operating income, net income or cash flows from operating activities as determined in accordance with GAAP or as an indicator of our operating performance or liquidity. Certain items excluded from Adjusted EBITDA are significant components in understanding and assessing a company’s financial performance, such as a company’s cost of capital and tax structure, as well as the historic costs of depreciable assets, none of which are components of Adjusted EBITDA. Our computations of Adjusted EBITDA may not be comparable to other similarly titled measures of other companies. We believe that Adjusted EBITDA is a widely followed measure of operating performance and may also be used by investors to measure our ability to meet debt service requirements.
The following table presents a reconciliation of the non-GAAP financial measure of Adjusted EBITDA to the GAAP financial measure of net income.
| FINV | ||||||||||||||||||||||||||||
| Frank’s International | Pro Forma | |||||||||||||||||||||||||||
| Year Ended December 31, | Three Months Ended March 31, |
Year Ended December 31, 2012 |
Three Months Ended March 31, 2013 |
|||||||||||||||||||||||||
| 2010 | 2011 | 2012 | 2012 | 2013 | ||||||||||||||||||||||||
| Adjusted EBITDA Reconciliation (in thousands): |
||||||||||||||||||||||||||||
| Net income |
$ | 118,401 | $ | 170,787 | $ | 350,934 | $ | 82,255 | $ | 73,045 | $ | 293,561 | $ | 60,693 | ||||||||||||||
| Interest (income) expense, net |
1,658 | 655 | (264 | ) | (260 | ) | 201 | (1,038 | ) | (83 | ) | |||||||||||||||||
| Depreciation and amortization |
48,197 | 54,581 | 66,215 | 15,424 | 17,783 | 64,148 | 17,364 | |||||||||||||||||||||
| Income tax expense |
14,601 | 20,287 | 31,877 | 7,687 | 6,303 | 89,569 | 17,834 | |||||||||||||||||||||
| (Gain) loss on sale of assets |
(164 | ) | (47 | ) | (2,608 | ) | 195 | 23 | (2,608 | ) | 23 | |||||||||||||||||
| Foreign currency (gain) loss |
1,930 | 3,209 | 450 | (2,626 | ) | 3,587 | 450 | 3,587 | ||||||||||||||||||||
|
|
|
|
|
|
|
|
|
|
|
|
|
|
|
|||||||||||||||
| Adjusted EBITDA |
$ | 184,623 | $ | 249,472 | $ | 446,604 | $ | 102,675 | $ | 100,942 | $ | 444,082 | $ | 99,418 | ||||||||||||||
|
|
|
|
|
|
|
|
|
|
|
|
|
|
|
|||||||||||||||
15
Table of Contents
Index to Financial Statements
You should carefully consider the risks described below before making an investment decision. Our business, financial condition and results of operations could be materially adversely affected by any of these risks. The trading price of our common stock could decline due to any of these risks, and you may lose all or part of your investment.
Risks Related to Our Business
Our business depends on the level of activity in the oil and gas industry, which is significantly affected by volatile oil and gas prices and other factors.
Our business depends on the level of activity in oil and gas exploration, development and production in market sectors worldwide. Oil and gas prices and market expectations of potential changes in these prices significantly affect this level of activity. However, higher commodity prices do not necessarily translate into increased drilling activity, since customers’ expectations of future commodity prices typically drive demand for our services. The availability of quality drilling prospects, exploration success, relative production costs, the stage of reservoir development and political and regulatory environments also affect the demand for our services. Worldwide military, political and economic events have in the past contributed to oil and gas price volatility and are likely to do so in the future. The demand for our services may be affected by numerous factors, including:
| • | the level of worldwide oil and gas exploration and production; |
| • | the cost of exploring for, producing and delivering oil and gas; |
| • | demand for energy, which is affected by worldwide economic activity and population growth; |
| • | the level of excess production capacity; |
| • | the discovery rate of new oil and gas reserves; |
| • | the ability of OPEC to set and maintain production levels for oil; |
| • | the level of production by non-OPEC countries; |
| • | U.S. and global political and economic uncertainty, socio-political unrest and instability or hostilities; |
| • | demand for, availability of and technological viability of, alternative sources of energy; and |
| • | technological advances affecting energy exploration, production, transportation and consumption. |
Demand for our offshore services substantially depends on the level of activity in offshore oil and gas exploration, development and production. The level of offshore activity is historically cyclical and characterized by large fluctuations in response to relatively minor changes in a variety of factors, including oil and gas prices, which could have a material adverse effect on our business, financial condition and results of operations.
A significant amount of our U.S. onshore business is focused on unconventional shale resource plays. The demand for those services is substantially affected by oil and gas prices and market expectations of potential changes in these prices. If commodity prices were to go below a certain threshold for an extended period of time, demand for our services in the U.S. onshore market would be greatly reduced, potentially having a material adverse effect on our business, financial condition and results of operations.
The oil and gas industry has historically experienced periodic downturns, which have been characterized by reduced demand for oilfield services and downward pressure on the prices we charge. A significant downturn in the oil and gas industry will adversely affect the demand for oilfield services and our business, financial condition and results of operations.
16
Table of Contents
Index to Financial Statements
Physical dangers are inherent in our operations and may expose us to significant potential losses. Personnel and property may be harmed during the process of drilling for oil and gas.
Drilling for and producing oil and gas, and the associated services that we provide, include inherent dangers that may lead to property damage, personal injury, death or the discharge of hazardous materials into the environment. Many of these events are outside our control. Typically, we provide services at a well site where our personnel and equipment are located together with personnel and equipment of our customers and third parties, such as other service providers. At many sites, we depend on other companies and personnel to conduct drilling operations in accordance with appropriate safety standards. From time to time, personnel are injured or equipment or property is damaged or destroyed as a result of accidents, failed equipment, faulty products or services, failure of safety measures, uncontained formation pressures, or other dangers inherent in drilling for oil and gas. Any of these events can be the result of human error. With increasing frequency, our services are deployed on more challenging prospects, particularly deep water offshore drilling sites, where the occurrence of the types of events mentioned above can have an even more catastrophic impact on people, equipment and the environment. Such events may expose us to significant potential losses, which could adversely affect our business, financial condition and results of operations.
We are vulnerable to risks associated with our offshore operations that could negatively impact our business, financial condition and results of operations.
We conduct offshore operations in the U.S. Gulf of Mexico and almost every significant international offshore market, including West Africa, Latin America, Europe, the Asia Pacific region and several other producing regions. Our operations and financial results could be significantly impacted by conditions in some of these areas because we are vulnerable to certain unique risks associated with operating offshore, including those relating to:
| • | hurricanes and other adverse weather conditions; |
| • | terrorist attacks, such as piracy; |
| • | failure of offshore equipment and facilities; |
| • | local and international political and economic conditions and policies and regulations related to offshore drilling; |
| • | unavailability of offshore drilling rigs in the markets that we operate; |
| • | the cost of offshore exploration for, and production and transportation of, oil and gas; |
| • | successful exploration for, and production and transportation of, oil and gas from onshore sources; |
| • | the availability and rate of discovery of new oil and gas reserves in offshore areas; and |
| • | the ability of oil and gas companies to generate or otherwise obtain funds for exploration and production. |
While the impact of these factors is difficult to predict, any one or more of these factors could adversely affect our business, financial condition and results of operations.
Our international operations and revenue expose us to political, economic and other uncertainties inherent to international business.
We have substantial international operations, and we intend to grow those operations further. For the year ended December 31, 2012 and the three months ended March 31, 2013, international operations accounted for approximately 44% and 47%, respectively, of our revenue. Our international operations are subject to a number of risks inherent in any business operating in foreign countries, including, but not limited to, the following:
| • | political, social and economic instability; |
| • | potential expropriation, seizure or nationalization of assets; |
17
Table of Contents
Index to Financial Statements
| • | deprivation of contract rights; |
| • | increased operating costs; |
| • | inability to collect revenues due to shortages of convertible currency; |
| • | unwillingness of foreign governments to make new onshore and offshore areas available for drilling; |
| • | civil unrest and protests, strikes, acts of terrorism, war or other armed conflict; |
| • | import/export quotas; |
| • | confiscatory taxation or other adverse tax policies; |
| • | continued application of foreign tax treaties; |
| • | currency exchange controls; |
| • | currency exchange rate fluctuations and devaluations; |
| • | restrictions on the repatriation of funds; and |
| • | other forms of government regulation which are beyond our control. |
Instability and disruptions in the political, regulatory, economic and social conditions of the foreign countries in which we conduct business, including economically and politically volatile areas such as Africa, the Middle East, Latin America and the Asia Pacific region, could cause or contribute to factors that could have an adverse effect on the demand for the products and services we provide. Worldwide political, economic, and military events have contributed to oil and gas price volatility and are likely to continue to do so in the future. Depending on the market prices of oil and gas, oil and gas exploration and development companies may cancel or curtail their drilling programs, thereby reducing demand for our services.
Additionally, our competitiveness in international market areas may be adversely affected by regulations that promote or incentivize, among other things, the:
| • | awarding of contracts to local contractors; and |
| • | establishment of foreign subsidiaries with significant ownership positions reserved by the foreign government for local citizens. |
While the impact of these factors is difficult to predict, any one or more of these factors could adversely affect our business, financial condition and results of operations.
To compete in our industry, we must continue to develop new technologies and products to support our tubular services, secure and maintain patents related to our current and new technologies and products as well as protect and enforce our intellectual property rights.
The markets for our tubular services are characterized by continual technological developments. While we believe that the proprietary products we have developed provide us with technological advances in providing services to our customers, substantial improvements in the scope and quality of the products in the market we operate may occur over a short period of time. If we are not able to develop commercially competitive products in a timely manner in response, our ability to service our customers’ demands may be adversely affected. Our future ability to develop new products in order to support our services depends on our ability to:
| • | design and produce products that allow us to meet the needs of our customers; and |
| • | obtain and maintain patent protection. |
18
Table of Contents
Index to Financial Statements
We may encounter resource constraints, technical barriers, or other difficulties that would delay introduction of new services and related products in the future. Our competitors may introduce new products or obtain patents before we do and achieve a competitive advantage. Additionally, the time and expense invested in product development may not result in commercial applications.
We currently hold multiple U.S. and international patents and have multiple pending patent applications for products and processes. Patent rights give the owner of a patent the right to exclude third parties from making, using, selling, and offering for sale the inventions claimed in the patents in the applicable country. Patent rights do not necessarily grant the owner of a patent the right to practice the invention claimed in a patent, but merely the right to exclude others from practicing the invention claimed in the patent. It may also be possible for a third party to design around our patents. Furthermore, patent rights have strict territorial limits. Some of our work will be conducted in international waters and would, therefore, not fall within the scope of any country’s patent jurisdiction. We may not be able to enforce our patents against infringement occurring in international waters and other “non-covered” territories. Also, we do not have patents in every jurisdiction in which we conduct business and our patent portfolio will not protect all aspects of our business and may relate to obsolete or unusual methods, which would not prevent third parties from entering the same market.
We attempt to limit access to and distribution of our technology by customarily entering into confidentiality agreements with our employees, customers and potential customers and suppliers. However, our rights in our confidential information, trade secrets, and confidential know-how will not prevent third parties from independently developing similar information. Publicly available information (e.g. information in expired issued patents, published patent applications, and scientific literature) can also be used by third parties to independently develop technology. We cannot provide assurance that this independently developed technology will not be equivalent or superior to our proprietary technology.
In addition, we may become involved in legal proceedings from time to time to protect and enforce our intellectual property rights. Third parties from time to time may initiate litigation against us by asserting that the conduct of our business infringes, misappropriates or otherwise violates intellectual property rights. We may not prevail in any such legal proceedings related to such claims, and our products and services may be found to infringe, impair, misappropriate, dilute or otherwise violate the intellectual property rights of others. Any legal proceeding concerning intellectual property could be protracted and costly and is inherently unpredictable and could have a material adverse effect on our business, regardless of its outcome. Further, our intellectual property rights may not have the value that management believes them to have and such value may change over time as we and others develop new product designs and improvements.
Our tubular services may be adversely affected by various laws and regulations in countries in which we operate relating to the equipment and operation of drilling units, oil and gas exploration and development, as well as import and export activities.
Governments in some foreign countries have been increasingly active in regulating and controlling the ownership of concessions and companies holding concessions, the exploration for oil and gas and other aspects of the oil and gas industries in their countries, including local content requirements for participating in tenders for certain tubular services. We operate in several of these countries, including Angola, Nigeria, Indonesia, Malaysia, Brazil and Canada. Many governments favor or effectively require that contracts be awarded to local contractors or require foreign contractors to employ citizens of, or purchase supplies from, a particular jurisdiction. These practices may result in inefficiencies or put us at a disadvantage when we bid for contracts against local competitors.
In addition, the shipment of goods, services and technology across international borders subjects us to extensive trade laws and regulations. Our import and export activities are governed by unique customs laws and regulations in each of the countries where we operate. Moreover, many countries control the import and export of certain goods, services and technology and impose related import and export recordkeeping and reporting obligations. Governments also may impose economic sanctions against certain countries, persons and other
19
Table of Contents
Index to Financial Statements
entities that may restrict or prohibit transactions involving such countries, persons and entities, and we are also subject to the U.S. anti-boycott law. In addition, certain anti-dumping regulations in the foreign countries in which we operate may prohibit us from purchasing pipe from certain suppliers.
The laws and regulations concerning import and export activity, recordkeeping and reporting, import and export control and economic sanctions are complex and constantly changing. These laws and regulations may be enacted, amended, enforced or interpreted in a manner materially impacting our operations. The global economic downturn may increase some foreign governments’ efforts to enact, enforce, amend or interpret laws and regulations as a method to increase revenue. Materials that we import can be delayed and denied for varying reasons, some of which are outside our control and some of which may result from failure to comply with existing legal and regulatory regimes. Shipping delays or denials could cause unscheduled operational downtime. Any failure to comply with these applicable legal and regulatory obligations also could result in criminal and civil penalties and sanctions, such as fines, imprisonment, debarment from government contracts, seizure of shipments and loss of import and export privileges.
We may be exposed to unforeseen risks in our services and product manufacturing, which could adversely affect our results of operations.
We operate a number of manufacturing facilities to support our tubular services. In addition, we also manufacture certain products, including large OD pipe connectors and casing attachments that we sell directly to external customers. The equipment and management systems necessary for such operations may break down, perform poorly or fail, resulting in fluctuations in manufacturing efficiencies. Additionally, some of our U.S. onshore business may be conducted under fixed price or “turnkey” contracts. Under fixed price contracts, we agree to perform a defined scope of work for a fixed price. Prices for these contracts are based largely upon estimates and assumptions relating to project scope and specifications, personnel and material needs.
Fluctuations in our manufacturing process and inaccurate estimates and assumptions used in our projects may occur due to factors out of our control, resulting in cost overruns, which we may be required to absorb and could have a material adverse effect on our business, financial condition and results of operations. Such fluctuations or incorrect estimates may affect our ability to deliver services and products to our customers on a timely basis and we may suffer financial penalties and a diminution of our commercial reputation and future product orders, which could adversely affect our business, financial condition and results of operations.
We may be unable to employ a sufficient number of skilled and qualified workers to sustain or expand our current operations.
The delivery of our tubular services requires personnel with specialized skills and experience. Our ability to be productive and profitable will depend upon our ability to employ and retain skilled workers. In addition, our ability to expand our operations depends in part on our ability to increase the size of our skilled labor force. The demand for skilled workers is high, the supply is limited, and the cost to attract and retain qualified personnel has increased over the past few years. In addition, we are currently a party to collective bargaining or similar agreements in certain international areas in which we operate, which could result in increases in the wage rates that we must pay to retain our employees. Furthermore, a significant increase in the wages paid by competing employers could result in a reduction of our skilled labor force, increases in the wage rates that we must pay, or both. If any of these events were to occur, our capacity could be diminished, our ability to respond quickly to customer demands or strong market conditions may be inhibited and our growth potential could be impaired, any of which could have a material adverse effect on our business, financial condition and results of operations.
We operate in an intensively competitive industry, and if we fail to compete effectively, our business will suffer.
Our competitors may attempt to increase their market share by reducing prices, or our customers may adopt competing technologies. The drilling industry is driven primarily by cost minimization, and our strategy is aimed at
20
Table of Contents
Index to Financial Statements
reducing drilling costs through the application of new technologies. Our competitors, many of whom have a more diverse product line and access to greater amounts of capital than we do, have the ability to compete against the cost savings generated by our technology by reducing prices and by introducing competing technologies. Our competitors may also have the ability to offer bundles of products and services to customers that we do not offer. We have limited resources to sustain prolonged price competition and maintain the level of investment required to continue the commercialization and development of our new technologies. Any failure to continue to do so could adversely affect our business, financial condition or results of operations.
Our business depends upon our ability to source low cost raw materials and components, such as steel castings and forgings. Increased costs of raw materials and other components may result in increased operating expenses.
Our ability to source low cost raw materials and components, such as steel castings and forgings, is critical to our ability to manufacture our drilling products competitively and, in turn, our ability to provide onshore and offshore drilling services. Should our current suppliers be unable to provide the necessary raw materials or components or otherwise fail to deliver such materials and components timely and in the quantities required, resulting delays in the provision of products or services to customers could have a material adverse effect on our business.
In particular, we have experienced increased costs in recent years due to rising steel prices. There is also strong demand within the industry for forgings, castings and outsourced coating services necessary for us to make our products. We cannot assure that we will be able to continue to purchase these raw materials on a timely basis or at historical prices. Our results of operations may be adversely affected by our inability to manage the rising costs and availability of raw materials and components used in our products.
Our tubular services are provided in connection with operations that are subject to potential hazards inherent in the oil and gas industry, and as a result, we are exposed to potential liabilities that may affect our financial condition and reputation.
Our tubular services are provided in connection with potentially hazardous drilling, completion and production applications in the oil and gas industry where an accident can potentially have catastrophic consequences. This is particularly true in deep water operations, where we are increasingly providing more tubular services. Risks inherent to these applications, such as equipment malfunctions and failures, equipment misuse and defects, explosions, blowouts and uncontrollable flows of oil, gas or well fluids and natural disasters, on land or in deep water or shallow-water environments, can cause personal injury, loss of life, suspension of operations, damage to formations, damage to facilities, business interruption and damage to or destruction of property, surface water and drinking water resources, equipment and the environment. If our services fail to meet specifications or are involved in accidents or failures, we could face warranty, contract, fines or other litigation claims, which could expose us to substantial liability for personal injury, wrongful death, property damage, loss of oil and gas production, pollution and other environmental damages. Our insurance policies may not be adequate to cover all liabilities. Further, insurance may not be generally available in the future or, if available, insurance premiums may make such insurance commercially unjustifiable. Moreover, even if we are successful in defending a claim, it could be time-consuming and costly to defend.
In addition, the frequency and severity of such incidents will affect operating costs, insurability and relationships with customers, employees and regulators. In particular, our customers may elect not to purchase our services if they view our safety record as unacceptable, which could cause us to lose customers and substantial revenues. In addition, these risks may be greater for us because we may acquire companies that have not allocated significant resources and management focus to safety and have a poor safety record requiring rehabilitative efforts during the integration process and we may incur liabilities for losses before such rehabilitation occurs.
21
Table of Contents
Index to Financial Statements
The imposition of stringent restrictions or prohibitions on offshore drilling by any governing body may have a material adverse effect on our business.
Events in recent years have heightened environmental and regulatory concerns about the oil and gas industry. From time to time, governing bodies have enacted and may propose legislation or regulations that would materially limit or prohibit offshore drilling in certain areas. If laws are enacted or other governmental action is taken that restrict or prohibit offshore drilling in our expected areas of operation, our expected future growth in offshore services could be reduced and our business could be materially adversely affected.
For example, the U.S. governmental, regulatory and industry response to the Deepwater Horizon drilling rig accident in April 2010 and resulting oil spill could have a prolonged and material adverse impact on drilling operations in the U.S. Gulf of Mexico. Following the April 2010 fire and explosion aboard the Deepwater Horizon drilling platform and subsequent release of oil from the Macondo well in the U.S. Gulf of Mexico, the federal Bureau of Ocean Energy Management, Regulation and Enforcement (“BOEMRE”) issued a moratorium on deep water drilling activities in the U.S. Gulf of Mexico, which was lifted on October 12, 2010, and also implemented a series of environmental, technological and safety measures intended to improve offshore safety systems and environmental protection. The safety regulations require operators to, among other things, submit independent third-party reports on the design and operation of blowout preventers (“BOPs”) and other well control systems, and conduct tests on the functionality of well control systems. Additional regulations address new standards for certain equipment involved in the construction of offshore wells, especially BOPs, and require operators to implement and enforce a safety and environmental management system, including regular third-party audits of safety procedures and drilling equipment to assure that offshore rig personnel and equipment remain in compliance with the new regulations. Each operator is also required to demonstrate that it has in place written and enforceable procedures, pursuant to applicable regulations, that ensure containment in the event of a deep water blowout. In October 2011, BOEMRE was separated into two federal bureaus, the Bureau of Ocean Energy Management (“BOEM”), which handles offshore leasing, resource evaluation, review and administration of oil and gas exploration and development plans, renewable energy development, National Environmental Policy Act analysis and environmental studies, and the Bureau of Safety and Environmental Enforcement (“BSEE”), which is responsible for the safety and enforcement functions of offshore oil and gas operations, including the development and enforcement of safety and environmental regulations, permitting of offshore exploration, development and production activities, inspections, offshore regulatory programs, oil spill response and newly formed training and environmental compliance programs.
The U.S. Gulf of Mexico represents a significant portion of the industry’s existing deep water demand, and we expect the provision of tubular services there to continue to account for a meaningful portion of our business. The legal and regulatory developments since the Deepwater Horizon incident have created significant uncertainty regarding the outlook of offshore drilling activity in the U.S. Gulf of Mexico and possible implications for regions outside of the U.S. Gulf of Mexico. If the new regulations, operating procedures and possibility of increased legal liability are viewed by our current or future customers as a significant impairment to expected profitability on drilling projects in the U.S. Gulf of Mexico, deep water drillships and other floating rigs could depart the U.S. Gulf of Mexico, which would likely affect the global supply and demand balance for our services. In addition to the new safety requirements issued by BOEMRE, the BSEE could issue additional safety and environmental guidelines or regulations for drilling in the U.S. Gulf of Mexico that could disrupt or delay drilling operations, increase the cost of drilling operations or reduce the area of operations for deep water drilling, and other governments could take similar actions. All of these uncertainties could result in increased future operating costs, including insurance costs, which we may not be able to pass through to our customers.
We may not be fully indemnified against financial losses in all circumstances where damage to or loss of property, personal injury, death or environmental harm occur.
As is customary in our industry, our contracts typically provide that our customers indemnify us for claims arising from the injury or death of their employees, the loss or damage of their equipment, damage to the
22
Table of Contents
Index to Financial Statements
reservoir and pollution emanating from the customer’s equipment or from the reservoir (including uncontained oil flow from a reservoir). Conversely, we typically indemnify our customers for claims arising from the injury or death of our employees, the loss or damage of our equipment, or pollution emanating from our equipment. Our contracts typically provide that our customer will indemnify us for claims arising from catastrophic events, such as a well blowout, fire or explosion.
Our indemnification arrangements may not protect us in every case. For example, from time to time (i) we may enter into contracts with less favorable indemnities or perform work without a contract that protects us, (ii) our indemnity arrangements may be held unenforceable in some courts and jurisdictions or (iii) we may be subject to other claims brought by third parties or government agencies. Furthermore, the parties from which we seek indemnity may not be solvent, may become bankrupt, may lack resources or insurance to honor their indemnities, or may not otherwise be able to satisfy their indemnity obligations to us. The lack of enforceable indemnification could expose us to significant potential losses.
Further, our assets generally are not insured against loss from political violence such as war, terrorism or civil unrest. If any of our assets are damaged or destroyed as a result of an uninsured cause, we could recognize a loss of those assets.
We may incur liabilities, fines, penalties or additional costs, or we may be unable to provide services to certain customers, if we do not maintain safe operations.
If we fail to comply with safety regulations or maintain an acceptable level of safety in connection with our tubular services, we may incur fines, penalties or other liabilities or may be held criminally liable. We expect to incur additional costs over time to upgrade equipment or conduct additional training or otherwise incur costs in connection with compliance with safety regulations. Failure to maintain safe operations or achieve certain safety performance metrics could disqualify us from doing business with certain customers, particularly major oil companies. Because we provide tubular services to a large number of major oil companies, any such failure could adversely affect our business, financial condition and results of operations.
The industry in which we operate is undergoing continuing consolidation that may impact results of operations.
Some of our largest customers have consolidated and are using their size and purchasing power to achieve economies of scale and pricing concessions. This consolidation may result in reduced capital spending by such customers or the acquisition of one or more of our other primary customers, which may lead to decreased demand for our products and services. If we cannot maintain sales levels for customers that have consolidated or replace such revenues with increased business activities from other customers, this consolidation activity could have a significant negative impact on our business, financial condition and results of operations. We are unable to predict what effect consolidations in the industries may have on prices, capital spending by customers, selling strategies, competitive position, ability to retain customers or ability to negotiate favorable agreements with customers.
Our operations and our customers’ operations are subject to a variety of governmental laws and regulations that may increase our costs, limit the demand for our services and products or restrict our operations.
Our business and our customers’ businesses may be significantly affected by:
| • | federal, state and local and non-U.S. laws and other regulations relating to oilfield operations, worker safety and protection of the environment; |
| • | changes in these laws and regulations; and |
| • | the level of enforcement of these laws and regulations. |
23
Table of Contents
Index to Financial Statements
In addition, we depend on the demand for our tubular services from the oil and gas industry. This demand is affected by changing taxes, price controls and other laws and regulations relating to the oil and gas industry in general. For example, the adoption of laws and regulations curtailing exploration and development drilling for oil and gas for economic or other policy reasons could adversely affect our operations by limiting demand for our products. In addition, some non-U.S. countries may adopt regulations or practices that give advantage to indigenous oil companies in bidding for oil leases, or require indigenous companies to perform oilfield services currently supplied by international service companies. To the extent that such companies are not our customers, or we are unable to develop relationships with them, our business may suffer. We cannot determine the extent to which our future operations and earnings may be affected by new legislation, new regulations or changes in existing regulations.
Because of our non-U.S. operations and sales, we are also subject to changes in non-U.S. laws and regulations that may encourage or require hiring of local contractors or require non-U.S. contractors to employ citizens of, or purchase supplies from, a particular jurisdiction. If we fail to comply with any applicable law or regulation, our business, financial condition and results of operations may be adversely affected.
An inability to obtain visas and work permits for our employees on a timely basis could negatively affect our operations and have an adverse effect on our business.
Our ability to provide services worldwide depends on our ability to obtain the necessary visas and work permits for our personnel to travel in and out of, and to work in, the jurisdictions in which we operate. Governmental actions in some of the jurisdictions in which we operate may make it difficult for us to move our personnel in and out of these jurisdictions by delaying or withholding the approval of these permits. If we are not able to obtain visas and work permits for the employees we need for conducting our tubular services on a timely basis, we might not be able to perform our obligations under our contracts, which could allow our customers to cancel the contracts. If our customers cancel some of our contracts, and we are unable to secure new contracts on a timely basis and on substantially similar terms, our business, financial condition and results of operations could be materially adversely affected.
Our operations are subject to environmental and operational safety laws and regulations that may expose us to significant costs and liabilities.
Our operations are subject to numerous stringent and complex laws and regulations governing the discharge of materials into the environment, health and safety aspects of our operations, or otherwise relating to human health and environmental protection. These laws and regulations may, among other things, regulate the management and disposal of hazardous and non-hazardous wastes; require acquisition of environmental permits related to our operations; restrict the types, quantities, and concentrations of various materials that can be released into the environment; limit or prohibit operational activities in certain ecologically sensitive and other protected areas; regulate specific health and safety criteria addressing worker protection; require compliance with operational and equipment standards; impose testing, reporting and record-keeping requirements; and require remedial measures to mitigate pollution from former and ongoing operations. Failure to comply with these laws and regulations or to obtain or comply with permits may result in the assessment of administrative, civil and criminal penalties, imposition of remedial or corrective action requirements and the imposition of injunctions to prohibit certain activities or force future compliance. Certain environmental laws may impose joint and several liability, without regard to fault or legality of conduct, on classes of persons who are considered to be responsible for the release of a hazardous substance into the environment.
The trend in environmental regulation has been to impose increasingly stringent restrictions and limitations on activities that may impact the environment. The implementation of new laws and regulations could result in materially increased costs, stricter standards and enforcement, larger fines and liability and increased capital expenditures and operating costs, particularly for our customers.
24
Table of Contents
Index to Financial Statements
Our operations in countries outside of the United States are subject to a number of U.S. federal laws and regulations, including restrictions imposed by the Foreign Corrupt Practices Act, as well as trade sanctions administered by the Office of Foreign Assets Control and the Commerce Department.
Local laws and customs in many countries differ significantly from those in the United States. In many countries, particularly in those with developing economies, it is common to engage in business practices that are prohibited by U.S. regulations applicable to us. The United States Foreign Corrupt Practices Act (“FCPA”) and similar anti-bribery laws in other jurisdictions, including the UK Bribery Act 2010 and the United Nations Convention Against Corruption, prohibit corporations and individuals, including us and our employees, from engaging in certain accounting practices or activities to obtain or retain business or to influence a person working in an official capacity. We do business and may do additional business in the future in countries and regions in which we may face, directly or indirectly, corrupt demands by officials, tribal or insurgent organizations, or private entities. Thus, we face the risk of unauthorized payments or offers of payments by one of our employees, contractors and agents, even though these parties are not always subject to our control. It is our policy to implement compliance procedures to prohibit these practices. However, our existing safeguards and any future improvements may prove to be less than effective, and our employees, contractors, and agents may engage in conduct for which we might be held responsible, regardless of whether such conduct occurs within or outside the United States. We may also be held responsible for any violations by an acquired company that occur prior to an acquisition, or subsequent to the acquisition but before we are able to institute our compliance procedures. In addition, our non-U.S. competitors that are not subject to the FCPA or similar laws may be able to secure business or other preferential treatment in such countries by means that such laws prohibit with respect to us. A violation of any of these laws, even if prohibited by our policies, may result in severe criminal or civil sanctions and other penalties, and could have a material adverse effect on our business. Actual or alleged violations could damage our reputation, be expensive to defend, and impair our ability to do business.
Compliance with U.S. regulations on trade sanctions and embargoes administered by the United States Department of the Treasury’s Office of Foreign Assets Control (“OFAC”) also poses a risk to us. We cannot provide products or services to certain countries subject to U.S. trade sanctions. Furthermore, the laws and regulations concerning import activity, export recordkeeping and reporting, export control and economic sanctions are complex and constantly changing. Any failure to comply with applicable legal and regulatory trading obligations could result in criminal and civil penalties and sanctions, such as fines, imprisonment, debarment from governmental contracts, seizure of shipments and loss of import and export privileges.
Compliance with and changes in laws could be costly and could affect operating results.
We have operations in the U.S. and in approximately 60 countries that can be impacted by expected and unexpected changes in the legal and business environments in which we operate. Political instability and regional issues in many of the areas in which we operate may contribute to such changes with greater significance or frequency. Our ability to manage our compliance costs and compliance programs will impact our ability to meet our earnings goals. Compliance-related issues could also limit our ability to do business in certain countries. Changes that could impact the legal environment include new legislation, new regulations, new policies, investigations and legal proceedings and new interpretations of existing legal rules and regulations, in particular, changes in export control laws or exchange control laws, additional restrictions on doing business in countries subject to sanctions and changes in laws in countries where we operate or intend to operate.
Restrictions on emissions of greenhouse gases could increase our operating costs or reduce demand for our products.
Environmental advocacy groups and regulatory agencies in the United States and other countries have focused considerable attention on emissions of carbon dioxide, methane and other greenhouse gases and their potential role in climate change. The U.S. Environmental Protection Agency (the “EPA”) has already begun to regulate greenhouse gas emissions under existing provisions of the federal Clean Air Act, and the state of
25
Table of Contents
Index to Financial Statements
California has established a “cap-and-trade” program requiring state-wide annual reductions in emission of greenhouse gasses. In addition, from time to time there have been proposals to impose a “carbon tax” based on the carbon content of combusted fuels. The adoption of additional legislation or regulatory programs to reduce emissions of greenhouse gases could require us to incur increased operating costs to comply with new emissions-reduction or reporting requirements. Any such legislation or regulatory programs could also increase the cost of consuming, and thereby reduce demand for, hydrocarbons that our customers produce. Consequently, legislation and regulatory programs to reduce emissions of greenhouse gases could have an adverse effect on our business, financial condition and results of operations. Finally, some scientists have concluded that increasing concentrations of greenhouse gases in the Earth’s atmosphere may produce climate changes that have significant physical effects, such as increased frequency and severity of storms, droughts, and floods and other climatic events.
We face risks related to natural disasters and pandemic diseases, which could result in severe property damage or materially and adversely disrupt our operations and affect travel required for our worldwide operations.
Some of our operations involve risks of, among other things, property damage, which could curtail our operations. For example, disruptions in operations or damage to a manufacturing plant could reduce our ability to produce products and satisfy customer demand. In particular, we have offices and manufacturing facilities in Houston, Texas and Lafayette, Louisiana and in various places throughout the Gulf Coast region of the United States. These offices and facilities are particularly susceptible to severe tropical storms and hurricanes, which may disrupt our operations. If one or more manufacturing facilities we own are damaged by severe weather or any other disaster, accident, catastrophe or event, our operations could be significantly interrupted. Similar interruptions could result from damage to production or other facilities that provide supplies or other raw materials to our plants or other stoppages arising from factors beyond our control. These interruptions might involve significant damage to, among other things, property, and repairs might take from a week or less for a minor incident to many months or more for a major interruption.
In addition, a portion of our business involves the movement of people and certain parts and supplies to or from foreign locations. Any restrictions on travel or shipments to and from foreign locations, due to the occurrence of natural disasters such as earthquakes, floods or hurricanes, or an epidemic or outbreak of diseases, including the H1N1 virus and the avian flu, in these locations, could significantly disrupt our operations and decrease our ability to provide services to our customers. In addition, our local workforce could be affected by such an occurrence or outbreak which could also significantly disrupt our operations and decrease our ability to provide services to our customers.
Our exposure to currency exchange rate fluctuations may result in fluctuations in our cash flows and could have an adverse effect on our financial condition and results of operations.
From time to time, fluctuations in currency exchange rates could be material to us depending upon, among other things, the principal regions in which we provide tubular services. For each of the year ended December 31, 2012 and the three months ended March 31, 2013, on a U.S. dollar-equivalent basis, approximately 25% of our revenue was represented by currencies other than the U.S. dollar. In particular, we are sensitive to fluctuations in currency exchange rates between the U.S. dollar and each of the Euro, Norwegian Krone, British Pound, Venezuelan Bolivar and Brazilian Real. There may be instances in which costs and revenue will not be matched with respect to currency denomination. As a result, to the extent that we continue our expansion on a global basis, as expected, we expect that increasing portions of revenue, costs, assets and liabilities will be subject to fluctuations in foreign currency valuations. We may experience economic loss and a negative impact on earnings or net assets solely as a result of foreign currency exchange rate fluctuations. Further, the markets in which we operate could restrict the removal or conversion of the local or foreign currency, resulting in our inability to hedge against these risks.
26
Table of Contents
Index to Financial Statements
Seasonal and weather conditions could adversely affect demand for our services and operations.
Weather can have a significant impact on demand as consumption of energy is seasonal, and any variation from normal weather patterns, such as cooler or warmer summers and winters, can have a significant impact on demand. Adverse weather conditions, such as hurricanes in the U.S. Gulf of Mexico or typhoons in the Asia Pacific region, may interrupt or curtail our operations, or our customers’ operations, cause supply disruptions and result in a loss of revenue and damage to our equipment and facilities, which may or may not be insured. Extreme winter conditions in Canada, Russia or the North Sea may interrupt or curtail our operations, or our customers’ operations, in those areas and result in a loss of revenue.
Legislation or regulations restricting the use of hydraulic fracturing could reduce demand for our services.
Hydraulic fracturing is an important and common practice in the oil and gas industry. The process involves the injection of water, sand and chemicals under pressure into a formation to fracture the surrounding rock and stimulate production of hydrocarbons. Certain environmental advocacy groups and regulatory agencies have suggested that additional federal, state and local laws and regulations may be needed to more closely regulate the hydraulic fracturing process, and have made claims that hydraulic fracturing techniques are harmful to surface water and drinking water resources and may cause earthquakes. Various governmental entities (within and outside the United States) are in the process of studying, restricting, regulating or preparing to regulate hydraulic fracturing, directly or indirectly. For example, the EPA has already begun to regulate certain hydraulic fracturing operations involving diesel under the Underground Injection Control program of the federal Safe Drinking Water Act, and is conducting a study to determine if additional regulation of hydraulic fracturing is warranted. The adoption of legislation or regulatory programs that restrict hydraulic fracturing could adversely affect, reduce or delay well drilling and completion activities, increase the cost of drilling and production, and thereby reduce demand for our services.
Customer credit risks could result in losses.
The concentration of our customers in the energy industry may impact our overall exposure to credit risk as customers may be similarly affected by prolonged changes in economic and industry conditions. Those countries that rely heavily upon income from hydrocarbon exports would be hit particularly hard by a drop in oil prices. Further, laws in some jurisdictions in which we operate could make collection difficult or time consuming. We perform ongoing credit evaluations of our customers and do not generally require collateral in support of our trade receivables. While we maintain reserves for potential credit losses, we cannot assure such reserves will be sufficient to meet write-offs of uncollectible receivables or that our losses from such receivables will be consistent with our expectations.
We may be unable to identify or complete acquisitions.
We expect that acquisitions will be an important element of our business strategy going forward. We can give no assurance that we will be able to integrate successfully the assets and operations of acquired businesses with our own business. Any inability on our part to integrate and manage the growth of acquired businesses may have a material adverse effect on our business, financial condition and results of operations. We can give no assurance that we will be able to identify and acquire additional businesses in the future on terms favorable to us.
Our executive officers and certain key personnel are critical to our business, and these officers and key personnel may not remain with us in the future.
Our future success depends in substantial part on our ability to hire and retain our executive officers and other key personnel. In particular, we are highly dependent on our executive officers, particularly Donald Keith Mosing, our Chairman, Chief Executive Officer and President. These individuals possess extensive expertise, talent and leadership, and they are critical to our success. The diminution or loss of the services of these individuals, or other integral key personnel affiliated with entities that we acquire in the future, could have a
27
Table of Contents
Index to Financial Statements
material adverse effect on our business. Furthermore, we may not be able to enforce all of the provisions in any employment agreement we have entered into with certain of our executive officers, and such employment agreements may not otherwise be effective in retaining such individuals. In addition, we may not be able to retain key employees of entities that we acquire in the future. This may impact our ability to successfully integrate or operate the assets we acquire.
Control of oil and gas reserves by state-owned oil companies may impact the demand for our services and create additional risks in our operations.
Much of the world’s oil and gas reserves are controlled by state-owned oil companies, and we provide tubular services for a number of those companies. State-owned oil companies may require their contractors to meet local content requirements or other local standards, such as joint ventures, that could be difficult or undesirable for us to meet. The failure to meet the local content requirements and other local standards may adversely impact our operations in those countries. In addition, our ability to work with state-owned oil companies is subject to our ability to negotiate and agree upon acceptable contract terms.
Risks Related to Our Organizational Structure
We are a holding company and our sole material asset after completion of this offering will be our indirect equity interest in FICV, and we are accordingly dependent upon distributions from FICV to pay taxes, make payments under the tax receivable agreement, and pay dividends.
We will be a holding company and will have no material assets other than our indirect equity interest in FICV. See “Organizational Structure.” We have no independent means of generating revenue. We intend to cause FICV to make distributions to us and Mosing Holdings in an amount sufficient to cover (i) all applicable taxes at assumed tax rates, (ii) payments under the tax receivable agreement we intend to enter into with Mosing Holdings and (iii) dividends, if any, declared by us. To the extent that we need funds and FICV or its subsidiaries is restricted from making such distributions under applicable law or regulation or under the terms of their financing or other contractual arrangements, or is otherwise unable to provide such funds, it could materially adversely affect our liquidity and financial condition.
The Mosing family will hold a majority of the combined voting power of the FINV Stock and, accordingly, will have substantial control over our management and affairs.
Immediately following the completion of this offering, the Mosing family will hold approximately 85.1% of the combined voting power of the FINV Stock (or 83.3% if the underwriters exercise their option to purchase additional shares of common stock in full) through FWW and Mosing Holdings. Accordingly, the Mosing family will have the ability to elect all of the members of both our management board and supervisory board, and thereby to control our management and affairs. Moreover, pursuant to our amended and restated articles of association, our board of directors will consist of no more than nine individuals. The Mosing family will have the right to recommend one director for nomination to the supervisory board for each 10% of the outstanding FINV Stock they collectively beneficially own, up to a maximum of five directors. The remaining directors will be nominated by our supervisory board. At the completion of this offering, our supervisory board will consist of four members, three of whom are members of the Mosing family and are also employees of us or one of our affiliates, including our chief executive officer. As a result, members of the Mosing family will have substantial influence over our operations and potential conflicts may arise, including with respect to matters related to the compensation of our chief executive officer and the other members of the Mosing family who serve on our supervisory board. In addition, the Mosing family will be able to determine the outcome of all matters requiring shareholder approval, including mergers, amendments of our articles of association and other material transactions, and will be able to cause or prevent a change in the composition of both our management board and supervisory board or a change in control of our company that could deprive our shareholders of an opportunity to receive a premium for their common stock as part of a sale of our company. The existence of significant
28
Table of Contents
Index to Financial Statements
shareholders may also have the effect of deterring hostile takeovers, delaying or preventing changes in control or changes in management, or limiting the ability of our other shareholders to approve transactions that they may deem to be in the best interests of our company. So long as the Mosing family continues to own a significant amount of the FINV Stock, even if such amount represents less than 50% of the aggregate voting power, it will continue to be able to strongly influence all matters requiring shareholder approval, regardless of whether or not other shareholders believe that the transaction is in their own best interests.
Pursuant to a voting agreement that will be entered into among Mosing Holdings, FWW and members of the Mosing family, each shareholder will agree to vote all of their shares of common stock and Series A preferred stock for the election of directors of our supervisory board and management board in the manner specified by a designated shareholder representative, which will initially be Keith Mosing, our chief executive officer. See “Certain Relationships and Related Person Transactions—Voting Agreement.”
The Mosing family may have interests that conflict with holders of shares of our common stock.
Immediately following the completion of this offering, the Mosing family will indirectly own % of the limited partnership interests in FICV. Because they hold a portion of their ownership interest in our business through FICV, rather than through FINV, the Mosing family may have conflicting interests with holders of shares of our common stock. For example, the Mosing family may have different tax positions from us which could influence their decisions regarding whether and when to cause us to dispose of assets, whether and when to cause us to incur new or refinance existing indebtedness, especially in light of the existence of the tax receivable agreement that we intend to enter into in connection with this offering. In addition, the structuring of future transactions may take into consideration the Mosing family’s tax or other considerations even where no similar benefit would accrue to us. See “Certain Relationships and Related Person Transactions—Tax Receivable Agreement.”
We will be required under the tax receivable agreement to pay Mosing Holdings or its permitted transferees for certain tax benefits we may claim, and the amounts we may pay could be significant.
We intend to enter into the tax receivable agreement with Mosing Holdings. This agreement generally will provide for the payment by us of 85% of actual reductions, if any, in payments of U.S. federal, state and local income tax or franchise tax (which reductions we refer to as “cash savings”) in periods after this offering as a result of (i) the tax basis increases resulting from the transfer of FICV interests to us in connection with a conversion of shares of Series A Preferred Stock into shares of our common stock and (ii) imputed interest deemed to be paid by us as a result of, and additional tax basis arising from, payments under the tax receivable agreement. In addition, the tax receivable agreement will provide for interest earned from the due date (without extensions) of the corresponding tax return to the date of payment specified by the tax receivable agreement.
The payment obligations under the tax receivable agreement are our obligations and are not obligations of FICV. The term of the tax receivable agreement will commence upon the completion of this offering and will continue until all such tax benefits have been utilized or expired, unless we exercise our right to terminate the tax receivable agreement.
Estimating the amount of payments that may be made under the tax receivable agreement is by its nature imprecise, insofar as the calculation of amounts payable depends on a variety of factors. The actual increase in tax basis, as well as the amount and timing of any payments under the tax receivable agreement, will vary depending upon a number of factors, including the timing of exchanges, the relative value of our U.S. and international assets at the time of the exchange, the price of shares of our common stock at the time of the exchange, the extent to which such exchanges are taxable, the amount and timing of the taxable income we realize in the future and the tax rate then applicable, our use of loss carryovers and the portion of our payments under the tax receivable agreement constituting imputed interest or depreciable or amortizable basis. We expect that the payments that we will be required to make under the tax receivable agreement will be substantial. There
29
Table of Contents
Index to Financial Statements
may be a substantial negative impact on our liquidity if, as a result of timing discrepancies or otherwise, (i) the payments under the tax receivable agreement exceed the actual benefits we realize in respect of the tax attributes subject to the tax receivable agreement or (ii) distributions to us by FICV are not sufficient to permit us to make payments under the tax receivable agreement subsequent to the payment of our taxes and other obligations. The payments under the tax receivable agreement will not be conditioned upon a holder of rights under a tax receivable agreement having a continued ownership interest in either FICV or us. While we may defer payments under the tax receivable agreement to the extent we do not have sufficient cash to make such payments, except in the case of an acceleration of payments thereunder occurring in connection with an early termination of the tax receivable agreement or certain mergers or changes of control, any such unpaid obligation will accrue interest. Additionally, during any such deferral period, we will be prohibited from paying dividends on our common stock. See “Certain Relationships and Related Person Transactions—Tax Receivable Agreement.”
In certain cases, payments under the tax receivable agreement to Mosing Holdings or its permitted transferees may be accelerated or significantly exceed the actual benefits, if any, we realize in respect of the tax attributes subject to the tax receivable agreement.
The tax receivable agreement provides that we may terminate it early. If we elect to terminate the tax receivable agreement early, we would be required to make an immediate payment equal to the present value of the anticipated future tax benefits subject to the tax receivable agreement (based upon certain assumptions and deemed events set forth in the tax receivable agreement, including the assumption that we have sufficient taxable income to fully utilize such benefits and that any interests in FICV that Mosing Holdings or its transferees own on the termination date are deemed to be exchanged on the termination date). Any early termination payment may be made significantly in advance of the actual realization, if any, of such future benefits. In addition, payments due under the tax receivable agreement will be similarly accelerated following certain mergers or other changes of control. In these situations, our obligations under the tax receivable agreement could have a substantial negative impact on our liquidity and could have the effect of delaying, deferring or preventing certain mergers, asset sales, other forms of business combinations or other changes of control. For example, if the tax receivable agreement were terminated immediately after this offering, the estimated termination payment would be approximately $78.1 million (calculated using a discount rate of 3.01%). The foregoing number is merely an estimate and the actual payment could differ materially. There can be no assurance that we will be able to finance our obligations under the tax receivable agreement. If we were unable to finance our obligations due under the tax receivable agreement, we would be in breach of the agreement. Any such breach could adversely affect our business, financial condition or results of operations.
Payments under the tax receivable agreement will be based on the tax reporting positions that we will determine. Although we are not aware of any issue that would cause the Internal Revenue Service (the “IRS”) to challenge a tax basis increase or other benefits arising under the tax receivable agreement, the holders of rights under the tax receivable agreement will not reimburse us for any payments previously made under the tax receivable agreement if such basis increases or other benefits are subsequently disallowed, except that excess payments made to any such holder will be netted against payments otherwise to be made, if any, to such holder after our determination of such excess. As a result, in such circumstances, we could make payments that are greater than our actual cash tax savings, if any, and may not be able to recoup those payments, which could adversely affect our liquidity.
Risks Related to Our Common Stock
The initial public offering price of our common stock may not be indicative of the market price of our common stock after this offering. In addition, an active liquid trading market for our common stock may not develop and our common stock price may be volatile.
Prior to this offering, our common stock was not traded on any market. An active and liquid trading market for our common stock may not develop or be maintained after this offering. Liquid and active trading markets usually result in less price volatility and more efficiency in carrying out investors’ purchase and sale orders. The
30
Table of Contents
Index to Financial Statements
market price of our common stock could vary significantly as a result of a number of factors, some of which are beyond our control. In the event of a drop in the market price of our common stock, you could lose a substantial part or all of your investment in our common stock. The initial public offering price will be negotiated between us and representatives of the underwriters, based on numerous factors which we discuss in the “Underwriting” section of this prospectus, and may not be indicative of the market price of our common stock after this offering. Consequently, you may not be able to sell shares of our common stock at prices equal to or greater than the price paid by you in the offering.
The following factors could affect our common stock price:
| • | our operating and financial performance; |
| • | quarterly variations in the rate of growth of our financial indicators, such as net income per share, net income, Adjusted EBITDA and revenues; |
| • | changes in revenue or earnings estimates or publication of reports by equity research analysts; |
| • | speculation in the press or investment community; |
| • | sales of our common stock by us or other shareholders, or the perception that such sales may occur; |
| • | general market conditions, including fluctuations in commodity prices; and |
| • | U.S. and international economic, legal and regulatory factors unrelated to our performance. |
The trading markets in general have experienced extreme volatility that has often been unrelated to the operating performance of particular companies. These broad market fluctuations may adversely affect the trading price of our common stock.
We will incur increased costs as a result of being a public company.
As a privately held company, we have not been responsible for the corporate governance and financial reporting practices and policies required of a publicly traded company. As a publicly traded company with listed equity securities we will need to comply with new laws, regulations and requirements, including corporate governance provisions of the Sarbanes-Oxley Act of 2002, and rules and regulations of the SEC and the NYSE, as well as the relevant provisions under Dutch law. Complying with these statutes, regulations and requirements will occupy a significant amount of time of our management board and supervisory board and will significantly increase our costs and expenses. Among other things, we will need to:
| • | institute a more comprehensive compliance function; |
| • | design, establish, evaluate and maintain a system of internal controls over financial reporting in compliance with the requirements of Section 404 of the Sarbanes-Oxley Act of 2002 and the related rules and regulations of the SEC and the Public Company Accounting Oversight Board (the “PCAOB”); |
| • | comply with rules promulgated by the NYSE; |
| • | prepare and distribute periodic public reports in compliance with our obligations under the federal securities laws; |
| • | establish new internal policies, such as those relating to disclosure controls and procedures and insider trading; |
| • | involve and retain to a greater degree outside counsel and accountants in the above activities; and |
| • | establish an investor relations function. |
These factors could also make it more difficult for us to attract and retain qualified members of our supervisory board, particularly to serve on our Audit Committee, qualified executive officers and key personnel.
31
Table of Contents
Index to Financial Statements
Future sales of our common stock in the public market could lower our stock price, and any additional capital raised by us through the sale of equity may dilute your ownership in us.
We may sell additional shares of common stock in subsequent public offerings. After the completion of this offering, we will have 149,024,000 outstanding shares of our common stock and 52,976,000 outstanding shares of Series A preferred stock that are convertible into an equivalent number of shares of common stock. Following the completion of this offering, members of the Mosing family will own, indirectly through FWW and Mosing Holdings, 119,024,000 shares of common stock and all of our shares of Series A preferred stock. Together, these shares will represent approximately 85.1% of our total outstanding FINV Stock (assuming no exercise of the underwriters’ option to purchase additional shares of common stock). All of these shares will be subject to a lock-up agreement as described in “Underwriting,” but may be sold into the market in the future.
As soon as practicable after this offering, we intend to file a registration statement with the SEC on Form S-8 providing for the registration of 20,000,000 shares of our common stock issued or reserved for issuance under our stock incentive plan and 3,000,000 shares of our common stock issued or reserved for issuance under our employee stock purchase plan. Subject to the satisfaction of vesting conditions and the expiration of lock-up agreements, shares registered under this registration statement on Form S-8 will be available for resale immediately in the public market without restriction.
We cannot predict the size of future issuances of our common stock or the effect, if any, that future issuances and sales of shares of our common stock will have on the market price of our common stock. Sales of substantial amounts of our common stock (including shares issued in connection with an acquisition), or the perception that such sales could occur, may adversely affect prevailing market prices of our common stock.
Our declaration of dividends is within the discretion of our management board, with the approval of our supervisory board, and subject to certain limitations under Dutch law, and there can be no assurance that we will pay dividends.
Our dividend policy is within the discretion of our management board, with the approval of our supervisory board, and will depend upon various factors, including our results of operations, financial condition, capital requirements and investment opportunities. We can provide no assurance that we will pay dividends on our common stock. No dividends on our common stock will accrue in arrears. In addition, Dutch law contains certain restrictions on a company’s ability to pay cash dividends, and we can provide no assurance that those restrictions will not prevent us from paying a dividend in future periods. See “Description of Capital Stock—Dividends.”
As a Dutch public company with limited liability, the rights of our shareholders may be different from the rights of shareholders in companies governed by the laws of U.S. jurisdictions.
We are a Dutch public company with limited liability (naamloze vennootschap). Our corporate affairs are governed by our articles of association and by the laws governing companies incorporated in The Netherlands. The rights of shareholders and the responsibilities of members of our management board and supervisory board may be different from those in companies governed by the laws of U.S. jurisdictions.
For example, resolutions of the general meeting of shareholders may be taken with majorities different from the majorities required for adoption of equivalent resolutions in, for example, Delaware corporations. Although shareholders will have the right to approve legal mergers or demergers, Dutch law does not grant appraisal rights to a company’s shareholders who wish to challenge the consideration to be paid upon a legal merger or demerger of a company.
In addition, if a third party is liable to a Dutch company, under Dutch law shareholders generally do not have the right to bring an action on behalf of the company or to bring an action on their own behalf to recover damages sustained as a result of a decrease in value, or loss of an increase in value, of their ordinary shares. Only in the event that the cause of liability of such third party to the company also constitutes a tortious act directly
32
Table of Contents
Index to Financial Statements
against such shareholder and the damages sustained are permanent, may that shareholder have an individual right of action against such third party on its own behalf to recover damages. The Dutch Civil Code provides for the possibility to initiate such actions collectively. A foundation or an association whose objective, as stated in its articles of association, is to protect the rights of persons having similar interests may institute a collective action. The collective action cannot result in an order for payment of monetary damages but may result in a declaratory judgment (verklaring voor recht), for example declaring that a party has acted wrongfully or has breached a fiduciary duty. The foundation or association and the defendant are permitted to reach (often on the basis of such declaratory judgment) a settlement which provides for monetary compensation for damages. A designated Dutch court may declare the settlement agreement binding upon all the injured parties, whereby an individual injured party will have the choice to opt-out within the term set by the court (at least three months). Such individual injured party, may also individually institute a civil claim for damages within the before mentioned term.
Furthermore, certain provisions of Dutch corporate law have the effect of concentrating control over certain corporate decisions and transactions in the hands of our management board and supervisory board. As a result, holders of our shares may have more difficulty in protecting their interests in the face of actions by members of our management board and supervisory board than if we were incorporated in the United States.
In the performance of its duties, our management board and supervisory board will be required by Dutch law to act in the interest of the company and its affiliated business, and to consider the interests of our company, our shareholders, our employees and other stakeholders in all cases with reasonableness and fairness. It is possible that some of these parties will have interests that are different from, or in addition to, interests of our shareholders.
Our articles of association and Dutch corporate law contain provisions that may discourage a takeover attempt.
Provisions contained in the amended and restated articles of association that we intend to adopt in connection with this offering and the laws of The Netherlands could make it more difficult for a third party to acquire us, even if doing so might be beneficial to our shareholders. Provisions of our articles of association impose various procedural and other requirements, which could make it more difficult for shareholders to effect certain corporate actions. Among other things, these provisions:
| • | authorize our management board, with the approval of our supervisory board, for a period of five years from the date of the offering to issue preferred stock, including for defensive purposes, and shares of common stock, in each case without shareholder approval; and |
| • | do not provide for shareholder action by written consent, thereby requiring all shareholder actions to be taken at a general meeting of shareholders. |
These provisions, alone or together, could delay hostile takeovers and changes in control of our company or changes in our management. See “Description of Capital Stock—Anti-Takeover Provisions.”
It may be difficult for you to obtain or enforce judgments against us or some of our executive officers and directors and some of our named experts in the United States or The Netherlands.
We were formed under the laws of The Netherlands and, as such, the rights of holders of our ordinary shares and the civil liability of our directors will be governed by the laws of The Netherlands and our amended and restated articles of association. Some of the named experts referred to in this prospectus are not residents of the United States and some of our directors and executive officers and some of our assets and some of the assets of our directors and executive officers are located outside the United States.
In the absence of an applicable convention between the United States and The Netherlands providing for the reciprocal recognition and enforcement of judgments (other than arbitration awards and divorce decrees) in civil
33
Table of Contents
Index to Financial Statements
and commercial matters, a judgment rendered by a court in the United States will not automatically be recognized by the courts of The Netherlands. In principle, the courts of The Netherlands will be free to decide, at their own discretion, if and to what extent a judgment rendered by a court in the United States should be recognized in The Netherlands. In general terms, Dutch courts tend to grant the same judgment without re-litigating on the merits if the following three cumulative minimum conditions are met:
| • | the judgment was rendered by the foreign court that was (based on internationally accepted grounds) competent to take cognizance of the matter; |
| • | the judgment is the outcome of a proper judicial procedure (behoorlijke rechtspleging); and |
| • | the judgment is not manifestly incompatible with the public policy (openbare orde) of The Netherlands. |
Without prejudice to the above, in order to obtain enforcement of a judgment rendered by a United States court in The Netherlands, a claim against the relevant party on the basis of such judgment should be brought before the competent court of The Netherlands. During the proceedings such court will assess, when requested, whether a foreign judgment meets the above conditions. In the affirmative, the court may order that substantive examination of the matter shall be dispensed with. In such case, the court will confine itself to an order reiterating the foreign judgment against the party against whom it had been obtained.
Otherwise, a new substantive examination will take place in the framework of the proceedings. In all of the above situations, when applying the law of any jurisdiction (including The Netherlands), Dutch courts may give effect to the mandatory rules of the laws of another country with which the situation has a close connection, if and insofar as, under the law of the latter country, those rules must be applied regardless of the law applicable to the contract or legal relationship. In considering whether to give effect to these mandatory rules of such third country, regard shall be given to the nature, purpose and the consequences of their application or non-application. Moreover, a Dutch court may give effect to the rules of the laws of The Netherlands in a situation where they are mandatory irrespective of the law otherwise applicable to the documents or legal relationship in question. The application of a rule of the law of any country that otherwise would govern an obligation may be refused by the courts of The Netherlands if such application is manifestly incompatible with the public policy (openbare orde) of The Netherlands.
Under our amended and restated articles of association, we will indemnify and hold our officers and directors harmless against all claims and suits brought against them, subject to limited exceptions. Under our amended and restated articles of association, to the extent allowed by law, the rights and obligations among or between us, any of our current or former directors, officers and employees and any current or former shareholder will be governed exclusively by the laws of The Netherlands and subject to the jurisdiction of Dutch courts, unless those rights or obligations do not relate to or arise out of their capacities listed above. Although there is doubt as to whether U.S. courts would enforce such provision in an action brought in the United States under U.S. securities laws, this provision could make judgments obtained outside of The Netherlands more difficult to have recognized and enforced against our assets in The Netherlands or jurisdictions that would apply Dutch law. Insofar as a release is deemed to represent a condition, stipulation or provision binding any person acquiring our ordinary shares to waive compliance with any provision of the Securities Act or of the rules and regulations of the SEC, such release will be void.
Purchasers of common stock will experience immediate and substantial dilution.
Assuming an initial public offering price of $20.00 per share (the mid-point of the price range set forth on the cover page of this prospectus), purchasers of our common stock in this offering will experience an immediate and substantial dilution of $15.30 per share in the net tangible book value per share of common stock from the initial public offering price, and our pro forma net tangible book value as of March 31, 2013, after giving effect to this offering, would be $4.70 per share. In addition, our amended and restated articles of association allow us to issue significant numbers of additional shares, including shares that may be issued under our long-term incentive plans. We expect to grant restricted stock units representing an aggregate of 3,900,000 shares of common stock (based upon the midpoint of the price range set forth on the cover page of this prospectus) to our
34
Table of Contents
Index to Financial Statements
officers and employees concurrently with this offering as described in “Compensation Discussion and Analysis—Components of Our Executive Compensation Program—Long-Term Incentive Plan.” See “Dilution” for a complete description of the calculation of net tangible book value.
We will be a “controlled company” within the meaning of the NYSE rules and will qualify for and have the ability to rely on exemptions from certain NYSE corporate governance requirements.
Because the Mosing family will beneficially own a majority of our outstanding common stock following the completion of this offering, we will be a “controlled company” as that term is set forth in Section 303A of the NYSE Listed Company Manual. Under the NYSE rules, a company of which more than 50% of the voting power is held by another person or group of persons acting together is a “controlled company” and may elect not to comply with certain NYSE corporate governance requirements, including:
| • | the requirement that a majority of its supervisory board consist of independent directors; |
| • | the requirement that its nominating and governance committee be composed entirely of independent directors with a written charter addressing the committee’s purpose and responsibilities; and |
| • | the requirement that its compensation committee be composed entirely of independent directors with a written charter addressing the committee’s purpose and responsibilities. |
These requirements will not apply to us as long as we remain a “controlled company.” Following the completion of this offering, and so long as members of the Mosing family control the outstanding common stock and Series A preferred stock representing at least a majority of the outstanding voting power in FINV, we have the option to utilize these exemptions. Accordingly, should we choose to utilize such exemptions, you may not have the same protections afforded to shareholders of companies that are subject to all of the corporate governance requirements of the NYSE. The significant ownership interest held by members of the Mosing family could adversely affect investors’ perceptions of our corporate governance. See “Management—Board Structure.”
Tax Risks
Changes in tax laws, treaties or regulations or adverse outcomes resulting from examination of our tax returns could adversely affect our financial results.
Our future effective tax rates could be adversely affected by changes in tax laws, treaties and regulations, both in the United States and internationally. Tax laws, treaties and regulations are highly complex and subject to interpretation. Consequently, we are subject to changing tax laws, treaties and regulations in and between countries in which we operate or are resident. Our income tax expense is based upon the interpretation of the tax laws in effect in various countries at the time that the expense was incurred. A change in these tax laws, treaties or regulations, or in the interpretation thereof, could result in a materially higher tax expense or a higher effective tax rate on our worldwide earnings. If any country successfully challenges our income tax filings based on our structure, or if we otherwise lose a material tax dispute, our effective tax rate on worldwide earnings could increase substantially and our financial results could be materially adversely affected.
U.S. tax authorities could treat us as a “passive foreign investment company,” which could have adverse U.S. federal income tax consequences to U.S. holders.
A foreign corporation will be treated as a “passive foreign investment company,” or PFIC, for U.S. federal income tax purposes if either (1) at least 75% of its gross income for any taxable year consists of certain types of “passive income” or (2) at least 50% of the average value of the corporation’s assets for any taxable year produce or are held for the production of those types of “passive income.” For purposes of these tests, “passive income” includes dividends, interest and gains from the sale or exchange of investment property and rents and royalties other than certain rents and royalties which are received from unrelated parties in connection with the active conduct of a trade or business, but does not include income derived from the performance of services. U.S.
35
Table of Contents
Index to Financial Statements
shareholders of a PFIC are subject to a disadvantageous U.S. federal income tax regime with respect to the income derived by the PFIC, the distributions they receive from the PFIC, and the gain, if any, they derive from the sale or other disposition of their interests in the PFIC.
We believe that we will not be a PFIC for the current taxable year or for any future taxable year. However, this involves a facts and circumstances analysis and it is possible that the IRS would not agree with our conclusion, or the U.S. tax laws could change significantly. See “Material U.S. Federal Income Tax Considerations—PFIC Status and Significant Tax Consequences.”
U.S. “anti-inversion” tax laws could negatively affect our results and could result in a reduced amount of foreign tax credit for U.S. Holders.
Under rules contained in U.S. tax law, we would be subject to tax as a U.S. corporation in the event the we acquire substantially all of the assets of a U.S. corporation and the equity owners of that U.S. corporation own at least 80% (calculated without regard for any stock issued in a public offering) of our stock by reason of holding stock in the U.S. corporation. For purposes of applying these rules, the rights associated with the Series A preferred stock and the interests in FICV would likely result in the holders thereof being deemed to own our common stock under the “stock equivalent” portion of the rules.
We will acquire the assets of Mosing Holdings (a U.S. corporation); however, the ownership of Mosing Holdings in our stock, taking into account common stock that Mosing Holdings is deemed to own under the “stock equivalent” rules, is substantially below the 80% standard for the application of the rules. Accordingly, we do not believe these rules should apply.
There can be no assurance that the IRS will not challenge our determination that these rules are inapplicable. In the event that these rules were applicable, we would be subject to U.S. federal income tax on our worldwide income, which would negatively impact our cash available for distribution and the value of our common stock. Application of the rules could also adversely affect the ability of a U.S. Holder (as defined in “Material U.S. Federal Income Tax Considerations”) to obtain a U.S. tax credit with respect to any Dutch withholding tax imposed on distributions.
36
Table of Contents
Index to Financial Statements
CAUTIONARY NOTE REGARDING FORWARD-LOOKING STATEMENTS
This prospectus contains forward-looking statements that are subject to a number of risks and uncertainties, many of which are beyond our control. All statements, other than statements of historical fact included in this prospectus, regarding our strategy, future operations, financial position, estimated revenues and losses, projected costs, prospects, plans and objectives of management are forward-looking statements. When used in this prospectus, the words “could,” “believe,” “anticipate,” “intend,” “estimate,” “expect,” “may,” “continue,” “predict,” “potential,” “project” and similar expressions are intended to identify forward-looking statements, although not all forward-looking statements contain such identifying words.
Forward-looking statements appear in a number of places in this prospectus, including “Prospectus Summary,” “Risk Factors,” “Dividend Policy,” “Management’s Discussion and Analysis of Financial Condition and Results of Operations” and “Business” and may include statements about, among other things:
| • | our business strategy and prospects for growth; |
| • | our cash flows and liquidity; |
| • | our financial strategy, budget, projections and operating results; |
| • | the amount, nature and timing of capital expenditures; |
| • | the availability and terms of capital; |
| • | competition and government regulations; and |
| • | general economic conditions. |
Although we believe that the expectations reflected in such forward-looking statements are reasonable, we cannot give any assurance that such expectations will prove correct. The forward-looking statements involve risks and uncertainties. Important factors that could cause actual results to differ materially from our expectations included, but are not limited to, the following:
| • | the level of activity in the oil and gas industry; |
| • | the volatility of oil and gas prices; |
| • | unique risks associated with our offshore operations; |
| • | political, economic and regulatory uncertainties in our international operations; |
| • | our ability to develop new technologies and products; |
| • | our ability to protect our intellectual property rights; |
| • | our ability to employ and retain skilled and qualified workers; |
| • | the level of competition in our industry; |
| • | operational safety laws and regulations; |
| • | weather conditions and natural disasters; and |
| • | other factors discussed in “Risk Factors,” “Management’s Discussion and Analysis of Financial Condition and Results of Operations” and elsewhere in this prospectus. |
All forward-looking statements speak only as of the date of this prospectus; we disclaim any obligation to update these statements unless required by law and we caution you not to place undue reliance on them. It is not possible for our management to predict all risks, nor can we assess the impact of all factors on our business or the extent to which any factor, or combination of factors, may cause actual results to differ materially from those contained in any forward-looking statements that we make. These cautionary statements qualify all forward-looking statements attributable to us or persons acting on our behalf.
37
Table of Contents
Index to Financial Statements
The diagram below depicts our simplified organizational structure immediately following the completion of this offering (assuming that the underwriters’ option to purchase additional shares of common stock is not exercised and without giving effect to the grant of restricted stock units representing an aggregate of 3,900,000 shares of common stock (based upon the midpoint of the price range set forth on the cover page of this prospectus) to our officers and employees concurrently with this offering as described in “Compensation Discussion and Analysis—Components of Our Executive Compensation Program—Long-Term Incentive Plan”):
Frank’s International N.V.
Following completion of this offering, FINV, the issuer of common stock in this offering, will act as a holding company whose sole material assets will consist of indirect general and limited partnership interests in
38
Table of Contents
Index to Financial Statements
FICV. As the indirect sole shareholder of the general partner of FICV, FINV will be responsible for all operational, management and administrative decisions relating to FICV’s business and will consolidate the financial results of FICV and its subsidiaries.
The articles of association of FINV authorize two classes of stock, common stock and Series A preferred stock. See “Description of Capital Stock.” Only common stock will be sold to investors pursuant to this offering. Shares of our common stock will also be held indirectly by members of the Mosing family through FWW. 52,976,000 Shares of Series A preferred stock will be held by Mosing Holdings as described below. Each share of Series A preferred stock will have a liquidation preference equal to its par value of €0.01 per share (or €529,760 in the aggregate) and will be entitled to an annual dividend equal to 0.25% of its par value (or €1,324 per annum in the aggregate). Additionally, each share of Series A preferred stock will entitle its holder to vote together with the common stock as a single class on all matters presented to FINV’s shareholders for their vote.
Formation of FICV
FICV is a newly formed limited partnership that was formed to act as a holding company of various U.S. and foreign operating companies engaged in our business. Prior to this offering, our foreign operating companies have been owned directly or indirectly by FINV, and our U.S. operating companies have been owned directly or indirectly by Mosing Holdings, which is owned by members of the Mosing family. In connection with this offering, FINV will contribute all of our foreign operating subsidiaries and a portion of the proceeds from this offering to FICV, and Mosing Holdings will contribute all of our U.S. operating subsidiaries (excluding certain assets that generate a de minimis amount of revenue, including aircraft, real estate and life insurance policies) to FICV. We intend to enter into real estate lease agreements and an aviation services agreement with customary terms for continued use of the real estate and aircraft. See “Certain Relationships and Related Party Transactions—Transactions with Our Directors, Executive Officers and Affiliates.”
In exchange for this contribution (and after giving effect to this offering assuming the underwriters’ option to purchase additional shares of common stock is not exercised),
| (i) | FINV will (indirectly) hold a 73.7% limited partnership interest and a 0.1% general partnership in FICV; and |
| (ii) | Mosing Holdings will hold a 26.2% limited partnership interest in FICV. |
In order to give Mosing Holdings a percentage vote in FINV that is equal to the percentage limited partnership interest in FICV that Mosing Holdings will receive in exchange for its contribution to FICV, Mosing Holdings will also receive 52,976,000 shares of Series A preferred stock of FINV in the exchange.
Following the completion of this offering, the Mosing family will own, indirectly through Mosing Holdings and FWW, FINV Stock and FICV limited partnership interests that in the aggregate will represent approximately 85.1% of the economic interests in and voting power of our combined company (or 83.3% if the underwriters’ option to purchase additional shares of common stock is exercised in full).
For purposes of any transfer or exchange of Series A preferred stock and limited partnership interests in FICV, the articles of association of FINV and the partnership agreement of FICV contain provisions linking each share of Series A preferred stock in FINV to a proportionate portion of the limited partnership interest in FICV held by Mosing Holdings or its permitted transferee, which portion at any time will equal the total limited partnership interest in FICV held by Mosing Holdings or its permitted transferee divided by the total number of issued and outstanding shares of Series A preferred stock of FINV (each such portion being referred to as an “FICV Portion”). Shares of Series A preferred stock cannot be transferred unless simultaneously with an equal number of FICV Portions and vice versa.
39
Table of Contents
Index to Financial Statements
Mosing Holdings (or any of its permitted transferees) will have the right to convert all or a portion of its Series A preferred stock into FINV common stock by delivery to FINV of an equivalent number of FICV Portions. In connection with such conversion, Mosing Holdings or its permitted transferees will also be entitled to receive an amount of cash equal to the par value of each share of Series A preferred stock so converted plus any accrued but unpaid dividends thereon.
The above mechanism is subject to customary conversion rate adjustments for stock splits, stock dividends and reclassifications.
See “Certain Relationships and Related Party Transactions—Limited Partnership Agreement of FICV.”
Offering
Only common stock will be sold to investors pursuant to this offering. Immediately following the completion of this offering, there will be 149,024,000 shares of common stock issued and outstanding (or 153,524,000 shares of common stock if the underwriters exercise in full their option to purchase additional shares of common stock). We estimate that our net proceeds from this offering, after deducting estimated underwriting discounts and commissions and other offering related expenses, will be approximately $562.0 million (or $646.8 million if the underwriters exercise in full their option to purchase additional shares of common stock). A portion of the proceeds of this offering will be used to repay in full the outstanding notes payable to FWW, under which there was an aggregate of $443.7 million outstanding as of March 31, 2013. FINV will contribute any remaining proceeds (including any proceeds attributable to the underwriters’ exercise of their option to purchase additional shares of common stock) to FICV. Following any such contribution, FINV’s percentage ownership interest in FICV will equal the percentage of outstanding FINV Stock represented by FINV’s outstanding common stock.
As a result of the formation of FICV and the offering described above (and prior to any conversions of shares of Series A preferred stock into shares of our common stock):
| • | the investors in this offering will collectively own 30,000,000 shares of common stock (or 34,500,000 shares of common stock if the underwriters exercise in full their option to purchase additional shares of common stock), and FINV will hold an interest in FICV that is equal to the percentage of the total number of outstanding shares of FINV Stock represented by our common stock; |
| • | Mosing Holdings will hold 52,976,000 shares of Series A preferred stock and an interest in FICV that is equal to the percentage of the total number of outstanding shares of FINV Stock represented by such shares of Series A preferred stock; |
| • | the investors in this offering will collectively hold 14.9% (or 16.7% if the underwriters exercise in full their option to purchase additional shares of common stock) of the voting power in FINV; and |
| • | the Mosing Family, through their ownership of Mosing Holdings and FWW, will hold 85.1% (or 83.3% if the underwriters exercise in full their option to purchase additional shares of common stock) of the voting power in FINV. |
Holding Company Structure
Following completion of this offering, FINV will act as a holding company whose sole material assets will consist of indirect general and limited partnership interests in FICV. As the owner of the general partner of FICV, FINV will be responsible for all operational, management and administrative decisions relating to FICV’s business and will consolidate the financial results of FICV and its subsidiaries.
Our post-offering organizational structure will allow the Mosing Family to retain a portion of their equity ownership in our company through FICV, an entity that is classified as a partnership for U.S. federal income tax purposes, with the remainder of their ownership being in the form of common stock of FINV. Investors in this
40
Table of Contents
Index to Financial Statements
offering will, by contrast, hold all of their equity ownership in the form of shares of common stock of FINV, which is classified as a corporation for U.S. federal income tax purposes. We believe that the members of the Mosing family generally find it advantageous to hold their equity interests in an entity that is not taxable as a corporation for U.S. federal income tax purposes. The Mosing family, like FINV, will generally incur U.S. federal, state and local income taxes on their proportionate share of any taxable income of FICV.
FINV’s articles of association and FICV’s limited partnership agreement will provide for customary mechanisms to ensure that (i) FINV’s percentage interest in FICV will always equal the percentage of the total number of outstanding shares of FINV Stock represented by our outstanding common stock and (ii) Mosing Holding’s (together with any permitted transferee’s) percentage interest in FICV will always equal the percentage of the total number of outstanding shares of FINV Stock represented by our outstanding Series A preferred stock.
FINV will generally be subject to U.S. federal, state and local income taxes on its proportionate share of FICV’s taxable income attributable to U.S. operations. FINV may also incur U.S. branch profits tax on its proportionate share of FICV’s taxable income attributable to U.S. operations. The U.S. branch profits tax is imposed on a non-U.S. corporation’s “dividend equivalent amount,” which generally consists of the corporation’s after-tax earnings and profits (as determined under U.S. federal income tax principles) that are effectively connected with the corporation’s U.S. trade or business but are not reinvested in a U.S. business. The limited partnership agreement of FICV provides for distributions to be made at the discretion of the general partner on a pro rata basis to the holders of interests in FICV for purposes of funding the holders’ tax obligations with respect to the income of FICV allocated to them. Generally, these tax distributions will be computed based on our estimate of the taxable income of FICV allocable to a holder multiplied by an assumed tax rate equal to the highest effective marginal combined U.S. federal, state and local income tax rate prescribed for an individual resident in Louisiana. See “Certain Relationships and Related Person Transactions—Limited Partnership Agreement of FICV.”
In connection with our formation transactions, we will enter into a tax receivable agreement with Mosing Holdings. This agreement generally will provide for the payment by FINV of 85% of actual reductions, if any, in payments of U.S. federal, state and local income tax or franchise tax (which reductions we refer to as “cash savings”) in periods after this offering as a result of (i) the tax basis increases resulting from the transfer of FICV interests to us in connection with a conversion of shares of Series A preferred stock into shares of our common stock and (ii) imputed interest deemed to be paid by us as a result of, and additional tax basis arising from, any payments we make under the tax receivable agreement. FINV will retain the benefit of the remaining 15% of these cash savings. See “Certain Relationships and Related Party Transactions—Tax Receivable Agreement.”
41
Table of Contents
Index to Financial Statements
We expect to receive net proceeds of approximately $562.0 million from the sale of the common stock by us in this offering, assuming an initial public offering price of $20.00 per share (the midpoint of the price range set forth on the cover page of this prospectus) and after deducting estimated expenses payable by us and underwriting discounts and commissions of approximately $34.5 million. We intend to use the net proceeds from this offering to repay in full the outstanding notes payable to FWW, under which there was an aggregate of $443.7 million outstanding as of March 31, 2013. Any remaining net proceeds (including any proceeds attributable to the underwriters’ exercise of their option to purchase additional shares of common stock) will be contributed to FICV. FICV will use any such proceeds for general corporate purposes.
The notes payable to FWW each bore interest at a rate of 0.24% per annum as of March 31, 2013. The $320.0 million note is payable on demand, and the $220.0 million note matures in December 2020. The notes payable were issued in order to fund a distribution of $484.0 million to the owners of FINV.
An increase or decrease in the initial public offering price of $1.00 per share of common stock would cause the net proceeds that we will receive from the offering, after deducting estimated expenses and underwriting discounts and commissions, to increase or decrease by approximately $28.3 million.
Following the completion of this offering, we intend to pay a regular quarterly dividend on our common stock of $0.075 per share, or an aggregate of approximately $44.7 million on an annual basis. However, our future dividend policy is within the discretion of our management board, with the approval of our supervisory board, and will depend upon various factors, including our results of operations, financial condition, capital requirements and investment opportunities. In addition, each share of Series A preferred stock will have a liquidation preference equal to its par value of €0.01 per share and will be entitled to an annual dividend equal to 0.25% of its par value. Based upon the number of Series A preferred shares outstanding upon completion of this offering, this amount would be €1,324 in the aggregate. We will only be able to pay dividends from our available cash on hand and funds received from FICV. FICV’s ability to make distributions to us will depend on many factors, including the performance of our business in the future. In order to make these distributions on our common stock and Series A preferred stock, we expect that FICV will be required to distribute approximately $60.6 million pro rata to holders of FICV interests. This aggregate amount would have represented approximately 20.6% of our pro forma net income and 13.6% of our pro forma Adjusted EBITDA for the year ended December 31, 2012. See “Management’s Discussion and Analysis of Financial Condition and Results of Operations—Liquidity and Capital Resources—Liquidity.”
42
Table of Contents
Index to Financial Statements
The following table sets forth our capitalization as of March 31, 2013:
| • | for Frank’s International; and |
| • | on a pro forma basis after giving effect to the restructuring transactions described in “Organizational Structure” and the sale of 30,000,000 shares of common stock in this offering at the initial public offering price of $20.00 per share (the midpoint of the estimated price range set forth on the cover page of this prospectus), after deducting underwriting discounts and estimated offering expenses and the application of the net proceeds as set forth in “Use of Proceeds.” |
You should read the following table in conjunction with “Organizational Structure,” “Use of Proceeds,” “Selected Historical Combined and Unaudited Pro Forma Financial Data,” “Management’s Discussion and Analysis of Financial Condition and Results of Operations” and our historical combined financial statements and related notes thereto appearing elsewhere in this prospectus.
| As of March 31, 2013 | ||||||||
| Frank’s International |
Pro Forma | |||||||
| (in thousands) | ||||||||
| Cash and cash equivalents (1) |
$ | 123,392 | $ | 241,684 | ||||
|
|
|
|
|
|||||
| Long-term debt, including current maturities: |
||||||||
| Lines of credit |
$ | 2,000 | $ | 2,000 | ||||
| Notes payable—excluding affiliates |
2,981 | 2,981 | ||||||
| Notes payable—affiliated (2)(3) |
448,838 | 2,881 | ||||||
| Equipment financing and other(3) |
877 | 78 | ||||||
|
|
|
|
|
|||||
| Total long-term debt |
454,696 | 7,940 | ||||||
|
|
|
|
|
|||||
| Series A preferred stock: |
||||||||
| Series A preferred stock, €0.01 par value; no shares authorized or issued and outstanding (actual); 52,976,000 shares authorized (as adjusted); 52,976,000 shares issued and outstanding (as adjusted) |
— | 689 | ||||||
|
|
|
|
|
|||||
| Stockholders’ equity: |
||||||||
| Common stock, €0.01 par value; 240,000,000 shares authorized (actual); 48,096,000 shares issued and outstanding (actual); 745,120,000 shares authorized (as adjusted); 149,024,000 shares issued and outstanding (as adjusted) |
803 | (4) | 1,937 | |||||
| Additional paid-in capital |
1,409 | 561,586 | ||||||
| Retained earnings |
491,145 | 317,677 | ||||||
| Accumulated other comprehensive income |
294 | 217 | ||||||
| Non-controlling interest (5) |
— | 113,007 | ||||||
|
|
|
|
|
|||||
| Total stockholders’ equity |
493,651 | 994,424 | ||||||
|
|
|
|
|
|||||
| Total capitalization |
$ | 948,347 | $ | 1,003,053 | ||||
|
|
|
|
|
|||||
| (1) | As of June 30, 2013, our cash and cash equivalents totaled $106.0 million. |
| (2) | In 2012, FINV made a non-cash distribution of $484.0 million to its owners in the form of two unsecured promissory notes payable. As of March 31, 2013 and June 30, 2013, there was an aggregate of approximately $443.7 million and $415.4 million, respectively outstanding under these notes. |
| (3) | In connection with the restructuring transactions described in “Organizational Structure,” certain adjustments have been made to these line items in an aggregate amount of approximately $3.0 million. |
| (4) | Represents the common stock of FINV, FII, FCC and FTS. See Note 11 to our audited combined financial statements included elsewhere in this prospectus. |
| (5) | Reflects the portion of FICV that will be owned by Mosing Holdings upon completion of this offering. See “Organizational Structure.” |
43
Table of Contents
Index to Financial Statements
Purchasers of common stock in this offering will experience immediate and substantial dilution in the net tangible book value per share of the common stock for accounting purposes. Our net tangible book value as of March 31, 2013, after giving pro forma effect to the reorganization transactions as described in “Organizational Structure” was approximately $387.7 million, or $1.92 per share of common stock. Pro forma net tangible book value per share is determined by dividing our pro forma tangible net worth (tangible assets less total liabilities) by the total number of outstanding shares of common stock that will be outstanding immediately prior to the closing of this offering. After giving pro forma effect to the reorganization transactions as described in “Organizational Structure” and as adjusted for the sale of the shares in this offering and assuming the receipt of the estimated net proceeds (after deducting estimated discounts and expenses of this offering), our adjusted pro forma net tangible book value as of March 31, 2013 would have been approximately $949.7 million, or $4.70 per share. This represents an immediate increase in the net tangible book value of $2.78 per share to our existing shareholders and an immediate dilution (i.e., the difference between the offering price and the adjusted pro forma net tangible book value after this offering) to new investors purchasing shares in this offering of $15.30 per share. The following table illustrates the per share dilution to new investors purchasing shares in this offering (assuming that 100% of our Series A preferred shares have been exchanged for common stock):
| Assumed initial public offering price per share |
$ | 20.00 | ||
| Pro forma net tangible book value per share as of March 31, 2013 (after giving effect to the reorganization transactions as described in “Organizational Structure”) |
1.92 | |||
| Increase per share attributable to new investors in this offering |
2.78 | |||
|
|
|
|||
| As adjusted pro forma net tangible book value per share after giving effect to this offering |
4.70 | |||
|
|
|
|||
| Dilution in pro forma net tangible book value per share to new investors in this offering |
$ | 15.30 | ||
|
|
|
The following table summarizes, on an adjusted pro forma basis as of March 31, 2013, the total number of shares of common stock owned by existing shareholders (assuming that 100% of our Series A preferred shares have been exchanged for common stock) and to be owned by the new investors in this offering, the total consideration paid, and the average price per share paid by our existing shareholders and to be paid by the new investors in this offering at $20.00, the midpoint of the range of the initial public offering prices set forth on the cover page of this prospectus, calculated before deduction of estimated discounts and commissions:
| Shares Acquired | Total Consideration | Average Price Per Share |
||||||||||||||||||
| Number | Percent | Amount (in thousands) |
Percent | |||||||||||||||||
| Existing shareholders |
172,000,000 | 85 | % | $ | 387,716 | 39 | % | $ | 2.25 | |||||||||||
| New investors in this offering |
30,000,000 | 15 | 600,000 | 61 | $ | 20.00 | ||||||||||||||
|
|
|
|
|
|
|
|
|
|
|
|||||||||||
| Total |
202,000,000 | 100 | % | $ | 987,716 | 100 | % | $ | 4.89 | |||||||||||
|
|
|
|
|
|
|
|
|
|
|
|||||||||||
A $1.00 increase or decrease in the assumed initial public offering price of $20.00 per share, which is the midpoint of the range set forth on the cover page of this prospectus, would increase or decrease our as adjusted pro forma net tangible book value as of March 31, 2013 by approximately $28.3 million, the as adjusted pro forma net tangible book value per share after this offering by $0.14 per share and the dilution in pro forma as adjusted net tangible book value per share to new investors in this offering by $0.86 per share, assuming the number of shares offered by us, as set forth on the cover page of this prospectus, remains the same and after deducting the estimated underwriting discounts and commissions and estimated offering expenses payable by us.
44
Table of Contents
Index to Financial Statements
SELECTED HISTORICAL COMBINED AND UNAUDITED PRO FORMA FINANCIAL DATA
The following table shows selected historical combined financial data of Frank’s International as of and for the years ended December 31, 2008, 2009, 2010, 2011 and 2012. The selected historical financial data as of December 31, 2011 and 2012 and for the years ended December 31, 2010, 2011 and 2012 are derived from our audited historical combined financial statements and related notes thereto included elsewhere in this prospectus. The selected historical financial data as of December 31, 2008, 2009 and 2010 and for the years ended December 31, 2008 and 2009 are derived from our audited historical combined financial statements and related notes thereto that are not included in this prospectus. The summary historical combined financial data presented as of March 31, 2013 and for the three months ended March 31, 2012 and 2013 are derived from the unaudited historical combined financial statements included elsewhere in this prospectus. Under the combined method of accounting, the historical consolidated financial statements of FINV, FII, FCC, and FTS and their wholly owned subsidiaries are combined as if Frank’s International operated as a single entity. All intercompany accounts and transactions have been eliminated for purposes of preparing these combined financial statements.
The selected unaudited pro forma financial data presented below has been derived by the application of pro forma adjustments to the historical combined financial statements of Frank’s International included elsewhere in this prospectus. The selected unaudited pro forma financial data for the year ended December 31, 2012 and as of and for the three months ended March 31, 2013 give effect to our reorganization in connection with this offering as described in “Organizational Structure” and the use of the estimated net proceeds from this offering as described in “Use of Proceeds” as if all such transactions had occurred on January 1, 2012, in the case of the unaudited pro forma statement of operations, and on March 31, 2013, in the case of the unaudited pro forma balance sheet.
45
Table of Contents
Index to Financial Statements
You should read these tables in conjunction with “Management’s Discussion and Analysis of Financial Condition and Results of Operations,” which includes a discussion of factors materially affecting the comparability of the information presented, “Organizational Structure” and our historical and pro forma financial statements and notes thereto included elsewhere in this prospectus. Our selected unaudited pro forma financial data is presented for informational purposes only. The pro forma adjustments are based upon available information and certain assumptions that we believe are reasonable. Our selected unaudited pro forma financial data does not purport to represent what our results of operations or financial position would have been if we operated as a public company during the period presented and may not be indicative of our future performance.
| FINV | ||||||||||||||||||||||||||||||||||||
| Frank’s International | Pro Forma | |||||||||||||||||||||||||||||||||||
| Year Ended December 31, | Three Months Ended March 31, |
Year
Ended December 31, 2012 |
Three
Months Ended March 31, 2013 |
|||||||||||||||||||||||||||||||||
| 2008 | 2009 | 2010 | 2011 | 2012 | 2012 | 2013 | ||||||||||||||||||||||||||||||
| Statements of income data (in thousands): |
||||||||||||||||||||||||||||||||||||
| Revenues: |
||||||||||||||||||||||||||||||||||||
| Equipment rentals and services |
$ | 572,160 | $ | 428,476 | $ | 490,902 | $ | 613,541 | $ | 880,084 | $ | 203,755 | $ | 205,878 | $ | 878,938 | $ | 205,643 | ||||||||||||||||||
| Products |
152,163 | 89,307 | 117,306 | 125,534 | 175,841 | 36,773 | 30,882 | 175,841 | 30,882 | |||||||||||||||||||||||||||
|
|
|
|
|
|
|
|
|
|
|
|
|
|
|
|
|
|
|
|||||||||||||||||||
| Total revenues |
724,323 | 517,783 | 608,208 | 739,075 | 1,055,925 | 240,528 | 236,760 | 1,054,779 | 236,525 | |||||||||||||||||||||||||||
|
|
|
|
|
|
|
|
|
|
|
|
|
|
|
|
|
|
|
|||||||||||||||||||
| Operating expenses: |
||||||||||||||||||||||||||||||||||||
| Cost of revenues, exclusive of depreciation and amortization |
||||||||||||||||||||||||||||||||||||
| Equipment rentals and services |
200,624 | 161,920 | 222,345 | 256,515 | 314,950 | 72,731 | 75,781 | 314,950 | 75,781 | |||||||||||||||||||||||||||
| Products |
168,278 | 102,694 | 70,697 | 76,368 | 119,527 | 24,184 | 18,019 | 119,527 | 18,019 | |||||||||||||||||||||||||||
| General and administrative expenses |
112,288 | 113,851 | 134,449 | 160,506 | 187,033 | 41,608 | 44,145 | 188,409 | 45,434 | |||||||||||||||||||||||||||
| Depreciation and amortization |
39,013 | 45,769 | 48,197 | 54,581 | 66,215 | 15,424 | 17,783 | 64,148 | 17,364 | |||||||||||||||||||||||||||
| Impairment of goodwill and intangible assets |
— | 9,438 | — | — | — | — | — | — | — | |||||||||||||||||||||||||||
| (Gain) loss on sale of assets |
(364 | ) | (16 | ) | (164 | ) | (47 | ) | (2,608 | ) | 195 | 23 | (2,608 | ) | 23 | |||||||||||||||||||||
|
|
|
|
|
|
|
|
|
|
|
|
|
|
|
|
|
|
|
|||||||||||||||||||
| Operating income |
204,484 | 84,127 | 132,684 | 191,152 | 370,808 | 86,386 | 81,009 | 370,353 | 79,904 | |||||||||||||||||||||||||||
|
|
|
|
|
|
|
|
|
|
|
|
|
|
|
|
|
|
|
|||||||||||||||||||
| Other income (expense): |
||||||||||||||||||||||||||||||||||||
| Other income |
5,192 | 4,972 | 3,906 | 3,786 | 12,189 | 670 | 2,127 | 12,189 | 2,127 | |||||||||||||||||||||||||||
| Interest income (expense), net |
(2,584 | ) | (1,840 | ) | (1,658 | ) | (655 | ) | 264 | 260 | (201 | ) | 1,038 | 83 | ||||||||||||||||||||||
| Impairment of investment |
(3,797 | ) | — | — | — | — | — | — | — | — | ||||||||||||||||||||||||||
| Foreign currency gain (loss) |
(8,648 | ) | 559 | (1,930 | ) | (3,209 | ) | (450 | ) | 2,626 | (3,587 | ) | (450 | ) | (3,587 | ) | ||||||||||||||||||||
|
|
|
|
|
|
|
|
|
|
|
|
|
|
|
|
|
|
|
|||||||||||||||||||
| Total other income (expense) |
(9,837 | ) | 3,691 | 318 | (78 | ) | 12,003 | 3,556 | (1,661 | ) | 12,777 | (1,377 | ) | |||||||||||||||||||||||
|
|
|
|
|
|
|
|
|
|
|
|
|
|
|
|
|
|
|
|||||||||||||||||||
| Income before income tax |
194,647 | 87,818 | 133,002 | 191,074 | 382,811 | 89,942 | 79,348 | 383,130 | 78,527 | |||||||||||||||||||||||||||
| Income tax expense |
22,006 | 13,340 | 14,601 | 20,287 | 31,877 | 7,687 | 6,303 | 89,569 | 17,834 | |||||||||||||||||||||||||||
|
|
|
|
|
|
|
|
|
|
|
|
|
|
|
|
|
|
|
|||||||||||||||||||
| Net income |
172,641 | 74,478 | 118,401 | 170,787 | 350,934 | 82,255 | 73,045 | 293,561 | 60,693 | |||||||||||||||||||||||||||
| Non-controlling interest |
— | — | — | — | — | — | — | (92,059 | ) | (18,915 | ) | |||||||||||||||||||||||||
|
|
|
|
|
|
|
|
|
|
|
|
|
|
|
|
|
|
|
|||||||||||||||||||
| Net income attributable to Frank’s International |
172,641 | 74,478 | 118,401 | 170,787 | 350,934 | 82,255 | 73,045 | 201,502 | 41,778 | |||||||||||||||||||||||||||
| Preferred stock dividends |
— | — | — | — | — | — | — | (2 | ) | — | ||||||||||||||||||||||||||
|
|
|
|
|
|
|
|
|
|
|
|
|
|
|
|
|
|
|
|||||||||||||||||||
| Net income attributable to common stockholders |
$ | 172,641 | $ | 74,478 | $ | 118,401 | $ | 170,787 | $ | 350,934 | $ | 82,255 | $ | 73,045 | $ | 201,500 | $ | 41,778 | ||||||||||||||||||
|
|
|
|
|
|
|
|
|
|
|
|
|
|
|
|
|
|
|
|||||||||||||||||||
46
Table of Contents
Index to Financial Statements
| FINV | ||||||||||||||||||||||||||||||||||||
| Frank’s International | Pro Forma | |||||||||||||||||||||||||||||||||||
| Year Ended December 31, | Three Months Ended March 31, |
Year
Ended December 31, 2012 |
Three
Months Ended March 31, 2013 |
|||||||||||||||||||||||||||||||||
| 2008 | 2009 | 2010 | 2011 | 2012 | 2012 | 2013 | ||||||||||||||||||||||||||||||
| Balance sheet data (as of period end) (in thousands): |
||||||||||||||||||||||||||||||||||||
| Total assets |
$ | 661,740 | $ | 649,915 | $ | 710,543 | $ | 847,500 | $ | 1,107,961 | $ | 1,129,318 | $ | 1,184,022 | ||||||||||||||||||||||
| Long-term debt—excluding affiliates |
71,011 | 57,108 | 46,579 | 9,204 | 7,368 | |
5,858 |
|
5,059 | |||||||||||||||||||||||||||
| Long-term debt—affiliate(1) |
978 | 810 | 907 | 3,618 | 469,268 | |
448,838 |
|
2,881 | |||||||||||||||||||||||||||
| Total liabilities(2) |
179,136 | 165,608 | 174,530 | 180,372 | 660,973 | 635,667 | 189,598 | |||||||||||||||||||||||||||||
| Total stockholders’ equity |
482,604 | 484,307 | 536,013 | 667,128 | 446,988 | 493,651 | 994,424 | |||||||||||||||||||||||||||||
| Other financial data (in thousands): |
||||||||||||||||||||||||||||||||||||
| Net cash provided by operating activities |
$ | 209,603 | $ | 141,444 | $ | 163,414 | $ | 180,710 | $ | 344,776 | $ | 78,669 | $ | 50,664 | ||||||||||||||||||||||
| Net cash used in investing activities |
(83,509 | ) | (64,520 | ) | (69,130 | ) | (126,655 | ) | (182,533 | ) | (47,541 | ) | (42,014 | ) | ||||||||||||||||||||||
| Net cash used in financing activities |
(109,394 | ) | (92,834 | ) | (79,261 | ) | (71,874 | ) | (107,210 | ) | (14,742 | ) | (44,235 | ) | ||||||||||||||||||||||
| Adjusted EBITDA(3) (unaudited) |
248,325 | 144,290 | 184,623 | 249,472 | 446,604 | 102,675 | 100,942 | $ | 444,802 | $ | 99,418 | |||||||||||||||||||||||||
| (1) | In 2012, FINV made a non-cash distribution of $484.0 million to its owners of FINV in the form of two unsecured promissory notes payable. As of December 31, 2012 and March 31, 2013, there was an aggregate of approximately $464.0 million and $443.7 million, respectively, outstanding under these notes. |
| (2) | Includes Series A preferred stock. |
| (3) | Adjusted EBITDA is a non-GAAP financial measure. For a definition and a reconciliation of Adjusted EBITDA to our net income, see “—Non-GAAP Financial Measure” below. |
Non-GAAP Financial Measures
Adjusted EBITDA is a supplemental non-GAAP financial measure that is used by management and external users of our financial statements, such as industry analysts, investors, lenders and rating agencies.
We define Adjusted EBITDA as net income before net interest income or expense, depreciation and amortization, income tax benefit or expense, asset impairments, gain or loss on sale of assets, foreign currency gain or loss and other non-cash adjustments. We define Adjusted EBITDA margin as Adjusted EBITDA divided by revenues. Adjusted EBITDA is not a measure of net income or cash flows as determined by U.S. GAAP.
Management believes Adjusted EBITDA is useful because it allows us to more effectively evaluate our operating performance and compare the results of our operations from period to period without regard to our financing methods or capital structure. We exclude the items listed above from net income in arriving at Adjusted EBITDA because these amounts can vary substantially from company to company within our industry depending upon accounting methods and book values of assets, capital structures and the method by which the assets were acquired. Adjusted EBITDA and Adjusted EBITDA margin have limited use as analytical tools and should not be considered as an alternative to, or more meaningful than, operating income, net income or cash flows from operating activities as determined in accordance with GAAP or as an indicator of our operating performance or liquidity. Certain items excluded from Adjusted EBITDA are significant components in understanding and assessing a company’s financial performance, such as a company’s cost of capital and tax structure, as well as the historic costs of depreciable assets, none of which are components of Adjusted EBITDA. Our computations of Adjusted EBITDA may not be comparable to other similarly titled measures of other companies. We believe that
47
Table of Contents
Index to Financial Statements
Adjusted EBITDA is a widely followed measure of operating performance and may also be used by investors to measure our ability to meet debt service requirements.
| FINV | ||||||||||||||||||||||||||||||||||||
| Frank’s International | Pro Forma | |||||||||||||||||||||||||||||||||||
| Year Ended December 31, | Three Months Ended March 31, |
Year
Ended December 31, 2012 |
Three Months Ended March 31, 2013 |
|||||||||||||||||||||||||||||||||
| 2008 | 2009 | 2010 | 2011 | 2012 | 2012 | 2013 | ||||||||||||||||||||||||||||||
| Adjusted EBITDA Reconciliation (in thousands): |
||||||||||||||||||||||||||||||||||||
| Net income |
$ | 172,641 | $ | 74,478 | $ | 118,401 | $ | 170,787 | $ | 350,934 | $ | 82,255 | $ | 73,045 | $ | 293,561 | $ | 60,693 | ||||||||||||||||||
| Interest (income) expense, net |
2,584 | 1,840 | 1,658 | 655 | (264 | ) | (260 | ) | 201 | (1,038 | ) | (83 | ) | |||||||||||||||||||||||
| Depreciation and amortization |
39,013 | 45,769 | 48,197 | 54,581 | 66,215 | 15,424 | 17,783 | 64,148 | 17,364 | |||||||||||||||||||||||||||
| Income tax expense |
22,006 | 13,340 | 14,601 | 20,287 | 31,877 | 7,687 | 6,303 | 89,569 | 17,834 | |||||||||||||||||||||||||||
| Impairment of goodwill and intangible assets |
— | 9,438 | — | — | — | — | — | — | — | |||||||||||||||||||||||||||
| Impairment of investment |
3,797 | — | — | — | — | — | — | — | — | |||||||||||||||||||||||||||
| (Gain) loss on sale of assets |
(364 | ) | (16 | ) | ( 4 | ) | (47 | ) | (2,608 | ) | 195 | 23 | (2,608 | ) | 23 | |||||||||||||||||||||
| Foreign currency (gain) loss |
8,648 | (559 | ) | 1,930 | 3,209 | 450 | (2,626 | ) | 3,587 | 450 | 3,587 | |||||||||||||||||||||||||
|
|
|
|
|
|
|
|
|
|
|
|
|
|
|
|
|
|
|
|||||||||||||||||||
| Adjusted EBITDA |
$ | 248,325 | $ | 144,290 | $ | 184,623 | $ | 249,472 | $ | 446,604 | $ | 102,675 | $ | 100,942 | $ | 444,802 | $ | 99,418 | ||||||||||||||||||
|
|
|
|
|
|
|
|
|
|
|
|
|
|
|
|
|
|
|
|||||||||||||||||||
48
Table of Contents
Index to Financial Statements
MANAGEMENT’S DISCUSSION AND ANALYSIS OF
FINANCIAL CONDITION AND RESULTS OF OPERATIONS
Investors should read the following information together with “Prospectus Summary—Summary Historical Combined and Unaudited Pro Forma Financial Data,” “Selected Historical Combined and Unaudited Pro Forma Financial Data” and the financial statements and the notes thereto included elsewhere in this prospectus. This discussion and analysis contains forward-looking statements, which involve risks and uncertainties, including those described under the captions “Risk Factors” and “Cautionary Note Regarding Forward Looking Statements” and elsewhere in this prospectus. Our actual results may differ materially from those anticipated in these forward-looking statements. The financial information contained in the following discussion is based on our audited financial statements for the years ended December 31, 2010, 2011 and 2012, the unaudited financial statements for the three months ended March 31, 2012 and 2013 and the unaudited pro forma financial information for the year ended December 31, 2012 and the three months ended March 31, 2013.
Overview
We are a 75 year-old, industry-leading global provider of highly engineered tubular services to the oil and gas industry. We provide our services to leading exploration and production companies in both offshore and onshore environments, with a focus on complex and technically demanding wells. We believe that we are one of the largest global providers of tubular services to the oil and gas industry.
We conduct our business through three operating segments:
| • | International Services. We currently provide our services in approximately 60 countries on six continents. Our customers in these international markets are primarily large exploration and production companies, including integrated oil and gas companies and national oil and gas companies, with a significant focus on complex, high profile projects. Our International Services segment accounted for approximately 49% and 50%, respectively, of our Adjusted EBITDA in 2012 and the first three months of 2013. Approximately 82% and 83%, respectively, of our revenue from external customers in this segment was generated in offshore markets in 2012 and the first three months of 2013, the significant majority of which was from deep water markets. |
| • | U.S. Services. Approximately 51% and 63%, respectively, of our 2012 and first quarter 2013 U.S. Services segment revenue from external customers was generated in the technically challenging deep water areas of the U.S. Gulf of Mexico. In addition, we have a significant presence in almost all of the active onshore oil and gas drilling regions in the U.S., including the Permian Basin, Bakken Shale, Barnett Shale, Eagle Ford Shale, Haynesville Shale, Marcellus Shale and Utica Shale. Our U.S. Services segment accounted for approximately 45% and 42%, respectively, of our Adjusted EBITDA in 2012 and the first three months of 2013. |
| • | Pipe and Products. We also design and manufacture certain products that we sell or rent directly to external customers, including large OD pipe connectors and casing attachments. We also provide specialized fabrication and welding services in support of deep water projects in the U.S. Gulf of Mexico, including drilling and production risers, flowlines and pipeline end terminations, as well as long length tubulars (up to 300 feet in length) for use as caissons or pilings. Finally, we distribute large OD pipe manufactured by third parties. A significant majority of our sales to external customers occur in deep water markets. Our Pipe and Products segment accounted for approximately 6% and 8%, respectively, of our Adjusted EBITDA in 2012 and the first three months of 2013. |
How We Generate Our Revenue
A significant majority of our services revenues are derived primarily from two sources:
| • | personnel rates for our specially trained employees who perform tubular services for our customers; and |
| • | rental rates for the suite of products and equipment that our employees use to perform tubular services. |
49
Table of Contents
Index to Financial Statements
In addition, our customers typically reimburse us for transportation costs that we incur in connection with transporting our products and equipment from our staging areas to the customers’ job sites.
In contrast, our Pipe and Products revenues are derived from sales of certain products, including large OD pipe connectors, casing attachments and large OD pipe manufactured by third parties, directly to external customers.
As described below under “—U.S. Services,” we have some exposure to footage-based rates and blended (one for both personnel and equipment) rates in our U.S. Services segment for certain onshore regions, but we do not have any meaningful exposure to fixed price contracts in either of our services segments. We believe that our lack of exposure to the market risk associated with fixed price contracts is an important component of our profitability.
International Services
In our International Services segment, we typically enter into contracts with our customers relating to the provision of tubular services for multiple wells, with terms ranging from three to five years. Though these contracts are usually terminable on 60 days’ notice, the frequency with which such contracts are terminated is typically limited by the time and expense required for customers to change service providers, including the cost of transporting equipment and personnel to remote international locations. Many of our international services arrangements provide for up to 180 days’ notice to us prior to the commencement of a project. Due to the high costs associated with drilling offshore wells, minimum government commitments for international oil companies to retain leases, the extent of well construction planning required to design and secure manufactured materials and the other logistical challenges of operating in many foreign countries, the market for international services is usually less susceptible to short-term fluctuations in demand as compared to our services provided in the U.S.
In a typical international arrangement, we provide our customers with a package of equipment which is dedicated to the customers’ rig. We also assign dedicated, specialized personnel to the customers’ rig. For certain large projects, this may include multiple crews that can rotate shifts during the provision of tubular services. During the time that our equipment is in use, we charge our customers full working personnel and rental rates, and we may also charge the customer a lower, standby rate for the time the equipment is dedicated to the customer but not in use. Given the long-term nature of our international projects, a large portion of the personnel and equipment rates charged to customers are monthly rates. More than 75% of our International Services revenue during each of 2012 and the first three months of 2013 were denominated in U.S. dollars.
In areas where we can access equipment that is located in the U.S., such as Latin America, we sometimes provide services on a callout basis, where we would be required to perform tubular services on shorter notice. The rates that we charge under callout arrangements are typically higher than standby rates, and we are able to use and rent the same equipment to multiple customers in a given time period, allowing us to complete more jobs for a greater number of customers.
U.S. Services
In contrast to our International Services, our customer contracts in the U.S. Services segment are typically managed on a well-by-well basis. In addition, though we are able to charge day rates for products and equipment in our U.S. Gulf of Mexico operations, the standby periods are typically much shorter than those provided for in our International Service contracts. Services in our U.S. Services segment are usually performed on a callout basis, where we are required to arrive at a customers’ site within a matter of days.
The typical U.S. Services arrangement relates to a specific tubular service project for a particular well. Moreover, the casing and tubing portions of a project may be tendered for and awarded separately. Given the shorter-term nature of our U.S. projects, the rates charged to customers are hourly rates for personnel and day rates for equipment. Rather than being on standby for potentially long periods of time, our employees and equipment in
50
Table of Contents
Index to Financial Statements
the U.S. Services segment instead typically make discrete trips, as necessary to the customer’s well site to perform the tubular services. As a result, our standby revenue is significantly lower in onshore and offshore portions of our U.S. Services segment as compared to our International Services segment. Although we generate lower standby revenues than in our International Services segment, we seek to optimize utilization of our personnel and equipment to allow us to earn full working rates on as many jobs for as many customers as possible.
In comparison to our International Services segment, we face a much larger number of small, regional competitors in the U.S. As a consequence, the bidding process is much more competitive. In order to be awarded certain projects, we sometimes enter into other contractual arrangements, including:
| • | blended rate arrangements, where we charge one hourly rate for both the required equipment and the personnel necessary to complete the project; or |
| • | footage-based rate arrangements. |
Contracts and Liability
Most of our services are performed pursuant to master service agreements that we have entered into with our customers. We have maintained master service agreements with Chevron, BP, Shell, Exxon Mobil and other customers for over 20 years. We strive to negotiate the terms of these and our other contracts to be consistent with what we consider to be best practices. The general industry practice is for oilfield service providers, like us, to be responsible for their own products and services and for our customers to retain liability for drilling and related operations. Consistent with this practice, we generally take responsibility for our own people and property, while our customers, such as the operator of a well, take responsibility for their own people, property and all liabilities related to the well and subsurface operations, regardless of either party’s negligence. In general, any material limitations on indemnifications to us from our customers in support of this allocation of responsibility arise only by applicable statutes. More recently, certain of our customers have begun to move more toward fault-based approaches for liability and indemnity.
Certain states in which we operate, such as Texas, Louisiana, Wyoming, and New Mexico, have enacted oil and gas specific statutes that void any indemnity agreement that attempts to relieve a party from liability resulting from its own negligence (“anti-indemnity statutes”). These statutes can void the allocation of liability agreed to in a contract; however, both the Texas and Louisiana anti-indemnity statutes include important exclusions. The Louisiana statute does not apply to property damage, and the Texas statute allows mutual indemnity agreements that are supported by insurance and has exclusions, which include, among other things, loss or liability for property damage that results from pollution and the cost of control of a wild well.
How We Evaluate Our Operations
We manage our business through three operating segments. We have focused on implementing financial reporting and controls in our operations to increase the availability of critical information necessary to support informed decision making. We use a number of financial and operational measures to routinely analyze and evaluate the performance of our business, including the following:
| • | revenue; |
| • | Adjusted EBITDA and Adjusted EBITDA margin; and |
| • | safety performance. |
Revenue
We analyze our revenue growth by comparing actual monthly revenue to our internal projections for each month to assess our performance. We also assess incremental changes in our monthly revenue across our operating segments to identify potential areas for improvement. Our revenue for the three months ended
51
Table of Contents
Index to Financial Statements
March 31, 2013 decreased $3.8 million, or 2%, from our revenue for the three months ended March 31, 2012. Our revenue for the year ended December 31, 2012 increased by $316.9 million, or 43%, from our revenue for the year ended December 31, 2011. Similarly, our revenue for the year ended December 31, 2011 increased by $130.9 million, or 22%, from our revenue for the year ended December 31, 2010.
Adjusted EBITDA and Adjusted EBITDA Margin
We define Adjusted EBITDA as net income before net interest income or expense, depreciation and amortization, income tax benefit or expense, asset impairments, gain or loss on sale of assets, foreign currency gain or loss and other non-cash adjustments. Adjusted EBITDA margin reflects our Adjusted EBITDA as a percentage of our revenues. We review Adjusted EBITDA and Adjusted EBITDA margin on both a combined basis and on a segment basis. We use Adjusted EBITDA and Adjusted EBITDA margin to assess our financial performance because it allows us to compare our operating performance on a consistent basis across periods by removing the effects of our capital structure (such as varying levels of interest expense), asset base (such as depreciation and amortization) and items outside the control of our management team (such as income tax rates). We present Adjusted EBITDA and Adjusted EBITDA margin on a combined basis and on a segment basis because we believe they provide a more complete understanding of the factors and trends affecting our business as compared to measures calculated under GAAP alone.
Adjusted EBITDA and Adjusted EBITDA margin have limitations as analytical tools and should not be considered as an alternative to net income, operating income, cash flow from operating activities or any other measure of financial performance or liquidity presented in accordance with GAAP. Other companies in our industry may calculate Adjusted EBITDA differently, limiting its usefulness as a comparative measure. Our Adjusted EBITDA for the three months ended March 31, 2013 decreased by $1.7 million, or 2%, from our Adjusted EBITDA for the three months ended March 31, 2012 and our Adjusted EBITDA for the year ended December 31, 2012 increased by $197.1 million, or 79%, from our Adjusted EBITDA for the year ended December 31, 2011. Our Adjusted EBITDA for the year ended December 31, 2011 increased by $64.8 million, or 35%, from our Adjusted EBITDA for the year ended December 31, 2010.
Our Adjusted EBITDA margin for the three months ended March 31, 2013 remained constant compared to the three months ended March 31, 2012 and our Adjusted EBITDA margin for the year ended December 31, 2012 increased by 25% from our Adjusted EBITDA margin for the year ended December 31, 2011. Our Adjusted EBITDA margin for the year ended December 31, 2011 increased by 11% from our Adjusted EBITDA margin for the year ended December 31, 2010.
For further discussion, including a reconciliation of our combined Adjusted EBITDA to the most comparable measure calculated in accordance with GAAP, see “Selected Historical Combined and Unaudited Pro Forma Financial Data—Non-GAAP Financial Measures.” For a reconciliation of our Adjusted EBITDA on a segment basis to the most comparable measure calculated in accordance with GAAP, see “—Operating Segment Results.”
Safety Performance
Maintaining a strong safety record is a critical component of our operational success. Many of our larger customers have safety standards we must satisfy before we can perform services for them. We continually monitor our safety culture through the use of employee safety surveys and trend analysis, and we modify existing programs or develop new programs according to the data obtained therefrom. We measure safety by tracking the total recordable incident rate (“TRIR”) and the lost time incident rate (“LTIR”), which are reviewed on both a monthly and rolling twelve-month basis. TRIR is a measure of the rate of recordable workplace injuries, defined below, normalized and stated on the basis of 100 workers for an annual period. The factor is derived by multiplying the number of recordable injuries in a calendar year by the number of employee hours worked per year (i.e., the total hours for the number of full-time equivalent employees multiplied by 2,000 hours per year) and dividing this value by the total hours actually worked in the year. A recordable injury includes occupational
52
Table of Contents
Index to Financial Statements
death, nonfatal occupational illness and other occupational injuries that involve loss of consciousness, restriction of work or motion, transfer to another project, or medical treatment other than first aid. LTIR is a measure of the frequency of incidents, such as injuries, per 200,000 man hours. LTIR is calculated by multiplying the total number of lost time cases under the federal Occupational Safety and Health Act (“OSHA”) by 200,000, and dividing that number by the total number of man hours worked by a specific group of employees. The table below presents our worldwide TRIR and LTIR for the years ended December 31, 2012, 2011 and 2010:
| Year Ended December 31, | ||||||||||||
| 2010 | 2011 | 2012 | ||||||||||
| TRIR |
2.03 | 2.15 | 1.89 | |||||||||
| LTIR |
0.53 | 0.73 | 0.50 | |||||||||
Key Drivers Affecting our Results of Operations
Our results of operations and financial condition are affected by numerous factors, including those described above in “Risk Factors,” elsewhere in this prospectus and those described below:
| • | General level of drilling activity. Demand for our services depends primarily upon the capital spending of oil and gas companies and the level of drilling activity in the U.S. and internationally. Higher activity levels can lead to greater utilization of our equipment and personnel by our customers. Because a large portion of our costs are fixed, our Adjusted EBITDA margins typically improve when more of our resources are commercially deployed. |
| • | Impact of service mix. Generally, offshore projects are more complex than onshore projects, and we typically have a greater opportunity to differentiate our capabilities compared to our competitors. Consequently, our revenue and profit opportunity per well is greater when offshore services are a relatively larger component of our revenue than onshore services. Similarly, because our equipment costs are typically fixed while our personnel costs are typically variable, our profit opportunity per well is greater when equipment rental is a larger component of a customer invoice relative to the personnel costs. |
| • | Size and complexity of projects. Our revenue and profit opportunity per well is higher for more complex wells. Onshore, our revenue and profit potential is greatest for horizontal shale wells with extended laterals. Offshore, our revenue and profit potential is greatest for deep wells with multiple casing strings and casing diameters. |
| • | Timing of projects. Our results of operations in a particular period can be impacted by the timing of the start-up and completion of large projects, particularly international offshore projects where we bill our customers a monthly rate for our personnel and equipment and our standby availability. |
General Trends and Outlook
We believe the long-term outlook for the tubular services businesses is favorable. For a more fulsome description of the trends in our industry, see “Business—Industry—Trends in the Industry.”
Factors Affecting Comparability of Historical Financial Results
Our pro forma results of operations and our future results of operations may not be comparable to our historical results of operations for the periods presented, primarily for the reasons described below:
| • | The historical combined financial statements included in this prospectus are based on the financial statements of Frank’s International, prior to our reorganization in connection with this offering as described in “Organizational Structure.” For example, in connection with the reorganization, Mosing Holdings will cause our U.S. operating subsidiaries to distribute certain assets that generate a de minimis amount of revenue, including aircraft, real estate and life insurance policies and associated accounts receivable. Accordingly, these assets will not be contributed to FICV in connection with the |
53
Table of Contents
Index to Financial Statements
| reorganization. As a result, we intend to enter into real estate lease agreements with customary terms for continued use of the real estate, under which we will incur additional rental expense of approximately $3.8 million per year. In addition, we will enter into an aviation services agreement with customary terms for continued use of the aircraft, under which we will incur additional charter service expense of approximately $1.1 million per year. As a result, the historical financial data may not give you an accurate indication of what our actual results would have been if the transactions described in “Organizational Structure” had been completed at the beginning of the periods presented or of what our future results of operations are likely to be. |
| • | The tax receivable agreement generally will provide for the payment by FINV of 85% of actual reductions, if any, in payments of U.S. federal, state and local income tax or franchise tax (which reductions we refer to as “cash savings”) in periods after this offering as a result of (i) the tax basis increases resulting from the transfer of FICV interests to us in connection with a conversion of shares of Series A preferred stock into shares of our common stock and (ii) imputed interest deemed to be paid by FINV as a result of, and additional tax basis arising from, payments under the tax receivable agreement. In addition, the tax receivable agreement will provide for interest earned from the due date (without extensions) of the corresponding tax return to the date of payment specified by the tax receivable agreement. We will record 85% of the estimated tax benefit as an increase to amounts payable under the tax receivable agreement as a liability. See “Certain Relationships and Related Person Transactions—Tax Receivable Agreement.” |
| • | We expect that our general and administrative (“G&A”) expenses will increase as a result of this offering. Specifically, we will incur certain expenses related to being a publicly traded company, including expenses to comply with reporting obligations under the Securities Exchange Act of 1934, as amended (the “Exchange Act”), expenses associated with Sarbanes-Oxley Act compliance, expenses associated with listing on the NYSE, independent auditors fees, legal fees, investor relations expenses, registrar and transfer agent fees, director and officer liability insurance costs and director compensation. |
| • | As described in “Compensation Discussion and Analysis—Components of Our Executive Compensation Program—Long-Term Incentive Plan,” concurrently with this offering, we expect to grant restricted stock units to certain of our officers and employees valued at an aggregate of $78 million under our LTIP. It is expected that the initial restricted stock unit awards to our CEO and our Named Executive Officers (as well as our other executive officers and our employees serving as first-level vice presidents) will vest 20% per year over the first three years, with the remaining 40% vesting on March 31, 2017. We expect that the initial restricted stock unit awards to our other officers and employees will vest ratably over a three-year period. Accordingly, assuming they all vest in accordance with their vesting schedule, this grant of restricted stock units will result in a charge to our income statement of $20.3 million in each of 2014, 2015 and 2016 and $17.0 million in 2017. Although we have not historically paid equity compensation, we expect that, going forward, equity will comprise a portion of our compensation program. We cannot, however, predict the amount of future equity awards or the effect of any potential equity awards on our overall compensation structure, and, as a result, cannot accurately predict the effects of future equity compensation on our financial statements or future results of operations. |
Our future results will depend on our ability to efficiently manage our combined operations and execute our business strategy.
54
Table of Contents
Index to Financial Statements
Historical Financial and Operating Data
The following table presents our combined results for the periods presented (in thousands):
| Year Ended December 31, | Three Months Ended March 31, |
|||||||||||||||||||
| 2010 | 2011 | 2012 | 2012 | 2013 | ||||||||||||||||
| Revenues: |
||||||||||||||||||||
| Equipment rentals and services |
$ | 490,902 | $ | 613,541 | $ | 880,084 | $ | 203,755 | $ | 205,878 | ||||||||||
| Products(1) |
117,306 | 125,534 | 175,841 | 36,773 | 30,882 | |||||||||||||||
|
|
|
|
|
|
|
|
|
|
|
|||||||||||
| Total revenues |
608,208 | 739,075 | 1,055,925 | 240,528 | 236,760 | |||||||||||||||
|
|
|
|
|
|
|
|
|
|
|
|||||||||||
| Operating expenses: |
||||||||||||||||||||
| Cost of revenues, exclusive of depreciation and amortization |
||||||||||||||||||||
| Equipment rentals and services |
222,345 | 256,515 | 314,950 | 72,731 | 75,781 | |||||||||||||||
| Products |
70,697 | 76,368 | 119,527 | 24,184 | 18,019 | |||||||||||||||
| General and administrative expenses |
134,449 | 160,506 | 187,033 | 41,608 | 44,145 | |||||||||||||||
| Depreciation and amortization |
48,197 | 54,581 | 66,215 | 15,424 | 17,783 | |||||||||||||||
| (Gain) loss on sale of assets |
(164 | ) | (47 | ) | (2,608 | ) | 195 | 23 | ||||||||||||
|
|
|
|
|
|
|
|
|
|
|
|||||||||||
| Operating income |
132,684 | 191,152 | 370,808 | 86,386 | 81,009 | |||||||||||||||
|
|
|
|
|
|
|
|
|
|
|
|||||||||||
| Other income (expense): |
||||||||||||||||||||
| Other income |
3,906 | 3,786 | 12,189 | 670 | 2,127 | |||||||||||||||
| Interest income (expense), net |
(1,658 | ) | (655 | ) | 264 | 260 | (201 | ) | ||||||||||||
| Foreign currency gain (loss) |
(1,930 | ) | (3,209 | ) | (450 | ) | 2,626 | (3,587 | ) | |||||||||||
|
|
|
|
|
|
|
|
|
|
|
|||||||||||
| Total other income (expense) |
318 | (78 | ) | 12,003 | 3,556 | (1,661 | ) | |||||||||||||
|
|
|
|
|
|
|
|
|
|
|
|||||||||||
| Income before income tax expense |
133,002 | 191,074 | 382,811 | 89,942 | 79,348 | |||||||||||||||
| Income tax expense |
14,601 | 20,287 | 31,877 | 7,687 | 6,303 | |||||||||||||||
|
|
|
|
|
|
|
|
|
|
|
|||||||||||
| Net income |
$ | 118,401 | $ | 170,787 | $ | 350,934 | $ | 82,255 | $ | 73,045 | ||||||||||
|
|
|
|
|
|
|
|
|
|
|
|||||||||||
| (1) | Combined products revenue includes a small amount of revenues attributable to the U.S. Services and International Services segments. |
Combined Results of Operations
Three Months Ended March 31, 2013 Compared to Three Months Ended March 31, 2012
Revenues. Revenues for the three months ended March 31, 2013 decreased by $3.8 million, or 2%, to $236.7 million from $240.5 million for the three months ended March 31, 2012. The decrease was primarily due to lower external revenues of $5.9 million in our Pipe and Products segment, which was negatively affected by the BSEE’s temporary shut-down of more than 20 rigs in the Gulf of Mexico in February 2013 in order for operators to replace bolts in subsea equipment that had been determined by regulators to be defective. Partially offsetting this decrease was an increase in external revenues of $1.4 million in our International Services segment.
Cost of revenues, exclusive of depreciation and amortization. Cost of revenues for the three months ended March 31, 2013 decreased by $3.1 million, or 3%, to $93.8 million from $96.9 million for the three months
55
Table of Contents
Index to Financial Statements
ended March 31, 2012. The decrease was primarily attributable to decreases in pipe inventory and equipment rentals resulting from the decrease in drilling activity described above.
General and administrative expenses. G&A expenses for the three months ended March 31, 2013 increased by $2.5 million, or 6%, to $44.1 million from $41.6 million for the three months ended March 31, 2012 primarily due to an increase in bad debt expense of $1.5 million related to a customer in Venezuela and compensation related costs of $1.5 million.
Depreciation and amortization. Depreciation and amortization for the three months ended March 31, 2013 increased by $2.4 million, or 15%, to $17.8 million from $15.4 million for the three months ended March 31, 2012. The increase was primarily attributable to assets placed in service in the last nine months of 2012 and in the first quarter of 2013.
Other income. Other income for the three months ended March 31, 2013 increased by $1.4 million, or 217%, to $2.1 million from $0.7 million for the three months ended March 31, 2012 due to a value added tax refund related to prior periods.
Foreign currency (gain) loss. Foreign currency loss for the three months ended March 31, 2013 increased by $6.2 million, or 237%, to a $3.6 million loss from a $2.6 million gain for the three months ended March 31, 2012. The increase in foreign currency loss was due to unfavorable fluctuations in foreign currency exchange rates and a $1.8 million charge related to the devaluation of the Venezuelan Bolivar in the first quarter of 2013. See Note 1 to our unaudited combined financial statements included elsewhere in this prospectus.
Income tax expense. Income tax expense for the three months ended March 31, 2013 decreased by $1.4 million, or 18%, to $6.3 million from $7.7 million for the three months ended March 31, 2012. We are subject to many U.S. and foreign tax jurisdictions and many tax agreements and treaties among the various taxing authorities. Our operations in these different jurisdictions are taxed on various bases such as income before taxes, deemed profits (which is generally determined using a percentage of revenues rather than profits), and withholding taxes based on revenues; consequently, the relationship between our pre-tax income or loss from operations and our income tax benefit or provision varies from period to period.
Year Ended December 31, 2012 Compared to Year Ended December 31, 2011
Revenues. Revenues for the year ended December 31, 2012 increased by $316.8 million, or 43%, to $1,055.9 million from $739.1 million for the year ended December 31, 2011. The increase was primarily attributable to higher revenues of $163.3 million and $52.0 million from our U.S. Services and Pipe and Products segments, respectively, as the demand continued to increase after the repeal of the Macondo-related drilling moratorium. Increased activity levels in our International Services segment comprised approximately $103.3 million of the increase.
Cost of revenues, exclusive of depreciation and amortization. Cost of revenues for the year ended December 31, 2012 increased by $101.6 million, or 31%, to $434.5 million from $332.9 million for the year ended December 31, 2011. The increase was primarily attributable to increases in the cost of products, equipment rentals and services ($73.0 million) and compensation-related costs ($28.6 million) due to the aforementioned increase in drilling activity.
General and administrative expenses. G&A expenses for the year ended December 31, 2012 increased by $26.5 million, or 17%, to $187.0 million from $160.5 million for the year ended December 31, 2011. The increase supported the growth in our business, and as a result of such growth, we experienced approximately $22.7 million in higher compensation related costs.
Depreciation and amortization. Depreciation and amortization for the year ended December 31, 2012 increased by $11.6 million, or 21%, to $66.2 million from $54.6 million for the year ended December 31, 2011. The increase was primarily attributable to increased capital expenditures during 2011 and 2012.
56
Table of Contents
Index to Financial Statements
Other income. Other income for the year ended December 31, 2012 increased by $8.4 million, or 222%, to $12.2 million from $3.8 million for the year ended December 31, 2011. The increase was due to a $4.0 million gain on the exchange of an investment and $4.9 million in death benefit proceeds from the passing of a related party.
Interest income (expense), net. Interest income (expense), net for the year ended December 31, 2012 increased by $0.9 million, or 140%, to $0.3 million of income from $0.6 million of expense for the year ended December 31, 2011. The increase was due to an increase in interest income and a decrease in interest expense due to lower borrowing levels.
Foreign currency loss. Foreign currency loss for the year ended December 31, 2012 decreased by $2.7 million, or 86%, to $0.5 million from $3.2 million for the year ended December 31, 2011. The decrease in foreign currency loss was due to favorable fluctuations in foreign currency exchange rates.
Income tax expense. Income tax expense for the year ended December 31, 2012 increased by $11.6 million, or 57%, to $31.9 million from $20.3 million for the year ended December 31, 2011. We are subject to many U.S. and foreign tax jurisdictions and many tax agreements and treaties among the various taxing authorities. Our operations in these different jurisdictions are taxed on various bases such as income before taxes, deemed profits (which is generally determined using a percentage of revenues rather than profits), and withholding taxes based on revenues; consequently, the relationship between our pre-tax income or loss from operations and our income tax benefit or provision varies from period to period.
Year Ended December 31, 2011 Compared to Year Ended December 31, 2010
Revenues. Revenues for the year ended December 31, 2011 increased by $130.9 million, or 22%, to $739.1 million from $608.2 million for the year ended December 31, 2010. The increase was primarily attributable to higher revenues of $76.1 million from increased drilling activity by customers in our International Services segment. Our U.S. Services segment contributed $45.0 million to the increase as permitting activity in the U.S. Gulf of Mexico started to rise following the repeal of the Macondo-related drilling moratorium in October 2010.
Cost of revenues, exclusive of depreciation and amortization. Cost of revenues for the year ended December 31, 2011 increased by $39.9 million, or 14%, to $332.9 million from $293.0 million for the year ended December 31, 2010. The increase was primarily attributable to increases in the costs of products, equipment rentals and services ($13.1 million) and compensation-related costs ($26.7 million) due to the aforementioned increase in drilling activity.
General and administrative expenses. G&A expenses for the year ended December 31, 2011 increased by $26.1 million, or 19%, to $160.5 million from $134.4 million for the year ended December 31, 2010. The increase in G&A expenses included higher benefits and compensation-related costs ($6.8 million), taxes ($5.4 million) and bad debt expense ($2.1 million).
Depreciation and amortization. Depreciation and amortization for the year ended December 31, 2011 increased by $6.4 million, or 13%, to $54.6 million from $48.2 million for the year ended December 31, 2010. The increase was primarily attributable to increased capital expenditures during 2011.
Interest income (expense), net. Interest income (expense), net for the year ended December 31, 2011 decreased by $1.0 million, or 60%, to $0.6 million from $1.6 million for the year ended December 31, 2010. The decrease was due to lower borrowing levels, primarily driven by our improved cash levels.
Foreign currency loss. Foreign currency loss for the year ended December 31, 2011 increased by $1.3 million, or 66%, to $3.2 million from $1.9 million for the year ended December 31, 2010. The increase in foreign currency loss was due to unfavorable fluctuations in foreign currency exchange rates.
57
Table of Contents
Index to Financial Statements
Income tax expense. Income tax expense for the year ended December 31, 2011 increased by $5.7 million, or 39%, to $20.3 million from $14.6 million for the year ended December 31, 2010. We are subject to many U.S. and foreign tax jurisdictions and many tax agreements and treaties among the various taxing authorities. Our operations in these different jurisdictions are taxed on various bases such as income before taxes, deemed profits (which is generally determined using a percentage of revenues rather than profits), and withholding taxes based on revenues; consequently, the relationship between our pre-tax income or loss from continuing operations and our income tax benefit or provision varies from period to period.
Operating Segment Results
The following table presents revenues and Adjusted EBITDA by segment, and a reconciliation of Adjusted EBITDA to net income, which is the most comparable GAAP financial measure (in thousands):
| Year Ended December 31, | Three Months Ended March 31, |
|||||||||||||||||||
| 2010 | 2011 | 2012 | 2012 | 2013 | ||||||||||||||||
| Revenues: |
||||||||||||||||||||
| International Services |
$ | 289,597 | $ | 366,106 | $ | 469,464 | $ | 109,538 | $ | 111,303 | ||||||||||
| U.S. Services |
231,913 | 277,286 | 444,568 | 101,369 | 102,722 | |||||||||||||||
| Pipe and Products |
126,196 | 147,335 | 214,686 | 45,299 | 45,004 | |||||||||||||||
| Intersegment purchases |
(39,498 | ) | (51,652 | ) | (72,793 | ) | (15,678 | ) | (22,269 | ) | ||||||||||
|
|
|
|
|
|
|
|
|
|
|
|||||||||||
| Total revenue |
$ | 608,208 | $ | 739,075 | $ | 1,055,925 | $ | 240,528 | $ | 236,760 | ||||||||||
|
|
|
|
|
|
|
|
|
|
|
|||||||||||
| Year Ended December 31, | Three Months Ended March 31, |
|||||||||||||||||||
| 2010 | 2011 | 2012 | 2012 | 2013 | ||||||||||||||||
| Segment Adjusted EBITDA: |
||||||||||||||||||||
| International Services |
$ | 118,487 | $ | 153,064 | $ | 219,199 | $ | 51,815 | $ | 49,959 | ||||||||||
| U.S. Services |
36,417 | 72,141 | 199,397 | 44,610 | 42,794 | |||||||||||||||
| Pipe and Products |
29,731 | 24,267 | 28,038 | 6,259 | 8,337 | |||||||||||||||
| Corporate and other (1) |
(12 | ) | — | (30 | ) | (9 | ) | (148 | ) | |||||||||||
|
|
|
|
|
|
|
|
|
|
|
|||||||||||
| Adjusted EBITDA Total |
184,623 | 249,472 | 446,604 | 102,675 | 100,942 | |||||||||||||||
| Interest income (expense), net |
(1,658 | ) | (655 | ) | 264 | 260 | (201 | ) | ||||||||||||
| Income tax expense |
(14,601 | ) | (20,287 | ) | (31,877 | ) | (7,687 | ) | (6,303 | ) | ||||||||||
| Depreciation and amortization |
(48,197 | ) | (54,581 | ) | (66,215 | ) | (15,424 | ) | (17,783 | ) | ||||||||||
| Gain (loss) on sale of assets |
164 | 47 | 2,608 | (195 | ) | (23 | ) | |||||||||||||
| Foreign currency gain (loss) |
(1,930 | ) | (3,209 | ) | (450 | ) | 2,626 | (3,587 | ) | |||||||||||
|
|
|
|
|
|
|
|
|
|
|
|||||||||||
| Net income |
$ | 118,401 | $ | 170,787 | $ | 350,934 | $ | 82,255 | $ | 73,045 | ||||||||||
|
|
|
|
|
|
|
|
|
|
|
|||||||||||
| (1) | Corporate and other represents amounts not directly associated with an operating segment. |
Three Months Ended March 31, 2013 Compared to Three Months Ended March 31, 2012
International Services
Revenue for the International Services segment increased by $1.8 million for the three months ended March 31, 2013, or 1.6%, compared to the same period in 2012, primarily as a result of increased service volume due to additional contracts and increased demand for our services from existing customers in our West Africa region.
Adjusted EBITDA for the International Services segment decreased by $1.9 million for the three months ended March 31, 2013, or 3.6%, compared to the same period in 2012, primarily due to the purchase of centralizers for resale ($0.4 million), additional bad debt expense ($1.5 million) and an increase in management fees ($0.9 million), partially offset by the $1.8 million increase in revenue described above.
58
Table of Contents
Index to Financial Statements
U.S. Services
Revenue for the U.S. Services segment increased by $1.3 million for the three months ended March 31, 2013, or 1%, compared to the same period in 2012 primarily due to $13.1 million of higher offshore services provided on production platforms. This increase was substantially offset by an $11.7 million decrease as a result of an 11% decline in average onshore rig counts in areas in which we operate.
Adjusted EBITDA for the U.S. Services segment decreased by $1.8 million for the three months ended March 31, 2013, or 4%, compared to the same period in 2012 primarily as a result of increases in cost of revenues and G&A of approximately $2.3 million related to contract labor, insurance and compensation. Partially offsetting this decrease was the increase in U.S. Services segment revenue described above.
Pipe and Products
Revenue for the Pipe and Products segment remained relatively constant, decreasing by $0.3 million for the three months ended March 31, 2013, or 0.7%, compared to the same period in 2012. Included in this decrease are lower revenues of $5.9 million in our pipe sales resulting from the temporary shut-down of more than 20 Gulf of Mexico rigs during February 2013, partially offset by an increase in sales of approximately $5.7 million to our International Services and U.S. Services segments from our manufacturing component.
Adjusted EBITDA for the Pipe and Products segment increased by $2.1 million for the three months ended March 31, 2013, or 33.2%, compared to the same period in 2012 due primarily to decreases in the cost of pipe.
Year Ended December 31, 2012 Compared to Year Ended December 31, 2011
International Services
Revenue for the International Services segment increased by $103.4 million, or 28%, compared to 2011, primarily as a result of additional contracts and increased demand for our services from existing customers in our Europe, Far East and Africa regions of approximately $56.7 million. In Latin America, we experienced an increase in tubular services performed on a callout basis of approximately $14.0 million. The remainder of the decrease is attributable to increased demand from our other international regions.
Adjusted EBITDA for the International Services segment increased by $66.1 million, or 43%, compared to 2011, primarily as a result of the $103.4 million revenue increase described above. Partially offsetting this increase were higher freight, transportation and repairs and maintenance expenses as demand for our services in the deep water offshore markets increased. The number of employees in the International Services segment increased 19% in 2012 compared to 2011 which initiated higher compensation related costs of approximately $24.5 million.
U.S. Services
Revenue for the U.S. Services segment increased by $167.3 million, or 60%, compared to 2011 primarily as a result of increased services volume due to increased permit activity in the U.S. Gulf of Mexico following the October 2010 repeal of the Macondo-related drilling moratorium.
Adjusted EBITDA for the U.S. Services segment increased by $127.3 million, or 176%, compared to 2011 primarily as a result of the $167.3 million revenue increase described above and an increase in other income of $9.1 million. Partially offsetting this increase was a $23.4 million increase in cost of revenues in 2012 due to increases in product costs and salaries and wages. G&A expenses increased $25.7 million in 2012 due primarily to higher compensation related to the increase in employees in the segment.
59
Table of Contents
Index to Financial Statements
Pipe and Products
Revenue for the Pipe and Products segment increased by $67.3 million, or 46%, compared to 2011 primarily as a result of increased permit activity in the U.S. Gulf of Mexico following the October 2010 repeal of the Macondo-related drilling moratorium. Increased sales with U.S. customers of approximately $40.2 million and an increase in activity in our international markets of approximately $16.8 million also contributed to the increase.
Adjusted EBITDA for the Pipe and Products segment increased by $3.8 million, or 16%, compared to 2011 primarily as a result of the $67.3 million revenue increase described above. Partially offsetting this increase was an increase in cost of revenues including higher materials costs of approximately $49.3 million and higher direct labor costs of approximately $7.8 million. In addition, G&A expenses increased approximately $3.3 million due to higher compensation related costs.
Year Ended December 31, 2011 Compared to Year Ended December 31, 2010
International Services
Revenue for the International Services segment increased by $76.5 million, or 26%, compared to 2010 primarily as a result of additional demand for our services from existing major customers in all regions of approximately $46.7 million and new contracts in Latin America of approximately $26.0 million.
Adjusted EBITDA for the International Services segment increased by $34.6 million, or 29%, compared to 2010 primarily as a result of the $76.5 million revenue increase described above. Partially offsetting this increase was an increase in compensation related costs of approximately $19.2 million as a result of a larger workforce in the segment as well as other operating costs of $11.0 million related to the increase in activity.
U.S. Services
Revenue for the U.S. Services segment increased by $45.4 million, or 20%, compared to 2010 due primarily to an increase in rig count from 2010 to 2011 as permitting activity in the Gulf of Mexico began to rise following the repeal of the Macondo related drilling moratorium.
Adjusted EBITDA for the U.S. Services segment increased by $35.7 million, or 98%, compared to 2010 primarily as a result of the $45.4 million increase in revenue described above. Partially offsetting this increase was an increase in compensation-related expenses of $12.2 million.
Pipe and Products
Revenue for the Pipe and Products segment increased by $21.1 million, or 17%, compared to 2010 primarily as a result of increased permit activity in the U.S. Gulf of Mexico following the October 2010 repeal of the Macondo-related drilling moratorium.
Adjusted EBITDA for the Pipe and Products segment decreased by $5.5 million, or 18%, compared to 2010 due primarily to an increase in materials costs and manufacturing costs of approximately $18.3 million and higher G&A compensation related costs of approximately $6.7 million partially offset by the $21.1 million increase in revenue described above.
Liquidity and Capital Resources
Liquidity
Our primary sources of liquidity to date have been intra-company borrowings, borrowings under our credit facilities and cash flows from operations. Our primary uses of capital have been for organic growth capital expenditures and acquisitions. We continually monitor potential capital sources, including equity and debt financing, in order to meet our investment and target liquidity requirements.
60
Table of Contents
Index to Financial Statements
Our total 2013 capital expenditure budget is $200.3 million, of which $164.0 million is for the purchase and manufacture of equipment and $36.3 million is for the purchase or construction of facilities. Our 2013 capital expenditure budget does not include any provision for acquisitions. While we have budgeted $200.3 million for the year ending December 31, 2013, the actual amount of capital expenditures for the manufacture of equipment may fluctuate based on market conditions. During the year ended December 31, 2012 and the three months ended March 31, 2013, we invested $180.2 million and $40.5 million, respectively, in capital expenditures, which was funded from internally generated funds. We believe the remaining net proceeds from this offering after repayment in full of the notes payable to FWW, together with cash flows from operations and additional borrowings under our credit facilities, should be sufficient to fund our capital expenditure requirements for the remainder of 2013.
The limited partnership agreement of FICV provides for distributions to be made on a pro rata basis to the holders of FICV interests (which holders, as of the completion of the offering, will consist of Mosing Holdings and FINV) for purposes of funding the holders’ tax obligations with respect to the income of FICV allocated to them. Generally, these tax distributions will be computed based on our estimate of the taxable income of FICV allocable to a holder of FICV interests multiplied by an assumed tax rate equal to the highest effective marginal combined U.S. federal, state and local income tax rate prescribed for an individual resident in Louisiana.
Following the completion of this offering, we intend to pay a regular quarterly dividend on our common stock of $0.075 per share, or an aggregate of approximately $44.7 million on an annual basis. However, our future dividend policy is within the discretion of our management board, with the approval of our supervisory board, and will depend upon various factors, including our results of operations, financial condition, capital requirements and investment opportunities. No dividends on our common stock will accrue in arrears. In addition, each share of Series A preferred stock will have a liquidation preference equal to its par value of €0.01 per share and will be entitled to an annual dividend equal to 0.25% of its par value. Based upon the number of Series A preferred shares outstanding upon completion of this offering, this amount would be €1,324 in the aggregate. We will only be able to pay dividends from our available cash on hand and funds received from FICV. FICV’s ability to make distributions to us will depend on many factors, including the performance of our business in the future. In order to make these distributions on our common stock and Series A preferred stock, we expect that FICV will be required to distribute approximately $60.6 million pro rata to holders of FICV interests. This aggregate amount would have represented approximately 20.6% of our pro forma net income and 13.6% of our pro forma Adjusted EBITDA for the year ended December 31, 2012.
Because we expect that the tax distribution to us from FICV will exceed our actual tax liabilities, we intend to use a portion of that distribution to fund part of our expected dividend. Any remaining cash needed to pay the dividend would be funded out of additional discretionary distributions from FICV, which are in our control subject to the availability of sufficient liquidity. Though we have not historically paid a regular quarterly dividend on our common stock, we have paid substantial tax and other distributions to our equity owners, including in the form of notes payable to FWW, on a relatively frequent basis. We believe that our historical cash flows would have been, and our expected future cash flows will be, sufficient to fund the amount of our expected future dividend on our common stock. See “Certain Relationships and Related Party Transactions—Limited Partnership Agreement of FICV.”
In addition, in the future, we expect to make payments pursuant to the tax receivable agreement that we intend to enter into with Mosing Holdings in connection with this offering, but we do not expect any such payments will have a material impact on our liquidity. We have the ability to elect to defer payments (which would accrue interest) to the extent we have not received sufficient cash distributions from FICV to satisfy our obligations thereunder, except in the case of an acceleration of payments thereunder occurring in connection with an early termination of the tax receivable agreement or a change in control of our company. If we were to defer substantial payment obligations on an ongoing basis under the tax receivable agreement, the accrual of those obligations would reduce the availability of cash for other purposes and we would be prohibited from paying dividends on our common stock. See “Risk Factors—Risks Related to Our Organizational Structure—We will be required under the tax receivable agreement to pay Mosing Holdings or its permitted transferees for certain tax
61
Table of Contents
Index to Financial Statements
benefits we may claim, and the amounts we may pay could be significant,” “Risk Factors—Risks Related to Our Organizational Structure—In certain cases, payments under the tax receivable agreement to Mosing Holdings or its permitted transferees may be accelerated or significantly exceed the actual benefits, if any, we realize in respect of the tax attributes subject to the tax receivable agreement” and “Certain Relationships and Related Party Transactions—Tax Receivable Agreement.”
Existing Indebtedness
In 2012, we made a non-cash distribution of $484.0 million to the owners of FINV in the form of two unsecured promissory notes payable. As of December 31, 2012 and March 31, 2013, there was an aggregate of approximately $464.0 million and $443.7 million, respectively, outstanding under the notes payable to FWW. Interest is charged on the notes at the applicable short-term monthly applicable federal rate as published by the Internal Revenue Service. As of December 31, 2012 and March 31, 2013, $320.0 million is included in current portion of notes payable to affiliates because it is due on demand and $144.0 million and $123.7 million, respectively, is included in notes payable to affiliates on the combined balance sheets. We intend to use a portion of the net proceeds from this offering to repay in full these outstanding notes payable.
In 2012, we issued a note payable to our chief executive officer, in an amount of $2.88 million in connection with a deferred bonus payment. As of December 31, 2012 and March 31, 2013, there was $2.88 million outstanding under this note payable. We also had various other notes payable totaling $3.2 million and $1.8 million at December 31, 2012 and March 31, 2013, respectively. These notes mature in 2013 with interest rates of 3% per annum.
We have financed certain business acquisitions. At December 31, 2012 and March 31, 2013, the aggregate outstanding balance of the finance agreements for such acquisitions was $1.3 million and $1.2 million, respectively, with interest rates ranging from 5% to 6% per annum. The finance agreements are due on demand in 2011 and have maturity dates ranging from September 2016 to October 2018.
In addition, we have financed certain aircraft through credit agreements. The aggregate outstanding balance of these credit agreements was $0.8 million at December 31, 2012 and March 31, 2013, with a fixed interest rate 5% per annum payable monthly. The credit agreements mature in August 2013 and the notes are secured by the aircraft. In connection with the reorganization described in “Organizational Structure,” Mosing Holdings will cause our U.S. operating subsidiaries to distribute certain assets that generate a de minimis amount of revenue, including the aircraft. Accordingly, the aircraft will not be contributed to FICV and we will no longer be responsible for payments under the credit facilities associated with the aircraft upon completion of this offering.
We have two revolving credit facilities, with available borrowing capacities of $40.0 million and $5.0 million, which mature on August 31, 2014 and February 19, 2016, respectively. Interest is paid monthly on the unpaid balance of the $40.0 million line of credit at the London Interbank Offering Rate plus approximately 2.5% per annum. Interest is paid on the unpaid balance of the $5.0 million line of credit at the prime rate, which equates to 4.5% with the applicable margin included. The aggregate outstanding balance under the credit facilities was $2.0 million as of March 31, 2013. The revolving credit facilities have certain financial covenants. As of March 31, 2013, we were in compliance with all financial covenants. In addition, we had outstanding letters of credit of $5.9 million as of March 31, 2013. In connection with this offering, we intend to repay any outstanding indebtedness in full and terminate our existing revolving credit facilities.
New Credit Facilities
In connection with this offering, FICV intends to enter into two revolving credit facilities with Amegy Bank, National Association, as Administrative Agent and Capital One, National Association, as Syndication Agent, and certain other financial institutions. The credit agreements will provide for (i) a $100 million revolving credit facility, including up to $20 million for letters of credit and up to $10 million in swingline loans, which will mature in July 2018 (the “Five Year Facility”) and (ii) a $100 million revolving credit facility that will
62
Table of Contents
Index to Financial Statements
mature in July 2014 (the “One Year Facility” and, together with the Five Year Facility, the “Credit Facilities”). Subject to the terms of the credit agreements, we have the ability to increase the commitments under the Credit Facilities by $150 million. As of the closing of this offering, we do not expect to have any outstanding indebtedness under the Credit Facilities.
It is anticipated that future borrowings under the Credit Facilities will be available for working capital and general corporate purposes, including capital expenditures and for the issuance of letters of credit. The availability of the Credit Facilities is subject to certain conditions precedent, including the closing of this offering.
The credit agreements contain various covenants that, among other things, limit our ability to grant certain liens, make certain loans and investments, enter into mergers or acquisitions unless certain conditions are satisfied, enter into hedging transactions unless certain conditions are satisfied, change our lines of business, prepay certain indebtedness, enter into certain burdensome agreements, enter into certain affiliate transactions or engage in certain asset dispositions. Additionally, the credit agreements limit our ability to incur additional indebtedness subject to certain exceptions.
The credit agreements also contain financial covenants, which, among other things, require us, on a consolidated basis, to maintain specified financial ratios or conditions summarized as follows:
| • | Total consolidated funded debt to adjusted EBITDA (defined as the “Leverage Ratio” in the credit agreements) of not more than 2.50 to 1.0; and |
| • | EBITDA to interest expense (defined as the “Interest Coverage Ratio” in the credit agreements) of not less than 3.0 to 1.0. |
The obligations under the credit agreements are unsecured, and all of the obligations under the Credit Facilities are guaranteed by FICV’s subsidiaries.
Borrowings under our credit facilities bear interest, at our option, at either a base rate or an Adjusted Eurodollar rate. Base rate loans under the credit facilities will bear interest at a rate based off of the higher of (a) the Prime Rate as published from time to time in the Bonds, Rates & Yields section of The Wall Street Journal, (b) the Federal Funds Effective Rate plus 0.5% or (c) the Adjusted Eurodollar Rate plus 1.00%, plus an applicable margin ranging from 0.50% to 1.50% (determined with reference to our leverage ratio). Interest is payable quarterly for base rate loans.
Eurodollar loans under the credit facilities will bear interest at an Adjusted Eurodollar Rate equal to the Eurodollar Rate for such interest period multiplied by the Statutory Reserves, plus an applicable margin ranging from 1.50% to 2.50% (determined with reference to our leverage ratio). Interest is payable at the end of applicable interest periods for Eurodollar loans, except that if the interest period for a Eurodollar loan is longer than three months, interest is paid at the end of each three-month period. The timing of the required interest payments does not affect the calculation of the interest on the Eurodollar loans.
In addition, the unused portion of the Five Year Facility will be subject to a commitment fee of up to 0.375%.
If an event of default exists under the credit agreements, the lenders have the right to accelerate the maturity of the obligations outstanding under the credit agreements and exercise other rights and remedies. Each of the following constitutes an event of default under the credit agreements:
| • | representations and warranties in the credit agreements or other loan documents being incorrect or misleading in any material respect; |
| • | failure to pay any principal when due or any interest, fees or other amount within certain grace periods; |
| • | failure to perform or otherwise comply with the covenants in the credit agreements or other loan documents, subject, in certain instances, to grace periods; |
63
Table of Contents
Index to Financial Statements
| • | the actual or asserted invalidity of any material provisions of the guarantees of the indebtedness under the credit agreements; |
| • | default by us or our restricted subsidiaries on the payment of any other indebtedness with a principal amount in excess of $10 million, any default in the performance of any obligation or condition with respect to such indebtedness beyond the applicable grace period if the effect of the default is to permit or cause the acceleration of the indebtedness, or such indebtedness will be declared due and payable prior to its scheduled maturity; |
| • | bankruptcy or insolvency events involving us or our restricted subsidiaries; |
| • | the entry, and failure to pay, of one or more adverse judgments in excess of $10 million, upon which enforcement proceedings are commenced or that are not stayed pending appeal; and |
| • | the occurrence of a change in control (as defined in the Credit Facilities). |
Cash Flows from Operating, Investing and Financing Activities
Cash flows provided by (used in) operations by type of activity were as follows for the periods indicated (in thousands):
| Year Ended December 31, | Three Months Ended March 31, |
|||||||||||||||||||
| 2010 | 2011 | 2012 | 2012 | 2013 | ||||||||||||||||
| Operating activities |
$ | 163,414 | $ | 180,710 | $ | 344,776 | $ | 78,669 | $ | 50,664 | ||||||||||
| Investing activities |
(69,130 | ) | (126,655 | ) | (182,533 | ) | (47,541 | ) | (42,014 | ) | ||||||||||
| Financing activities |
(79,261 | ) | (71,874 | ) | (107,210 | ) | (14,742 | ) | (44,235 | ) | ||||||||||
|
|
|
|
|
|
|
|
|
|
|
|||||||||||
| 15,023 | (17,819 | ) | 55,033 | 16,386 | (35,585 | ) | ||||||||||||||
| Effect of exchange rate changes on cash activities |
285 | 2,305 | (737 | ) | (1,933 | ) | 6,032 | |||||||||||||
|
|
|
|
|
|
|
|
|
|
|
|||||||||||
| Increase (decrease) in cash and cash equivalents |
$ | 15,308 | $ | (15,514 | ) | $ | 54,296 | $ | 14,453 | $ | (29,553 | ) | ||||||||
|
|
|
|
|
|
|
|
|
|
|
|||||||||||
Statements of cash flows for entities with international operations that are local currency functional exclude the effects of the changes in foreign currency exchange rates that occur during any given year, as these are non-cash changes. As a result, changes reflected in certain accounts on the combined statements of cash flows may not reflect the changes in corresponding accounts on the combined balance sheets.
Operating Activities
Cash flow from operating activities was $50.7 million for the three months ended March 31, 2013 as compared to $78.7 million in the comparable period in 2012. The decrease in 2012 was due primarily to a decrease in net income and payments of accrued expenses and other current liabilities.
Cash flow from operating activities was $344.8 million for the year ended December 31, 2012 as compared to $180.7 million in 2011 and $163.4 million in 2010. The increase in 2012 was due primarily to the increase in profitability as a result of the increased permit activity from the repeal of the Macondo-related moratorium in the U.S. Gulf of Mexico that occurred in late 2010. The increase in 2011 was due primarily to higher revenues partially offset by an increase in accounts receivable.
Investing Activities
Cash flow used in investing activities was $42.0 million for the three months ended March 31, 2013 as compared to $47.5 million in the comparable period in 2012. The decrease in 2013 was due primarily to decreases in capital expenditures.
64
Table of Contents
Index to Financial Statements
Cash flow used in investing activities was $182.5 million for the year ended December 31, 2012 as compared to $126.7 million in 2011 and $69.1 million in 2010. The increases in 2012 and 2011 were primarily due to increases in capital expenditures to ensure that we maintain the appropriate levels and types of machinery and equipment to support our expanding business.
Financing Activities
Cash flow used in financing activities was $44.2 million for the three months ended March 31, 2013 as compared to $14.7 million in the comparable period in 2012. The increase in 2013 was due primarily to $20.3 million in payments related to the FWW note.
Cash used in financing activities was $107.2 million for the year ended December 31, 2012 as compared to $71.9 million in 2011 and $79.3 million in 2010. The increase in 2012 was primarily due to an increase in stockholder distributions partially offset by an increase in borrowings from our revolving credit facilities. The decrease in 2011 was primarily due to a decrease in stockholder distributions, partially offset by an increase in borrowings under our lines of credit and proceeds from the reissuance of stock.
Contractual Obligations
We lease several facilities worldwide and accommodations for certain employees located outside of the U.S. under noncancelable operating leases.
The following table presents our contractual obligations and contingent commitments by period as of December 31, 2012, on a pro forma basis to give effect to our reorganization in connection with this offering as described in “Organizational Structure” and the use of the estimated net proceeds from this offering as described in “Use of Proceeds” as if all such transactions had occurred on January 1, 2012. Our obligations to make payments in the future may vary due to certain assumptions including the duration of our obligations and anticipated actions by third parties.
| Payments Due by Period | ||||||||||||||||||||
| Total | Less than 1 year |
1-3 years | 3-5 years | More than 5 years |
||||||||||||||||
| (in thousands) | ||||||||||||||||||||
| Long-term debt and capital lease obligations (1) |
$ | 9,430 | $ | 8,379 | $ | 1,051 | $ | — | $ | — | ||||||||||
| Interest payments (2) |
382 | 277 | 101 | 4 | — | |||||||||||||||
| Noncancelable operating leases (3) |
26,696 | 4,955 | 7,301 | 5,523 | 8,917 | |||||||||||||||
| Uncertain tax positions |
3,913 | — | — | — | 3,913 | |||||||||||||||
|
|
|
|
|
|
|
|
|
|
|
|||||||||||
| Total |
$ | 40,421 | $ | 13,611 | $ | 8,453 | $ | 5,527 | $ | 12,830 | ||||||||||
|
|
|
|
|
|
|
|
|
|
|
|||||||||||
| (1) | Amounts represent the expected cash payments of principal amounts associated with our long-term debt and capital lease obligations. |
| (2) | Amounts represent the expected cash payments for interest on our long-term debt and capital lease obligations. The interest amount calculated is based on the assumption that the amount outstanding and the interest rate charged both remain at their current levels. |
| (3) | Upon consummation of our initial public offering, we will incur additional rental expense and charter service expense of approximately $3.8 million and $1.1 million per year, respectively, due to the distribution of the real estate and aircraft to Mosing Holdings, Inc. These amounts are not included in the table above as the terms of such new agreements are not yet known. |
Off-Balance Sheet Arrangements
At March 31, 2013, we had no off-balance sheet debt or arrangements.
65
Table of Contents
Index to Financial Statements
Critical Accounting Policies
The preparation of combined financial statements in conformity with GAAP requires management to select appropriate accounting principles from those available, to apply those principles consistently and to make reasonable estimates and assumptions that affect revenues and associated costs as well as reported amounts of assets and liabilities, and related disclosure of contingent assets and liabilities. Certain accounting policies involve judgments and uncertainties. We evaluate estimates and assumptions on a regular basis. We base our respective estimates on historical experience and various other assumptions that we believe to be reasonable under the circumstances, the results of which form the basis for making judgments about the carrying values of assets and liabilities that are not readily apparent from other sources. Actual results may differ from the estimates and assumptions used in preparation of our combined financial statements. We consider the following policies to be the most critical to understanding the judgments that are involved and the uncertainties that could impact our results of operations, financial condition and cash flows.
Revenue Recognition
All revenue is recognized when all of the following criteria have been met: (1) evidence of an arrangement exists; (2) delivery to and acceptance by the customer has occurred; (3) the price of the customer is fixed or determinable; and (4) collectability is reasonably assured, as follows:
Services Revenue. We provide tubular services to clients in the oil and gas industry. We perform services either under direct service purchase orders or master service agreements. Service revenue is recognized when services have been performed or rendered.
Rental Revenue. We design and manufacture a suite of highly technical equipment and products that we rent to our customers in connection with providing our services, including high-end, proprietary tubular handling equipment. We rent our products either under direct rental agreements or with customers with rental agreements in place. Revenue from rental agreements is recognized as earned over the rental period.
For customers contracted under direct service purchase orders and direct rental agreements, an accrual is recorded in unbilled accounts receivable for revenue earned but not yet invoiced.
Pipe and Products Revenue. Revenue on pipe and products sales is recognized when the product has shipped and significant risks of ownership have passed to the customer. The sales arrangements typically do not include right of return or other similar provisions or other post-delivery obligations. In some regions, customers have a right of return due to purchasing of excess products and deliverability limitations of products in remote locations. When the likelihood of a return exists on a sale, a determination of this portion of revenue is reclassified to unearned revenue until such time as the product is returned or no return occurs.
Income Taxes
The liability method is used for determining our income tax provisions, under which current and deferred tax liabilities and assets are recorded in accordance with enacted tax laws and rates. Under this method, the amounts of deferred tax liabilities and assets at the end of each period are determined using the tax rate expected to be in effect when taxes are actually paid or recovered. Valuation allowances are established to reduce deferred tax assets when it is more likely than not that some portion or all of the deferred tax assets will not be realized. In determining the need for valuation allowances, we have considered and made judgments and estimates regarding estimated future taxable income and ongoing prudent and feasible tax planning strategies. These estimates and judgments include some degree of uncertainty, and changes in these estimates and assumptions could require us to adjust the valuation allowances for our deferred tax assets. Historically, changes to valuation allowances have been caused by major changes in the business cycle in certain countries and changes in local country law. The ultimate realization of the deferred tax assets depends on the generation of sufficient taxable income in the applicable taxing jurisdictions.
66
Table of Contents
Index to Financial Statements
Through FICV, we operate in approximately 60 countries under many legal forms. As a result, we are subject to the jurisdiction of numerous U.S. and foreign tax authorities, as well as to tax agreements and treaties among these governments. Our operations in these different jurisdictions are taxed on various bases: actual income before taxes, deemed profits (which are generally determined using a percentage of revenue rather than profits) and withholding taxes based on revenue. Determination of taxable income in any jurisdiction requires the interpretation of the related tax laws and regulations and the use of estimates and assumptions regarding significant future events such as the amount, timing and character of deductions, permissible revenue recognition methods under the tax law and the sources and character of income and tax credits. Changes in tax laws, regulations, agreements and treaties, foreign currency exchange restrictions or our level of operations or profitability in each taxing jurisdiction could have an impact on the amount of income taxes that we provide during any given year.
Our tax filings for various periods are subject to audit by the tax authorities in most jurisdictions where we conduct business. These audits may result in assessments of additional taxes that are resolved with the authorities or through the courts. We believe these assessments may occasionally be based on erroneous and even arbitrary interpretations of local tax law. Resolution of these situations inevitably includes some degree of uncertainty; accordingly, we provide taxes only for the amounts we believe will ultimately result from these proceedings. The resulting change to our tax liability, if any, is dependent on numerous factors including, among others, the amount and nature of additional taxes potentially asserted by local tax authorities; the willingness of local tax authorities to negotiate a fair settlement through an administrative process; the impartiality of the local courts; the number of countries in which we do business; and the potential for changes in the tax paid to one country to either produce, or fail to produce, an offsetting tax change in other countries. Our experience has been that the estimates and assumptions we have used to provide for future tax assessments have proven to be appropriate. However, past experience is only a guide, and the potential exists that the tax resulting from the resolution of current and potential future tax controversies may differ materially from the amount accrued.
In addition to the aforementioned assessments that have been received from various tax authorities, we also provide for taxes for uncertain tax positions where formal assessments have not been received. The determination of these liabilities requires the use of estimates and assumptions regarding future events. Once established, we adjust these amounts only when more information is available or when a future event occurs necessitating a change to the reserves such as changes in the facts or law, judicial decisions regarding the application of existing law or a favorable audit outcome. We believe that the resolution of tax matters will not have a material effect on our combined financial condition, although a resolution could have a material impact on our consolidated statements of income for a particular period and on our effective tax rate for any period in which such resolution occurs.
Recent Accounting Pronouncements
In February 2013, the Financial Accounting Standards Board (“FASB”) issued Accounting Standards Update (“ASU”) No. 2013-02, Reporting of Amounts Reclassified Out of Accumulated Other Comprehensive Income (“AOCI”). This ASU requires entities to present separately, among other items, the amount of the change that is due to reclassifications, and the amount that is due to current period other comprehensive income. We adopted the new presentation requirements in the notes to our financial statements in the first quarter of 2013, but otherwise there was no impact our combined financial position, results of operations or cash flows as there are currently no items reclassified from AOCI.
In September 2011, the FASB issued an accounting standards update which provides, subject to certain conditions, the option to perform a qualitative, rather than quantitative, assessment of goodwill to determine whether it is more likely than not that the fair value of a reporting unit is less than its carrying amount. This update was effective and adopted by us in the first quarter of 2012 and did not have a material impact on our combined financial position, results of operations or cash flows.
67
Table of Contents
Index to Financial Statements
In June 2011, the FASB issued an accounting standards update which revises the manner in which entities present comprehensive income in their financial statements. The new guidance requires entities to report components of comprehensive income in either (1) a continuous statement of comprehensive income or (2) a separate but consecutive statement. Under the two-statement approach, the first statement would include components of net income, which is consistent with the income statement format previously used by us, and the second statement would include components of other comprehensive income (“OCI”). The update does not change the items that must be reported in OCI and must be applied retrospectively for all periods presented in the financial statements. This update was effective and adopted by us in the first quarter of 2012 and impacted our financial statement presentation, but otherwise did not impact our combined financial position, results of operations or cash flows.
In May 2011, the FASB issued an accounting standards update which amends the definition of fair value measurement principles and disclosure requirements to eliminate differences between U.S. GAAP and International Financial Reporting Standards. The update requires new quantitative and qualitative disclosures about the sensitivity of recurring Level 3 measurement disclosures, as well as disclosures of transfers between Level 1 and Level 2 of the fair value hierarchy. This update was effective and adopted by us in the first quarter of 2012 and impacted our disclosures, but otherwise did not impact our combined financial position, results of operations or cash flows.
Quantitative and Qualitative Disclosures about Market Risk
We are exposed to certain market risks that are inherent in our financial instruments and arise from changes in foreign currency exchange rates and interest rates. A discussion of our market risk exposure in financial instruments is presented below.
Foreign Currency Exchange Rates
We operate in virtually every oil and natural gas exploration and production region in the world. In some parts of the world, the currency of our primary economic environment is the U.S. dollar, and we use the U.S. dollar as our functional currency. In other parts of the world, such as Europe, Norway, Venezuela and Brazil, we conduct our business in currencies other than the U.S. dollar, and the functional currency is the applicable local currency.
Assets and liabilities of entities for which the functional currency is the local currency are translated into U.S. dollars using the exchange rates in effect at the balance sheet date, resulting in translation adjustments that are reflected in accumulated other comprehensive income (loss) in the shareholders’ equity section on our combined balance sheets. A portion of our net assets are impacted by changes in foreign currencies in relation to the U.S. dollar. We recorded a $4.3 million adjustment to decrease our equity account for the three months ended March 31, 2013 to reflect the change in the U.S. dollar against various foreign currencies.
For the three months ended March 31, 2013, on a U.S. dollar-equivalent basis, approximately 25% of our revenue was represented by currencies other than the U.S. dollar. However, no single foreign currency represented more than 5% of our revenue. A hypothetical 10% decrease in the exchange rates for each of the foreign currencies in which a portion of our revenues is denominated would result in a 1.5% decrease in our overall revenues for the three months ended March 31, 2013.
Devaluation of Venezuelan Bolivar Fuerte
In February 2013, the Venezuelan government announced a devaluation of the Bolivar Fuerte (“Bolivar”), resulting in the exchange rate declining from 4.3 to 6.3 Bolivars per U.S. Dollar. As a result of the devaluation, the Company recorded a foreign currency loss of $1.8 million during the three months ended March 31, 2013, related to the remeasurement of the Bolivar-denominated net monetary assets of the company’s Venezuelan operations as of the date of the devaluation.
68
Table of Contents
Index to Financial Statements
Interest Rate Risk
We are exposed to changes in interest rates on our floating rate borrowings under our revolving credit facilities and under our notes payable to FWW. Although we do not currently utilize interest rate derivative instruments to reduce interest rate exposure, we may do so in the future.
As of March 31, 2013, we had approximately $443.7 million in outstanding borrowings in the form of two promissory notes payable to FWW or its affiliate. We intend to use a portion of the net proceeds from this offering to repay in full these outstanding notes payable. Interest is charged on the notes at the applicable short-term monthly applicable federal rate as published by the Internal Revenue Service. The impact of a 1% increase in interest rates on these notes payable as of March 31, 2013 would have resulted in a $1.1 million increase in interest expense.
Customer Credit Risk
Financial instruments that potentially subject us to concentrations of credit risk are trade receivables. We extend credit to customers and other parties in the normal course of business. We have established various procedures to manage our credit exposure, including credit evaluations and maintaining an allowance for doubtful accounts.
We are also exposed to credit risk because our customers are concentrated in the oil and natural gas industry. This concentration of customers may impact overall exposure to credit risk, either positively or negatively, because our customers may be similarly affected by changes in economic and industry conditions, including sensitivity to commodity prices. While current energy prices are important contributors to positive cash flow for our customers, expectations about future prices and price volatility are generally more important for determining future spending levels. However, any prolonged increase or decrease in oil and natural gas prices affects the levels of exploration, development and production activity, as well as the entire health of the oil and natural gas industry, and can therefore negatively impact spending by our customers.
69
Table of Contents
Index to Financial Statements
Overview
We are a 75 year-old, industry-leading global provider of highly engineered tubular services to the oil and gas industry. We provide our services to leading exploration and production companies in both offshore and onshore environments, with a focus on complex and technically demanding wells. We believe that we are one of the largest global providers of tubular services to the oil and gas industry.
Tubular services involve the handling and installation of multiple joints of pipe to establish a cased wellbore and the installation of smaller diameter pipe inside a cased wellbore to provide a conduit for produced oil and gas to reach the surface. The casing of a wellbore isolates the wellbore from the surrounding geologic formations and water table, provides well structure and pressure integrity, and allows well operators to target specific zones for production. Given the central role that our services play in the structural integrity, reliability and safety of a well, and the importance of efficient tubular services to managing the overall cost of a well, we believe that our role is vital to the overall process of producing oil and gas. For more information regarding tubular services, see “—Industry—Tubular Services.”
Our specially trained employees provide our services using a suite of highly technical, purpose-built equipment, much of which we design and manufacture for our proprietary use. Most of our manufactured equipment and products use patented, advanced technologies that enable us to service complex wells, increase efficiency, enhance well integrity and improve safety. We currently have 104 U.S. patents and 136 related international patents and 37 U.S. patent applications pending and 111 related international patent applications pending for equipment that our engineers have developed.
Recent developments in well construction and completion requirements have resulted in increased technical demands associated with tubular services. For onshore wells, these developments include long horizontal laterals and deviated well bores that seek to maximize the wells’ exposure to hydrocarbon-bearing geologic formations. In the offshore environment, these developments include increasing water and well depths, which require lengthier and heavier strings, as well as tubular handling equipment capable of accommodating a more complex array of equipment and hydraulic control lines that are deployed inside the well. We believe that we are a market leader in the development of equipment and services that facilitate and accommodate recent developments in well construction and completion requirements and this is reflected in our extensive suite of patent-protected, innovative products and equipment. We continuously work with our customers to develop new products, improve efficiency and safety and solve complex well construction and completion problems.
In addition to our tubular handling equipment, we also design and manufacture certain products that we sell or rent directly to external customers, including large OD pipe connectors and casing attachments. We also provide specialized fabrication and welding services in support of deep water projects in the U.S. Gulf of Mexico, including drilling and production risers, flowlines and pipeline end terminations, as well as long length tubulars (up to 300 feet in length) for use as caissons or pilings. Finally, we distribute large OD pipe manufactured by third parties, and generally maintain an inventory of this pipe in order to support our pipe sales and distribution operations.
Spears estimates that the global market for tubular services (excluding product sales) was approximately $3.3 billion in annual revenues in 2012 and will grow to $3.8 billion in 2013. Spears projects that this market will grow at an annual rate of approximately 11% between 2012 and 2015. There are a limited number of companies that provide these services on a global basis. We serve our customers through a network of over 90 sales and support offices in approximately 60 countries. Our customer base includes major international oil companies, such as Anadarko, BP, Chevron, ConocoPhillips, ExxonMobil, Shell, Total and Murphy Oil Corporation, and national oil companies, such as PDVSA, Statoil and Saudi Aramco, as well as numerous independent oil and gas producers.
70
Table of Contents
Index to Financial Statements
We believe we differentiate ourselves from our competitors on the basis of the quality and reliability of our service, our proprietary technology, and our ability to perform in the most demanding environments, including deep water and ultra-deep water projects. Our expertise stems from years of experience, a focus on technical innovation and our highly trained and dedicated workforce. Representative examples of the trusted, critical services we have been selected to provide to our customers include:
| • | In March 2013, we successfully completed the casing installation for the Chevron Northwood well in the Green Canyon Block 945 area of the Gulf of Mexico, to a total depth of 31,866 feet in a water depth of 6,000 feet, which is the deepest oil and gas well of which we are aware. |
| • | In August 2012, we broke our own record for greatest hook load recorded at approximately 1,140 tons while lifting 24,500 feet of combined casing and landing string for Shell’s Stones 4 well in the U.S. Gulf of Mexico. |
| • | In June 2010, we successfully provided all tubular services for the relief well drilled by BP to contain the Macondo well in the U.S. Gulf of Mexico. |
| • | In 2006, we were selected to provide tubular installation services on the BP Shah Deniz project in offshore Azerbaijan, which is an ongoing multiple well project. We believe we were selected for the project due to our highly regarded technical capabilities, including our proprietary Fluid Grip Power Tong gripping technology combined with our Collar Load Support tubular handling system. These proprietary technologies are critical for this project due to their ability to provide “zero marking” handling of the specialized CRA completion tubulars required in wells with high hydrogen sulfide content. CRA services have also been increasingly common in other corrosive high-pressure, high-temperature applications, both onshore and offshore. |
We have a long history of strong revenue growth. Specifically, as depicted in the chart below, our revenues have grown sequentially in all but one of the past 10 years.
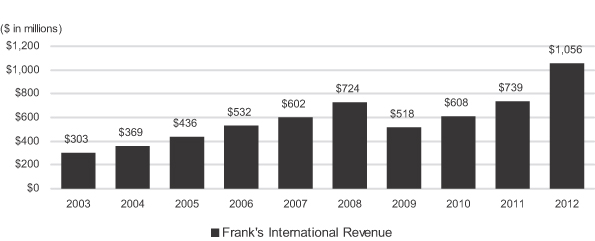
Our results over this period were driven by a number of factors:
| • | Acquisitions that increased our geographic footprint in the onshore market in the continental United States. As a consequence of these acquisitions, we were well positioned to benefit from the significant increase in drilling and development activity in most of the nation’s unconventional shale basins over the past decade. |
| • | Increasing complexity in offshore well design. Over the course of the past decade, offshore wells have become increasingly complex. In order to manage fluid pressure and well integrity, offshore wells are often drilled and completed in stages with multiple casing strings being required. In addition, offshore wells increasingly include the placement of a number of gauges, sensors, valves and hydraulic control |
71
Table of Contents
Index to Financial Statements
| lines deployed inside the well. The need to accommodate these developments has increased the technical requirements and complexity of tubular services, and therefore our revenue opportunity. |
| • | Growing international presence. Our ability to operate on a global basis provides a significant competitive advantage. Our customer base includes major international oil companies, such as Anadarko, BP, Chevron, ConocoPhillips, ExxonMobil, Shell and Total, and national oil companies, such as PDVSA, Statoil and Saudi Aramco. To better serve these customers, we developed a network of over 90 sales and support offices in approximately 60 countries. We have grown our international presence so that we can participate in their offshore development projects in locations such as East and West Africa, the Asia-Pacific region, the Middle East, the North Sea and South America. |
| • | Increasing deep water drilling activity and the impact of the global financial crisis and the Macondo incident. Because of our strong market share in offshore tubular services, we have benefited from growing deep water drilling activity in recent years. Our revenue was affected by the global financial crisis in 2009, notably in the U.S. onshore market, and by the Macondo incident in 2010, which dampened our offshore results in the U.S. Gulf of Mexico in large part because of the drilling moratorium that was imposed. Consistent with other service providers, our business activity in the U.S. Gulf of Mexico began to recover to pre-Macondo levels in 2011, a year after the moratorium was lifted. Worldwide offshore rig counts continue to increase as crude oil supply and demand fundamentals encourage new drilling. Offshore discoveries are expected to play an important role in the future, particularly deep water discoveries. |
Our revenue grew by 43% to $1,055.9 million for the twelve months ended December 31, 2012 compared to $739.1 million for the twelve months ended December 31, 2011, and Adjusted EBITDA grew by 79% to $446.6 million from $249.5 million over the same period. During the twelve months ended December 31, 2012, 45% of our revenue was generated outside North America, and 69% was generated from products and services provided offshore. For an explanation of how we calculate Adjusted EBITDA, see “Selected Historical Combined and Unaudited Pro Forma Financial Data—Non-GAAP Financial Measures.”
Competitive Strengths
We believe that we are well positioned to execute our strategy based on the following competitive strengths:
| • | Global market leader. We are a leading provider of tubular services in many of the regions in which we operate, including the U.S. Gulf of Mexico and almost every significant international offshore market, almost all of the major U.S. onshore resource basins and in targeted active international onshore regions. Moreover, we believe that we are one of only a few tubular service companies with true global capabilities. According to Spears, we have the number one or number two market share in each of the U.S. and international markets, both onshore and offshore. We currently provide our services in approximately 60 countries on six continents. Our customers include most of the world’s largest integrated oil companies and many of the largest national oil companies. We have no significant customer or geographic concentration. Our global presence allows us to quickly expand to additional regions that experience increases in drilling and production activity. |
| • | Focused service provider with highly differentiated engineering capabilities. We have an in-house engineering team responsible for developing new products that add value to our service capabilities and expand our portfolio of products and services. Our engineers typically work closely with our field personnel and customers in order to identify specific equipment needs related to the services we provide. We believe that we are a market leader in the development of equipment and services that facilitate and accommodate recent developments in well construction and completion requirements, and this is reflected in our extensive suite of patent-protected, innovative products and equipment. We believe that our engineering expertise and our service and product line focus give us a competitive advantage in quickly designing and manufacturing custom solutions in response to our customers’ unique requirements and applications. We have received a number of customer and industry awards recognizing the achievements of our engineering group and our custom designed solutions. |
72
Table of Contents
Index to Financial Statements
| • | Favorable reputation developed over eight decades. We believe our customers select Frank’s International because of our reputation for safety, reliability, quality service and proprietary technology. While generally a small portion of the overall well cost, properly performed tubular services are critical to protecting the producer’s investment in the well, as well as its safe operation during production. The economic stakes are especially high for deep water wells, where day rates for offshore drilling rigs and other associated services can approach $1 million per day, and a producer’s investment in a single offshore well can exceed $80 million. The difference between efficiently executed tubular services and less efficiently executed services can save producers days or even weeks, which can translate directly into significant and measurable savings. The producer’s environmental, safety and regulatory risks associated with operating offshore are also heightened. In connection with their customer feedback-based survey, EnergyPoint Research has ranked Frank’s International first in customer satisfaction in one or more oilfield service or product categories every year since 2004, the first year in which the survey was conducted. Our reputation for safety is further demonstrated by our ability to meet and exceed the stringent safety requirements of our customers, some of which have been Frank’s International customers for over 40 years. |
| • | Strong position in favorable deep water offshore markets. We believe Frank’s International will continue to benefit from the continued development of oil and gas resources located offshore. As a result of the long development lead times associated with deep water projects, they are generally less likely to be cancelled or delayed due to volatility in commodity or financial markets. Also, due to their technical complexity and often remote locations, offshore projects typically provide us with a greater opportunity to differentiate our capabilities from those of our competitors. According to Spears, offshore development spending will increase at an annual rate of approximately 12% between 2011 and 2018. Approximately 67% of our services revenue from external customers in 2012 was generated from offshore services, and our global market share in offshore services was approximately 29% in 2012, according to Spears. Moreover, the significant majority of our offshore services revenue in 2012 was from deep water markets. We believe the economic opportunity for deep water services will continue to be favorable given the technical challenges associated with constructing and completing wells offshore, and the risk of potential negative economic consequences to our customers if tubular services are poorly performed. |
| • | Attractive financial results reflect value of our differentiated and critical services. For the year ended December 31, 2012 and the three months ended March 31, 2013, our Adjusted EBITDA margin was approximately 42% and 43%, respectively, which we believe reflects the economic value to our customers of our differentiated and critical services and the benefits of a diversified, global customer base. Because our business is not capital intensive, we generate significant free cash flow. Consequently, we intend to pay a regular quarterly dividend on our common stock of $0.075 per share. As of March 31, 2013 after giving effect to this offering, we expect to have approximately $241.7 million of cash and cash equivalents and approximately $7.9 million of outstanding indebtedness. |
| • | Significant experience selectively acquiring and integrating companies. We have a long history of evaluating and acquiring companies that expand or complement our geographic footprint and product and service offerings. Since 1982, we have successfully acquired and integrated more than 50 private companies. We believe that being a public company will enhance our acquisition strategy and allow us to target larger acquisition candidates. |
| • | Experienced management team with proven track record. Our executive officers and senior operational managers have extensive experience at Frank’s International and in the oilfield service industry generally. Our executive officers and senior operational managers have an average of 25 years of experience in the oilfield services industry with us. Our chief executive officer, Keith Mosing, is a third generation owner and manager who successfully led our expansion into international operations. The Mosing family will continue to own the majority equity interest in us following the completion of this offering, which we believe aligns their interests with the interests of our public investors. |
73
Table of Contents
Index to Financial Statements
Business Strategy
Our objective is to maximize shareholder value by expanding our leading global oilfield services company and continuing to supply high-quality services and products to our customers. We intend to accomplish that objective by capitalizing on the key long-term industry growth trends through the execution of the following strategies:
| • | Continue to focus on customer service. We have a long track record of being responsive to our customers’ unique requirements. We believe that focusing on our customers’ needs and continuing to provide industry-leading technological and safety innovations will enable us to expand our customer base and increase our revenues. |
| • | Sustain our track record of technical innovation. Our team of over 70 in-house engineers and engineering technicians works to develop new products and technologies and provides operational support. We currently have 104 U.S. patents and 136 related international patents and 37 U.S. patent applications pending and 111 related international patent applications pending for equipment that our engineers have developed. In addition, we currently have more than 50 new technologies and product improvements under development. We have developed strong working relationships with oil and gas producers throughout the world, many of which have approached us with requests for solutions to specific well construction and completion challenges. To address these needs, we continue to invest in new product engineering capabilities. In addition to our own efforts to continuously enhance our equipment and procedures, we expect to continue to develop innovative products and solutions driven by our customers’ needs. |
| • | Pursue disciplined growth organically and through acquisitions. We intend to selectively pursue acquisitions that complement our geographic footprint and product and service offerings, with a focus on businesses that would benefit from our global presence and international sales capabilities. We intend to continue to grow organically by leveraging our customer base, investing in additional equipment and geographically expanding our existing global facilities in order to continue to grow our cash flows and satisfy incremental customer demand. |
| • | Maintain and expand our worldwide presence. We are committed to being on the ground in strategic markets to provide services on a global basis. We intend to build upon our existing presence in Africa, the Asia-Pacific region, the Middle East, North America, the North Sea and South America through deployment of sales, distribution, and service resources. We believe this organic expansion will provide more points of contact with our customers, allowing us to respond more quickly to their needs. |
Segments
We conduct our business through three operating segments:
| • | International Services. We currently provide our services in approximately 60 countries on six continents. Our customers in these international markets are primarily large exploration and production companies, including integrated oil and gas companies and national oil and gas companies, with a significant focus on complex, high profile projects. Our International Services segment accounted for approximately 49% and 50%, respectively, of our Adjusted EBITDA in 2012 and the first three months of 2013. Approximately 82% and 83%, respectively, of our revenue from external customers in this segment was generated in offshore markets in 2012 and in the first three months of 2013, the significant majority of which was from deep water markets. |
| • | U.S. Services. Approximately 51% and 63%, respectively, of our 2012 and first quarter 2013 U.S. Services segment revenue from external customers was generated in the technically challenging deep water areas of the U.S. Gulf of Mexico. In addition, we have a significant presence in almost all of the active onshore oil and gas drilling regions in the U.S., including the Permian Basin, Bakken Shale, Barnett Shale, Eagle Ford Shale, Haynesville Shale, Marcellus Shale and Utica Shale. Our U.S. Services segment accounted for approximately 45% and 42%, respectively, of our Adjusted EBITDA in 2012 and the first three months of 2013. |
74
Table of Contents
Index to Financial Statements
| • | Pipe and Products. We also design and manufacture certain products that we sell or rent directly to external customers, including large OD pipe connectors and casing attachments. We also provide specialized fabrication and welding services in support of deep water projects in the U.S. Gulf of Mexico, including drilling and production risers, flowlines and pipeline end terminations, as well as long length tubulars (up to 300 feet in length) for use as caissons or pilings. Finally, we distribute large OD pipe manufactured by third parties. A significant majority of our sales to external customers occur in deep water markets. Our Pipe and Products segment accounted for approximately 6% and 8%, respectively, of our Adjusted EBITDA in 2012 and the first three months of 2013. |
Industry
Overview
We provide highly engineered tubular services to the oil and gas industry. Tubular services involve the handling and installation of multiple joints of pipe to establish a cased wellbore and the installation of smaller diameter completion tubing inside a cased wellbore to provide a conduit for produced oil and gas to reach the surface. The casing of a wellbore isolates the well, provides well structural and pressure integrity, and allows well operators to target specific zones for production. Given the central role that these services play in the structural integrity, reliability and safety of a well, and the importance of efficient tubular services to managing the overall cost of a well, we believe that tubular services are vital to the overall process of producing oil and gas.
Spears estimates that the global market for tubular services (excluding product sales) was approximately $3.3 billion in annual revenues in 2012 and will grow to $3.8 billion in 2013. Spears projects that this market will grow at an annual rate of approximately 11% between 2012 and 2015.
The tubular services sector of the oilfield services and equipment industry includes large and international companies (including ourselves, Weatherford International and Baker Hughes) as well as smaller, independent companies that operate primarily on a U.S. onshore basis. We believe a significant portion of the growth and opportunity for expansion in the industry exists for providers that possess the scale, the global reach and the technological sophistication to compete in a rapidly advancing industry, as further described in “—Trends in the Industry.”
We believe that customers of oilfield services and products select providers of tubular services based on a number of factors, including price, international capability, availability of tools, range of services provided, intellectual property, technological sophistication, rigorous quality systems and reliability of equipment, along with reputation and safety record. We believe that we are well-positioned to compete on a global basis in all of these dimensions. See “—Competitive Strengths.”
Tubular Services
The drilling process creates an open borehole through numerous rock formations that reaches the targeted reservoir. Left alone, the raw surface of the borehole typically cannot support itself. Casing is a tubular steel open-ended pipe run into the borehole. One of its main functions is to provide the structural and pressure integrity to the well. Once cemented in place, the casing serves as the rigid wall of the well from the wellhead down to the bottom of the well.
In addition to providing stabilization and keeping the sides of the well from collapsing, casing protects ground water aquifers through which the well is drilled. It also protects the hydrocarbons produced by the well from outside contaminants. The production tubing forms the conduit for production of hydrocarbons and, with the wellhead equipment, facilitates control of the well and the rate of production. Tubular services involve the use of highly specialized tools to handle and install multiple strings of pipe to establish a cased wellbore coupled with the installation of smaller diameter completion tubing inside the cased wellbore to provide a conduit for produced oil and gas to reach the surface.
75
Table of Contents
Index to Financial Statements
Casing is steel pipe that is manufactured in sections, or joints, that are typically 40 feet long and screwed together to specified parameters of torque or rotations to form longer lengths of casing, called casing strings. Most casing has male threads on each end. Typically, a collar or coupling, composed of a short cylindrical steel sleeve that is slightly larger in diameter than the casing and has female threads, is used to connect the two male joint ends. A thread compound is applied to the connection to provide lubrication and ensure a tight seal.
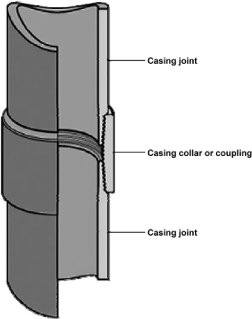
Connecting Joints of Casing
The casing operation is managed from the rig floor, as one or more joints at a time are connected by specialized powered pipe wrenches called power tongs. Typically hanging above the rig floor or on motorized track systems, power tongs screw each subsequent joint to the casing string and can also be used with computerized instrumentation to monitor, assess and control the joint make-up in accordance with the connection manufacturer’s recommendations.
A specialized cement cone known as a guide float shoe is connected to the first casing string to help guide the casing into the borehole and allow drilling mud to remain in the casing string to equalize pressure. Additionally, along the outside of the casing, numerous spring-like centralizers are attached to the casing string to help position the casing string in the center of the borehole to facilitate uniform distribution of cement around and between the outside of the casing and the borehole.
Casing strings are run into the borehole and officially landed when the weight of the casing string is transferred to the casing hangers, which are located at the top of the well to suspend the casing. After the casing has been run, cement slurry is pumped through the string of casing, then run up and around the space between the borehole and the outside of the casing and allowed to harden to permanently fix the casing in place.
The well is typically drilled in stages. Typically, a borehole is drilled to a certain depth, cased and cemented, and then the borehole is drilled deeper, cased and cemented again, and so on. Each time the well is cased, a smaller diameter casing is used in the following stage.
The largest diameter casing is called conductor pipe, which typically ranges from 30 to 42 inches in diameter for offshore wells, and 16 inches in diameter for onshore wells. The next casing string is the surface
76
Table of Contents
Index to Financial Statements
casing, which can run several thousand feet in length. The last type of casing string that is run into the well, and therefore the smallest in diameter, is the production string. The production string is run directly into the producing reservoir. Subsequent strings of casing referred to as protection or intermediate casing and liners, are run into separate challenging areas or problem zones, including areas of high pressure or lost circulation.
In an alternate method of well completion, sometimes a liner string is run into the borehole instead of a casing string. While a liner string is very similar to casing string in that it is made up of separate joints of casing, the liner string does not extend over the entire depth of the well, rather it hangs from the bottom of the previously installed casing string, down to the bottom of the borehole. A liner string is hung in the well by a liner hanger, and then cemented into place. In some cases the liner string is tied back to the wellhead before well completion.
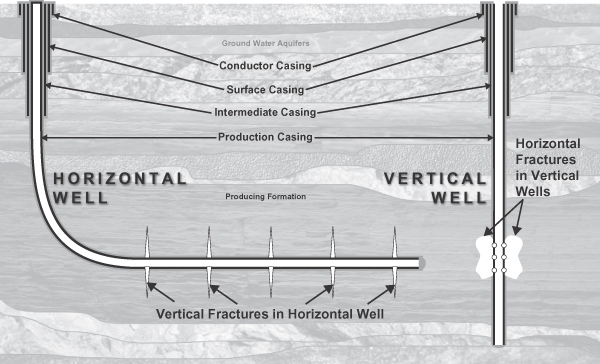
One of the most common challenges in the casing process can be that the casing string becomes stuck before it reaches the bottom of the wellbore. The typical solution for this problem is to retrieve the casing string for some vertical distance, then attempt to run it downhole again. Rotating, or reaming, the casing while it is being run is an effective method for minimizing the risk of stuck pipe. The circulation of drilling fluids in the wellbore also helps to speed the casing operation and prevent stuck pipe.
All of these problems result in non-productive time, during which the well’s owner is incurring day rate-based costs for the drilling rig and other onsite services, but during which the well’s drilling to completion is not making progress. An effective and efficiently managed casing process benefits the well’s operator by minimizing non-productive time.
The process for casing deep water wells includes a number of complexities that are not typically experienced with respect to onshore or shallow water wells. The seafloor may be thousands of feet below the rig. In order to bridge the distance between the drilling rig, which is at the ocean surface, and the well, which begins at the seafloor, the casing process typically involves using a string of tubulars known as a landing string. A landing string is typically composed of high strength pipe similar to drill pipe. The high strength, comparatively low weight landing string is assembled joint-by-joint and is attached to the top of the casing string to lower the casing string and land it in the wellhead. The landing string not only saves the cost of a length of casing to reach
77
Table of Contents
Index to Financial Statements
the sea floor, but is also designed for repeated assembly and disassembly making retrieval easier. However, the handling of the landing string with the weight of the heavy casing suspended below it requires specialized equipment and expertise to avoid failure, which at a minimum, would likely result in non-productive time and, at worst, cause damage to the well and critical infrastructure below.
Casing strings in deep water wells generally are longer and heavier than those used in onshore or shallow water wells, and require equipment that can handle string weights of up to 1,250 tons without crushing the casing at the point of suspension or allowing the casing to slip.
Additionally, deep water wells are generally characterized by increased geological complexity as compared to onshore or shallow water depth wells and typically require many casing or liner strings to allow for mud weight changes. In deep water wells, it is common to use as many as ten tubular strings, including contingencies, compared with the five or fewer strings typically used in shallower or onshore wells. With an increase in the number of strings used, there are tight tolerances in the well and additional attention to quality assurance is required. The graphic below depicts the significantly greater number of casing strings in deep water as compared to onshore wells:
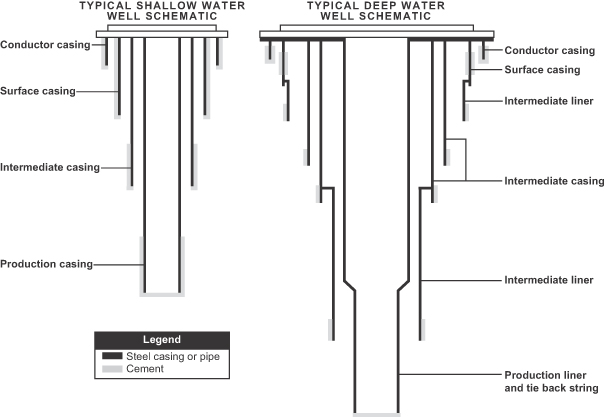
To prevent wear and withstand a long production life, which can extend beyond 20 years, high specification tubulars are frequently used for critical well sections. In recent years, certain deep water well completions have utilized numerous pressure containment and flow control valves, and downhole pressure and downhole temperature measurement devices, all of which require control lines with the ability to communicate with subsea wellhead controls. When making up and running the completion tubing string into a well, specialized equipment is required to accommodate the control lines and other hardware in order ensure that the control lines are not damaged during the running process. The need to accommodate these developments has increased the technical requirements and complexity of tubular installation services.
78
Table of Contents
Index to Financial Statements
Due to the complexity of drilling in deep water, the cost substantially exceeds that experienced in onshore operations, with aggregate costs approaching $1 million per day for the drilling rig and related services. The high cost of drilling in offshore environments makes it even more important for efficient tubular services in order to minimize time spent on this activity. Spears estimates that the average Gulf of Mexico well requires $2.1 million of tubular services, while the average cost for tubular services for an onshore well in the U.S. is often less than $50,000.
Trends in the Industry
We believe that the following trends will positively affect the oilfield services industry, and consequently the demand for tubular installation services, in the coming years.
| • | Increasing global demand for crude oil and natural gas has spurred increases in energy development spending. The crude oil and natural gas industry benefits from increased consumption of hydrocarbons, caused in part by the industrialization of China, India and other developing countries. Spears estimates that annual global spending on drilling and development activities increased from $236 billion in 2009 to $326 billion in 2012, and is projected to increase to $482 billion in 2018, representing a compound annual growth rate of approximately 8% from 2009 to 2018. According to the IEA, under current policies, global energy demand will be approximately 18,676 million tons of oil equivalent (Mtoe) by 2035, or about 47% greater than in 2010. |
Global Energy Demand (Mtoe)
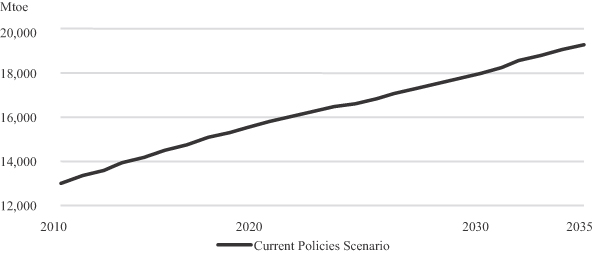
Source: International Energy Agency (2012 World Energy Outlook)
79
Table of Contents
Index to Financial Statements
Global Oilfield Equipment and Service Market
(excludes Russia, China and Central Asia)
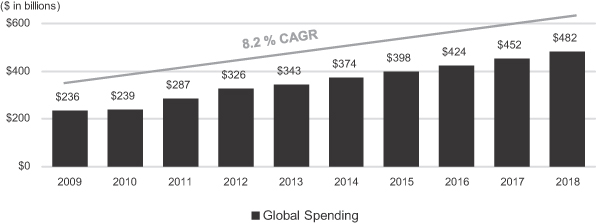
Source: Spears & Associates, Inc. 2012 Oilfield Market Report
| • | Significant new well development is required to replace naturally declining production. Despite elevated exploration and development activity in recent years, oil supply has only experienced modest gains, highlighting the difficulty in overcoming the natural decline rates of large legacy fields. The IEA estimates that in order to overcome the decline in production from existing fields, and to keep pace with projected demand increases, new production of approximately 40 million barrels of oil per day (an amount equal to nearly 60% of 2011 global oil production) must be added by 2035. A significant number of new wells will be required to make up for declines in production from existing fields and the projected increase in global oil demand. |
| • | Increasing offshore and deep water drilling and development activity. Worldwide offshore rig counts continue to increase as crude oil supply and demand fundamentals encourage new drilling. Moreover, many of these new rigs are bigger and more efficient and designed to drill deeper to previously unrecoverable reserves. According to the IEA, 55% of remaining recoverable conventional oil outside of the OPEC is offshore. According to Spears, offshore spending will increase from $80.1 billion in 2011 to $179.7 billion in 2018, a compound annual growth rate of 12%. Offshore discoveries are expected to play an important role in the future, particularly deep water discoveries at depths greater than 1,000 feet. |
Global Offshore Equipment and Service Market
(excludes Russia, China and Central Asia)
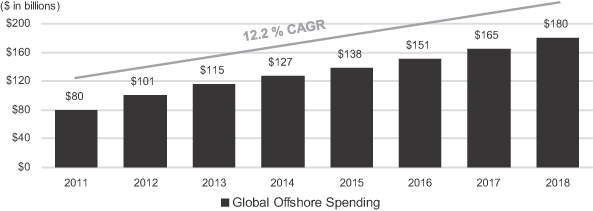
80
Table of Contents
Index to Financial Statements
Source: Spears & Associates, Inc. 2012 Oilfield Market Report
| • | Increasing complexity and costs of well construction. As conventional sources of oil and gas are depleted, the oil and gas industry continues to develop new technologies and techniques that allow operators to develop a wider range of unconventional oil and gas resources, such as oil and gas shales. Certain of these techniques include drilling deeper and horizontal well paths with long lateral lengths and multi-stage completions, often in high temperature and high pressure environments. These types of unconventional drilling generally require additional tubular services compared to conventional drilling, and tubular installation services have become increasingly complex to execute, and have required the development of new techniques and specialized tools. |
| • | Heightened focus on quality, safety and environmental factors. Our customers are increasingly focused on the quality of wellbore construction, operational safety and environmental stewardship, particularly in offshore environments where we routinely operate. The tubular services we provide are critical in achieving these goals. As such, our reputation as a high-quality, trusted service provider positions us well to benefit from this trend. |
Our Operations
The table below provides a summary of the percentage contributions from our three operating segments and our primary geographic markets for the periods indicated.
| Year Ended December 31, | Three Months Ended March 31, |
|||||||||||||||||||
| 2010 | 2011 | 2012 | 2012 | 2013 | ||||||||||||||||
| Adjusted EBITDA by segment: |
||||||||||||||||||||
| International Services |
64 | % | 61 | % | 49 | % | 51 | % | 50 | % | ||||||||||
| U.S. Services |
20 | % | 29 | % | 45 | % | 43 | % | 42 | % | ||||||||||
| Pipe and Products |
16 | % | 10 | % | 6 | % | 6 | % | 8 | % | ||||||||||
| Revenue by geographic area: |
||||||||||||||||||||
| United States |
52 | % | 51 | % | 56 | % | 52 | % | 49 | % | ||||||||||
| Africa |
17 | % | 16 | % | 16 | % | 16 | % | 19 | % | ||||||||||
| Latin America |
11 | % | 12 | % | 10 | % | 11 | % | 10 | % | ||||||||||
| Europe |
10 | % | 10 | % | 10 | % | 10 | % | 9 | % | ||||||||||
| Far East |
4 | % | 5 | % | 5 | % | 5 | % | 5 | % | ||||||||||
| Other |
6 | % | 6 | % | 3 | % | 6 | % | 8 | % | ||||||||||
For additional information regarding our operating segments, see Note 16 to our audited combined financial statements included elsewhere in this prospectus.
81
Table of Contents
Index to Financial Statements
Tubular Services
We are a leading provider of tubular services in many of the regions in which we operate, including the U.S. Gulf of Mexico and almost every significant international offshore market, almost all of the major U.S. resource basins and in targeted active international onshore regions. A presentation of our tubular services revenue by geographic area is set forth below:
Frank’s International
2012 Tubular Services Revenue by Region1
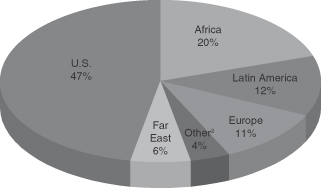
| ¹ | Excludes Pipe and Products revenue. |
| ² | Other includes Canada and the Middle East. |
We provide highly engineered tubular services to leading exploration and production companies in both offshore and onshore environments, with a focus on complex and technically demanding wells. Our specially trained employees provide our services with the aid of a suite of highly technical, purpose-built equipment that we design and manufacture for our proprietary use. Most of our manufactured equipment and products use patented, advanced technologies that enable us to service complex wells, increase efficiency, enhance well integrity and improve safety. We continuously work with our customers to develop new products and enhance existing equipment to improve efficiency and safety and also in response to problems encountered in challenging drilling environments. For example, a substantial portion of the rigs scheduled for delivery within the next two years are “dual activity” rigs, which are designed with two masts to simultaneously conduct multiple independent complementing activities. We have developed patented handling technology that allows the casing to be connected into triple joints in the auxiliary mast area and, once the well section is drilled to its targeted depth, triple joints can be safely maneuvered over the well bore and installed into the well. Use of this technology in connection with “dual activity” rigs can save 30% or more of rig time during casing running activity.
82
Table of Contents
Index to Financial Statements
The following table provides information about our primary products and equipment that complement our tubular services offerings as of June 11, 2013:
| Product |
Description |
Advantages of
Our |
Related Patents(1) | |||||||||
| U.S. | International | |||||||||||
| Issued | Pending | Issued | Pending | |||||||||
| Top Drive Mounted Casing Running Tools | Used to hoist single joints of casing, makeup of casing connections, lower and rotate casing string in the wellbore while simultaneously circulating drilling fluid | • Grip tubulars internally or externally
• Replace certain traditionally manually operated equipment with a single fully mechanized and remotely controlled system, which reduces the risk of injury to personnel
• Provides for simultaneous rotation of the pipe and/or circulation while raising or lowering the string, which reduces the risk of stuck pipe
• Ability to rotate and/or circulate while lowering or raising which reduces the risk of stuck pipe |
14 | 4 | 31 | 8 | ||||||
| Extended Range Slip Type Elevators and Spiders | Innovative pipe handling tools that are used to hoist and support tubular strings in order to lower the string into the wellbore or support the string at the rig floor. The extended range feature allows multiple pipe sizes which may be present in a single string to be gripped effectively without the need to change out or adjust equipment at pipe size changeover points | • Reduces the risks associated with changing out equipment or reconfiguring a tool in the midst of running a string
• Capitalizes on many of the innovations developed over the past three decades of Frank’s development of handling tools, while significantly expanding the functionality and value to the client
• Maximum load capabilities of 1,250 tons
|
8 | 3 | 9 | 13 | ||||||
| Elevators | Clamps that hoist casing and tubing for raising or lowering into the borehole | • Working load ratings exceeding 1,250 tons, which is of great value in deep and ultra-deep water operations
• Versatility to perform multiple tasks as a single apparatus
• Tools incorporate elevator/spider interlocking feature which detects when proper engagement with the tubular string has been achieved, thereby allowing the companion tool to be released from engagement with the tubular string. This feature assures that at all times either the elevator or the spider has a secure grip on the string prior to the companion tool being allowed to open, which provides for a safer tubular running system
• Improved resistance to the crushing of tubulars at high loads
|
25 | 13 | 26 | 47 | ||||||
83
Table of Contents
Index to Financial Statements
| Product |
Description |
Advantages of
Our |
Related Patents(1) | |||||||||
| U.S. | International | |||||||||||
| Issued | Pending | Issued | Pending | |||||||||
| Spiders | Companion tools to the Elevators, these tools suspend the tubular string from the drill floor while the next joint in the assembly is made up (or backed out) | • Improved resistance to crushing of the tubular at high loads
• Tools incorporate elevator/spider interlocking feature which detects when proper engagement with the tubular string has been achieved, thereby allowing the companion tool to be released from engagement with the tubular string. This feature assures that at all times either the elevator or the spider has a secure grip on the string prior to the companion tool being allowed to open, which provides for a safer tubular running system |
20 | 11 | 12 | 24 | ||||||
|
• An array of powered and automated positioning systems, which allow for minimal floor personnel to operate the equipment
|
||||||||||||
| Landing String Handling Equipment | Special purpose elevators and spiders of ultrahigh load capacity for suspending, lowering and raising of landing strings with heavy casing strings for demanding deep water applications | • 1,250 ton load rated elevators and spiders
• Equipped with patented elevator/spider interlock system |
2 | 3 | 7 | 4 | ||||||
| Power Tongs | Powered pipe wrenches that are used to rotate pipe joints together and apply designated makeup torque in order to achieve pressure tight sealing and structural integrity at the threaded connections | • Tubular Reducer kit provides ability to reconfigure conventional power tongs to grip and rotate range of smaller diameter tubulars
• Automatic disabling upon sensing slippage between the gripping elements and the tubular |
5 | — | 14 | 3 | ||||||
| Hammer Accessories |
Hammers are powered devices that apply high impact forces to the top of a tubular string in order to drive it into the earth. Hammers are used to drive conductor strings which are the first string of pipe installed at the commencement of a well (typically used in onshore and in shallow water offshore). | • Complete line of accessories and related products for conductor driving services, including high-penetration “Speedshoe,” deviated conductors and drivepipe whipstocks |
2 | — | 4 | — | ||||||
| CRA Makeup and Handing Tools | CRA tubulars frequently used as completion tubing in harsh corrosive well environments. For CRA tubulars to deliver maximum resistance to injurious corrosion the installation process must be accomplished without mechanical damage associated with the conventional gripping elements found in industry standard elevators, spiders and power tongs. | • Collar Load Support (“CLS”) system does not use toothed inserts to support the load
• “Reduced Penetration” tooling for conventional slip systems minimizes the severity of damaged from toothed inserts
• “FluidGripTM” gripping systems for power tongs and backup tongs complement CLS and reduced penetration elevator and spider systems in applying torque to the tubular without damaging its surface |
3 | — | 8 | 2 | ||||||
84
Table of Contents
Index to Financial Statements
| Product |
Description |
Advantages of
Our |
Related Patents(1) | |||||||||
| U.S. | International | |||||||||||
| Issued | Pending | Issued | Pending | |||||||||
| Completions Tubing Installation Equipment | Spiders purpose designed to accommodate running complex completion strings with simultaneous running of control lines and associated hardware along with control line manipulator systems. | • Safely manipulate control lines during running of the string into the wellbore, avoiding expensive damage and potential rework |
10 | 2 | 18 | 8 | ||||||
| Downhole Drilling Tools | Suite of products directed to efficiency improvements during drilling. | • Reduction in adverse effects caused by vibration of the drill bit during drilling, extending life of downhole equipment and improved bore hole quality |
7 | 4 | 24 | 22 | ||||||
| (1) | Includes patents and applications that apply to more than one product family. |
Pipe and Products
In addition to our services offering, we design and manufacture casing attachments, fabricate subsea equipment and distribute large OD pipe. Our products are sold directly to external customers.
| • | Fabricated pipe accessories. We manufacture and sell large OD pipe accessories to precise client specifications to facilitate transportation, handling and installation. These accessories include a complete range of innovative threaded connectors for large OD pipe that eliminate a number of customer concerns with other connector technology, such as (i) risk of premature back-out during driving or throughout the well’s service life, (ii) vulnerability to vibrations, (iii) risk of leaks during service and (iv) installation time and cost effectiveness. The use of connectors of this type on large OD pipe eliminates the need to weld joints of pipe together, which cuts down on customers’ rig time and expense. To service this product line, we operate our four stock point and fabrication facilities located in Lafayette, Houma, and the Port of New Iberia, Louisiana and Alvin, Texas. |
| • | Deep water fabrication. We also provide specialized fabrication and welding services in support of deep water projects in the U.S. Gulf of Mexico, including drilling and production risers, flowlines and pipeline end terminations, as well as long length tubulars (up to 300 feet in length) for use as caissons or pilings. In addition to these core fabrication and welding services, we provide logistical support services such as spreader bars, bolster frames, barge loading and riser project installation services. |
| • | Large OD pipe. We distribute large OD pipe on behalf of third party manufacturers to a variety of external customers. The pipe we distribute is primarily used as conductor pipe and surface casing, which are typically the first casing strings installed in an offshore well. We manufacture large OD threaded connectors that are typically welded to the large OD pipe we distribute. We generally maintain an inventory of pipe in order to support our pipe sales and distribution operations. |
New Product Development and Intellectual Property
Our sales and earnings are influenced by our ability to successfully provide the high-level tubular services our customer’s demand, which in turn relies on our ability to develop new technology and products. Much of our product development occurs in response to specific customer requests, in which case we are typically able to pass costs along to the customer. However, we have also historically dedicated additional resources toward the development of new technology and equipment to enhance the effectiveness, safety and efficiency of the services we provide. Since most of our new product development is in response to a specific customer engagement, we have not incurred significant research and development expenses during the three most recent fiscal years. Although certain of our competitors may spend greater amounts on research and development, we believe that
85
Table of Contents
Index to Financial Statements
our product development efforts are greatly enhanced by the investments of management time and energy we make to improve our customer service and to work with our customers on their specific product needs and challenges.
We hold rights, through patents and patent license agreements, to patented or patent-pending technologies for certain innovations that we believe will have application to our businesses. We pursue patent protection in appropriate jurisdictions where we believe our innovations could have significant potential application to our core businesses. We also generally retain all intellectual property rights to our technology through technology ownership agreements or arrangements with our employees, suppliers, consultants and other third parties with whom we do business. We currently have 104 U.S. patents and 136 related international patents and 37 U.S. patent applications pending and 111 related international patent applications pending for equipment that our engineers have developed.
Although in the aggregate our patents and licenses are important to us, we do not regard any single patent or license as critical or essential to our business as a whole. Of greatest importance to our development efforts is our ability to preserve excellent customer relations and stay close enough to our customers’ operations so that we can observe opportunities to make changes to our service offerings (and the products that support them) that would yield the maximum benefit to our customers. Although we highly value our proprietary products and technology, we also depend on our technological capabilities, customer service oriented culture and application of our know-how to distinguish ourselves from our competitors. We also consider the service we provide to our customers and the technical knowledge and skill of our personnel to be more important than our registered intellectual property in our ability to compete. While we stress the importance of our research and development programs, the technical challenges and market uncertainties associated with the development and successful introduction of new and updated services are such that we cannot assure you that we will realize any particular amount of future revenue from the services and related products resulting from our research and development programs.
Customers
Our customers consist primarily of oil and gas exploration and production companies, both U.S. and international, including major and independent companies, national oil companies and, on occasion, other service companies that have contractual obligations to provide casing and handling services. Demand for our services depends primarily upon the capital spending of oil and gas companies and the level of drilling activity in the U.S. and internationally. We do not believe the loss of any of our individual customers would have a material adverse effect on our business. No single customer accounted for more than 10% of our revenue for the years ended December 31, 2010 and 2011 and one customer accounted for approximately 11% of our revenue for the year ended December 31, 2012.
International Services Segment
The top five customers in our international services segment accounted for an aggregate of approximately 38% of the segment’s revenue for the year ended December 31, 2012, with no other customers representing 10% or more of that segment’s revenue.
U.S. Services Segment
The top five customers in our U.S. Services segment accounted for an aggregate of approximately 37% of the segment’s revenue during the year ended December 31, 2012. Other than Chevron, which accounted for approximately 20% of that segment’s revenue for the year ended December 31, 2012, no other customers represented 10% or more of that segment’s revenue.
86
Table of Contents
Index to Financial Statements
Pipe and Products Segment
The top five customers of our Pipe and Products segment accounted for an aggregate of approximately 31% of the segment’s revenue during the year ended December 31, 2012. Other than Shell, which accounted for approximately 12% of that segment’s revenue for the year ended December 31, 2012, no other customers represented 10% or more of that segment’s revenue.
Seasonality
A substantial portion of our business is not significantly impacted by changing seasons. A small portion of the revenue we generate from selected international operations may benefit from higher first quarter activity levels, as operators take advantage of the winter freeze to gain access to remote drilling and production areas. In the past, some of our revenue in Canada has declined during the second quarter due to warming weather conditions that resulted in thawing, softer ground, difficulty accessing drill sites and road bans that curtailed drilling activity.
Competition
The markets in which we operate are competitive. We compete with a number of companies, some of which have financial and other resources greater than us. The principal competitive factors in our markets are the quality, price and availability of products and services and a company’s responsiveness to customer needs and reputation for safety. In general, we face a larger number of smaller, more regionally-specific customers in U.S. onshore market as compared to offshore markets, where larger competitors dominate.
We believe several factors give us a strong competitive position. In particular, we believe our products and services in each segment fulfill our customer’s requirements for international capability, availability of tools, range of services provided, intellectual property, technological sophistication, rigorous quality systems and availability of equipment, along with reputation and safety record. We seek to differentiate ourselves from our competitors by providing a rapid response to the needs of our customers, a high level of customer service and innovative product development initiatives. Although we have no single competitor across all of our product lines, we believe that Weatherford International represents our most direct competitor across our segments for providing tubular services on an aggregate, global basis.
International Services Segment
We hold established market leading positions in several of our core international service regions. The most significant competitors we have across our international service lines are Weatherford International and, to a lesser extent, Baker Hughes.
U.S. Services Segment
We hold established market leading positions in several of our core U.S. service regions, and we compete with a large number of relatively smaller competitors. The most significant competitor we have across our U.S. service lines is Weatherford International and, to a lesser extent, Tesco Corporation. We also face numerous regional competitors in each of our U.S. onshore service regions.
Pipe and Products Segment
We hold established market leading positions in several of our core product offerings, and we compete with a small number of competitors. The most significant competitors we have across our Pipe and Products segment are National Oilwell Varco, Dril-Quip and GE VetcoGray.
87
Table of Contents
Index to Financial Statements
Properties
In order to design, manufacture and service the proprietary products that support our tubular services business, as well as those that we offer for sale directly to external customers, we maintain several manufacturing and service facilities around the world. Though our manufacturing and service capabilities are primarily concentrated in the U.S., we currently provide our services in approximately 60 countries.
Following the completion of our corporate reorganization, as described in “Organizational Structure,” our major facilities owned or leased by us will be as follows:
| Location |
Leased or owned |
Principal/Most Significant Use | ||||
| Houston, Texas |
Leased | Corporate office | ||||
| Lafayette, Louisiana |
Leased | Manufacturing and engineering | ||||
| Aberdeen, Scotland |
Owned | Regional operations and administration | ||||
| Dubai |
Owned | Regional operations and administration | ||||
| Singapore |
Owned | Regional operations and administration | ||||
| Mumbai |
Owned | Administration | ||||
We intend to enter into real estate lease agreements with customary terms for continued use of the real estate we will no longer own following completion of our corporate reorganization, including our Houston, Texas and Lafayette, Louisiana facilities. See “Organizational Structure.”
Our largest manufacturing facility is located in Lafayette, Louisiana, where we manufacture a substantial portion of our pipe handling tools. The facility serves our U.S. Services segment in the U.S. Gulf of Mexico, and is our global headquarters for the design and manufacture of our equipment. The Lafayette facility is situated on a total of 151 acres. The main facility occupies 135 acres and the remaining acreage is dedicated to pipe storage located offsite, within Lafayette. There are a total of 16 buildings onsite and 11 buildings offsite. Our manufacturing operations occupy 11 of the 16 buildings, with the remaining buildings dedicated to administration, training and other operational tasks. The main administrative building within the facility is approximately 40,000 square feet.
Suppliers and Raw Materials
We acquire component parts, products and raw materials from suppliers, including foundries, forge shops, and original equipment manufacturers. The prices we pay for our raw materials may be affected by, among other things, energy, steel and other commodity prices, tariffs and duties on imported materials and foreign currency exchange rates. Certain of our component parts, products or specific raw materials are only available from a limited number of suppliers.
Our ability to source low cost raw materials and components, such as steel castings and forgings, is critical to our ability to manufacture our drilling products competitively and, in turn, our ability to provide onshore and offshore drilling services. In order to purchase raw materials and components in a cost effective manner we have developed a broad international sourcing capability and we maintain quality assurance and testing programs to analyze and test these raw materials and components.
We have experienced increased costs in recent years due to rising steel prices. There is also strong demand within the industry for forgings, castings and outsourced coating services necessary for us to make our products. We cannot assure that we will be able to continue to purchase these raw materials on a timely basis or at historical prices. We generally try to purchase our raw materials from multiple suppliers so we are not dependent on any one supplier, but this is not always possible.
88
Table of Contents
Index to Financial Statements
Inventories and Working Capital
An important consideration for many of our customers in selecting a vendor is timely availability of the product. Often customers will pay a premium for earlier or immediate availability because of the cost of delays in critical operations. We aim to stock certain of our consumable products in regional warehouses around the world so we can have these products available for our customers when needed. This availability is especially critical for our proprietary products, causing us to carry substantial inventories for these products. For critical capital items in which demand is expected to be strong, we often build certain items before we have a firm order. Having such goods available on short notice can be of great value to our customers.
Employees
As of March 31, 2013, we had approximately 4,100 employees worldwide. We are a party to collective bargaining or other similar agreements in certain international areas in which we operate, such as Brazil, the Far East and Europe. We consider our relations with our employees to be satisfactory.
Operating Risk and Insurance
We maintain insurance coverage of types and amounts that we believe to be customary and reasonable for companies of our size and with similar operations. In accordance with industry practice, however, we do not maintain insurance coverage against all of the operating risks to which our business is exposed. Therefore, there is a risk our insurance program may not be sufficient to cover any particular loss or all losses.
Currently, our insurance program includes, among other things, general liability, umbrella liability, sudden and accidental pollution, personal property, vehicle, workers’ compensation, and employer’s liability coverage. Our insurance includes various limits and deductibles or retentions, which must be met prior to or in conjunction with recovery.
Business History
FINV was formed in 2006 as a Dutch company with limited liability (naamloze vennootschap). We believe that our long and successful history in the industry is a testament to the quality of the services and the innovative technology that we provide our customers. Frank’s International traces its roots to the founding of FCC by Frank Mosing in 1938. In 1950, Donald E. Mosing joined his father in the business. Later, Donald’s younger brothers, Billy and Larry, joined their father and brother to help manage the growing operations. As an engineering and safety innovator, Donald was a driving force for many years in the development of many of our proprietary tools and processes, and he is named as an inventor on 45 of the U.S. patents that have been issued to us. In 1973, Donald Keith Mosing, Donald E. Mosing’s eldest son, established our third office, in Alvin, Texas. Keith Mosing quickly embarked on the expansion of operations across North America and into South America, Asia, Europe, Africa and the Middle East. Our international operations were formally organized into a separate company in 1981, with Keith Mosing being named Chairman, President and Chief Executive Officer. Since the early 1980s, our U.S. and international operations have continued to grow, both organically and through strategic acquisitions. Upon Donald’s retirement in July 2011, Keith Mosing was named Chairman, President and Chief Executive Officer of the U.S. operations. We now operate in nearly every region of the world with significant oil and gas drilling activity. We currently provide our services in approximately 60 countries on six continents.
Environmental, Health and Safety Regulation
Our operations are subject to numerous stringent and complex laws and regulations governing the discharge of materials into the environment, health and safety aspects of our operations, or otherwise relating to human health and environmental protection. Failure to comply with these laws or regulations or to obtain or comply with permits may result in the assessment of administrative, civil and criminal penalties, imposition of remedial or corrective action requirements, and the imposition of orders or injunctions to prohibit or restrict certain activities or force future compliance.
89
Table of Contents
Index to Financial Statements
The trend in environmental regulation has been to impose increasingly stringent restrictions and limitations on activities that may impact the environment, and thus, any changes in environmental laws and regulations or in enforcement policies that result in more stringent and costly waste handling, storage, transport, disposal, or remediation requirements could have a material adverse effect on our operations and financial position. Moreover, accidental releases or spills of regulated substances may occur in the course of our operations, and we cannot assure you that we will not incur significant costs and liabilities as a result of such releases or spills, including any third-party claims for damage to property, natural resources or persons.
The following is a summary of the more significant existing environmental, health and safety laws and regulations to which our business operations are subject and for which compliance could have a material adverse impact on our capital expenditures, results of operations or financial position.
Hazardous Substances and Waste
The Resource Conservation and Recovery Act (“RCRA”) and comparable state statutes, regulate the generation, transportation, treatment, storage, disposal and cleanup of hazardous and non-hazardous wastes. Under the auspices of the EPA, the individual states administer some or all of the provisions of RCRA, sometimes in conjunction with their own, more stringent requirements. We are required to manage the transportation, storage and disposal of hazardous and non-hazardous wastes in compliance with RCRA.
The Comprehensive Environmental Response, Compensation, and Liability Act (“CERCLA”), also known as the Superfund law, imposes joint and several liability, without regard to fault or legality of conduct, on classes of persons who are considered to be responsible for the release of a hazardous substance into the environment. These persons include the owner or operator of the site where the release occurred, and anyone who disposed or arranged for the disposal of a hazardous substance released at the site. We currently own, lease, or operate numerous properties that have been used for manufacturing and other operations for many years. We also contract with waste removal services and landfills. These properties and the substances disposed or released on them may be subject to CERCLA, RCRA and analogous state laws. Under such laws, we could be required to remove previously disposed substances and wastes, remediate contaminated property, or perform remedial operations to prevent future contamination. In addition, it is not uncommon for neighboring landowners and other third parties to file claims for personal injury and property damage allegedly caused by hazardous substances released into the environment.
Water Discharges
The Federal Water Pollution Control Act (the “Clean Water Act”) and analogous state laws impose restrictions and strict controls with respect to the discharge of pollutants, including spills and leaks of oil and other substances, into waters of the United States. The discharge of pollutants into regulated waters is prohibited, except in accordance with the terms of a permit issued by the EPA or an analogous state agency. A responsible party includes the owner or operator of a facility from which a discharge occurs. The Clean Water Act and analogous state laws provide for administrative, civil and criminal penalties for unauthorized discharges and, together with the Oil Pollution Act of 1990, impose rigorous requirements for spill prevention and response planning, as well as substantial potential liability for the costs of removal, remediation, and damages in connection with any unauthorized discharges.
Air Emissions
The federal Clean Air Act and comparable state laws regulate emissions of various air pollutants through air emissions permitting programs and the imposition of other emission control requirements. In addition, the EPA has developed, and continues to develop, stringent regulations governing emissions of toxic air pollutants at specified sources. Non-compliance with air permits or other requirements of the federal Clean Air Act and associated state laws and regulations can result in the imposition of administrative, civil and criminal penalties, as well as the issuance of orders or injunctions limiting or prohibiting non-compliant operations. In August 2012,
90
Table of Contents
Index to Financial Statements
the EPA adopted new regulations restricting emissions of volatile organic compounds in connection with the drilling and completion of oil and gas wells, which will require operators to purchase emissions control equipment and make process changes that may increase the costs of well drilling and completion activities.
Climate Change
In December 2009, the EPA determined that emissions of carbon dioxide, methane and other “greenhouse gases” present an endangerment to public health and the environment because emissions of such gases are, according to the EPA, contributing to warming of the Earth’s atmosphere and other climatic changes. Based on these findings, the EPA has begun adopting and implementing regulations to restrict emissions of greenhouse gases under existing provisions of the federal Clean Air Act. The EPA recently adopted two sets of rules regulating greenhouse gas emissions under the Clean Air Act, one of which requires a reduction in emissions of greenhouse gases from motor vehicles and the other of which regulates emissions of greenhouse gases from certain large stationary sources, effective January 2, 2011. The EPA has also adopted rules requiring the reporting of greenhouse gas emissions from specified large greenhouse gas emission sources in the United States, including petroleum refineries, on an annual basis, beginning in 2011 for emissions occurring after January 1, 2010, as well as onshore oil and gas production facilities, on an annual basis, beginning in 2012 for emissions occurring in 2011.
In addition, the United States Congress has from time to time considered adopting legislation to reduce emissions of greenhouse gases and almost one-half of the states have already taken legal measures to reduce emissions of greenhouse gases primarily through the planned development of greenhouse gas emission inventories and/or regional greenhouse gas cap and trade programs. Most of these cap and trade programs work by requiring major sources of emissions, such as electric power plants, or major producers of fuels, such as refineries and gas processing plants, to acquire and surrender emission allowances. The number of allowances available for purchase is reduced each year in an effort to achieve the overall greenhouse gas emission reduction goal.
The adoption of legislation or regulatory programs to reduce emissions of greenhouse gases could require us to incur increased operating costs, such as costs to purchase and operate emissions control systems, to acquire emissions allowances or comply with new regulatory or reporting requirements. Any such legislation or regulatory programs could also increase the cost of consuming, and thereby reduce demand for, the oil and gas produced by our customers. Consequently, legislation and regulatory programs to reduce emissions of greenhouse gases could have an adverse effect on our business, financial condition and results of operations. Finally, it should be noted that some scientists have concluded that increasing concentrations of greenhouse gases in the Earth’s atmosphere may produce climate changes that have significant physical effects, such as increased frequency and severity of storms, droughts, and floods and other climatic events. If any such effects were to occur, they could have an adverse effect on our business, financial condition and results of operations.
Employee Health and Safety
We are subject to a number of federal and state laws and regulations, including OSHA and comparable state statutes, establishing requirements to protect the health and safety of workers. In addition, the OSHA hazard communication standard, the EPA community right-to-know regulations under Title III of the federal Superfund Amendment and Reauthorization Act and comparable state statutes require that information be maintained concerning hazardous materials used or produced in our operations and that this information be provided to employees, state and local government authorities and the public. Substantial fines and penalties can be imposed and orders or injunctions limiting or prohibiting certain operations may be issued in connection with any failure to comply with laws and regulations relating to worker health and safety.
We also operate in non-U.S. jurisdictions, which may impose similar liabilities against us.
91
Table of Contents
Index to Financial Statements
Legal Proceedings
We are the subject of lawsuits and claims arising in the ordinary course of business from time to time. Management cannot predict the ultimate outcome of such lawsuits and claims. While the lawsuits and claims are asserted for amounts that may be material should an unfavorable outcome be the result, management does not currently expect that these matters will have a material adverse effect on our financial position or results of operations.
92
Table of Contents
Index to Financial Statements
Board Structure
Our board currently consists of one member, Mr. Donald Keith Mosing. Prior to the completion of this offering, we intend to appoint at least one additional director to our existing board, Sheldon Erikson, who will then join our supervisory board and serve as a member of our audit committee, as described below. At the completion of this offering, we will create a two-tier board structure, consisting of a management board and a supervisory board, each of which must consist of at least one member under our articles of association.
Supervisory Board
Under Dutch law, the supervisory board’s duties include supervising and advising the management board in performing its management tasks. The supervisory board is expected to exercise oversight of management with the company’s interests in mind. The number of members of our supervisory board is determined from time to time at a general meeting of our shareholders upon a proposal by the supervisory board, but will not be greater than nine. We expect to increase the number of members on our supervisory board prior to or in connection with the completion of this offering. As described below, at the completion of this offering, our supervisory board will consist of four members, three of whom are members of the Mosing family, including our chief executive officer.
We intend to appoint independent directors to our supervisory board contemporaneously with and following the completion of this offering. We also expect that our supervisory board will review the independence of our current supervisory director using the independence standards of the NYSE.
In evaluating supervisory director candidates, we will assess whether a candidate possesses the integrity, judgment, knowledge, experience, skills and expertise that are likely to enhance the supervisory board’s ability to oversee and direct our affairs and business, including, when applicable, to enhance the ability of committees of the supervisory board to fulfill their duties and the quality of the supervisory board’s deliberations and decisions. In evaluating supervisory directors, we will consider diversity in its broadest sense, including persons diverse in perspectives, personal and professional experiences, geography, gender, race and ethnicity. In addition, pursuant to our amended and restated articles of association, the Mosing family will have the right to recommend one director for nomination to the supervisory board for each 10% of the outstanding FINV Stock they collectively beneficially own, up to a maximum of five directors.
Management Board
The management board’s sole member will be our wholly owned subsidiary, Frank’s International Management B.V. As a managing director, Frank’s International Management B.V.’s duties will include the management of the company, consulting with the supervisory board on important matters and submitting certain important decisions to the supervisory board for its prior approval.
93
Table of Contents
Index to Financial Statements
Executive Officers and Supervisory Directors
Set forth below are the names, ages and positions of our executive officers, supervisory directors and supervisory director nominees as of July 26, 2013. All supervisory directors are elected for a term of one year to serve until their successors are elected and qualified or upon earlier of death, disability, resignation or removal. All executive officers hold office until their successors are elected and qualified or upon earlier of death, disability, resignation or removal. There are no family relationships among any of our supervisory directors or executive officers. The address of each supervisory director and executive officer is 10260 Westheimer Rd., Houston, Texas 77042.
| Name |
Age | Position | ||
| Donald Keith Mosing |
62 | Chairman of the Supervisory Board, Director, Chief Executive Officer and President | ||
| Robert R. Gilbert |
58 | Executive Vice President and Chief Operating Officer—U.S. Services and Pipe and Products | ||
| C. Michael Webre |
57 | Vice President of Engineering | ||
| Mark G. Margavio |
52 | Chief Financial Officer | ||
| Brian D. Baird |
49 | Chief Legal Officer | ||
| W. John Walker |
47 | Vice President of International Operations | ||
| Sheldon Erikson |
71 | Supervisory Director Nominee | ||
| Kirkland D. Mosing |
54 | Supervisory Director Nominee | ||
| Steven B. Mosing |
57 | Supervisory Director Nominee |
Donald Keith Mosing. Mr. Mosing currently serves as the Chairman of our supervisory board, our Chief Executive Officer and President. Mr. Mosing began working for the family company in 1965 at age 14. Mr. Mosing established our third office, and first outside of Louisiana, in 1973, and then led the expansion of our operations across North America and into South America, Asia, Europe, Africa, the Middle East and Australia. Our international operations were formally organized into a separate company in 1981, with Mr. Mosing serving as the Chairman, President and Chief Executive Officer. Mr. Mosing was named Chairman, President and Chief Executive Officer of all of our U.S. companies in July 2011, upon the retirement of his father, Donald E. Mosing. Mr. Mosing attended the University of Louisiana at Lafayette and Embry-Riddle Aeronautical University, where he graduated with a Bachelor of Science degree.
Robert R. Gilbert. Mr. Gilbert currently serves as our Executive Vice President and Chief Operating Officer—U.S. Services and Pipe and Products, a position he has held since July 2011. Prior to serving in his current position, Mr. Gilbert was our Vice President of Operations and Sales from 1997 to 2011, concentrating on our U.S. operations, and served as our Executive Administrator and advisor to Engineering from 1980 to 1997. Mr. Gilbert received both his Bachelor of Science degree in Mechanical Engineering and Master of Business Administration degree from the University of Louisiana at Lafayette. Mr. Gilbert is currently a member of the Lafayette Chamber of Commerce, the American Society of Mechanical Engineers and the American Association of Drilling Engineers, and is an associate member of the Society of Petroleum Engineers. Mr. Gilbert was the first engineer hired by Donald E. Mosing, Keith Mosing’s father, and has been associated with a broad range of our U.S. divisions and operations.
C. Michael Webre. Mr. Webre currently serves as our Vice President of Engineering, a position he has held since 2002. Mr. Webre has served in various capacities since first joining the Frank’s corporate family in 1979, including Mechanical Engineer, Senior Mechanical Engineer and Engineering Manager. Mr. Webre received both his Bachelor of Science degree in Mechanical Engineering and Master of Science degree in Engineering Systems from the University of Louisiana at Lafayette. Mr. Webre is a licensed Professional Engineer and is a member of the Society of Petroleum Engineers, American Society of Mechanical Engineers and the American Welding Society.
94
Table of Contents
Index to Financial Statements
Mark G. Margavio. Mr. Margavio currently serves as our Chief Financial Officer, a position he has held since 2003. Prior to serving in his current position, Mr. Margavio was our Vice President of Finance from 2002 until 2003. Prior to joining Frank’s International, Mr. Margavio was the Chief Financial Officer for Transoceanic Shipping Company, a global logistics company, from 1997 to 2002. From 1982 to 1997, Mr. Margavio held various positions in investments, treasury and finance, including Senior Lead Analyst in Treasury and Corporate Finance for Entergy Corporation and Director of Acquisition for RPC Inc. Mr. Margavio received his Bachelor of Arts degree in Economics from Southeastern Louisiana University and his Master of Business Administration degree from the University of New Orleans. Mr. Margavio earned his Certified Public Accountant designation in 1994. He also has received designations as a Certified Treasury Professional, Certified Cash Manager and Registered Investment Advisor.
Brian D. Baird. Mr. Baird currently serves as our Vice President, Chief Legal Officer and Secretary, a position he has held since April 2005. Prior to joining Frank’s International in 2005, Mr. Baird was Vice President, General Counsel and Secretary of Pantellos, a Houston-based supply chain services and electronic marketplace company owned by 20 of the largest publically owned electric utility companies. Earlier in his career, Mr. Baird practiced law with the law firms of Boyar & Miller from 1991 to 2001 and with Jenkens & Gilchrist from 1989 to 1991. He received both his Doctor of Jurisprudence in 1989 and his Bachelor of Business Administration degree in Finance in 1986 from the University of Texas. Mr. Baird’s legal background is broad-based with emphasis on mergers and acquisitions, corporate finance, venture capital, technology and e-commerce, commercial real estate, oilfield services and general corporate law. For 2013, Mr. Baird is serving as President of the Houston Chapter of the General Counsel Forum, and has served on its Board of Directors since 2010.
W. John Walker. Mr. Walker currently serves as our Vice President of International Operations, a position that he has held since August 2012. Prior to serving in his current position, Mr. Walker served as the Vice President of North America from 2004 to 2012, and he assumed the additional responsibilities of Vice President of Brazil in July 2009. Mr. Walker also served as the Regional Manager of the Asia Pacific and Middle East divisions from 1999 to 2003. Mr. Walker entered the North Sea oil industry and served in several technical as well as supervisory field roles after obtaining an Ordinary National Certificate in Electrical and Electronic Engineering in 1982 from Aberdeen Technical College in Scotland. Mr. Walker has over 29 years of industry experience and has held positions across the world, including in Europe, North Africa, the Asia-Pacific region and the Middle East.
Kirkland D. Mosing. Mr. Mosing will be appointed to serve on our supervisory board in connection with the completion of this offering. Mr. Mosing has served as a technical sales representative for FCC and has been involved in sales technical support efforts since 1986, with a focus on hammer sales, pipe sales and CRT tools in the Lafayette, Louisiana and Dallas, Texas areas. Mr. Mosing has a Doctor of Veterinary Medicine from Louisiana State University. Mr. Mosing was selected as a Supervisory Director Nominee because of his extensive experience and familiarity with the Frank’s companies.
Steven B. Mosing. Mr. Mosing will be appointed to serve on our supervisory board in connection with the completion of this offering. Mr. Mosing has served on the board of directors for FCC and FTS since 2000. Additionally, Mr. Mosing is currently a director of Shoreline Energy LLC, an independent exploration and production company. Mr. Brent Mosing began his career with Frank’s full time in 1978 and has held various positions, including field sales, office sales, information technology and marketing. Mr. Mosing received his Bachelor of Science Degree in Economics from the University of Louisiana at Lafayette in 1978 and his Master of Business Administration from the Northwestern State University in 1993. Mr. Mosing was selected as a Supervisory Director Nominee because of his extensive experience and familiarity with the Frank’s companies.
95
Table of Contents
Index to Financial Statements
Sheldon Erikson. Mr. Erikson will be appointed to serve on our existing board prior to completion of this offering and will serve on our supervisory board following its creation. Mr. Erikson served as the Chairman, President and Chief Executive Officer of Cameron International Corporation from the time of its creation in 1995 through 2008, and currently serves on Cameron International Corporation’s board of directors. Prior to assuming his leadership role with Cameron, Mr. Erikson had a long and distinguished career in the energy and manufacturing sectors. He was Chairman of the Board, President and Chief Executive Officer of The Western Company of North America, an international petroleum service company engaged in pressure pumping, well stimulating and cementing and offshore drilling. Previously, he was President of the Joy Petroleum Equipment Group of Joy Manufacturing Company. Mr. Erikson is also a director of Endeavour International Corporation, an oil and gas exploration and production company; Rockwood Holdings, Inc., a company in the specialty chemicals and advanced materials businesses; General Partner of Red Rock Interests, a private company; and has been a director of Triton Energy Company and Spinnaker Exploration Company, both oil and gas exploration companies, Layne Christensen Co., a provider of services and related products for the water, mineral and energy markets, and NCI Building Systems, a provider of products and services for the construction industry. He also serves on the boards of the National Petroleum Council, American Petroleum Institute, National Ocean Industries Association and the Petroleum Equipment Suppliers Association, of which he is a past chairman. He also serves in positions of leadership in charitable and non-profit organizations, including The University of Texas MD Anderson Cancer Center and the Texas Heart Institute. He has an M.B.A. from the Harvard Graduate School of Business Administration and studied engineering and economics at the University of Illinois. Mr. Erikson was selected as a Supervisory Director Nominee because he has extensive experience in the oil and gas industry and serving on the boards of publicly traded companies.
Status as a Controlled Company
Following the completion of this offering, we intend to elect to be treated as a “controlled company” as that term is set forth in Section 303A of the NYSE Listed Company Manual. Under the NYSE rules, a “controlled company” may elect not to comply with certain NYSE corporate governance requirements, including: (1) the requirement that a majority of our supervisory board consist of independent directors, (2) the requirement that our nominating and governance committee be composed entirely of independent directors with a written charter addressing the committee’s purpose and responsibilities, and (3) the requirement that our compensation committee be composed entirely of independent directors with a written charter addressing the committee’s purpose and responsibilities. Notwithstanding our status as a controlled company, we will remain subject to the NYSE corporate governance standard that requires us to have an audit committee composed entirely of independent directors. As a result, we must have at least one independent director on the audit committee of our supervisory board by the date our common stock is listed on the NYSE, at least two independent directors within 90 days of the listing date and at least three independent directors within one year of the listing date.
Once we cease to be a controlled company, our supervisory board will be required to have a compensation committee and a nominating and governance committee, each with at least one independent director. Within 90 days of ceasing to be a controlled company, we will be required to have each of a compensation committee and a nominating and governance committee with a majority of independent directors, and within one year of ceasing to be a controlled company, a majority of our supervisory board must be comprised of independent directors.
Committees of the Supervisory Board
Upon the conclusion of this offering, we intend to have an audit committee, and in the event we are no longer a controlled company, a compensation committee and nominating and governance committee, of our supervisory board, and may have such other committees as the supervisory board shall determine from time to time. We anticipate that each of the standing committees of the supervisory board will have the composition and responsibilities described below.
96
Table of Contents
Index to Financial Statements
Audit Committee
We will establish an audit committee prior to completion of this offering. Rules implemented by the NYSE and SEC require us to have an audit committee comprised of at least three directors who meet the independence and experience standards established by the NYSE and the Exchange Act, subject to transitional relief during the one-year period following the completion of this offering. Prior to the completion of this offering, Mr. Erikson will be appointed the chairman and sole member of the audit committee of our existing board. Following this offering, he will fill the same position on our supervisory board. As required by the rules of the SEC and listing standards of the NYSE, the audit committee will consist solely of independent directors. SEC rules also require that a public company disclose whether or not its audit committee has an “audit committee financial expert” as a member. An “audit committee financial expert” is defined as a person who, based on his or her experience, possesses the attributes outlined in such rules. The Board believes that Mr. Erikson possesses substantial experience from his prior service as the chief executive officer and chairman of the board of Cameron International Corporation for over 13 years, during which time he was ultimately responsible for overseeing the preparation of financial statements and accounting controls, and his prior service on the audit committee of Rockwood Holdings, Inc., which provide him with an understanding of audit and accounting-related matters, internal accounting controls and audit committee functions. As a result of these qualifications, we anticipate that Mr. Erikson will satisfy the definition of “audit committee financial expert.”
This committee will oversee, review, act on and report on various auditing and accounting matters to our supervisory board, including: the selection of our independent accountants, the scope of our annual audits, fees to be paid to the independent accountants, the performance of our independent accountants and our accounting practices. In addition, the audit committee will oversee our compliance programs relating to legal and regulatory requirements. Upon formation of the audit committee, we expect to adopt an audit committee charter defining the committee’s primary duties in a manner consistent with the rules of the SEC and the NYSE market standards.
Compensation Committee
Because we will be a “controlled company” within the meaning of the NYSE corporate governance standards, we will not be required to, and will not, have a compensation committee.
If and when we are no longer a controlled company, we will be required to establish a compensation committee. We anticipate that such a compensation committee would consist of three directors, each of whom will be “independent” under the rules of the SEC. As required by the rules of the SEC and listing standards of the NYSE, a majority of the compensation committee would be independent directors. This committee would establish salaries, incentives and other forms of compensation for officers and other employees. Our compensation committee would also administer our incentive compensation and benefit plans. Upon formation of a compensation committee, we expect to adopt a compensation committee charter defining the committee’s primary duties in a manner consistent with the rules of the SEC and applicable stock exchange or market standards.
Nominating and Governance Committee
Because we will be a “controlled company” within the meaning of the NYSE corporate governance standards, we will not be required to, and will not, have a nominating and corporate governance committee. While we are a controlled company, our supervisory board will identify and evaluate potential candidates for nomination as a director and recommend any such candidates to our supervisory board.
If and when we are no longer a controlled company, we will be required to establish a nominating and corporate governance committee. We anticipate that such a nominating and corporate governance committee would consist of three directors. As required by the rules of the SEC and listing standards of the NYSE, the nominating and corporate governance committee would consist of a majority of independent directors. This committee would identify, evaluate and recommend qualified nominees to serve on our supervisory board, develop and oversee our internal corporate governance processes and maintain a management succession plan. Upon formation of a nominating and corporate governance committee, we would expect to adopt a nominating and corporate governance committee charter defining the committee’s primary duties in a manner consistent with the rules of the SEC and applicable stock exchange or market standards.
97
Table of Contents
Index to Financial Statements
Compensation Committee Interlocks and Insider Participation
Because we will be a “controlled company” within the meaning of the NYSE corporate governance standards, we will not be required to, and will not initially, have a compensation committee. None of our executive officers serve on the board of directors or compensation committee of a company that has an executive officer that serves on our board or compensation committee. No member of our supervisory board is an executive officer of a company in which one of our executive officers serves as a member of the board of directors or compensation committee of that company. At the completion of this offering, our supervisory board will consist of four members, three of whom are members of the Mosing family, including our chief executive officer.
Risk Oversight
The supervisory board is actively involved in oversight of risks that could affect us. Following the completion of this offering, this oversight function will be conducted primarily through the audit committee, but the full supervisory board will retain responsibility for general oversight of risks. The audit committee will be charged with oversight of our system of internal controls and risks relating to financial reporting, legal, regulatory and accounting compliance. Our supervisory board will continue to satisfy its oversight responsibility through full reports from the audit committee chair regarding the committee’s considerations and actions, as well as through regular reports directly from officers responsible for oversight of particular risks. In addition, we have internal audit systems in place to review adherence to policies and procedures, which are supported by a separate internal audit department.
Code of Ethics for Chief Executive Officer, Chief Financial Officer, Controller and Certain Other Officers
Prior to the closing of this offering, our supervisory board will adopt a Code of Ethics for our Chief Executive Officer, our Chief Financial Officer and all other financial and accounting officers. Following adoption of the Code of Ethics, any change to, or waiver from, the Code of Ethics will be promptly disclosed as required by applicable U.S. federal securities laws and the corporate governance rules of the NYSE.
Code of Conduct
Prior to the closing of this offering, our supervisory board will adopt a Code of Business Conduct and Ethics applicable to our employees, supervisory directors, managing directors and officers, in accordance with applicable U.S. federal securities laws and the corporate governance rules of the NYSE. Following adoption of the Code of Business Conduct and Ethics, any change to, or waiver from, this Code of Business Conduct and Ethics may be made only by our supervisory board and will be promptly disclosed as required by applicable U.S. federal securities laws and the corporate governance rules of the NYSE.
Corporate Governance Guidelines
Prior to the closing of this offering, our supervisory board will adopt corporate governance guidelines in accordance with the corporate governance rules of the NYSE.
98
Table of Contents
Index to Financial Statements
COMPENSATION DISCUSSION AND ANALYSIS
This Compensation Discussion and Analysis (this “CD&A”) provides information regarding the executive compensation program for our principal executive officer, our principal financial officer, and our three other highest compensated executive officers at the end of the last completed fiscal year (the “Named Executive Officers”) and is intended to provide perspective regarding our executive compensation program, including our philosophy, objectives, compensation processes, and key components of compensation.
The following individuals were our Named Executive Officers as of December 31, 2012:
| • | Donald Keith Mosing, Chairman of the supervisory board, Director, Chief Executive Officer (“CEO”) and President; |
| • | Mark G. Margavio, Chief Financial Officer (“CFO”); |
| • | W. John Walker, Vice President of International Operations; |
| • | Robert R. Gilbert, Executive Vice President and Chief Operating Officer – U.S. Services and Pipe and Products; and |
| • | C. Michael Webre, Vice President of Engineering. |
Although this CD&A focuses on our executive compensation program during the last fiscal year, we also describe compensation actions taken before or after the last completed fiscal year to the extent such discussion enhances the understanding of our executive compensation disclosure. In connection with this offering, we expect to adjust our compensation practices going forward in order to make them more appropriate for a public company. This CD&A discusses our compensatory practices in place during 2012 and highlights the changes we expect to implement upon the consummation of this offering.
Overview of Executive Compensation and our Compensation Process
As a private company, our compensation arrangements with our Named Executive Officers have been determined on an individual basis, generally based on negotiations between the individual and our CEO, and in consultation with our CFO or Director of Human Resources when appropriate. Our CEO’s compensation arrangements were historically determined based on direct negotiations with the Board of Directors of FII (the “FII Board”), which consisted of Kirkland D. Mosing, Steven B. Mosing, and our CEO, with our CEO abstaining from all discussions and decisions related to his own compensation. Our Named Executive Officers’ compensation has generally been reviewed and adjusted on an annual basis.
Although we have not historically had a formal compensation committee, our CEO, our CFO, our Chief Operating Officer and our Director of Human Resources together have historically operated as an informal compensation committee, together with the FII Board (less our CEO) with respect to our CEO’s compensation, for purposes of designing our compensation program. Following the completion of this offering, we expect to be a “controlled company” within the meaning of the NYSE corporate governance standards. If we are a controlled company, we will not be required to have a compensation committee composed entirely of independent directors. If we do not form a formal compensation committee comprised entirely of independent directors, we intend to continue to rely on our informal compensation committee process. Future independent directors that we add to our supervisory board may be included in this process. See “Management—Status as a Controlled Company” for additional information regarding our status as a controlled company.
The main components of our executive compensation program have historically consisted of the following components, which are described in greater detail below:
| • | base salary; |
| • | annual cash incentive awards; |
99
Table of Contents
Index to Financial Statements
| • | deferred compensation and long-term incentive compensation; |
| • | severance benefits; and |
| • | limited perquisites. |
As described in greater detail below, our annual cash incentive award program has consisted of annual discretionary cash bonuses, while our long-term incentive awards have consisted of discretionary company contributions to the Frank’s Executive Deferred Compensation Plan (the “Deferred Compensation Plan”), which is subject to time-based vesting. In addition, three of our Named Executive Officers have existing employment agreements that provide for severance pay in the event of certain qualifying terminations of employment.
The decisions regarding the various levels and forms of compensation for the Named Executive Officers were made in the discretion of our CEO (in consultation with the other members of our existing informal compensation committee) with respect to the other Named Executive Officers and by the FII Board (less the CEO) with respect to our CEO. Factors considered in making this determination included overall market conditions, our CEO’s or FII Board’s sense of the amounts necessary to remain competitive in the marketplace, the particular Named Executive Officer’s collaboration and teamwork skills, and for all of the Named Executive Officers other than our CEO and CFO, the financial performance of the business or geographical unit led by the Named Executive Officer as compared to the performance of the market in our industry. Consideration has also historically been given to the compensation received by the individual in prior years relative to performance in those years versus the performance of the individual in the most recent fiscal year. Since we have not historically provided any of the Named Executive Officers with grants of equity, we have previously focused on annual bonuses and Deferred Compensation Plan contributions to incentivize short-term and long-term performance. While our historical compensation decisions may have been based on more of a subjective assessment, we anticipate that our future compensation decisions will be guided by more qualitative and quantitative analysis.
Through our informal compensation committee, we have begun the process of analyzing our executive compensation program with the goal of modifying it to be more suitable for a public company. To aid in this process, we have engaged Meridian Consultants, LLC (“Meridian”), a nationally recognized compensation consulting firm with experience in assisting similar U.S. companies that provide services to the oil and gas industry. We are working with Meridian to refine our executive compensation arrangements to ensure that (i) our total executive compensation is in line with the executive compensation among our peer group and (ii) our overall compensation aligns our executives’ interests with those of our stockholders by tying a meaningful portion of each executive’s cash and equity compensation to the achievement of performance targets and by including time-based vesting requirements in our long-term equity incentive compensation awards. The process of modifying our executive compensation policies and practices is still underway, but we have received recommendations from Meridian that we expect will be used to implement new compensation arrangements in connection with this offering. Although Messrs. Mosing, Gilbert, and Webre all have existing employment agreements, all of our Named Executive Officers will enter into new employment agreements in connection with this offering, which are described in more detail below in “—Components of Our Compensation Program – Severance Benefits” and in “—Potential Payments Upon Termination or a Change in Control.”
Goals of the Compensation Program
We are focused on establishing an executive compensation program that is intended to attract, motivate, and retain key executives and to reward executives for creating and increasing the value of our company. These objectives are taken into consideration when creating our compensation arrangements, when setting each element of compensation under those programs, and when determining the proper mix of the various compensation elements for each of our Named Executive Officers. We periodically reevaluate whether our compensation programs and the levels of pay awarded under each element of compensation achieve these objectives. For example, we concluded that our decision to list our shares on a public stock exchange will change the duties and responsibilities of our executive officers and may change the group of companies with which we compete for executive talent such that a formal reevaluation was advisable.
100
Table of Contents
Index to Financial Statements
To ensure we continue to meet our compensation objectives as a public company, we are working closely with Meridian and using market data to develop an understanding of the current compensation practices among our peers and to ensure that our executive compensation program is competitive within the industry. In furtherance of this goal, we have identified, with Meridian’s assistance, an initial peer group consisting of the following 17 companies in order to create a broad sample for purposes of evaluating compensation practices:
| • | C&J Energy Services, Inc. |
| • | Core Laboratories N.V. |
| • | Dresser-Rand Group Inc. |
| • | Dril-Quip, Inc. |
| • | Exterran Holdings, Inc. |
| • | Forum Energy Technologies, Inc. |
| • | Helix Energy Solutions Group, Inc. |
| • | Hercules Offshore, Inc. |
| • | Hornbeck Offshore Services, Inc. |
| • | Lufkin Industries Inc. (subsequently acquired) |
| • | Newpark Resources, Inc. |
| • | Noble Corp |
| • | Oceaneering International, Inc. |
| • | Precision Drilling Corporation |
| • | Rowan Companies plc |
| • | RPC, Inc. |
| • | SEACOR Holdings Inc. |
Meridian worked with our informal compensation committee to select this group of publicly traded companies from the same or similar industry and within a certain range of our annual revenue to serve as our peer group for purposes of obtaining data regarding the compensation practices of our peers.
In order to ensure that our total compensation program is competitive with our peers following the completion of this offering, we expect that our existing informal compensation committee will approve targeting overall compensation of our Named Executive Officers (other than our CEO) at or near the 50th percentile of our peer group companies, and we expect that the FII Board (minus our CEO) will approve targeting overall compensation of our CEO at or near the 75th percentile of our peer group companies. However, we expect that our supervisory board, following the completion of this offering, will make a final determination regarding the precise allocation of this total targeted compensation among the various compensation elements.
We are also seeking to more closely align our executives’ interests with those of our shareholders through the use of long-term incentive plan awards. We feel that this reevaluation of our compensation programs and each of the elements of our compensation scheme is necessary to ensure that our programs continue to meet the objectives we have set in the context of a growing, publicly traded company. This review may result in substantial changes to our executive compensation programs, which will be disclosed as they are implemented.
101
Table of Contents
Index to Financial Statements
Components of Our Executive Compensation Program
The employment agreements that our Named Executive Officers (other than Messrs. Margavio and Walker) have previously entered into provide for three principal elements of compensation: base salary, cash bonuses, and severance pay. Cash bonuses have been paid annually on a discretionary basis for each of the Named Executive Officers except Mr. Mosing, whose annual cash bonus is paid pursuant to a specific formula based on company performance measures. In addition, our Named Executive Officers are eligible to participate in the Deferred Compensation Plan, which provides for annual discretionary company contributions that vest at the end of a five-year period. We believe this mix of compensation has historically aligned our executives’ compensation with our short-term and long-term goals. While we feel that the employment agreements have historically been beneficial to both the executive and the company, each of our Named Executive Officers will enter into new employment agreements that are better suited for a public company and reflective of the executive’s role going-forward.
Below is a description of each of the principal elements of our current compensation program and our current view on these elements. We recognize that in connection with the review our informal compensation committee is undertaking with Meridian, the goals themselves and the methods of implementing those goals may change.
Base Salary
Each Named Executive Officer’s base salary is a fixed component of compensation for each year for performing specific job responsibilities. It represents the minimum income a Named Executive Officer may receive in any year. Base salaries have typically been reviewed in September or October of each year for each Named Executive Officer based on company performance, cost-of-living adjustments, and personal performance. Any resulting base salary adjustments typically occur in November. Base salaries are also re-evaluated at the time of any promotion or significant change in job responsibilities. Historically, base salary review has been made by the informal compensation committee for each of the Named Executive Officers other than the CEO and the CFO, by our CEO for our CFO, and by the FII Board (less the CEO) for our CEO. Under the terms of Mr. Mosing’s current employment agreement, his base salary can be increased, but generally not decreased (except in response to unusual economic conditions and only if the reduction is consistent with the percentage reduction applied to other executive employees), following review and determination by the FII Board, which review was historically required to occur annually or more frequently from time to time in the discretion of the FII Board. Under the terms of the current employment agreements for Messrs. Gilbert and Webre, “base compensation” (defined as including salary, bonus, automobile allowance, and benefits accrued as of the effective date of the agreements) shall not be reduced during any annual review except by mutual agreement of the parties. In November, our annual base salary review resulted in implementation of the following base salary adjustments for each of our Named Executive Officers: $762,023 for Mr. Mosing; $307,743 for Mr. Margavio; $355,446 for Mr. Walker; $409,164 for Mr. Gilbert; and $378,446 for Mr. Webre.
In connection with this offering, we anticipate that the informal compensation committee of our existing board of directors (and the FII Board, less our CEO, with respect to the CEO) will analyze the appropriateness of the base salary for each of our Named Executive Officers in light of the base salaries of the peer group we identify with the assistance of Meridian, both on a stand-alone basis and as a component of total compensation. We expect that this review will result in the establishment of the following annual base salaries for our Named Executive Officers, to be effective upon the closing of the offering: $950,000 for Mr. Mosing; $350,000 for Mr. Margavio; $375,000 for Mr. Walker; $409,164 for Mr. Gilbert; and $378,446 for Mr. Webre. In the future, we expect our supervisory board will review base salaries on an annual basis to determine if the company’s financial and operating performance, as well as the executive officer’s personal performance and the cost of living factor, support any adjustment to the executive’s base salary. The employment agreements for each of our Named Executive Officers will provide that base salary may be increased, but generally not decreased (except by up to 10% as part of similar reductions applicable to all similarly situated executives) by the supervisory board.
102
Table of Contents
Index to Financial Statements
Cash Bonus
Our annual bonus program is intended to reward our executives for personal and company performance. Generally, in determining the amount of each executive’s annual bonus, we have previously considered company growth and earnings for the year, as well as the employee’s performance, the employee’s past bonus compensation, and market compensation. While each of these factors has been taken into account, our CEO has historically had full discretion to award any level of annual bonus, including awarding no bonus, to each of the other Named Executive Officers. In contrast, Mr. Mosing’s current employment agreement provides that his annual bonus will be equal to at least 2% of our annual EBITDA. Going forward, Mr. Mosing’s employment agreement will not provide for a bonus based upon our annual EBITDA, or any other single performance metric.
The determination of the amount of any annual bonus that will be paid to a Named Executive Office has historically been made by our CEO with respect to the other four Named Executive Officers and by the FII Board (less our CEO) with respect to Mr. Mosing (subject to the minimum annual bonus required by Mr. Mosing’s existing employment agreement). Other than with respect to Mr. Mosing, annual bonuses have historically been paid in November of each year, based on performance for the fiscal year.
We intend to continue to provide annual incentive cash bonuses to reward achievement of financial or operational goals so that total compensation reflects actual company and individual performance. Following the conclusion of our informal compensation committee’s review of our compensation policies with data supplied by Meridian, our annual bonus program may significantly change. We expect that our compensation committee or supervisory board may establish performance goals (with threshold, target and maximum levels) to be used following the offering in determining cash bonuses that may become payable at threshold, target, and maximum amounts and which will align our executive officers’ compensation with the performance of the company as a whole. We expect that any such goals will be established in connection with the review of the data provided by Meridian.
Deferred Compensation Plan
We have historically offered long-term incentives to each of our Named Executive Officers other than Mr. Mosing (whose long-term incentives are achieved through his ownership interests) through discretionary company contributions under our Deferred Compensation Plan. These contributions vest in full after five years and serve as a long-term retention tool. Historically, each April, our informal compensation committee recommends for approval by the CEO the amount of the discretionary company contribution to be made on behalf of each Named Executive Officer other than Mr. Mosing, and this amount is contributed to the applicable Named Executive Officer’s Deferred Compensation Plan account each May. Going forward, we expect that our supervisory board will make these determinations. While Mr. Mosing is eligible, under the terms of the Deferred Compensation Plan, to receive a company contribution in our discretion, we have not historically credited him with any such contributions under this plan.
The Deferred Compensation Plan also allows each Named Executive Officer, including Mr. Mosing, to elect to defer a percentage of his compensation (defined as the Named Executive Officer’s base salary, bonus, commission, and any other cash or equity-based compensation approved by the plan’s administrative committee) until the executive’s termination of employment or until a future date specified by the executive at the time of his deferral election.
To create additional incentives for our executive officers to continue to grow our company, we are in the process of evaluating a formal long-term incentive plan and an employee stock purchase plan intended to satisfy the requirements of section 423 of the Code (“ESPP”), both of which we intend to adopt in connection with this offering. We expect that both the ESPP and the long-term incentive plan will be adopted by our existing board and approved by our stockholders prior to the completion of this offering. We believe that having an equity component to our compensation program is vital to align our executive officers’ interests with our equity holders’
103
Table of Contents
Index to Financial Statements
interests through shared ownership, and the new employment agreements we intend to execute with each of our Named Executive Officers are expected to allow awards to be granted to each Named Executive Officer under the long-term incentive plan, as determined by our supervisory board (or a designated committee thereof), in its sole discretion.
Long-Term Incentive Plan
Based on our discussions with Meridian, we expect to adopt an omnibus long-term incentive plan (the “LTIP”) that will provide for the grant of a variety of awards. We anticipate that in connection with or after the closing of this offering, the supervisory board will grant restricted stock unit awards to certain of our employees (including the Named Executive Officers) that are key to our operations, as well as to our supervisory board’s outside directors, pursuant to the LTIP described below. Concurrently with this offering, we expect to grant stock-settled Restricted Stock Units (“RSUs”) to our officers and employees valued at an aggregate of $78,000,000 under our LTIP. This will include RSUs granted to our Named Executive Officers in the following amounts: For our CEO, an RSU award valued at $25,000,000, with the number of RSUs subject to the award calculated based on the fair market value of our common stock on the date of grant, and for the remaining Named Executive Officers (as well as our other executive officers and our employees serving as first-level vice presidents (the “Officer Group”)), RSU awards valued at a total of $17,500,000 for the entire group (with the total number of RSUs being granted to this group determined under the same formula as described above for the CEO, and with each executive officer’s individual RSU allocation being determined by our CEO). Based on the midpoint of the price range set forth on the cover page of this prospectus, the RSUs to be granted to our officers and employees will represent an aggregate of approximately 3,900,000 shares of common stock, including RSUs representing approximately 1,250,000 shares of common stock to be granted to our CEO and RSUs representing approximately 875,000 shares of common stock to be granted to the remaining Named Executive Officers (as well as our Officer Group). It is expected that the initial RSU awards to our CEO and the Named Executive Officers (as well as our Officer Group) will vest 20% per year over the first three years, with the remaining 40% vesting on March 31, 2017. We expect that the initial RSU awards granted to our other officers and employees will vest ratably over a three-year period. We anticipate that any such equity awards granted to our officers and outside directors in the future will be subject to time-based vesting; however, except as described above with respect to the initial grants made to our Named Executive Officers in connection with this offering, the board has not yet made final determinations as to the number of awards to be granted, when the awards will be granted, or the schedule on which the awards will become vested. A form of the award agreement that is expected to be used for these grants has been filed as an exhibit to the registration statement of which this prospectus is a part.
The description of the LTIP set forth below is a summary of the expected material features of the plan. This summary, however, does not purport to be a complete description of all the provisions of the LTIP that we intend to adopt. This summary is qualified in its entirety by reference to the LTIP, a form of which has been filed as an exhibit to the registration statement of which this prospectus is a part. Because the LTIP has not yet been adopted, the description below merely reflects current expectations with respect to the terms and conditions of the LTIP. The terms and conditions described below should be read in that context and remain subject to change unless and until we adopt the LTIP.
Overview
The LTIP will provide us with the flexibility to make grants of stock options (both incentive stock options and options that do not constitute incentive stock options), restricted stock, restricted stock units, dividend equivalents, performance awards, annual incentive awards, bonus stock awards, or other stock-based awards. All officers and employees of FINV or its subsidiaries, as well as other individuals who provide services to us or our subsidiaries (including directors), will be eligible to receive awards under the LTIP. The LTIP will expire upon the earlier of (i) its termination by our supervisory board, (ii) the date common stock is no longer available under the LTIP for grants of awards, or (iii) the tenth anniversary of the effective date of the LTIP.
104
Table of Contents
Index to Financial Statements
Administration of LTIP
The LTIP will initially be administered by our supervisory board or a designated committee thereof (the “Committee”). Under the terms of the LTIP, the Committee will have the power to (1) adopt, amend, and rescind administrative and interpretative rules and regulations relating to the LTIP, (2) determine which eligible individuals will be granted awards under the LTIP and the time or times at which such awards will be granted, (3) determine the amount of cash and/or the number of shares of common stock that will be subject to each award under the LTIP, (4) determine the terms and provisions of each award agreement, (5) accelerate the time of vesting or exercisability of any award that has been granted under the LTIP, (6) construe the respective award agreements and the LTIP, (7) make determinations of the fair market value of the common stock pursuant to the LTIP, (8) delegate its duties under the LTIP (including, but not limited to, the authority to grant awards) to such agents as it may appoint from time to time and (9) make all other determinations, perform all other acts, and exercise all other powers and authority necessary or advisable for administering the LTIP, including the delegation of those ministerial acts and responsibilities as the Committee deems appropriate.
Shares Available for Awards Under the LTIP
Pursuant to the LTIP, we expect the aggregate maximum number of shares of our common stock that may be issued under the LTIP will not exceed 20,000,000. Shares of common stock cancelled, settled in cash, forfeited, or withheld to satisfy exercise prices or tax withholding obligations will be available for delivery pursuant to other awards. The common stock delivered pursuant to such awards may be common stock acquired in the open market or acquired from any affiliate or other person, or any combination of the foregoing, as determined in the discretion of the Committee. Further, we expect that the following limitations will apply with respect to awards granted under the LTIP to the extent the awards will be subject to the restrictions under section 162(m) of the Internal Revenue Code of 1986, as amended (the “Code”) that apply to compensation paid following the reliance period described in Treasury Regulation §1.162-27(f) and granted to a “covered employee” as defined under section 162(m) of the Code:
| • | The maximum number of shares of our common stock that may be subject to awards denominated in shares of our common stock granted to any one individual during any one calendar year in the term of the LTIP (excluding awards granted in connection with this offering) may not exceed 2,500,000 shares; and |
| • | A maximum amount of $50,000,000 may be granted to any one individual during any calendar year with respect to awards either designated to be paid only in cash or for which the settlement is not based on a number of shares of our common stock (with such value determined on the date of grant). |
The LTIP will provide that if we effect a subdivision or consolidation or an extraordinary cash dividend on the shares of our common stock, the number of shares of stock subject to the award, and the purchase price thereunder (if applicable) will be proportionately adjusted. If we recapitalize, reclassify, or otherwise change our capital structure, outstanding awards will be adjusted so that the award will thereafter cover the number and class of shares to which the holder would have been entitled if he had been the holder of record of the shares covered by such award immediately prior to the recapitalization, reclassification, or other change in our capital structure. Further, the aggregate number of shares available under the LTIP and the individual award limitations described above will also be appropriately adjusted.
Types of LTIP Awards
At the discretion of our Committee, we expect that awards under the LTIP may be granted in the forms described below. Each award will be evidenced by an award agreement setting forth the specific terms and conditions applicable to the award.
Options. The LTIP will provide for the granting of incentive stock options or options that do not constitute incentive stock options. The Committee will determine the terms of any stock options granted under the LTIP,
105
Table of Contents
Index to Financial Statements
including the purchase price and when such options become vested and exercisable. The Committee will also determine the term of each option (up to a maximum term of 10 years), the time at which an option may be exercised, and the method by which payment of the purchase price may be made.
Stock Appreciation Rights. Stock appreciation rights allow the recipient to receive the appreciation in the fair market value of our common stock between the date of grant and the exercise date. The Committee will determine the terms of any stock appreciation rights, including when such rights become vested and exercisable and whether to pay the appreciation in cash, in shares of our common stock, or a combination thereof. The term of each stock appreciation right may not exceed 10 years from the date of grant.
Restricted Stock. Pursuant to a grant of restricted stock, shares of our common stock may be issued or delivered to participants, subject to certain restrictions on the disposition thereof and certain obligations to forfeit the shares to us as may be determined in the discretion of the Committee. The restrictions on disposition and the forfeiture restriction for restricted stock may lapse at such times and under such circumstances (including based on achievement of performance goals and/or future service requirements) or in such installments as the Committee may determine. The recipient may not sell, transfer, pledge, exchange, hypothecate, or otherwise dispose of the shares until the expiration of the restriction period. However, upon the issuance of shares of our common stock pursuant to a restricted stock award, except as otherwise determined by the Committee, the holder will have all the rights of a holder of our common stock with respect to the shares, including the right to vote the shares and to receive all dividends and other distributions paid with respect to the shares. Dividends made on restricted stock may or may not be subjected to the same vesting provisions as the restricted stock, depending on the terms of the award agreement pursuant to which the restricted stock award is granted.
Restricted Stock Units. A restricted stock unit is a notional share of our common stock that entitles the grantee to receive a share of our common stock upon the vesting of the restricted stock unit or, in the discretion of the Committee, the cash equivalent to the value of a share of our common stock. The Committee may determine to make grants of restricted stock units under the LTIP to participants containing such terms as it determines. The Committee will determine the period over which restricted stock units granted to participants will vest. Like restricted stock, restricted stock units may vest over time, pursuant to performance criteria, or based on a combination of service and performance.
Dividend Equivalents. The Committee, in its discretion, may grant dividend equivalent rights (either in tandem to other awards or on a stand-alone basis) that entitle the holder to receive cash, shares of our common stock, or other awards equal to any dividends made on a specified number of shares of common stock.
Performance and Annual Incentive Awards. For awards granted under the LTIP that are based upon performance criteria specified by the Committee, the Committee will establish the maximum number of shares of common stock subject to, or the maximum value of, each performance award and the performance period over which the performance applicable to the award will be measured. The performance measures to which a performance award are subject will be determined by the Committee and will be based on one or more of the following performance measures: (1) earnings per share; (2) increase in revenues; (3) increase in cash flow; (4) increase in cash flow from operations; (5) increase in cash flow return; (6) return on net assets; (7) return on assets; (8) return on investment; (9) return on capital; (10) return on equity; (11) economic value added; (12) operating margin; (13) contribution margin; (14) net income; (15) net income per share; (16) pretax earnings; (17) pretax earnings before interest, depreciation and amortization; (18) pretax operating earnings after interest expense and before incentives, service fees, and extraordinary or special items; (19) total stockholder return; (20) debt reduction; (21) market share; (22) change in the fair market value of our common stock; (23) operating income; (24) objective safety measures such as the total recordable incident rate or the lost time incident rate; (25) other objective measures related to completion of projects; and (26) any of the above goals determined on an absolute or relative basis or as compared to the performance of a published or special index deemed applicable by the Committee, including, but not limited to, the Standard & Poor’s 500 Stock Index or a group of comparable companies. Any of these metrics may be subject to adjustment as provided in the LTIP.
106
Table of Contents
Index to Financial Statements
Payment of a performance award may be made in cash, shares of our common stock, or a combination thereof, as determined by the Committee. The Committee may establish a performance pool, which shall be an unfunded pool, for purposes of measuring the achievement of a performance goal or goals based on one or more criteria set forth above during the given performance period (which may be a single calendar year or multiple years). The Committee may specify the amount of a performance pool as a percentage of any of such criteria, a percentage in the excess of a threshold amount, or as another amount which need not bear a strictly mathematical relationship to such criteria.
Bonus Stock Awards. Bonus stock awards are unrestricted shares of our common stock that are subject to such terms and conditions as the Committee may determine. They need not be subject to performance criteria or objectives or to forfeiture.
Other Stock-Based Awards. The Committee, in its discretion, may also grant to participants an award denominated or payable in, referenced to, or otherwise based on or related to the value of our common stock.
Change in Control
The LTIP will provide that, upon a “change in control” (as defined in the LTIP), the Committee, in its sole discretion, may accelerate the vesting and exercise date of options and stock appreciation rights, cancel options and stock appreciation rights and cause us to make payments in respect thereof in cash or adjust the outstanding options and stock appreciation rights as appropriate to reflect the change in control. In addition, under the LTIP, upon the occurrence of a change in control, the Committee will be permitted to fully vest any awards then outstanding (including restricted stock, restricted stock units, and performance awards) or make such other adjustments to awards as it deems appropriate.
Amendment and Termination of the LTIP
Our supervisory board, in its discretion, will be permitted to terminate the LTIP at any time with respect to any shares of our common stock for which awards have not been granted. Our supervisory board will also be permitted to alter or amend the LTIP or any part thereof or award thereunder from time to time; provided that no change to the LTIP or such award may be made that would materially impair the rights of a participant with respect to any previously granted and outstanding award without the consent of the applicable participant. To the extent any amendment to the LTIP requires stockholder approval pursuant to any applicable federal or state law or regulation or the rule of any stock exchange or automated quotation system on which our common stock may then be listed or quoted, including any increase in any share limitation, such amendment will be subject to the approval of our stockholders. No awards may be granted under the LTIP on or after the tenth anniversary of its effective date.
Employee Stock Purchase Plan
As described above, we expect that our supervisory board will adopt an ESPP and that our existing shareholders will approve such plan prior to the completion of this offering, in order to enable eligible employees (including our Named Executive Officers) to purchase shares of our common stock at a discount following the date of this offering. Purchases will be accomplished through participation in discrete offering periods. This ESPP is intended to qualify as an employee stock purchase under section 423 of the Code. We expect to reserve a maximum of 3,000,000 shares of our common stock for issuance under the ESPP, subject to appropriate adjustments to reflect changes in our common stock caused by certain events like stock splits or a change in control. The number of shares of stock that may be granted to any single participant in any single option period will be subject to certain limitations set forth in the plan.
Severance Benefits
We currently maintain employment agreements with all of our Named Executive Officers other than Messrs. Margavio and Walker. Mr. Mosing’s employment agreement includes an initial term of six years, with
107
Table of Contents
Index to Financial Statements
automatic extensions for additional one-year periods unless either party provides at least 90 days advance written notice of its intent to terminate the employment relationship as of the end of the term. Under this automatic renewal feature, Mr. Mosing’s employment agreement has currently been extended through December 31, 2013. Mr. Gilbert and Mr. Webre have entered into an employment agreement with an initial term of three years, with automatic extensions on a month-to-month basis until either party provides at least 10 days advance written notice of its intent to terminate the Agreement. These two executives have concluded their initial terms and are currently under monthly renewal.
The employment agreements for these three Named Executive Officers contain certain severance protections that are described in more detail below in “—Potential Payments Upon Termination or a Change in Control.” Generally, the executives who are a part of these agreements are entitled to receive, upon a qualifying termination of employment, cash payments of up to three times the sum of the executive’s base salary and bonus and continued medical care coverage for a specific post-termination period. In addition, Mr. Mosing is entitled to accelerated vesting of any outstanding incentive compensation or stock option awards.
We believe that severance protection provisions create important retention tools for us, as post-termination payments allow employees to leave our employment with value in the event of certain terminations of employment that were beyond their control. Post-termination payments allow management to focus their attention and energy on making the best objective business decisions that are in our interest without allowing personal considerations to cloud the decision-making process. In addition, the employment agreements preclude the executives from soliciting employees or competing with us for a period of two years following termination of employment (one year in the case of Mr. Mosing). In connection with the review performed by Meridian, we have evaluated the employment agreements and severance provided to determine whether the agreements will meet our requirements as a public company. Based on this review, we intend that all of our Named Executive Officers will enter into new employment agreements meeting these requirements in connection with this offering. We anticipate that, under the new employment agreements, each Named Executive Officer will be entitled to certain severance benefits upon a qualifying termination of employment, as described in more detail below in “—Potential Payments Upon Termination or a Change in Control.” We anticipate that the new employment agreements will continue to preclude the executives, including Mr. Mosing, from soliciting employees or competing with us for a period of two years following termination of employment. (one year following a resignation by the executive for a reason other than a Good Reason, as defined in the agreements).
Perquisites and Other Compensation Elements
We offer participation in broad-based retirement, health and welfare plans to all of our employees. We currently maintain a plan intended to provide benefits under section 401(k) of the Code where employees are allowed to contribute portions of their base compensation into a retirement account (the “401(k) Plan”). We provide a matching contribution at the rate of 75% of the first $4,000 deferred by an employee (i.e., up to $3,000 in matching contributions). Our 401(k) Plan is designed to encourage all employees, including the participating Named Executive Officers, to save for the future.
We have historically provided limited perquisites for our Named Executive Officers. We believe that providing perquisites such as an automobile allowance, and in some cases, club dues, is an important component of compensation and necessary to compete for top management. However, our perquisite practice is also being re-evaluated as part of our compensation evaluation process with Meridian. Under the new employment agreements that we intend to adopt for each of our Named Executive Officers, we anticipate that each Named Executive Officer will receive the benefit of a life insurance policy providing an aggregate death benefit of not less than $1,000,000 and that Mr. Mosing will also be entitled, during the term of his employment, to personal use of corporate aircraft, subject to certain annual limitations and other restrictions, as well as to continued payment of monthly country club dues.
108
Table of Contents
Index to Financial Statements
How Elements of Our Compensation Program Are Related to Each Other
The approximate allocation of compensation elements in the 2012 compensation packages for each Named Executive Officer is as follows:
| Donald Keith Mosing | Mark G. Margavio | W. John Walker | Robert R. Gilbert | C. Michael Webre | ||||||||||||||||
| Base Salary |
8 | % | 54 | % | 28 | % | 57 | % | 56 | % | ||||||||||
| Bonus or Annual Cash Incentive Awards |
92 | % | 34 | % | 57 | % | 32 | % | 33 | % | ||||||||||
| Deferred Compensation Plan Contributions |
— | 9 | % | 13 | % | 8 | % | 8 | % | |||||||||||
| Perquisites and other compensation |
* | % | 3 | % | 2 | % | 3 | % | 3 | % | ||||||||||
|
|
|
|
|
|
|
|
|
|
|
|||||||||||
| Total |
100 | % | 100 | % | 100 | % | 100 | % | 100 | % | ||||||||||
|
|
|
|
|
|
|
|
|
|
|
|||||||||||
| * | Represents less than 1% |
Following our review of our compensation programs with Meridian, we expect that these allocations may change.
Accounting and Tax Considerations
Section 162(m) of the Code limits the deductibility of certain compensation expenses in excess of $1,000,000 to certain of our executive officers in any fiscal year. Compensation that is “performance based” is excluded from this limitation. For compensation to be “performance based,” it must meet certain criteria, including being payable only upon the attainment of predetermined, objective performance goals based upon performance criteria approved by our stockholders and having such goals be established and the attainment of which certified by a committee of our supervisory board that consists only of “outside directors.” While the tax impact of any compensation arrangement is one factor to be considered, such impact is evaluated in light of our overall compensation philosophy and objectives. We believe that maintaining the discretion to evaluate the performance of our executive officers is an important part of our responsibilities and benefits our public stockholders, and therefore, we may award compensation to our Named Executive Officers that is not fully deductible if we determine that such compensation is consistent with our compensation philosophy and benefits our stockholders. Regardless, section 162(m) of the Code provides that certain compensation of corporations which are privately held and which become publicly held in an initial public offering will not be subject to the deduction limitations of section 162(m) for a transition period following such initial public offering. We anticipate that our annual bonuses and certain awards of equity compensation may satisfy the requirements of this exception during the transition period.
Section 409A of the Code requires that “nonqualified deferred compensation” be deferred and paid under plans or arrangements that satisfy the requirements of the statute with respect to the timing of deferral elections, timing of payments, and certain other matters. Failure to satisfy these requirements can expose employees and other service providers to accelerated income tax liabilities and penalty taxes and interest on their vested compensation under such plans. Accordingly, as a general matter, it is our intention to design and administer our compensation and benefits plans and arrangements for all of our employees and other service providers, including our executive officers, so that they are either exempt from, or satisfy the requirements of, section 409A of the Code.
Any equity awards that may be granted to our employees, including our executive officers, pursuant to the long-term incentive plan we intend to adopt in connection with the offering will be reflected in our consolidated financial statements, based upon the applicable accounting guidance, at fair market value on the grant date in accordance with FASB Accounting Standards Codification, Topic 718, “Compensation–Stock Compensation.”
109
Table of Contents
Index to Financial Statements
Risk Assessment
Our existing board of directors has reviewed our compensation policies as generally applicable to our employees and believes that our policies do not encourage excessive and unnecessary risk-taking and that the level of risk that they do encourage is not reasonably likely to have a material adverse effect on us. In addition, the following specific factors, in particular, reduce the likelihood of excessive risk-taking:
| • | our overall compensation levels are competitive with the market; and |
| • | our compensation mix is balanced among (i) fixed components, like salary and benefits, and (ii) annual incentives that reward our overall financial and business performance, business unit financial performance, operational measures, and individual performance. |
In summary, although a portion of the compensation provided to our Named Executive Officers may be based on our performance and on the individual successes of the employee, we believe our compensation programs do not encourage excessive and unnecessary risk-taking by executive officers (or other employees) because these programs are designed to encourage employees to remain focused on both our short- and long-term operational and financial goals. Further, facets of compensation that incentivize our executives but mitigate risk-taking will be one of the many factors considered by our informal compensation committee and the FII Board during its review of our current compensation programs and during the design of new programs that may become effective in connection with this offering. In the future, the compensation committee or our supervisory board will seek to ensure that any changes made to our compensation programs following the completion of this offering do not encourage excessive and unnecessary risk-taking and that any level of risk that they do encourage is not reasonably likely to have a material adverse effect on us.
Stock Ownership Guidelines
Stock ownership guidelines have not currently been implemented for our Named Executive Officers or directors. We will continue to periodically review best practices and re-evaluate our position with respect to stock ownership guidelines.
110
Table of Contents
Index to Financial Statements
Summary Compensation Table
The table below sets forth the annual compensation earned during 2012 by our “Named Executive Officers,” as of December 31, 2012:
| Name and Principal Position |
Year | Salary ($)(1) |
Bonus ($)(2) |
Non-Equity Incentive Plan Compensation ($)(3) |
Nonqualified Deferred Compensation Earnings ($)(4) |
All Other Compensation ($)(5) |
Total ($) | |||||||||||||||||||||
| Donald Keith Mosing Chairman of the supervisory board, Director, Chief Executive Officer and President |
2012 | 746,782 | — | 9,050,000 | 547,069 | 30,825 | 10,374,676 | |||||||||||||||||||||
| Mark G. Margavio Chief Financial Officer |
2012 | 287,239 | 184,000 | — | 68,935 | 66,000 | 606,174 | |||||||||||||||||||||
| W. John Walker Vice President of International Operations |
2012 | 223,730 | 450,000 | — | 91,881 | 113,000 | 878,611 | |||||||||||||||||||||
| Robert R. Gilbert Executive Vice President and Chief Operating Officer – U.S. Services and Pipe and Products |
2012 | 382,354 | 212,100 | — | 62,247 | 72,662 | 728,363 | |||||||||||||||||||||
| C. Michael Webre Vice President of Engineering |
2012 | 361,340 | 213,000 | — | 32,367 | 66,000 | 672,707 | |||||||||||||||||||||
| (1) | The amounts reflected in this column include total annual salary for 2012, regardless of whether any of these amounts were deferred under our deferred compensation arrangements. |
| (2) | The amounts reflected in this column are the discretionary cash bonuses that were paid in November 2012 with respect to 2012. |
| (3) | The amount reflected in this column for Mr. Mosing reflects the performance-based bonus amount for 2012, which is based on a percentage of our EBITDA for the year. This amount was settled in December 2012 based on year-end EBITDA projections. |
| (4) | The amounts reflected in this column reflect the portion of the earnings that accrued under the Deferred Compensation Plan in 2012 that were determined to be above-market or preferential under the SEC’s rules, using 120% of the applicable federal long-term rate as the reference rate. |
| (5) | The amounts reflected in this column include the specific items reflected in the following table. The annual perquisite amounts include an automobile allowance for each named executive officer ($12,000), the expensing of gasoline purchases and tolls for the executive’s personal use of his car ($1,000), and for Messrs. Mosing and Gilbert, the payment of monthly country club dues (annualized at $14,825 and $5,662, respectively). |
| Company Contributions Under Deferred Compensation Plan ($) |
Employer Matching Contributions Under 401(k) Plan ($) |
Perquisites ($) |
Total ($) | |||||||||||||
| Donald Keith Mosing |
— | 3,000 | 27,825 | 30,825 | ||||||||||||
| Mark G. Margavio |
50,000 | 3,000 | 13,000 | 66,000 | ||||||||||||
| W. John Walker |
100,000 | — | 13,000 | 113,000 | ||||||||||||
| Robert R. Gilbert |
50,000 | 3,000 | 18,662 | 71,662 | ||||||||||||
| Michael Webre |
50,000 | 3,000 | 13,000 | 66,000 | ||||||||||||
111
Table of Contents
Index to Financial Statements
Grants of Plan-Based Awards for 2012
| Estimated Future
Payouts Under Non-Equity Incentive Plan Awards |
||||
| Name |
Target | |||
| Donald Keith Mosing (1) |
$ | — | ||
| Mark G. Margavio |
— | |||
| W. John Walker |
— | |||
| Robert R. Gilbert |
— | |||
| C. Michael Webre |
— | |||
| (1) | Pursuant to the terms of his current employment agreement, Mr. Mosing was entitled in 2012 to an annual bonus award in an amount equal to 2% of our EBITDA for the year. This amount was not subject to any threshold or maximum levels, and since we did not establish an EBIDTA target for the year, there was accordingly, no targeted bonus amount for Mr. Mosing. |
Narrative Description to the Summary Compensation Table and the Grants of Plan-Based Awards Table for the 2012 Fiscal Year
Employment Agreements. As noted above, three of our Named Executive Officers are currently party to an employment agreement with us. Under these employment agreements, Messrs. Mosing, Gilbert, and Webre are entitled to certain base salary, annual bonus payment, and perquisite protections. For example, in each of these employment agreements, the Named Executive Officer’s base compensation can generally be increased but not decreased during the term of the employment agreements. For this purpose, “base compensation” is defined in the employment agreements of Messrs. Gilbert and Webre as including the executive officer’s salary, annual bonus, automobile allowance, and other accrued benefits as of the effective date of the agreement. In addition, Mr. Mosing’s Employment Agreement currently provides for an annual bonus that is equal to 2% of our EBITDA for the year, which annual bonus can never be less than the percentage of base salary awarded to any other executive officer as a bonus for the same year. Finally, each of these executive officers is also entitled to a monthly automobile allowance under their employment agreements. However, as discussed in the “Compensation Discussion & Analysis” section above, it is expected that these Named Executive Officers will enter into new employment agreements in connection with this offering that will supersede the existing arrangements.
Grants of Plan Based Awards. We previously have not maintained an equity compensation plan and accordingly did not grant any equity-based compensation awards to any Named Executive Officer for 2012. The only grant of any plan-based awards that was made for 2012 was for Mr. Mosing’s annual bonus award, which is described in more detail in the note to the Grants of Plan Based Awards table.
Pension Benefits
We maintain the 401(k) Plan for our employees, including our Named Executive Officers, as well as the Deferred Compensation Plan, but at this time, we do not sponsor or maintain a pension plan for any of our employees.
112
Table of Contents
Index to Financial Statements
Non-Qualified Deferred Compensation Table
| Name and Principal Position |
Executive Contributions in Last FY ($)(1) |
Registrant Contributions in Last FY ($)(2) |
Aggregate Earnings in Last FY ($)(3) |
Aggregate Withdrawals/ Distributions ($)(4) |
Aggregate Balance at Last FYE ($)(5) |
|||||||||||||||
| Donald Keith Mosing |
214,211 | — | 757,609 | — | 7,882,581 | |||||||||||||||
| Mark G. Margavio |
10,000 | 50,000 | 85,357 | 9,890 | 653,938 | |||||||||||||||
| W. John Walker |
360,000 | 100,000 | 128,172 | — | 1,596,267 | |||||||||||||||
| Robert R. Gilbert |
83,548 | 50,000 | 87,498 | — | 1,009,260 | |||||||||||||||
| C. Michael Webre |
30,000 | 50,000 | 44,215 | — | 486,171 | |||||||||||||||
| (1) | The amounts reflected in this column are included in the Summary Compensation Table as part of the executive officer’s base salary and/or bonus. Participants may elect to defer up to 75% of their base salary and up to 100% of bonus, commissions, or any such other cash or equity-based compensation as may be approved for deferral by the plan’s administrative committee. |
| (2) | The amounts reported in this column are included in the Summary Compensation Table (see the “All Other Compensation” table in Note 4 to the Summary Compensation Table). Company contributions are credited to participant accounts from year to year at the sole discretion of the employer and vest in full (along with related earnings on these contributions) after 5 years of credited service. |
| (3) | This column represents the aggregate earnings for 2012 for each Named Executive Officer’s account under the plan and includes earnings on the executive’s elective deferrals (which earnings are 100% vested), as well as on the company’s discretionary contributions (which earnings are subject to a five-year vesting schedule). Earnings are calculated based on the executive’s elections from available deemed investment options offered under the plan. The deemed investment options are selected by the plan’s administrative committee, which can add or remove deemed investment options from the plan’s menu from time to time. Participants can select and change their deemed investment allocations at any time. |
| (4) | This column reflects the aggregate withdrawals or distributions from the plan for each Named Executive Officer in 2012. Distributions are made in accordance with the Named Executive Officer’s distribution elections; participants can elect to receive distributions upon retirement or other termination of employment or upon a specified future date. Upon the officer’s death or disability, all amounts credited to the participant under the plan are accelerated and paid out. Amounts may also be distributed on an account of an unforeseeable emergency or to comply with the terms of a qualified domestic relations order. There are various forms of payment that apply to different types of contributions and different types of payment events under the plan; these range from single lump sum payments to equal annual installments over a period from two to ten years, to a combination of forms (i.e., a partial lump sum, with the balance paid in equal annual installments over a specified number of years). |
| (5) | This column reflects the dollar amount of the total balance in each Named Executive Officer’s account under the plan as of the end of 2012. Some of these amounts are attributable to company contributions and therefore remain subject to the vesting requirements described in Note 2 to this table above. |
Potential Payments Upon Termination or a Change in Control
Current Employment Agreements
Under the terms of Mr. Mosing’s current employment agreement, upon a termination by the company without “good cause” (as such term is defined below), the executive is entitled to continue to receive his full salary and benefits (including payment of any annual bonuses) for a period of three years following his termination date, and any outstanding incentive or stock option awards held by the executive will become immediately vested. If Mr. Mosing’s employment is terminated by us without good cause within the two-year period following a “change in control” (as such term is defined in the agreement), or if Mr. Mosing terminates employment following a change in control on account of certain events that constitute good reason under the employment agreement, then (a) he will be entitled to receive a cash lump sum payment equal to three times the
113
Table of Contents
Index to Financial Statements
amount of his base salary for the year of the termination, plus three times the amount of his prior year bonus payment (which bonus amount shall be deemed to equal one-fourth of the executive’s base salary for the year in the event no bonus was awarded for the prior year), (b) he will receive continued medical care coverage (including for any covered spouse and/or dependents) for a period of three years following his termination of employment (or until the executive becomes employed by another employer sponsoring a medical plan, if earlier), along with a tax gross-up for any taxable medical benefits, and (c) any outstanding incentive compensation or stock option plan awards held by Mr. Mosing shall become immediately vested.
The employment agreements with Messrs. Gilbert and Webre provide a severance payment equal to three (3) times the sum of the executive’s base salary, automobile allowance, annual bonus, and benefits accrued on the effective date of the agreement upon a termination of employment by us without “cause” (as such term is defined below), plus payment of COBRA premiums for 12 months following the termination of employment. If the executive resigns for “good reason” (as such term is defined below) within three years following a “change of control” (as such term is defined below), he is entitled to continue receiving his base compensation in accordance with the company’s standard payroll practices until the earlier of 12 months following termination of employment or the date that the executive commences full-time employment with another employer (and to also receive payment of COBRA premiums during this same period). If the executive’s employment is terminated due to his death or “disability” (as such term is defined in the employment agreement), he will be entitled to a lump sum payment equal to his pro-rata portion of the annual bonus for the year of such termination, based on his length of service in such year.
The following terms are defined under the current employment agreements for Messrs. Mosing, Gilbert, and Webre, as described below:
| • | “Good Cause” includes the following circumstances under Mr. Mosing’s employment agreement, if such circumstances (other than item (a) below) are not cured within 10 business days following written notice from the board that describes the failure in reasonable detail and indicates the steps the employer requires as part of its cure: (a) conviction of either a felony involving moral turpitude or any crime in connection with the executive’s employment with us that causes us a substantial detriment (does not include traffic offenses), (b) actions or inactions that clearly are contrary to our best interests; (c) the executive’s willful failure to take lawful actions that are necessary for implementation of any policies established by our board that have been communicated to the executive in writing or that are reflected in the meeting minutes of any board meeting that executive has attended; (d) executive’s continued failure to attend to his duties as an executive officer, following written notice from the board regarding this failure; or (e) any condition that resulted from the executive’s substantial dependence on alcohol, any narcotic drug, or any other controlled or illegal substance. |
| • | “Cause” includes the following circumstances under the employment agreements for each of Messrs. Gilbert’s and Webre: (a) misconduct; (b) misappropriation of our assets; (c) conviction of, or a plea of guilty or no contest to, any felony under any federal or state laws; (d) commission of the act of any fraud against or appropriation of any property belonging to us; (e) a material breach of any confidentiality or proprietary information agreement between the executive and our company; and (f) continued unsatisfactory performance after being provided a written warning and at least 30 days to improve performance. |
| • | “Good reason” shall exist under Mr. Mosing’s termination if, following a change in control, any of the following occur, as compared to such circumstances existing prior to the change in control: (a) a reduction of the executive’s base salary or potential bonus level or any incentive compensation or stock option plan benefit; (b) a relocation of the executive’s office (or of the principal executive office) to a location that is more than 35 miles from the prior location; (c) requiring the executive to travel to a substantially greater extent to perform the same duties; (d) failing to provide the executive with substantially equivalent benefits as those enjoyed by the executive under the company’s health and welfare programs, disability plans, and incentive compensation or stock option plans in which the executive was previously participating; (e) materially reducing any such benefits or depriving the |
114
Table of Contents
Index to Financial Statements
| executive of any material fringe benefit enjoyed by the executive; (f) failing to provide the executive with at least the same number of paid vacation days to which the executive is entitled on the basis of years of service (giving credit for time served at prior employers); or (g) the executive’s voluntary termination of employment within two years following the change in control as a result of the executive’s good faith determination that as a result of the change in control, the executive can no longer adequately exercise the authorities, functions, or duties attached to the executive’s position as an executive officer of the company. |
| • | “Good reason” under the employment agreements of Messers. Gilbert and Webre include a resignation within 60 days of any of the following events (a) a reduction in salary or bonus; (b) a change in the executive’s position with our company or a successor company that substantially reduces the executive’s duties or responsibilities; (c) a change in title without the express written consent; or (d) a requirement that the executive relocate his place of employment outside of the United States. |
| • | “Disability” for purposes of the employment agreements for Messrs. Gilbert and Webre means the executive’s inability to carry out his material duties under the agreement for more than six months in any 12 consecutive month period as a result of his incapacity due to mental or physical illness or injury. |
| • | “Change in control” for purposes of Mr. Mosing’s employment agreement shall generally mean (a) the obtaining by any party or group of 50% or more of our voting shares pursuant to a “tender offer”; (b) members of our board fail to constitute a majority of the members of our board following a shareholder meeting that involves a contest for the election of directors; (c) we execute an agreement for the sale of all of our assets to an unrelated purchaser; (d) we adopt a plan of dissolution of liquidation; or (e) we enter into an agreement for a merger or consolidation in which we are not the surviving corporation or in which less than 50% of the surviving corporation’s outstanding voting stock is held by our prior shareholders. |
| • | “Change of control” for purposes of the employment agreements of Messrs. Gilbert and Webre shall mean (a) the sale, transfer, or other disposition of all or substantially all of the assets of FCC, or (b) the public offering for sale of FCC’s stock. |
Deferred Compensation Plan
Each of the Named Executive Officers is entitled to accelerated vesting of the amount of any unvested company discretionary contributions that have been credited to the officer’s account under the Deferred Compensation Plan upon the occurrence of the earliest of the death of the executive while actively employed, the disability of the executive, a change in control, or an involuntary termination of employment other than for cause. For purposes of this accelerated vesting provision, the following definitions apply:
| • | “Disability” means that the participant is, by reason of any medically determinable physical or mental impairment which can be expected to result in death or last for a continuous period of not less than 12 months: (a) unable to engage in any substantial gainful activity, or (b) receiving income replacement benefits for a period of not less than three months under one of our accident or health plans. |
| • | “Change in control” for purposes of the Deferred Compensation Plan means a change in the ownership of the employer, a change in the effective control of the employer, or a change in the ownership of a substantial portion of the assets of the employer, all as defined under section 409A of the Code. |
| • | “Cause” means the participant’s conviction of a felony or other crime; the participant’s commission of any act against the company constituting willful misconduct, dishonesty, fraud, theft, or embezzlement; the participant’s failure to perform any material services, duties, or responsibilities or to comply with the policies or procedures established by the company; the participant’s breach of any agreement entered into with the company prior to or within one year following a termination of employment; the participant’s dependence on any addictive substance; the destruction of or material change to the company’s property caused by willful or grossly negligent conduct; or the willful engaging by the participant in any other conduct that is demonstrably injurious to the company. |
115
Table of Contents
Index to Financial Statements
The following summaries and table describe and quantify the potential payments and benefits that we would provide to our Named Executive Officers in connection with a termination of employment and/or change in control, pursuant to the terms of the existing employment agreements that were in effect on December 31, 2012 for each of Messrs. Mosing, Gilbert, and Webre. Note, however, that we expect these existing Employment Agreements to be superseded by new employment agreements that are expected to be entered into in connection with this offering. Accordingly, the amounts that our Named Executive Officers may become entitled to in connection with a termination of employment and/or change in control following the offering may differ significantly from the amounts reflected in the table below:
| Executive |
Termination of Employment by us Without Cause ($)(1) |
Termination of Employment for Death ($)(2) |
Termination
of Employment by Executive for Good Reason following a Change in Control ($)(3) |
Change in Control or Liquidity Event (Without a Termination of Employment) ($)(4) |
||||||||||||
| Donald Keith Mosing(5) |
27,485,268 | 9,844,958 | 16,821,760 | — | ||||||||||||
| Mark G. Margavio |
230,800 | 230,800 | — | 230,800 | ||||||||||||
| W. John Walker |
363,840 | 363,840 | — | 363,840 | ||||||||||||
| Robert R. Gilbert |
2,090,730 | 170,003 | 639,859 | 170,003 | ||||||||||||
| C. Michael Webre |
2,010,976 | 179,709 | 610,714 | 179,709 | ||||||||||||
| (1) | Mr. Mosing’s termination payment includes a present value calculation on the 36-month payments. For purposes of calculating the present value, a discount rate of 5% and monthly compounding were applied, and all compensation and benefits were treated as being payable on the first of each month throughout the 36-month term beginning January 1, 2013. For Messrs. Gilbert and Webre, present value calculations (applying the same discount rate and compounding factors) were only applied to the value of the health premiums for the 12-month period because the other payments payable under their employment agreements are payable in a lump sum payment. For each of the Named Executive Officers other than Mr. Mosing, the amounts in this column also include the amounts of unvested company discretionary contributions under the Deferred Compensation Plan that will become vested upon an involuntary termination without cause. |
| (2) | Although the existing employment agreements for each of Messrs. Gilbert and Webre provide for a pro-rata annual bonus payment for the year of the executive officer’s termination of employment by reason of death or disability, because such termination date is assumed for purposes of this table to be December 31, 2012, and bonuses for such year were already paid in full prior to such date, no amount is included in this column for payments made under the existing employment agreements for these executive officers. Payments on account of Mr. Mosing’s death have been calculated in the form of a lump sum payment equal to the sum of his annual base salary (as in effect on December 31, 2012), his annual bonus (assuming the same annual bonus payment for 2013 as occurred for 2012), and annual car allowance; plus the present value of continued health coverage for 12 months following termination (assuming a 5% discount rate and monthly compounding). For each of the Named Executive Officers other than Mr. Mosing, payments in this column also reflect the amount of their Deferred Compensation Plan contributions that will become vested upon the executive’s death or disability. |
| (3) | The amount reflected in this column for Mr. Mosing is payable in a lump sum payment (except for the cost of continued health insurance coverage for a period of 36 months, which was calculated using the same present value factors described in note 1 above) and includes a tax gross-up on his medical insurance premium payments, which was calculated assuming a 35% marginal tax bracket. The amounts for Messrs. Gilbert and Webre represent the present value (using the same discount rate and compounding assumptions described in the notes above) of salary, annual bonus, automobile allowance, and health insurance coverage for a period of 12 months. |
| (4) | The amounts in this column reflect the amount of company discretionary contributions to the Deferred Compensation Plan that will become vested upon a change in control. |
116
Table of Contents
Index to Financial Statements
| (5) | For purposes of calculating the potential payments to Mr. Mosing upon a qualifying termination of employment, the annual bonus payment received by Mr. Mosing with respect to 2012 was used to calculate the severance amount for a termination by us without cause. In calculating the severance amount for a termination following a change in control, the annual bonus payment received by Mr. Mosing with respect to 2011 was used, as prescribed by the terms of his employment agreement, which require the prior year bonus amount to be included in the severance multiple for such circumstances. |
New Employment Agreements
We intend to adopt new employment agreements for each of our Named Executive Officers that will provide for certain payments upon a qualifying termination of employment. The description of the new employment agreements set forth below is a summary of the expected material features of the agreements regarding potential payments upon termination or a change in control. This summary, however, does not purport to be a complete description of all the provisions of the agreements that we intend to enter into with the executives. This summary is qualified in its entirety by reference to the employment agreements, forms of which for each of our CEO and our other Named Executive Officers have been filed as exhibits to the registration statement of which this prospectus is a part. Because the employment agreements have not yet been executed, the description below merely reflects current expectations with respect to the terms and conditions of the employment agreements. The terms and conditions described below should be read in that context and remain subject to change unless and until the parties execute new employment agreements.
Under the terms of the new employment agreements, we anticipate that each Named Executive Officer will be entitled to receive only the following amounts (the “Accrued Rights”) upon a termination by the company for “cause” (as such term is defined below), upon a termination of employment by reason of death, disability, or expiration of the term of the employment agreement, or upon the executive’s termination without “good reason” (as such term is defined below): (a) payment of all accrued and unpaid base salary to the date of termination, (b) reimbursement of all incurred but unreimbursed business expenses to which the executive would have been entitled to reimbursement, and (c) benefits to which the executive is entitled under the terms of any applicable benefit plan or program.
Under the terms of the new employment agreements, we anticipate that each Named Executive Officer will be entitled to receive the following amounts upon a termination by the executive for “good reason” (as such term is defined below) or by the company without “cause” (as such term is defined below): (a) the Accrued Rights; (b) any earned but unpaid annual bonus for the prior year; (c) a prorated annual bonus for the year of termination; and (d) a severance payment equal to two times (three times for Mr. Mosing, as well as for the other Named Executive Officers in the event of a termination within 12 months following a “change in control” as such term is defined below) the sum of the executive’s base salary on the date of termination and the average annual bonus for the three prior calendar years. We anticipate that Named Executive Officers other than Mr. Mosing will also be entitled to payment of COBRA premiums for 18 months for the executive and the executive’s spouse and eligible dependents.
We anticipate that the following terms will be defined under the new employment agreements for the Named Executive Officers, as described below:
| • | “Cause” means a determination by the company that the executive (a) has engaged in gross negligence, gross incompetence, or misconduct in the performance of the executive’s duties to us, (b) has failed without proper legal reason to perform the executive’s duties and responsibilities to us, (c) has breached any material provision of the employment agreement or any written agreement or corporate policy or code of conduct established by us, (d) has engaged in conduct that is, or could reasonably expected to be, materially injurious to us, (e) has committed an act of theft, fraud, embezzlement, misappropriation, or breach of a fiduciary duty to us, or (f) has been convicted of, pleaded no contest to, or received adjudicated probation or deferred adjudication in connection with a crime involving fraud, dishonesty, |
117
Table of Contents
Index to Financial Statements
| or moral turpitude or any felony (or a crime of similar import in a foreign jurisdiction). We anticipate that Mr. Mosing will be allowed a 30-day period to cure items (a) through (d), above. |
| • | “Good reason” means (a) a material diminution in the executive’s base salary (as defined in the employment agreements), other than as a part of one or more decreases that (i) shall not exceed, in the aggregate, more than 10% of the base salary as in effect on the date immediately prior to such decrease, and (ii) are applied similarly to all of our similarly situated executives; (b) a material diminution in the executive’s authority, duties, or responsibilities, including, for Mr. Mosing only, due to our engagement of an outside management firm to provide management services or a removal of Mr. Mosing from service as Chairman of the Board (except if such removal occurs due to his resignation from the board or removal by the board for “cause”); (c) for Mr. Mosing only, a requirement that he report to any corporate officer or other employee instead of reporting directly to our board; (d) the involuntary relocation of the geographic location of the executive’s principal place of employment by more than 75 miles from the location of the executive’s principal place of employment as of the effective date of the employment agreement; or (e) for Mr. Mosing only, any material breach by the Company or its affiliates of its obligations under his employment agreement. |
| • | “Change in control” generally means (a) a merger, consolidation, or sale of all or substantially all of our assets if (i) our shareholders do not continue to own at least 50% of the voting power of the resulting entity in substantially the same proportions that they owned our equity securities prior to the transaction or event or (ii) the members of our board immediately prior to the transaction or event do not constitute at least a majority of the board of directors of the resulting entity immediately after the transaction or event; (b) the dissolution or liquidation of the company; (c) when any person, entity, or group (other than members of the Mosing family and/or related persons or entities) acquires or gains ownership or control of more than 50% of the combined voting power of the outstanding securities of the company, or (d) as a result of or in connection with a contested election of directors, the persons who were members of our board immediately before such election cease to constitute a majority of the board. |
Director Compensation
During 2012, we did not pay fees to members of our board. Going forward, our existing board believes that attracting and retaining qualified non-employee directors will be critical to our future value, growth, and governance. Our supervisory board also believes that the compensation package for our non-employee directors should require a significant portion of the total compensation to be equity-based to align the interests of these directors with our stockholders. Following this offering, we expect that our supervisory board will share in that belief. We have reviewed with Meridian the non-employee director compensation paid by our peer group. Based on this review, following the consummation of this offering, we expect to implement an annual retainer compensation package for the non-employee directors valued at approximately $150,000, of which $50,000 would be paid in the form of an annual cash retainer, and the remaining $100,000 would be paid in a grant of restricted stock units under the LTIP. In addition, we expect to pay the audit committee chairman and each audit committee member an annual amount of $20,000 and $10,000, respectively. We currently expect to pay meeting fees in the amount of $1,500 for attendance at each board meeting.
Directors who are also our employees will not receive any additional compensation for their service on the supervisory board.
118
Table of Contents
Index to Financial Statements
CERTAIN RELATIONSHIPS AND RELATED PARTY TRANSACTIONS
The descriptions set forth below are qualified in their entirety by reference to the applicable agreements.
Limited Partnership Agreement of FICV
As a result of the transactions described in “Organizational Structure,” FINV will act as a holding company whose sole material assets will consist of indirect general and limited partnership interests in FICV. As the indirect sole shareholder of the general partner of FICV, FINV will be responsible for all operational, management and administrative decisions relating to FICV’s business and will consolidate the financial results of FICV and its subsidiaries.
FICV is a newly formed limited partnership that was formed to act as a holding company of various U.S. and foreign operating companies engaged in our business. Prior to this offering, our foreign operating companies have been owned directly or indirectly by FINV, and our U.S. operating companies have been owned directly or indirectly by Mosing Holdings, which is owned by members of the Mosing family. In connection with this offering, FINV will contribute all of our foreign operating subsidiaries and a portion of the proceeds from this offering to FICV, and Mosing Holdings will contribute all of our U.S. operating subsidiaries (excluding certain assets that generate a de minimis amount of revenue, including aircraft, real estate and life insurance policies) to FICV. We intend to enter into real estate lease agreements and an aviation services agreement with customary terms for continued use of the real estate and aircraft. See “—Transactions with Our Directors, Executive Officers and Affiliates.”
In exchange for this contribution (and after giving effect to this offering assuming the underwriters’ option to purchase additional shares of common stock is not exercised),
(i) FINV will (indirectly) hold a 73.7% limited partnership interest and a 0.1% general partnership interest in FICV; and
(ii) Mosing Holdings will hold a 26.2% limited partnership interest in FICV.
In accordance with the limited partnership agreement, net profits and net losses of FICV will be allocated to its members on a pro rata basis in accordance with their respective percentage of interest in FICV. Accordingly, net profits and net losses of FICV will initially be allocated, 73.8% to FINV (of which 73.7% relates to the limited partnership interest and 0.1% relates to the general partnership interest held indirectly by FINV) and 26.2% to Mosing Holdings (or 74.3% and 25.7%, respectively, if the underwriters’ option to purchase additional shares of common stock is exercised in full).
FINV will generally be subject to U.S. federal, state and local income taxes on its proportionate share of FICV’s taxable income attributable to U.S. operations. FINV may also incur U.S. branch profits tax on its proportionate share of FICV’s taxable income attributable to U.S. operations. The U.S. branch profits tax is imposed on a non-U.S. corporation’s “dividend equivalent amount,” which generally consists of the corporation’s after-tax earnings and profits (as determined under U.S. federal income tax principles) that are effectively connected with the corporation’s U.S. trade or business but are not reinvested in a U.S. business. The limited partnership agreement of FICV provides for distributions to be made at the discretion of the general partner on a pro rata basis to the holders of FICV interests for purposes of funding the holders’ tax obligations with respect to the income of FICV allocated to them. Generally, these tax distributions will be computed based on our estimate of the taxable income of FICV allocable to a holder of FICV interests multiplied by an assumed tax rate equal to the highest effective marginal combined U.S. federal, state and local income tax rate prescribed for an individual resident in Louisiana.
FINV’s articles of association and FICV’s limited partnership agreement will provide for customary mechanisms to ensure that (i) FINV’s percentage interest in FICV will always equal the percentage of the total number of outstanding shares of FINV Stock represented by our outstanding common stock and (ii) Mosing
119
Table of Contents
Index to Financial Statements
Holding’s (together with any permitted transferee’s) percentage interest in FICV will always equal the percentage of the total number of outstanding shares of FINV common stock represented by our outstanding Series A preferred stock. In this regard, the FICV limited partnership agreement will provide that at any time FINV issues a share of its common stock, the net proceeds received by FINV with respect to such share, if any, shall be concurrently transferred to FICV and FICV will issue to FINV an additional percentage interest in FICV such that FINV’s total interest in FICV will be equal to (i) the total number of shares of FINV common stock issued and outstanding divided by (ii) the total number of issued and outstanding FINV Stock, in each case taking into account the newly issued shares of common stock. Conversely, if at any time, any shares of common stock of FINV are redeemed, FICV shall, immediately prior to such redemption, redeem a proportionate percentage of interest in FICV held indirectly by FINV, upon the same terms and for the same price, as the shares of FINV common stock are redeemed.
Mosing Holdings (or any of its permitted transferees) will have the right to convert all or a portion of its Series A preferred stock into FINV common stock by delivery to FINV of an equivalent number of FICV Portions. In connection with such conversion, Mosing Holdings or its permitted transferees will also be entitled to receive an amount of cash equal to the par value of each share of Series A preferred stock so converted plus any accrued but unpaid dividends thereon.
The above mechanism is subject to customary conversion rate adjustments for stock splits, stock dividends and reclassifications.
The form of limited partnership agreement of FICV is filed as an exhibit to the registration statement of which this prospectus forms a part, and the foregoing description of the limited partnership agreement is qualified in its entirety by reference thereto.
Tax Receivable Agreement
As described in “—Limited Partnership Agreement of FICV,” in the future, Mosing Holdings and its permitted transferees may exchange their FICV Portions for cash accompanied by the conversion of such shares into shares of our common stock on a one-for-one basis, subject to customary conversion rate adjustments for stock splits, stock dividends and reclassifications and other similar transactions (the “Exchange”). FICV intends to make an election under Section 754 of the Code effective for each taxable year in which an Exchange occurs. Pursuant to the Section 754 election, each future Exchange is expected to result in an adjustment to the tax basis of the tangible and intangible assets of FICV, and these adjustments will be allocated to FINV. Certain of the adjustments to the tax basis of the tangible and intangible assets of FICV described above would not have been available absent these future Exchanges. The anticipated basis adjustments are expected to reduce the amount of tax that FINV would otherwise be required to pay in the future. These basis adjustments may also decrease gains (or increase losses) on future dispositions of certain capital assets to the extent tax basis is allocated to those capital assets.
FINV intends to enter into the tax receivable agreement with Mosing Holdings. This agreement generally will provide for the payment by FINV of 85% of actual reductions, if any, in payments of U.S. federal, state and local income tax or franchise tax (which reductions we refer to as “cash savings”) in periods after this offering as a result of (i) the basis increases resulting from the Exchanges and (ii) imputed interest deemed to be paid by FINV as a result of, and additional tax basis arising from, payments under the tax receivable agreement. In addition, the tax receivable agreement will provide for payment by FINV of interest earned from the due date (without extensions) of the corresponding tax return to the date of payment specified by the tax receivable agreement.
The payment obligations under the tax receivable agreement are FINV’s obligations and are not obligations of FICV. The term of the tax receivable agreement will commence upon the completion of this offering and will continue until all such tax benefits have been utilized or expired, unless FINV exercises its right to terminate the tax receivable agreement.
120
Table of Contents
Index to Financial Statements
Estimating the amount of payments that may be made under the tax receivable agreement is by its nature imprecise, insofar as the calculation of amounts payable depends on a variety of factors. The actual increase in tax basis, as well as the amount and timing of any payments under the tax receivable agreement, will vary depending upon a number of factors, including the timing of exchanges, the relative value of FINV’s U.S. and international assets at the time of the exchange, the price of FINV’s common stock at the time of the exchange, the extent to which such exchanges are taxable, the amount and timing of the taxable income FINV realizes in the future and the tax rate then applicable, FINV’s use of loss carryovers and the portion of its payments under the tax receivable agreement constituting imputed interest or depreciable or amortizable basis. FINV expects that the payments that it will be required to make under the tax receivable agreement will be substantial. There may be a substantial negative impact on our liquidity if, as a result of timing discrepancies or otherwise, (i) the payments under the tax receivable agreement exceed the actual benefits we realize in respect of the tax attributes subject to the tax receivable agreement and/or (ii) distributions to us by FICV are not sufficient to permit us to make payments under the tax receivable agreement subsequent to the payment of taxes and other obligations. The payments under the tax receivable agreement will not be conditioned upon a holder of rights under a tax receivable agreement having a continued ownership interest in either FICV or FINV.
The tax receivable agreement provides that we may terminate it early. If FINV elects to terminate the tax receivable agreement early, it would be required to make an immediate payment equal to the present value of the anticipated future tax benefits subject to the tax receivable agreement (based upon certain assumptions and deemed events set forth in the tax receivable agreement, including the assumption that it has sufficient taxable income to fully utilize such benefits and that any FICV interests that Mosing Holdings or its transferees own on the termination date are deemed to be exchanged on the termination date). Any early termination payment may be made significantly in advance of the actual realization, if any, of such future benefits. In addition, payments due under the tax receivable agreement will be similarly accelerated following certain mergers or other changes of control. In these situations, FINV’s obligations under the tax receivable agreement could have a substantial negative impact on FINV’s liquidity and could have the effect of delaying, deferring or preventing certain mergers, asset sales, other forms of business combinations or other changes of control.
Payments under the tax receivable agreement will be based on the tax reporting positions that FINV will determine. Although FINV is not aware of any issue that would cause the IRS to challenge a tax basis increase or other benefits arising under the tax receivable agreement, the holders of rights under the tax receivable agreement will not reimburse FINV for any payments previously made under the tax receivable agreement if such basis increases or other benefits are subsequently disallowed, except that excess payments made to any such holder will be netted against payments otherwise to be made, if any, to such holder after our determination of such excess. As a result, in such circumstances, FINV could make payments that are greater than our actual cash tax savings, if any, and may not be able to recoup those payments, which could adversely affect FINV’s liquidity.
Decisions made by Mosing Holdings and certain members of the Mosing family in the course of running our business, such as with respect to mergers, asset sales, other forms of business combinations or other changes in control, may influence the timing and amount of payments that are received by Mosing Holdings or its permitted transferees under the tax receivable agreement. For example, the earlier disposition of assets following an exchange or acquisition transaction will generally accelerate payments under the tax receivable agreement and increase the present value of such payments, and the disposition of assets before an exchange or acquisition transaction will increase Mosing Holdings tax liability without giving rise to any rights of Mosing Holdings to receive payments under the tax receivable agreement.
Payments under the tax receivable agreement, if any, will be made pro rata among all parties to the tax receivable agreement entitled to payments on an annual basis to the extent we have sufficient taxable income to utilize the increased tax benefits. The availability of sufficient taxable income to utilize the increased tax benefits will not be determined until such time as the financial results for the year in question are known and tax estimates prepared, which typically occurs within 90 days after the end of the applicable calendar year.
121
Table of Contents
Index to Financial Statements
Payments are generally due under the tax receivable agreement within five days following the determination of the applicable tax benefit, which generally is required to occur within 60 days of the filing of FINV’s tax return for the taxable year with respect to which the payment obligation arises, although interest on such payments will begin to accrue at a rate of interest equal to LIBOR plus 5% from the due date. Except in cases where FINV elects to terminate the tax receivable agreement early, the tax receivable agreement is terminated early due to certain mergers or other changes of control or FINV has available cash but fails to make payments when due, generally FINV may elect to defer payments under the tax receivable agreement if it does not have available cash to satisfy its payment obligations under the tax receivable agreement or if FINV’s contractual obligations limit its ability to make these payments. Any such deferred payments would accrue interest at a rate of interest equal to LIBOR plus 5%. FINV has no present intention to defer payments under the tax receivable agreement.
Because FINV is a holding company with no operations of its own, its ability to make payments under the tax receivable agreement is dependent on the ability of FICV to make distributions to it in an amount sufficient to cover FINV’s obligations under such agreements; this ability, in turn, may depend on the ability of FICV’s subsidiaries to provide payments to it. The ability of FICV and its subsidiaries to make such distributions will be subject to, among other things, the applicable provisions of Dutch law that may limit the amount of funds available for distribution and restrictions in our debt instruments. To the extent that FINV is unable to make payments under the tax receivable agreement for any reason, such payments will be deferred and will accrue interest until paid, and FINV will be prohibited from paying dividends on its common stock.
The form of the tax receivable agreement is filed as an exhibit to the registration statement of which this prospectus forms a part, and the foregoing description of the tax receivable agreement is qualified by reference thereto.
FICV Management Agreement
We will enter into an FICV management agreement with Frank’s International LP B.V., Frank’s International Management B.V. and Mosing Holdings, which constitute the partners in FICV, with respect to the operation and management of FICV in order to facilitate the activities of FINV as a publicly traded company. The FICV management agreement provides for the consent of the FICV partners to facilitate (i) FINV’s percentage interest in FICV remaining equal to the percentage of the total number of outstanding shares of FINV Stock represented by our outstanding common stock and (ii) Mosing Holdings’ (together with any permitted transferee’s) percentage interest in FICV remaining equal to the percentage of the total number of outstanding shares of FINV Stock represented by our outstanding Series A preferred stock. Please see “—Limited Partnership Agreement of FICV.”
The form of FICV management agreement is filed as an exhibit to the registration statement of which this prospectus forms a part, and the foregoing description of the FICV management agreement is qualified in its entirety by reference thereto.
Transactions with Our Directors, Executive Officers and Affiliates
In connection with the reorganization described in “Organizational Structure,” Mosing Holdings will cause our U.S. operating subsidiaries to distribute certain assets that generate a de minimis amount of revenue, including aircraft, real estate and life insurance policies. Accordingly, these assets will not be contributed to FICV in connection with the reorganization. As a result, we intend to enter into real estate lease agreements with customary terms for continued use of the real estate, under which we will incur additional rental expense of approximately $3.8 million per year. In addition, we will enter into an aviation services agreement with customary terms for continued use of the aircraft, under which we will incur additional charter service expense of approximately $1.1 million per year.
We have engaged in transactions with certain of our directors, executive officers and affiliates. In 2012, we made distributions of two promissory notes to Ginsoma C.V. (“Ginsoma”) and FWW, which are entities
122
Table of Contents
Index to Financial Statements
controlled by the Mosing family, in an aggregate amount of $484.0 million. Subsequent to its issuance, the promissory note payable to Ginsoma was assigned to FWW. As of December 31, 2012 and March 31, 2013, there was an aggregate of approximately $464.0 million and $443.7 million, respectively, outstanding under the notes payable to FWW. Interest is charged on the notes at the applicable short-term monthly applicable federal rate as published by the Internal Revenue Service. The notes payable to FWW bore interest at a rate of 0.24% per annum as of March 31, 2013. As of December 31, 2012 and March 31, 2013, $320.0 million is included in current portion of notes payable to affiliates because it is due on demand and $144.0 million and $123.7 million, respectively, is included in notes payable to affiliates on the combined balance sheets. During the year ended December 31, 2012, we made payments of approximately $58.0 million, which consisted of $57.4 million in principal and $0.6 million in interest. Subsequent to March 31, 2013, we made a payment of approximately $28.5 million to reduce the amount outstanding under the notes payable. We intend to use a portion of the net proceeds from this offering to repay in full these outstanding notes payable.
In addition, in 2012, we issued a note payable to our chief executive officer, in an amount of $2.88 million in connection with a deferred bonus payment. As of December 31, 2012 and March 31, 2013, there was $2.88 million outstanding under the note payable. We made no payments of principal or interest under the note payable during the year ended December 31, 2012. As of March 31, 2013, the note payable bore interest at a rate of 3.5% per annum and matures in September 2013.
In 2011, we issued various notes payable to certain members of the Mosing family in connection with our purchase of aircraft. The table below presents information regarding these notes payable:
| Related Party |
Note Payable Amount |
Amount Outstanding at December 31, 2012 |
Amount Outstanding at March 31, 2013 |
Payments Made During the Year Ended December 31, 2012 |
||||||||||||||||||||
| Principal | Interest | Total | ||||||||||||||||||||||
| Donald Keith Mosing – chief executive officer |
$ | 1,000,000 | $ | 772,881 | $ | 725,732 | $ | 182,822 | $ | 43,633 | $ | 226,455 | ||||||||||||
| William B. Mosing – sibling of our chief executive officer |
1,000,000 | 772,881 | 725,732 | 182,822 | 43,633 | 226,455 | ||||||||||||||||||
| Gregory S. Mosing – sibling of our chief executive officer |
500,000 | 386,440 | 362,866 | 91,411 | 21,817 | 113,228 | ||||||||||||||||||
| Sharon M. Miller – cousin of our chief executive officer |
500,000 | 386,440 | 362,866 | 91,411 | 21,817 | 113,228 | ||||||||||||||||||
| Alice M. Mosing – spouse of our chief executive officer |
100,000 | 77,288 | 72,573 | 18,282 | 4,363 | 22,645 | ||||||||||||||||||
|
|
|
|
|
|
|
|
|
|
|
|
|
|||||||||||||
| Total |
$ | 3,100,000 | $ | 2,395,930 | $ | 2,249,769 | $ | 566,748 | $ | 135,263 | $ | 702,011 | ||||||||||||
|
|
|
|
|
|
|
|
|
|
|
|
|
|||||||||||||
As of March 31, 2013, each of the notes payable bore interest at a rate 5.0% per annum and each of the notes payable matures in 2016.
We have entered into various operating leases with Mosing Land & Cattle Company of Texas, LLC, Mosing Properties LP, and Western Airways, Inc., each of which are entities owned by our chief executive officer and certain other members of the Mosing family to lease office space and aircraft from such entities. Rent expense related to these leases was $2.8 million, $2.8 million and $3.0 million for the years ended December 31, 2010, 2011 and 2012, respectively and $0.7 million and $0.8 million for the three months ended March 31, 2012 and 2013, respectively. The expiration date of the operating leases currently in place ranges from 2013 to 2017, unless otherwise extended.
123
Table of Contents
Index to Financial Statements
As of December 31, 2012 and March 31, 2013, subsidiaries of Mosing Holdings, which will be a significant shareholder following this offering, had receivables totaling $5.6 million and $5.8 million, respectively, due from our chief executive officer and certain members of the Mosing family relating to amounts owed to such subsidiaries for split-dollar life insurance policy premiums that they maintain. The table below presents additional information regarding the split-dollar life insurance policy premiums:
| Related Party |
Amount Outstanding at December 31, 2012 |
Amount Outstanding at March 31, 2013 |
||||||
| Donald Keith Mosing – chief executive officer |
$ | 1,054,866 | $ | 1,054,866 | ||||
| William B. Mosing – sibling of our chief executive officer |
1,055,584 | 1,055,584 | ||||||
| Gregory S. Mosing – sibling of our chief executive officer |
418,200 | 418,200 | ||||||
| Alice M. Mosing – spouse of our chief executive officer |
504,681 | 504,681 | ||||||
| Kirkland D. Mosing – cousin of our chief executive officer and Supervisory Director Nominee |
377,647 | 440,588 | ||||||
| Steven B. Mosing – cousin of our chief executive officer and Supervisory Director Nominee |
600,000 | 600,000 | ||||||
|
|
|
|
|
|||||
| Total |
$ | 4,010,978 | $ | 4,073,919 | ||||
|
|
|
|
|
|||||
The receivables will be collected either directly from the executive officer, if employment terminates other than by death, or from the executive officer’s beneficiary, if employment terminates due to death of the executive officer.
In 2012, we received a death benefit payment of $4.9 million related to the passing of Larry Mosing, our chief executive officer’s uncle. In connection with the reorganization described in “Organizational Structure,” Mosing Holdings will cause our U.S. operating subsidiaries to distribute these split-dollar life insurance policies and the associated accounts receivable, such that they will not be contributed to FICV. Accordingly, upon completion of this offering, we will no longer maintain or record receivables related to these split-dollar life insurance policies.
In June 2013, Mosing Holdings made a distribution in an aggregate amount of $46.5 million to its owners.
Registration Rights Agreement
Mosing Holdings and FWW and certain of their transferees will enter into a registration rights agreement with FINV. The registration rights agreement will cover all 52,976,000 shares of Series A preferred stock and 119,024,000 shares of common stock owned by Mosing Holdings and FWW, respectively. Pursuant to this agreement, the parties to the agreement may cause FINV to register their shares of common stock under the Securities Act and to maintain a shelf registration statement effective with respect to such shares.
The form of registration rights agreement is filed as an exhibit to the registration statement of which this prospectus forms a part, and the foregoing description of the registration rights agreement is qualified by reference thereto.
Voting Agreement
Mosing Holdings, FWW and certain members of the Mosing family will enter into a voting agreement pursuant to which each shareholder will agree to vote all of their shares of common stock and Series A preferred stock for the election of directors in the manner specified by a designated shareholder representative, which will initially be Keith Mosing, our chief executive officer.
The form of voting agreement is filed as an exhibit to the registration statement of which this prospectus forms a part, and the foregoing description of the voting agreement is qualified by reference thereto.
124
Table of Contents
Index to Financial Statements
Procedures for Approval of Related Person Transactions
A “Related Party Transaction” is a transaction, arrangement or relationship in which we or any of our subsidiaries was, is or will be a participant, the amount of which involved exceeds $120,000, and in which any related person had, has or will have a direct or indirect material interest. A “Related Person” means:
| • | any person who is, or at any time during the applicable period was, one of our executive officers or one of our directors; |
| • | any person who is known by us to be the beneficial owner of more than 5% of our common stock; |
| • | any immediate family member of any of the foregoing persons, which means any child, stepchild, parent, stepparent, spouse, sibling, mother-in-law, father-in-law, son-in-law, daughter-in-law, brother-in-law or sister-in-law of a director, executive officer or a beneficial owner of more than 5% of our common stock, and any person (other than a tenant or employee) sharing the household of such director, executive officer or beneficial owner of more than 5% of our common stock; and |
| • | any firm, corporation or other entity in which any of the foregoing persons is a partner or principal or in a similar position or in which such person has a 10% or greater beneficial ownership interest. |
Our supervisory board intends to adopt a written related party transactions policy prior to the completion of this offering. Pursuant to this policy, the audit committee will review all material facts of all Related Party Transactions and either approve or disapprove entry into the Related Party Transaction, subject to certain limited exceptions. In determining whether to approve or disapprove entry into a Related Party Transaction, the audit committee expects to take into account, among other factors, the following: (1) whether the Related Party Transaction is on terms no less favorable than terms generally available to an unaffiliated third party under the same or similar circumstances and (2) the extent of the Related Person’s interest in the transaction. Further, the policy would require that all Related Party Transactions required to be disclosed in our filings with the SEC be so disclosed in accordance with applicable laws, rules and regulations.
125
Table of Contents
Index to Financial Statements
The following table sets forth information with respect to the beneficial ownership of our common stock and Series A preferred stock by:
| • | each person known to us to beneficially own more than 5% of our common stock or our Series A preferred stock; |
| • | each of our named executive officers; |
| • | each member of our supervisory board and management board and any director nominees; and |
| • | all of our directors and executive officers as a group. |
The number of shares of our common stock and Series A preferred stock outstanding and the percentage of beneficial ownership before and after the consummation of the offering set forth below is presented as of July 26, 2013, after giving effect to the reorganization as described in “Organizational Structure.”
Beneficial ownership is determined in accordance with the rules of the SEC. These rules generally attribute beneficial ownership of securities to persons who possess sole or shared voting power or investment power with respect to such securities. Except as otherwise indicated, the persons or entities listed below have sole voting and investment power with respect to all shares of our common stock beneficially owned by them, except to the extent this power may be shared with a spouse. All information with respect to beneficial ownership has been furnished by the respective directors, executive officers, or 5% or more stockholders, as the case may be.
Unless otherwise indicated by us, the address of each person or entity named in the table is 10260 Westheimer Rd., Houston, Texas 77042.
| Name of Beneficial Owner |
Common Stock to be Beneficially Owned(1) |
Series A Preferred Stock to be Beneficially Owned(2) |
Percentage of Total FINV Stock to be Beneficially Owned(4) |
|||||||||||||||||
| Number | %(3) | Number | %(3) | |||||||||||||||||
| 5% shareholders: |
||||||||||||||||||||
| FWW B.V. (5)(6) |
119,024,000 | 79.9 | % | — | — | % | 58.9 | % | ||||||||||||
| Mosing Holdings, Inc. (5)(7) |
— | — | % | 52,976,000 | 100.0 | % | 26.2 | % | ||||||||||||
| Directors and Named Executive Officers: |
||||||||||||||||||||
| Donald Keith Mosing (5)(6)(7)(8) |
119,024,000 | 79.9 | % | 52,976,000 | 100.0 | % | 85.1 | % | ||||||||||||
| Sheldon Erikson |
— | — | % | — | — | % | — | % | ||||||||||||
| Kirkland D. Mosing (7) |
— | — | % | — | — | % | — | % | ||||||||||||
| Steven B. Mosing (7) |
— | — | % | — | — | % | — | % | ||||||||||||
| Frank’s International Management B.V. (8) |
— | — | % | — | — | % | — | % | ||||||||||||
| Mark G. Margavio (9) |
— | — | % | — | — | % | — | % | ||||||||||||
| W. John Walker (9) |
— | — | % | — | — | % | — | % | ||||||||||||
| Robert R. Gilbert (9) |
— | — | % | — | — | % | — | % | ||||||||||||
| C. Michael Webre (9) |
— | — | % | — | — | % | — | % | ||||||||||||
| All directors, director nominees and executive officers as a group (10 persons) (9) |
119,024,000 | 79.9 | % | 52,976,000 | 100.0 | % | 85.1 | % | ||||||||||||
| * | Represents less than 1%. |
| (1) | Excludes shares of common stock that may be deemed to be beneficially owned by such persons due to their beneficial ownership of shares of Series A preferred stock, which are convertible into an equivalent number of shares of common stock. See “Description of Capital Stock—Conversion Right.” |
| (2) | Each share of Series A preferred stock will entitle its holder to vote together with the common stock as a single class on all matters presented to FINV’s shareholders for their vote. |
| (3) | Assumes no exercise of the underwriters’ option to purchase an additional 4,500,000 shares of common stock. |
126
Table of Contents
Index to Financial Statements
| (4) | Represents percentage of voting power of our common stock and Series A preferred stock voting together as a single class. |
| (5) | Pursuant to a voting agreement that will be entered into among Mosing Holdings, FWW B.V. and certain members of the Mosing family, the shareholders party to the agreement will agree to vote all of their shares of common stock and Series A preferred stock for the election of directors in the manner specified by a designated shareholder representative, which will initially be Mr. Mosing. As such, Mr. Mosing is entitled to vote on decisions to vote, or to direct the voting of, the shares of common stock held by FWW B.V. and Mosing Holdings. Mr. Mosing disclaims beneficial ownership of such shares except to the extent of his pecuniary interest. |
Excludes a grant of restricted stock units representing an aggregate of 1,250,000 shares of common stock (based upon the midpoint of the price range set forth on the cover page of this prospectus) that will be made to Mr. Mosing concurrently with this offering. The restricted stock units began vesting (and shares of common stock will be issued) one year from the date of grant. See “Compensation Discussion and Analysis—Components of Our Executive Compensation Program—Long-Term Incentive Plan.”
| (6) | FWW B.V. is a Dutch company with limited liability. FWW B.V. is controlled by two managing directors, including Donald Keith Mosing and Intertrust (Netherlands) B.V., a corporate service provider. The address of FWW B.V. is Prins Bernhardplein 200, 1097 JB Amsterdam, The Netherlands. |
| (7) | Mosing Holdings, Inc. is a Delaware corporation owned by the Mosing Family. Mosing Holdings, Inc. is controlled by three directors, including Donald Keith Mosing, Kirkland D. Mosing and Steven B. Mosing. None of the three directors individually has the power to vote, dispose or direct the disposition of, the shares of common stock held by Mosing Holdings as a result of their directorship. |
| (8) | Frank’s International Management B.V., a wholly owned subsidiary and the sole member of our management board, is controlled by two managing directors, including Donald Keith Mosing. The address of Frank’s International Management B.V. is Prins Bernhardplein 200, 1097 JB Amsterdam, The Netherlands. |
| (9) | Excludes a grant of restricted stock units representing an aggregate of 875,000 shares of common stock (based upon the midpoint of the price range set forth on the cover page of this prospectus) that will be made to our executive officers and certain other officers concurrently with this offering. The restricted stock units begin vesting (and shares of common stock will be issued) one year from the date of grant. See “Compensation Discussion and Analysis—Components of Our Executive Compensation Program—Long-Term Incentive Plan.” |
127
Table of Contents
Index to Financial Statements
The material provisions of our articles of association to be amended and restated prior to the closing of this offering and particular provisions of Dutch law relevant to our statutory existence and the Dutch Corporate Governance Code are summarized below. This summary does not restate our articles of association or relevant Dutch law in their entirety. While we believe that this summary contains all of the information about the articles of association important to your decision to subscribe for the common shares, it does not include all of the provisions that you may feel are important. The articles of association, and not this summary, will define your rights as a holder of shares of our common stock.
Authorized Capital
Our articles of association will authorize up to two classes of shares of capital stock, consisting of our common stock and our Series A preferred stock. Following the completion of this offering (assuming that the underwriters’ option to purchase additional shares of our common stock is not exercised), our authorized capital stock will consist of 745,120,000 shares, divided into:
| Series |
Nominal Value per Share |
Number of Shares Authorized |
Number of Shares Outstanding |
|||||||||
| Common stock |
€ | 0.01 | 745,120,000 | 149,024,000 | ||||||||
| Series A preferred stock |
€ | 0.01 | 52,976,000 | 52,976,000 | ||||||||
Following the completion of this offering, all of our shares of Series A preferred stock will be held by Mosing Holdings, Inc.
Under Dutch law, our authorized capital stock is the maximum capital that we may issue without amending our articles of association. An amendment of our articles of association would require a resolution from the general meeting of shareholders.
Our articles of association are registered at the Trade Register in Amsterdam, and an English translation has been filed with the SEC as an exhibit to the registration statement of which this prospectus forms a part. Our file number with the Trade Register is 34241787.
Issuance of Capital Stock
Under Dutch law, we may only issue capital stock pursuant to a resolution of the general meeting of shareholders, unless another corporate body has been designated to do so by a resolution of the general meeting of shareholders or by our articles of association.
Our management board will be designated by the articles of association for a period of five years from the closing of this offering to issue shares and grant rights to subscribe for shares up to the amount of unissued shares in our authorized capital stock, subject to the approval of our supervisory board. The designation may be extended from time to time, with periods not exceeding five years, by a resolution of the general meeting of shareholders adopted with a simple majority. If authority is not delegated to another corporate body, the general meeting of shareholders may only decide to issue shares and grant rights to subscribe for shares at the proposal of the supervisory board.
Pre-Emptive Rights
Under Dutch law, in the event of an issuance of shares of common stock, each holder of common stock will have a pro rata preemptive right based on the number of shares of common stock held by such shareholder. Preemptive rights do not apply with respect to the issuance of preferred stock, or to shares of common stock issued against contributions other than in cash or shares of common stock issued to our employees or the
128
Table of Contents
Index to Financial Statements
employees of one of our group companies. Our management board will be authorized by the articles of association for a period of five years from the date of the offering to limit or exclude any pre-emptive rights to which shareholders may be entitled in connection with the issuance of shares, subject to the approval of our supervisory board. The above authority to limit or exclude pre-emptive rights can only be exercised if at that time the authority to issue shares is in full force and effect. The authority to limit or exclude pre-emptive rights may be extended from time to time, with periods not exceeding five years, by a resolution of the general meeting of shareholders adopted with a simple majority. If authority is not delegated to another corporate body, the general meeting of shareholders may only decide to limit or exclude pre-emptive rights at the proposal of the management board, which proposal shall be approved by our supervisory board.
Repurchase of Shares of Capital Stock
Under Dutch law, a public company with limited liability (naamloze vennootschap) may acquire its own shares, subject to certain provisions of Dutch law and the articles of association. We may acquire our own shares either without paying any consideration, or in the event any consideration must be paid only if (i) our shareholders’ equity less the acquisition price is not less than the sum of paid-up and called-up capital and any reserve required to be maintained by law or our articles of association, (ii) we and our subsidiaries would not thereafter hold or hold shares as a pledgee with an aggregate par value exceeding 50% of our issued capital stock and (iii) the general meeting of shareholders has authorized the management board to effect such acquisitions, subject to the approval of our supervisory board. Our shareholders will authorize the acquisition of our own shares up to the maximum number allowed under Dutch law for a period of 18 months from the date of the offering for a price per share between $0.01 and 120% of the price on the NYSE at the close of the business day prior to the day of the repurchase for the shares of common stock and for a price per share between $0.01 and 120% of the amount paid up on such shares for the Series A preferred stock.
Conversion Right
For purposes of any transfer or conversion of Series A preferred stock and limited partnership interests in FICV, our articles of association and the partnership agreement of FICV contain provisions linking each share of Series A preferred stock to a proportionate portion of the holder’s limited partnership interest in FICV, which portion at any time will equal the holder’s total limited partnership interest in FICV divided by the total number of issued and outstanding shares of Series A preferred stock of FINV (each such portion being referred to as an “FICV Portion”). Shares of Series A preferred stock cannot be transferred unless simultaneously with an equal number of FICV Portions and vice versa.
Holders of our Series A preferred stock will have the right to convert all or a portion of their Series A preferred stock into FINV common stock by delivery to FINV of an equivalent number of FICV Portions. In connection with such conversion, Mosing Holdings or its permitted transferees will also be entitled to receive an amount of cash equal to the par value of each share of Series A preferred stock so converted plus any accrued but unpaid dividends thereon.
The above mechanism is subject to customary conversion rate adjustments for stock splits, stock dividends and reclassifications.
Capital Reduction
Subject to Dutch law and our articles of association, pursuant to a proposal of the management board, which proposal shall be approved by our supervisory board, the general meeting of shareholders may resolve to reduce the outstanding capital stock by cancellation of shares or by reducing the nominal value of the shares by means of an amendment to our articles of association. Dutch law requires that this resolution be adopted by an absolute majority of votes cast, or by a two-thirds majority of the votes cast, if less than half of the issued capital stock is present or represented at the meeting.
129
Table of Contents
Index to Financial Statements
Dividends
Following the completion of this offering, we intend to pay a regular quarterly dividend on our common stock of $0.075 per share, or an aggregate of approximately $44.7 million in the aggregate on an annual basis. However, our future dividend policy is within the discretion of our management board, with the approval of our supervisory board, and will depend upon various factors, including our results of operations, financial condition, capital requirements and investment opportunities. No dividends on our common stock will accrue in arrears. In addition, each share of Series A preferred stock will have a liquidation preference equal to its par value of €0.01 per share and will be entitled to an annual dividend equal to 0.25% of its par value. Based upon the number of Series A preferred shares outstanding upon completion of this offering, this amount would be €1,324 in the aggregate. We will only be able to pay dividends from our available cash on hand and funds received from FICV. FICV’s ability to make distributions to us will depend on many factors, including the performance of our business in the future. In order to make these distributions on our common stock and Series A preferred stock, we expect that FICV will be required to distribute approximately $60.6 million pro rata to holders of FICV interests. This aggregate amount would have represented approximately 20.6% of our pro forma net income and 13.6% of our pro forma Adjusted EBITDA for the year ended December 31, 2012. See “Dividend Policy” and “Management’s Discussion and Analysis of Financial Condition and Results of Operations—Liquidity and Capital Resources—Liquidity.”
Subject to certain exceptions, Dutch law provides that dividends may only be paid out of profits as shown in our annual financial statements as adopted by the general meeting of shareholders. Moreover, dividends may be distributed only to the extent the shareholders’ equity exceeds the sum of the amount of paid-up capital and any reserves that must be maintained under the law or our articles of association. Interim dividends may be declared as provided in the articles of association and may be distributed to the extent that the shareholders’ equity exceeds the amount of the paid-up capital plus any reserves that must be maintained under the law or the articles of association as apparent from a statement of assets and liabilities prepared on the basis of generally accepted accounting principles. Interim dividends should be regarded as advances on the final dividend that a company intends to declare with respect to the ongoing financial year or—if the annual accounts have not yet been adopted—the previous financial year.
Should it be determined that any distribution made was not permitted, the shareholders or any other person entitled to profits must repay the dividends declared to the extent such shareholder or person was or ought to have been aware that the distribution was not permitted.
Pursuant to our articles of association, the management board, subject to the approval of our supervisory board, will decide what portion of our profit is to be held as reserves. Holders of our common stock are not entitled to any dividends unless declared by our management board.
General Meeting of Shareholders
Procedures and Admissions
Pursuant to our articles of association, general meetings of shareholders will be held in Amsterdam, The Netherlands in the municipality in which the company has its statutory seat, or at Schiphol (Municipality of Haarlemmermeer). A general meeting of shareholders shall be held at least once a year within the period required by Dutch law, which is currently no later than six months after the end of our financial year, unless our articles of association provide for a shorter period.
Extraordinary general meetings of shareholders shall be held as frequently as needed; however they must be convened by the management board and/or the supervisory board. Our management board and/or the supervisory board must give public notice of a general meeting of shareholders or an extraordinary meeting of shareholders, by at least such number of days prior to the day of the meeting as required by Dutch law, which is currently fifteen days.
130
Table of Contents
Index to Financial Statements
The agenda for a meeting of shareholders must contain such items as the management board, supervisory board or the person or persons convening the meeting determine. The agenda shall also include any matter, the consideration of which has been requested by one or more shareholders, representing alone or jointly with others at least such percentage of the issued capital stock as determined by Dutch law, which is currently set at one percent, or a value of at least €50 million. The request to consider such matter should have been received by us no later than on the 60th day prior to the day of the meeting accompanied by a statement containing the reasons for the request.
The agenda for the annual general meeting of shareholders shall contain, among other items, items placed on the agenda in accordance with Dutch law and our articles of association, the consideration of the annual report, the discussion and adoption of our annual accounts, our policy regarding dividends and reserves and the proposal to pay a dividend (if applicable), proposals relating to the composition of the management board and supervisory board, including the filling of any vacancies on those boards, the proposals placed on the agenda by those boards, including but not limited to a proposal to grant discharge to the members of the management board for their management and the supervisory board for their supervision during the financial year, together with the items proposed by shareholders in accordance with provisions of Dutch law and our articles of association.
Shareholders are entitled to attend our general meeting of shareholders, to address the general meeting of shareholders and to vote, either in person or represented by a person holding a written proxy. The requirement that a proxy must be in written form is also fulfilled when it is recorded electronically.
The holder of a right of usufruct or a pledgee with voting rights is entitled to request an item to be placed on the agenda of the general meeting of shareholders, to attend the general meeting of shareholders, to address the general meeting of shareholders and to vote.
Under Dutch law, shareholders’ resolutions may be adopted in writing without holding a meeting of shareholders, provided that (i) the articles of association explicitly allow such practice, (ii) all shareholders agree on this practice for decision making and (ii) all shareholders are in favor of the resolution to be adopted. Our articles of association, however, will not provide for shareholder action by written consent as it is not practicable for a listed company.
Members of the management board and supervisory board are authorized to attend general meetings of shareholders. They have an advisory vote. The general meeting of shareholders is presided over by the chairman. In the absence of the chairman, one of the other supervisory directors presides over the meeting.
Voting Rights
Under Dutch law, each share of common stock confers the right to cast one vote at the general meeting of shareholders. Each shareholder may cast as many votes as it holds shares. Pursuant to our articles of association, each share (whether common or preferred) will confer the right to cast one vote. Following the completion of this offering, the holders of our common stock and our Series A preferred stock will vote together as a single class on matters presented to the shareholders. Resolutions by the general meeting of shareholders must be adopted by an absolute majority of votes cast, unless another standard of votes and / or a quorum is required by virtue of Dutch law or our articles of association. There is no required quorum under Dutch law for shareholder action at a properly convened shareholder meeting, except in specific instances prescribed by Dutch law or our articles of association.
Each shareholder has the right to participate in, address and exercise its right to vote at the general meeting of shareholders in person or by written proxy or by electronic means of communication, subject to certain conditions for the use of electronic means of voting set by or pursuant to the articles of association.
No votes may be cast at a general meeting of shareholders on the shares held by us or our subsidiaries. Nonetheless, the holders of a right of usufruct and the holders of a right of pledge in respect of the shares held by
131
Table of Contents
Index to Financial Statements
us or our subsidiaries in our capital stock are not excluded from the right to vote on such shares, if the right of usufruct or the right of pledge was granted prior to the time such shares were acquired by us or any of our subsidiaries. Neither we nor our subsidiaries may cast votes in respect of a share on which we or such subsidiary holds a right of usufruct or a right of pledge.
Under Dutch law, our management board is not required to set a record date for a general meeting to determine those shareholders that are entitled to vote at the general meeting. If our management board determines in the future to include a record date in a notice for convening a general meeting, Dutch law requires that the record date be on the 28th day prior to the date of the general meeting. Shareholders as of the record date shall be deemed entitled to attend and to vote at the general meeting. There is no specific provision in Dutch law relating to adjournment of the general meeting of shareholders.
Nomination Right
Pursuant to our amended and restated articles of association, our supervisory board will consist of up to nine members. The Mosing family will have the right to recommend one director for nomination to the supervisory board for each 10% of our outstanding common stock they collectively beneficially own, up to a maximum of five directors. Our supervisory board will nominate the remaining directors.
Shareholder Vote on Certain Reorganizations
Under Dutch law, the approval of our general meeting of shareholders is required for any significant change in the identity of us or our business.
Appraisal Rights
Subject to certain exceptions, Dutch law does not recognize the concept of appraisal or dissenters’ rights.
Anti-Takeover Provisions
Under Dutch law, protective measures against takeovers are possible and permissible, within the boundaries set by Dutch law and Dutch case law.
The following resolutions and provisions of our articles of association may have the effect of making a takeover of our company more difficult or less attractive, including:
| • | our management board, subject to the approval of our supervisory board, will be designated to issue shares and grant rights to subscribe for shares in the form of common or preferred stock, up to the amount of our authorized capital stock and to limit or exclude pre-emptive rights on shares, both for a period of five years from the date of the offering; and |
| • | shareholder action by written consent will not be permitted, thereby requiring all shareholder actions to be taken at a general meeting of shareholders. |
As described above, we have adopted an anti-takeover measure providing our management board, subject to the approval of our supervisory board, with the ability to issue, without shareholder approval, preferred stock or to grant a foundation to be established the right to subscribe to preferred stock, up to a maximum equal to 100% of issued capital, other than such preferred stock, at the time of issue of the preferred stock. Preferred stock is a separate class of our equity securities. The price that will be due by the foundation for these preferred shares should equal their nominal value. It is permitted that a maximum of to 75% of the nominal value of the shares shall be paid up upon our request. As voting rights in us relate to nominal value, and common stock tends to be issued or traded against an amount (potentially significantly) in excess of nominal value, preferred stock issued against nominal value or less will have significant relative voting power. The preferred stock can accordingly be used as a defensive measure. These shares would typically have both a liquidation and dividend preferred over
132
Table of Contents
Index to Financial Statements
the common stock and the Series A preferred stock and otherwise accrue cash dividends at a fixed rate. Our management board, subject to the approval of our supervisory board, is authorized by our shareholders to issue these shares in the future in order to protect us from influences that do not serve our best interests and that threaten to undermine our continuity, independence and identity. These influences may result from a third party acquiring a significant amount of our shares of common stock, the announcement of a public offer or other concentration of control or any other form of unreasonable pressure exercised on us to amend our strategic polices. If it is determined to issue the preferred stock to such a foundation, the foundation’s articles of association will provide that it shall endeavor to serve our best interests, our associated business and all parties connected to us, warding off as much as possible any influences that conflict with these interests and threaten to undermine our continuity, independence and identity. This foundation shall operate independently of us.
Subject to the limits of NYSE listing rules, the preferred stock described above would vote together with the shares of common stock and the Series A preferred stock on matters submitted to shareholders for approval and have the same number of votes per share as the number of shares of common stock and the Series A preferred stock with a nominal value which in the aggregate equals the nominal value of such a preferred share. By issuing the preferred stock in the appropriate number, this antitakeover measure may result in the holders of such preferred stock having voting power equal to all issued shares of common stock and Series A preferred stock. This anti-takeover measure can be used to provide time for our management board and supervisory board to negotiate the terms of a possible transaction that is in the best interest of all our stakeholders. In the event of a hostile takeover bid, in general, our management board and supervisory board still have the duty to act in the interest of our company and all its stakeholders.
Inspection of Books and Records
The management board provides all information required by Dutch law at the general meeting of shareholders and makes the information available to individual shareholders at the office of the company with copies available upon request. The part of our shareholders’ register kept in The Netherlands is available for inspection by the shareholders.
Amendment of the Articles of Association
The general meeting of shareholders will be able to effect an amendment of the articles of association only upon a proposal of our management board, which proposal shall be approved by our supervisory board. A proposal to amend the articles of association whereby any change would be made in the rights which vest in the holders of shares in a specific class in their capacity as such, shall require the prior approval of the meeting of the holders of the shares of that specific class.
Dissolution, Merger or Demerger
The general meeting of shareholders will only be able to effect a dissolution of the company. The liquidation of the company shall be carried out by the managing directors under the supervision of the supervisory board, if and to the extent the general meeting of shareholders has not appointed one or more other liquidators.
Under Dutch law, a resolution for a legal merger (juridische fusie) or legal demerger (juridische splitsing) is adopted in the same manner as a resolution to amend the articles of association. The general meeting of shareholders may, in accordance with the relevant merger proposal by the management board, adopt a resolution for a legal merger or legal demerger by an absolute majority of the votes cast, unless less than half of the issued capital stock is present or represented at the meeting, in which case a two-thirds majority is required.
133
Table of Contents
Index to Financial Statements
Shareholder Suits
If a third party is liable to a Dutch company, under Dutch law generally shareholders do not have the right to bring an action on behalf of the company or bring an action on their own behalf to recover damages sustained as a result of a decrease in value, or loss of an increase in value, of their stock. Only in the event that the cause for the liability of such third party to the company also constitutes a tortious act directly against such shareholder and the damages sustained are permanent may that shareholder have an individual right of action against such third party on its own behalf to recover such damages. The Dutch Civil Code provides for the possibility to initiate such actions collectively. A foundation or an association whose objective, as stated in its articles of association, is to protect the rights of a group of persons having similar interests may institute a collective action. The collective action cannot result in an order for payment of monetary damages but may result in a declaratory judgment (verklaring voor recht), for example, declaring that a party has acted wrongfully or has breached fiduciary duty. The foundation or association and the defendant are permitted to reach (often on the basis of such declaratory judgment) a settlement, which provides for monetary compensation of damages. A designated Dutch court may declare the settlement agreement binding upon all the injured parties whereby an individual injured party will have the choice to opt-out within the term set by the court (at least three months). Such individual injured party may also individually institute a civil claim for damages within the aforementioned term.
Squeeze-Out
Under Dutch law, a shareholder who holds at least 95% of our issued capital for its own account may institute proceedings against the other shareholders jointly for the transfer of their shares to the shareholder. The proceedings are held before the Enterprise Division (Ondernemingskamer) of the Court of Appeal in Amsterdam, which may award the claim for squeeze-out in relation to all minority shareholders and will determine the price to be paid for the shares, if necessary after appointment of one or three experts who will render an opinion to the Enterprise Chamber on the value of the shares. The court shall disallow the proceedings against all other defendants if (i) notwithstanding compensation, a defendant would sustain serious tangible loss by the transfer; (ii) the defendant is the holder of a share in which a special right of control of the company is vested under the articles of association; or (iii) a claimant has, as against a defendant, renounced his power to institute such proceedings. Once the order for transfer has become final, the acquirer must give written notice of the price and the date on which and the place where the price is payable to the minority shareholders whose addresses are known to the acquirer. Unless all addresses are known to the acquirer, it must also publish the same in a daily newspaper with nationwide distribution.
Transfer Agent and Registrar
We anticipate that the transfer agent and registrar for our common stock will be American Stock Transfer & Trust Company, LLC.
Listing
Our common stock has been approved for listing on the NYSE under the symbol “FI.”
134
Table of Contents
Index to Financial Statements
SHARES ELIGIBLE FOR FUTURE SALE
Upon the completion of this offering, there will be 149,024,000 shares of common stock outstanding, 119,024,000 of which will be owned by FWW and 52,976,000 shares of Series A preferred stock that are convertible into common stock, all of which are owned by Mosing Holdings. The sale of these shares could have an adverse impact on the price of our common stock or on any trading market that may develop.
The shares of common stock to be sold in this offering will generally be freely transferable without restriction or further registration under the Securities Act. However, any shares of common stock held by an “affiliate” of ours may not be resold publicly except in compliance with the registration requirements of the Securities Act or under an exemption from the registration requirements of the Securities Act pursuant to Rule 144 or otherwise. Rule 144 permits securities acquired by an affiliate of ours to be sold into the market in an amount that does not exceed, during any three-month period, the greater of:
| • | 1% of the total number of the class of securities outstanding; or |
| • | the average weekly reported trading volume of our common stock for the four calendar weeks prior to the sale. |
Sales under Rule 144 by our affiliates are also subject to specific manner of sale provisions, holding period requirements, notice requirements and the availability of current public information about us. A person who is not deemed to have been an affiliate of ours at any time during the three months preceding a sale, and who has beneficially owned the shares for at least six months, would be entitled to sell those shares under Rule 144 without regard to the volume, manner of sale and notice requirements of Rule 144 so long as we comply with the current public information requirement for the next six months after the six-month holding period expires.
Lock-Up Agreements
We, all of our directors and executive officers, FWW and Mosing Holdings, have agreed not to sell any common stock for a period of 180 days from the date of this prospectus, subject to certain exceptions and extensions. See “Underwriting” for a description of these lock-up provisions.
Stock Issuable Under Employee Plans
We intend to file a registration statement on Form S-8 under the Securities Act to register 20,000,000 shares of common stock issuable under our long-term incentive plan and 3,000,000 shares of our common stock issued or reserved for issuance under our employee stock purchase plan. This registration statement is expected to be filed following the effective date of the registration statement of which this prospectus is a part and will be effective upon filing. Accordingly, shares issued under such registration statement will be available for sale in the open market following the effective date, unless such shares are subject to vesting restrictions with us, Rule 144 restrictions applicable to our affiliates or the lock-up restrictions described above.
Registration Rights
Mosing Holdings and FWW and certain of their transferees will enter into a registration rights agreement with us. Pursuant to this agreement, the parties to the agreement may cause us to register their shares of common stock under the Securities Act and to maintain a shelf registration statement effective with respect to such shares. For a description of the registration rights agreement, see “Certain Relationships and Related Party Transactions—Registration Rights Agreement.”
135
Table of Contents
Index to Financial Statements
MATERIAL NETHERLANDS INCOME AND ESTATE TAX CONSIDERATIONS
The information given below is neither intended as tax advice nor purports to describe all of the tax considerations that may be relevant to a prospective holder of common stock. All statements as to matters of law and legal conclusions, but not as to factual matters, contained in this discussion, unless otherwise noted, are the opinions of Van Campen Liem (Liem & Partners N.V.) and are based on the accuracy of representations made by us. Prospective holders of common stock are advised to consult their tax counsel with respect to the tax consequences of acquiring, holding and/or disposing of common stock.
Introduction
This discussion solely addresses the material Dutch tax consequences of the acquisition, ownership and disposal of common stock. It does not consider every aspect of taxation that may be relevant to a particular holder of common stock under special circumstances or who is subject to special treatment under applicable law. Where in this discussion English terms and expressions are used to refer to Dutch concepts, the meaning to be attributed to such terms and expressions shall be the meaning to be attributed to the equivalent Dutch concepts under Dutch tax law.
This discussion does not address the tax consequences of a holder of common stock who is an individual, either resident or non-resident in The Netherlands, and who has a substantial interest (in Dutch: “aanmerkelijk belang”) in us within the meaning of the Dutch Income Tax Act 2001 (in Dutch: “Wet inkomstenbelasting 2001”). Generally, if a person holds an interest in us, such interest forms part of a substantial interest, or a deemed substantial interest, in us if any or more of the following circumstances is present:
| 1. | If he/she, either alone or, in the case of an individual, together with his/her partner (in Dutch: “partner”) within the meaning article 5a of the Dutch General Tax Act (in Dutch: “Algemene wet inzake rijksbelastingen”) in combination with article 1.2 of the Dutch Income Tax Act, if any, or pursuant to article 2.14a of the Dutch Income Tax Act 2001 owns or is deemed to own, directly or indirectly, either a number of shares in us representing five per cent or more of our total issued and outstanding capital (or the issued and outstanding capital of any class of our shares), or rights to acquire, directly or indirectly, shares, whether or not already issued, representing five per cent or more of our total issued and outstanding capital (or the issued and outstanding capital of any class of our shares), or profit participating certificates (in Dutch: “winstbewijzen”), relating to five per cent or more of our annual profit or to five per cent of our liquidation proceeds. |
| 2. | If the shares, profit participating certificates or rights to acquire shares in us are held or deemed to be held as a deemed substantial interest following the application of a non-recognition provision. |
| 3. | If the partner of the holder of common stock or any of the relatives by blood or by marriage in the direct line (including foster-children) or of those of the partner of the holder of common stock has a substantial interest (as described under 1 and 2 above) in us. |
For purposes of Dutch personal income tax and corporate income tax, common stock legally owned by a third party, such as a trustee, foundation or similar entity or arrangement, may under certain circumstances have to be allocated to the (deemed) settler, grantor or similar organisor (“Settlor”) or, upon the death of the Settlor, his/her beneficiaries in proportion to their entitlement to the estate of the Settlor of such trust or similar arrangement.
This discussion does not address the tax consequences of holders of common stock receiving income or realizing capital gains in their capacity as future, present or past employee (in Dutch: “werknemer”) or member of a management board (in Dutch: “bestuurder”), or supervisory director (in Dutch: “commissaris”).
This discussion is based on the tax laws and principles (unpublished case law not included) in The Netherlands as in effect on the date of this Prospectus, which are subject to changes that could prospectively or retrospectively affect the stated tax consequences. Where in this discussion the terms “The Netherlands” and “Dutch” are used, these refer solely to the European part of the Kingdom of The Netherlands.
136
Table of Contents
Index to Financial Statements
Dividend Withholding Tax
General
We are generally required to withhold Dutch dividend withholding tax at a rate of 15% from dividends distributed by us.
The concept dividends “distributed by us” as used in this section includes, but is not limited to, the following:
| (a) | distributions is cash or in kind, deemed and constructive distributions and repayments of paid-in capital which is not recognized for Dutch dividend withholding tax purposes; |
| (b) | liquidation proceeds, proceeds of redemption of common stock or, as a rule consideration for the repurchase of common stock by us in excess of the average paid-in capital recognized for Dutch dividend withholding tax purposes; |
| (c) | the par value of the common stock issued to a holder of common stock or an increase of the par value of common stock, to the extent that it does not appear that a contribution, recognized for Dutch dividend withholding tax purposes, has been made or will be made; and |
| (d) | partial repayment of capital, which is recognized as paid-in for Dutch dividend withholding tax purposes, if and to the extent that there are net profits (in Dutch: “zuivere winst”), unless (a) the general meeting of shareholders has resolved in advance to make such repayment and (b) the par value of the shares concerned has been reduced by an equal amount by way of an amendment to our articles of association. |
Holders of Common Stock Resident in The Netherlands
A Dutch resident individual (other than a non-Dutch resident individual who has elected to be treated as a resident of The Netherlands for Dutch income tax purposes) or a Dutch resident corporate entity, can generally credit Dutch dividend withholding tax against his/her/its Dutch income tax or his/her/its Dutch corporate income tax liability, as applicable, and is generally entitled to a refund in the form of a negative assessment of Dutch income tax or Dutch corporate income tax, as applicable, insofar such dividend withholding tax, together with any other creditable domestic and/or foreign taxes, exceeds his/her/its aggregate Dutch income tax or Dutch corporate income tax liability, respectively.
If and to the extent that such holder of common stock is eligible for the application of the participation exemption with respect to the common stock, dividends distributed by us are in principle exempt from Dutch dividend withholding tax.
An exemption from Dutch dividend withholding tax and/or the availability of a credit or refund of Dutch dividend withholding tax withheld shall only apply if the holder of common stock is the beneficial owner (in Dutch: “uiteindelijk gerechtigde”) of dividend distributed by us. A recipient is not considered the beneficial owner of the dividend if, as a consequence of a combination of transactions,
(i) a person (other than the holder of a dividend coupon), directly or indirectly, party or wholly benefits from the dividends;
(ii) such person directly or indirectly retains or acquires a comparable interest in the common stock; and
(iii) such person is entitled to a less favourable exemption, reduction, refund or credit of dividend withholding tax than the recipient of the dividend distribution.
The term “combination of transactions” includes transactions that have been entered into in anonymity of a regulated stock market, the sole acquisition of one or more dividend coupons and the establishment of short-term rights or the common stock (e.g. usufruct).
137
Table of Contents
Index to Financial Statements
An individual who is not resident or deemed to be resident in The Netherlands, that has elected to be treated as a resident of The Netherlands for Dutch income tax purposes, may be eligible for relief from Dutch dividend withholding tax on the same conditions as an individual who is a non-resident holder of common stock, as discussed below.
Holders of Common Stock Resident Outside The Netherlands
A non-resident holder of common stock, which is resident in the non-European part of the Kingdom of The Netherlands or in a country that has concluded a tax treaty with The Netherlands, may be eligible for a full or partial relief from Dutch dividend withholding tax, provided such relief is timely and duly claimed. Pursuant to domestic rules to avoid dividend stripping, Dutch dividend withholding tax relief will only be available to the non-resident holder of common stock if he/she/it is the beneficial owner of the dividends distributed by us. The Dutch tax authorities have taken the position that this beneficial ownership test can also be applied to deny relief from Dutch dividend withholding tax under tax treaties and the Tax Arrangement for the Kingdom (in Dutch: “Belastingregeling voor het Koninkrijk”).
In addition, a non-resident holder of common stock that is not an individual, is entitled to an exemption from Dutch dividend withholding tax, provided that each of the following tests are satisfied:
| 1. | the non-resident holder of common stock is, according to the tax law of a Member State of the European Union or a state designated by a ministerial decree, that is a party to the Agreement regarding the European Economic Area, resident there and it is not transparent for tax purposes according to the tax law of such state; |
| 2. | anyone or more of the following threshold conditions are satisfied: |
| a. | at the time the dividend is distributed by us, the non-resident holder of common stock holds shares representing at least five per cent of our nominal paid-up capital; or |
| b. | the non-resident holder of common stock has held shares representing at least five per cent of our nominal paid-up capital for a continuous period of more than one year at any time during four years preceding the time the dividend is distributed by us; or |
| c. | the non-resident holder of common stock is connected with us within the meaning of article 10a, paragraph 4 of the Dutch Corporate Income Tax Act 1969 (in Dutch: “Wet op de Vennootschapsbelasting 1969”); or |
| d. | an entity connected with the non-resident holder of common stock within the meaning of article 10a, paragraph 4 of the Dutch Corporate Income Tax Act 1969 holds at the time of the dividends distributed by us, shares representing at least five per cent of our nominal paid-up capital; |
| 3. | the non-resident holder of common stock is not considered to be resident outside the Member States of the European Union or the states designated by ministerial decree, that are party to the Agreement regarding the European Economic Area, under the terms of a tax treaty concluded with a third state; and |
| 4. | the non-resident holder of common stock does not perform a similar function as an investment institution (in Dutch: “beleggingsinstelling”) as meant by article 6a or article 28 of the Dutch Corporate Income Tax Act 1969. |
The exemption from Dutch dividend withholding tax is not available to a non-resident holder of common stock if pursuant to a provision for the prevention of fraud or abuse included in a tax treaty between The Netherlands and the country of residence of the non-resident holder of common stock, the non-resident holder of common stock is not entitled to the reduction of Dutch tax on dividends provided for by such treaty. Furthermore, the exemption from Dutch dividend withholding tax will only be available if the non-resident holder of common stock is the beneficial owner (as described above) of dividends distributed by us. A non-resident holder of common stock which is resident in a Member State of the European Union with which The Netherlands has concluded a tax treaty that provides for a reduction of Dutch tax on dividends based on the
138
Table of Contents
Index to Financial Statements
ownership of the number of voting rights, the test under 2.a. above is also satisfied if the non-resident holder of common stock owns at least five per cent of the voting rights in us.
A non-resident holder of common stock which is subject to Dutch income tax or Dutch corporate income tax in respect of any benefits derived or deemed to be derived from common stock, including any capital gain realized on the disposal thereof, can generally credit Dutch dividend withholding tax against its Dutch income tax or its Dutch corporate income tax liability, as applicable, and is generally entitled to a refund pursuant to a negative tax assessment if and to the extent the Dutch dividend withholding tax, together with any other creditable domestic and/or foreign taxes, exceeds its aggregate Dutch income tax or its aggregate Dutch corporate income tax liability, respectively.
Taxes on Income and Capital Gains
Resident Holders of Common Stock
Individuals
A holder of common stock, who is an individual resident or deemed to be resident in The Netherlands, or who has elected to be taxed as a resident of The Netherlands for Dutch personal income tax purposes, will be subject to regular Dutch personal income tax at progressive rates (up to a maximum rate of 52%) under the Dutch Income Tax Act 2001 on the income derived from the common stock and gains realized upon the redemption of the common stock if:
| (a) | the individual is an entrepreneur (In Dutch: “ondernemer”) and has an enterprise to which the common stock are attributable or the individual is, other than as shareholder, co-entitled to the net worth of an enterprise (in Dutch: “medegerechtigde”), to which enterprise the common stock are attributable; or |
| (b) | such income or gain forms “a benefit from miscellaneous activities” (in Dutch: “resultaat uit overige werkzaamheden”), which, for instance, would be the case if the activities with respect to the common stock exceed “regular active portfolio management” (in Dutch: “normal actief vermogensbeheer”) or if the income and gains are derived from the holding, whether directly or indirectly, of (a combination of) shares, debt claims or other rights (together a lucrative interest, in Dutch “lucratief belang”) that the holder thereof has acquired under certain circumstances based on which such income and gains are intended to be a remuneration for work or services performed by such holder (or a related person) in The Netherlands, whether within or outside an employment relation, where such lucrative interest provided the holder thereof, economically speaking, with certain benefits that have a relation to the relevant work or services. |
If neither condition (a) or (b) applies, and the individual that holds the common stock does not hold a substantial interest (as discussed above), he/she must determine his/her taxable income with regard to the common stock on the basis of a deemed return on income from savings and investments (in Dutch: “sparen en beleggen”), rather than on the basis of income actually received or gains actually realized. This deemed return on income from savings and investments has been fixed at a rate of 4% of the individual’s yield basis (in Dutch: “rendementsgrondslag”) at the beginning of the calendar year, insofar as the individual’s yield basis exceeds a certain threshold. The individual’s yield basis is determined as the fair market value of certain qualifying assets held by the individual less the fair market value of certain qualifying liabilities at the beginning of the calendar year.
Corporate Entities
A holder of shares that is resident or deemed to be resident in The Netherlands for Dutch corporate income tax purposes, and that is:
| (i) | a corporation; |
| (ii) | another entity with a capital divided into shares; |
| (iii) | a cooperative (association); or |
139
Table of Contents
Index to Financial Statements
| (iv) | another legal entity that has an enterprise or an interest in an enterprise to which the common stock are attributable, |
but which is not,
| (v) | a qualifying pension fund; |
| (vi) | a qualifying investment fund (under article 6a or 28 of the Dutch Corporate Income Tax Act); or |
| (vii) | another entity exempt from corporate income tax, |
will, in general, be subject to regular Dutch corporate income tax, levied at a rate of 25% (20% over profits up to €200,000) over income derived from the common stock and gains realized upon acquisition, redemption and disposal of common stock.
If and to the extent that such holder of common stock is eligible for the application of the participation exemption with respect to the common stock, income derived from the common stock and gains and losses (with the exception of liquidation losses under strict conditions) realized on the common stock may be exempt from Dutch corporate income tax.
Non-resident Holders of Common Stock
Individuals
A holder of common stock, who is an individual not resident or deemed to be resident in The Netherlands, and who has not elected to be taxed as a resident of The Netherlands for Dutch income tax purposes, will not be subject to any Dutch taxes on income or capital gains in respect of dividends distributed by us or in respect of any gain realized on the disposal of common stock (other than dividend withholding tax as described above), unless:
| (a) | such holder has an enterprise or an interest in an enterprise that is, in whole or in part, carried on through a permanent establishment or a permanent representative in The Netherlands and to which enterprise or part of an enterprise, as the case may be, the common stock are attributable; and/or |
| (b) | such income or gain forms “a benefit from miscellaneous activities” (in Dutch: “resultaat uit overige werkzaamheden”) which, for instance, would be the case if the activities with respect to the common stock exceed “regular active portfolio management” in The Netherlands or if the income and gains are derived from the holding, whether directly or indirectly, of (a combination of) shares, debt claims or other rights (together a lucrative interest, in Dutch “lucratief belang”) that the holder thereof has acquired under certain circumstances based on which such income and gains are intended to be a remuneration for work or services performed by such holder (or a related person) in The Netherlands, whether within or outside an employment relation, where such lucrative interest provided the holder thereof, economically speaking, with certain benefits that have a relation to the relevant work or services. |
If either of the abovementioned conditions (a) or (b) applies, the income or gains in respect of dividends distributed by us or in respect of any capital gain realized on the disposal of common stock will in general be subject to Dutch personal income tax at the progressive rates up to 52%.
Corporate Entities
A holder of shares that is a legal entity, another entity with a capital divided into shares, an association, a foundation or a trust, not resident or deemed to be resident in The Netherlands for Dutch corporate income tax purposes, will not be subject to any Dutch taxes on income or capital gains in respect of dividends distributed by us or in respect of any gain realized on the disposal of common stock (other than dividend withholding tax as described above), except if:
| (1) | such holder has an enterprise or an interest in an enterprise that is, in whole or in part, carried on through a permanent establishment or a permanent representative in The Netherlands and to which enterprise or part of an enterprise, as the case may be, the common stock are attributable; |
140
Table of Contents
Index to Financial Statements
| (2) | such holder has a substantial interest or a deemed substantial interest in us within the meaning of Chapter 4 of the Dutch Income Tax Act 2001, that (i) is held with the avoidance of income tax or dividend withholding tax as (one of) the main purpose(s) and (ii) does not form part of the assets of an enterprise; or |
| (3) | such holder is an entity resident of Aruba, Curaçao or Saint Martin with a permanent establishment or permanent representative in Bonaire, Saint Eustatius or Saba to which such income or gain is attributable, and the permanent establishment or permanent representative would be deemed to be resident of the Netherlands for Dutch corporate income tax purposes (i) had the permanent establishment been a corporate entity (in Dutch: “lichaam”), or (ii) had the activities of the permanent representative been conducted by a corporate entity, respectively. |
If one of the abovementioned conditions applies, income derived from the common stock and gains realized on the common stock will, in general, be subject to regular corporate income tax levied at a rate of 25% (20% over profits up to €200,000), except that a holder referred to under (2) above will generally be subject to an effective corporate income tax rate of 15% on dividend income only if it holds the substantial interest in us only with the purpose of avoiding dividend withholding tax and not with (one of) the main purposes to avoid income tax.
Gift or Inheritance Taxes
If you dispose of common stock by way of gift, in form or in substance, or if you die, no Dutch gift or Dutch inheritance tax, as applicable, will be due, unless:
| (i) | you are, or you were, resident or deemed to be resident in The Netherlands for purposes of Dutch gift tax or Dutch inheritance tax, as applicable; or |
| (ii) | in the case of a gift of common stock by an individual who at the date of the gift was neither resident nor deemed to be resident in The Netherlands (i) such individual dies within 180 days after the date of the gift, while being resident or deemed to be resident in The Netherlands; or (ii) the gift of common stock is made under a condition precedent and the holder of these shares is resident, or is deemed to be resident, in The Netherlands at the time the condition is fulfilled. |
For purposes of the above, a gift of common stock made under a condition precedent (In Dutch: “opschortende voorwaarde”) is deemed to be made at the time the condition precedent is satisfied.
For purposes of Dutch gift, or inheritance taxes, an individual not holding the Dutch nationality will be deemed to be resident in The Netherlands, inter alia, if he or she has been resident in The Netherlands at any time during the ten years preceding the date of the gift or his or her death. Additionally, for purposes of Dutch gift tax, an individual not holding the Dutch nationality will be deemed to be resident in The Netherlands if he or she has been resident in The Netherlands at any time during the twelve months preceding the date of the gift. Applicable tax treaties may override deemed residency in The Netherlands.
Value Added Tax
In general, no Dutch value added tax will arise in respect of payments in consideration for the issue of the common stock or in respect of a cash payment made under the common stock, or in respect of the transfer of the common stock.
Other Taxes and Duties
No Dutch registration tax, capital tax, custom duty, transfer tax, stamp duty or any other similar tax or duty, other than court fees, will be payable in The Netherlands in respect of or in connection with the subscription, issue, placement, allotment, delivery or transfer of common stock.
141
Table of Contents
Index to Financial Statements
MATERIAL U.S. FEDERAL INCOME TAX CONSIDERATIONS
The following is a discussion of the material U.S. federal income tax considerations applicable to the purchase, ownership and disposition of the common stock by U.S. Holders (as defined below) (i) who are residents of the United States for purposes of the U.S.-Netherlands Income Tax Convention (the “U.S.-Netherlands Tax Treaty”), (ii) whose common stock is not, for purposes of the U.S.-Netherlands Tax Treaty, effectively connected with a permanent establishment in The Netherlands and (iii) who otherwise qualify for the full benefits of the U.S.-Netherlands Tax Treaty. No rulings have been or will be sought from the IRS with respect to any of the U.S. federal income tax issues discussed in this section, however, and as a result, there can be no assurance that the IRS will not successfully challenge the conclusions reached in this section. All statements as to matters of law and legal conclusions, but not as to factual matters, contained in this discussion, unless otherwise noted, are the opinions of Vinson & Elkins L.L.P. and are based on the accuracy of representations made by us. This discussion is not exhaustive of all possible U.S. federal income tax considerations applicable to ownership of the common stock.
This discussion is based on the Code, the Treasury Regulations promulgated thereunder, IRS rulings and official pronouncements, judicial decisions and the U.S.-Netherlands Tax Treaty, all as in effect on the date of this prospectus and all of which are subject to change, possibly with retroactive effect, or different interpretations, which could affect the accuracy of the statements and conclusions set forth below. FINV undertakes no obligation to update or otherwise revise this discussion.
This discussion applies only to U.S. Holders (as defined below) that hold the common stock as capital assets within the meaning of Section 1221 of the Code (generally, property held for investment). This discussion does not address any U.S. federal estate and gift or alternative minimum tax consequences, U.S. state or local, or non-U.S. tax consequences to any particular investor, or the tax consequences to persons subject to special treatment under U.S. federal income tax laws, such as:
| • | banks and certain other financial institutions; |
| • | insurance companies; |
| • | regulated investment companies; |
| • | real estate investment trusts; |
| • | dealers or traders in securities or currencies; |
| • | brokers; |
| • | traders that elect to mark-to-market their investments; |
| • | tax-exempt organizations, retirement plans, individual retirement accounts and other tax-deferred accounts; |
| • | persons holding common stock as part of a hedge, straddle, conversion, constructive sale or other “synthetic security” or integrated transaction; |
| • | persons whose functional currency for U.S. federal income tax purposes is not the U.S. dollar; |
| • | persons who own, actually or under applicable constructive ownership rules, 10% or more of our common stock; or |
| • | persons who are former citizens or former long-term residents of the United States (U.S. expatriates). |
As used in this discussion, a “U.S. Holder” is any beneficial owner of common stock that is for U.S. federal income tax purposes:
| • | a citizen or resident of the United States (as determined under U.S. federal income tax rules); |
| • | a corporation (including an entity classified as an association subject to tax as a corporation for U.S. federal income tax purposes) that is created or organized in or under the laws of the United States or of a political subdivision thereof (or the District of Columbia); |
142
Table of Contents
Index to Financial Statements
| • | an estate whose income is subject to U.S. federal income taxation regardless of its source; or |
| • | any trust if (1) a U.S. court is able to exercise primary supervision over the administration of such trust and one or more U.S. persons have the authority to control all substantial decisions of the trust, or (2) it has a valid election in place to be treated as a U.S. person for U.S. federal income tax purposes. |
If an entity or arrangement classified as a partnership for U.S. federal income tax purposes holds common stock, the U.S. federal income tax treatment of a partner generally will depend upon the status of the partner and the activities of the partnership. A partner of a partnership holding common stock should consult its own tax advisor regarding the U.S. federal income tax consequences to the partner of the acquisition, ownership and disposition of common stock by the partnership.
Taxation of Distributions from FINV
Subject to the PFIC rules discussed below, the gross amount (i.e., before Dutch withholding tax) of distributions paid by FINV to a U.S. Holder with respect to common stock generally will be treated as a dividend to the extent paid out of the FINV’s current or accumulated earnings and profits (as determined under U.S. federal income tax principles). Such dividend generally will be includible in a U.S. Holder’s gross income in accordance with the U.S. Holder’s method of accounting. U.S. Holders that are corporations will not be entitled to claim a dividends received deduction with respect to dividends they receive from FINV because FINV is not a U.S. corporation. Dividends received with respect to common stock generally will be treated as foreign-source “passive category income” for purposes of computing allowable foreign tax credits for U.S. federal income tax purposes. However, as described below in “—Foreign Tax Credit Limitations,” all or a portion of such dividends could be treated as U.S.-source income.
Dividends to a U.S. Holder in excess of the FINV’s earnings and profits will be treated first as a tax-free return of capital to the extent of the U.S. Holder’s tax basis in common stock and will reduce (but not below zero) such basis (thereby increasing the amount of gain or decreasing the amount of loss that a U.S. Holder would recognize on a subsequent disposition of common stock). A distribution in excess of earnings and profits and the U.S. Holder’s tax basis in common stock will be treated as gain from the sale or exchange of such common stock, the consequences of which are described below under “—Taxation of Sale, Exchange or Other Taxable Disposition of Common Stock.” FINV intends to calculate its earnings and profits under U.S. federal income tax principles, so that U.S. Holders can determine the portion of dividends on common stock that will be treated as a dividend.
Dividends received from FINV by a U.S. Holder who is an individual, trust or estate (a “U.S. Individual Holder”) generally will continue to be treated as “qualified dividend income,” which is currently taxable to such U.S. Individual Holder at preferential capital gain tax rates, provided that (i) FINV is a “qualified foreign corporation”; (ii) FINV is not a PFIC for the taxable year during which the dividend is paid or the immediately preceding taxable year (which management of FINV does not believe FINV is, has been or will be, as discussed below under “—PFIC Status and Significant Tax Consequences”); (iii) the U.S. Individual Holder has owned the common stock for more than 60 days during the 121-day period beginning 60 days before the date on which the common stock become ex-dividend (and has not entered into certain risk limiting transactions with respect to such common stock); and (iv) the U.S. Individual Holder is not under an obligation to make related payments with respect to positions in substantially similar or related property. A foreign corporation is treated as a qualified foreign corporation with respect to dividends paid by that corporation on shares that are readily tradable on an established securities market in the United States. U.S. Treasury Department guidance indicates that our common stock, which we intend to list on the NYSE, will be readily tradable on an established securities market in the United States as a result of such listing. There can be no assurance that our common stock will be considered readily tradable on an established securities market in later years.
There is no assurance that any dividends paid on common stock will be eligible for taxation at preferential capital gains tax rates in the hands of a U.S. Individual Holder, and any dividends paid on common stock that are
143
Table of Contents
Index to Financial Statements
not eligible for these preferential rates will be taxed as ordinary income to a U.S. Individual Holder. U.S. Individual Holders should consult their tax advisors regarding the availability of the preferential rates applicable to qualified dividend income for any dividends FINV pays with respect to the common stock.
Taxation of Sale, Exchange or Other Taxable Disposition of Common Stock
Subject to the PFIC rules discussed below, upon the sale, exchange or other taxable disposition of a share of common stock, a U.S. Holder generally will recognize gain or loss equal to the difference between the amount realized upon the sale, exchange or other disposition and such U.S. Holder’s adjusted tax basis in the share. The U.S. Holder’s adjusted tax basis in the share of common stock will generally equal the cost of such share, reduced by any dividends treated as a tax-free return of capital as discussed above under “—Taxation of Dividends from FINV”. Such gain or loss generally will be capital gain or loss and generally will be long-term capital gain or loss if the U.S. Holder’s holding period for the share of common stock exceeds one year on the date of the sale or disposition. Certain U.S. Holders (including individuals) may be eligible for preferential rates of U.S. federal income tax in respect of long-term capital gains. A U.S. Holder’s ability to deduct capital losses is subject to limitations. Such capital gain or loss generally will be treated as U.S. source income or loss, as applicable, for U.S. foreign tax credit purposes.
PFIC Status and Significant Tax Consequences
In general, a non-U.S. corporation is a PFIC for any taxable year in which either:
| • | at least 75% of its gross income (including its proportionate share of the gross income of any other corporation in which it owns, directly or indirectly, 25% or more (by value) of such corporation’s stock) for such taxable year consists of certain types of passive income (e.g., dividends, interest, capital gains, royalties and, the excess of gains over losses from sales of commodities); or |
| • | at least 50% of the average value of its assets (including its proportionate share of the assets of any other corporation in which it owns, directly or indirectly, 25% or more (by value) of such corporation’s stock) is attributable to assets that produce, or are held for the production of, passive income. |
If FINV were to be treated as a PFIC for any taxable year, a U.S. Holder generally would be subject to adverse rules resulting in increased tax liability with respect to (1) any excess distribution (i.e., the portion of any dividends received by the U.S. Holder on its common stock in a taxable year in excess of 125% of the average annual dividends received by the U.S. Holder in the three preceding taxable years, or, if shorter, the U.S. Holder’s holding period for its common stock), and (2) any gain realized on the sale, exchange or other disposition of its common stock. In addition, the U.S. Holder would be required to file an annual report with the IRS.
Under the special rules applicable to PFICs:
| • | any excess distribution (as described above) or gain would be allocated ratably over the U.S. Holder’s aggregate holding period for common stock; |
| • | the amount allocated to the current taxable year and any taxable year prior to the taxable year FINV was first treated as a PFIC with respect to the U.S. Holder would be taxed as ordinary income; and |
| • | the amount allocated to each of the other taxable years would be subject to tax at the highest rate of tax in effect for the applicable class of taxpayers for that year, and an interest charge for the deemed deferral benefit would be imposed with respect to the resulting tax attributable to each such other taxable year. Certain elections may be available to mitigate the tax consequences of PFIC status. |
Based on estimates of FINV’s gross income, the nature and value of its assets, the manner in which it conducts its business, and the expectation for the manner in which such business will be conducted in the future, FINV does not believe it is a PFIC, and it does not expect to become a PFIC in the future. However, there is no
144
Table of Contents
Index to Financial Statements
definitive guidance regarding the treatment of FINV’s income or assets, or the characterization of power generation activities more generally, for purposes of the applicable PFIC tests. Furthermore, no assurance can be given that FINV’s manner of operation, or the composition of its income or assets, will not change in the future. Consequently, no assurance can be given that FINV is not and will not be a PFIC in the future.
If FINV were to be treated as a PFIC for any taxable year, a U.S. Holder would be subject to different taxation rules if the U.S. Holder were to make an election to treat FINV as a “Qualified Electing Fund” or were to make a “mark-to-market” election with respect to the common stock.
The PFIC rules are very complex and are not described completely herein. U.S. Holders are urged to consult their own tax advisors regarding the PFIC rules.
Foreign Tax Credit Limitations
U.S. Holders may be subject to Dutch withholding tax on distributions paid with respect to common stock. Subject to certain conditions and limitations, including any applicable foreign tax credit limitations, such withholding taxes may be treated as foreign taxes eligible for credit against a U.S. Holder’s U.S. federal income tax liability. If it is determined that U.S. persons own 50% or more of the common stock, then for purposes of computing a U.S. Holder’s foreign tax credit limitation, at least a portion of the dividends paid with respect to the common stock may be U.S.-source income if more than a de minimis amount of FINV’s earnings and profits out of which the dividends are paid is from sources within the United States. A U.S. Holder may be unable to determine what portion of a dividend from FINV is treated as foreign-source income for foreign tax credit purposes. To the extent that a U.S. Holder is unable to establish that all or any portion of a dividend from FINV is foreign-source income, the value of any potential foreign tax credit attributable to foreign withholding taxes on FINV’s dividends could be limited. In addition, foreign taxes may not be eligible for credit to the extent they could have been reduced pursuant to the U.S.-Netherlands Tax Treaty.
To the extent that distributions paid with respect to common stock are in excess of FINV’s current and accumulated earnings and profits and in excess of adjusted basis, such distributions are treated as gain from the sale or disposition of the common stock. Consequently, such distributions would generally not give rise to foreign source income. Any Dutch withholding tax imposed on such distributions would generally not qualify for the foreign tax credit unless such credit could be applied (subject to applicable limitations) against U.S. federal income tax due on other foreign source income in the appropriate category for foreign tax credit purposes.
The rules governing foreign tax credits are complex and are not described completely herein. U.S. Holders are urged to consult their own tax advisors regarding the availability of foreign tax credits in their particular circumstances.
3.8% Medicare Tax on Unearned Income
Certain U.S. Holders that are individuals, trusts or estates will be subject to an additional 3.8% Medicare tax on unearned income, which generally will include dividends received and gain recognized with respect to common stock. For U.S. Individual Holders, the additional Medicare tax applies to the lesser of (i) “net investment income,” or (ii) the excess of “modified adjusted gross income” over $200,000 ($250,000 if married and filing jointly or $125,000 if married and filing separately). “Net investment income” generally equals a holder’s gross investment income reduced by the deductions that are allocable to such income. Investment income generally includes passive income such as interest, dividends, annuities, royalties, rents and capital gains. U.S. holders are urged to consult their own tax advisors regarding the implications of this additional Medicare tax to their particular circumstances.
145
Table of Contents
Index to Financial Statements
Information Reporting and Backup Withholding
Distributions paid with respect to common stock and proceeds from a sale, exchange or redemption of common stock made within the United States or through certain U.S.-related financial intermediaries may be subject to information reporting to the IRS and possible U.S. backup withholding. Backup withholding will not apply, however, to a U.S. Holder who furnishes a correct taxpayer identification number and makes any other required certification on IRS Form W-9 or that is a corporation or entity that is otherwise exempt from backup withholding. U.S. Holders who are exempt from backup withholding should still complete IRS Form W-9 to avoid possible erroneous backup withholding. U.S. Holders of common stock should consult their tax advisors regarding the application of the U.S. information reporting and backup withholding rules.
Backup withholding is not an additional tax. Amounts withheld as backup withholding may be credited against such holder’s U.S. federal income tax liability, and such holder may obtain a refund of any excess amounts withheld under the backup withholding rules by filing an appropriate claim for refund with the IRS and furnishing any required information in a timely manner.
A U.S. Holder that purchases common stock from FINV pursuant to this offering generally will be required to file Form 926 with the IRS with respect to such purchase if the amount of cash paid by the holder to FINV pursuant to this offering exceeds $100,000. For purposes of determining the total dollar value of common stock purchased by a U.S. Holder in this offering, common stock purchased by certain related parties (including family members) are included. Substantial penalties may be imposed upon a U.S. Holder who fails to comply with this reporting obligation. Each U.S. Holder should consult its own tax advisor as to the possible obligation to file IRS Form 926.
In addition, under U.S. federal income tax law and temporary and proposed Treasury Regulations, individual citizens or residents of the United States who hold certain “specified foreign financial assets” that exceed certain thresholds (the lowest being holding specified foreign financial assets with an aggregate value in excess of: (1) $50,000 on the last day of the tax year, or (2) $75,000 at any time during the tax year) are required to report information relating to such assets. The definition of “specified foreign financial assets” generally includes not only financial accounts maintained in foreign financial institutions, but also, unless held in accounts maintained by a financial institution, any stock or security issued by a non-U.S. person, any financial instrument or contract held for investment that has an issuer or counterparty other than a U.S. person, and any interest in a foreign entity. U.S. Individual Holders may be subject to these reporting requirements unless their common stock is held in an account at a U.S. financial institution. Significant penalties may apply for failure to satisfy the reporting obligations described above. U.S. Holders should consult with their own tax advisors regarding their reporting obligations, if any, as a result of their purchase, ownership or disposition of common stock.
THE DISCUSSION ABOVE DOES NOT COVER ALL TAX MATTERS THAT MAY BE IMPORTANT TO YOU. PROSPECTIVE INVESTORS SHOULD CONSULT THEIR TAX ADVISORS REGARDING THE APPLICATION OF THE U.S. FEDERAL TAX RULES TO THEIR PARTICULAR CIRCUMSTANCES AS WELL AS THE STATE, LOCAL, NON-U.S. AND OTHER TAX CONSEQUENCES TO THEM OF THE PURCHASE, OWNERSHIP AND DISPOSITION OF COMMON STOCK.
146
Table of Contents
Index to Financial Statements
Barclays Capital Inc., Credit Suisse Securities (USA) LLC, Simmons & Company International, Citigroup Global Markets Inc., Morgan Stanley & Co. LLC, Goldman, Sachs & Co. and UBS Securities LLC are acting as joint book-running managers of this offering and Barclays Capital Inc., Credit Suisse Securities (USA) LLC and Simmons & Company International are acting as representatives of the underwriters named below. Under the terms of an underwriting agreement, which is filed as an exhibit to the registration statement relating to this prospectus, each of the underwriters named below has severally agreed to purchase from us the respective number of shares of common stock shown opposite its name below:
| Underwriters |
Number of Shares |
|||
| Barclays Capital Inc. |
||||
| Credit Suisse Securities (USA) LLC |
||||
| Simmons & Company International |
||||
| Citigroup Global Markets Inc. |
||||
| Morgan Stanley & Co. LLC |
||||
| Goldman, Sachs & Co. |
||||
| UBS Securities LLC |
||||
| Capital One Securities, Inc. |
||||
| Tudor, Pickering, Holt & Co. Securities, Inc. |
||||
| Global Hunter Securities, LLC |
||||
| Johnson Rice & Company L.L.C. |
||||
| FBR Capital Markets & Co. |
||||
| Scotia Capital (USA) Inc. |
||||
|
|
|
|||
| Total |
30,000,000 | |||
|
|
|
|||
The underwriters are obligated to purchase all of the shares of common stock offered hereby (other than those shares covered by their option to purchase additional shares of common stock as described below), if any of the shares of common stock are purchased. The underwriting agreement provides that the underwriters’ obligation to purchase the shares of common stock depends on the satisfaction of the conditions contained in the underwriting agreement, including:
| • | the representations and warranties made by us to the underwriters are true; |
| • | there is no material change in our business or the financial markets; and |
| • | we deliver customary closing documents to the underwriters. |
Commissions and Expenses
The following table summarizes the underwriting discounts and commissions we will pay to the underwriters. These amounts are shown assuming both no exercise and full exercise of the underwriters’ option to purchase additional shares of common stock. The underwriting fee is the difference between the initial price to the public and the amount the underwriters pay to us for the shares.
| No Exercise |
Full Exercise |
|||||||
| Per share |
$ | $ | ||||||
| Total |
$ | $ | ||||||
We also have agreed to reimburse the underwriters for up to $30,000 of any fees and expenses of counsel related to the review by the Financial Industry Regulatory Authority, Inc., or FINRA, of the terms of sale of the common stock offered hereby.
147
Table of Contents
Index to Financial Statements
The representatives of the underwriters have advised us that the underwriters propose to offer the shares of common stock directly to the public at the public offering price on the cover of this prospectus and to selected dealers, which may include the underwriters, at such offering price less a selling concession not in excess of $ per share. After the offering, the representatives may change the offering price and other selling terms. Sales of shares made outside of the United States may be made by affiliates of the underwriters.
The expenses of the offering that are payable by us are estimated to be $3.5 million (excluding underwriting discounts and commissions).
Option to Purchase Additional Shares
We have granted the underwriters an option exercisable for 30 days after the date of the underwriting agreement, to purchase, from time to time, in whole or in part, up to an aggregate of 4,500,000 shares at the public offering price less underwriting discounts and commissions. This option may be exercised if the underwriters sell more than 30,000,000 shares of common stock in connection with this offering. To the extent that this option is exercised, each underwriter will be obligated, subject to certain conditions, to purchase its pro rata portion of these additional shares based on the underwriter’s underwriting commitment in the offering as indicated in the table at the beginning of this Underwriting section.
Lock-Up Agreements
We, all of our directors and executive officers and certain of our principal shareholders, including FWW and Mosing Holdings, have agreed that, subject to certain exceptions, without the prior written consent of Barclays Capital Inc., Credit Suisse Securities (USA) LLC and Simmons & Company International, we and they will not directly or indirectly, (1) offer for sale, sell, pledge, or otherwise dispose of (or enter into any transaction or device that is designed to, or could be expected to, result in the disposition by any person at any time in the future of) any shares of common stock (including, without limitation, shares of common stock that may be deemed to be beneficially owned by us or them in accordance with the rules and regulations of the SEC and shares of common stock that may be issued upon exercise of any options or warrants) or securities convertible into or exercisable or exchangeable for common stock, (2) enter into any swap or other derivatives transaction that transfers to another, in whole or in part, any of the economic consequences of ownership of the common stock, (3) make any demand for or exercise any right or file or cause to be filed a registration statement, including any amendments thereto, with respect to the registration of any shares of common stock or securities convertible, exercisable or exchangeable into common stock or any of our other securities, or (4) publicly disclose the intention to do any of the foregoing for a period of 180 days after the date of this prospectus. The lock-up agreements will not restrict the transfer of common stock as bona fide gifts, so long as, among other things, the transferee agrees to be bound by the restrictions in the lock-up agreements. Subject to certain restrictions, the lock-up agreements also will not restrict the establishment of a trading plan pursuant to Rule 10b5-1 under the Exchange Act for the transfer of shares of our common stock.
The 180-day restricted period described in the preceding paragraph will be extended if:
| • | during the last 17 days of the 180-day restricted period we issue an earnings release or material news or a material event relating to us occurs; or |
| • | prior to the expiration of the 180-day restricted period, we announce that we will release earnings results during the 16-day period beginning on the last day of the 180-day period, |
in which case the restrictions described in the preceding paragraph will continue to apply until the expiration of the 18-day period beginning on the issuance of the earnings release or the announcement of the material news or occurrence of a material event, unless such extension is waived in writing by Barclays Capital Inc., Credit Suisse Securities (USA) LLC and Simmons & Company International.
148
Table of Contents
Index to Financial Statements
Barclays Capital Inc., Credit Suisse Securities (USA) LLC and Simmons & Company International may release the common stock and other securities subject to the lock-up agreements described above in whole or in part at any time with or without notice. When determining whether or not to release common stock and other securities from lock-up agreements, Barclays Capital Inc., Credit Suisse Securities (USA) LLC and Simmons & Company International will consider, among other factors, the holder’s reasons for requesting the release, the number of shares of common stock and other securities for which the release is being requested and market conditions at the time.
As described below under “—Directed Share Program,” any participants in the Directed Share Program shall be subject to a lock up with respect to any shares sold to them pursuant to that program. This lock up will have similar restrictions and an identical extension provision as the lock-up agreement described above. Any shares sold in the Directed Share Program to our directors or officers shall be subject to the lock-up agreement described above.
Offering Price Determination
Prior to this offering, there has been no public market for our common stock. The initial public offering price was negotiated among the representatives and us. In determining the initial public offering price of our common stock, the representatives considered:
| • | the history and prospects for the industry in which we compete; |
| • | our financial information; |
| • | the ability of our management and our business potential and earning prospects; |
| • | the prevailing securities markets at the time of this offering; and |
| • | the recent market prices of, and the demand for, publicly traded shares of generally comparable companies. |
Indemnification
We and certain of our affiliates have agreed to indemnify the underwriters against certain customary liabilities, including liabilities under the Securities Act and liabilities incurred in connection with the directed share program referred to below, and to contribute to payments that the underwriters may be required to make for these liabilities.
Directed Share Program
At our request, the underwriters have reserved for sale at the initial public offering price up to 1,500,000 shares offered hereby for officers, directors, employees and certain other persons associated with us. The number of shares available for sale to the general public will be reduced to the extent such persons purchase such reserved shares. Any reserved shares not so purchased will be offered by the underwriters to the general public on the same basis as the other shares offered hereby. Any participants in this program shall be prohibited from selling, pledging or assigning any shares sold to them pursuant to this program for a period of 30 days (provided that the period shall be extended to 90 days for any participant who purchases $10 million or more of our common stock in connection with the offering) after the date of this prospectus. This lock up period shall be extended with respect to our issuance of an earnings release or if a material news or a material event relating to us occurs, in the same manner as described above under “—Lock-Up Agreements.”
Stabilization, Short Positions and Penalty Bids
The representatives may engage in stabilizing transactions, short sales and purchases to cover positions created by short sales, and penalty bids or purchases for the purpose of pegging, fixing or maintaining the price of the common stock, in accordance with Regulation M under the Exchange Act:
| • | Stabilizing transactions permit bids to purchase the underlying security so long as the stabilizing bids do not exceed a specified maximum. |
149
Table of Contents
Index to Financial Statements
| • | A short position involves a sale by the underwriters of shares in excess of the number of shares the underwriters are obligated to purchase in the offering, which creates the syndicate short position. This short position may be either a covered short position or a naked short position. In a covered short position, the number of shares involved in the sales made by the underwriters in excess of the number of shares they are obligated to purchase is not greater than the number of shares that they may purchase by exercising their option to purchase additional shares of common stock. In a naked short position, the number of shares involved is greater than the number of shares in their option to purchase additional shares of common stock. The underwriters may close out any short position by either exercising their option to purchase additional shares of common stock and/or purchasing shares of common stock in the open market. In determining the source of shares to close out the short position, the underwriters will consider, among other things, the price of shares available for purchase in the open market as compared to the price at which they may purchase shares through their option to purchase additional shares of common stock. A naked short position is more likely to be created if the underwriters are concerned that there could be downward pressure on the price of the shares in the open market after pricing that could adversely affect investors who purchase in the offering. |
| • | Syndicate covering transactions involve purchases of the common stock in the open market after the distribution has been completed in order to cover syndicate short positions. |
| • | Penalty bids permit the representatives to reclaim a selling concession from a syndicate member when the common stock originally sold by the syndicate member is purchased in a stabilizing or syndicate covering transaction to cover syndicate short positions. |
These stabilizing transactions, syndicate covering transactions and penalty bids may have the effect of raising or maintaining the market price of our common stock or preventing or retarding a decline in the market price of the common stock. As a result, the price of the common stock may be higher than the price that might otherwise exist in the open market. These transactions may be effected on the NYSE or otherwise and, if commenced, may be discontinued at any time.
Neither we nor any of the underwriters make any representation or prediction as to the direction or magnitude of any effect that the transactions described above may have on the price of the common stock. In addition, neither we nor any of the underwriters make representation that the representatives will engage in these stabilizing transactions or that any transaction, once commenced, will not be discontinued without notice.
Electronic Distribution
A prospectus in electronic format may be made available on the Internet sites or through other online services maintained by one or more of the underwriters and/or selling group members participating in this offering, or by their affiliates. In those cases, prospective investors may view offering terms online and, depending upon the particular underwriter or selling group member, prospective investors may be allowed to place orders online. The underwriters may agree with us to allocate a specific number of shares for sale to online brokerage account holders. Any such allocation for online distributions will be made by the representatives on the same basis as other allocations.
Other than the prospectus in electronic format, the information on any underwriter’s or selling group member’s web site and any information contained in any other web site maintained by an underwriter or selling group member is not part of the prospectus or the registration statement of which this prospectus forms a part, has not been approved and/or endorsed by us or any underwriter or selling group member in its capacity as underwriter or selling group member and should not be relied upon by investors.
New York Stock Exchange
Our common stock has been approved for listing on the NYSE under the symbol “FI.” In connection with that listing, the underwriters will undertake to sell the minimum number of shares of common stock to the minimum number of beneficial owners necessary to meet the NYSE listing requirements.
150
Table of Contents
Index to Financial Statements
Discretionary Sales
The underwriters have informed us that they do not intend to confirm sales to discretionary accounts that exceed 5% of the total number of shares offered by them.
Stamp Taxes
If you purchase shares of common stock offered in this prospectus, you may be required to pay stamp taxes and other charges under the laws and practices of the country of purchase, in addition to the offering price listed on the cover page of this prospectus.
Relationships
Certain of the underwriters and their affiliates have engaged, and may in the future engage, in investment banking transactions with us in the ordinary course of their business. They have received, and expect to receive, customary compensation and expense reimbursement for these investment banking transactions.
In addition, in the ordinary course of their business activities, the underwriters and their affiliates may make or hold a broad array of investments and actively trade debt and equity securities (or related derivative securities) and financial instruments (including bank loans) for their own account and for the accounts of their customers. Such investments and securities activities may involve securities and/or instruments of ours or our affiliates. The underwriters and their affiliates may also make investment recommendations and/or publish or express independent research views in respect of such securities or financial instruments and may hold, or recommend to clients that they acquire, long and/or short positions in such securities and instruments.
Selling Restrictions
European Economic Area
In relation to each member state of the European Economic Area which has implemented the Prospectus Directive (each, a “Relevant Member State”), including each Relevant Member State that has implemented the 2010 PD Amending Directive with regard to persons to whom an offer of securities is addressed and the denomination per unit of the offer of securities (each, an “Early Implementing Member State”), with effect from and including the date on which the Prospectus Directive is implemented in that Relevant Member State (the “Relevant Implementation Date”), no offer of shares will be made to the public in that Relevant Member State (other than offers (the “Permitted Public Offers”) where a prospectus will be published in relation to the shares that has been approved by the competent authority in a Relevant Member State or, where appropriate, approved in another Relevant Member State and notified to the competent authority in that Relevant Member State, all in accordance with the Prospectus Directive), except that with effect from and including that Relevant Implementation Date, offers of shares may be made to the public in that Relevant Member State at any time:
| (a) | to “qualified investors” as defined in the Prospectus Directive, including: |
| (i) | (in the case of Relevant Member States other than Early Implementing Member States), legal entities which are authorized or regulated to operate in the financial markets or, if not so authorized or regulated, whose corporate purpose is solely to invest in securities, or any legal entity which has two or more of (i) an average of at least 250 employees during the last financial year; (ii) a total balance sheet of more than €43.0 million and (iii) an annual turnover of more than €50.0 million as shown in its last annual or consolidated accounts; or |
| (ii) | (in the case of Early Implementing Member States), persons or entities that are described in points (1) to (4) of Section I of Annex II to Directive 2004/39/EC, and those who are treated on request as professional clients in accordance with Annex II to Directive 2004/39/EC, or recognized as eligible counterparties in accordance with Article 24 of Directive 2004/39/EC unless they have requested that they be treated as non-professional clients; |
151
Table of Contents
Index to Financial Statements
| (b) | to fewer than 100 (or, in the case of Early Implementing Member States, 150) natural or legal persons (other than “qualified investors” as defined in the Prospectus Directive), as permitted in the Prospectus Directive, subject to obtaining the prior consent of the representatives for any such offer; or |
| (c) | in any other circumstances falling within Article 3(2) of the Prospectus Directive, provided that no such offer of shares shall result in a requirement for the publication of a prospectus pursuant to Article 3 of the Prospectus Directive or of a supplement to a prospectus pursuant to Article 16 of the Prospectus Directive. |
Each person in a Relevant Member State (other than a Relevant Member State where there is a Permitted Public Offer) who initially acquires any shares or to whom any offer is made will be deemed to have represented, acknowledged and agreed that (A) it is a “qualified investor,” and (B) in the case of any shares acquired by it as a financial intermediary, as that term is used in Article 3(2) of the Prospectus Directive, (x) the shares acquired by it in the offering have not been acquired on behalf of, nor have they been acquired with a view to their offer or resale to, persons in any Relevant Member State other than “qualified investors” as defined in the Prospectus Directive, or in circumstances in which the prior consent of the Subscribers has been given to the offer or resale, or (y) where shares have been acquired by it on behalf of persons in any Relevant Member State other than “qualified investors” as defined in the Prospectus Directive, the offer of those shares to it is not treated under the Prospectus Directive as having been made to such persons.
For the purpose of the above provisions, the expression “an offer to the public” in relation to any shares in any Relevant Member State means the communication in any form and by any means of sufficient information on the terms of the offer of any shares to be offered so as to enable an investor to decide to purchase any shares, as the same may be varied in the Relevant Member State by any measure implementing the Prospectus Directive in the Relevant Member State and the expression “Prospectus Directive” means Directive 2003/71 EC (including the 2010 PD Amending Directive, in the case of Early Implementing Member States) and includes any relevant implementing measure in each Relevant Member State and the expression “2010 PD Amending Directive” means Directive 2010/73/EU.
United Kingdom
This prospectus is only being distributed to, and is only directed at, persons in the United Kingdom that are qualified investors within the meaning of Article 2(1)(e) of the Prospectus Directive (“Qualified Investors”) that are also (i) investment professionals falling within Article 19(5) of the Financial Services and Markets Act 2000 (Financial Promotion) Order 2005 (the “Order”) or (ii) high net worth entities, and other persons to whom it may lawfully be communicated, falling within Article 49(2)(a) to (d) of the Order (all such persons together being referred to as “relevant persons”). This prospectus and its contents are confidential and should not be distributed, published or reproduced (in whole or in part) or disclosed by recipients to any other persons in the United Kingdom. Any person in the United Kingdom that is not a relevant person should not act or rely on this document or any of its contents.
Australia
No prospectus or other disclosure document (as defined in the Corporations Act 2001 (Cth) of Australia (“Corporations Act”)) in relation to the shares has been or will be lodged with the Australian Securities &
Investments Commission (“ASIC”). This document has not been lodged with ASIC and is only directed to certain categories of exempt persons. Accordingly, if you receive this document in Australia:
| (a) | you confirm and warrant that you are either: |
| (i) | a “sophisticated investor” under section 708(8)(a) or (b) of the Corporations Act; |
152
Table of Contents
Index to Financial Statements
| (ii) | a “sophisticated investor” under section 708(8)(c) or (d) of the Corporations Act and that you have provided an accountant’s certificate to us which complies with the requirements of section 708(8)(c)(i) or (ii) of the Corporations Act and related regulations before the offer has been made; |
| (iii) | a person associated with the company under section 708(12) of the Corporations Act; or |
| (iv) | a “professional investor” within the meaning of section 708(11)(a) or (b) of the Corporations Act, and to the extent that you are unable to confirm or warrant that you are an exempt sophisticated investor, associated person or professional investor under the Corporations Act any offer made to you under this document is void and incapable of acceptance; and |
| (b) | you warrant and agree that you will not offer any of the shares for resale in Australia within 12 months of those shares being issued unless any such resale offer is exempt from the requirement to issue a disclosure document under section 708 of the Corporations Act. |
Hong Kong
The shares may not be offered or sold in Hong Kong, by means of any document, other than (a) to “professional investors” as defined in the Securities and Futures Ordinance (Cap. 571, Laws of Hong Kong) and any rules made under that Ordinance or (b) in other circumstances which do not result in the document being a “prospectus” as defined in the Companies Ordinance (Cap. 32, Laws of Hong Kong) or which do not constitute an offer to the public within the meaning of that Ordinance. No advertisement, invitation or document relating to the shares may be issued or may be in the possession of any person for the purpose of the issue, whether in Hong Kong or elsewhere, which is directed at, or the contents of which are likely to be read by, the public in Hong Kong (except if permitted to do so under the laws of Hong Kong) other than with respect to the shares which are intended to be disposed of only to persons outside Hong Kong or only to “professional investors” as defined in the Securities and Futures Ordinance (Cap. 571, Laws of Hong Kong) or any rules made under that Ordinance.
India
This prospectus has not been and will not be registered as a prospectus with the Registrar of Companies in India or with the Securities and Exchange Board of India. This prospectus or any other material relating to these securities is for information purposes only and may not be circulated or distributed, directly or indirectly, to the public or any members of the public in India and in any event to not more than 50 persons in India. Further, persons into whose possession this prospectus comes are required to inform themselves about and to observe any such restrictions. Each prospective investor is advised to consult its advisors about the particular consequences to it of an investment in these securities. Each prospective investor is also advised that any investment in these securities by it is subject to the regulations prescribed by the Reserve Bank of India and the Foreign Exchange Management Act and any regulations framed thereunder.
Japan
No securities registration statement (“SRS”) has been filed under Article 4, Paragraph 1 of the Financial Instruments and Exchange Law of Japan (Law No. 25 of 1948, as amended) (“FIEL”) in relation to the shares. The shares are being offered in a private placement to “qualified institutional investors” (tekikaku-kikan-toshika) under Article 10 of the Cabinet Office Ordinance concerning Definitions provided in Article 2 of the FIEL (the Ministry of Finance Ordinance No. 14, as amended) (“QIIs”), under Article 2, Paragraph 3, Item 2 i of the FIEL. Any QII acquiring the shares in this offer may not transfer or resell those shares except to other QIIs.
Korea
The shares may not be offered, sold and delivered directly or indirectly, or offered or sold to any person for reoffering or resale, directly or indirectly, in Korea or to any resident of Korea except pursuant to the applicable
153
Table of Contents
Index to Financial Statements
laws and regulations of Korea, including the Korea Securities and Exchange Act and the Foreign Exchange Transaction Law and the decrees and regulations thereunder. The shares have not been registered with the Financial Services Commission of Korea for public offering in Korea. Furthermore, the shares may not be resold to Korean residents unless the purchaser of the shares complies with all applicable regulatory requirements (including but not limited to government approval requirements under the Foreign Exchange Transaction Law and its subordinate decrees and regulations) in connection with the purchase of the shares.
Singapore
This prospectus has not been registered as a prospectus with the Monetary Authority of Singapore. Accordingly, this prospectus and any other document or material in connection with the offer or sale, or invitation for subscription or purchase, of the shares may not be circulated or distributed, nor may the shares be offered or sold, or be made the subject of an invitation for subscription or purchase, whether directly or indirectly, to persons in Singapore other than (i) to an institutional investor under Section 274 of the Securities and Future Act, Chapter 289 of Singapore (the “SFA”), (ii) to a “relevant person” as defined in Section 275(2) of the SFA, or any person pursuant to Section 275 (1A), and in accordance with the conditions, specified in Section 275 of the SFA or (iii) otherwise pursuant to, and in accordance with the conditions of, any other applicable provision of the SFA.
Where the shares are subscribed and purchased under Section 275 of the SFA by a relevant person which is:
| (a) | a corporation (which is not an accredited investor (as defined in Section 4A of the SFA)) the sole business of which is to hold investments and the entire share capital of which is owned by one or more individuals, each of whom is an accredited investor; or |
| (b) | a trust (where the trustee is not an accredited investor (as defined in Section 4A of the SFA)) whose sole whole purpose is to hold investments and each beneficiary is an accredited investor, shares, debentures and units of shares and debentures of that corporation or the beneficiaries’ rights and interest (howsoever described) in that trust shall not be transferable within six months after that corporation or that trust has acquired the shares under Section 275 of the SFA except: |
| (i) | to an institutional investor under Section 274 of the SFA or to a relevant person (as defined in Section 275(2) of the SFA) and in accordance with the conditions, specified in Section 275 of the SFA; |
| (ii) | (in the case of a corporation) where the transfer arises from an offer referred to in Section 275(1A) of the SFA, or (in the case of a trust) where the transfer arises from an offer that is made on terms that such rights or interests are acquired at a consideration of not less than S$200,000 (or its equivalent in a foreign currency) for each transaction, whether such amount is to be paid for in cash or by exchange of securities or other assets; |
| (iii) | where no consideration is or will be given for the transfer; or |
| (iv) | where the transfer is by operation of law. |
By accepting this prospectus, the recipient hereof represents and warrants that he is entitled to receive it in accordance with the restrictions set forth above and agrees to be bound by limitations contained herein. Any failure to comply with these limitations may constitute a violation of law.
154
Table of Contents
Index to Financial Statements
Certain legal matters in connection with this offering relating to United States law and certain matters relating to United States federal income taxation will be passed upon for us by Vinson & Elkins L.L.P., Houston, Texas. The validity of the common stock being offered by this prospectus and other legal matters concerning this offering relating to Dutch law will be passed upon for us by Van Campen Liem, Amsterdam, The Netherlands. Certain legal matters in connection with this offering will be passed upon for the underwriters by Latham & Watkins LLP, Houston, Texas.
The audited combined financial statements of Frank’s International N.V. as of December 31, 2011 and 2012 and for each of the three years in the period ended December 31, 2012 included in this prospectus have been so included in reliance on the report of PricewaterhouseCoopers LLP, an independent registered public accounting firm given on the authority of such firm as experts in auditing and accounting.
155
Table of Contents
Index to Financial Statements
WHERE YOU CAN FIND MORE INFORMATION
We have filed with the SEC a registration statement on Form S-1 (including the exhibits, schedules and amendments thereto) under the Securities Act, with respect to the shares of our common stock offered hereby. This prospectus does not contain all of the information set forth in the registration statement and the exhibits and schedules thereto. For further information with respect to us and the common stock offered hereby, we refer you to the registration statement and the exhibits and schedules filed therewith. Statements contained in this prospectus as to the contents of any contract, agreement or any other document are summaries of the material terms of this contract, agreement or other document. With respect to each of these contracts, agreements or other documents filed as an exhibit to the registration statement, reference is made to the exhibits for a more complete description of the matter involved. A copy of the registration statement, and the exhibits and schedules thereto, may be inspected without charge at the public reference facilities maintained by the SEC at 100 F Street NE, Washington, D.C. 20549. Copies of these materials may be obtained, upon payment of a duplicating fee, from the Public Reference Section of the SEC at 100 F Street NE, Washington, D.C. 20549. Please call the SEC at 1-800-SEC-0330 for further information on the operation of the public reference facility. The SEC maintains a website that contains reports, proxy and information statements and other information regarding registrants that file electronically with the SEC. The address of the SEC’s website is www.sec.gov.
After we have completed this offering, we will file annual, quarterly and current reports, proxy statements and other information with the SEC. We expect to make our periodic reports and other information filed with or furnished to the SEC available, free of charge, through our website, as soon as reasonably practicable after those reports and other information are electronically filed with or furnished to the SEC. Information on our website or any other website is not incorporated by reference into this prospectus and does not constitute a part of this prospectus. We will provide electronic or paper copies of our filings free of charge upon request.
156
Table of Contents
Index to Financial Statements
FRANK’S INTERNATIONAL
F-1
Table of Contents
Index to Financial Statements
FRANK’S INTERNATIONAL
UNAUDITED PRO FORMA CONDENSED FINANCIAL STATEMENTS
The following unaudited pro forma condensed financial statements of Frank’s International (the “Company”) reflect the historical combined financial statements of Frank’s International on a pro forma basis. Under the combined method of accounting, the historical consolidated financial statements of Frank’s International N.V., Frank’s International, Inc., Frank’s Casing Crew and Rental Tools, Inc. and Frank’s Tong Service, Inc. and their wholly owned subsidiaries are combined as if Frank’s International operated as a single entity.
The pro forma adjustments give effect to (i) the carve-out distribution of certain assets and liabilities from the Company’s U.S. operating subsidiaries to Mosing Holdings, Inc., (ii) the corporate reorganization described in “Organizational Structure” and (iii) the issuance and sale of sale of shares of the Company’s common stock to the public for estimated net proceeds of $562.0 million and the application by the Company of the net proceeds from such issuance as described in “Use of Proceeds.”
The unaudited pro forma condensed balance sheet is based on Frank’s International’s unaudited historical combined balance sheet as of March 31, 2013 and includes the pro forma adjustments summarized above as if they had occurred on March 31, 2013.
The unaudited pro forma condensed statement of income for the year ended December 31, 2012 is based on Frank’s International’s audited historical combined statement of income and the unaudited pro forma condensed statement of income for the three months ended March 31, 2013 is based on Frank’s International unaudited historical combined statement of income. The pro forma adjustments summarized above are included as if they had occurred on January 1, 2012.
In addition, an additional set of pro forma condensed financial statements has also been prepared reflecting an alternative scenario under which, in addition to the adjustments discussed above, additional adjustments were made to reflect the full conversion of shares of Series A preferred stock into FINV common stock (the “Conversion Right”).
The unaudited pro forma condensed financial statements should be read in conjunction with the notes accompanying these unaudited pro forma condensed financial statements and with Frank’s International’s historical combined financial statements and related notes found elsewhere in this prospectus.
The pro forma adjustments to the audited financial statements are based on currently available information and certain estimates and assumptions. The actual effect of the pro forma adjustments discussed in the accompanying notes ultimately may differ from the unaudited pro forma adjustments included herein. However, management believes that the assumptions used to prepare the pro forma adjustments provide a reasonable basis for presenting the significant effects as currently contemplated and that the unaudited pro forma adjustments are factually supportable, give appropriate effect to the expected impact of events that are directly attributable to the pro forma adjustments, and reflect those items expected to have a continuing impact on the Company.
The unaudited pro forma condensed financial statements are not necessarily indicative of the results that actually would have occurred if the Company had completed the transactions on the dates indicated or that could be achieved in the future.
Upon completion of this offering, the Company anticipates that general and administrative expenses will increase as a result of being a publicly traded company, including: expenses associated with annual and quarterly reporting; tax return preparation expenses; Sarbanes-Oxley compliance expenses; expenses associated with listing on the New York Stock Exchange; independent auditor fees; legal fees; investor relations expenses; and registrar and transfer agent fees. The unaudited pro forma financial statements do not reflect these additional public company costs.
F-2
Table of Contents
Index to Financial Statements
FRANK’S INTERNATIONAL
UNAUDITED PRO FORMA CONDENSED BALANCE SHEET
March 31, 2013
(in thousands)
| FINV Historical |
Distribution of Assets and Liabilities |
Reorganization Transactions |
FINV Pro Forma |
Offering Related Adjustments |
FINV As Adjusted for Offering |
|||||||||||||||||||
| Assets |
||||||||||||||||||||||||
| Current assets: |
||||||||||||||||||||||||
| Cash and cash equivalents |
$ | 123,392 | $ | — | $ | — | $ | 123,392 | $ | 562,000 | (f) | $ | 241,684 | |||||||||||
| (443,708 | )(g) | |||||||||||||||||||||||
| Accounts receivable, net |
319,057 | (6,769 | )(a) | — | 312,288 | — | 312,288 | |||||||||||||||||
| Inventories |
128,471 | — | — | 128,471 | — | 128,471 | ||||||||||||||||||
| Other current assets |
15,556 | (2,750 | )(a) | — | 12,806 | — | 12,806 | |||||||||||||||||
|
|
|
|
|
|
|
|
|
|
|
|
|
|||||||||||||
| Total current assets |
586,476 | (9,519 | ) | — | 576,957 | 118,292 | 695,249 | |||||||||||||||||
| Property, plant and equipment, net |
449,789 | (24,702 | )(a) | — | 425,087 | — | 425,087 | |||||||||||||||||
| Goodwill |
15,239 | — | — | 15,239 | — | 15,239 | ||||||||||||||||||
| Intangible assets |
1,595 | — | — | 1,595 | — | 1,595 | ||||||||||||||||||
| Other assets, net |
76,219 | (29,367 | )(a) | — | 46,852 | — | 46,852 | |||||||||||||||||
|
|
|
|
|
|
|
|
|
|
|
|
|
|||||||||||||
| Total assets |
$ | 1,129,318 | $ | (63,588 | ) | $ | — | $ | 1,065,730 | $ | 118,292 | $ | 1,184,022 | |||||||||||
|
|
|
|
|
|
|
|
|
|
|
|
|
|||||||||||||
| Liabilities and Shareholders’ Equity |
||||||||||||||||||||||||
| Current liabilities: |
||||||||||||||||||||||||
| Current portion of long-term debt |
$ | 4,815 | $ | (799 | )(a) | $ | — | $ | 4,016 | $ | — | $ | 4,016 | |||||||||||
| Current portion of notes payable— affiliates |
323,476 | (595 | )(a) | — | 322,881 | (320,000 | )(g) | 2,881 | ||||||||||||||||
| Accounts payable |
26,134 | (2 | )(a) | — | 26,132 | — | 26,132 | |||||||||||||||||
| Accrued expenses and other current liabilities |
115,797 | — | 115,797 | — | 115,797 | |||||||||||||||||||
|
|
|
|
|
|
|
|
|
|
|
|
|
|||||||||||||
| Total current liabilities |
470,222 | (1,396 | ) | — | 468,826 | (320,000 | ) | 148,826 | ||||||||||||||||
|
|
|
|
|
|
|
|
|
|
|
|
|
|||||||||||||
| Long-term debt |
||||||||||||||||||||||||
| Long-term debt |
1,043 | — | — | 1,043 | — | 1,043 | ||||||||||||||||||
| Notes payable—affiliates |
125,362 | (1,654 | )(a) | — | 123,708 | (123,708 | )(g) | — | ||||||||||||||||
|
|
|
|
|
|
|
|
|
|
|
|
|
|||||||||||||
| Total long-term debt |
126,405 | (1,654 | ) | — | 124,751 | (123,708 | ) | 1,043 | ||||||||||||||||
|
|
|
|
|
|
|
|
|
|
|
|
|
|||||||||||||
| Deferred tax liability, net |
6,029 | — | — | 6,029 | — | 6,029 | ||||||||||||||||||
| Other non-current liabilities |
33,011 | — | — | 33,011 | — | 33,011 | ||||||||||||||||||
|
|
|
|
|
|
|
|
|
|
|
|
|
|||||||||||||
| Total liabilities |
635,667 | (3,050 | ) | — | 632,617 | (443,708 | ) | 188,909 | ||||||||||||||||
|
|
|
|
|
|
|
|
|
|
|
|
|
|||||||||||||
| Series A preferred stock |
— | — | 689 | (d) | 689 | — | 689 | |||||||||||||||||
|
|
|
|
|
|
|
|
|
|
|
|
|
|||||||||||||
| Shareholders’ equity |
||||||||||||||||||||||||
| Common stock |
803 | — | — | 803 | 1,134 | (f) | 1,937 | |||||||||||||||||
| Additional paid-in capital |
1,409 | — | (689 | )(d) | 720 | 560,866 | (f) | 561,586 | ||||||||||||||||
| Retained earnings |
491,145 | (60,538 | )(a) | (112,930 | )(c) | 317,677 | — | 317,677 | ||||||||||||||||
| Accumulated other comprehensive income |
294 | — | (77 | )(c) | 217 | — | 217 | |||||||||||||||||
|
|
|
|
|
|
|
|
|
|
|
|
|
|||||||||||||
| Total shareholders’ equity |
493,651 | (60,538 | ) | (113,696 | ) | 319,417 | 562,000 | 881,417 | ||||||||||||||||
| Non-controlling interest |
— | — | 113,007 | (c) | 113,007 | — | 113,007 | |||||||||||||||||
|
|
|
|
|
|
|
|
|
|
|
|
|
|||||||||||||
| Total shareholders’ equity |
493,651 | (60,538 | ) | (689 | ) | 432,424 | 562,000 | 994,424 | ||||||||||||||||
|
|
|
|
|
|
|
|
|
|
|
|
|
|||||||||||||
| Total liabilities and shareholders’ equity |
$ | 1,129,318 | $ | (63,588 | ) | $ | — | $ | 1,065,730 | $ | 118,292 | $ | 1,184,022 | |||||||||||
|
|
|
|
|
|
|
|
|
|
|
|
|
|||||||||||||
The accompanying notes are an integral part of these unaudited pro forma condensed financial statements.
F-3
Table of Contents
Index to Financial Statements
FRANK’S INTERNATIONAL
UNAUDITED PRO FORMA CONDENSED STATEMENT OF INCOME
For the Year Ended December 31, 2012
(In thousands, except per share data)
| FINV Historical |
Distribution of Assets and Liabilities |
Reorganization Transactions |
FINV Pro Forma |
Offering Related Adjustments |
FINV As Adjusted for Offering |
|||||||||||||||||||
| Revenues |
||||||||||||||||||||||||
| Equipment rentals and services |
$ | 880,084 | $ | (1,146 | )(a) | $ | — | $ | 878,938 | $ | — | $ | 878,938 | |||||||||||
| Products |
175,841 | — | — | 175,841 | — | 175,841 | ||||||||||||||||||
|
|
|
|
|
|
|
|
|
|
|
|
|
|||||||||||||
| Total revenues |
1,055,925 | (1,146 | ) | — | 1,054,779 | — | 1,054,779 | |||||||||||||||||
|
|
|
|
|
|
|
|
|
|
|
|
|
|||||||||||||
| Operating expenses |
||||||||||||||||||||||||
| Cost of revenues, exclusive of depreciation and amortization |
||||||||||||||||||||||||
| Equipment rentals and services |
314,950 | — | — | 314,950 | — | 314,950 | ||||||||||||||||||
| Products |
119,527 | — | — | 119,527 | — | 119,527 | ||||||||||||||||||
| General and administrative |
187,033 | (3,580 | )(a) | — | 188,409 | — | 188,409 | |||||||||||||||||
| 4,956 | (b) | |||||||||||||||||||||||
| Depreciation and amortization |
66,215 | (2,067 | )(a) | — | 64,148 | — | 64,148 | |||||||||||||||||
| Gain on sale of assets |
(2,608 | ) | — | — | (2,608 | ) | — | (2,608 | ) | |||||||||||||||
|
|
|
|
|
|
|
|
|
|
|
|
|
|||||||||||||
| Operating income (loss) |
370,808 | (455 | ) | — | 370,353 | — | 370,353 | |||||||||||||||||
|
|
|
|
|
|
|
|
|
|
|
|
|
|||||||||||||
| Other income (expense): |
||||||||||||||||||||||||
| Other income |
12,189 | — | — | 12,189 | — | 12,189 | ||||||||||||||||||
| Interest income (expense), net |
264 | 204 | (a) | — | 468 | 570 | (g) | 1,038 | ||||||||||||||||
| Foreign currency loss |
(450 | ) | — | — | (450 | ) | — | (450 | ) | |||||||||||||||
|
|
|
|
|
|
|
|
|
|
|
|
|
|||||||||||||
| Total other income (expense) |
12,003 | 204 | — | 12,207 | 570 | 12,777 | ||||||||||||||||||
|
|
|
|
|
|
|
|
|
|
|
|
|
|||||||||||||
| Income (loss) before income taxes |
382,811 | (251 | ) | — | 382,560 | 570 | 383,130 | |||||||||||||||||
| Income tax expense |
31,877 | — | 57,463 | (e) | 89,340 | 229 | (g) | 89,569 | ||||||||||||||||
|
|
|
|
|
|
|
|
|
|
|
|
|
|||||||||||||
| Net income |
350,934 | (251 | ) | (57,463 | ) | 293,220 | 341 | 293,561 | ||||||||||||||||
| Non-controlling interest |
— | — | (91,969 | )(c) | (91,969 | ) | (90 | )(g) | (92,059 | ) | ||||||||||||||
|
|
|
|
|
|
|
|
|
|
|
|
|
|||||||||||||
| Net income (loss) attributable to Frank’s International |
350,934 | (251 | ) | (149,432 | ) | 201,251 | 251 | 201,502 | ||||||||||||||||
| Preferred stock dividends |
— | — | (2 | )(d) | (2 | ) | — | (2 | ) | |||||||||||||||
|
|
|
|
|
|
|
|
|
|
|
|
|
|||||||||||||
| Net income (loss) attributable to common shareholders |
$ | 350,934 | $ | (251 | ) | $ | (149,434 | ) | $ | 201,249 | $ | 251 | $ | 201,500 | ||||||||||
|
|
|
|
|
|
|
|
|
|
|
|
|
|||||||||||||
| Basic and diluted earnings per share |
$ | 1.35 | ||||||||||||||||||||||
|
|
|
|||||||||||||||||||||||
| Basic and diluted weighted average shares common stock outstanding |
149,024 | |||||||||||||||||||||||
|
|
|
|||||||||||||||||||||||
The accompanying notes are an integral part of these unaudited pro forma condensed financial statements.
F-4
Table of Contents
Index to Financial Statements
FRANK’S INTERNATIONAL
UNAUDITED PRO FORMA CONDENSED STATEMENT OF INCOME
For the Three Months Ended March 31, 2013
(In thousands, except per share data)
| FINV Historical |
Distribution of Assets and Liabilities |
Reorganization Transactions |
FINV Pro Forma |
Offering Related Adjustments |
FINV As Adjusted for Offering |
|||||||||||||||||||
| Revenues |
||||||||||||||||||||||||
| Equipment rentals and services |
$ | 205,878 | $ | (235 | )(a) | $ | — | $ | 205,643 | $ | — | $ | 205,643 | |||||||||||
| Products |
30,882 | — | — | 30,882 | — | 30,882 | ||||||||||||||||||
|
|
|
|
|
|
|
|
|
|
|
|
|
|||||||||||||
| Total revenues |
236,760 | (235 | ) | — | 236,525 | — | 236,525 | |||||||||||||||||
|
|
|
|
|
|
|
|
|
|
|
|
|
|||||||||||||
| Operating expenses |
||||||||||||||||||||||||
| Cost of revenues, excluding depreciation and amortization |
||||||||||||||||||||||||
| Equipment rentals and services |
75,781 | — | — | 75,781 | — | 75,781 | ||||||||||||||||||
| Products |
18,019 | — | — | 18,019 | — | 18,019 | ||||||||||||||||||
| General and administrative |
44,145 | 50 | (a) | — | 45,434 | — | 45,434 | |||||||||||||||||
| 1,239 | (b) | |||||||||||||||||||||||
| Depreciation and amortization |
17,783 | (419 | )(a) | — | 17,364 | — | 17,364 | |||||||||||||||||
| Loss on sale of assets |
23 | — | — | 23 | — | 23 | ||||||||||||||||||
|
|
|
|
|
|
|
|
|
|
|
|
|
|||||||||||||
| Operating income (loss) |
81,009 | (1,105 | ) | — | 79,904 | — | 79,904 | |||||||||||||||||
|
|
|
|
|
|
|
|
|
|
|
|
|
|||||||||||||
| Other income (expense): |
||||||||||||||||||||||||
| Other income |
2,127 | — | — | 2,127 | — | 2,127 | ||||||||||||||||||
| Interest income (expense), net |
(201 | ) | 34 | (a) | — | (167 | ) | 250 | (g) | 83 | ||||||||||||||
| Foreign currency loss |
(3,587 | ) | — | — | (3,587 | ) | — | (3,587 | ) | |||||||||||||||
|
|
|
|
|
|
|
|
|
|
|
|
|
|||||||||||||
| (1,661 | ) | 34 | — | (1,627 | ) | 250 | (1,377 | ) | ||||||||||||||||
|
|
|
|
|
|
|
|
|
|
|
|
|
|||||||||||||
| Income (loss) before income taxes |
79,348 | (1,071 | ) | — | 78,277 | 250 | 78,527 | |||||||||||||||||
| Income tax expense |
6,303 | — | 11,431 | (e) | 17,734 | 100 | (g) | 17,834 | ||||||||||||||||
|
|
|
|
|
|
|
|
|
|
|
|
|
|||||||||||||
| Net income |
73,045 | (1,071 | ) | (11,431 | ) | 60,543 | 150 | 60,693 | ||||||||||||||||
| Non-controlling interest |
— | — | (18,876 | )(c) | (18,876 | ) | (39 | )(g) | (18,915 | ) | ||||||||||||||
|
|
|
|
|
|
|
|
|
|
|
|
|
|||||||||||||
| Net income (loss) attributable to Frank’s International |
73,045 | (1,071 | ) | (30,307 | ) | 41,667 | 111 | 41,778 | ||||||||||||||||
| Preferred stock dividends |
— | — | — | (d) | — | — | — | |||||||||||||||||
|
|
|
|
|
|
|
|
|
|
|
|
|
|||||||||||||
| Net income (loss) attributable to common stockholders |
$ | 73,045 | $ | (1,071 | ) | $ | (30,307 | ) | $ | 41,667 | $ | 111 | $ | 41,778 | ||||||||||
|
|
|
|
|
|
|
|
|
|
|
|
|
|||||||||||||
| Basic and diluted earnings per share |
$ | 0.28 | ||||||||||||||||||||||
|
|
|
|||||||||||||||||||||||
| Basic and diluted weighted average shares common stock outstanding |
149,024 | |||||||||||||||||||||||
|
|
|
|||||||||||||||||||||||
The accompanying notes are an integral part of these unaudited pro forma condensed financial statements.
F-5
Table of Contents
Index to Financial Statements
FRANK’S INTERNATIONAL
UNAUDITED PRO FORMA CONDENSED BALANCE SHEET
March 31, 2013
(in thousands)
| FINV As Adjusted for Offering |
Exercise of Conversion Rights |
FINV As Adjusted for Conversion |
||||||||||
| Assets |
||||||||||||
| Current assets: |
||||||||||||
| Cash and cash equivalents |
$ | 241,684 | $ | — | $ | 241,684 | ||||||
| Accounts receivable, net |
312,288 | — | 312,288 | |||||||||
| Inventories |
128,471 | — | 128,471 | |||||||||
| Other current assets |
12,806 | — | 12,806 | |||||||||
|
|
|
|
|
|
|
|||||||
| Total current assets |
695,249 | — | 695,249 | |||||||||
| Property, plant and equipment, net |
425,087 | — | 425,087 | |||||||||
| Goodwill |
15,239 | — | 15,239 | |||||||||
| Intangible assets |
1,595 | — | 1,595 | |||||||||
| Deferred tax asset |
— | 77,393 | (h) | 77,393 | ||||||||
| Other assets, net |
46,852 | — | 46,852 | |||||||||
|
|
|
|
|
|
|
|||||||
| $ | 1,184,022 | $ | 77,393 | $ | 1,261,415 | |||||||
|
|
|
|
|
|
|
|||||||
| Liabilities and Stockholders’ Equity |
||||||||||||
| Current liabilities: |
||||||||||||
| Current portion of long-term debt |
$ | 4,016 | $ | — | $ | 4,016 | ||||||
| Current portion of notes payable—affiliates |
2,881 | — | 2,881 | |||||||||
| Accounts payable |
26,132 | — | 26,132 | |||||||||
| Accrued expenses and other current liabilities |
115,797 | — | 115,797 | |||||||||
|
|
|
|
|
|
|
|||||||
| Total current liabilities |
148,826 | — | 148,826 | |||||||||
|
|
|
|
|
|
|
|||||||
| Long-term debt |
||||||||||||
| Long-term debt |
1,043 | — | 1,043 | |||||||||
| Notes payable—affiliates |
— | — | — | |||||||||
|
|
|
|
|
|
|
|||||||
| Total long-term debt |
1,043 | — | 1,043 | |||||||||
|
|
|
|
|
|
|
|||||||
| Deferred tax liability, net |
6,029 | — | 6,029 | |||||||||
| Other non-current liabilities |
33,011 | 105,956 | (h) | 138,967 | ||||||||
|
|
|
|
|
|
|
|||||||
| Total liabilities |
188,909 | 105,956 | 294,865 | |||||||||
|
|
|
|
|
|
|
|||||||
| Series A preferred stock |
689 | (689 | ) (h) | — | ||||||||
|
|
|
|
|
|
|
|||||||
| Stockholders’ equity |
||||||||||||
| Common stock |
1,937 | 689 | (h) | 2,626 | ||||||||
| Additional paid-in capital |
561,586 | (28,563) | (h) | 533,023 | ||||||||
| Retained earnings |
317,677 | 112,930 | (h) | 430,607 | ||||||||
| Accumulated other comprehensive income |
217 | 77 | (h) | 294 | ||||||||
|
|
|
|
|
|
|
|||||||
| Total stockholders’ equity |
881,417 | 85,133 | 966,550 | |||||||||
| Non-controlling interest |
113,007 | (113,007) | (h) | — | ||||||||
|
|
|
|
|
|
|
|||||||
| Total stockholders’ equity |
994,424 | (27,874 | ) | 966,550 | ||||||||
|
|
|
|
|
|
|
|||||||
| Total liabilities and stockholders’ equity |
$ | 1,184,022 | $ | 77,393 | $ | 1,261,415 | ||||||
|
|
|
|
|
|
|
|||||||
The accompanying notes are an integral part of these unaudited pro forma condensed financial statements.
F-6
Table of Contents
Index to Financial Statements
FRANK’S INTERNATIONAL
UNAUDITED PRO FORMA CONDENSED STATEMENT OF INCOME
For the Year Ended December 31, 2012
(In thousands, except per share data)
| FINV As Adjusted for Offering |
Exercise of Conversion Rights |
FINV As Adjusted for Conversion |
||||||||||
| Revenues |
||||||||||||
| Equipment rentals and services |
$ | 878,938 | $ | — | $ | 878,938 | ||||||
| Products |
175,841 | — | 175,841 | |||||||||
|
|
|
|
|
|
|
|||||||
| Total revenues |
1,054,779 | — | 1,054,779 | |||||||||
|
|
|
|
|
|
|
|||||||
| Operating expenses |
||||||||||||
| Cost of revenues, excluding depreciation and amortization |
||||||||||||
| Equipment rentals and services |
314,950 | — | 314,950 | |||||||||
| Products |
119,527 | — | 119,527 | |||||||||
| General and administrative |
188,409 | — | 188,409 | |||||||||
| Depreciation and amortization |
64,148 | — | 64,148 | |||||||||
| Gain on sale of assets |
(2,608 | ) | — | (2,608 | ) | |||||||
|
|
|
|
|
|
|
|||||||
| Operating income |
370,353 | — | 370,353 | |||||||||
|
|
|
|
|
|
|
|||||||
| Other income (expense): |
||||||||||||
| Other income |
12,189 | — | 12,189 | |||||||||
| Interest income (expense), net |
1,038 | — | 1,038 | |||||||||
| Foreign currency loss |
(450 | ) | — | (450 | ) | |||||||
|
|
|
|
|
|
|
|||||||
| 12,777 | — | 12,777 | ||||||||||
|
|
|
|
|
|
|
|||||||
| Income before income taxes |
383,130 | — | 383,130 | |||||||||
| Income tax expense |
89,569 | 20,400 | (h) | 109,969 | ||||||||
|
|
|
|
|
|
|
|||||||
| Net income |
293,561 | (20,400 | ) | 273,161 | ||||||||
| Non-controlling interest |
(92,059 | ) | 92,059 | (h) | — | |||||||
|
|
|
|
|
|
|
|||||||
| Net income attributable to Frank’s International |
201,502 | 71,659 | 273,161 | |||||||||
| Preferred stock dividends |
(2 | ) | 2 | — | ||||||||
|
|
|
|
|
|
|
|||||||
| Net income attributable to common stockholders |
$ | 201,500 | $ | 71,661 | $ | 273,161 | ||||||
|
|
|
|
|
|
|
|||||||
| Basic and diluted earnings per share |
$ | 1.35 | ||||||||||
|
|
|
|||||||||||
| Basic and diluted weighted average shares common stock outstanding |
202,000 | |||||||||||
|
|
|
|||||||||||
The accompanying notes are an integral part of these unaudited pro forma condensed financial statements.
F-7
Table of Contents
Index to Financial Statements
FRANK’S INTERNATIONAL
UNAUDITED PRO FORMA CONDENSED STATEMENT OF INCOME
For the Three Months Ended March 31, 2013
(In thousands, except per share data)
| FINV As Adjusted for Offering |
Exercise of Conversion Rights |
FINV As Adjusted for Conversion |
||||||||||
| Revenues |
||||||||||||
| Equipment rentals and services |
$ | 205,643 | $ | — | $ | 205,643 | ||||||
| Products |
30,882 | — | 30,882 | |||||||||
|
|
|
|
|
|
|
|||||||
| Total revenues |
236,525 | — | 236,525 | |||||||||
|
|
|
|
|
|
|
|||||||
| Operating expenses |
||||||||||||
| Cost of revenues, excluding depreciation and amortization |
||||||||||||
| Equipment rentals and services |
75,781 | 75,781 | ||||||||||
| Products |
18,019 | 18,019 | ||||||||||
| General and administrative |
45,434 | — | 45,434 | |||||||||
| Depreciation and amortization |
17,364 | — | 17,364 | |||||||||
| Loss on sale of assets |
23 | — | 23 | |||||||||
|
|
|
|
|
|
|
|||||||
| Operating income |
79,904 | — | 79,904 | |||||||||
|
|
|
|
|
|
|
|||||||
| Other income (expense): |
||||||||||||
| Other income |
2,127 | — | 2,127 | |||||||||
| Interest income (expense), net |
83 | — | 83 | |||||||||
| Foreign currency loss |
(3,587 | ) | — | (3,587 | ) | |||||||
|
|
|
|
|
|
|
|||||||
| Total other income (expense) |
(1,377 | ) | — | (1,377 | ) | |||||||
|
|
|
|
|
|
|
|||||||
| Income before income taxes |
78,527 | — | 78,527 | |||||||||
| Income tax expense |
17,834 | 4,058 | (h) | 21,892 | ||||||||
|
|
|
|
|
|
|
|||||||
| Net income |
60,693 | (4,058 | ) | 56,635 | ||||||||
| Non-controlling interest |
(18,915 | ) | 18,915 | (h) | — | |||||||
|
|
|
|
|
|
|
|||||||
| Net income attributable to Frank’s International |
41,778 | 14,857 | 56,635 | |||||||||
| Preferred stock dividends |
— | — | — | |||||||||
|
|
|
|
|
|
|
|||||||
| Net income attributable to common stockholders |
$ | 41,778 | $ | 14,857 | $ | 56,635 | ||||||
|
|
|
|
|
|
|
|||||||
| Basic and diluted earnings per share |
$ | 0.28 | ||||||||||
|
|
|
|||||||||||
| Basic and diluted weighted average shares common stock outstanding |
202,000 | |||||||||||
|
|
|
|||||||||||
The accompanying notes are an integral part of these unaudited pro forma condensed financial statements.
F-8
Table of Contents
Index to Financial Statements
FRANK’S INTERNATIONAL
NOTES TO UNAUDITED PRO FORMA CONDENSED FINANCIAL STATEMENTS
Note 1—Basis of Presentation
Under the combined method of accounting, the historical consolidated financial statements of Frank’s International N.V., Frank’s International, Inc., Frank’s Casing Crew and Rental Tools, Inc. and Frank’s Tong Service, Inc. and their wholly owned subsidiaries are combined as if Frank’s International operated as a single entity.
The unaudited pro forma condensed balance sheet of Frank’s International (the “Company”) as of March 31, 2013 is based on Frank’s International’s unaudited historical combined balance sheet and includes pro forma adjustments to give effect to the transactions as described below as if they had occurred on March 31, 2013.
The unaudited pro forma condensed statement of income for the year ended December 31, 2012 is based on Frank’s International’s audited historical combined statement of income and the unaudited pro forma condensed statement of income for the three months ended March 31, 2013 is based on Frank’s International unaudited historical combined statement of income. The pro forma adjustments are included to give effect to the transactions as described below as if they had occurred on January 1, 2012.
The unaudited pro forma financial statements give effect to the following transactions:
| • | the carve-out distribution of certain assets and liabilities from the Company’s U.S. operating subsidiaries to Mosing Holdings, Inc.; |
| • | the corporate reorganization (the “Reorganization”) described in “Organizational Structure”; and |
| • | the issuance and sale by the Company of 30,000,000 shares of common stock to the public, representing 14.9% of the voting interest in the Company, at an assumed initial offering price of $20.00 per share (the midpoint of the price range set forth on the cover page of this prospectus) and the application by the Company of the net proceeds from such issuance (the “Offering”) as described in “Use of Proceeds.” |
Note 2—Pro Forma Adjustments and Assumptions
Distribution of Assets and Liabilities to Mosing Holdings, Inc.
| (a) | Adjustments to reflect the assets and liabilities that will be distributed to Mosing Holdings, Inc. These assets and liabilities relate to (i) Frank’s International’s aviation ownership and operations, (ii) split-dollar life insurance policies and associated accounts receivable held for the Company’s chief executive officer and other members of the Mosing family and (iii) certain real estate. Revenues and expenses associated with the assets and liabilities to be distributed are also being eliminated from the Company’s pro forma statement of income. |
F-9
Table of Contents
Index to Financial Statements
FRANK’S INTERNATIONAL
NOTES TO UNAUDITED PRO FORMA CONDENSED FINANCIAL STATEMENTS
The primary components of this adjustment include (in thousands):
| Balance Sheet Item |
Description |
Amount | ||||
| Accounts receivable, net |
Miscellaneous accounts receivable with Mosing Holdings, Inc. | $ | 6,769 | |||
|
|
|
|||||
| Other current assets |
Note receivable related to life insurance | $ | 2,750 | |||
|
|
|
|||||
| Property, plant & equipment |
Aircraft, net | $ | 2,538 | |||
| Property, plant & equipment |
Buildings, net | 16,897 | ||||
| Property, plant & equipment |
Land | 4,754 | ||||
| Property, plant & equipment |
Leasehold improvements | 513 | ||||
|
|
|
|||||
| Property, plant & equipment total |
$ | 24,702 | ||||
|
|
|
|||||
| Other assets, net |
Investment in KM Partners | $ | 2,549 | |||
| Other assets, net |
Split dollar life insurance | 20,546 | ||||
| Other assets, net |
Receivable with Mosing Properties | 500 | ||||
| Other assets, net |
Notes receivable related to life insurance | 5,772 | ||||
|
|
|
|||||
| Other assets, net total |
$ | 29,367 | ||||
|
|
|
|||||
| (b) | As a result of the distribution of the real estate and aviation assets to Mosing Holdings, Inc., the Company will enter into real estate lease agreements pursuant to which the Company will incur additional rental expense of approximately $3.8 million per year for continued use of the real estate. In addition, the Company will enter into an aviation services agreement pursuant to which the Company will incur additional charter service expense of approximately $1.1 million per year for continued use of the aircraft. |
Reorganization
| (c) | Reflects the pro forma adjustments to non-controlling interest, retained earnings and income attributable to non-controlling interest to reflect the ownership interest of Frank’s International C.V. (“FICV”) that will not be owned by the Company. |
| Following the Reorganization and the Offering, the Company will be a holding company, with its sole material assets being its indirect ownership of 73.7% of the limited partnership interests and 0.1% of the general partnership interest of FICV. Mosing Holdings, Inc. will own the remaining 26.2% of the limited partnership interests. |
| In addition, the Company will also indirectly own the general partnership interests of FICV. As the owner of the general partner of FICV, the Company will control the business and affairs of FICV and its subsidiaries. The Company will consolidate all financial results of FICV and its subsidiaries, and it will recognize as non-controlling interest the 26.2% limited partnership interest that Mosing Holdings, Inc. will hold in FICV. |
| (d) | Reflects the issuance to Mosing Holdings, Inc. of 52,976,000 shares of FINV Series A preferred stock as part of the Reorganization. The annual aggregate dividend requirement on the shares of Series A preferred stock of approximately €1,324 is based on the stated dividend rate on the Series A preferred stock of 0.25%. |
| (e) | Reflects incremental income taxes based on the tax consequences of the Reorganization. |
F-10
Table of Contents
Index to Financial Statements
FRANK’S INTERNATIONAL
NOTES TO UNAUDITED PRO FORMA CONDENSED FINANCIAL STATEMENTS
Offering
| (f) | Reflects the proceeds to the Company of $562.0 million from the issuance and sale of 30 million shares of common stock in the Offering at an assumed initial public offering price of $20.00 per share (the midpoint of the price range set forth on the cover page of this prospectus), net of aggregate offering costs of $38.0 million. |
| (g) | Reflects the repayment of the notes payable to FWW B.V., which is controlled by the Mosing family, and the elimination of the related interest expense. |
Exercise of Conversion Rights
| (h) | Reflects the exercise of all of the Conversion Rights held by the Series A preferred stockholders into shares of FINV common stock and the related delivery of all of their interests in FICV. |
| Future conversions of our Series A preferred stock by our existing stockholders could result in changes to our deferred tax asset, deferred tax liabilities and amounts owed under our tax receivable agreement. These adjustments give effect to the tax receivable agreement (as described in “Certain Relationships and Related Transactions—Tax Receivable Agreement”) assuming all of the Series A preferred stock is converted into FINV common stock concurrent with the offering. These adjustments are based on the following assumptions: |
| • | we will record an increase of $77.4 million in deferred tax assets for the estimated income tax effect of the increase in the tax basis of the purchased interests, based on an effective income tax rate of 40.1% (which includes a provision for U.S. federal, state and local income taxes). The deferred assets arise from taxable temporary differences primarily related to additional tax over book basis in intangible assets and property, plant and equipment; |
| • | we will record $106.0 million, representing 85% of the estimated realizable tax benefit resulting from the increase in the tax basis of the purchased interests as noted above, as an increase to the liability under the tax receivable agreement; |
| • | we will record a decrease of $28.6 million to additional paid-in capital which is an amount equal to the difference between the increase in deferred tax assets and the increase in the liability due to existing owners under the tax receivable agreement; and |
| • | there are no material changes in the relevant tax law and that we earn sufficient taxable income in each year to realize the full tax benefit of the amortization of our assets. |
The amount of liability that we recognize under the tax receivable agreement does not correspond with the amount of the increase in our deferred tax asset due to the difference in the basis in our assets and liabilities for tax purposes and the basis in our assets and liabilities for financial reporting purposes. The liability under the tax receivable agreement is based on the estimated realizable tax benefit resulting from the increase in the basis in our assets and liabilities for tax purposes as a result of the exercise of the Conversion Right. The amount of the increase in our deferred tax asset is based on the difference between the historical book value of our assets and liabilities and the stepped-up tax basis in our assets and liabilities as a result of the exercise of the Conversion Right. Because our basis in our assets and liabilities for tax purposes is lower than our basis in our assets and liabilities for financial reporting purposes prior to the conversions, the estimated realizable tax benefit from the exercise of the Conversion Right is greater than the increase in our deferred tax asset.
Note 3—Pro Forma Earnings Per Share
Pro forma earnings per share is determined by dividing the pro forma net income attributable to common shareholders by the number of common shares expected to be outstanding following the offering. All shares were assumed to have been outstanding since January 1, 2012.
F-11
Table of Contents
Index to Financial Statements
Report of Independent Registered Public Accounting Firm
To the Board of Directors and Stockholders of Frank’s International N.V.
In our opinion, the accompanying combined balance sheets and the related combined results of operations, comprehensive income, stockholders’ equity and cash flows present fairly, in all material respects, the financial position of Frank’s International N.V. (the “Company”) at December 31, 2012 and 2011, and the results of their operations and their cash flows for each of the three years in the period ended December 31, 2012 in conformity with accounting principles generally accepted in the United States of America. These financial statements are the responsibility of the Company’s management. Our responsibility is to express an opinion on these financial statements based on our audits. We conducted our audits of these statements in accordance with the standards of the Public Company Accounting Oversight Board (United States). Those standards require that we plan and perform the audit to obtain reasonable assurance about whether the financial statements are free of material misstatement. An audit includes examining, on a test basis, evidence supporting the amounts and disclosures in the financial statements, assessing the accounting principles used and significant estimates made by management, and evaluating the overall financial statement presentation. We believe that our audits provide a reasonable basis for our opinion.
/s/ PricewaterhouseCoopers LLP
Houston, Texas
May 10, 2013
F-12
Table of Contents
Index to Financial Statements
FRANK’S INTERNATIONAL
(In thousands)
| December 31, | ||||||||
| 2011 | 2012 | |||||||
| Assets |
||||||||
| Current assets: |
||||||||
| Cash and cash equivalents |
$ | 98,649 | $ | 152,945 | ||||
| Accounts receivable, net |
233,945 | 313,657 | ||||||
| Inventories |
92,073 | 108,543 | ||||||
| Other current assets |
17,187 | 16,632 | ||||||
|
|
|
|
|
|||||
| Total current assets |
441,854 | 591,777 | ||||||
| Property, plant and equipment, net |
324,881 | 426,500 | ||||||
| Goodwill |
15,239 | 15,239 | ||||||
| Intangible assets, net |
3,261 | 1,832 | ||||||
| Other assets |
62,265 | 72,613 | ||||||
|
|
|
|
|
|||||
| Total assets |
$ | 847,500 | $ | 1,107,961 | ||||
|
|
|
|
|
|||||
| Liabilities and Stockholders’ Equity |
||||||||
| Current liabilities: |
||||||||
| Current portion of long-term debt and capital lease obligations |
$ | 5,264 | $ | 6,317 | ||||
| Current portion of notes payable—affiliated |
567 | 323,476 | ||||||
| Accounts payable |
20,065 | 19,377 | ||||||
| Accrued and other current liabilities |
116,343 | 127,799 | ||||||
|
|
|
|
|
|||||
| Total current liabilities |
142,239 | 476,969 | ||||||
|
|
|
|
|
|||||
| Long-term debt: |
||||||||
| Long-term debt and capital lease obligations |
3,940 | 1,051 | ||||||
| Notes payable—affiliated |
3,051 | 145,792 | ||||||
|
|
|
|
|
|||||
| Total long-term debt |
6,991 | 146,843 | ||||||
|
|
|
|
|
|||||
| Deferred tax liabilities |
5,178 | 6,575 | ||||||
| Other non-current liabilities |
25,964 | 30,586 | ||||||
|
|
|
|
|
|||||
| Total liabilities |
180,372 | 660,973 | ||||||
|
|
|
|
|
|||||
| Commitments and contingencies |
— | — | ||||||
| Stockholders’ equity: |
||||||||
| Common stock |
803 | 803 | ||||||
| Additional paid-in capital |
1,409 | 1,409 | ||||||
| Retained earnings |
660,474 | 440,399 | ||||||
| Accumulated other comprehensive income |
4,442 | 4,377 | ||||||
|
|
|
|
|
|||||
| Total stockholders’ equity |
667,128 | 446,988 | ||||||
|
|
|
|
|
|||||
| Total liabilities and stockholders’ equity |
$ | 847,500 | $ | 1,107,961 | ||||
|
|
|
|
|
|||||
The accompanying notes are an integral part of these combined financial statements.
F-13
Table of Contents
Index to Financial Statements
FRANK’S INTERNATIONAL
(In thousands)
| Year Ended December 31, | ||||||||||||
| 2010 | 2011 | 2012 | ||||||||||
| Revenues: |
||||||||||||
| Equipment rentals and services |
$ | 490,902 | $ | 613,541 | $ | 880,084 | ||||||
| Products |
117,306 | 125,534 | 175,841 | |||||||||
|
|
|
|
|
|
|
|||||||
| Total revenues |
608,208 | 739,075 | 1,055,925 | |||||||||
|
|
|
|
|
|
|
|||||||
| Operating expenses: |
||||||||||||
| Cost of revenues, exclusive of depreciation and amortization Equipment rentals and services |
222,345 | 256,515 | 314,950 | |||||||||
| Products |
70,697 | 76,368 | 119,527 | |||||||||
| General and administrative expenses |
134,449 | 160,506 | 187,033 | |||||||||
| Depreciation and amortization |
48,197 | 54,581 | 66,215 | |||||||||
| Gain on sale of assets |
(164 | ) | (47 | ) | (2,608 | ) | ||||||
|
|
|
|
|
|
|
|||||||
| Operating income |
132,684 | 191,152 | 370,808 | |||||||||
|
|
|
|
|
|
|
|||||||
| Other income (expense): |
||||||||||||
| Other income |
3,906 | 3,786 | 12,189 | |||||||||
| Interest income (expense), net |
(1,658 | ) | (655 | ) | 264 | |||||||
| Foreign currency loss |
(1,930 | ) | (3,209 | ) | (450 | ) | ||||||
|
|
|
|
|
|
|
|||||||
| Total other income (expense) |
318 | (78 | ) | 12,003 | ||||||||
|
|
|
|
|
|
|
|||||||
| Income before income tax expense |
133,002 | 191,074 | 382,811 | |||||||||
| Income tax expense |
14,601 | 20,287 | 31,877 | |||||||||
|
|
|
|
|
|
|
|||||||
| Net income |
$ | 118,401 | $ | 170,787 | $ | 350,934 | ||||||
|
|
|
|
|
|
|
|||||||
The accompanying notes are an integral part of these combined financial statements.
F-14
Table of Contents
Index to Financial Statements
FRANK’S INTERNATIONAL
COMBINED STATEMENTS OF COMPREHENSIVE INCOME
(In thousands)
| Year Ended December 31, | ||||||||||||
| 2010 | 2011 | 2012 | ||||||||||
| Net income |
$ | 118,401 | $ | 170,787 | $ | 350,934 | ||||||
| Other comprehensive income (loss): |
||||||||||||
| Foreign currency translation adjustments, net of tax |
236 | (2,734 | ) | (178 | ) | |||||||
| Unrealized gain on marketable securities, net of tax |
271 | 301 | 113 | |||||||||
|
|
|
|
|
|
|
|||||||
| Total other comprehensive income (loss) |
507 | (2,433 | ) | (65 | ) | |||||||
|
|
|
|
|
|
|
|||||||
| Comprehensive income |
$ | 118,908 | $ | 168,354 | $ | 350,869 | ||||||
|
|
|
|
|
|
|
|||||||
The accompanying notes are an integral part of these combined financial statements.
F-15
Table of Contents
Index to Financial Statements
FRANK’S INTERNATIONAL
COMBINED STATEMENTS OF STOCKHOLDERS’ EQUITY
(In thousands)
| Common Stock |
Treasury Stock |
Additional Paid-In Capital |
Retained Earnings |
Accumulated Other Comprehensive Income |
Total Stockholders’ Equity |
|||||||||||||||||||
| Balances at December 31, 2009 |
$ | 803 | $ | (1,317 | ) | $ | — | $ | 478,453 | $ | 6,368 | $ | 484,307 | |||||||||||
| Net income |
— | — | — | 118,401 | — | 118,401 | ||||||||||||||||||
| Foreign currency translation adjustments |
— | — | — | — | 236 | 236 | ||||||||||||||||||
| Unrealized gain on marketable securities |
— | — | — | — | 271 | 271 | ||||||||||||||||||
| Distributions to stockholders |
— | — | — | (67,202 | ) | — | (67,202 | ) | ||||||||||||||||
|
|
|
|
|
|
|
|
|
|
|
|
|
|||||||||||||
| Balances at December 31, 2010 |
803 | (1,317 | ) | — | 529,652 | 6,875 | 536,013 | |||||||||||||||||
| Net income |
— | — | — | 170,787 | — | 170,787 | ||||||||||||||||||
| Foreign currency translation adjustments |
— | — | — | — | (2,734 | ) | (2,734 | ) | ||||||||||||||||
| Unrealized gain on marketable securities |
— | — | — | — | 301 | 301 | ||||||||||||||||||
| Reissuance of stock |
— | 1,317 | 1,409 | — | — | 2,726 | ||||||||||||||||||
| Distributions to stockholders |
— | — | — | (39,965 | ) | — | (39,965 | ) | ||||||||||||||||
|
|
|
|
|
|
|
|
|
|
|
|
|
|||||||||||||
| Balances at December 31, 2011 |
803 | — | 1,409 | 660,474 | 4,442 | 667,128 | ||||||||||||||||||
| Net income |
— | — | — | 350,934 | — | 350,934 | ||||||||||||||||||
| Foreign currency translation adjustments |
— | — | — | — | (178 | ) | (178 | ) | ||||||||||||||||
| Unrealized gain on marketable securities |
— | — | — | — | 113 | 113 | ||||||||||||||||||
| Distributions to stockholders |
— | — | — | (571,009 | ) | — | (571,009 | ) | ||||||||||||||||
|
|
|
|
|
|
|
|
|
|
|
|
|
|||||||||||||
| Balances at December 31, 2012 |
$ | 803 | $ | — | $ | 1,409 | $ | 440,399 | $ | 4,377 | $ | 446,988 | ||||||||||||
|
|
|
|
|
|
|
|
|
|
|
|
|
|||||||||||||
The accompanying notes are an integral part of these combined financial statements.
F-16
Table of Contents
Index to Financial Statements
FRANK’S INTERNATIONAL
COMBINED STATEMENTS OF CASH FLOWS
(In thousands)
| Year Ended December 31, | ||||||||||||
| 2010 | 2011 | 2012 | ||||||||||
| Cash flows from operating activities |
||||||||||||
| Net income |
$ | 118,401 | $ | 170,787 | $ | 350,934 | ||||||
| Adjustments to reconcile net income to cash provided by operating activities |
||||||||||||
| Depreciation and amortization |
48,197 | 54,581 | 66,215 | |||||||||
| Deferred tax provision |
236 | (412 | ) | 1,449 | ||||||||
| Provision for (recovery of) bad debts |
585 | 2,486 | (389 | ) | ||||||||
| Gain on sale of assets |
(164 | ) | (47 | ) | (2,608 | ) | ||||||
| Changes in fair value of marketable securities |
(1,180 | ) | 688 | (2,058 | ) | |||||||
| Gain on exchange of investment |
— | — | (3,997 | ) | ||||||||
| Decrease (increase) in value of life insurance policies |
(420 | ) | 731 | 254 | ||||||||
| Changes in operating assets and liabilities |
||||||||||||
| Accounts receivable |
(27,799 | ) | (72,266 | ) | (76,729 | ) | ||||||
| Inventories |
7,640 | (4,606 | ) | (15,351 | ) | |||||||
| Other current assets |
(4,889 | ) | (2,681 | ) | 845 | |||||||
| Other assets |
(1,270 | ) | 403 | (173 | ) | |||||||
| Accounts payable |
2,581 | 5,274 | (533 | ) | ||||||||
| Accrued expenses and other current liabilities |
11,594 | 24,167 | 22,255 | |||||||||
| Other noncurrent liabilities |
9,922 | 1,445 | 4,662 | |||||||||
| Other |
(20 | ) | 160 | — | ||||||||
|
|
|
|
|
|
|
|||||||
| Net cash provided by operating activities |
163,414 | 180,710 | 344,776 | |||||||||
|
|
|
|
|
|
|
|||||||
| Cash flows from investing activities |
||||||||||||
| Purchase of property, plant and equipment |
(57,263 | ) | (117,883 | ) | (180,187 | ) | ||||||
| Proceeds from sale of equipment |
545 | 391 | 5,259 | |||||||||
| Purchase of marketable securities |
(4,385 | ) | (4,518 | ) | (2,757 | ) | ||||||
| Premiums on life insurance policies |
(2,989 | ) | (3,698 | ) | (3,088 | ) | ||||||
| Investment in affiliates |
(1,635 | ) | — | — | ||||||||
| Other |
(3,403 | ) | (947 | ) | (1,760 | ) | ||||||
|
|
|
|
|
|
|
|||||||
| Net cash used in investing activities |
(69,130 | ) | (126,655 | ) | (182,533 | ) | ||||||
|
|
|
|
|
|
|
|||||||
| Cash flows from financing activities |
||||||||||||
| Repayments of borrowings |
(12,659 | ) | (39,735 | ) | (36,191 | ) | ||||||
| Proceeds from borrowings |
600 | 5,100 | 15,996 | |||||||||
| Proceeds from reissuance of stock |
— | 2,726 | — | |||||||||
| Distributions to stockholders |
(67,202 | ) | (39,965 | ) | (87,015 | ) | ||||||
|
|
|
|
|
|
|
|||||||
| Net cash used in financing activities |
(79,261 | ) | (71,874 | ) | (107,210 | ) | ||||||
| Effect of exchange rate changes on cash |
285 | 2,305 | (737 | ) | ||||||||
|
|
|
|
|
|
|
|||||||
| Net increase (decrease) in cash |
15,308 | (15,514 | ) | 54,296 | ||||||||
| Cash and cash equivalents at beginning of year |
98,855 | 114,163 | 98,649 | |||||||||
|
|
|
|
|
|
|
|||||||
| Cash and cash equivalents at end of year |
$ | 114,163 | $ | 98,649 | $ | 152,945 | ||||||
|
|
|
|
|
|
|
|||||||
| Supplemental cash flow information: |
||||||||||||
| Cash paid for interest |
$ | 2,332 | $ | 710 | $ | 1,434 | ||||||
| Cash paid for income tax |
6,141 | 6,624 | 8,292 | |||||||||
| Non-cash transactions: |
||||||||||||
| Change in accounts payable related to capital expenditures |
$ | (2,258 | ) | $ | 10,997 | $ | (10,943 | ) | ||||
| Insurance premium financed by note payable |
2,015 | 1,777 | — | |||||||||
| Notes issued as payment of distribution to owners |
— | — | 483,994 | |||||||||
The accompanying notes are an integral part of these combined financial statements.
F-17
Table of Contents
Index to Financial Statements
FRANK’S INTERNATIONAL
NOTES TO COMBINED FINANCIAL STATEMENTS
Note 1—Summary of Business and Basis of Presentation
Frank’s International is a global provider of highly engineered tubular services to the oil and gas industry. Frank’s International provides services to leading exploration and production companies in both offshore and onshore environments, with a focus on complex and technically demanding wells.
The combined financial statements for the three years ended December 31, 2012 include the activities of Frank’s International N.V. (“FINV”), a Netherlands corporation, Frank’s International, Inc. (“FII”), Frank’s Casing Crew and Rental Tools, Inc. (“FCC”), Frank’s Tong Service, Inc. (“FTS”) and their wholly owned subsidiaries (collectively, the “Company”). Under this combined method of accounting, the historical combined financial statements of FINV are combined with FII, FCC and FTS. All intercompany accounts and transactions have been eliminated for purposes of preparing these combined financial statements.
The accounting and reporting policies of the Company conform to accounting principles generally accepted in the United States of America (“US GAAP”). The policies that materially affect the determination of financial position, results of operations and cash flows are summarized below.
The combined financial statements have been prepared on a historical cost basis and in accordance with US GAAP, using the United States dollar as the reporting currency.
Note 2—Summary of Significant Accounting Policies
Accounting Estimates
The preparation of combined financial statements in conformity with accounting principles generally accepted in the United States requires management to make estimates and assumptions that affect the reported amounts of assets and liabilities, and the disclosure of contingent assets and liabilities at the date of the combined financial statements, and the reported amounts of revenues and expenses during the reporting period. Actual results could differ from these estimates.
Accounts Receivable
The Company extends credit to customers in the normal course of business. The Company estimates its bad debt exposure each period and records a bad debt provision for accounts receivable it believes it may not collect in full.
Cash and Cash Equivalents
The Company considers all highly liquid financial instruments purchased with an original maturity of three months or less to be cash equivalents. Throughout the year, the Company has cash balances in excess of federally insured limits deposited with various financial institutions. The Company has not experienced any losses in such accounts and believes it is not exposed to any significant credit risk on cash and cash equivalents.
F-18
Table of Contents
Index to Financial Statements
FRANK’S INTERNATIONAL
NOTES TO COMBINED FINANCIAL STATEMENTS
Comprehensive Income
Accounting standards on reporting comprehensive income require that certain items, including foreign currency translation adjustments and unrealized gains and losses on marketable securities be presented as components of comprehensive income. The cumulative amounts recognized by the Company under these standards are reflected in the combined balance sheet as accumulated other comprehensive income, a component of shareholders’ equity.
| December 31, | ||||||||
| 2011 | 2012 | |||||||
| Foreign currency translation adjustments |
$ | 4,367 | $ | 4,189 | ||||
| Unrealized gain on marketable securities |
75 | 188 | ||||||
|
|
|
|
|
|||||
| Total accumulated other comprehensive income |
$ | 4,442 | $ | 4,377 | ||||
|
|
|
|
|
|||||
Contingencies
Certain conditions may exist as of the date the Company’s combined financial statements are issued that may result in a loss to the Company, but which will only be resolved when one or more future events occur or fail to occur. The Company’s management, with input from legal counsel, assesses such contingent liabilities, and such assessment inherently involves an exercise in judgment. In assessing loss contingencies related to legal proceedings pending against the Company or unasserted claims that may result in proceedings, the Company’s management, with input from legal counsel, evaluates the perceived merits of any legal proceedings or unasserted claims as well as the perceived merits of the amount of relief sought or expected to be sought therein.
If the assessment of a contingency indicates it is probable a material loss has been incurred and the amount of liability can be estimated, then the estimated liability would be accrued in the Company’s combined financial statements. If the assessment indicates a potentially material loss contingency is not probable but is reasonably possible, or is probable but cannot be estimated, then the nature of the contingent liability, together with an estimate of the range of possible loss if determinable and material, is disclosed.
Loss contingencies considered remote are generally not disclosed unless they involve guarantees, in which case the guarantees would be disclosed.
Fair Value of Financial Instruments
The Company’s financial instruments consist primarily of cash and cash equivalents, trade accounts receivable, available-for-sale securities, obligations under trade accounts payable and short and long-term debt. Due to their short-term nature, the carrying values for cash and cash equivalents, trade accounts receivable and trade accounts payable approximate fair value. Refer to Note 10 for the fair values of the Company’s available-for-sale securities and other obligations.
Foreign Currency Translations and Transactions
Results of operations for foreign subsidiaries with functional currencies other than the U.S. dollar are translated using average exchange rates during the period. Assets and liabilities of these foreign subsidiaries are translated using the exchange rates in effect at the balance sheet dates. Gains and losses resulting from these translations are included in accumulated other comprehensive income within stockholders’ equity.
F-19
Table of Contents
Index to Financial Statements
FRANK’S INTERNATIONAL
NOTES TO COMBINED FINANCIAL STATEMENTS
For those foreign subsidiaries that have designated the U.S. dollar as the functional currency, gains and losses resulting from balance sheet remeasurement of foreign operations are included in the combined statements of income as incurred. Gains and losses resulting from transactions denominated in a foreign currency are also included in the combined statements of income as incurred.
Goodwill
Goodwill is not subject to amortization and is tested for impairment annually or more frequently if events or changes in circumstances indicate that the asset might be impaired. A qualitative assessment is allowed to determine if goodwill is potentially impaired. The qualitative assessment determines whether it is more likely than not that a reporting unit’s fair value is less than its carrying amount. If it is more likely that not that the fair value of the reporting unit is less than the carrying amount, then the two step impairment test is performed. First, the fair value of each reporting unit is compared to its carrying value to determine whether an indication of impairment exists. If impairment is indicated, then the fair value of the reporting unit’s goodwill is determined by allocating the unit’s fair value to its assets and liabilities (including any unrecognized intangible assets) as if the reporting unit had been acquired in a business combination. The amount of impairment for goodwill is measured as the excess of its carrying value over its fair value. The Company completes its assessment of goodwill impairment as of December 31 each year. No impairment was recorded for the years ended December 31, 2010, 2011 and 2012. The Company’s goodwill is allocated to its segments as follows: U.S. Services – approximately $11.3 million; Pipe and Products – approximately $3.9 million. The inputs used in the determination of fair value are generally level 3 inputs. See Note 10 for a discussion of fair value measures.
Impairment of Long-Lived Assets
Long-lived assets, which include property, plant and equipment, and certain other assets to be held and used by the Company, are reviewed when events or changes in circumstances indicate that the carrying amount of the assets may not be recoverable based on estimated future cash flows. If this assessment indicates that the carrying values will not be recoverable, as determined based on undiscounted cash flows over the remaining useful lives, an impairment loss is recognized based on fair value of the asset.
Income Taxes
The Company operates under many legal forms in approximately 60 countries. As a result, the Company is subject to many U.S. and foreign tax jurisdictions and many tax agreements and treaties among the various taxing authorities. The Company’s operations in these different jurisdictions are taxed on various bases such as income before taxes, deemed profits (which is generally determined using a percentage of revenues rather than profits), and withholding taxes based on revenues. Determination of taxable income in any jurisdiction requires the interpretation of the related tax laws and regulations and the use of estimates and assumptions regarding significant future events. Changes in tax laws, regulations, agreements and treaties, foreign currency exchange restrictions, or the Company’s level of operations or profitability in each taxing jurisdiction could have an impact upon the amount of income taxes that the Company provides during any given year.
Effective January 1, 2008, the Company elected Subchapter S status for its U.S. entities, which has been approved by the Internal Revenue Service. A Subchapter S corporation is a flow through entity for U.S. federal income tax purposes and generally is not subject to a corporate level U.S. federal income tax.
The Company provides for income tax expense based on the liability method of accounting for income taxes based on the authoritative accounting guidance. Deferred tax assets and liabilities are recorded based upon temporary differences between the tax basis of assets and liabilities and their carrying values for financial
F-20
Table of Contents
Index to Financial Statements
FRANK’S INTERNATIONAL
NOTES TO COMBINED FINANCIAL STATEMENTS
reporting purposes, and are measured using the enacted marginal rates and laws that will be in effect when the differences are expected to reverse. Deferred tax expense or benefit is the result of changes in deferred tax assets and liabilities during the period. The impact of an uncertain tax position taken or expected to be taken on an income tax return is recognized in the financial statements at the largest amount that is more likely than not to be sustained upon examination by the relevant taxing authority.
Intangible Assets
Intangible assets are comprised of licenses, customer relationships and tradenames. Identifiable intangible assets are amortized using the straight-line method over the estimated useful lives of the assets. The Company evaluates impairment of its intangible assets on an individual basis whenever circumstances indicate that the carrying value may not be recoverable. Intangible assets deemed to be impaired are written down to their fair value discounted cash flows and, if available, comparable market values.
Inventories
Inventories are stated at the lower of cost (primarily average cost) or market value. Work in progress and finished goods include the cost of materials, labor, and manufacturing overhead. Inventory placed in service is either capitalized and included in equipment or expensed based upon the Company’s capitalization policies.
Marketable Securities
The Company’s marketable securities in certificates of deposit, debt securities and publicly traded equity securities as an indirect result of strategic investments are classified as available-for-sale and are reported at fair value. See Note 7—Other Assets.
The marketable securities are held within a Rabbi Trust for the purpose of paying future Executive Deferred Compensation benefit obligations. Unrealized gains and losses are reported as a component of stockholders’ equity. Realized gains and losses on marketable securities are included in other income on the Company’s combined statements of income, net when realized. Any impairment loss to reduce an investment’s carrying amount to its fair market value is recognized in income when a decline in the fair market value of an individual security below its cost or carrying value is determined to be other than temporary. Realized gains on investments were $1.2 million and $2.1 million for the years ended December 31, 2010 and 2012, respectively. Realized losses on investments were $0.7 million for the year ended December 31, 2011.
Property, Plant and Equipment
Property, plant and equipment are stated at cost less accumulated depreciation. Expenditures for significant improvements and betterments are capitalized when they extend the useful life of the asset. Expenditures for minor improvements and routine repairs and maintenance, which do not improve or extend the life of the related assets, are expensed when incurred. When properties or equipment are sold, retired or otherwise disposed of, the related cost and accumulated depreciation are removed from the books and the resulting gain or loss is recognized on the combined statements of income.
Depreciation on fixed assets is computed using the straight-line method over the estimated useful lives of the individual assets. Leasehold improvements are amortized on a straight-line basis over the shorter of their estimated useful lives or the lease term. The depreciation of fixed assets recorded under capital lease agreements is included in depreciation expense.
F-21
Table of Contents
Index to Financial Statements
FRANK’S INTERNATIONAL
NOTES TO COMBINED FINANCIAL STATEMENTS
Recent Accounting Pronouncements
In February 2013, the Financial Accounting Standards Board (“FASB”) issued an accounting standards update which adds new disclosure requirements for items reclassified out of accumulated other comprehensive income. The update requires entities to disclose additional information about reclassification adjustments, including changes in accumulated other comprehensive income balances by component and significant items reclassified out of accumulated other comprehensive income. The update will be effective for the Company in the first quarter of 2013, but early adoption is permitted. The update will impact the Company’s disclosures and will not have a material impact on its combined financial position, results of operations or cash flows.
In September 2011, the FASB issued an accounting standards update which provides, subject to certain conditions, the option to perform a qualitative, rather than quantitative, assessment of goodwill to determine whether it is more likely than not that the fair value of a reporting unit is less than its carrying amount. This update was effective and adopted by the Company in the first quarter of 2012 and did not have a material impact on its combined financial position, results of operations or cash flows.
In June 2011, the FASB issued an accounting standards update which revises the manner in which entities present comprehensive income in their financial statements. The new guidance requires entities to report components of comprehensive income in either (1) a continuous statement of comprehensive income or (2) a separate but consecutive statement. Under the two-statement approach, the first statement would include components of net income, which is consistent with the income statement format previously used by the Company, and the second statement would include components of other comprehensive income (“OCI”). The update does not change the items that must be reported in OCI and must be applied retrospectively for all periods presented in the financial statements. This update was effective and adopted by the Company in the first quarter of 2012 and impacted the Company’s financial statement presentation, but otherwise did not impact its combined financial position, results of operations or cash flows.
In May 2011, the FASB issued an accounting standards update which amends the definition of fair value measurement principles and disclosure requirements to eliminate differences between U.S. GAAP and International Financial Reporting Standards. The update requires new quantitative and qualitative disclosures about the sensitivity of recurring Level 3 measurement disclosures, as well as disclosures of transfers between Level 1 and Level 2 of the fair value hierarchy. This update was effective and adopted by the Company in the first quarter of 2012 and impacted the Company’s disclosures, but otherwise did not impact the Company’s combined financial position, results of operations or cash flows.
Revenue Recognition
All revenue is recognized when all of the following criteria have been met: (1) evidence of an arrangement exists; (2) delivery to and acceptance by the customer has occurred; (3) the price of the customer is fixed or determinable; and (4) collectability is reasonably assured, as follows:
Services Revenue. The Company provides tubular services to clients in the oil and gas industry. The Company performs services either under direct service purchase orders or master service agreements. Service revenue is recognized when services have been performed or rendered.
Rental Revenue. The Company designs and manufactures a suite of highly technical equipment and products that it rents to its customers in connection with providing its services, including high-end, proprietary tubular handling equipment. The Company rents its products either under direct rental agreements or with customers with rental agreements in place. Revenue from rental agreements is recognized as earned over the rental period.
F-22
Table of Contents
Index to Financial Statements
FRANK’S INTERNATIONAL
NOTES TO COMBINED FINANCIAL STATEMENTS
For customers contracted under direct service purchase orders and direct rental agreements, an accrual is recorded in unbilled accounts receivable for revenue earned but not yet invoiced.
Pipe and Products Revenue. Revenue on pipe and products sales is recognized when the product has shipped and significant risks of ownership have passed to the customer. The sales arrangements typically do not include right of return or other similar provisions or other post-delivery obligations. In some regions, customers have a right of return due to purchasing of excess products and deliverability limitations of products in remote locations. When the likelihood of a return exists on a sale, a determination of this portion of revenue is reclassified to unearned revenue until such time when the product is returned or no return occurs.
Risks and Uncertainties
Financial instruments, which potentially subject the Company to concentrations of credit risk, consist principally of trade accounts receivable. No one individual customer accounted for more than 10% of revenue in 2010 and 2011, while one customer accounted for approximately 11% of the Company’s revenue for the year ended December 31, 2012. No customers accounted for more than 10% of receivables as of December 31, 2011 and 2012. The Company’s customers operate in the oil and gas industry. The Company’s business depends on the level of activity in oil and gas exploration, development and production in market sectors worldwide. Oil and gas prices and market expectations of potential changes in these prices significantly affect this level of activity. Demand for the Company’s offshore services substantially depends on the level of activity in offshore oil and gas exploration, development and production. The level of offshore activity is historically cyclical and characterized by large fluctuations in response to relatively minor changes in a variety of factors, including oil and gas prices, which could have a material adverse effect on the Company’s business, financial condition and results of operations. The Company mitigates its exposure to credit risk by performing ongoing credit evaluations of its customer base.
The Company’s international operations are subject to a number of risks inherent in any business operating in foreign countries, including, but not limited to, political, social and economic instability, potential expropriation, seizure or nationalization of assets, deprivation of contract rights, civil unrest and protests, strikes, acts of terrorism, war or other armed conflict, import/export quotas, confiscatory taxation or other adverse tax policies and other forms of government regulation which are beyond the Company’s control. Instability and disruptions in the political, regulatory, economic and social conditions of the foreign countries in which the Company conducts business, including economically and politically volatile areas such as Africa, the Middle East, Latin America and the Asia Pacific region, could cause or contribute to factors that could have an adverse effect on the demand for the products and services the Company provides. Worldwide political, economic, and military events have contributed to oil and gas price volatility and are likely to continue to do so in the future. Depending on the market prices of oil and gas, oil and gas exploration and development companies may cancel or curtail their drilling programs, thereby reducing demand for the Company’s services. While the impact of these factors is difficult to predict, any one or more of these factors could adversely affect the Company’s business, financial condition and results of operations.
F-23
Table of Contents
Index to Financial Statements
FRANK’S INTERNATIONAL
NOTES TO COMBINED FINANCIAL STATEMENTS
Note 3—Accounts Receivable, net
Accounts receivable at December 31, 2011 and 2012 were as follows (in thousands):
| December 31, | ||||||||
| 2011 | 2012 | |||||||
| Trade accounts receivable, net of allowance of $4,655 and $1,697, respectively |
$ | 169,139 | $ | 188,095 | ||||
| Unbilled receivables |
54,225 | 108,713 | ||||||
| Affiliated (1) |
1,169 | 4,551 | ||||||
| Other receivables |
9,412 | 12,298 | ||||||
|
|
|
|
|
|||||
| Total accounts receivable |
$ | 233,945 | $ | 313,657 | ||||
|
|
|
|
|
|||||
| (1) | Amounts represent expenditures on behalf of non-consolidated affiliates. |
Note 4—Inventories
Inventories at December 31, 2011 and 2012 were as follows (in thousands):
| December 31, | ||||||||
| 2011 | 2012 | |||||||
| Pipe and connectors |
$ | 74,613 | $ | 87,083 | ||||
| Finished goods |
7,118 | 6,985 | ||||||
| Work in progress |
772 | 2,411 | ||||||
| Raw materials, components and supplies |
9,570 | 12,064 | ||||||
|
|
|
|
|
|||||
| Total inventories |
$ | 92,073 | $ | 108,543 | ||||
|
|
|
|
|
|||||
Note 5—Property, Plant and Equipment
The following is a summary of property, plant and equipment at December 31, 2011 and 2012 (in thousands):
| Estimated Useful Lives in Years |
December 31, | |||||||||||
| 2011 | 2012 | |||||||||||
| Land |
— | $ | 19,319 | $ | 21,344 | |||||||
| Buildings and improvements |
39 | 53,292 | 82,005 | |||||||||
| Rental machinery and equipment |
7 | 471,318 | 563,368 | |||||||||
| Machinery and equipment-other |
7 | 46,368 | 43,086 | |||||||||
| Furniture, fixtures and computers |
5 | 13,827 | 16,707 | |||||||||
| Automobiles and other vehicles |
5 | 53,551 | 55,481 | |||||||||
| Leasehold improvements |
7 | 3,861 | 4,843 | |||||||||
| Construction in progress - machinery and equipment |
— | 38,545 | 62,122 | |||||||||
|
|
|
|
|
|||||||||
| 700,081 | 848,956 | |||||||||||
| Less: Accumulated depreciation |
(375,200 | ) | (422,456 | ) | ||||||||
|
|
|
|
|
|||||||||
| Total property, plant and equipment, net |
$ | 324,881 | $ | 426,500 | ||||||||
|
|
|
|
|
|||||||||
Depreciation expense was approximately $46.4 million, $52.9 million and $64.8 million for the years ended December 31, 2010, 2011 and 2012, respectively.
F-24
Table of Contents
Index to Financial Statements
FRANK’S INTERNATIONAL
NOTES TO COMBINED FINANCIAL STATEMENTS
Note 6—Intangible Assets
Intangible assets at December 31, 2011 and 2012 consist of the following (in thousands):
| December 31, | ||||||||
| 2011 | 2012 | |||||||
| Trade name |
$ | 2,730 | $ | 2,725 | ||||
| Accumulated amortization |
(2,707 | ) | (2,725 | ) | ||||
|
|
|
|
|
|||||
| Net carrying amount |
23 | — | ||||||
|
|
|
|
|
|||||
| Customer relationships |
8,498 | 8,498 | ||||||
| Accumulated amortization |
(7,059 | ) | (8,006 | ) | ||||
|
|
|
|
|
|||||
| Net carrying amount |
1,439 | 492 | ||||||
|
|
|
|
|
|||||
| License agreement |
4,957 | 4,957 | ||||||
| Accumulated amortization |
(3,158 | ) | (3,617 | ) | ||||
|
|
|
|
|
|||||
| Net carrying amount |
1,799 | 1,340 | ||||||
|
|
|
|
|
|||||
| Total intangible assets |
$ | 3,261 | $ | 1,832 | ||||
|
|
|
|
|
|||||
Amortization expense was approximately $1.8 million, $1.7 million and $1.4 million for the years ended December 31, 2010, 2011 and 2012, respectively.
Expected aggregate amortization of intangible assets is as follows (in thousands):
| Year Ending December 31, |
||||
| 2013 |
$ | 857 | ||
| 2014 |
554 | |||
| 2015 |
421 | |||
|
|
|
|||
| Total |
$ | 1,832 | ||
|
|
|
|||
Note 7—Other Assets
Other assets at December 31, 2011 and 2012 consist of the following (in thousands):
| December 31, | ||||||||
| 2011 | 2012 | |||||||
| Split-dollar life insurance |
$ | 15,966 | $ | 18,799 | ||||
| Marketable securities—deferred compensation plan (1) |
31,686 | 36,479 | ||||||
| Notes receivable—affiliates |
6,045 | 6,939 | ||||||
| Other |
8,568 | 10,396 | ||||||
|
|
|
|
|
|||||
| Total other assets |
$ | 62,265 | $ | 72,613 | ||||
|
|
|
|
|
|||||
| (1) | See Note 15—Employee Benefit Plans. |
F-25
Table of Contents
Index to Financial Statements
FRANK’S INTERNATIONAL
NOTES TO COMBINED FINANCIAL STATEMENTS
Note 8—Accrued and Other Current Liabilities
Accrued and other current liabilities at December 31, 2011 and 2012 consist of the following (in thousands):
| December 31, | ||||||||
| 2011 | 2012 | |||||||
| Accrued compensation |
$ | 15,671 | $ | 23,978 | ||||
| Accrued property and other taxes |
19,059 | 23,847 | ||||||
| Deferred revenue |
34,771 | 23,172 | ||||||
| Accrued inventory |
4,440 | 17,273 | ||||||
| Other accrued purchases |
42,402 | 39,529 | ||||||
|
|
|
|
|
|||||
| Total accrued and other current liabilities |
$ | 116,343 | $ | 127,799 | ||||
|
|
|
|
|
|||||
Note 9—Long-Term Debt
The following is a summary of long-term debt at December 31, 2011 and 2012 (in thousands):
| December 31, | ||||||||
| 2011 | 2012 | |||||||
| Lines of credit |
$ | 4,000 | $ | 2,000 | ||||
| Notes payable |
4,162 | 4,464 | ||||||
| Equipment financing |
1,042 | 818 | ||||||
| Other |
— | 86 | ||||||
|
|
|
|
|
|||||
| 9,204 | 7,368 | |||||||
| Less: current portion |
(5,264 | ) | (6,317 | ) | ||||
|
|
|
|
|
|||||
| Long-term portion |
3,940 | 1,051 | ||||||
|
|
|
|
|
|||||
| Notes payable—affiliated |
3,618 | 469,268 | ||||||
| Less: current portion |
(567 | ) | (323,476 | ) | ||||
|
|
|
|
|
|||||
| Long-term portion |
3,051 | 145,792 | ||||||
|
|
|
|
|
|||||
| Total long-term debt |
$ | 6,991 | $ | 146,843 | ||||
|
|
|
|
|
|||||
Lines of Credit
The Company has two revolving lines of credit of $40.0 million and $5.0 million, which mature on August 31, 2014 and February 19, 2016, respectively. Interest is paid monthly on the unpaid balance of the $40.0 million line of credit at the London Interbank Offering Rate plus approximately 2.5% per annum. Interest is paid on the unpaid balance of the $5.0 million line of credit at the prime rate, which equates to 4.5% with the applicable margin included. The aggregate outstanding balance for the credit agreements was $4.0 million and $2.0 million as of December 31, 2011 and 2012, respectively. In addition, the Company had outstanding letters of credit of $5.2 million as of December 31, 2012. The lines of credit have certain financial covenants. As of December 31, 2012, the Company was in compliance with all financial covenants.
Notes Payable
The Company has various notes payable totaling $2.5 million and $3.2 million at December 31, 2011 and 2012, respectively. These notes mature in 2013 with interest rates of 3.0% per annum.
F-26
Table of Contents
Index to Financial Statements
FRANK’S INTERNATIONAL
NOTES TO COMBINED FINANCIAL STATEMENTS
The Company has financed certain business acquisitions. At December 31, 2011 and 2012, the aggregate outstanding balance of the finance agreements was $1.7 million and $1.3 million, with interest rates ranging from 5% and 6% per annum. The finance agreements are due on demand and have maturity dates ranging from September 2016 to October 2018.
Equipment Financing
The Company has financed certain aircraft through credit agreements. The aggregate outstanding balance of these credit agreements was $1.0 million and $0.8 million at December 31, 2011 and 2012, respectively, with a fixed interest rate 5.0% per annum payable monthly. The credit agreements mature in August 2013. The notes are secured by the aircraft.
Notes Payable—Affiliated
In 2012, the Company made a non-cash distribution of $484.0 million to the owners of the Company in the form of two unsecured promissory notes payable to FWW B.V. Interest is charged on the notes at the applicable short-term monthly applicable federal rate (commonly known as the AFR Rate) as published by the Internal Revenue Service. The average interest rate was 0.22% during 2012. As of December 31, 2012, $320.0 million is included in current portion of notes payable—affiliates because it is due on demand and $144.0 million is included in notes payable—affiliated on the combined balance sheets. The Company also has various notes payable—affiliated of $3.6 million and $5.3 million at December 31, 2011 and 2012, respectively.
The following table presents the scheduled maturities of principal amounts of the Company’s debt obligations for the next five years and in total thereafter (in thousands):
| Year Ending December 31, |
||||
| 2013 |
$ | 329,793 | ||
| 2014 |
1,661 | |||
| 2015 |
674 | |||
| 2016 |
516 | |||
| Thereafter |
143,992 | |||
|
|
|
|||
| Total |
$ | 476,636 | ||
|
|
|
|||
Note 10—Fair Value Measurements
The Company follows fair value measurement authoritative accounting guidance for measuring fair values of assets and liabilities in financial statements. Fair value is the price that would be received to sell an asset or paid to transfer a liability in an orderly transaction between market participants at the measurement date (exit price). The Company utilizes market data or assumptions that market participants who are independent, knowledgeable and willing and able to transact would use in pricing the asset or liability, including assumptions about risk and the risks inherent in the inputs to the valuation technique. The Company is able to classify fair value balances based on the observability of these inputs. The authoritative guidance for fair value measurements establishes three levels of the fair value hierarchy, defined as follows:
| • | Level 1: Unadjusted, quoted prices for identical assets or liabilities in active markets. |
| • | Level 2: Quoted prices in markets that are not considered to be active or financial instruments for which all significant inputs are observable, either directly or indirectly for substantially the full term of the asset or liability. |
F-27
Table of Contents
Index to Financial Statements
FRANK’S INTERNATIONAL
NOTES TO COMBINED FINANCIAL STATEMENTS
| • | Level 3: Significant, unobservable inputs for use when little or no market data exists, requiring a significant degree of judgment. |
The hierarchy gives the highest priority to Level 1 measurements and the lowest priority to Level 3 measurements. Depending on the particular asset or liability, input availability can vary depending on factors such as product type, longevity of a product in the market and other particular transaction conditions. In some cases, certain inputs used to measure fair value may be categorized into different levels of the fair value hierarchy. For disclosure purposes under the accounting guidance, the lowest level that contains significant inputs used in valuation should be chosen.
Financial Assets and Liabilities
A summary of financial assets and liabilities that are measured at fair value on a recurring basis as of December 31, 2011 and 2012 were as follows (in thousands):
| Quoted Prices in Active Markets |
Significant Other Observable Inputs |
Significant Unobservable Inputs |
Total | |||||||||||||
| (Level 1) | (Level 2) | (Level 3) | ||||||||||||||
| December 31, 2011 |
||||||||||||||||
| Assets: |
||||||||||||||||
| Investments available-for-sale: |
||||||||||||||||
| Marketable securities—deferred compensation plan |
$ | 31,686 | $ | — | $ | — | $ | 31,686 | ||||||||
| Marketable securities—other |
227 | — | — | 227 | ||||||||||||
| Liabilities: |
||||||||||||||||
| Marketable securities—deferred compensation plan |
25,740 | — | — | 25,740 | ||||||||||||
| December 31, 2012 |
||||||||||||||||
| Assets: |
||||||||||||||||
| Investments available-for-sale: |
||||||||||||||||
| Marketable securities—deferred compensation plan |
$ | 36,479 | $ | — | $ | — | $ | 36,479 | ||||||||
| Marketable securities—other |
3,717 | — | — | 3,717 | ||||||||||||
| Liabilities: |
||||||||||||||||
| Marketable securities—deferred compensation plan |
30,143 | — | — | 30,143 | ||||||||||||
The Company’s investments associated with its deferred compensation plan consist of marketable securities and mutual funds that are publicly traded and for which market prices are readily available. Other marketable securities are included in other assets on the combined balance sheets.
Assets and Liabilities Measured at Fair Value on a Non-recurring Basis
The Company applies the provisions of the fair value measurement standard to its non-recurring, non-financial measurements including business combinations as well as impairment related to goodwill and other long-lived assets. For business combinations, the purchase price is allocated to the assets acquired and liabilities assume based on a discounted cash flow model for most intangibles as well as market assumptions for the valuation of equipment and other fixed assets. The Company utilizes a discounted cash flow model in evaluating impairment considerations related to goodwill and long-lived assets. Given the unobservable nature of the inputs, the discounted cash flow models are deemed to use Level 3 inputs.
F-28
Table of Contents
Index to Financial Statements
FRANK’S INTERNATIONAL
NOTES TO COMBINED FINANCIAL STATEMENTS
Fair Value of Long-Term Debt
The carrying values and fair values of the Company’s long-term debt at December 31, 2011 and 2012 were as follows (in thousands):
| December 31, 2011 | December 31, 2012 | |||||||||||||||
| Carrying Value |
Fair Value |
Carrying Value |
Fair Value |
|||||||||||||
| Lines of credit |
$ | 3,000 | $ | 3,000 | $ | 1,000 | $ | 1,000 | ||||||||
| Notes payable |
940 | 940 | — | — | ||||||||||||
| Capital lease obligations |
— | — | 51 | 51 | ||||||||||||
|
|
|
|
|
|
|
|
|
|||||||||
| $ | 3,940 | $ | 3,940 | $ | 1,051 | $ | 1,051 | |||||||||
|
|
|
|
|
|
|
|
|
|||||||||
The carrying values on the Company’s combined balance sheet of its cash and cash equivalents, trade accounts receivable, other current assets, accounts payable and accrued and other current liabilities approximates fair values due to their short maturities; therefore, they are excluded from the foregoing table.
The carrying value of the Company’s lines of credit approximates fair value because of its variable rate structure. The fair value of the capital lease and business acquisition financing were estimated to not be materially different from the carrying amount.
Transactions involving related parties cannot be presumed to be carried out on an arm’s-length basis, as the requisite conditions of competitive, free-market dealings may not exist. Representations about transactions with related parties, if made, shall not imply that the related party transactions were consummated on terms equivalent to those that prevail in arm’s-length transactions unless such representations can be substantiated. It is not practical to determine the fair value of the long-term portion of the notes payable to FWW B.V. due to its related party nature.
Note 11—Common Stock
At December 31, 2011 and 2012, the Company’s common stock consisted of the following (in thousands, except per share information):
| Par Value Per Share |
Shares | Common Stock |
||||||||||||||
| Authorized | Issued | |||||||||||||||
| FINV |
€ | 0.0100 | 240,000 | 48,096 | $ | 617 | ||||||||||
| FII |
$ | 1.0000 | 100 | 10 | 10 | |||||||||||
| FCC |
$ | 0.0380 | 10,000 | 2,000 | 76 | |||||||||||
| FTS |
$ | 1.0000 | 100 | 100 | 100 | |||||||||||
|
|
|
|
|
|
|
|||||||||||
| 250,200 | 50,206 | $ | 803 | |||||||||||||
|
|
|
|
|
|
|
|||||||||||
Note 12—Related Party Transactions
The Company has engaged in certain transactions with other companies related to the Company by common ownership. The Company has entered into various operating leases with an affiliated partnership to lease office space from the partnership. Rent expense related to these leases was $2.8 million, $2.8 million and $3.0 million for the years ended December 31, 2010, 2011 and 2012, respectively.
F-29
Table of Contents
Index to Financial Statements
FRANK’S INTERNATIONAL
NOTES TO COMBINED FINANCIAL STATEMENTS
The Company had receivables totaling $4.9 million and $5.6 million at December 31, 2011 and 2012, respectively, due from our chief executive officer and certain members of the Mosing family, relating to amounts owed to the Company for split-dollar life insurance policy premiums that the Company maintains. The Company will collect the receivable either directly from the executive officer, if employment terminates other than by death, or from the executive officer’s beneficiary, if employment terminates due to death of the executive officer. The receivables are recorded in other assets on the combined balance sheets. The cash surrender value of $16.0 million and $18.8 million related to such policies is recorded in other assets as of December 31, 2011 and 2012, respectively. The Company recorded an unrealized gain of $0.5 million for the year ended December 31, 2010 and unrealized losses of $0.7 million and $0.3 million for the years ended December 31, 2011 and 2012, respectively, in general and administrative expenses on the combined statements of income. In 2012, the Company received a death benefit payment of $4.9 million related to the passing of a related party which is included in other income on the combined statements of income.
In addition, the Company has two outstanding notes payable to FWW B.V. See Note 9—Long-Term Debt.
Note 13—Income Taxes
Income before income tax expense was comprised of the following for the periods indicated (in thousands):
| Year Ended December 31, | ||||||||||||
| 2010 | 2011 | 2012 | ||||||||||
| United States |
$ | 33,745 | $ | 64,252 | $ | 192,545 | ||||||
| Foreign |
99,257 | 126,822 | 190,266 | |||||||||
|
|
|
|
|
|
|
|||||||
| Income before income tax expense |
$ | 133,002 | $ | 191,074 | $ | 382,811 | ||||||
|
|
|
|
|
|
|
|||||||
Income taxes have been provided for based upon the tax laws and rates in the countries in which operations are conducted and income is earned. Components of income tax expense consist of the following for the periods indicated (in thousands):
| Year Ended December 31, | ||||||||||||
| 2010 | 2011 | 2012 | ||||||||||
| Current |
||||||||||||
| U.S. federal |
$ | 119 | $ | 68 | $ | 63 | ||||||
| U.S. state and local |
45 | 92 | — | |||||||||
| Foreign |
14,201 | 20,539 | 30,365 | |||||||||
|
|
|
|
|
|
|
|||||||
| Total current |
14,365 | 20,699 | 30,428 | |||||||||
|
|
|
|
|
|
|
|||||||
| Deferred |
||||||||||||
| U.S. federal |
(119 | ) | (62 | ) | (63 | ) | ||||||
| Foreign |
355 | (350 | ) | 1,512 | ||||||||
|
|
|
|
|
|
|
|||||||
| Total deferred |
236 | (412 | ) | 1,449 | ||||||||
|
|
|
|
|
|
|
|||||||
| Total income tax expense |
$ | 14,601 | $ | 20,287 | $ | 31,877 | ||||||
|
|
|
|
|
|
|
|||||||
F-30
Table of Contents
Index to Financial Statements
FRANK’S INTERNATIONAL
NOTES TO COMBINED FINANCIAL STATEMENTS
Foreign taxes were incurred in the following regions for the periods indicated (in thousands):
| Year Ended December 31, | ||||||||||||
| 2010 | 2011 | 2012 | ||||||||||
| Latin America |
$ | 1,625 | $ | 5,992 | $ | 11,996 | ||||||
| West Africa |
5,686 | 5,978 | 9,104 | |||||||||
| Middle East |
976 | 1,665 | 3,751 | |||||||||
| Europe |
992 | 1,677 | 1,707 | |||||||||
| Far East |
982 | 1,630 | 2,172 | |||||||||
| Other |
4,295 | 3,247 | 3,147 | |||||||||
|
|
|
|
|
|
|
|||||||
| Total foreign income tax expense |
$ | 14,556 | $ | 20,189 | $ | 31,877 | ||||||
|
|
|
|
|
|
|
|||||||
A reconciliation of the differences between the income tax provision computed at the U.S. statutory rate and the reported provision for income taxes is as follows (in thousands):
| Year Ended December 31, | ||||||||||||
| 2010 | 2011 | 2012 | ||||||||||
| Income tax expense at U.S. statutory rate |
$ | 46,551 | $ | 66,876 | $ | 133,984 | ||||||
| Benefit of pass through entity status |
(11,766 | ) | (22,353 | ) | (66,593 | ) | ||||||
| Taxes on foreign earnings at less than the U.S. statutory rate |
(20,184 | ) | (24,236 | ) | (35,514 | ) | ||||||
|
|
|
|
|
|
|
|||||||
| Total income tax expense |
$ | 14,601 | $ | 20,287 | $ | 31,877 | ||||||
|
|
|
|
|
|
|
|||||||
Deferred tax assets and liabilities are recorded for the anticipated future tax effects of temporary differences between the financial statement basis and tax basis of the Company’s assets and liabilities using the applicable tax rates in effect at year-end. A valuation allowance is recorded when it is not more likely than not that some or all of the benefit from the deferred tax asset will be realized. Significant components of deferred tax assets and liabilities are as follows (in thousands):
| December 31, | ||||||||
| 2011 | 2012 | |||||||
| Deferred tax assets |
||||||||
| Current |
||||||||
| Other |
$ | — | $ | 94 | ||||
| Noncurrent |
||||||||
| Property and equipment |
144 | 324 | ||||||
|
|
|
|
|
|||||
| Total deferred tax assets |
144 | 418 | ||||||
|
|
|
|
|
|||||
| Deferred tax liabilities |
||||||||
| Current |
||||||||
| Property and equipment |
— | (21 | ) | |||||
| Noncurrent |
||||||||
| Property and equipment |
(5,322 | ) | (6,899 | ) | ||||
|
|
|
|
|
|||||
| Total deferred liabilities |
(5,322 | ) | (6,920 | ) | ||||
|
|
|
|
|
|||||
| Net deferred tax liabilities |
$ | (5,178 | ) | $ | (6,502 | ) | ||
|
|
|
|
|
|||||
F-31
Table of Contents
Index to Financial Statements
FRANK’S INTERNATIONAL
NOTES TO COMBINED FINANCIAL STATEMENTS
It is the Company’s intention to permanently reinvest undistributed earnings and profits from the subsidiaries of the combined companies’ operations that have been generated through December 31, 2012 and future plans do not demonstrate a need to repatriate the foreign amounts to fund U.S. operations. In the event of distribution of those earnings in the form of dividends or otherwise, the Company would not be subject to either U.S. income taxes nor foreign withholding taxes payable to certain foreign entities.
A tabular reconciliation of the total amounts of uncertain tax positions at the beginning and end of the period is as follows: (in thousands):
| Gross Unrecognized Tax Benefits, Excluding Interest and Penalties |
Interest and Penalties |
Total Gross Unrecognized Tax Benefits |
||||||||||
| Balance at December 31, 2011 |
$ | 1,796 | $ | — | $ | 1,796 | ||||||
| Increase in prior year tax positions |
1,553 | 564 | 2,117 | |||||||||
|
|
|
|
|
|
|
|||||||
| Balance at December 31, 2012 |
$ | 3,349 | $ | 564 | $ | 3,913 | ||||||
|
|
|
|
|
|
|
|||||||
Substantially all of the uncertain tax positions, if recognized in the future, would impact the Company’s effective tax rate. The Company has elected to classify interest and penalties incurred on income taxes as income tax expense. The Company had no changes to its uncertain tax positions in 2010 and 2011 and no interest or penalties on income taxes were recorded during the years ended December 31, 2010 and 2011.
The Company files income tax returns in various international tax jurisdictions. As of December 31, 2012, the tax years 2006 through 2012 remain open to examination in the major foreign taxing jurisdictions to which the Company is subject. There are currently no U.S. Federal or state audits or examinations underway.
Note 14—Commitments and Contingencies
Commitments
The Company is committed under various noncancelable operating lease agreements primarily related to facilities and equipment that expire at various dates throughout the next several years. Future minimum lease commitments under noncancelable operating leases with initial or remaining terms of one year or more at December 31, 2012, are as follows (in thousands):
| Year Ending December 31, |
||||
| 2013 |
$ | 4,955 | ||
| 2014 |
4,060 | |||
| 2015 |
3,241 | |||
| 2016 |
2,775 | |||
| 2017 |
2,748 | |||
| Thereafter |
8,917 | |||
|
|
|
|||
| Total future lease commitments |
$ | 26,696 | ||
|
|
|
|||
Total rent expense incurred under operating leases was $5.2 million, $5.8 million and $8.4 million for the years ended December 31, 2010, 2011 and 2012, respectively.
F-32
Table of Contents
Index to Financial Statements
FRANK’S INTERNATIONAL
NOTES TO COMBINED FINANCIAL STATEMENTS
Contingencies
The Company is the subject of other lawsuits and claims arising in the ordinary course of business. Management cannot predict the ultimate outcome of such lawsuits and claims. While the lawsuits and claims are asserted for amounts that may be material should an unfavorable outcome be the result, management does not expect that these matters will have a material adverse effect on the Company’s financial position or results of operations.
Note 15—Employee Benefit Plans
U.S. Benefit Plans
401(k) Savings and Investment Plan. FII, FCC and FTS administer separate 401(k) savings and investment plans (the “Plans”) as part of the employee benefits package. Employees are required to complete six months of service before becoming eligible to participate in the Plans. Under the terms of the Plans, the Company matches 75% of employee contributions up to $3,000 annually. The Company’s matching contributions to the Plans totaled $2.5 million, $2.6 million and $2.9 million for the years ended December 31 2010, 2011 and 2012, respectively.
Executive Deferred Compensation Plan. The Company and certain affiliates adopted the Frank’s Executive Deferred Compensation Plan (“EDC Plan”) effective December 20, 2004. The purpose of the EDC Plan is to provide participants with an opportunity to defer receipt of a portion of their salary, bonus, and other specified cash compensation. Participant contributions are immediately vested. Company contributions vest after five years of service. All participant benefits under this EDC Plan shall be paid directly from the general funds of the applicable participating subsidiary or a grantor trust, commonly referred to as a Rabbi Trust, created for the purpose of informally funding the EDC Plan, and other than such Rabbi Trust, no special or separate fund shall be established and no other segregation of assets shall be made to assure payment. The assets of the Company EDC Plan’s trust is invested in a corporate owned split-dollar life insurance policy and an amalgamation of mutual funds (Note 7).
The Company recorded compensation expense related to the vesting of the Company’s contribution of $2.5 million, $2.6 million and $4.8 million for the years ended December 31, 2010, 2011 and 2012, respectively. The total liability recorded at December 31, 2011 and 2012, related to the EDC Plan was $25.7 million and $30.1 million, respectively, and was included in other noncurrent liabilities on the combined balance sheets.
Foreign Benefit Plans
The Company sponsors certain benefit plans as dictated by host country law. The Company recorded expense related to foreign benefit plans of $1.6 million, $1.7 million and $2.4 million for the years ended December 31, 2010, 2011 and 2012, respectively.
Note 16—Segment Information
Reporting Segments
Operating segments are defined as components of an enterprise for which separate financial information is available that is regularly evaluated by the chief operating decision maker (“CODM”) in deciding how to allocate resources and assess performance. The Company is comprised of three reportable segments: International Services, U.S. Services and Pipe and Products.
F-33
Table of Contents
Index to Financial Statements
FRANK’S INTERNATIONAL
NOTES TO COMBINED FINANCIAL STATEMENTS
The International Services segment provides tubular services in international offshore markets and in several onshore international regions. The Company’s customers in these international markets are primarily large exploration and production companies, including blue-chip integrated oil and gas companies and national oil and gas companies.
The U.S. Services segment provides tubular running services in almost all of the active onshore oil and gas drilling regions in the U.S., including the Permian Basin, Bakken Shale, Barnett Shale, Eagleford Shale, Haynesville Shale, Marcellus Shale and Utica Shale, as well as in the U.S. Gulf of Mexico.
The Pipe and Products segment designs and manufactures certain products that the Company sells or rents directly to external customers, including large OD pipe connectors and casing attachments. Finally, the Company distributes large OD pipe manufactured by third parties that the Company has equipped with weld-on end connections.
Adjusted EBITDA
The Company defines Adjusted EBITDA as net income before net interest income or expense, depreciation and amortization, income tax benefit or expense, asset impairments, gain or loss on sale of assets, foreign currency gain or loss and other non-cash adjustments. The Company’s CODM uses Adjusted EBITDA as the primary measure of segment reporting performance.
The following table presents a reconciliation of Adjusted EBITDA to net income (in thousands):
| Year Ended December 31, | ||||||||||||
| 2010 | 2011 | 2012 | ||||||||||
| Segment Adjusted EBITDA: |
||||||||||||
| International Services |
$ | 118,487 | $ | 153,064 | $ | 219,199 | ||||||
| U.S. Services |
36,417 | 72,141 | 199,397 | |||||||||
| Pipe and Products |
29,731 | 24,267 | 28,038 | |||||||||
| Corporate and other |
(12 | ) | — | (30 | ) | |||||||
|
|
|
|
|
|
|
|||||||
| Adjusted EBITDA Total |
184,623 | 249,472 | 446,604 | |||||||||
| Interest income (expense), net |
(1,658 | ) | (655 | ) | 264 | |||||||
| Income tax expense |
(14,601 | ) | (20,287 | ) | (31,877 | ) | ||||||
| Depreciation and amortization |
(48,197 | ) | (54,581 | ) | (66,215 | ) | ||||||
| Gain on sale of assets |
164 | 47 | 2,608 | |||||||||
| Foreign currency loss |
(1,930 | ) | (3,209 | ) | (450 | ) | ||||||
|
|
|
|
|
|
|
|||||||
| Net income |
$ | 118,401 | $ | 170,787 | $ | 350,934 | ||||||
|
|
|
|
|
|
|
|||||||
F-34
Table of Contents
Index to Financial Statements
FRANK’S INTERNATIONAL
NOTES TO COMBINED FINANCIAL STATEMENTS
The following tables set forth certain financial information with respect to the Company’s reportable segments. Included in “Corporate and Other” are intersegment eliminations and amounts not directly associated with an operating segment (in thousands):
| International Services |
U.S. Services |
Pipe and Products |
Corporate and Other |
Total | ||||||||||||||||
| Year Ended December 31, 2010 |
||||||||||||||||||||
| Revenue from external customers |
$ | 289,183 | $ | 214,360 | $ | 104,665 | $ | — | $ | 608,208 | ||||||||||
| Inter-segment revenues |
414 | 17,553 | 21,531 | (39,498 | ) | — | ||||||||||||||
| Adjusted EBITDA |
118,487 | 36,417 | 29,731 | (12 | ) | 184,623 | ||||||||||||||
| Depreciation and amortization |
18,540 | 26,457 | 3,200 | — | 48,197 | |||||||||||||||
| Property, plant and equipment |
116,879 | 115,983 | 19,729 | — | 252,591 | |||||||||||||||
| Capital expenditures |
34,313 | 21,605 | 1,345 | — | 57,263 | |||||||||||||||
| Year Ended December 31, 2011 |
||||||||||||||||||||
| Revenue from external customers |
$ | 365,278 | $ | 259,396 | $ | 114,401 | $ | — | $ | 739,075 | ||||||||||
| Inter-segment revenues |
828 | 17,890 | 32,934 | (51,652 | ) | — | ||||||||||||||
| Adjusted EBITDA |
153,064 | 72,141 | 24,267 | — | 249,472 | |||||||||||||||
| Depreciation and amortization |
23,702 | 27,378 | 3,501 | — | 54,581 | |||||||||||||||
| Property, plant and equipment |
164,709 | 138,339 | 21,833 | — | 324,881 | |||||||||||||||
| Capital expenditures |
63,285 | 49,097 | 5,501 | — | 117,883 | |||||||||||||||
| Year Ended December 31, 2012 |
||||||||||||||||||||
| Revenue from external customers |
$ | 467,126 | $ | 422,522 | $ | 166,277 | $ | — | $ | 1,055,925 | ||||||||||
| Inter-segment revenues |
2,338 | 22,046 | 48,409 | (72,793 | ) | — | ||||||||||||||
| Adjusted EBITDA |
219,199 | 199,397 | 28,038 | (30 | ) | 446,604 | ||||||||||||||
| Depreciation and amortization |
31,931 | 30,230 | 4,054 | — | 66,215 | |||||||||||||||
| Property, plant and equipment |
222,197 | 181,830 | 22,473 | — | 426,500 | |||||||||||||||
| Capital expenditures |
98,781 | 75,342 | 6,064 | — | 180,187 | |||||||||||||||
The CODM does not review total assets by segment as part of the financial information provided; therefore, no asset information is provided in the above table.
Geographic Areas
Revenue and property, plant and equipment by geographic area were as follows for the periods indicated (in thousands):
| Year Ended December 31, | ||||||||||||
| 2010 | 2011 | 2012 | ||||||||||
| Revenue: |
||||||||||||
| United States |
$ | 301,002 | $ | 361,408 | $ | 560,559 | ||||||
| Europe/Middle East/Africa |
182,812 | 215,110 | 287,433 | |||||||||
| Latin America |
63,166 | 90,409 | 107,112 | |||||||||
| Other countries |
61,228 | 72,148 | 100,821 | |||||||||
|
|
|
|
|
|
|
|||||||
| $ | 608,208 | $ | 739,075 | $ | 1,055,925 | |||||||
|
|
|
|
|
|
|
|||||||
The revenue generated in The Netherlands was immaterial for the years ended December 31, 2010, 2011 and 2012. Other than the United States, no individual country represented more than 10% of the Company’s revenue for each of the years ended December 31, 2010, 2011 and 2012.
F-35
Table of Contents
Index to Financial Statements
FRANK’S INTERNATIONAL
NOTES TO COMBINED FINANCIAL STATEMENTS
| December 31, | ||||||||
| 2011 | 2012 | |||||||
| Long-Lived Assets (PP&E) |
||||||||
| United States |
$ | 160,172 | $ | 204,303 | ||||
| International |
164,709 | 222,197 | ||||||
|
|
|
|
|
|||||
| $ | 324,881 | $ | 426,500 | |||||
|
|
|
|
|
|||||
Based on the unique nature of the operating structure of the Company, revenue generating assets are interchangeable between international countries and are not separately identifiable. Revenues from customers and long-lived assets in the Netherlands were insignificant in each of the years presented.
Note 17—Subsequent Events
The Venezuelan government has devalued the Bolivar a number of times, including a recent devaluation on February 8, 2013. As a result of the 2013 valuation, the Company estimates a non-deductible foreign exchange loss of approximately $2.0 million in the first quarter of 2013.
F-36
Table of Contents
Index to Financial Statements
FRANK’S INTERNATIONAL
(In thousands)
(Unaudited)
| December 31, 2012 |
March 31, 2013 |
|||||||
| Assets |
||||||||
| Current assets: |
||||||||
| Cash and cash equivalents |
$ | 152,945 | $ | 123,392 | ||||
| Accounts receivables, net |
313,657 | 319,057 | ||||||
| Inventories |
108,543 | 128,471 | ||||||
| Other current assets |
16,632 | 15,556 | ||||||
|
|
|
|
|
|||||
| Total current assets |
591,777 | 586,476 | ||||||
| Property, plant and equipment, net |
426,500 | 449,789 | ||||||
| Goodwill |
15,239 | 15,239 | ||||||
| Intangible assets, net |
1,832 | 1,595 | ||||||
| Other assets |
72,613 | 76,219 | ||||||
|
|
|
|
|
|||||
| Total assets |
$ | 1,107,961 | $ | 1,129,318 | ||||
|
|
|
|
|
|||||
| Liabilities and Stockholders’ Equity |
||||||||
| Current liabilities: |
||||||||
| Current portion of long-term debt and capital lease obligation |
$ | 6,317 | $ | 4,815 | ||||
| Current portion of notes payable—affiliated |
323,476 | 323,476 | ||||||
| Accounts payable |
19,377 | 26,134 | ||||||
| Accrued and other current liabilities |
127,799 | 115,797 | ||||||
|
|
|
|
|
|||||
| Total current liabilities |
476,969 | 470,222 | ||||||
|
|
|
|
|
|||||
| Long-term debt: |
||||||||
| Long-term debt and capital lease obligation |
1,051 | 1,043 | ||||||
| Notes payable—affiliated |
145,792 | 125,362 | ||||||
|
|
|
|
|
|||||
| Total long-term debt |
146,843 | 126,405 | ||||||
|
|
|
|
|
|||||
| Deferred tax liabilities |
6,575 | 6,029 | ||||||
| Other non-current liabilities |
30,586 | 33,011 | ||||||
|
|
|
|
|
|||||
| Total liabilities |
660,973 | 635,667 | ||||||
|
|
|
|
|
|||||
| Commitments and contingencies |
— | — | ||||||
| Stockholders’ equity |
||||||||
| Common stock |
803 | 803 | ||||||
| Additional paid-in capital |
1,409 | 1,409 | ||||||
| Retained earnings |
440,399 | 491,145 | ||||||
| Accumulated other comprehensive income |
4,377 | 294 | ||||||
|
|
|
|
|
|||||
| Total stockholders’ equity |
446,988 | 493,651 | ||||||
|
|
|
|
|
|||||
| Total liabilities and stockholders’ equity |
$ | 1,107,961 | $ | 1,129,318 | ||||
|
|
|
|
|
|||||
The accompanying notes are an integral part of these combined financial statements.
F-37
Table of Contents
Index to Financial Statements
FRANK’S INTERNATIONAL
(In thousands)
(Unaudited)
| Three Months Ended March 31, |
||||||||
| 2012 | 2013 | |||||||
| Revenues: |
||||||||
| Equipment rentals and services |
$ | 203,755 | $ | 205,878 | ||||
| Products |
36,773 | 30,882 | ||||||
|
|
|
|
|
|||||
| Total revenue |
240,528 | 236,760 | ||||||
|
|
|
|
|
|||||
| Operating expenses: |
||||||||
| Cost of revenues, exclusive of depreciation and amortization |
||||||||
| Equipment rentals and services |
72,731 | 75,781 | ||||||
| Products |
24,184 | 18,019 | ||||||
| General and administrative expenses |
41,608 | 44,145 | ||||||
| Depreciation and amortization |
15,424 | 17,783 | ||||||
| Loss on sale of assets |
195 | 23 | ||||||
|
|
|
|
|
|||||
| Operating income |
86,386 | 81,009 | ||||||
|
|
|
|
|
|||||
| Other income (expense): |
||||||||
| Other income |
670 | 2,127 | ||||||
| Interest income (expense), net |
260 | (201 | ) | |||||
| Foreign currency gain (loss) |
2,626 | (3,587 | ) | |||||
|
|
|
|
|
|||||
| Total other income (expense) |
3,556 | (1,661 | ) | |||||
|
|
|
|
|
|||||
| Income before income tax expense |
89,942 | 79,348 | ||||||
| Income tax expense |
7,687 | 6,303 | ||||||
|
|
|
|
|
|||||
| Net income |
$ | 82,255 | $ | 73,045 | ||||
|
|
|
|
|
|||||
The accompanying notes are an integral part of these combined financial statements.
F-38
Table of Contents
Index to Financial Statements
FRANK’S INTERNATIONAL
COMBINED STATEMENTS OF COMPREHENSIVE INCOME
(In thousands)
(Unaudited)
| Three Months Ended March 31, |
||||||||
| 2012 | 2013 | |||||||
| Net income |
$ | 82,255 | $ | 73,045 | ||||
| Other comprehensive income (loss): |
||||||||
| Foreign currency translation adjustments, net of tax |
660 | (4,276 | ) | |||||
| Unrealized gain on marketable securities, net of tax |
38 | 193 | ||||||
|
|
|
|
|
|||||
| Total other comprehensive income (loss) |
698 | (4,083 | ) | |||||
|
|
|
|
|
|||||
| Comprehensive income |
$ | 82,953 | $ | 68,962 | ||||
|
|
|
|
|
|||||
The accompanying notes are an integral part of these combined financial statements.
F-39
Table of Contents
Index to Financial Statements
FRANK’S INTERNATIONAL
COMBINED STATEMENTS OF STOCKHOLDERS’ EQUITY
(In thousands)
(Unaudited)
| Common Stock |
Additional Paid-In Capital |
Retained Earnings |
Accumulated Other Comprehensive Income |
Total Stockholders’ Equity |
||||||||||||||||
| Balances at December 31, 2012 |
$ | 803 | $ | 1,409 | $ | 440,399 | $ | 4,377 | $ | 446,988 | ||||||||||
| Net income |
— | — | 73,045 | — | 73,045 | |||||||||||||||
| Foreign currency translation adjustments |
— | — | — | (4,276 | ) | (4,276 | ) | |||||||||||||
| Unrealized gain on marketable securities |
— | — | — | 193 | 193 | |||||||||||||||
| Distributions to stockholders |
— | — | (22,299 | ) | — | (22,299 | ) | |||||||||||||
|
|
|
|
|
|
|
|
|
|
|
|||||||||||
| Balances at March 31, 2013 |
$ | 803 | $ | 1,409 | $ | 491,145 | $ | 294 | $ | 493,651 | ||||||||||
|
|
|
|
|
|
|
|
|
|
|
|||||||||||
The accompanying notes are an integral part of these combined financial statements.
F-40
Table of Contents
Index to Financial Statements
FRANK’S INTERNATIONAL
COMBINED STATEMENTS OF CASH FLOWS
(In thousands)
(Unaudited)
| Three Months Ended March 31, |
||||||||
| 2012 | 2013 | |||||||
| Cash flows from operating activities |
||||||||
| Net income |
$ | 82,255 | $ | 73,045 | ||||
| Adjustments to reconcile net income to cash provided by operating activities |
||||||||
| Depreciation and amortization |
15,424 | 17,783 | ||||||
| Venezuelan currency devaluation charge |
— | 1,755 | ||||||
| Deferred tax provision |
(90 | ) | (167 | ) | ||||
| Provision for (recovery of) bad debts |
(164 | ) | 1,343 | |||||
| Loss on sale of assets |
195 | 23 | ||||||
| Changes in fair value of marketable securities |
(1,457 | ) | (1,314 | ) | ||||
| Increase in value of life insurance policies |
— | (847 | ) | |||||
| Changes in operating assets and liabilities |
||||||||
| Accounts receivable |
(23,885 | ) | (19,715 | ) | ||||
| Inventories |
(11,191 | ) | (20,097 | ) | ||||
| Other current assets |
2,053 | 1,112 | ||||||
| Other assets |
(316 | ) | 119 | |||||
| Accounts payable |
5,252 | 7,075 | ||||||
| Accrued expenses and other current liabilities |
7,864 | (11,876 | ) | |||||
| Other noncurrent liabilities |
2,729 | 2,425 | ||||||
|
|
|
|
|
|||||
| Net cash provided by operating activities |
78,669 | 50,664 | ||||||
|
|
|
|
|
|||||
| Cash flows from investing activities |
||||||||
| Purchase of property, plant and equipment |
(43,919 | ) | (40,511 | ) | ||||
| Proceeds from sale of equipment |
27 | 49 | ||||||
| Purchase of marketable securities |
(566 | ) | (330 | ) | ||||
| Premiums on life insurance policies |
(1,648 | ) | (1,222 | ) | ||||
| Other |
(1,435 | ) | — | |||||
|
|
|
|
|
|||||
| Net cash used in investing activities |
(47,541 | ) | (42,014 | ) | ||||
|
|
|
|
|
|||||
| Cash flows from financing activities |
||||||||
| Repayments of borrowings |
(1,723 | ) | (21,936 | ) | ||||
| Proceeds from borrowings |
10,000 | — | ||||||
| Distributions to stockholders |
(23,019 | ) | (22,299 | ) | ||||
|
|
|
|
|
|||||
| Net cash used in financing activities |
(14,742 | ) | (44,235 | ) | ||||
| Effect of exchange rate changes on cash due to Venezuelan devaluation |
— | 575 | ||||||
| Effect of exchange rate changes on cash |
(1,933 | ) | 5,457 | |||||
|
|
|
|
|
|||||
| Net increase (decrease) in cash |
14,453 | (29,553 | ) | |||||
| Cash and cash equivalents at beginning of period |
98,649 | 152,945 | ||||||
|
|
|
|
|
|||||
| Cash and cash equivalents at end of period |
$ | 113,102 | $ | 123,392 | ||||
|
|
|
|
|
|||||
The accompanying notes are an integral part of these combined financial statements.
F-41
Table of Contents
Index to Financial Statements
FRANK’S INTERNATIONAL
NOTES TO COMBINED FINANCIAL STATEMENTS (UNAUDITED)
Note 1—Basis of Presentation and Significant Accounting Policies
Nature of Business
Frank’s International is a global provider of highly engineered tubular services to the oil and gas industry. Frank’s International provides services to leading exploration and production companies in both offshore and onshore environments with a focus on complex and technically demanding wells.
Basis of Presentation
The combined financial statements for the three months ended March 31, 2012 and 2013 include the activities of Frank’s International N.V. (“FINV”), a Netherlands corporation, Frank’s International, Inc. (“FII”), Frank’s Casing Crew and Rental Tools, Inc. (“FCC”), Frank’s Tong Service, Inc. (“FTS”) and their wholly owned subsidiaries (collectively, the “Company”). Under this combined method of accounting, the historical combined financial statements of FINV are combined with FII, FCC and FTS. All intercompany accounts and transactions have been eliminated for purposes of preparing these combined financial statements.
Certain information and footnote disclosures required by generally accepted accounting principles in the United States of America (“GAAP”) for complete annual financial statements have been omitted and, therefore, it is suggested that these interim financial statements be read in conjunction with the Company’s audited financial statements for the year ended December 31, 2012 located elsewhere in this prospectus. In the opinion of management, these financial statements, which have been prepared pursuant to the rules of the Securities and Exchange Commission (the “SEC”) and GAAP for interim financial reporting, reflect all adjustments, which consisted only of normal recurring adjustments which were necessary for a fair statement of the interim periods presented. The results of operations for interim periods are not necessarily indicative of those for a full year.
The combined financial statements have been prepared on a historical cost basis using the United States dollar as the reporting currency.
Venezuelan Currency Devaluation
In February 2013, the Venezuelan government announced a devaluation of the Bolivar Fuerte (“Bolivar”), resulting in the exchange rate declining from 4.3 to 6.3 Bolivars per U.S. Dollar. As a result of the devaluation, the Company recorded a foreign currency loss of $1.8 million during the three months ended March 31, 2013, related to the remeasurement of the Bolivar-denominated net monetary assets of the Company’s Venezuelan operations as of the date of the devaluation. In future periods, foreign exchange gains (losses) arising due to the appreciation (depreciation) of the Bolivar versus the U.S. Dollar will result in benefits (charges) to the statements of income based on the value of the Bolivar-denominated net monetary assets at the time when such exchange rate changes become effective.
Recent Accounting Pronouncements
In February 2013, the Financial Accounting Standards Board (“FASB”) issued Accounting Standards Update (“ASU”) No. 2013-02, Reporting of Amounts Reclassified Out of Accumulated Other Comprehensive Income (“AOCI”). This ASU requires entities to present separately, among other items, the amount of the change that is due to reclassifications, and the amount that is due to current period other comprehensive income. The Company adopted this guidance during the first quarter of 2013 which did not have a material impact on its combined financial position, results of operations or cash flows as there are currently no items reclassified from AOCI.
F-42
Table of Contents
Index to Financial Statements
FRANK’S INTERNATIONAL
NOTES TO COMBINED FINANCIAL STATEMENTS (UNAUDITED)
Note 2—Accounts Receivable, net
Accounts receivable at December 31, 2012 and March 31, 2013 were as follows (in thousands):
| December 31, 2012 |
March 31, 2013 |
|||||||
| Trade accounts receivable, net of allowance of $1,697 and $2,953, respectively |
$ | 188,095 | $ | 207,515 | ||||
| Unbilled receivables |
108,713 | 96,509 | ||||||
| Affiliated (1) |
4,551 | 5,464 | ||||||
| Other receivables |
12,298 | 9,569 | ||||||
|
|
|
|
|
|||||
| Total accounts receivable |
$ | 313,657 | $ | 319,057 | ||||
|
|
|
|
|
|||||
| (1) | Amounts represent expenditures on behalf of non-consolidated affiliates. |
Note 3—Inventories
Inventories at December 31, 2012 and March 31, 2013 were as follows (in thousands):
| December 31, 2012 |
March 31, 2013 |
|||||||
| Pipe and connectors |
$ | 87,083 | $ | 108,075 | ||||
| Finished goods |
6,985 | 7,368 | ||||||
| Work in progress |
2,411 | 697 | ||||||
| Raw materials, components and supplies |
12,064 | 12,331 | ||||||
|
|
|
|
|
|||||
| Total inventories |
$ | 108,543 | $ | 128,471 | ||||
|
|
|
|
|
|||||
Note 4—Property, Plant and Equipment
The following is a summary of property, plant and equipment at December 31, 2012 and March 31, 2013 (in thousands):
| Estimated Useful Lives in Years |
December 31, 2012 |
March 31, 2013 |
||||||||||
| Land |
— | $ | 21,344 | $ | 21,177 | |||||||
| Buildings and improvements |
39 | 82,005 | 81,028 | |||||||||
| Rental machinery and equipment |
7 | 563,368 | 583,201 | |||||||||
| Machinery and equipment—other |
7 | 43,086 | 48,001 | |||||||||
| Furniture, fixtures and computers |
5 | 16,707 | 17,528 | |||||||||
| Automobiles and other vehicles |
5 | 55,481 | 55,650 | |||||||||
| Leasehold improvements |
7 | 4,843 | 4,893 | |||||||||
| Construction in progress—machinery and equipment |
— | 62,122 | 75,077 | |||||||||
|
|
|
|
|
|||||||||
| 848,956 | 886,555 | |||||||||||
| Less: Accumulated depreciation |
(422,456 | ) | (436,766 | ) | ||||||||
|
|
|
|
|
|||||||||
| Total property, plant and equipment, net |
$ | 426,500 | $ | 449,789 | ||||||||
|
|
|
|
|
|||||||||
F-43
Table of Contents
Index to Financial Statements
FRANK’S INTERNATIONAL
NOTES TO COMBINED FINANCIAL STATEMENTS (UNAUDITED)
Note 5—Other Assets
Other assets at December 31, 2012 and March 31, 2013 consist of the following (in thousands):
| December 31, 2012 |
March 31, 2013 |
|||||||
| Split-dollar life insurance |
$ | 18,799 | $ | 20,546 | ||||
| Marketable securities held in Rabbi Trust (1) |
36,479 | 38,124 | ||||||
| Notes receivable—affiliates (2) |
6,939 | 7,099 | ||||||
| Other |
10,396 | 10,450 | ||||||
|
|
|
|
|
|||||
| Total other assets |
$ | 72,613 | $ | 76,219 | ||||
|
|
|
|
|
|||||
| (1) | See Note 8—Fair Value Measurements. |
| (2) | Represents amounts due from family members related to split-dollar life insurance policy premiums that the Company maintains. |
Note 6—Accrued and Other Current Liabilities
Accrued and other current liabilities at December 31, 2012 and March 31, 2013 consist of the following (in thousands):
| December 31, 2012 |
March 31, 2013 |
|||||||
| Accrued compensation |
$ | 23,978 | $ | 17,541 | ||||
| Accrued property and other taxes |
23,847 | 22,960 | ||||||
| Deferred revenue |
23,172 | 37,865 | ||||||
| Accrued inventory |
17,273 | 4,076 | ||||||
| Other accrued purchases |
39,529 | 33,355 | ||||||
|
|
|
|
|
|||||
| Total accrued and other current liabilities |
$ | 127,799 | $ | 115,797 | ||||
|
|
|
|
|
|||||
Note 7—Long-term Debt
The following is summary of long-term debt at December 31, 2012 and March 31, 2013 (in thousands):
| December 31, 2012 |
March 31, 2013 |
|||||||
| Lines of credit |
$ | 2,000 | $ | 2,000 | ||||
| Notes payable |
4,464 | 2,981 | ||||||
| Equipment financing |
818 | 799 | ||||||
| Other |
86 | 78 | ||||||
|
|
|
|
|
|||||
| 7,368 | 5,858 | |||||||
| Less: current portion |
(6,317 | ) | (4,815 | ) | ||||
|
|
|
|
|
|||||
| Long-term portion |
1,051 | 1,043 | ||||||
|
|
|
|
|
|||||
| Notes payable—affiliated |
469,268 | 448,838 | ||||||
| Less: current portion |
(323,476 | ) | (323,476 | ) | ||||
|
|
|
|
|
|||||
| Long-term portion |
145,792 | 125,362 | ||||||
|
|
|
|
|
|||||
| Total long-term debt |
$ | 146,843 | $ | 126,405 | ||||
|
|
|
|
|
|||||
F-44
Table of Contents
Index to Financial Statements
FRANK’S INTERNATIONAL
NOTES TO COMBINED FINANCIAL STATEMENTS (UNAUDITED)
Lines of Credit
The Company has two revolving credit facilities, with available borrowing capacities of $40.0 million and $5.0 million, which mature on August 31, 2014 and February 19, 2016, respectively. Interest is paid monthly on the unpaid balance of the $40.0 million line of credit at the London Interbank Offering Rate plus approximately 2.5% per annum. Interest is paid on the unpaid balance of the $5.0 million line of credit at the prime rate, which equates to 4.5% with the applicable margin included. The aggregate outstanding balance under the credit facilities was $2.0 million as of December 31, 2012 and March 31, 2013. The revolving credit facilities have certain financial covenants. As of March 31, 2013, the Company was in compliance with all financial covenants. In addition, we had outstanding letters of credit of $5.9 million as of March 31, 2013.
Notes Payable
The Company has various notes payable totaling $3.2 million and $1.8 million at December 31, 2012 and March 31, 2013, respectively. These notes mature in 2013 with interest rates of 3.0% per annum.
The Company has financed certain business acquisitions. At December 31, 2012 and March 31, 2013, the aggregate outstanding balance of the finance agreements was $1.3 million and $1.2 million, respectively, with interest rates ranging from 5% to 6% per annum. The finance agreements are due on demand and have maturity dates ranging from September 2016 to October 2018.
Equipment Financing
The Company has financed certain aircraft through credit agreements. The aggregate outstanding balance of these credit agreements was $0.8 million at December 31, 2012 and March 31, 2013, with a fixed interest rate of 5.0% per annum payable monthly. The credit agreements mature in August 2013. The notes are secured by the aircraft.
Notes Payable—Affiliated
In 2012, the Company made a non-cash distribution of $484.0 million to the owners of the Company in the form of two unsecured promissory notes payable to FWW.B.V. Interest is charged on the notes at the applicable short-term monthly applicable federal rate (commonly known as the AFR Rate) as published by the Internal Revenue Service. As of December 31, 2012 and March 31, 2013, $320.0 million is included in current portion of notes payable—affiliates because it is due on demand and $144.0 million and $123.7 million, respectively, is included in notes payable—affiliated on the combined balance sheets. The Company also has various notes payable —affiliated of $5.3 million and $5.1 million at December 31, 2012 and March 31, 2013, respectively.
Note 8—Fair Value Measurements
The Company follows fair value measurement authoritative accounting guidance for measuring fair values of assets and liabilities in financial statements. Fair value is the price that would be received to sell an asset or paid to transfer a liability in an orderly transaction between market participants at the measurement date (exit price). The Company utilizes market data or assumptions that market participants who are independent, knowledgeable and willing and able to transact would use in pricing the asset or liability, including assumptions about risk and the risks inherent in the inputs to the valuation technique. The Company is able to classify fair
F-45
Table of Contents
Index to Financial Statements
FRANK’S INTERNATIONAL
NOTES TO COMBINED FINANCIAL STATEMENTS (UNAUDITED)
value balances based on the observability of these inputs. The authoritative guidance for fair value measurements establishes three levels of the fair value hierarchy, defined as follows:
| • | Level 1: Unadjusted, quoted prices for identical assets or liabilities in active markets. |
| • | Level 2: Quoted prices in markets that are not considered to be active or financial instruments for which all significant inputs are observable, either directly or indirectly for substantially the full term of the asset or liability. |
| • | Level 3: Significant, unobservable inputs for use when little or no market data exists, requiring a significant degree of judgment. |
The hierarchy gives the highest priority to Level 1 measurements and the lowest priority to Level 3 measurements. Depending on the particular asset or liability, input availability can vary depending on factors such as product type, longevity of a product in the market and other particular transaction conditions. In some cases, certain inputs used to measure fair value may be categorized into different levels of the fair value hierarchy. For disclosure purposes under the accounting guidance, the lowest level that contains significant inputs used in valuation should be chosen.
Financial Assets and Liabilities
A summary of financial assets and liabilities that are measured at fair value on a recurring basis as of December 31, 2012 and March 31, 2013 were as follows (in thousands):
| Quoted Prices in Active Markets |
Significant Other Observable Inputs |
Significant Unobservable Inputs |
||||||||||||||
| (Level 1) | (Level 2) | (Level 3) | Total | |||||||||||||
| December 31, 2012 |
||||||||||||||||
| Assets: |
||||||||||||||||
| Investments available-for-sale: |
||||||||||||||||
| Marketable securities—deferred compensation plan |
$ | 36,479 | $ | — | $ | — | $ | 36,479 | ||||||||
| Marketable securities—other |
3,717 | — | — | 3,717 | ||||||||||||
| Liabilities: |
||||||||||||||||
| Marketable securities—deferred compensation plan |
30,143 | — | — | 30,143 | ||||||||||||
| March 31, 2013 |
||||||||||||||||
| Assets: |
||||||||||||||||
| Investments available-for-sale: |
||||||||||||||||
| Marketable securities—deferred compensation plan |
$ | 38,124 | $ | — | $ | — | $ | 38,124 | ||||||||
| Marketable securities—other |
3,910 | — | — | 3,910 | ||||||||||||
| Liabilities: |
||||||||||||||||
| Marketable securities—deferred compensation plan |
32,649 | — | — | 32,649 | ||||||||||||
The Company’s investments associated with its deferred compensation plan consist of marketable securities and mutual funds that are publicly traded and for which market prices are readily available. Other marketable securities are included in other assets on the combined balance sheets.
F-46
Table of Contents
Index to Financial Statements
FRANK’S INTERNATIONAL
NOTES TO COMBINED FINANCIAL STATEMENTS (UNAUDITED)
Assets and Liabilities Measured at Fair Value on a Non-recurring Basis
The Company applies the provisions of the fair value measurement standard to its non-recurring, non-financial measurements including business combinations as well as impairment related to goodwill and other long-lived assets. For business combinations, the purchase price is allocated to the assets acquired and liabilities assumed based on a discounted cash flow model for most intangibles as well as market assumptions for the valuation of equipment and other fixed assets. The Company utilizes a discounted cash flow model in evaluating impairment considerations related to goodwill and long-lived assets. Given the unobservable nature of the inputs, the discounted cash flow models are deemed to use Level 3 inputs. There were no non-recurring measurements during the interim periods presented.
Fair Value of Long-Term Debt
The carrying values and fair values of the Company’s long-term debt at December 31, 2012 and March 31, 2013 were as follows (in thousands):
| December 31, 2012 | March 31, 2013 | |||||||||||||||
| Carrying Value |
Fair Value |
Carrying Value |
Fair Value |
|||||||||||||
| Lines of credit |
$ | 1,000 | $ | 1,000 | $ | 1,000 | $ | 1,000 | ||||||||
| Capital lease obligations |
51 | 51 | 43 | 43 | ||||||||||||
|
|
|
|
|
|
|
|
|
|||||||||
| $ | 1,051 | $ | 1,051 | $ | 1,043 | $ | 1,043 | |||||||||
|
|
|
|
|
|
|
|
|
|||||||||
The carrying values on the Company’s combined balance sheet of its cash and cash equivalents, trade accounts receivable, other current assets, accounts payable and accrued and other current liabilities approximates fair values due to their short maturities; therefore, they are excluded from the foregoing table.
The carrying value of the Company’s lines of credit approximates fair value because of its variable rate structure. The fair value of the capital lease was estimated to not be materially different from the carrying amount.
Transactions involving related parties cannot be presumed to be carried out on an arm’s-length basis, as the requisite conditions of competitive, free-market dealings may not exist. It is not practical to determine the fair value of the long-term portion of the notes payable to FWW B.V. due to its related party nature.
Note 9—Common Stock
At December 31, 2012 and March 31, 2013, the Company’s common stock consisted of the following (in thousands, except per share information):
| Par Value Per Share |
Shares | Common Stock |
||||||||||||||
| Authorized | Issued | |||||||||||||||
| FINV |
€ | 0.0100 | 240,000 | 48,096 | $ | 617 | ||||||||||
| FII |
$ | 1.0000 | 100 | 10 | 10 | |||||||||||
| FCC |
$ | 0.0380 | 10,000 | 2,000 | 76 | |||||||||||
| FTS |
$ | 1.0000 | 100 | 100 | 100 | |||||||||||
|
|
|
|
|
|
|
|||||||||||
| 250,200 | 50,206 | $ | 803 | |||||||||||||
|
|
|
|
|
|
|
|||||||||||
F-47
Table of Contents
Index to Financial Statements
FRANK’S INTERNATIONAL
NOTES TO COMBINED FINANCIAL STATEMENTS (UNAUDITED)
Note 10—Related Party Transactions
The Company has engaged in certain transactions with other companies related to the Company by common ownership. The Company has entered into various operating leases with an affiliated partnership to lease office space from the partnership. Rent expense related to these leases was $0.7 million $0.8 million for the three months ended March 31, 2012 and 2013, respectively.
The Company had receivables totaling $5.6 million and $5.8 million at December 31, 2012 and March 31, 2013, respectively, due from our chief executive officer and certain members of the Mosing family, relating to amounts owed to the Company for split-dollar life insurance policy premiums that the Company maintains. The Company will collect the receivable either directly from the executive officer, if employment terminates other than by death, or from the executive officer’s beneficiary, if employment terminates due to death of the executive officer. The receivables are recorded in other assets on the combined balance sheets. The cash surrender value of $18.8 million and $20.5 million related to such policies is recorded in other assets as of December 31, 2012 and March 31, 2013, respectively. The Company recorded an unrealized gain of $0.8 million for the three months ended March 31, 2013 in general and administrative expenses on the combined statements of income.
In addition, the Company has two outstanding notes payable to FWW B.V. See Note 7—Long-Term Debt.
Note 11—Income Taxes
As of March 31, 2013, there were no significant changes to the Company’s unrecognized tax benefits as reported in its audited financial statements for the year ended December 31, 2012.
The Company’s effective tax rate on income before income taxes for the three months ended March 31, 2012 and 2013 was 8.5% and 7.9%, respectively. The tax rate for the three months ended March 31, 2012 and 2013 is lower than the U.S. statutory income tax rate of 35% due to the Company’s Subchapter S status for its U.S. entities as well as lower statutory tax rates in certain foreign jurisdictions where the Company operates. A Subchapter S corporation is a flow through entity for U.S. federal income tax purposes and generally is not subject to a corporate level U.S. federal income tax.
Note 12—Commitments and Contingencies
The Company is the subject of lawsuits and claims arising in the ordinary course of business. Management cannot predict the ultimate outcome of such lawsuits and claims. While the lawsuits and claims are asserted for amounts that may be material should an unfavorable outcome be the result, management does not expect that these matters will have a material adverse effect on the Company’s financial position or results of operations.
Note 13—Segment Information
Adjusted EBITDA
The Company defines Adjusted EBITDA as net income before net interest income or expense, depreciation and amortization, income tax benefit or expense, asset impairments, gain or loss on sale of assets, foreign currency gain or loss and other non-cash adjustments. The Company’s chief operating decision maker (“CODM”) uses Adjusted EBITDA as the primary measure of segment reporting performance.
F-48
Table of Contents
Index to Financial Statements
FRANK’S INTERNATIONAL
NOTES TO COMBINED FINANCIAL STATEMENTS (UNAUDITED)
The following table presents a reconciliation of Adjusted EBITDA to net income (in thousands):
| Three Months Ended March 31, |
||||||||
| 2012 | 2013 | |||||||
| Segment Adjusted EBITDA: |
||||||||
| International Services |
$ | 51,815 | $ | 49,959 | ||||
| U.S. Services |
44,610 | 42,794 | ||||||
| Pipe and Products |
6,259 | 8,337 | ||||||
| Corporate and other |
(9 | ) | (148 | ) | ||||
|
|
|
|
|
|||||
| Adjusted EBITDA Total |
102,675 | 100,942 | ||||||
| Interest income (expense), net |
260 | (201 | ) | |||||
| Income tax expense |
(7,687 | ) | (6,303 | ) | ||||
| Depreciation and amortization |
(15,424 | ) | (17,783 | ) | ||||
| Loss on sale of assets |
(195 | ) | (23 | ) | ||||
| Foreign currency gain (loss) |
2,626 | (3,587 | ) | |||||
|
|
|
|
|
|||||
| Net income |
$ | 82,255 | $ | 73,045 | ||||
|
|
|
|
|
|||||
The following tables set forth certain financial information with respect to the Company’s reportable segments. Included in “Corporate and Other” are intersegment eliminations and costs associated with activities of a general nature (in thousands):
| International Services |
U.S. Services |
Pipe and Products |
Corporate and Other |
Total | ||||||||||||||||
| Three Months Ended March 31, 2012 |
||||||||||||||||||||
| Revenue from external customers |
$ | 109,035 | $ | 96,820 | $ | 34,673 | $ | — | $ | 240,528 | ||||||||||
| Inter-segment revenues |
503 | 4,549 | 10,626 | (15,678 | ) | — | ||||||||||||||
| Adjusted EBITDA |
51,815 | 44,610 | 6,259 | (9 | ) | 102,675 | ||||||||||||||
| Three Months Ended March 31, 2013 |
||||||||||||||||||||
| Revenue from external customers |
$ | 110,488 | $ | 97,557 | $ | 28,715 | $ | — | $ | 236,760 | ||||||||||
| Inter-segment revenues |
815 | 5,165 | 16,289 | (22,269 | ) | — | ||||||||||||||
| Adjusted EBITDA |
49,959 | 42,794 | 8,337 | (148 | ) | 100,942 | ||||||||||||||
Note 14—Subsequent Event
In June 2013, the Company sold a component of its Pipe and Products segment, which is expected to result in an estimated gain of approximately $41.0 million in the second quarter ended June 30, 2013. Revenues associated with the component were $16.9 million and $4.2 million for the year ended December 31, 2012 and three months ended March 31, 2013, respectively.
F-49
Table of Contents
Index to Financial Statements
Selected Industry Terms
The following industry terms defined in this section are used throughout this prospectus:
Blowout Preventer (BOP). A large valve at the top of a well that may be closed to regain control of a reservoir if the drilling crew or other wellsite personnel lose control of formation fluids.
Bottomhole assembly. Lower portion of the drill string, consisting of the drill bit, drill collars, heavy-weight drill pipe and stroking tools. Also includes various tools to enable directional drilling if required.
Casing. Large-diameter pipe lowered into an openhole wellbore and cemented in place.
Cementing. The process of pumping cement between the outside of an installed string of casing and wellbore.
Completion. A generic term used to describe the assembly of downhole tubulars and equipment required to enable safe and efficient production from an oil or gas well.
Control line. A small-diameter hydraulic line used to operate downhole completion equipment.
Connector. A small joint of pipe used to connect two tubular components.
Drilling Rig. The machine used to drill a wellbore.
Drill Bit. Tool attached to the bottom of a drill string that serves as the cutting or boring element used to drill the wellbore.
Drill Floor. The elevated platform where the majority of activity by a drilling rig crew occurs during drilling and casing operations, including make-up and breakout of tubulars and supervision and monitoring of the drilling process.
Drill Pipe. Heavy tubular steel conduit fitted with special threaded ends called tool joints. The drill pipe connects the surface equipment with the bottomhole assembly, both to pump drilling fluid to the drill bit and to raise, lower and rotate the bottomhole assembly.
Drill String. The combination of the drillpipe and the bottomhole assembly.
Elevator. A set of clamps that grip tubulars so that the tubulars can be raised or lowered into the wellbore.
Hook Load. The total force pulling down on the hook, including the weight of the drill string and any ancillary equipment, reduced by any force that tends to reduce that weight such as friction along the wellbore wall (especially in deviated wells) and buoyant forces on the drill string caused by its immersion in drilling fluid.
Hydrocarbon. A naturally occurring organic compound comprising hydrogen and carbon. Hydrocarbons can be as simple as methane, but many are highly complex molecules, and can occur as gases, liquids or solids. Petroleum is a complex mixture of hydrocarbons. The most common hydrocarbons are natural gas, oil and coal.
Landing String. A long string of drill pipe used to lower blowout preventer stacks and casing strings to the ocean floor from an offshore drilling rig.
Make-Up and Breakout. Process of spinning and torquing when connecting and disconnecting tubulars.
Pipe Handling. Equipment used to move and connect tubulars.
Rotary Table. Machine embedded into drill floor used to rotate the drill string.
Slips. Wedge-shaped pieces of metal with gripping elements that are used to hold tubulars in place or to prevent tubulars from slipping down into the wellbore.
A-1
Table of Contents
Index to Financial Statements
Spider. A circular steel device that holds slips supporting a suspended string of drill pipe, casing, or tubing from the drill floor.
Tongs. Large wrenches used for torquing when making-up or breaking-out tubulars.
Top Drive. Machine used to rotate the drill string by attaching to the top of the drillpipe without the use of the rotary table.
Tubing. String of pipe set inside the well casing, through which a reservoir’s oil or natural gas is produced.
Tubulars. Drill pipe, casing, tubing, or other piping placed in the wellbore.
Wellbore. The physical hole drilled from surface into the hydrocarbon reservoir.
A-2
Table of Contents
Index to Financial Statements
30,000,000 Shares
Frank’s International N.V.
Common Stock
Prospectus
, 2013
Barclays
Credit Suisse
Simmons & Company
International
Citigroup
Morgan Stanley
Goldman, Sachs & Co.
UBS Investment Bank
Capital One Southcoast
Tudor, Pickering, Holt & Co.
Global Hunter Securities
Johnson Rice & Company L.L.C.
FBR
Scotiabank / Howard Weil
You should rely only on the information contained in this prospectus or in any free writing prospectus Frank’s International may authorize to be delivered to you. Until , 2013 (25 days after the date of this prospectus), federal securities laws may require all dealers that effect transactions in the trust units, whether or not participating in this offering, to deliver a prospectus. This is in addition to the dealers’ obligation to deliver a prospectus when acting as underwriters and with respect to their unsold allotments or subscriptions.
Table of Contents
Index to Financial Statements
Part II
Information not required in prospectus
| Item 13. | Other Expenses of Issuance and Distribution |
The following table sets forth an itemized statement of the amounts of all expenses (excluding underwriting discounts and commissions) payable by us in connection with the registration of the common stock offered hereby. With the exception of the SEC registration fee, the New York Stock Exchange listing fee and the FINRA filing fee, the amounts set forth below are estimates.
| SEC registration fee |
$ | 98,822 | ||
| FINRA filing fee |
109,175 | |||
| NYSE listing fee |
250,000 | |||
| Accountants’ fees and expenses |
700,000 | |||
| Legal fees and expenses |
2,100,000 | |||
| Printing and engraving expenses |
200,000 | |||
| Transfer agent and registrar fees |
4,000 | |||
| Miscellaneous |
38,003 | |||
|
|
|
|||
| Total |
$ | 3,500,000 | ||
|
|
|
| Item 14. | Indemnification of Directors and Officers |
Our directors and executive officers will enter into indemnification agreements with us. The agreements provide, to the fullest extent permitted by our amended and restated articles of association and the law of The Netherlands, that we will indemnify the directors and executive officers against any and all liabilities, claims, judgments, fines, penalties, interest and expenses, including attorneys fees, incurred in connection with any expected, threatened, pending or completed action, investigation or other proceeding, whether civil, criminal or administrative, involving a director or an executive officer by reason of his position as director or officer.
The articles of association provide that we will, to the full extent permitted by the law of The Netherlands, as amended from time to time, indemnify, and advance expenses to, each of its now acting and former management board and supervisory board members, officers, employees and agents, whenever any such person is made a party, or threatened to be made a party, in any action, suit or proceeding by reason of his service with us. The articles of association also provide that we may purchase and maintain directors’ and officers’ liability insurance.
In any underwriting agreement we enter into in connection with the sale of common stock being registered hereby, the underwriters will agree to indemnify, under certain conditions, us, our directors, our officers and persons who control us, within the meaning of the Securities Act, against certain liabilities.
| Item 15. | Recent Sales of Unregistered Securities |
There have been no sales of unregistered securities within the past three years.
II-1
Table of Contents
Index to Financial Statements
| Item 16. | Exhibits and Financial Statement Schedules |
(a) Exhibits
| Exhibit number |
Description | |||
| **1.1 | Form of Underwriting Agreement | |||
| **3.1 | Articles of Association of Frank’s International N.V. | |||
| **3.2 | Form of Amended and Restated Articles of Association of Frank’s International N.V. | |||
| 5.1 | Opinion of Van Campen Liem (Liem & Partners N.V.) | |||
| 8.1 | Opinion of Van Campen Liem (Liem & Partners N.V.) regarding material Netherlands tax matters | |||
| 8.2 | Opinion of Vinson & Elkins L.L.P. regarding material U.S. tax matters | |||
| **10.1 | Form of 5-Year Credit Agreement, among Frank’s International C.V., Amegy Bank National Association, as Administration Agent, and Capital One, National Association, as Syndication Agent and certain other lenders party thereto | |||
| **10.2 | Form of 364-Day Credit Agreement, among Frank’s International C.V., Amegy Bank National Association, as Administration Agent, and certain other lenders party thereto | |||
| **†10.3 | Form of Indemnification Agreement | |||
| **†10.4 | Form of Long-Term Incentive Plan | |||
| **†10.5 | Form of Restricted Stock Unit Agreement (for non-employee directors) | |||
| **†10.6 | Form of Restricted Stock Unit Agreement (for employees) | |||
| **†10.7 | Form of Employment Agreement for D. Keith Mosing | |||
| **†10.8 | Form of Employment Agreement for each of Robert R. Gilbert, C. Michael Webre, Mark G. Margavio, Brian D. Baird and W. John Walker | |||
| **10.9 | Form of Registration Rights Agreement | |||
| **10.10 | Form of Tax Receivable Agreement | |||
| **10.11 | Global Transaction Agreement, dated as of July 22, 2013, between Frank’s International N.V. and Mosing Holdings, Inc. | |||
| **10.12 | Voting Agreement, dated as of July 22, 2013, by and among Ginsoma Family C.V., FWW B.V., Mosing Holdings, Inc., and certain other parties thereto. | |||
| **10.13 | Form of FICV Management Agreement | |||
| **10.14 | Form of Limited Partnership Agreement of Frank’s International C.V. | |||
| **21.1 | List of Subsidiaries of Frank’s International N.V. | |||
| 23.1 | Consent of PricewaterhouseCoopers LLP | |||
| 23.2 | Consent of Van Campen Liem (Liem & Partners N.V.) (included as part of Exhibit 5.1 hereto) | |||
| 23.3 | Consent of Van Campen Liem (Liem & Partners N.V.) (included as part of Exhibit 8.1 hereto) | |||
| 23.4 | Consent of Vinson & Elkins L.L.P. (included as part of Exhibit 8.2 hereto) | |||
| **99.1 | Consent of Spears and Associates, Inc. | |||
| **99.2 | Consent of Sheldon Erikson, as Director Nominee | |||
| **99.3 | Consent of Kirkland D. Mosing, as Director Nominee | |||
| **99.4 | Consent of Steven B. Mosing, as Director Nominee | |||
| ** | Previously filed |
| † | Management contract or compensatory plan or arrangement. |
II-2
Table of Contents
Index to Financial Statements
| Item 17. | Undertakings |
The undersigned registrant hereby undertakes to provide to the underwriters at the closing specified in the underwriting agreement certificates in such denominations and registered in such names as required by the underwriters to permit prompt delivery to each purchaser.
Insofar as indemnification for liabilities arising under the Securities Act may be permitted to directors, officers and controlling persons of the registrant pursuant to the foregoing provisions, or otherwise, the registrant has been advised that in the opinion of the Securities and Exchange Commission such indemnification is against public policy as expressed in the Securities Act and is, therefore, unenforceable. In the event that a claim for indemnification against such liabilities (other than the payment by the registrant of expenses incurred or paid by a director, officer or controlling person of the registrant in the successful defense of any action, suit or proceeding) is asserted by such director, officer or controlling person in connection with the securities being registered, the registrant will, unless in the opinion of its counsel the matter has been settled by controlling precedent, submit to a court of appropriate jurisdiction the question whether such indemnification by it is against public policy as expressed in the Securities Act and will be governed by the final adjudication of such issue.
The undersigned registrant hereby undertakes that:
(1) For purposes of determining any liability under the Securities Act, the information omitted from the form of prospectus filed as part of this registration statement in reliance upon Rule 430A and contained in a form of prospectus filed by the registrant pursuant to Rule 424(b)(1) or (4) or 497(h) under the Securities Act shall be deemed to be part of this registration statement as of the time it was declared effective.
(2) For the purpose of determining any liability under the Securities Act, each post-effective amendment that contains a form of prospectus shall be deemed to be a new registration statement relating to the securities offered therein, and the offering of such securities at that time shall be deemed to be the initial bona fide offering thereof.
II-3
Table of Contents
Index to Financial Statements
Signatures
Pursuant to the requirements of the Securities Act of 1933, the registrant has duly caused this Registration Statement to be signed on its behalf by the undersigned, thereunto duly authorized, in the City of Houston, State of Texas, on July 26, 2013.
| FRANK’S INTERNATIONAL N.V. | ||
| By: |
/s/ Donald Keith Mosing | |
| Donald Keith Mosing | ||
| Chairman of the Board, Director, Chief Executive Officer and President | ||
Pursuant to the requirements of the Securities Act of 1933, as amended, this Registration Statement has been signed below by the following persons in the capacities and the dates indicated.
| Name |
Title |
Date | ||
|
/s/ Donald Keith Mosing Donald Keith Mosing |
Chairman of the Board, Director, Chief Executive Officer and President (Principal Executive Officer) |
July 26, 2013 | ||
| /s/ Mark G. Margavio Mark G. Margavio |
Chief Financial Officer (Principal Financial Officer and Principal Accounting Officer) |
July 26, 2013 | ||
II-4
Table of Contents
Index to Financial Statements
INDEX TO EXHIBITS
| Exhibit number |
Description | |||
| **1.1 | Form of Underwriting Agreement | |||
| **3.1 | Articles of Association of Frank’s International N.V. | |||
| **3.2 | Form of Amended and Restated Articles of Association of Frank’s International N.V. | |||
| 5.1 | Opinion of Van Campen Liem (Liem & Partners N.V.) | |||
| 8.1 | Opinion of Van Campen Liem (Liem & Partners N.V.) regarding material Netherlands tax matters | |||
| 8.2 | Opinion of Vinson & Elkins L.L.P. regarding material U.S. tax matters | |||
| **10.1 | Form of 5-Year Credit Agreement, among Frank’s International C.V., Amegy Bank National Association, as Administration Agent, and Capital One, National Association, as Syndication Agent and certain other lenders party thereto | |||
| **10.2 | Form of 364-Day Credit Agreement, among Frank’s International C.V., Amegy Bank National Association, as Administration Agent, and certain other lenders party thereto | |||
| **†10.3 | Form of Indemnification Agreement | |||
| **†10.4 | Form of Long-Term Incentive Plan | |||
| **†10.5 | Form of Restricted Stock Unit Agreement (for non-employee directors) | |||
| **†10.6 | Form of Restricted Stock Unit Agreement (for employees) | |||
| **†10.7 | Form of Employment Agreement for D. Keith Mosing | |||
| **†10.8 | Form of Employment Agreement for each of Robert R. Gilbert, C. Michael Webre, Mark G. Margavio, Brian D. Baird and W. John Walker | |||
| **10.9 | Form of Registration Rights Agreement | |||
| **10.10 | Form of Tax Receivable Agreement | |||
| **10.11 | Global Transaction Agreement, dated as of July 22, 2013, between Frank’s International N.V. and Mosing Holdings, Inc. | |||
| **10.12 | Voting Agreement, dated as of July 22, 2013, by and among Ginsoma Family C.V., FWW B.V., Mosing Holdings, Inc., and certain other parties thereto. | |||
| **10.13 | Form of FICV Management Agreement | |||
| **10.14 | Form of Limited Partnership Agreement of Frank’s International C.V. | |||
| **21.1 | List of Subsidiaries of Frank’s International N.V. | |||
| 23.1 | Consent of PricewaterhouseCoopers LLP | |||
| 23.2 | Consent of Van Campen Liem (Liem & Partners N.V.) (included as part of Exhibit 5.1 hereto) | |||
| 23.3 | Consent of Van Campen Liem (Liem & Partners N.V.) (included as part of Exhibit 8.1 hereto) | |||
| 23.4 | Consent of Vinson & Elkins L.L.P. (included as part of Exhibit 8.2 hereto) | |||
| **99.1 | Consent of Spears and Associates, Inc. | |||
| **99.2 | Consent of Sheldon Erikson, as Director Nominee | |||
| **99.3 | Consent of Kirkland D. Mosing, as Director Nominee | |||
| **99.4 | Consent of Steven B. Mosing, as Director Nominee | |||
| ** | Previously filed |
| † | Management contract or compensatory plan or arrangement. |
II-5