Attached files
| file | filename |
|---|---|
| 8-K - FORM 8-K - LyondellBasell Industries N.V. | d576056d8k.htm |
| EX-99.1 - EX-99.1 - LyondellBasell Industries N.V. | d576056dex991.htm |
 July 26, 2013
S E I Z E T H
E M O M E N T S
E I Z E T H E M O M E N T
S E C U R I N G T H E F U T U R
E S E C U R I N G T H E F U T
U R E Exhibit 99.2
Second-Quarter 2013 Earnings
Jim Gallogly, Chief Executive Officer
Karyn Ovelmen, Chief Financial Officer
Sergey
Vasnetsov,
SVP
-
Strategic
Planning
and
Transactions
Doug
Pike,
VP
-
Investor
Relations |
 lyondellbasell.com
Cautionary Statement
The information in this presentation includes forward-looking statements. These
statements relate to future events, such as anticipated revenues, earnings,
business strategies, competitive position or other aspects of our operations
or operating results. Actual outcomes and results may differ materially from
what is expressed or forecast in such forward-looking statements. These
statements are not guarantees of future performance and involve certain
risks, uncertainties and assumptions that are difficult to predict.
Factors that could cause actual results to differ from forward-looking
statements include, but are not limited to, availability, cost and price
volatility of raw materials and utilities; supply/demand balances; industry
production capacities and operating rates; uncertainties associated with worldwide economies;
legal,
tax
and
environmental
proceedings;
cyclical
nature
of
the
chemical
and
refining
industries;
operating interruptions; current and potential governmental regulatory actions;
terrorist acts; international political unrest; competitive products and
pricing; technological developments; the ability to comply with the terms of
our credit facilities and other financing arrangements; the ability to implement business
strategies;
and
other
factors
affecting
our
business
generally
as
set
forth
in
the
“Risk
Factors”
section
of
our Form 10-K for the year ended December 31, 2012, which can be found at
www.lyondellbasell.com on the Investor Relations page and on the Securities
and Exchange Commission’s website at www.sec.gov. This presentation
contains time sensitive information that is accurate only as of the date hereof.
Information contained in this presentation is unaudited and is subject to
change. We undertake no obligation to update the information presented
herein except as required by law. 2 |
 lyondellbasell.com
Information Related to Financial Measures
We have included EBITDA in this presentation, which is a non-GAAP measure, as
we believe that EBITDA
is
a
measure
commonly used by
investors.
However,
EBITDA,
as
presented
herein,
may
not
be
comparable to a similarly titled measure reported by other companies due to
differences in the way the measure is calculated.
We calculate EBITDA as income from continuing operations plus interest
expense (net), provision for (benefit from) income taxes, and depreciation &
amortization. EBITDA should not be considered an alternative to profit or
operating profit for any period as an indicator of our performance, or as an
alternative to operating cash flows as a measure of our liquidity. See Table 9 of
our
accompanying
earnings
release
for
reconciliations
of
EBITDA
to
net
income.
While
we
also
believe
that
free
cash
flow
(FCF)
and
book
capital
are
measures
commonly
used
by
investors,
free
cash
flow
and
book
capital,
as
presented
herein,
may
not
be
comparable
to
similarly
titled
measures reported by other companies due to differences in the way the measures are
calculated. For purposes of this presentation, free cash flow means net cash
provided by operating activities minus capital
expenditures
and
book
capital
means
total
debt
plus
stockholders’
equity
plus
minority
interests.
3 |
 lyondellbasell.com
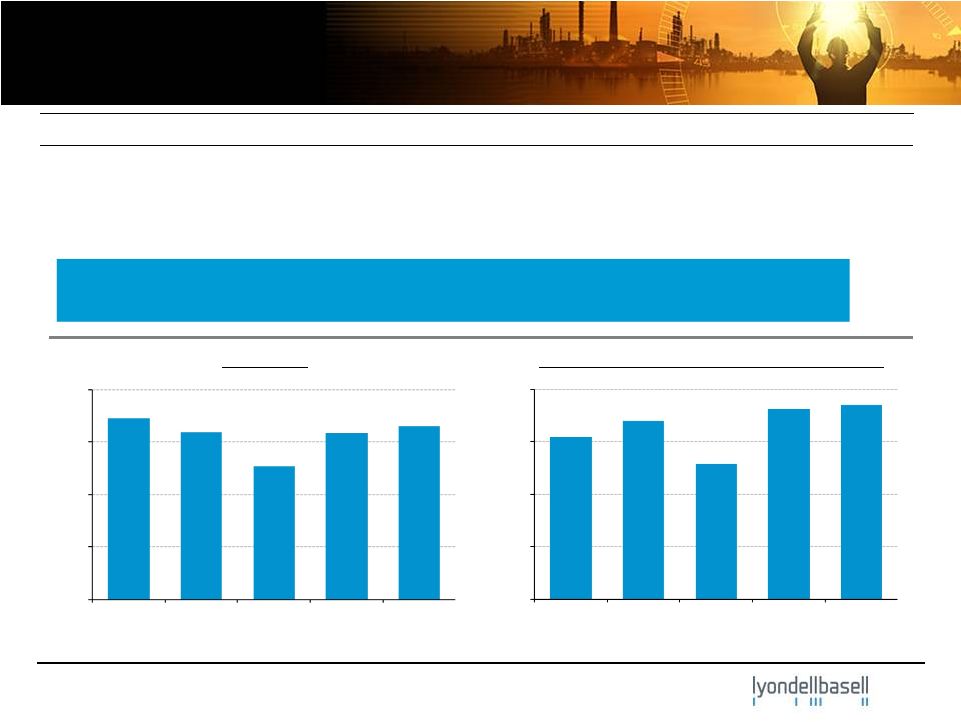
Highlights
EBITDA
EPS Growth vs. Q1’13: 3%
EPS Growth vs. Q2’12: 20%
($ in millions)
4
Income from Continuing Operations
2Q'12
3Q'12
4Q'12
1Q'13
2Q'13
250
500
750
$1,000
2Q'12
3Q'12
4Q'12
1Q'13
2Q'13
($ in millions, except per share data)
2Q'13
1Q'13
2Q'12
EBITDA
(1)
$1,652
$1,585
$1,727
Income from Continuing Operations
$923
$906
$768
Diluted Earnings ($ / share) from Continuing Operations
$1.60
$1.56
$1.33
500
1,000
1,500
$2,000
(1)
(1)
(1)
(1) EBITDA and income from continuing operations include a pre-tax lower of cost or market
adjustment of $71 million in the second quarter 2012 which was reversed in the third quarter
2012, due to a recovery in market prices.
|
 •
Sustained safety results through Q2
Injuries per 200,000 Hours Worked
(1)
1) Includes employees and contractors.
5
0.0
0.1
0.2
0.3
0.4
0.5
2009
2010
2011
2012
1H 2013
lyondellbasell.com
LyondellBasell Safety Performance |
 Second Quarter 2013 and Last-Twelve-Months
(LTM) Segment EBITDA
6
June 2013 LTM EBITDA
Second Quarter 2013 EBITDA
($ in millions)
($ in millions)
lyondellbasell.com
200
400
600
800
$1000
Q2’13 EBITDA
$1,652 million
Q2’13 Operating Income
$1,364 million
LTM June EBITDA
$6,091 million
LTM Operating Income
$4,918 million
Olefins &
Olefins &
Intermediates
Refining
Technology
Polyolefins -
Polyolefins -
& Derivatives
Americas
EAI
750
1,500
2,250
3,000
$3,750
Olefins &
Olefins &
Intermediates
Refining
Technology
Polyolefins -
Polyolefins -
& Derivatives
Americas
EAI |
 1)
Beginning and ending cash balances include cash and cash equivalents; 2) Includes accounts receivable, inventories, and accounts payable; 3) Includes capital and maintenance
turnaround spending.
(3)
(2)
(1)
($ in millions)
(2)
(1)
Second Quarter 2013
LTM June 2013
(3)
(1)
7
(1)
$2,879
$3,233
0
1,000
2,000
3,000
4,000
$5,000
Q2'13
Beginning
Cash
Balance
CF from
Operations
excl. Working
Capital
Working
Capital
Changes
Capex
Dividends &
Share
Repurchase
Other
Q2'13 Ending
Cash
Balance
$1,950
$3,233
0
1,500
3,000
4,500
6,000
$7,500
Q3'12
Beginning
Cash
Balance
CF from
Operations
excl.
Working
Capital
Working
Capital
Changes
Capex
Dividends &
Share
Repurchase
Other
Q2'13
Ending Cash
Balance
lyondellbasell.com
Cash Flow |
 Working Capital and Key Financial Statistics
Snapshot at June 30, 2013
LTM FCF: $4.1 billion
LTM Capex: $1.4 billion
Cash: $3.2 billion
Total Debt/LTM EBITDA: 0.7x
Total Debt/Book Capital: 27%
1) Figures depicted represent end of quarter balances
($ in billions)
Working Capital
(1)
Key Statistics
8
($4)
($2)
$0
$2
$4
$6
$8
2Q'12
3Q'12
4Q'12
1Q'13
2Q'13
Total WC
Inventory
AR
AP
lyondellbasell.com |
 lyondellbasell.com
Olefins & Polyolefins -
Americas
Highlights
and
Business
Drivers
-
2Q’13
U.S. Olefins
•
Above 100% of nameplate capacity
•
Higher spot sales volume
Polyethylene
•
Volumes flat
•
Spread up 4¢/lb
Polypropylene (includes Catalloy)
•
Volumes up ~ 13%
•
Spread up 3¢/lb
Ethylene Chain Margins
(2)
EBITDA
(1)
Performance vs. 1Q’13
Polypropylene Margins
(2)
($ in millions)
(cents / lb)
(cents / lb)
9
1)
EBITDA
includes
a
lower
of
cost
or
market
adjustment
of
$71
million
in
the
second
quarter
2012
which
was
reversed
in
the
third
quarter
2012,
due
to
a
recovery
in
market
prices;
2)
Source: quarterly average
industry data from third party consultant .
(10)
5
20
35
50
2Q’12
1Q’13
2Q’13
July ’13
Ethane Margin
Naphtha Margin
HDPE Margin
Ethylene/HDPE Chain
600
200
400
800
$1000
2Q'12
3Q'12
4Q'12
1Q'13
2Q'13
2Q'12
1Q'13
2Q'13
Jul'13
0
1
2
3
4
EBITDA
Margin
Volume |
 EBITDA
Margin
Volume
Olefins & Polyolefins -
Europe, Asia, International
Highlights and Business Drivers -
2Q’13
EU Olefins
•
Margin expansion –
LPG cracking and
naphtha volatility
•
Operating rate ~ 92%
Polyethylene
•
Volumes up ~ 9%
•
Spread down ~ 1¢/lb
Polypropylene (includes Catalloy)
•
Volumes up ~ 10%
•
Spread flat
JV equity income
European Ethylene Chain Margins
(1)
EBITDA
Performance vs. 1Q’13
European Polypropylene Margins
(1)
($ in millions)
(cents / lb)
(cents / lb)
10
1) Source: quarterly average data from third party consultant.
100
200
300
$400
2Q'12
3Q'12
4Q'12
1Q'13
2Q'13
(10)
5
20
35
50
2Q'12
1Q'13
2Q'13
Jul'13
HDPE Margin
Naphtha Margin
Ethylene/HDPE Chain
(6)
(4)
(2)
0
2
2Q'12
1Q'13
2Q'13
Jul'13
lyondellbasell.com |
 EBITDA
Propylene Oxide and Derivatives
EBITDA
Margin
Volume
Performance vs. 1Q’13
($ in millions)
11
EU MTBE Raw Material Margins (per Platts)
(1)
(cents / gallon)
P-Glycol Raw Material Margins (per Chemdata)
(1)
(cents / lb)
1) Data represents quarterly average.
lyondellbasell.com
0
15
30
45
2Q12
1Q13
2Q13
3Q13 E
0
50
100
150
2Q'12
1Q'13
2Q'13
Jul'13
100
200
300
400
$500
2Q'12
3Q'12
4Q'12
1Q'13
2Q'13
•
Turnaround impacts
•
Weaker butanediol margins
•
Lower deicer sales
Intermediates
•
Stronger Acetyls and EO/EG
volumes
•
Lower C4 chemicals and styrene
volumes due to turnarounds
Oxyfuels
•
U.S. Butane to gasoline spread
expansion
Intermediates & Derivatives
Highlights and Business Drivers -
2Q’13 |
 Refining Highlights and Business Drivers -
2Q’13
Houston Refinery
•
Crude throughput: 265 MBPD
•
Maya 2-1-1: $18.49 bbl
•
RINs cost up $22 million
Refining Spreads (per Platts)
(1)
EBITDA
Performance vs. 1Q’13
EBITDA
Margin
Volume
($ in millions)
($ / bbl)
1) Light Louisiana Sweet (LLS) is the referenced light crude. Data represents
quarterly average. 12
Refining Throughput
(MBPD)
Capacity = 268 MBPD
40
80
120
160
$200
2Q'12
3Q'12
4Q'12
1Q'13
2Q'13
0
100
200
300
2Q'12
3Q'12
4Q'12
1Q'13
2Q'13
0
10
20
30
2Q'12
1Q'13
2Q'13
Jul'13
Lt-Hvy
Lt-Gasoline
Lt-Heating Oil
lyondellbasell.com |
 lyondellbasell.com
–
Midwest olefin/polyolefin plant
turnaround in Q3
–
Intermediates and Derivatives have
completed turnarounds
–
Refining crude infrastructure delivery
progresses; continued high cost of
RINs
–
Growth projects remain on schedule
Second-Quarter Summary and Outlook
–
Record
O&P
–
Americas
results
•
Continued U.S. NGL advantage
–
Europe olefins and polyolefins
margins expansion from LPG
cracking and naphtha volatility;
steady performance in differentiated
products
–
Intermediates and Derivatives
segment results impacted by
multiple turnarounds
–
Houston refinery operation near full
capacity; increased cost of RINs;
weakened Maya 2-1-1
Second-Quarter Summary
Near-Term Outlook
13 |