Attached files
| file | filename |
|---|---|
| EX-31.2 - EX-31.2 - BMC SOFTWARE INC | d572917dex312.htm |
| EX-31.1 - EX-31.1 - BMC SOFTWARE INC | d572917dex311.htm |
Table of Contents
UNITED STATES
SECURITIES AND EXCHANGE COMMISSION
Washington, D.C. 20549
FORM 10-K/A
Amendment No. 1
(Mark One)
| x | ANNUAL REPORT PURSUANT TO SECTION 13 OR 15(d) OF THE SECURITIES EXCHANGE ACT OF 1934 |
For the fiscal year ended March 31, 2013
OR
| ¨ | TRANSITION REPORT PURSUANT TO SECTION 13 OR 15(d) OF THE SECURITIES EXCHANGE ACT OF 1934 |
For the transition period from to
Commission file number 001-16393
BMC Software, Inc.
(Exact name of registrant as specified in its charter)
| Delaware | 74-2126120 | |
| (State or other jurisdiction of incorporation or organization) |
(I.R.S. Employer Identification No.) |
| 2101 CityWest Boulevard Houston, Texas |
77042-2827 | |
| (Address of principal executive offices) | (Zip Code) |
(713) 918-8800
Registrant’s telephone number, including area code
Securities registered pursuant to Section 12(b) of the Act:
| Title of each class |
Name of each exchange on which registered | |
| Common Stock, par value $.01 per share | The NASDAQ Stock Market LLC |
Securities registered pursuant to section 12(g) of the Act: None
Indicate by check mark if the registrant is a well-known seasoned issuer, as defined in Rule 405 of the Securities Act. Yes x No ¨
Indicate by check mark if the registrant is not required to file reports pursuant to Section 13 or Section 15(d) of the Act. Yes ¨ No x
Indicate by check mark whether the registrant: (1) has filed all reports required to be filed by Section 13 or 15(d) of the Securities Exchange Act of 1934 during the preceding 12 months (or for such shorter period that the registrant was required to file such reports), and (2) has been subject to such filing requirements for the past 90 days. Yes x No ¨
Indicate by check mark whether the registrant has submitted electronically and posted on its corporate Web site, if any, every Interactive Data File required to be submitted and posted pursuant to Rule 405 of Regulation S-T (§232.405 of this chapter) during the preceding 12 months (or for such shorter period that the registrant was required to submit and post such files). Yes x No ¨
Indicate by check mark if disclosure of delinquent filers pursuant to Item 405 of Regulation S-K (§229.405 of this chapter) is not contained herein, and will not be contained, to the best of registrant’s knowledge, in definitive proxy or information statements incorporated by reference in Part III of this Form 10-K or any amendment to this Form 10-K. ¨
Indicate by check mark whether the registrant is a large accelerated filer, an accelerated filer, a non-accelerated filer, or a smaller reporting company. See the definitions of “large accelerated filer,” “accelerated filer” and “smaller reporting company” in Rule 12b-2 of the Exchange Act.
| Large accelerated filer | x | Accelerated filer | ¨ | |||
| Non-accelerated filer | ¨ (Do not check if a smaller reporting company) | Smaller reporting company | ¨ | |||
Indicate by check mark whether the registrant is a shell company (as defined in Rule 12b-2 of the Act). Yes ¨ No x
The aggregate market value of voting and non-voting common equity held by non-affiliates of the registrant was approximately $6,429,383,000 at September 30, 2012 based upon the closing sale price of the Common Stock on the NASDAQ Stock Market reported on such date.
As of July 25, 2013, there were 141,929,434 outstanding shares of Common Stock, par value $.01, of the registrant.
DOCUMENTS INCORPORATED BY REFERENCE:
None.
Table of Contents
EXPLANATORY NOTE
This Amendment No. 1 on Form 10-K/A (this “Form 10-K/A”) amends the Annual Report on Form 10-K for the year ended March 31, 2013 (the “Original Form 10-K”) of BMC Software, Inc. filed with the Securities and Exchange Commission (the “SEC”) on May 9, 2013. This Form 10-K/A is being filed to include certain information that was to be incorporated by reference from our definitive proxy statement (pursuant to Regulation 14A under the Securities and Exchange Act of 1934, as amended (the “Exchange Act”)) for our 2013 Annual Meeting of Stockholders (the “2013 Proxy Statement”). This Form 10-K/A hereby amends and restates in their entirety Items 10 through 14 of Part III of the Original Form 10-K as well as the cover page to remove the statement that information is being incorporated by reference from the 2013 Proxy Statement.
Except as otherwise expressly noted herein and the filing of related certifications, this Form 10-K/A does not amend any other information set forth in the Original Form 10-K, and we have not updated disclosures contained therein to reflect any events that occurred at a date subsequent to the date of the Original Form 10-K. Accordingly, this Form 10-K/A should be read in conjunction with the Original Form 10-K and our other filings with the SEC.
Unless the context requires otherwise, all references to “BMC Software,” “BMC,” “we,” “our” and “us” mean BMC Software, Inc., a Delaware corporation, and one or more of its subsidiaries.
Table of Contents
BMC Software, Inc.
Form 10-K/A
| 10-K/A PART AND ITEM NO. |
Page | |||||
| PART III |
||||||
| ITEM 10. | 2 | |||||
| ITEM 11. | 13 | |||||
| ITEM 12. | SECURITY OWNERSHIP OF CERTAIN BENEFICIAL OWNERS AND MANAGEMENT AND RELATED STOCKHOLDER MATTERS |
40 | ||||
| ITEM 13. | CERTAIN RELATIONSHIPS AND RELATED TRANSACTIONS, AND DIRECTOR INDEPENDENCE |
43 | ||||
| ITEM 14. | 44 | |||||
| PART IV |
||||||
| ITEM 15. | 47 | |||||
1
Table of Contents
| Item 10. | Directors, Executive Officers and Corporate Governance |
DIRECTORS
The size of our Board of Directors (the “Board”) is currently set at 13 directors. Each director is elected annually to serve until the next Annual Meeting of Stockholders (the “Annual Meeting”) and until his or her successor is elected and qualified. Each of the directors listed below was elected by the stockholders at the last Annual Meeting.
| Name |
Age | Position and Office Held |
Director Since |
|||||
| Robert E. Beauchamp |
53 | Director – Chairman of the Board, President and Chief Executive Officer |
2001 | |||||
| Jon E. Barfield |
61 | Director – Independent, Lead Director | 2001 | |||||
| Gary L. Bloom |
52 | Director – Independent | 2007 | |||||
| John M. Dillon |
63 | Director – Independent | 2012 | |||||
| Meldon K. Gafner |
65 | Director – Independent | 1987 | |||||
| Mark J. Hawkins |
54 | Director – Independent | 2010 | |||||
| Stephan A. James |
66 | Director – Independent | 2010 | |||||
| P. Thomas Jenkins |
53 | Director – Independent | 2004 | |||||
| Louis J. Lavigne, Jr |
65 | Director – Independent | 2008 | |||||
| Kathleen A. O’Neil |
61 | Director – Independent | 2002 | |||||
| Alex Pinchev |
63 | Director – Independent | 2012 | |||||
| Carl James (Jim) Schaper |
61 | Director – Independent | 2012 | |||||
| Tom C. Tinsley |
60 | Director – Independent | 1997 | |||||
Director Information and Qualifications
Listed below are the biographies of each director. The biographies include information regarding each individual’s service as a director of the Company, business experience and principal occupations for at least the past five years, director positions at public companies held currently or at any time during the past five years, and the experiences, qualifications, attributes or skills that led the Corporate Governance & Nominating Committee (the “Governance Committee”) to recommend, and the Board to determine, that the person should serve as a director for the Company. In addition to the information presented below regarding each director's specific experience, qualifications, attributes and skills that led our Board to the conclusion that he or she should serve as a director, we also believe that all of our directors have a reputation for integrity, sound judgment and excellent analytical skills. Each of our directors has demonstrated business acumen and a commitment of service to the Company and our Board and complements the attributes and skills of the other directors.
Robert E. Beauchamp. Mr. Beauchamp has served as Chairman of the Board since October 2008 and has served as our President and Chief Executive Officer and a member of the Board since January 2001. He brings to these positions a thorough understanding of our business with experience in key areas, including business strategy, research and development, marketing and sales. Mr. Beauchamp joined us in 1988, dedicating six years to the sales organization and progressing from senior account representative to sales manager. While in sales he gained a solid understanding of the business issues our customers face on a daily basis. He joined our marketing organization in 1994, becoming Vice President, Strategic Marketing & Development in 1996, and subsequently assumed responsibility for our mergers and acquisitions efforts. Prior to his selection as President and Chief Executive Officer, he further developed his knowledge of our Company and the software business as Senior Vice President of Product Management and Development. Mr. Beauchamp has been active and served on the boards of numerous non-profit, industry and civic organizations during his career and currently serves on the board of National Oilwell Varco, Inc., a public company, and as a member of the Board of Regents for Baylor University.
As the Company’s Chief Executive Officer for the past 12 years and an employee of the Company with increasing levels of responsibility for nearly 25 years, Mr. Beauchamp brings to the Board extensive knowledge of the software industry and an in-depth understanding of all aspects of the Company, including its customers, operations, competitive landscape and key business drivers.
2
Table of Contents
Jon E. Barfield. Mr. Barfield has served as our Lead Director since January 2010 and has been a director since 2001. Mr. Barfield is President and Chief Executive Officer of LJ Holdings Investment Company LLC, a private investment company. In March 2012, he retired from The Bartech Group, Inc. (“Bartech”) where he served since 1981 as President and from 1995 to March 2012 as Chairman and President, of this industry-leading professional services firm, with headquarters in Southfield, Michigan, delivering talent management and managed service provider solutions to Global 1000 firms. Bartech employs and manages the daily work assignments for more than 26,000 associates and more than $2 billion in procurement for major employers around the world, making Bartech one of the largest, independent talent management and managed service provider firms in the United States. During the past five years, he previously served as a director of Motorola Mobility Holdings, Inc. and National City Corp. He has been a director of CMS Energy since August 2005.
A graduate of Princeton University and Harvard Law School, Mr. Barfield brings to the Board legal knowledge and experience, having practiced corporate and securities law at Sidley Austin LLP. His qualifications to serve as a director stem primarily through his experiences as a senior leader, and his varied service as a director with considerable experience regarding legal risk oversight and risk management, financial reporting, attracting and retaining key talent and related human resources experience, corporate governance and mergers and acquisitions (“M&A”).
Gary L. Bloom. Mr. Bloom has been a director since 2007. Mr. Bloom is currently the President and Chief Executive Officer of MarkLogic Corporation, a privately held software company, having assumed this role in May 2012. From March 2010 until January 2012, he served as Chief Executive Officer of eMeter, Inc., a privately held software company that was acquired by Siemens Corporation in January 2012. From December 2006 to December 2009, Mr. Bloom was a consultant of Texas Pacific Group, a global private investment firm. Mr. Bloom served as Vice Chairman and President of Symantec Corporation from July 2005 to March 2006. Mr. Bloom joined Symantec through its merger with VERITAS Software Corporation, where he served as President and Chief Executive Officer from November 2000 to January 2002, and Chairman, President and Chief Executive Officer from January 2002 to July 2005. Mr. Bloom joined VERITAS after a 14-year career with Oracle Corporation, rising to the rank of Executive Vice President. During the past five years, Mr. Bloom served on the board of Taleo Corporation until it was acquired by Oracle in April 2012.
Through his 25 years of software company experience, including as a former Chief Executive Officer of a publicly traded software company, and service on other public software company boards, Mr. Bloom brings to the Board extensive knowledge of the software industry and specific insights into the operational and strategic issues facing the Company. Mr. Bloom also brings to the Board technology M&A experience both as a Chief Executive Officer and as a board member.
John M. Dillon. Mr. Dillon has been a director since July 2012. Since January 2009, Mr. Dillon has served as the Chief Executive Officer of Engine Yard, Inc., the leading cloud platform for automating and developing Ruby on Rails and PHP applications. From 2002 to 2008, Mr. Dillon served as Chief Executive Officer for Navis, Inc., a private company specializing in software systems for operating large marine container terminals and distribution centers. Before Navis, he served as Chief Executive Officer for Salesforce.com and as President and Chief Executive Officer of Hyperion Solutions. Mr. Dillon began his career as a Systems Engineer for Electronic Data Systems Corporation (“EDS”) and then moved into a variety of sales management positions for various high-tech companies, including Oracle Corporation. Mr. Dillon served on active duty in the nuclear submarine service for five years before beginning his civilian career. Mr. Dillon holds a Bachelor’s degree in Engineering from the United States Naval Academy and an MBA from Golden Gate University. Mr. Dillon currently serves on the board of TransAct Technologies Incorporated and Centerpointe Community Bank, both public companies. During the past five years, Mr. Dillon served on the board of Epicor Software, a public company.
With his engineering background, numerous executive positions with leading technology companies and current position as Chief Executive Officer of a cloud-based software development company, Mr. Dillon brings to the Board extensive knowledge of research and development organizations, software development and the technology industry generally.
Meldon K. Gafner. Mr. Gafner is a private investor. For the past five years, he has been self-employed as a consultant in the communications technology field. From 1988 to 1997, he served in various leadership roles, including as Chief Executive Officer and Vice Chairman, with ComStream Corporation, a privately held manufacturer of high-speed satellite earth stations for data distribution.
As a result of his professional experiences, Mr. Gafner possesses knowledge and experience in management of companies focusing on technology-driven innovation. Mr. Gafner has also served for more than 20 years on the Board affording institutional continuity and industry knowledge accumulated through various industry and economic cycles and through the Company’s growth during that period.
3
Table of Contents
Mark J. Hawkins. Mr. Hawkins has been a director since 2010. Mr. Hawkins has served as Executive Vice President and Chief Financial Officer of Autodesk, Inc. since April 2009. Prior to joining Autodesk, Mr. Hawkins served as Chief Financial Officer and Senior Vice President of Finance and Information Technology at Logitech International S.A. from April 2006 to April 2009. He was employed by Dell Inc. in various finance roles from 2000 to 2006, most recently serving as Vice President of Finance for worldwide procurement and logistics. Prior to joining Dell, Mr. Hawkins was employed by Hewlett-Packard Company for 18 years in finance and business-management roles.
As a Chief Financial Officer of a publicly traded software company, Mr. Hawkins brings to the Board global financial management expertise in the technology industry, including experience in the areas of accounting, capital markets and information technology management.
Stephan A. James. Mr. James has been a director since 2010. Mr. James is the former Chief Operating Officer of Accenture Ltd., and served as Vice Chairman of Accenture Ltd. from 2001 to 2004. He also served in the advisory position of International Chairman of Accenture from August 2004 to 2006. Mr. James serves as a director of the following public companies: Fidelity National Information Services, Inc. and Navigant Consulting, Inc. Within the past five years, Mr. James also served as a director of Metavante Technologies, Inc., a public company.
Mr. James brings to the Board valuable and extensive business and strategic experience in the management and operations of a large, complex international technology-based professional services and outsourcing organization. In addition, Mr. James possesses significant public company board experience.
P. Thomas Jenkins. Mr. Jenkins has been a director since 2004. Mr. Jenkins currently serves as Executive Chairman of the Board and Chief Strategy Officer of Open Text Corporation, a publicly traded software company and a leader in providing enterprise content management. Mr. Jenkins was appointed Chief Strategy Officer of Open Text in 2005. He served as Chief Executive Officer of Open Text from 1997 to 2005. From 1994 to 1997, Mr. Jenkins held progressive executive positions with Open Text. In addition to his Open Text responsibilities, Mr. Jenkins is the Chair of the federal centre of excellence Canadian Digital Media Network. He is also an appointed member of the Social Sciences and Humanities Research Council of Canada.
Mr. Jenkins brings to the Board a wealth of executive knowledge and extensive business strategy, operational and global management experience in the software industry.
Louis J. Lavigne, Jr. Mr. Lavigne has been a director since 2008. Mr. Lavigne is currently Managing Director of Lavrite, LLC, a management consulting firm specializing in the areas of corporate finance, accounting growth and strategy management. Mr. Lavigne retired in March 2005 as Executive Vice President and Chief Financial Officer of Genentech, Inc. He served as Genentech’s Chief Financial Officer from 1988 to 2005. Mr. Lavigne became the Controller in May 1983 and an officer of Genentech in February 1984. Mr. Lavigne serves as a director and as Chairperson of the board of Accuray Incorporated and as a director of Allergan, Inc. and Depomed, Inc., all public companies. Mr. Lavigne previously served on our Board from October 2004 to February 2007. Mr. Lavigne also serves as a trustee of Babson College and Children’s Hospital Oakland. He is also a Board Member and Audit Committee Chair of NovoCure and SafeNet, private companies.
As a former Chief Financial Officer of a large, complex publicly traded company and a current and former member of numerous public company boards, Mr. Lavigne brings to the Board financial expertise and extensive experience in business operations, strategy, accounting and public company governance.
Kathleen A. O'Neil. Ms. O’Neil has been a director since 2002. She is the President and Chief Executive Officer of Liberty Street Advisors, LLC, a company that she founded in 2001. Liberty Street Advisors, LLC advises public and private companies on corporate governance, risk management and strategy development. Prior to her work at Liberty Street Advisors, Ms. O’Neil was employed at IBM as General Manager of the company’s Global Financial Markets Infrastructure Group from January 2001 to September 2001. Prior to joining IBM, Ms. O’Neil functioned for 24 years at the Federal Reserve Bank of New York in a series of executive roles including Chief Financial Examiner, Chief Operations Officer, Chief Financial Officer, Chief Administrative Officer and Chief Risk Officer. Ms. O’Neil is lead independent director of the board of directors of Guidance Software, a public company. Ms. O’Neil also chairs the board of trustees of the Motley Fool Funds Trust and is a member of the board of directors of MetLife Bank, N.A., a subsidiary of MetLife, Inc.
As a result of Ms. O’Neil’s professional experiences, she provides the Board with financial expertise, experience in risk management, executive managerial experience and extensive knowledge of corporate governance.
4
Table of Contents
Alex Pinchev. Mr. Pinchev has been a director since September 2012. From January 2012 to May 2013, he served as President and Chief Executive Officer of Acronis, Inc., a leading provider of data protection and disaster recovery software. From 2008 to 2011, Mr. Pinchev served as President of Global Sales, Services & Field Marketing at Red Hat, Inc. Prior to that, he served as Executive Vice President of Worldwide Sales at Red Hat from 2003 to 2008. During his career, Mr. Pinchev has held senior executive roles at numerous technology companies, including MRO Software, Interchip and MainControl Inc. where he was chairman, CEO and founder. Mr. Pinchev currently serves on the board of Logi Analytics, a private technology company.
As a result of his computer science background and three decades in the technology industry, including holding numerous senior executive sales positions, Mr. Pinchev provides the Board with expertise in software sales, global operations, managing growth, building strategic customer relationships and software company management generally.
Carl James (Jim) Schaper. Mr. Schaper has been a director since July 2012. Since December 2010, Mr. Schaper has served as Chairman of the Board of Directors of Infor Global Solutions (“Infor”). In June 2002, Mr. Schaper founded Infor and served as Chairman, President and CEO of Infor from 2002 to December 2010. Mr. Schaper also serves as an operating partner of Golden Gate Capital, a private equity investment firm. Previously, he served as the Chairman and CEO of Primis Corporation. Prior to Primis, he served as the Chief Operating Officer of Medaphis Corporation. In addition to these roles, Mr. Schaper has served as the Chief Operating Officer of Dun and Bradstreet Software. Mr. Schaper serves on the board of Q2ebanking Software, a privately held company.
With over 30 years of experience in the technology industry, Mr. Schaper brings to the Board an extensive background in software company management, mergers and acquisitions, and corporate finance as well as board experience. The Board benefits from Mr. Schaper’s industry knowledge and experience managing and growing a global software company.
Tom C. Tinsley. Mr. Tinsley has been a director since 1997. He is an Advisory Director with General Atlantic Partners, a private equity investment firm. He previously served as a Partner of General Atlantic Partners from 2001 to December 2010 and as a Special Advisor to General Atlantic Partners from 1999 to 2001. Mr. Tinsley joined Baan Company N.V. in November 1995 as President and Chief Operating Officer and served in that position until June 1999. Prior to joining Baan, he was a Director at McKinsey & Company, Inc., where he was employed for 18 years. Mr. Tinsley serves on the board of Net 1 UEPS Technologies, Inc., a public company, and Intermedia, a privately held company.
Mr. Tinsley brings to the Board managerial experience in the software industry and, by virtue of his 15 years of service on the Board, extensive knowledge of the Company. The Board also values and benefits from Mr. Tinsley’s experience in evaluating, investing in and acquiring technology companies.
EXECUTIVE OFFICERS
Certain information concerning our executive officers as of the date of this Form 10-K/A is set forth below, except that information concerning Mr. Beauchamp is set forth above under “Directors.”
| Name |
Age | Position | ||
| Paul Avenant |
48 | Senior Vice President of Solutions | ||
| Kia Behnia |
42 | Senior Vice President, Chief Technology Officer | ||
| Brian Bergdoll |
55 | Senior Vice President of Sales | ||
| Kenneth W. Berryman |
45 | Senior Vice President, Strategy and Corporate Development | ||
| Hollie S. Castro |
44 | Senior Vice President, Administration | ||
| D. Stephen Goddard, Jr |
57 | Senior Vice President, Business Operations | ||
| William D. Miller |
62 | Chief Operating Officer | ||
| H. Carv Moore |
56 | Senior Vice President of Sales | ||
| Stephen B. Solcher |
52 | Senior Vice President, Chief Financial Officer | ||
| Patrick K. Tagtow |
46 | Senior Vice President, General Counsel and Secretary | ||
| T. Cory Bleuer |
43 | Vice President, Controller and Chief Accounting Officer |
5
Table of Contents
Paul Avenant is Senior Vice President of Solutions. He oversees the company’s five product lines, including Service Support, Data Center Automation & Cloud Management, Workload Automation, Performance & Availability and Data Management. From 2011 to 2012, he served as Senior Vice President, President of Enterprise Service Management (“ESM”) business unit. From 2010 to 2011, Mr. Avenant served as Senior Vice President of ESM-Solutions and brand management and was responsible for product strategy, research and development, customer support and marketing. Under his leadership, BMC Atrium was developed and established as service-driven architecture of Business Service Management. He joined BMC in 2004 as Vice President of R&D after spending nearly nine years at Hewlett-Packard Company. He has more than 20 years experience, including numerous leadership roles in the network, systems and service management market segment.
Mr. Behnia was appointed Senior Vice President and Chief Technology Officer in 2011. Mr. Behnia joined BMC in 2004 through the acquisition of Marimba, Inc., where he served as CTO. Initially serving as a vice president and corporate software architect with us, Mr. Behnia was promoted to Vice President – Chief Architect in 2005 and to Senior Vice President – Platform Architect in 2010. Mr. Behnia has more than 19 years experience in enterprise service, infrastructure and application management.
Mr. Bergdoll is Senior Vice President of Sales. Mr. Bergdoll joined BMC Software in 1986. He has held numerous sales, marketing and strategy management positions at BMC. During his tenure, he has led various teams dealing with the company’s largest customers. He most recently led worldwide sales, software consulting and marketing for the Mainframe Services Management (“MSM”) business unit. Before joining BMC Software, Mr. Bergdoll worked for seven years at IBM in various sales and sales management positions.
Mr. Berryman was appointed Senior Vice President, Strategy and Corporate Development in September 2010. Prior to joining us, Mr. Berryman served in various leadership roles at Symantec Corporation from 2007 to 2010, including most recently as Senior Vice President, Strategy and Emerging Businesses. From 2002 to 2007, Mr. Berryman was a partner at McKinsey & Company, and he served as a consultant at McKinsey from 1997 to 2002. Mr. Berryman was a research scientist at Princeton University from 1995 to 1997.
Ms. Castro was appointed Senior Vice President, Administration in September 2009. Prior to joining us, Ms. Castro served as Senior Vice President of Corporate Services for Talisman Energy from October 2008 to September 2009. She was the CEO of Global Rainmakers Coaching and Consulting from July 2006 to October 2008. From October 2000 to July 2006, Ms. Castro served as Vice President, Human Resources for Cisco Systems, Inc. She also served as an HR executive for General Electric Company from August 1996 to October 2000.
Mr. Goddard was appointed Senior Vice President, Business Operations in November 2008. Prior to this appointment, Mr. Goddard served as Vice President, Assurance from April 2007 to October 2008. He joined us in July 2003 and served in management positions in both Finance and IT. Prior to joining us, Mr. Goddard was with Arthur Andersen for 25 years, serving in various client serving and leadership positions including as the Gulf Coast Managing Partner.
Mr. Miller was appointed Chief Operating Officer in May 2013. Previously, from 2008 to 2013, he served as Senior Vice President, President of MSM. He served as Senior Vice President, General Manager, MSM from February 2007 to October 2008. Mr. Miller served as Vice President, General Manager, MSM from April 2006 to February 2007. Mr. Miller joined us in July 2002 and served in various senior management positions in our mainframe business unit, including General Manager from April 2004 to April 2006. Mr. Miller joined Bindview Development as Senior Vice President of Sales and Services in July 2000 and was promoted to Chief Operating Officer in October 2001 before joining us. Mr. Miller left IBM in 2000 after working with IBM for 21 years in various technical and sales positions and was Vice President, EMEA, Industrial Sector for his last assignment at IBM.
Mr. Moore was appointed Senior Vice President of Sales in 2012. Mr. Moore has more than 25 years of executive and sales leadership experience. Prior to joining BMC, he was senior vice president of Sun Microsystems’ global software business and responsible for driving worldwide software product and services sales in more than 160 countries. In previous roles, Moore served as president of four market-leading companies including SeeBeyond, Novell, Cambridge Technology Partners and Excell Data Corporation. He has also held executive and sales positions at IBM and Digital Equipment Corporation.
Mr. Solcher was appointed Senior Vice President and Chief Financial Officer in December 2005. From August 2005 to December 2005, Mr. Solcher served as our interim Chief Financial Officer. Prior to this appointment, Mr. Solcher had served as our Vice President of Finance and Treasurer for more than five years. Mr. Solcher joined us in 1991 as Assistant Treasurer.
Mr. Tagtow was appointed Senior Vice President, General Counsel and Secretary in November 2011. Mr. Tagtow served as our interim general counsel from May 2011 until he was appointed to his current position in November 2011. Prior to being named General Counsel, he served as BMC’s Vice President of Litigation from 2007 to 2011 with responsibility for global litigation management, legal and regulatory enterprise risk management and our compliance and ethics program. Mr. Tagtow joined us in 1999 as Legal Counsel from the law firm of Haynes and Boone, L.L.P. where he practiced commercial and employment litigation.
6
Table of Contents
Mr. Bleuer was appointed Vice President, Controller and Chief Accounting Officer in August 2006. Prior to joining us, Mr. Bleuer was the Vice President and Controller of EMC Corporation’s Captiva Software group from December 2005 to July 2006 and was Vice President and Corporate Controller of Captiva Software Corporation from February 2005 to December 2005. Prior to joining Captiva Software Corporation, Mr. Bleuer was with Fair Isaac Corporation serving as the Corporate Controller from August 2004 to February 2005 and as Director, Corporate Finance and Accounting from August 2002 to August 2004. From June 2000 to August 2002, Mr. Bleuer served as Corporate Controller of HNC Software Inc.
7
Table of Contents
SECTION 16(a) BENEFICIAL OWNERSHIP REPORTING COMPLIANCE
Section 16(a) of the Securities Exchange Act of 1934, as amended, requires our directors and executive officers, among others, to file with the SEC and the NASDAQ Stock Market (the “NASDAQ”) an initial report of ownership of our $.01 par value common stock (“Common Stock”) on a Form 3 and to report changes in ownership on a Form 4 or a Form 5. Persons subject to Section 16(a) are required by SEC regulations to furnish us with copies of all Section 16(a) forms that they file related to transactions in our Common Stock. Under SEC rules, certain forms of indirect ownership and ownership of our Common Stock by certain family members are covered by these reporting requirements. As a matter of practice, our administrative staff assists our directors and executive officers in preparing initial ownership reports and reporting ownership changes and typically files these reports on their behalf.
Based on a review of the copies of such forms in our possession,
and on written representations from reporting persons, we believe that during fiscal 2013 all of our executive officers and directors filed the required reports on a timely basis under
Section 16(a).
CORPORATE GOVERNANCE
Code of Conduct
The Board has adopted a Code of Conduct (the “Code”) for the Company. The Board requires all directors, officers and employees to adhere to the Code in addressing the legal, regulatory and ethical issues encountered in conducting their work. This includes our principal executive officer and principal financial and accounting officers. A copy of the Code can be viewed on the corporate commitment section of our website at www.bmc.com and is available in print upon request to Corporate Secretary, BMC Software, Inc., 2101 CityWest Blvd., Houston, TX 77042. Among other matters, the Code is reasonably designed to promote:
| • | honest and ethical conduct, including the ethical handling of actual or apparent conflicts of interest; |
| • | full, fair, accurate, timely and understandable disclosure in reports and documents that we file with, or furnish to, the SEC and in other public communications made by us; |
| • | compliance with applicable governmental laws, rules and regulations; |
| • | the prompt internal reporting of violations of the Code to an appropriate person or persons identified in the Code; and |
| • | accountability for adherence to the Code. |
We maintain procedures for administering and reviewing potential issues under the Code, including procedures that allow employees to raise issues or report potential or actual violations anonymously. We also conduct periodic awareness training on various ethics and compliance-related topics.
Corporate Governance Principles and Board Matters
Corporate governance is typically defined as the system that allocates duties and authority among a company’s stockholders, board of directors and management. The stockholders elect the Board and vote on extraordinary matters. The Board is the Company’s governing body, responsible for hiring, overseeing and evaluating management, particularly the Chief Executive Officer, and management runs the Company’s day-to-day operations. The nominees for election include nine independent directors, as defined by the rules of the NASDAQ, and our President and Chief Executive Officer. The Board’s principal responsibility is to promote the best interests of our stockholders by providing guidance and oversight for the management of our business and affairs.
The Board has adopted Corporate Governance Guidelines (the “Guidelines”), and the Governance Committee is responsible for overseeing these Guidelines and making recommendations to the Board concerning corporate governance matters. The Guidelines can be viewed on our website at http://investors.bmc.com. Among other matters, the Guidelines include the following:
| • | Membership on our Board will be predominantly non-employee directors who, at a minimum, meet the criteria for independence required by the NASDAQ. |
| • | The Board has adopted additional independence criteria set forth in the Guidelines. |
| • | Each regularly scheduled Board meeting will include an executive session of the independent directors; the Lead Director presides during such executive sessions. |
| • | The Board conducts an annual evaluation of itself, its committees and each individual director. |
8
Table of Contents
| • | When the Chairman is not independent, the Board will appoint an independent director to serve as Lead Director. The Chairman and the Lead Director are reviewed annually as part of the Board’s evaluation process and are subject to removal or rotation at the discretion of the Board. |
| • | The Board expects our directors and officers to exhibit the highest standards of ethical behavior and to set an ethical tone for the Company. |
| • | To effectively discharge their oversight duties, the Board has direct access to management. |
| • | All members of the Board stand for election on an annual basis. |
The Guidelines contain a guideline that generally, a director will not be nominated to stand for election at an Annual Meeting if he or she would be age 70 or older at the time of the election; provided, that such director has had the opportunity to serve at least five years as a director.
Board Leadership Structure and Lead Director
Mr. Beauchamp serves as both our Chairman of the Board and our Chief Executive Officer. The Board has no policy mandating the combination or separation of the roles of Chairman and Chief Executive Officer and believes the matter of Board leadership structure should be discussed and considered from time to time. At this time, the Board believes that Mr. Beauchamp is the director best situated to serve as Chairman of the Board. He is the director most familiar with the Company's business and industry and most capable of effectively identifying strategic priorities and leading the Board's discussion of strategy and business operations. The Board believes that Mr. Beauchamp’s service in the combined role of Chairman and Chief Executive Officer promotes unified leadership and direction for the Board and the executive management team and allows for greater focus on executing the Company's strategic initiatives and business plans.
The Board is committed to ensuring strong independent oversight of management and leadership of the Board. Accordingly, our Corporate Governance Guidelines provide that when the Chairman is not independent, the Board will appoint an independent director to serve as Lead Director. Mr. Barfield has served as Lead Director since January 2010. The Board believes this role of Lead Director adequately addresses the need for leadership and organizational structure for the independent directors.
The Corporate Governance Guidelines provide that the Chairman shall consult with the Lead Director, committee chairs and other directors when preparing the agendas for Board meetings. The Chairman and the Lead Director share the following duties and responsibilities:
| • | monitoring the quality, quantity and timeliness of the flow of information between management and the Board; although management is responsible for the preparation of most materials for the Board, the Chairman or Lead Director may request specific or additional material; |
| • | interviewing, along with the members of the Governance Committee and other independent directors to the extent practical, all Board candidate finalists; and |
| • | consulting with the Governance Committee with respect to the membership of the various Board committees and the selection of the committee chairs. |
The Lead Director has the following duties and responsibilities:
| • | developing the agenda for, and moderating executive sessions of, the Board’s independent directors; |
| • | acting as principal liaison between the independent directors and the Chairman and/or Chief Executive Officer on matters discussed in executive sessions; |
| • | the option of calling meetings of the full Board or just the independent directors of the Board, in addition to the executive sessions held during regularly scheduled Board meetings; |
| • | presiding at any meeting of the Board or stockholders at which the Chairman is not present; |
| • | advising and consulting with the Chairman and the chair of each Board committee as to the appropriate information, agendas and schedules of Board and Board committee meetings (the Lead Director is encouraged to attend those Board committee meetings at which critical issues are to be decided); |
| • | approving, in consultation with other independent directors, the retention and compensation of consultants who report directly to the Board; |
| • | in conjunction with one of the Board committee chairs, reviewing with the Chief Executive Officer the Chief Executive Officer’s performance evaluation, including a review of the Chief Executive Officer’s performance as Chairman, conducted by the independent directors; and |
| • | with the assistance of the Governance Committee, reviewing each individual director’s performance annually, and discussing the details of each director’s review with him or her. |
9
Table of Contents
Board Oversight of Risk Management
The Board of Directors, as a whole and through the various committees of the Board, oversees the Company's risk management processes, including operational, financial, legal and regulatory, strategic and reputational risks. Enterprise risk management is an integral part of the Company’s risk management and strategic planning processes. The Audit Committee plays a leading role in assisting the Board in its oversight of risk management. In addition, the oversight responsibility of the Board and its committees is enabled by management reporting processes that are designed to provide visibility to the Board about the identification, assessment and management of critical risks and management’s risk mitigation strategies.
Board committees consider risks within their respective areas of oversight responsibility and the respective committee chairs advise the Board of any significant risks and management’s response via periodic committee reports to the full Board. In particular, the Audit Committee focuses on financial risk, including internal controls, and legal and regulatory compliance risks. The Compensation Committee considers risks relating to the Company's compensation programs and policies, and the Mergers and Acquisitions Committee reviews risks relating to potential acquisitions, investments and divestitures.
Board Meetings and Committee Composition
The Board and its committees meet throughout the year on a set schedule and also hold special meetings and act by written consent from time to time as appropriate. Our quarterly in-person Board meeting agendas include executive sessions for the non-employee directors (all of whom are independent directors) to meet without management present. The Lead Director, who is an independent director, presides over these executive sessions. In fiscal 2013, the Board met in person four times and held 31 telephonic Board meetings. The independent directors met in executive session at the conclusion of each of the in-person meetings. Each Board member attended at least 75% of the total number of meetings of the Board and the committees on which he or she serves. Each director is encouraged to be present at Annual Meetings of stockholders. At the 2012 Annual Meeting, all of the directors were in attendance.
The Board currently has, and appoints the members of, standing Audit, Compensation, Corporate Governance & Nominating and Mergers and Acquisitions Committees. Each committee has a written charter approved by the Board. These charters are available on our website at http://investors.bmc.com. We will also furnish copies of any charter upon request. Requests for copies should be directed to Corporate Secretary, BMC Software, Inc., 2101 CityWest Blvd., Houston, Texas 77042. Each of the committee charters requires that its membership be comprised solely of independent directors.
The current members of the committees are identified in the following table.
| Director |
Audit | Compensation | Corporate Governance & Nominating |
Mergers and Acquisitions | ||||
| Jon E. Barfield |
X | X | ||||||
| Gary L. Bloom |
X | X | ||||||
| John M. Dillon |
X | |||||||
| Meldon K. Gafner |
X | X | ||||||
| Mark J. Hawkins |
X | X | ||||||
| Stephan A. James |
Chair | X | ||||||
| P. Thomas Jenkins |
X | Chair | ||||||
| Louis J. Lavigne, Jr |
Chair | X | ||||||
| Kathleen A. O’Neil |
X | Chair | ||||||
| Alex Pinchev |
X | X | ||||||
| Carl James Schaper |
X | |||||||
| Tom C. Tinsley |
X | X |
As a non-independent director, Mr. Beauchamp does not serve on any of the Board committees.
10
Table of Contents
Audit Committee. The Audit Committee has been established to assist the Board in fulfilling its responsibility to oversee (i) the integrity of our financial statements, financial reporting process and systems of internal controls regarding finance and accounting, (ii) our legal and regulatory compliance, (iii) the quality and integrity of our risk management processes, (iv) the qualifications, engagement, compensation and independence of the independent registered public accounting firm, their conduct of the annual audit of our financial statements and their engagement to provide any other services, (v) the performance of our internal audit function and independent registered public accounting firm and (vi) our capital structure and financing activities. The Audit Committee has the sole authority to retain, compensate, direct, oversee and terminate our independent registered public accounting firm. The Audit Committee operates pursuant to a charter, which can be viewed on our website at http://investors.bmc.com. The Board has determined that each of the members of the Audit Committee qualifies as an “audit committee financial expert” as defined by the regulations of the SEC, and each of the members meets the independence criteria for audit committee members as defined by the NASDAQ and the SEC. No member of the Audit Committee serves on more than three public company audit committees. In fiscal 2013, the Audit Committee held eight meetings. The report of the Audit Committee begins on page 46.
Compensation Committee. The Compensation Committee’s primary function is to support the Board in fulfilling its oversight responsibilities relating to senior management performance, compensation and succession. In this regard, the Board and Compensation Committee align total compensation for the Chief Executive Officer and other senior executives with the long-term interests of stockholders. The Compensation Committee’s duties include: making recommendations to the Board with respect to all compensation plans covering executive officers, administering our equity plans, reviewing our employee benefits and reviewing our Compensation Discussion and Analysis disclosure. The Compensation Committee operates pursuant to a charter, which can be viewed on our website at http://investors.bmc.com. In fiscal 2013, the Compensation Committee held six meetings. The “Compensation Discussion and Analysis” section, which begins on page 13, contains information on the roles of the Compensation Committee, the Board, executive officers and outside consultants in determining or recommending executive compensation.
Corporate Governance & Nominating Committee. The Governance Committee assists the Board in fulfilling its responsibility to our stockholders, potential stockholders and investment community by (i) identifying individuals qualified to become directors and selecting, or recommending that the Board select, the candidates for all directorships to be filled by the Board or by the stockholders, (ii) developing and recommending to the Board a set of corporate governance principles applicable to the Company and (iii) otherwise providing leadership on corporate governance issues to ensure that the corporate governance system of the Company performs well. The duties of the Governance Committee include annually reviewing and reassessing the adequacy of our Corporate Governance Guidelines, managing the Board’s annual evaluation process, monitoring director independence and overseeing outside director compensation. In addition, the Governance Committee assesses the appropriate balance of skills, characteristics and perspectives required for an effective Board; identifies, screens and recommends qualified director candidates; and periodically reassesses the adequacy of the Board’s size. Although the Governance Committee does not have a formal policy with respect to diversity, it seeks to have a Board of Directors that represents a diversity of backgrounds, skills and experience. The Governance Committee assesses its achievement of diversity through the review of Board composition as part of the Board's annual self-assessment process. The Governance Committee operates pursuant to a charter, which can be viewed on our website at http://investors.bmc.com. The Governance Committee identifies director candidates through a variety of means, including recommendations from other Board members and management. From time to time, the Governance Committee utilizes third-party search consultants to identify director candidates. The Governance Committee will consider all stockholder recommendations for candidates for the Board; any such recommendations should be sent to the Governance Committee, c/o Corporate Secretary, BMC Software, Inc., 2101 CityWest Blvd., Houston, TX 77042, and should include the recommended candidate’s name, biographical data and qualifications. The Governance Committee’s minimum qualifications and specific qualities, knowledge and skills required for directors are set forth in Section 12 of our Corporate Governance Guidelines, which can be viewed on our website at http://investors.bmc.com. The Governance Committee evaluates all potential candidates in the same manner regardless of the source of the recommendation. The Governance Committee’s review is typically based on any written materials provided with respect to the potential candidate. The Governance Committee determines whether the candidate meets our minimum qualifications and specific qualities, knowledge and skills for directors and whether requesting additional information or an interview is appropriate. In fiscal 2013, the Governance Committee held ten meetings.
Mergers and Acquisitions Committee. The Mergers and Acquisitions Committee (the “M&A Committee”) is appointed by the Board to review and assess, and assist management and the Board in reviewing and assessing, potential acquisitions, strategic investments and divestitures. The duties of the M&A Committee include providing guidance to management and the Board with respect to our acquisition, investment and divestiture strategies; assisting management and the Board with identifying acquisition, investment and divestiture opportunities; and overseeing management’s and the Board’s due diligence process with respect to proposed acquisitions, investments and divestitures. The M&A Committee operates pursuant to a charter, which can be viewed on our website at http://investors.bmc.com. In fiscal 2013, the M&A Committee held five meetings.
11
Table of Contents
Communications from Stockholders to the Board
The Board is receptive to direct communication with stockholders and recommends that stockholders and other interested parties initiate any communications with the Board in writing and send them in care of the Corporate Secretary. Stockholders can send communications by email to directors@bmc.com, by fax to (713) 918-1110 or by mail to Corporate Secretary, BMC Software, Inc., 2101 CityWest Blvd., Houston, Texas 77042. This centralized process will assist the Board in reviewing and responding to stockholder communications in an appropriate manner. The name of any specifically intended Board recipient should be noted in the communication. Communications to the Board must include the number of shares owned by the stockholder as well as the stockholder’s name, address, telephone number and email address, if any. The Board has instructed the Corporate Secretary, prior to forwarding any correspondence, to review such correspondence and, pursuant to Board policy, not to forward certain items if they are deemed of a commercial or frivolous nature or otherwise inappropriate for the Board’s consideration. In such cases, some of that correspondence may be forwarded elsewhere within the Company for review and possible response. A more detailed disclosure regarding our Board communication process is available on our website at http://investors.bmc.com.
12
Table of Contents
| ITEM 11. | Executive Compensation |
COMPENSATION DISCUSSION AND ANALYSIS
This Compensation Discussion and Analysis (“CD&A”) describes the principles of our executive compensation program, how we applied those principles in compensating our most senior officers for fiscal 2013 and how we use our compensation program to drive and reward excellent performance.
Named Executive Officers
This CD&A explains how our compensation programs are designed and operate in practice with respect to our executives and specifically the following Named Executive Officers (“NEOs”):
| • | Robert E. Beauchamp, President and Chief Executive Officer; |
| • | Stephen B. Solcher, Senior Vice President, Chief Financial Officer; |
| • | Paul Avenant, Senior Vice President of Solutions; |
| • | Kia Behnia, Senior Vice President, Chief Technology Officer; and |
| • | William D. Miller, Chief Operating Officer. |
Executive Summary
Our key executive compensation decisions for fiscal 2013 included the following:
| • | Continuing the use of performance-based equity grants based on our Total Shareholder Return (“TSR”) relative to that of the NASDAQ-100 Index (“QQQ”) as a component of our Named Executive Officers’ compensation to maintain the pay for performance relationship of our executive compensation program; |
| • | Updating the peer group of companies which we utilize to make competitive executive compensation comparisons; improving the match to, and focusing more on companies in our sector with similar size; |
| • | Utilizing measures (bookings, operating margin and TSR) within our incentive programs to closely link stockholder interests and operational success to executive compensation; |
| • | Maintaining a position of competitive base salaries and minimal perquisites; |
| • | Being judicious in the use of equity awards, aligned with institutional investor advisory group burn rate policies; and |
| • | Not providing tax gross-ups on any portion of our executives’ current or potential compensation, with the exception of certain taxable relocation expenses. |
We believe that our actions in fiscal 2013 show that we have closely linked pay to performance.
Below are some of the key business successes we achieved in fiscal 2013:
| • | Our total revenue increased 1.4% to $2.2 billion year-over-year; |
| • | Our SaaS business increased its customer base by over 80 percent year-over-year and now has more than 600 active SaaS customers; and |
| • | Cloud-related license bookings totaled more than $100 million, increasing 35 percent year-over-year. |
Despite these operating results, our overall financial performance was below several of our internal targets. Reflecting the significant emphasis our compensation program places on performance-based rewards, these factors negatively impacted the compensation of our NEOs, as intended by the design of the compensation programs.
Pay for Performance Link
For fiscal 2013 our incentive plans paid out below target as detailed below.
Cash-based Short-term Incentive Plan (“STIP”): Our CEO earned only 54.1% of his target short-term incentive pay, based on Company attainment against pre-established bookings and non-GAAP operating margin targets, while all NEOs earned an average of 56.7% of their target short-term incentive pay based on Company attainment against pre-established bookings and non-GAAP operating margin targets. For further discussion of the short-term incentive payouts, see “Compensation Elements - Short-term Incentives.”
13
Table of Contents
Cash-based Long-Term Incentive Plan (“LTIP”): In April 2010, we granted three-year cash-based long-term incentive plan awards to three of our current NEOs: Messrs. Beauchamp, Solcher and Miller. The awards would have vested, if at all, based on achievement of certain TSR levels relative to the NASDAQ-100 Index from fiscal 2011 through fiscal 2013. From the fiscal 2011 LTIP award made in April 2010, our CEO received no payout from his $1.9 million target. Mr. Solcher and Mr. Miller also received no payout from their April 2010 LTIP awards. We suspended granting long-term cash incentives since April 2010, and there are no more outstanding LTIP cash awards. Since such time, we have granted all of our long-term incentives to our executive officers in the form of equity, with 50% or more of the aggregate value of these grants for our NEOs being in the form of performance-based RSUs during fiscal 2013. For further discussion of the cash-based long-term incentive payouts, see “Compensation Elements – Long-term Incentives.”
Equity-based Long-Term Incentives: Of the target number of performance-based RSUs granted in December 2010, our CEO vested in only 30% of the target number of shares (7,254 of the 24,181 target shares) due to our TSR performance compared to the NASDAQ-100 Index. Mr. Miller and Mr. Solcher also only vested in 30% of their target number of shares. For further discussion of the equity-based long-term incentive payouts, see “Compensation Elements - Long-term Incentives.”
Executive Compensation Principles
The Compensation Committee has defined high level executive compensation principles that help shape the structure and levels of pay for our executive officers, including each NEO (see “Compensation Elements”). These principles, which are discussed in more detail below, are to:
| • | Align executive compensation with stockholder interests; |
| • | Connect cash incentives to appropriate short-term measures; |
| • | Attract and retain top talent through equity-based incentive compensation, with a balance of time-based and performance-based vesting; and |
| • | Motivate a balance of short-term performance with long-term organizational health. |
Align executive compensation with stockholder interests
The role our executive officers play in the execution of our business strategy is critical to delivering stockholder return. To be successful, all employees need to understand and deliver results. Our incentive compensation programs are intended to provide for payment on attainment of pre-determined goals that are aligned with stockholder interests and linked to business strategy, key financial measures and stockholder returns. Our compensation programs reward success against those goals for key employees, including our NEOs. We also award equity grants to key employees, including the NEOs, in order to further align their compensation with stockholder interests over the long term.
Connect cash incentives to appropriate short-term measures
Our success partly depends upon our executive officers being focused on the critical strategic and tactical objectives that lead to Company success in the short term. Therefore, performance goals under our short-term incentive compensation programs have been designed to align executive compensation with our business objectives. The design of these compensation programs, the selected performance measures, the targets and the timing of awards and payouts are all geared to drive business performance and stockholder return. During fiscal 2013, performance measures included a combination of bookings and non-GAAP operating margin targets at both corporate and business unit levels to ensure a balanced focus. For fiscal 2014, we continue to utilize a combination of these measures at the total company level.
Attract and retain top talent through equity-based incentive compensation
Our success depends on attracting and retaining top performing individuals. This is especially true for our executive officers, including the NEOs. We believe in using equity grants with a combination of time-based vesting and performance-based vesting as a key tool to motivate long-term performance and to retain a stable, high performing team of executive officers. We have used equity-based compensation to reward executive officers as well as other key employees for their contributions and to motivate their continued commitment to the future. During fiscal 2013, we continued our practice of granting approximately 50% of our executive officers’ equity grant values in performance-based grants (see “Compensation Elements”). As these performance-based grants mature, with 2- and 3-year vesting/TSR attainment measurement periods, they will represent a larger portion of our executive officers’ “realizable pay,” subject to reduction or increase depending on our TSR performance in comparison to the NASDAQ-100 Index.
14
Table of Contents
Motivate a balance of short-term performance with long-term organizational health
The following table illustrates how performance-based compensation elements, each of which is described in greater detail in the next section, link executive compensation for our executive officers, including the NEOs, to Company performance and stockholder return over both short-term and long-term time horizons. It also describes how performance ranges affect payout ranges.
15
Table of Contents
| Program |
Performance Measures |
Timing |
Performance Connection to Pay | |||||
| Short-Term |
Short-Term Incentive Plan (“STIP”) | For Corporate Executives: Corporate Total Bookings and Operating Margin (3)
For BU Executives: Corporate Total Bookings, BU Total Bookings, and BU Operating Margin (3) |
Quarterly measurement periods, paid semi-annually | – 100% payout for achievement of performance targets
– 200% is the maximum payout level for extraordinary achievement
– For each metric, 85% of target is the threshold (the minimum performance level below which no payment is made)
– Measures are directly aligned to the Board-approved operating plan
| ||||
| Discretionary Cash Awards (1) | Individual performance goals | Ad hoc during the fiscal year | – Awards provide a direct link to short-term delivery of business objectives
| |||||
| Long-Term |
Long-Term Cash Incentive Plan (“LTIP”) (4) |
Relative TSR measured against the QQQ | Three-year measurement period | – Payout maximum is capped at 150%
– Threshold performance must be achieved (no worse than 24 points below QQQ TSR) to earn payout
| ||||
| Performance-Based RSUs | Relative TSR measured against the QQQ | Two-and three-year performance targets/measurement periods | – Performance-based RSUs are subject to forfeiture if minimum performance thresholds are not achieved or employment ceases (2)
– Performance-based RSUs will vest to the extent the Board-established TSR goals are achieved |
| (1) | The CEO was not eligible for discretionary cash awards under this program, and no discretionary cash awards were paid to any executive officers during fiscal 2013. |
| (2) | The November 2012 performance-based RSU agreement included a new “rollover” feature that would allow for shares that did not vest in the first tranche at the two-year measurement point to be subject to the performance attainment of the second tranche at the three-year measurement point. Any shares that do not vest at the third-year measurement point will be forfeited. |
| (3) | Bookings represent an internal measure of the committed contract value of license, maintenance and software-as-a-service orders plus delivered professional services revenue. Operating margin represents an internal measure of operating margin, consisting of revenue less internally-calculated operating expenses. Corporate operating margin represents an internal measure of consolidated operating margin, consisting of consolidated revenue less internally-calculated operating expenses. Business unit operating margin represents an internal measure of operating margin for our ESM and MSM business units, consisting of business unit revenue less internally-calculated direct and allocated indirect operating expenses. |
| (4) | No further grants have been made under this program since fiscal 2011. Based on the Company’s TSR relative to the NASDAQ-100 Index at the end of fiscal 2013, the three-year cash-based LTIP awards granted in fiscal 2011 to Messrs. Beauchamp, Solcher and Miller did not vest and were forfeited. |
Determining Executive Compensation (Roles and Process)
Utilizing the principles described above, the independent members of the Board, upon the recommendation of the Compensation Committee, determine the parameters of the executive compensation program, including appropriate target levels and performance measures. The Compensation Committee then administers the specific executive compensation programs for our executive officers, including with respect to matters where approval by our independent Compensation Committee members is appropriate for tax or regulatory reasons. This section discusses, in greater detail, the roles and process underlying the application of our executive compensation principles.
16
Table of Contents
Role of Management
Our CEO attends portions of Compensation Committee meetings from time to time, but does not participate in discussions regarding his own compensation. The Compensation Committee solicits his input from time to time on compensation philosophy, retention, motivation and goal-setting. The CEO provides input to the Compensation Committee for each of his direct reports based on:
| • | Comparison of our pay levels to that of our peer companies described below in the “Market and Peer Company Comparisons” section; |
| • | Assessment of capability and job complexity; and |
| • | An overall assessment of individual performance and contribution. |
The CEO’s input is intended to assist the Compensation Committee’s efforts to balance rewarding performance that delivers to the overall strategy of the business while creating a package that retains key executives over time. Our CEO is also responsible for approving underlying programs that seek to align and deliver performance-related pay for all employees below the executive officer level.
The Chief Financial Officer participates with the CEO and Board in establishing BMC’s operating plan. This operating plan and its key measures form an important foundation for the connection between performance and compensation.
Role of External Advisors
The Compensation Committee works with an external compensation consultant to assist the Compensation Committee in its duties, including providing advice regarding market trends relating to the form and amount of compensation. In fiscal 2013, the Compensation Committee engaged Compensia, Inc. (“Compensia”) as its compensation consultant to provide research, review and advice pertaining to executive compensation. Compensia also provides similar consulting services to our Governance Committee regarding non-employee director compensation. Compensia reports directly to the Compensation Committee (and the Governance Committee with respect to non-employee director compensation) and not to management, is independent from BMC Software and has not provided any other services to BMC Software.
After a thorough review, the Compensation Committee determined that Compensia’s service to the Committee does not raise any conflicts of interest.
Role of the Compensation Committee
The Compensation Committee’s primary function is to support the Board in fulfilling its oversight responsibilities relating to senior management performance, compensation and succession. The Compensation Committee operates pursuant to a charter, which can be viewed on our website at http://investors.bmc.com.
Specifically, the Compensation Committee approves, and recommends to the independent members of the Board for approval, the following for our executive officers, including the NEOs:
| • | The annual base salary levels; |
| • | The short-term incentive opportunity levels and the connection to performance measures; |
| • | The long-term incentive opportunity levels and the connection to performance measures; |
| • | Employment agreements, severance arrangements and change in control agreements/provisions; |
| • | Any special or supplemental benefits or perquisites; and |
| • | Levels, vesting terms and appropriate forms of equity-based compensation. |
The Compensation Committee obtains input from our CEO and management and consults with its compensation consultant as described above to ensure the appropriate information is provided for proper decision-making.
Market and Peer Company Comparisons
In determining the compensation elements and amounts for the executive officers, including the NEOs, the Compensation Committee and our CEO review the compensation practices and levels at certain peer companies. Generally, this peer group analysis is used to ensure that our compensation programs and individual compensation levels are competitive in order to attract and retain high performing talent.
17
Table of Contents
To ensure that our compensation practices and levels remain competitive, the Compensation Committee reconstituted the peer company list for fiscal 2013 to include the following software and technology companies with levels of revenue similar to ours:
| Fiscal 2013 Peer Companies | ||
| Activision Blizzard, Inc. |
Juniper Networks, Inc. | |
| Adobe Systems Incorporated |
NetApp, Inc. | |
| Akamai Technologies, Inc. |
Nuance Communications, Inc. | |
| Autodesk, Inc. |
Parametric Technology Corporation | |
| Brocade Communications Systems, Inc. |
Red Hat, Inc. | |
| CA, Inc. |
Salesforce.com, Inc. | |
| Citrix Systems, Inc. |
Symantec Corporation | |
| Compuware Corporation |
Synopsys, Inc. | |
| Electronic Arts Inc. |
Teradata Corporation | |
| Informatica Corporation |
VMware, Inc. | |
| Intuit Inc. |
||
The above companies fall within a range of approximately one-half to three times our annual revenue. The list reflects the addition of four similarly sized software companies and the removal of one company from our peer company list utilized in fiscal 2012. Based on the nature and scope of their respective businesses, Informatica Corporation, Nuance Communications, Inc., Parametric Technology Corporation, and Red Hat, Inc., were added for fiscal 2013. VeriSign, Inc. was removed from the list due to its revenue size and low employee population in comparison to BMC and the rest of the peer group.
With assistance from management and the Compensation Committee’s external compensation consultant, the Compensation Committee and our CEO review compensation data from the peer company proxy statements and independent survey sources. This exercise is intended to ensure the competitiveness of each compensation component, as well as the total compensation package.
The Compensation Committee does not target pay at a specific target percentile. Rather, when setting each compensation component and total compensation opportunities, the Compensation Committee considers the following factors in addition to competitive market data:
| • | The Company’s overall performance relative to peers and objectives established by the Board; |
| • | Each individual’s skills, job scope, experience and qualifications relative to other similarly-situated executives at peer companies; |
| • | BMC’s internal value for a position relative to other positions or market practices; |
| • | A subjective assessment of each individual’s contributions to the Company’s overall performance, ability to lead his or her business unit or function, work as part of a team and reflect the Company’s core values; and |
| • | BMC’s ability to retain “critical talent.” |
These factors provide the framework for our Compensation Committee’s decision-making. No single factor above is determinative in setting pay levels, nor is the impact of any one factor on the determination of pay levels quantifiable.
We supplemented the compensation data from public disclosures for the peer companies listed above with analysis of data from a survey of executive compensation practices at technology companies conducted by Radford, a subsidiary of Aon Hewitt, neither of which provides advice to the Compensation Committee.
18
Table of Contents
To ensure that our compensation practices and levels remain competitive and appropriate, the Compensation Committee has updated the peer company list for fiscal 2014 to include the following software and technology companies of similar revenue size to us:
| Fiscal 2014 Peer Companies | ||
| Activision Blizzard, Inc. |
Intuit Inc. | |
| Adobe Systems Incorporated |
Juniper Networks, Inc. | |
| Akamai Technologies, Inc. |
Nuance Communications, Inc. | |
| Autodesk, Inc. |
Parametric Technology Corporation | |
| Brocade Communications Systems, Inc. |
Red Hat, Inc. | |
| CA, Inc. |
Salesforce.com, Inc. | |
| Citrix Systems, Inc. |
Synopsys, Inc. | |
| Compuware Corporation |
Teradata Corporation | |
| Electronic Arts Inc. |
VMware, Inc. | |
| Informatica Corporation |
||
The above companies generally fall within a range of approximately one-half to two times our annual revenue. Changes for fiscal 2014, in comparison to our peer companies utilized in fiscal 2013, are the removal of NetApp, Inc. and Symantec Corporation due to their larger revenue scope. The Compensation Committee will continue to use broader technology industry survey data from similarly-sized companies in its assessment of the competitive market as sufficient data is not always available from the peer company list.
Process for Implementing the Philosophy
Beginning in the fourth quarter of our fiscal year and proceeding into the first quarter of the subsequent fiscal year, the Compensation Committee reviews, approves and recommends to the independent members of the Board:
| • | The total pay package for the CEO, including base salary, short-term incentive targets and long-term incentives; |
| • | Changes in any compensation programs for our executive officers, including the NEOs; and |
| • | The performance targets and relationship to payouts of short-term and long-term incentives. |
Following the end of the fiscal year and at predetermined performance periods, the Compensation Committee certifies performance in its administrative capacity under each of the incentive plans and approves the corresponding payouts. It will also review, approve and recommend to the Board any adjustments to performance measures that result from extraordinary business situations such as material acquisitions.
Equity Granting Policies
Each of our equity award plans is administered by the Compensation Committee. Absent an express delegation to another person or group, the Compensation Committee is the body which approves the granting of awards under our equity award plans. Prior to the Compensation Committee granting equity awards to executive officers, the independent members of the Board authorize equity award levels for our executive officers. Except in the case of newly hired executives, we generally do not grant equity awards to executive officers during a black-out period under our Securities Trading Policy. Our equity award plans require that stock options be granted with an exercise price no less than the fair market value of the Common Stock on the date of grant.
19
Table of Contents
Compensation Elements
The following table describes each executive compensation element utilized in fiscal 2013 for our NEOs based on the philosophy and process described above as well as each element’s link to our compensation philosophy.
| Compensation |
Philosophy Statement |
Retain | Reward Short-Term Performance |
Reward Long-Term Performance |
Align to Stockholder Interests | |||||
| Base Salary | We intend to provide base salaries competitive to the market of industry peers and across other industries where appropriate. Base salary maintains a standard of living, is used to compete in the market for talent and forms the foundation for our other reward vehicles. | X | ||||||||
| Short-Term Incentive Plan (“STIP”) |
The STIP rewards specific quarterly performance against business measures set by the Board. Paid semi-annually, the amount of the reward is determined by formula and can vary from 0% to 200% of an individual executive’s target incentive. To achieve top payout, our performance must significantly outperform targets set above external expectations. The minimum performance level to achieve payout is 85% of target for each metric. | X | X | |||||||
| Total Target Cash (Base + STIP) |
We design total target cash elements to ensure a proper balance of cash payouts annually. The mix of base salary and STIP is determined for each executive to encourage the right motivation in the short term. | X | X | X | ||||||
| Long-Term Cash Incentive Plan (“LTIP”) |
The LTIP is a long-term cash incentive award that rewards TSR relative to industry peers, typically over a three-year period. For LTIP awards granted in fiscal 2011, our TSR must be no worse than 24 points below that of the QQQ. To receive 100% payout, our TSR must equal that of the QQQ. Maximum payout of 150% requires that our TSR be 24 points or better than that of the QQQ. No new LTIP cash awards have been granted since fiscal 2011. The three-year cash-based LTIP awards granted in fiscal 2011 did not vest and were forfeited. | X | X | X | ||||||
| Performance- Based RSUs |
Performance-based RSUs have been awarded to Named Executive Officers in fiscal 2011, 2012 and 2013. The RSUs vest in full only if we achieve the pre-established performance targets, assuming continued employment. Partial or enhanced vesting, to a maximum of 150% of the number of target shares, is possible, based on the TSR performance of the Company in comparison to the QQQ. Our TSR must be no worse than 49 points below that of the QQQ to receive any vesting. To receive 100% of the target number of shares, our TSR must equal that of the QQQ. Maximum vesting (150% of the target number of shares) requires that our TSR be 25 points or better than that of the QQQ. Performance is measured and vesting of earned shares occurs at the rate of 50% after two years and 50% after three years. For the November 2012 awards, a “rollover” feature was added that would allow for shares that did not vest in the first tranche at the two-year measurement point, to be subject to the performance attainment of the second tranche at the three-year measurement point. Any shares that do not vest at the third-year measurement point will be forfeited. | X | X | X | ||||||
| Time-Based RSUs |
Time-based RSUs directly focus on retention while providing an opportunity for increased rewards as stockholder return increases. Typically, these awards vest one-third per year over three years, assuming continued employment. | X | X | X | ||||||
| Benefits | We offer our Named Executive Officers benefits programs that provide protections for health, welfare and retirement, generally consistent with that offered to other employees. A deferred compensation program is also provided for tax advantaged savings beyond the limits of qualified plans under Section 401(k) of the Internal Revenue Code (“IRC”). | X |
20
Table of Contents
The following charts illustrate the percentages of total target compensation of our CEO and the average for our other NEOs, respectively, for each compensation element. These percentages represent the target levels for each element approved for fiscal 2011, 2012 and 2013. Equity awards represent the grant-date fair market value. For fiscal 2013, we continued to grant performance-based RSUs, based on our TSR in comparison to the NASDAQ-100 Index, as a portion of the equity grants to our CEO and our NEOs. We believe our mix of short-term and long-term cash incentive plans provides compensation elements for our executive officers to focus on delivery of performance against business goals and relative performance against peer and similar companies.
Fiscal 2011
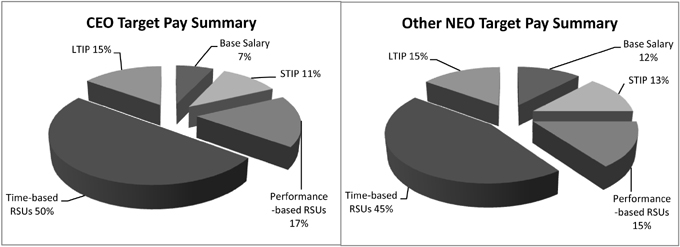
Fiscal 2012
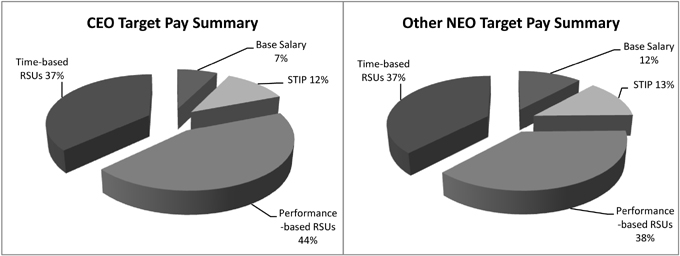
21
Table of Contents
Fiscal 2013
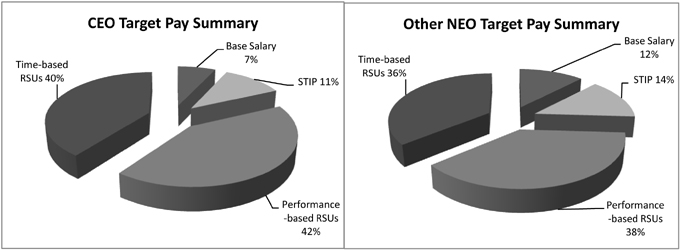
Base Salary
Base salary for our executive officers, including the NEOs, represents the basis for competing in the market for similar positions of industry peers and across industries where appropriate. We generally adjust salaries for executive officers when the peer group data shows a significant deviation versus the market, to recognize outstanding individual performance or to recognize a significant revision to an individual’s responsibilities.
During fiscal 2013, Mr. Beauchamp’s annual base salary remained at $980,000 and Mr. Solcher’s remained at $550,000; Mr. Miller’s annual base salary was increased from $490,000 to $539,000; Mr. Behnia’s annual base salary was increased from $430,000 to $473,000; and Mr. Avenant’s annual base salary was increased from $455,000 to $500,500. These increases were intended to maintain our competitive compensation market position, relative to our peer group of companies described above, consistent with our philosophy, as well as recognize individual performance. Mr. Avenant was not a NEO prior to fiscal 2013.
For fiscal 2014, effective May 1, 2013, Mr. Behnia’s salary was increased to $500,000 and Mr. Miller’s to $570,000, in consideration of market data as well as an increase in Mr. Miller’s responsibilities.
Short-term Incentives
During fiscal 2013, our short-term incentive plan provided for two categories of measures within which specific performance targets were established, as set forth in the following two tables:
| Category |
Measure |
Weight | Why | |||||
| Corporate Executives (1) |
Corporate Bookings (3) (measured quarterly) |
60 | % | Provides focus on driving sales from both business units, representing current consolidated business health | ||||
| Corporate Operating Margin (4) (measured quarterly) |
40 | % | Provides a clear connection to consolidated earnings, expense control and business efficiency | |||||
| Business Unit Executives (2) |
Corporate Bookings (3) (measured quarterly) |
20 | % | Provides focus on driving sales from both business units representing current consolidated business health | ||||
| Business Unit Bookings (3) (measured quarterly) |
40 | % | Provides focus on driving business unit sales representing current business unit health | |||||
| Business Unit Operating Margin (4) (measured quarterly) |
40 | % | Provides a clear connection to business unit earnings, expense control and business efficiency | |||||
22
Table of Contents
| (1) | Corporate executives are those officers whose short-term incentive pay is tied to overall corporate results, rather than to a specific business unit. Messrs. Beauchamp, Solcher and Behnia participated in the STIP for fiscal 2013 as Corporate executives. |
| (2) | Mr. Miller participated in the STIP for fiscal 2013 as a Business Unit executive for the MSM business unit, and Mr. Avenant participated as a Business Unit executive for the ESM business unit. |
| (3) | Bookings represent an internal measure of the committed contract value of license, maintenance and software-as-a-service orders plus delivered professional services revenue. |
| (4) | Operating margin represents an internal measure of operating margin, consisting of revenue less internally-calculated operating expenses. Corporate operating margin represents an internal measure of consolidated operating margin, consisting of consolidated revenue less internally-calculated operating expenses. Business unit operating margin represents an internal measure of operating margin for our ESM and MSM business units, consisting of business unit revenue less internally-calculated direct and allocated indirect operating expenses. |
The specific fiscal 2013 performance targets and actual and calculated percentage payouts for the NEOs are set forth in the following table:
| Bookings (in millions) | Operating Margin (in millions) | |||||||||||||||||||||||
| BU Measures |
Plan | Actual | Calculated Payout % (1) |
Plan | Actual | Calculated Payout % (1) |
||||||||||||||||||
| ESM |
$ | 1,539 | $
|
1,406 91% of plan |
|
60 | % | $ | 324 | $
|
224 69% of plan |
|
0 | % | ||||||||||
| MSM |
$ | 870 | $
|
831 96% of plan |
|
82 | % | $ | 507 | $
|
497 98% of plan |
|
91 | % | ||||||||||
| Corporate (ESM + MSM) |
$ | 2,409 | $
|
2,237 93% of plan |
|
71 | % | $ | 831 | $
|
721 87% of plan |
|
30 | % | ||||||||||
Note: Actual calculations for our Business Unit target attainments are completed on a quarterly basis. Because of variations in our financial plan from quarter to quarter, the quarterly targets and resulting attainments are not equally weighted quarter-to-quarter. Totals may not foot due to rounding.
| (1) | The Compensation Committee reserves the right to exercise discretion to modify a payout for any individual based on the Compensation Committee’s view of such individual’s performance and/or our performance during a performance period. |
The following chart sets forth, for each Named Executive Officer, the fiscal 2013 STIP measures and weighting applicable to such NEO, the target incentive amount, the calculated payout as a percentage of target, the actual adjusted payout as a percentage of target and the actual adjusted payout amounts.
| Name |
STIP Target as % of Base Salary |
Target Incentive Amount |
Actual $ Payout |
Payout as % of Target |
STIP Measures & Weightings | |||||||||||||
| Robert E. Beauchamp |
160 | % | $ | 1,568,000 | $ | 848,288 | 54 | % | 60% Corporate Bookings; 40% Corporate Operating Margin | |||||||||
| Stephen B. Solcher |
100 | % | $ | 550,000 | $ | 297,550 | 54 | % | 60% Corporate Bookings; 40% Corporate Operating Margin | |||||||||
| Paul Avenant |
120 | % | $ | 600,600 | $ | 228,829 | 38 | % | 20% Corporate Bookings; 40% ESM Bookings; 40% ESM Operating Margin | |||||||||
| Kia Behnia |
110 | % | $ | 520,300 | $ | 281,482 | 54 | % | 60% Corporate Bookings; 40% Corporate Operating Margin | |||||||||
| William D. Miller |
120 | % | $ | 646,800 | $ | 538,785 | 83 | % | 20% Corporate Bookings; 40% MSM Bookings; 40% MSM Operating Margin | |||||||||
23
Table of Contents
For fiscal 2014, the target annual incentives, as a percentage of base salary, for all NEOs remained unchanged from that of fiscal 2013, with the exception of Mr. Miller whose target changed to 125% of base salary. For fiscal 2014, for all NEOs, 60% of their annual incentive will be based on whether and the extent to which we achieve quarterly total bookings targets and 40% will be based on whether and the extent to which we achieve quarterly internally-calculated operating margin targets. The actual bonus payments under such awards may be less than or greater than the target amounts depending on whether and the extent to which the goals upon which such bonuses are based are achieved.
Discretionary cash awards
To drive and reward specific short-term initiatives, the Board had authorized the CEO to use a discretionary cash pool each year with the concurrence of the Chairman of the Compensation Committee. For fiscal 2013, an aggregate discretionary pool of $600,000 was authorized and could have been used for executive officers (with the exception of the CEO) as well as other employees. However, no awards were made to NEOs from this pool in fiscal 2013. Since January 2013, executive officers are no longer eligible for awards from this pool.
Long-term Incentives
During fiscal 2013, the elements of our compensation program that are designed to incent performance over a longer time period consisted of:
| • | Equity awards in the form of time-based and performance-based RSUs and |
| • | The LTIP, a cash-based, long-term incentive program which has been suspended since fiscal 2011. The final awards, covering a fiscal 2011-fiscal 2013 performance period, did not vest at the end of fiscal 2013. |
In fiscal 2013, our Compensation Committee granted RSUs to our NEOs as set forth in the “Fiscal 2013 Summary Compensation Table” and the “Grants of Plan-Based Awards in Fiscal 2013” table. In determining the dollar value of RSUs to grant to each of our NEOs, the Compensation Committee used the following factors: performance and potential of the executive, the intended value of total direct compensation (the sum of base, bonus and long-term vehicles at target) and retention in the form of unvested equity value. The Compensation Committee does not determine the awards using a mathematical formula but takes all factors into account, none of which is dispositive.
The use of long-term incentives aligns executives’ personal financial interests with stockholder interests and assists in retention of our executive team. In fiscal 2013, we continued our mix of long-term equity vehicles to include performance-based RSUs, consistent with the intent to increase the use of performance-based equity. Equity awards granted in fiscal 2013 require the executives to earn the rewards through a combination of Company performance (in the case of performance-based RSUs, our TSR as measured versus that of the NASDAQ-100 Index) and continued employment. All equity compensation vehicles represent an “ownership” linkage to long-term stockholder interests. Equity awards and LTIP payouts increase in value through Company stock price performance relative to the NASDAQ-100 Index, thus aligning these tools directly with stockholder value. From one year to the next, the Compensation Committee weighs the need to focus on performance versus retention.
The following table sets forth the performance requirements for each of the performance-based equity awards that have been granted and are still outstanding or were concluded in fiscal 2013. The Compensation Committee determined that the primary focus for using equity in fiscal 2010 was to establish retention and, therefore, did not provide new awards of performance-based RSUs as it had in fiscal 2009. However, the Compensation Committee did again utilize performance-based equity starting in fiscal 2011 for executive officers, including the Named Executive Officers.
| Vesting of Performance-Based RSUs | ||||||
| Fiscal Year of Award |
Performance after 2 years |
Performance after 3 years |
Fiscal 2013 Vesting | |||
| 2010 |
Not applicable | Not applicable | We did not grant performance-based equity awards to Named Executive Officers in fiscal 2010. | |||
| 2011 |
50% vesting based on our TSR performance versus that of the QQQ | 50% vesting based on our TSR performance versus that of the QQQ | First tranche of December 2010 awards vested in December 2012 at 30% of target based on our TSR performance versus that of the QQQ. | |||
| 2012 |
50% vesting based on our TSR performance versus that of the QQQ | 50% vesting based on our TSR performance versus that of the QQQ | No vesting in fiscal 2013. | |||
| 2013 |
50% vesting based on our TSR performance versus that of the QQQ | 50% vesting based on our TSR performance versus that of the QQQ | No vesting in fiscal 2013. | |||
24
Table of Contents
The use of equity is not limited to the CEO and other executive officers. In fact, BMC utilizes equity as a key component of our pay-for-performance philosophy. Each year, the Compensation Committee approves and oversees awards to employees below the executive level expressly to recognize key talent performance and establish long-term retention. The selection of recipients and award amounts are based on a combination of performance, contribution and future potential. In fiscal 2013, approximately 32% of our employees were selected for an award of time-based RSUs. These employees, not including executive officers, received 78% of the total RSUs granted to employees by the Company in fiscal 2013.
The LTIP (a cash-based long-term incentive program) was designed to:
| • | Drive value creation through TSR performance measures; |
| • | Retain top-performing and critical executive officers; and |
| • | Reward executive officers for exceptional stock price performance compared to selected peer technology companies. |
The actual LTIP cash award amount for each participant is dependent on our TSR relative to that of the NASDAQ-100 Index over the course of the three-year performance period. No additional awards have been made to any of our executive officers under this program since fiscal 2011.
| LTIP | ||||||||||
| Fiscal Year of Award |
TSR Measurement |
Payout Scale |
Outcome | |||||||
| 2009 |
BMC three-year TSR | < 30th percentile of peer group | = | 0% payout | 96.7% payout as our | |||||
| against list of peer | = 50th percentile of peer group | = | 75% payout | TSR achieved the 63rd | ||||||
| companies (1) | = 65th percentile of peer group | = | 100% payout | percentile | ||||||
| > 80th percentile of peer group | = | 150% payout | ||||||||
| 2010 |
BMC three-year TSR | < 30th percentile of peer group | = | 0% payout | 0% payout as our TSR | |||||
| against list of peer | = 50th percentile of peer group | = | 75% payout | achieved zero | ||||||
| companies (1) | = 65th percentile of peer group | = | 100% payout | percentile (last out of | ||||||
| > 80th percentile of peer group | = | 150% payout | nine total companies) | |||||||
| 2011 |
BMC three-year TSR | More than 24 points below QQQ | = | 0% payout | 0% payout as our TSR | |||||
| against the QQQ (2) | 24 points less than QQQ | = | 50% payout | was 35% below that of | ||||||
| 12 points less than QQQ | = | 75% payout | the QQQ | |||||||
| TSR matches QQQ | = | 100% payout | ||||||||
| 12 points above QQQ | = | 125% payout | ||||||||
| 24 points above QQQ | = | 150% payout | ||||||||
| (1) | For awards granted in fiscal 2009 and 2010, vesting is based on BMC’s TSR relative to that of a list of peer companies. TSR is calculated for both BMC and the peer companies over the performance period based on the closing price on the first and last day of the performance period using the following formula: |
Last day closing price – first day closing price
First day closing price
25
Table of Contents
| (2) | For awards granted in fiscal 2011, vesting is based on BMC’s TSR relative to that of the QQQ. TSR is calculated for both BMC and the QQQ over the performance period based on an average of the closing stock price during the period one month prior to and one month subsequent to the first day of the performance period, and an average of the closing stock price during the two-month period one month prior to and one month subsequent to the last day of the performance period, using the following formula: |
Beginning average closing price – Ending average closing price
Beginning average closing price
Where:
“Closing price” equals the average adjusted closing price of the stock and index for each trading day occurring during that two-month period ending on the last day of the performance period and
“Beginning price” equals the average adjusted closing price of the stock and index for each trading day occurring during the two month period ending on the day immediately preceding the start of the performance period.
If a participant is no longer employed due to disability or death, then targeted cash amounts are prorated. In the event of a termination following a change in control, targeted cash amounts are prorated based on relative TSR as if the performance period ended on the date of the change in control. In the event of terminations other than change in control terminations, death or disability, awards are forfeited.
At the conclusion of fiscal 2013, Messrs. Beauchamp, Solcher and Miller received no payouts for LTIP awards that measured our TSR during the three-year period from April 1, 2010 through March 31, 2013 since our relative TSR was below the percentile level required to generate a payment for this period (based on the performance payout scale applicable to such performance period).
| Name |
Target Grant Amount (April 2010 - March 2013) |
Payout Amount Based on TSR |
||||||
| Robert E. Beauchamp |
$ | 1,900,000 | $ | 0 | ||||
| Stephen B. Solcher |
$ | 600,000 | $ | 0 | ||||
| William B. Miller |
$ | 562,500 | $ | 0 | ||||
Benefits and Perquisites; Employee Benefit Plans
We do not provide material perquisites or personal benefits to NEOs that are not provided to the general employee population. Historically, BMC had reimbursed executive officers for costs and associated imputed income taxes associated with spousal travel to certain Company events. While we will continue to pay travel costs for spouses to attend appropriate Company events, we no longer “gross up” or pay the taxes on the imputed income resulting from these costs nor do we provide for any tax “gross up” of “golden parachute” taxes under Section 280G of the IRC to any of our executive officers.
Our NEOs participate in generally the same benefits programs, such as health insurance and 401(k) retirement savings plans, as all other employees with no differentiation or supplementation. We provide a Company-paid supplemental disability program for vice presidents and executive officers who enrolled in such program prior to its closure to new participants in March 2007. Of our NEOs, Messrs. Beauchamp, Solcher and Miller participated in the supplemental disability program in fiscal 2013. We also provide relocation expense reimbursement for new hires. The level of reimbursement eligibility varies based on an employee’s job level within the organization. Vice presidents and executive officers generally qualify for the same level of reimbursement eligibility. Actual reimbursement is dependent upon actual relocation expenses incurred and verified and is subject to a maximum amount.
Deferred Compensation Plan
We have a non-qualified deferred compensation plan for a select group of management or highly compensated employees in which the NEOs are also eligible to participate. Company contributions are permitted under the plan; however, this is not our typical practice, and we have not made Company contributions for any of the Named Executive Officers. We do not maintain a Supplemental Executive Retirement Plan (“SERP”) or any defined benefit deferred compensation plan for any NEOs.
26
Table of Contents
Other Compensation Items
Ownership Guidelines and Claw-back Provisions:
Effective April 2011, we adopted ownership guidelines for our CEO and other executive officers that will require our CEO to own shares of Common Stock representing a value of three times his or her base salary and for each other executive officer reporting to the CEO to own shares of Common Stock representing a value equal to their base salaries by April 27, 2016 or five years after their hire date, whichever is later.
We continue to be committed to sound compensation governance practices and implemented a “clawback” policy during fiscal 2012 applicable to our executive officers, in advance of the finalization of the pending regulations associated with the Dodd-Frank Wall Street Reform and Consumer Protection Act (the “Dodd-Frank Act”). The clawback policy provides for the reimbursement or forfeiture of cash incentive-based compensation in the event of fraud or intentional misconduct that results in the required restatement of any financial reporting required under the securities laws or other similar laws or regulations applicable to the Company.
Prohibition on Pledging and Hedging
Our Securities Trading Policy prohibits all employees from hedging or pledging Company stock or derivatives thereof.
Severance and Change in Control Benefits
We believe that severance arrangements, including arrangements that provide protection in the context of a change in control transaction, can play a valuable role in attracting and retaining executive officers, are an important part of an executive’s compensation and are consistent with competitive practices. Accordingly, we provide such arrangements for our NEOs and other executive officers. We believe that the occurrence, or potential occurrence, of a change in control will create uncertainty regarding the continued employment of our executive officers. This uncertainty results from the fact that many change in control transactions result in significant organizational changes, particularly impacting senior executives of the target company. In order to encourage our executive officers to remain employed with us during an important time when their prospects for continued employment following the transaction are often uncertain, we provide our executive officers, including the NEOs, with severance benefits if their employment is terminated without cause or by the executive for good reason within the first twelve months after a change in control. Because a termination by the executive for good reason, as defined in IRC Section 409A, is conceptually the same as a termination without cause, and potential acquirers would otherwise have an incentive to constructively terminate the executive’s employment to avoid paying severance, it is appropriate to provide severance benefits in these circumstances. In the case of our NEOs, these benefits are provided under employment agreements which are described in more detail under “Potential Payments Upon Termination or Change in Control.” However, our severance and change in control arrangements are within most stockholder guidelines for such arrangements, only accelerating existing stock awards in the case of a “double trigger” event (change in control and subsequent termination) and providing only one to two years in annual cash compensation.
In April 2010, we amended the employment agreements with our NEOs and other executive officers such that they no longer contain provisions providing that we would compensate or “gross up” the NEO or other executive officer for the IRC Section 4999 excise tax or any additional taxes on the gross-up payment. We have continued to exclude gross-up provisions from employment agreements of new NEOs and other executive officers.
Policy with Respect to IRC Section 162(m)
Section 162(m) of the Internal Revenue Code provides that we may not deduct for federal income tax purposes compensation of more than $1,000,000 paid in any year to the CEO or any of the three other most highly compensated executive officers, excluding the Chief Financial Officer, unless the compensation is paid based solely on the attainment of one or more pre-established objective performance goals and certain other conditions are met. We generally design and administer executive compensation programs, particularly stock options, performance-based RSUs, the STIP and LTIP, to preserve the deductibility of compensation paid to our executive officers, and we believe that a reasonable portion of our current executive compensation program satisfies the requirements for exemption from the $1,000,000 deduction limitation. However, from time to time, certain elements of our executive compensation program may not comply with all the requirements of Section 162(m) and the payouts associated with such elements are subject to the $1,000,000 deduction limit. Awards of time-based restricted stock and time-based RSUs are subject to the $1,000,000 deduction limit. We reserve the right to design compensation plans that recognize a full range of performance and other criteria important to our success regardless of the federal income tax deductibility of compensation paid under those plans.
27
Table of Contents
Report of the Compensation Committee
The Compensation Committee, which is comprised solely of independent members of the Board, assists the Board in fulfilling its responsibilities with regard to compensation matters. The Compensation Committee has reviewed and discussed this “Compensation Discussion and Analysis” section with management. Based on this review and discussion, the Compensation Committee recommended to the Board that the “Compensation Discussion and Analysis” section be included in this Form 10-K/A.
COMPENSATION COMMITTEE
Stephan A. James, Chairman
Gary L. Bloom
Meldon K. Gafner
Alex Pinchev
Carl James Schaper
Tom C. Tinsley
28
Table of Contents
COMPENSATION RISK ASSESSMENT
The Compensation Committee considers, in establishing and reviewing our overall compensation programs, whether these programs and their various elements encourage or motivate employees to take inappropriate risks or introduce excessive business risk. During fiscal 2013, at the direction of the Compensation Committee, our compensation practices and policies were reviewed by our internal Finance, Legal and Compensation organizations and by the Compensation Committee’s independent compensation consultant, Compensia; the findings were presented to the Compensation Committee. The Compensation Committee considered the findings of the assessment and concluded that our compensation programs are designed and administered with the appropriate balance of risk and reward in relation to our overall business strategy and do not encourage employees to take unnecessary or excessive risks and that the level of risk that they do encourage is not reasonably likely to materially harm our business or financial condition.
In regard to the compensation program relative to business risk, we offer a mixture of short-term and long-term incentives to our executive officers to balance their motivations. We also have in place numerous business controls, such as maximum payout levels in executive incentive plans, approvals and audit processes to mitigate and manage the risk that may arise as a result of focus on short-term, quarterly performance. The Compensation Committee believes that the design of our compensation programs as outlined in “Compensation Discussion and Analysis” places appropriate balance upon the multiple components of our compensation program. While a portion of total compensation is tied to short-term performance, the Compensation Committee concluded that emphasis on long-term incentives appropriately balances risk and aligns the executive officers’ motivations for BMC’s long-term success, including stock price performance. During fiscal 2013, we also continued to include performance-based equity awards within our executive compensation grants to ensure a portion of compensation will be tied closely to long-term stockholder interests. We introduced stock ownership guidelines during fiscal 2011, as described in “Compensation Discussion and Analysis,” which require a level of stock ownership by our Chief Executive Officer and executive officers directly reporting to him that we believe appropriately align their interests with those of our stockholders. We have also implemented a “clawback” policy applicable to our executive officers, in advance of regulatory guidance from the SEC as required by the Dodd-Frank Act, providing our Board with the ability to require the reimbursement or forfeiture of cash incentive-based compensation in the event of fraud or intentional misconduct that results in the required restatement of our financial statements. In addition, our Securities Trading Policy prohibits pledging or hedging Company stock or derivatives thereof.
Given the factors discussed above, we concluded that nothing inherent within the compensation program design increases the likelihood of a material risk being encouraged or introduced outside of the normal course of business practices.
29
Table of Contents
EXECUTIVE COMPENSATION
Fiscal 2013 Summary Compensation Table
The following table sets forth information concerning the compensation paid to or earned by our Named Executive Officers during fiscal 2013.
| Salary | Stock Awards ($)(3) |
Non-Equity Incentive Plan Compensation ($)(7) |
All Other Comp |
Total |
||||||||||||||||||||||||||||
| Performance- | Time- | |||||||||||||||||||||||||||||||
| Name and Principal Position |
Year | ($) | Based | Based | STIP | LTIP(8) | ($)(9) | ($) | ||||||||||||||||||||||||
| Robert E. Beauchamp |
2013 | 980,000 | 5,910,114 | (4) | 5,578,777 | 848,288 | — | 32,589 | 13,349,768 | |||||||||||||||||||||||
| President and CEO |
2012 | 977,500 | 5,856,582 | (5) | 4,908,766 | 713,440 | — | 36,229 | 12,492,517 | |||||||||||||||||||||||
| 2011 | 950,000 | 2,218,319 | (6) | 6,582,099 | 1,525,605 | 1,377,975 | 18,814 | 12,672,812 | ||||||||||||||||||||||||
| Stephen B. Solcher |
2013 | 550,000 | 1,736,972 | (4) | 1,639,609 | 297,550 | — | 17,340 | 4,241,471 | |||||||||||||||||||||||
| SVP, CFO |
2012 | 543,750 | 1,572,687 | (5) | 1,591,262 | 250,250 | — | 17,716 | 3,975,665 | |||||||||||||||||||||||
| 2011 | 475,000 | 517,597 | (6) | 1,535,826 | 508,535 | 348,120 | 16,676 | 3,401,754 | ||||||||||||||||||||||||
| Paul Avenant (1) SVP of Solutions |
2013 | 496,708 | 1,508,141 | (4) | 1,423,587 | 228,829 | — | 28,696 | 3,685,961 | |||||||||||||||||||||||
| Kia Behnia (2) |
2013 | 458,667 | 1,508,141 | (4) | 1,423,587 | 281,482 | — | 5,142 | 3,677,019 | |||||||||||||||||||||||
| SVP, CTO |
2012 | 406,458 | 1,342,543 | (5) | 1,373,145 | 263,461 | — | 4,294 | 3,389,901 | |||||||||||||||||||||||
| William D. Miller |
2013 | 534,917 | 1,687,687 | (4) | 1,593,059 | 538,785 | — | 38,999 | 4,393,447 | |||||||||||||||||||||||
| Chief Operating Officer |
2012 | 486,667 | 1,534,793 | (5) | 1,548,186 | 581,532 | — | 24,748 | 4,175,926 | |||||||||||||||||||||||
| 2011 | 450,000 | 633,465 | (6) | 1,869,923 | 570,780 | 328,780 | 19,949 | 3,872,897 | ||||||||||||||||||||||||
| (1) | Mr. Avenant was not a Named Executive Officer in fiscal 2011 or 2012. |
| (2) | Mr. Behnia was not a Named Executive Officer in fiscal 2011. |
| (3) | Represents grant date fair value as determined in accordance with accounting principles generally accepted in the United States (“U.S. GAAP”) for RSUs granted by the Company in the respective fiscal year, calculated by multiplying the fair value of the award on the date of grant by the number of awards granted. The fair value of RSUs is based on the average of the high and low trading price of a share of Common Stock on the date of grant, except for certain awards with performance-based conditions, for which the fair value was determined using a Monte Carlo simulation model on the date of grant. For a discussion of the specific valuation assumptions used, see Note 9, Share-Based Compensation, to our audited financial statements included in our Original Form 10-K for the year ended March 31, 2013. |
| (4) | Represents the grant date fair value of RSUs with performance-based conditions granted during fiscal 2013. The maximum potential value of these performance-based awards, based on the fair market value of a share of Common Stock on the date of grant multiplied by the maximum number of awards that could vest, is $8,865,171, $2,605,458, $2,262,210, $2,262,210 and $2,531,532 for Messrs. Beauchamp, Solcher, Avenant, Behnia and Miller, respectively. |
| (5) | Represents the grant date fair value of RSUs with performance-based conditions granted during fiscal 2012. The maximum potential value of these performance-based awards, based on the fair market value of a share of Common Stock on the date of grant multiplied by the maximum number of awards that could vest, is $8,784,873, $2,359,031, $2,013,815 and $2,302,190 for Messrs. Beauchamp, Solcher, Behnia and Miller, respectively. |
| (6) | Represents the grant date fair value of RSUs with performance-based conditions granted during fiscal 2011. The maximum potential value of these performance-based awards, based on the fair market value of a share of Common Stock on the date of grant multiplied by the maximum number of awards that could vest, is $3,327,479, $776,396 and $950,198 for Messrs. Beauchamp, Solcher and Miller, respectively. |
| (7) | Represents amounts earned under our STIP and LTIP based on performance measures satisfied in the fiscal year indicated. |
| (8) | LTIP payouts for fiscal 2012 and 2013 were zero due to BMC’s rankings during the three-year measurement period. LTIP awards earned in fiscal 2011 were paid at 96.7% of target due to BMC ranking at the 63rd percentile during the three-year measurement period. |
30
Table of Contents
| (9) | All other compensation for fiscal 2013 is itemized and described in the following table: |
| Name |
Defined Contribution Plans ($)(a) |
Insurance ($)(b) |
Other Awards ($)(c) |
|||||||||
| Robert E. Beauchamp |
12,250 | 7,104 | 13,235 | |||||||||
| Stephen B. Solcher |
12,500 | 4,840 | — | |||||||||
| Paul Avenant |
12,858 | 1,589 | 14,249 | |||||||||
| Kia Behnia |
3,942 | 998 | 202 | |||||||||
| William D. Miller |
13,051 | 10,286 | 15,662 | |||||||||
| (a) | Represents our matching contributions to 401(k) accounts. All 401(k) participants are treated equally with respect to our 401(k), and we do not have preferential matching for our executive officers. |
| (b) | Represents amounts paid by us on behalf of the Named Executive Officers for term life insurance and supplemental disability insurance. |
| (c) | Represents value attributed to the Named Executive Officers for guest travel to Company events and value of related gifts. |
Grants of Plan-Based Awards in Fiscal 2013
The following table sets forth information relating to plan-based awards granted to our Named Executive Officers during fiscal 2013.
| Award | Estimated Future Payouts
Under Non-Equity Incentive Plan Awards |
Estimated Future Payouts Under Equity Incentive Plan Awards(2) |
All Other Stock Awards: Number of Shares of |
Grant Date Fair Value of Stock and Option |
||||||||||||||||||||||||||||||||
| Type | Grant | Threshold | Target | Maximum | Threshold | Target | Maximum | Stock or | Awards | |||||||||||||||||||||||||||
| Name |
(1) | Date | ($) | ($) | ($) | (#) | (#) | (#) | Units (#) (3) | ($)(4) | ||||||||||||||||||||||||||
| Robert E. Beauchamp |
STIP Equity |
392,000 | 1,568,000 | 3,136,000 | ||||||||||||||||||||||||||||||||
| 5/14/2012 | 66,925 | 2,880,452 | ||||||||||||||||||||||||||||||||||
| 05/14/2012 | 1,235 | 61,756 | 92,634 | 3,213,165 | ||||||||||||||||||||||||||||||||
| 11/12/2012 | 67,416 | 2,698,325 | ||||||||||||||||||||||||||||||||||
| 11/12/2012 | 1,230 | 61,518 | 92,277 | 2,696,949 | ||||||||||||||||||||||||||||||||
| Stephen B. Solcher |
STIP Equity |
137,500 | 550,000 | 1,100,000 | ||||||||||||||||||||||||||||||||
| 5/14/2012 | 19,669 | 846,554 | ||||||||||||||||||||||||||||||||||
| 5/14/2012 | 363 | 18,150 | 27,225 | 944,345 | ||||||||||||||||||||||||||||||||
| 11/12/2012 | 19,814 | 793,055 | ||||||||||||||||||||||||||||||||||
| 11/12/2012 | 362 | 18,080 | 27,120 | 792,627 | ||||||||||||||||||||||||||||||||
| Paul Avenant |
STIP Equity |
150,150 | 600,600 | 1,201,200 | ||||||||||||||||||||||||||||||||
| 5/14/2012 | 17,078 | 735,037 | ||||||||||||||||||||||||||||||||||
| 5/14/2012 | 315 | 15,759 | 23,639 | 819,940 | ||||||||||||||||||||||||||||||||
| 11/12/2012 | 17,203 | 688,550 | ||||||||||||||||||||||||||||||||||
| 11/12/2012 | 314 | 15,698 | 23,547 | 688,200 | ||||||||||||||||||||||||||||||||
| Kia Behnia |
STIP | 130,075 | 520,300 | 1,040,600 | ||||||||||||||||||||||||||||||||
| Equity | ||||||||||||||||||||||||||||||||||||
| 5/14/2012 | 17,078 | 735,037 | ||||||||||||||||||||||||||||||||||
| 5/14/2012 | 315 | 15,759 | 23,639 | 819,940 | ||||||||||||||||||||||||||||||||
| 11/12/2012 | 17,203 | 688,550 | ||||||||||||||||||||||||||||||||||
| 11/12/2012 | 314 | 15,698 | 23,547 | 688,200 | ||||||||||||||||||||||||||||||||
| William D. Miller |
STIP Equity |
161,700 | 646,800 | 1,293,600 | ||||||||||||||||||||||||||||||||
| 5/14/2012 | 19,111 | 822,537 | ||||||||||||||||||||||||||||||||||
| 5/14/2012 | 353 | 17,635 | 26,453 | 917,549 | ||||||||||||||||||||||||||||||||
| 11/12/2012 | 19,251 | 770,521 | ||||||||||||||||||||||||||||||||||
| 11/12/2012 | 351 | 17,567 | 26,351 | 770,139 | ||||||||||||||||||||||||||||||||
31
Table of Contents
| (1) | STIP is our Short-Term Incentive Plan, which targets quarterly performance against goals established by the Compensation Committee and Board. Awards under the STIP are paid in cash and are reflected in the column titled “Non-Equity Incentive Plan Compensation – STIP” in the Fiscal 2013 Summary Compensation Table above. The Threshold, Target and Maximum amounts presented above represent such amounts for the fiscal 2013 STIP. Because our STIP incorporates multiple performance measures and measurement periods within the fiscal year, actual payouts could be less than the threshold amounts presented above if actual performance for one or more measures or measurement periods is below threshold for such measure or period. See “Compensation Discussion and Analysis – Short-term Incentives.” |
| (2) | Performance-based RSUs measure our TSR against that of the NASDAQ-100 Index over respective two-year and three-year performance periods, with both periods weighted equally. See “Compensation Discussion and Analysis – Long-term Incentives.” |
| (3) | Time-based RSUs which vest one-third per year over three years from date of grant, assuming continued employment. |
| (4) | Represents grant date fair value as determined in accordance with U.S. GAAP for RSUs granted by the Company in fiscal 2013. |
32
Table of Contents
Outstanding Equity Awards at Fiscal 2013 Year-End
The following table sets forth information, as of March 31, 2013, concerning unexercised options and unvested RSUs for each Named Executive Officer.
| Option Awards | Stock Awards | |||||||||||||||||||||||||||||||
| Name |
Number of Securities Underlying Unexercised Options Exercisable (#) |
Number of Securities Underlying Unexercised Options Unexercisable (#) |
Option Exercise Price ($) |
Option Expiration Date |
Number of Shares or Units of Stock That Have Not Vested (#) |
Market Value of Shares or Units of Stock That Have Not Vested ($)(13) |
Equity Incentive Plan Awards: Number of Unearned Shares, Units or Other Rights That Have Not Vested (#) |
Equity Incentive Plan Awards: Market Value of Unearned Shares, Units or Other Rights That Have Not Vested ($)(13) |
||||||||||||||||||||||||
| Robert E. Beauchamp |
500,000 | — | 17.405 | 5/3/2014 | ||||||||||||||||||||||||||||
| 326,000 | — | 39.295 | 6/6/2014 | |||||||||||||||||||||||||||||
| 40,361 | (1) | 1,869,925 | ||||||||||||||||||||||||||||||
| 16,272 | (2) | 753,882 | ||||||||||||||||||||||||||||||
| 39,706 | (4) | 1,839,579 | ||||||||||||||||||||||||||||||
| 31,924 | (5) | 1,479,039 | ||||||||||||||||||||||||||||||
| 66,925 | (6) | 3,100,635 | ||||||||||||||||||||||||||||||
| 67,416 | (7) | 3,123,383 | ||||||||||||||||||||||||||||||
| 24,181 | (8) | 1,120,306 | ||||||||||||||||||||||||||||||
| 53,885 | (9) | 2,496,492 | ||||||||||||||||||||||||||||||
| 85,802 | (10) | 3,975,207 | ||||||||||||||||||||||||||||||
| 61,756 | (11) | 2,861,155 | ||||||||||||||||||||||||||||||
| 61,518 | (12) | 2,850,129 | ||||||||||||||||||||||||||||||
| Stephen B. Solcher |
44,286 | — | 39.295 | 6/6/2014 | ||||||||||||||||||||||||||||
| 9,418 | (1) | 436,336 | ||||||||||||||||||||||||||||||
| 3,797 | (2) | 175,915 | ||||||||||||||||||||||||||||||
| 11,398 | (4) | 528,069 | ||||||||||||||||||||||||||||||
| 12,535 | (5) | 580,747 | ||||||||||||||||||||||||||||||
| 19,669 | (6) | 911,265 | ||||||||||||||||||||||||||||||
| 19,814 | (7) | 917,983 | ||||||||||||||||||||||||||||||
| 5,642 | (8) | 261,394 | ||||||||||||||||||||||||||||||
| 15,468 | (9) | 716,632 | ||||||||||||||||||||||||||||||
| 21,260 | (10) | 984,976 | ||||||||||||||||||||||||||||||
| 18,150 | (11) | 840,890 | ||||||||||||||||||||||||||||||
| 18,080 | (12) | 837,646 | ||||||||||||||||||||||||||||||
| Paul Avenant |
7,813 | — | 39.295 | 6/6/2014 | ||||||||||||||||||||||||||||
| 6,000 | (1) | 277,980 | ||||||||||||||||||||||||||||||
| 5,400 | (2) | 250,182 | ||||||||||||||||||||||||||||||
| 6,005 | (3) | 278,212 | ||||||||||||||||||||||||||||||
| 7,692 | (4) | 356,370 | ||||||||||||||||||||||||||||||
| 13,998 | (5) | 648,527 | ||||||||||||||||||||||||||||||
| 17,078 | (6) | 791,224 | ||||||||||||||||||||||||||||||
| 17,203 | (7) | 797,015 | ||||||||||||||||||||||||||||||
| 10,070 | (9) | 466,543 | ||||||||||||||||||||||||||||||
| 23,741 | (10) | 1,099,921 | ||||||||||||||||||||||||||||||
| 15,759 | (11) | 730,114 | ||||||||||||||||||||||||||||||
| 15,698 | (12) | 727,288 | ||||||||||||||||||||||||||||||
| Kia Behnia |
9,375 | — | 19.930 | 8/4/2015 | ||||||||||||||||||||||||||||
| 20,000 | — | 39.295 | 6/6/2014 | |||||||||||||||||||||||||||||
| 6,000 | (1) | 277,980 | ||||||||||||||||||||||||||||||
| 9,600 | (2) | 444,768 | ||||||||||||||||||||||||||||||
| 5,499 | (3) | 254,769 | ||||||||||||||||||||||||||||||
| 7,692 | (4) | 356,370 | ||||||||||||||||||||||||||||||
| 13,998 | (5) | 648,527 | ||||||||||||||||||||||||||||||
| 17,078 | (6) | 791,224 | ||||||||||||||||||||||||||||||
| 17,203 | (7) | 797,015 | ||||||||||||||||||||||||||||||
| 10,070 | (9) | 466,543 | ||||||||||||||||||||||||||||||
| 23,741 | (10) | 1,099,921 | ||||||||||||||||||||||||||||||
| 15,759 | (11) | 730,114 | ||||||||||||||||||||||||||||||
| 15,698 | (12) | 727,288 | ||||||||||||||||||||||||||||||
33
Table of Contents
| Option Awards | Stock Awards | |||||||||||||||||||||||||||||||
| Name |
Number of Securities Underlying Unexercised Options Exercisable (#) |
Number of Securities Underlying Unexercised Options Unexercisable (#) |
Option Exercise Price ($) |
Option Expiration Date |
Number of Shares or Units of Stock That Have Not Vested (#) |
Market Value of Shares or Units of Stock That Have Not Vested ($)(13) |
Equity Incentive Plan Awards: Number of Unearned Shares, Units or Other Rights That Have Not Vested (#) |
Equity Incentive Plan Awards: Market Value of Unearned Shares, Units or Other Rights That Have Not Vested ($)(13) |
||||||||||||||||||||||||
| William D. Miller |
17,292 | — | 32.145 | 6/15/2013 | ||||||||||||||||||||||||||||
| 40,334 | — | 39.295 | 6/6/2014 | |||||||||||||||||||||||||||||
| 11,436 | (1) | 529,830 | ||||||||||||||||||||||||||||||
| 4,647 | (2) | 215,296 | ||||||||||||||||||||||||||||||
| 9,573 | (4) | 443,517 | ||||||||||||||||||||||||||||||
| 14,446 | (5) | 669,283 | ||||||||||||||||||||||||||||||
| 19,111 | (6) | 885,413 | ||||||||||||||||||||||||||||||
| 19,251 | (7) | 891,899 | ||||||||||||||||||||||||||||||
| 6,905 | (8) | 319,909 | ||||||||||||||||||||||||||||||
| 12,991 | (9) | 601,873 | ||||||||||||||||||||||||||||||
| 24,502 | (10) | 1,135,178 | ||||||||||||||||||||||||||||||
| 17,635 | (11) | 817,030 | ||||||||||||||||||||||||||||||
| 17,567 | (12) | 813,879 | ||||||||||||||||||||||||||||||
| (1) | RSUs with grant date of June 7, 2010 that vest one-third per year over three years. |
| (2) | RSUs with grant date of December 6, 2010 that vest one-third per year over three years. |
| (3) | RSUs with grant date of February 7, 2011 that vest one-third per year over three years. |
| (4) | RSUs with grant date of June 6, 2011 that vest one-third per year over three years. |
| (5) | RSUs with grant date of November 7, 2011 that vest one-third per year over three years. |
| (6) | RSUs with grant date of May 14, 2012 that vest one-third per year over three years. |
| (7) | RSUs with grant date of November 12, 2012 that vest one-third per year over three years. |
| (8) | Performance-based RSUs with a grant date of December 6, 2010 that vest 50% in the second year and 50% in the third year based on our relative TSR as measured against the NASDAQ-100 Index. |
| (9) | Performance-based RSUs with a grant date of June 6, 2011 that vest 50% in the second year and 50% in the third year based on our relative TSR as measured against the NASDAQ-100 Index. |
| (10) | Performance-based RSUs with a grant date of November 7, 2011 that vest 50% in the second year and 50% in the third year based on our relative TSR as measured against the NASDAQ-100 Index. |
| (11) | Performance-based RSUs with a grant date of May 14, 2012 that vest 50% in the second year and 50% in the third year based on our relative TSR as measured against the NASDAQ-100 Index. |
| (12) | Performance-based RSUs with a grant date of November 12, 2012 that vest 50% in the second year and 50% in the third year based on our relative TSR as measured against the NASDAQ-100 Index. |
| (13) | Calculated using the closing price on March 28, 2013 of $46.33. |
34
Table of Contents
Fiscal 2013 Option Exercises and Stock Vested
The following table provides information on stock options exercised and stock awards vested during fiscal 2013.
| Option Awards | Stock Awards | |||||||||||||||
| Name |
Number of Shares Acquired on Exercise (#) |
Value Realized on Exercise ($)(1) |
Number of Shares Acquired on Vesting (#) |
Value Realized on Vesting ($)(2) |
||||||||||||
| Robert E. Beauchamp |
285,000 | 2,974,830 | 181,160 | 7,693,671 | ||||||||||||
| Stephen B. Solcher |
75,000 | 615,820 | 45,881 | 1,946,309 | ||||||||||||
| Paul Avenant |
— | — | 50,832 | 2,151,650 | ||||||||||||
| Kia Behnia |
36,882 | 533,391 | 53,275 | 2,251,860 | ||||||||||||
| William D. Miller |
— | — | 53,243 | 2,256,290 | ||||||||||||
| (1) | Represents the difference between the fair market value of our Common Stock on the date of exercise and the exercise price of the applicable option multiplied by the number of shares underlying the exercised option. |
| (2) | Represents the product of the fair market value of our Common Stock on the vesting date and the number of shares that vested on such date. |
35
Table of Contents
Fiscal 2013 Non-qualified Deferred Compensation
We have a non-qualified deferred compensation plan for a select group of management or highly compensated employees in which the Named Executive Officers are eligible to participate. Company contributions are permitted under the plan; however, this is not our typical practice, and we have not made Company contributions for any of the Named Executive Officers. Participants may elect to defer up to 50% of their respective base salaries and 100% of their applicable bonuses, which deferrals are irrevocable for each plan year as of the beginning of each plan year. Participant contributions are directed into a “rabbi trust” (a special form of grantor trust) for the purpose of administering and paying the deferred compensation under this plan. Contributions in the rabbi trust are invested by the Trustee in line with direction provided by participants for long-term return in their hypothetical accounts. The existence of the rabbi trust implies no vested ownership interest of the participant in trust assets but is a vehicle through which we may match the liabilities under the plan resulting from hypothetical accounts with an offsetting asset. The investment choices offered participants in their hypothetical accounts mirror those offered in our 401(k) plan, with the exception of investment in our Common Stock and the self-directed brokerage option, each of which is offered only in our 401(k) plan. Participants’ account values are adjusted up and down in line with investment returns of the selected investment options for their hypothetical accounts. The aggregate “at market” earnings on these investments by each Named Executive Officer who is a participant in the plan are included in the table below. Participants may change the designation of the investments in their hypothetical accounts in accordance with the investments and procedures established by the Employee Benefits Committee. Before any compensation deferral, participants choose when the funds will be distributable. Generally, the aggregate balances of the participants are distributable upon the following events: a specified date or age designated by the participant; the participant’s separation from service, subject to a six month waiting period; the participant’s unforeseeable emergency; or the participant’s death or disability. The plan provides for distributions to be made in either a lump sum amount or installments payable over 5, 10 or 15 years. The following table provides certain information with respect to our Non-qualified Deferred Compensation Plan.
| Name |
Executive Contributions in Last FY ($) |
Registrant Contributions in Last FY ($) |
Aggregate Earnings in Last FY ($)(2) |
Aggregate Withdrawals/ Distributions ($) |
Aggregate Balance at Last FYE ($) |
|||||||||||||||
| Robert E. Beauchamp |
— | — | 313,479 | — | 2,971,826 | |||||||||||||||
| Stephen B. Solcher |
— | — | 4,076 | 77,128 | 10,222 | |||||||||||||||
| Paul Avenant |
— | — | — | — | — | |||||||||||||||
| Kia Behnia |
— | — | — | — | — | |||||||||||||||
| William D. Miller |
105,835 | (1) | — | 44,704 | — | 685,348 | ||||||||||||||
| (1) | Contributions in fiscal 2013 include $34,751 reported in 2012 in our Fiscal 2012 Summary Compensation Table and $71,084 reported in our Fiscal 2013 Summary Compensation Table above. |
| (2) | Represents the change in the value of the account from investment returns (including interest and dividends) based on the deemed investment choices as selected by the individual. Earnings are not reported in our Fiscal 2013 Summary Compensation Table because they are not above-market or preferential earnings. |
36
Table of Contents
Potential Payments Upon Termination or Change in Control
Termination Events
Our employment agreements with each of our Named Executive Officers provide that in the case of a termination of employment by us not for Cause, as defined in the agreement, or by the Named Executive Officer for Good Reason, as defined in the agreement, the Named Executive Officer would be entitled to a cash severance payment, described in further detail in the table and accompanying footnotes below. In addition, each of our Named Executive Officers is entitled to certain benefits, as described in the table and accompanying footnotes below, in the event of termination by reasons of the NEO’s death or disability. In consideration of the payments and benefits under the employment agreement, the agreements restrict competitive activities and prohibit solicitation of our clients and employees for two years (18 months in the case of Messrs. Avenant, Behnia and Miller) after termination of employment and prohibit disclosure of our confidential information. The following table sets forth the amounts of such severance payments and benefits to the Named Executive Officer assuming the event that triggered the payment occurred on March 31, 2013.
| Name |
Executive Benefits and Payments Upon Termination |
Death ($)(2) |
Disability ($)(2) |
Involuntary For Cause Termination ($) |
Involuntary Not For Cause Termination ($)(3) |
Voluntary Termination with Good Reason ($)(3) |
Voluntary Termination without Good Reason (e.g., Retirement) ($) |
|||||||||||||||||||
| Robert E. Beauchamp |
Severance Payments Vesting of Equity(1) |
|
— 12,166,443 |
|
|
— 12,166,443 |
|
|
— — |
|
|
5,096,000 — |
|
|
5,096,000 — |
|
|
— — |
| |||||||
| Stephen B. Solcher |
Severance Payments Vesting of Equity(1) |
|
— 3,550,315 |
|
|
— 3,550,315 |
|
|
— — |
|
|
2,200,000 — |
|
|
2,200,000 — |
|
|
— — |
| |||||||
| Paul Avenant |
Severance Payments | — | — | — | 1,101,100 | 1,101,100 | — | |||||||||||||||||||
| Vesting of Equity(1) | 3,399,510 | 3,399,510 | — | — | — | — | ||||||||||||||||||||
| Kia Behnia |
Severance Payments | — | — | — | 993,300 | 993,300 | — | |||||||||||||||||||
| Vesting of Equity(1) | 3,570,653 | 3,570,653 | — | — | — | — | ||||||||||||||||||||
| William D. Miller |
Severance Payments Vesting of Equity(1) |
|
— 3,635,238 |
|
|
— 3,635,238 |
|
|
— — |
|
|
1,185,800 — |
|
|
1,185,800 — |
|
|
— — |
| |||||||
| (1) | Represents the value of time-based RSUs, calculated assuming a Common Stock price of $46.33 per share (the closing price on March 28, 2013, the final trading day of fiscal 2013), which would be subject to accelerated vesting upon death or permanent disability. |
| (2) | Named Executive Officers would be entitled to a pro rata payment of earned amounts under the STIP and LTIP in the case of death or disability. Such payments would be made at the end of the applicable performance period. Amounts payable under the STIP and the LTIP for performance periods that end on March 31, 2013 are shown above in the Non-Equity Incentive Plan Compensation section of the Fiscal 2013 Summary Compensation Table. |
| (3) | In the case of Messrs. Beauchamp and Solcher, the amount of severance is equal to two years of current base salary plus two times current cash bonus target amount, as of March 31, 2013. In the case of Messrs. Avenant, Behnia and Miller, the amount of severance is equal to one year of current base salary plus one times current cash bonus target amount, as of March 31, 2013. |
Termination Events Occurring Within 12 Months After a Change in Control
Our employment agreements with each of our Named Executive Officers also provide that in the event of a termination of employment not for Cause or for Good Reason within 12 months after a change in control, each Named Executive Officer would be entitled to a cash severance payment, would vest fully in his outstanding equity awards to the extent provided in equity award agreements and would receive a lump sum payment equal to the cost of eighteen months of COBRA coverage and eighteen months of life insurance coverage. In consideration of the benefits provided under the employment agreement with each NEO, the agreements restrict each NEO from competitive activities and from soliciting our clients and employees for two years (18 months in the case of Messrs. Avenant, Behnia and Miller) after termination of employment and prohibit disclosure of our confidential information.
37
Table of Contents
The following table sets forth potential payments to the Named Executive Officers in the event of a termination without Cause or termination for Good Reason by each of the Named Executive Officers within 12 months of a change in control, in each case assuming the event or events that triggered the payment occurred on March 31, 2013. The amounts also assume a Common Stock price of $46.33 per share, the closing price on March 28, 2013 (the final trading day of fiscal 2013), for purposes of determining all equity values. The table includes amounts earned through March 31, 2013 and estimates of amounts that would be paid out to the Named Executive Officers upon their separation or termination. Unless otherwise noted, all cash benefits are stated as the total value of the obligation. However, the amounts reflected in the table are estimates only, as the actual amounts can be determined only at the time of the Named Executive Officer’s termination of employment.
| Name |
Severance Amount ($)(1) |
Acceleration of Time-Based RSUs ($)(2) |
Acceleration of Performance- Based RSUs ($)(3) |
Acceleration of Stock Options ($)(4) |
Benefits ($)(5) |
Total ($) |
||||||||||||||||||
| Robert E. Beauchamp |
5,096,000 | 12,166,443 | 13,303,289 | — | 150,176 | 30,715,908 | ||||||||||||||||||
| Stephen B. Solcher |
2,200,000 | 3,550,315 | 3,641,538 | — | 84,456 | 9,476,309 | ||||||||||||||||||
| Paul Avenant |
1,101,100 | 3,399,510 | 3,023,866 | — | 69,050 | 7,593,526 | ||||||||||||||||||
| Kia Behnia |
993,300 | 3,570,653 | 3,023,866 | — | 35,967 | 7,623,786 | ||||||||||||||||||
| William D. Miller |
1,185,800 | 3,635,238 | 3,687,868 | — | 131,445 | 8,640,351 | ||||||||||||||||||
| (1) | In the case of Messrs. Beauchamp and Solcher, the Severance Amount is equal to two years of current base salary plus two times current cash bonus target amount, as of March 31, 2013. In the case of Messrs. Avenant, Behnia and Miller, the Severance Amount is equal to one year of current base salary plus one times current cash bonus target amount, as of March 31, 2013. |
| (2) | The Acceleration of Time-Based RSUs column represents the value of unvested time-based RSUs that would have accelerated upon a qualifying post-change in control termination on March 31, 2013. Additional information regarding these awards is presented in the “Outstanding Equity Awards at Fiscal 2013 Year-End” table. |
| (3) | The Acceleration of Performance-Based RSUs column represents the value at target vesting of unvested RSUs that would have accelerated upon a qualifying post-change in control termination on March 31, 2013. Additional information regarding these awards is presented in the “Outstanding Equity Awards at Fiscal 2013 Year-End” table. |
| (4) | No NEOs had unvested stock options as of March 31, 2013. |
| (5) | Benefits represent the cost of COBRA medical coverage and life insurance premiums for a period of 18 months. |
38
Table of Contents
COMPENSATION COMMITTEE INTERLOCKS AND INSIDER PARTICIPATION
None of the members of the Compensation Committee were officers or employees or former officers or employees of ours or any of our subsidiaries during fiscal 2013 or had any relationship otherwise requiring disclosure.
39
Table of Contents
| ITEM 12: | Security ownership of certain beneficial owners and management and related stockholder matters |
EQUITY COMPENSATION PLANS
The table below provides information with respect to shares of Common Stock that may be issued under our equity compensation plans as of March 31, 2013.
We have assumed various incentive plans (the “Assumed Plans”) in connection with our acquisitions by merger of BGS Systems, Inc. in 1998, Boole & Babbage, Inc. in 1999, Evity, Inc. in 2000, Marimba, Inc. in 2004 and BladeLogic, Inc. in 2008. With the exception of the BladeLogic, Inc. 2007 Stock Option and Incentive Plan (the “BladeLogic 2007 Plan”), no future awards will be issued under the Assumed Plans, and such other Assumed Plans are not included in the table below. We intend to issue new awards from the BladeLogic 2007 Plan in the future, and accordingly the table below includes information regarding such plan.
| Plan Category |
Number of Shares of Common Stock to be Issued upon Exercise of Outstanding Options and RSUs (#) |
Weighted-Average Exercise Price of Outstanding Options ($) |
Number of Shares of Common Stock Remaining Available for Future Issuance Under Equity Compensation Plans (Excluding Shares of Common Stock Reflected in Column (a)) (#) |
|||||||||
| (a)(3) | (b)(4) | (c) | ||||||||||
| Equity compensation plans approved by |
10,378,886 | 30.67 | 12,715,066 | (5) | ||||||||
| Equity compensation plans not approved by security holders(2) |
314,220 | 29.75 | 239,866 | |||||||||
| Total |
10,693,106 | 30.58 | 12,954,932 | |||||||||
| (1) | Includes our 1994 Employee Incentive Plan, 2002 Nonemployee Director Stock Option Plan, 2002 Employee Incentive Plan and 2007 Incentive Plan. No further awards may be granted under our 1994 Employee Incentive Plan, 2002 Nonemployee Director Stock Option Plan or 2002 Employee Incentive Plan. |
| (2) | Our 2000 Employee Stock Incentive Plan and our assumption of the BladeLogic 2007 Plan have not been approved by our stockholders. The material provisions of these plans are described below. |
| (3) | Does not include options to purchase an aggregate of 7,306 shares of Common Stock at a weighted-average exercise price of $4.20 outstanding as of March 31, 2013 under the Assumed Plans other than the BladeLogic 2007 Plan. Includes 7,374,136 shares issuable in respect of outstanding RSUs under stockholder approved plans. |
| (4) | Weighted average price of outstanding options only, excluding the impact of RSUs. |
| (5) | Includes 6,000,000 shares of Common Stock available for issuance pursuant to our 2013 Employee Stock Purchase Plan. |
Material Features of Plans Not Approved by Stockholders
2000 Employee Stock Incentive Plan
Our 2000 Employee Stock Incentive Plan was adopted by the Board to enable us to recruit, retain and motivate our non-executive employees with equity-based incentives, primarily employee stock options. This plan expired for new awards in 2010. Our employees and consultants were eligible to receive grants under this plan, and the plan is administered by our Compensation Committee. We have not granted any awards to our executive officers under this plan. As of March 31, 2013, options to purchase 306,024 shares of Common Stock were outstanding under the plan and no shares of Common Stock remained available for awards under the plan. The exercise price per share of Common Stock for options granted under the plan is determined by the Compensation Committee; provided, that the exercise price is not less than the fair market value of shares of Common Stock at the date the option is granted. The term of each stock option is specified by the Compensation Committee. In general, in the event of a change in control, the Compensation Committee will take one or more of the following four actions (which actions may vary among holders): accelerate the vesting of all outstanding and unexercised options; require the surrender of outstanding options and pay the holders of such options the difference between the change in control value and the exercise price of such options; make such adjustments to outstanding options as the Compensation Committee deems appropriate to reflect the change in control event; or provide that outstanding options shall be converted into options to receive shares of stock or securities or property to which the holder would have been entitled, pursuant to the terms of the change in control event (merger, sale of assets or otherwise), if immediately prior to such change in control event the holder had been a stockholder.
40
Table of Contents
BladeLogic, Inc. 2007 Stock Option and Incentive Plan
In connection with our acquisition of BladeLogic, our Board approved our assumption of the BladeLogic 2007 Plan. We intend to make future awards of various equity-based incentives under such plan to those officers, employees, directors and key persons previously employed by and associated with BladeLogic. Accordingly, we have assumed the outstanding awards under the BladeLogic 2007 Plan as of the acquisition and have the authority to make additional grants thereunder, except that the rules of the NASDAQ provide that we may not grant awards under the BladeLogic 2007 Plan to any person who was employed by BMC (rather than BladeLogic) at the time of the acquisition. As of March 31, 2013, a total of 8,196 shares of our Common Stock are reserved for future issuance pursuant to outstanding awards under the BladeLogic 2007 Plan, all of which are reserved for issuance upon exercise of outstanding options, with 239,866 shares available for future awards. Further, in general, shares subject to awards that are forfeited, cancelled or settled without the issuance of shares, or that are held back upon exercise to satisfy the exercise price of an option or tax withholding obligation upon settlement of an award under this plan also will be available for future awards. This plan is administered by our Compensation Committee. The exercise price of options and stock appreciation rights awarded under this plan is determined by the administrator; provided, that the exercise price is not less than the fair market value of Common Stock on the date of grant of the option or stock appreciation right. The term of each option may not exceed ten years from the date of grant. Restricted stock, RSUs and unrestricted stock awards may also be granted under this plan, subject to the administrator’s discretion regarding vesting conditions and restrictions, as well as performance shares, cash-based awards and dividend equivalent rights. In the event of a merger, sale of assets or dissolution, or a similar “sale event” in which all awards are not assumed or substituted by the successor entity, all options and stock appreciation rights that are unexercisable immediately prior to such event and all other unvested awards will terminate upon the effective time of such sale event following an exercise period for outstanding options and stock appreciation rights, unless such awards are assumed or continued by the successor entity. Other than in the event of a necessary adjustment in connection with a change in our Common Stock or a merger or similar transaction, the administrator may not “reprice” or otherwise reduce the exercise price of outstanding stock options.
41
Table of Contents
SECURITY OWNERSHIP OF CERTAIN BENEFICIAL OWNERS AND MANAGEMENT
The following table sets forth certain information regarding the beneficial ownership of our common stock as of July 25, 2013 with respect to:
| • | Each person known by us to own beneficially greater than 5% of the outstanding shares of our common stock; |
| • | Each member of our board and each named executive officer; and |
| • | The members of our board and our executive officers as a group. |
Unless otherwise noted below, the address of each beneficial owner listed in the table below is 2101 CityWest Blvd., Houston, TX 77042.
We have determined beneficial ownership in accordance with the rules of the SEC. Except as indicated by the footnotes below, we believe, based on the information furnished to us, that the persons and entities named in the table below have sole voting and investment power with respect to all shares of common stock that they beneficially own, subject to applicable community property laws.
Applicable percentage ownership is based on 144,039,332 shares of common stock outstanding on July 25, 2013. In computing the number of shares of common stock beneficially owned by a person and the percentage ownership of that person, we deemed outstanding shares of common stock subject to options held by that person that are currently exercisable or exercisable within 60 days of July 25, 2013. We did not deem these shares outstanding, however, for the purpose of computing the percentage ownership of any other person.
| Name and Address of Beneficial Owner |
Common Stock Beneficially Owned |
Percent of Class |
||||||
| 5% Stockholders: |
||||||||
| Elliott (1) 40 West 57th Street New York, NY 10019 |
13,697,300 | 9.5 | % | |||||
| Dodge & Cox (2) 555 California Street, 40th Floor San Francisco, CA 94104 |
12,687,878 | 8.8 | % | |||||
| The Vanguard Group, Inc.(3) 100 Vanguard Blvd. Malvern, PA 19355 |
9,242,657 | 6.4 | % | |||||
| BlackRock, Inc.(4) 55 East 52nd Street New York, NY 10055 |
7,901,692 | 5.5 | % | |||||
| Merion Investment Management LP (5) 280 King of Prussia Rd. Radnor, PA 19087 |
7,629,100 | 5.3 | % | |||||
42
Table of Contents
| Directors and Named Executive Officers |
Shares Owned |
Shares Covered by Exercisable Options (6) |
Total Beneficial Ownership |
Percent of Common Stock |
||||||||||||
| Jon E. Barfield |
18,534 | 30,000 | 48,534 | * | ||||||||||||
| Robert E. Beauchamp |
493,041 | 526,000 | 1,019,041 | * | ||||||||||||
| Gary L. Bloom |
29,315 | (7) | 57,500 | 86,815 | * | |||||||||||
| John M. Dillon |
7,383 | — | 7,383 | * | ||||||||||||
| Meldon K. Gafner |
49,215 | 60,000 | 109,215 | * | ||||||||||||
| Mark J. Hawkins |
22,085 | — | 22,085 | * | ||||||||||||
| Stephan A. James |
24,912 | — | 24,912 | * | ||||||||||||
| P. Thomas Jenkins |
20,730 | 90,000 | 110,730 | * | ||||||||||||
| Louis J. Lavigne, Jr. |
29,215 | (8) | 47,500 | 76,715 | * | |||||||||||
| Kathleen A. O’Neil |
51,480 | 150,000 | 201,480 | * | ||||||||||||
| Alex Pinchev |
5,694 | — | 5,694 | * | ||||||||||||
| Carl James Schaper |
7,383 | — | 7,383 | * | ||||||||||||
| Tom C. Tinsley |
7,383 | — | 7,383 | * | ||||||||||||
| Kia Behnia |
17,911 | 29,375 | 47,286 | * | ||||||||||||
| Paul Avenant |
— | 7,813 | 7,813 | * | ||||||||||||
| William D. Miller |
— | 40,334 | 40,334 | * | ||||||||||||
| Stephen B. Solcher |
45,266 | 44,286 | 89,552 | * | ||||||||||||
| All directors and executive officers as a group (24 persons) |
928,506 | 1,181,392 | 2,109,898 | 1.5 | % | |||||||||||
| * | Represents less than one percent. |
| (1) | Information is based solely upon a Schedule 13D/A filed by Elliott Associates, L.P., Elliott International, L.P. and Elliott International Capital Advisors Inc. on May 6, 2013 which reported that Elliott Associates, L.P. has sole voting power and sole dispositive power with respect to 4,803,809 shares and Elliott International, L.P. and Elliott International Capital Advisors Inc. each have shared voting power and shared dispositive power with respect to 8,893,491 shares. |
| (2) | Information is based solely upon a Schedule 13G/A filed by Dodge & Cox on February 13, 2013, which reported that Dodge & Cox has sole voting power with respect to 11,875,878 shares and sole dispositive power with respect to 12,687,878 shares. |
| (3) | Information is based solely upon a Schedule 13G/A filed by The Vanguard Group, Inc. on February 11, 2013, which reported that The Vanguard Group, Inc. has sole voting power with respect to 267,762 shares, sole dispositive power with respect to 8,991,579 shares and shared dispositive power with respect to 251,078 shares. |
| (4) | Information is based solely upon a Schedule 13G/A filed by BlackRock, Inc. on February 8, 2013, which reported that BlackRock, Inc. has sole voting power and sole dispositive power with respect to 7,901,692 shares. |
| (5) | Information is based solely upon a Schedule 13G/A filed by Merion Investment Management LP on July 22, 2013, which reported that Merion Investment Management LP has shared voting power and shared dispositive power with respect to 7,629,100 shares. |
| (6) | These are shares that may be acquired upon exercise of stock options which were exercisable as of July 25, 2013. |
| (7) | Includes 100 shares held in the name of The Bloom Family Trust. |
| (8) | Includes 12,136 shares held by the Louis J. Lavigne, Jr. Survivors Trust and 4,242 shares held by the Rachel J. Lavigne Exempt Bypass Trust. |
| Item 13. | Certain Relationships and Related Transactions, and Director Independence |
Related Person Transactions and Procedures
The Governance Committee is responsible for the review, approval or ratification of “related person transactions” between us or our subsidiaries and related persons. Under SEC rules, a “related person” is a director, executive officer, nominee for director or 5% stockholder of the Company since the beginning of the last fiscal year and their immediate family members. We have adopted written policies and procedures that apply to any transaction or series of transactions in which we or a subsidiary are a participant and a related person has a direct or indirect interest. The Governance Committee will determine, in its discretion, whether to approve or disapprove of a related person transaction. In determining whether to approve or ratify a related person transaction, the Governance Committee will take into account, among other factors it deems appropriate, whether the related person transaction is on terms no less favorable than terms generally available to an unaffiliated third party under the same or similar circumstances and the extent of the related person’s interest in the transaction. The Governance Committee has determined that, barring additional facts or circumstances, a related person does not have a direct or indirect interest in the following categories of transactions:
| • | compensation to executive officers determined by the Compensation Committee and independent members of the Board; |
43
Table of Contents
| • | compensation to directors determined by the Board; and |
| • | transactions in which all security holders receive proportional benefits. |
In fiscal 2013, there were no related person transactions requiring disclosure.
Independence of Directors
As required by the NASDAQ listing standards, a majority of the members of our Board must qualify as “independent,” as affirmatively determined by our Board. Our Corporate Governance Guidelines impose additional independence criteria and state that membership on our Board will be predominantly non-employee directors who, at a minimum, meet the criteria for independence required by the NASDAQ. Based on a review of their professional and personal affiliations, the Board has determined that each of the directors, except for Mr. Beauchamp who is our President and Chief Executive Officer, are independent directors, as defined in the applicable rules for NASDAQ-listed companies and the additional standards set forth in our Corporate Governance Guidelines. In determining Mr. Jenkins’ independence, the Board considered Mr. Jenkins’ position as Chief Strategy Officer for Open Text Corporation, a company with which we have a business relationship. As a result of acquisitions of companies made by each of us and Open Text, we have both inherited a pre-existing business relationship which has resulted in BMC Software licensing software from Open Text for use in certain of our products and paying royalties to Open Text of approximately $630,000 in fiscal 2013. This business relationship was established in the ordinary course of business on an arms-length basis without the involvement of Mr. Jenkins and is not material to either Open Text or us. Mr. Jenkins does not have a direct or indirect interest in such business relationship.
| ITEM 14. | Principal Accountant Fees and Services |
Approval Policies and Procedures of Our Audit Committee
The Audit Committee of the Board is directly responsible for the appointment, compensation, retention and oversight of the independent registered public accounting firm retained to audit our financial statements. Ernst & Young LLP (“Ernst & Young”) has been retained as our independent registered public accounting firm continuously since fiscal 2002. The Audit Committee oversees the compensation of our engagement of Ernst & Young and approves all audit and non-audit fees paid by us to Ernst & Young. In order to assure continuing auditor independence, the Audit Committee periodically considers and reviews whether it is appropriate to adopt a policy of rotating the independent auditing firm. In addition, the Audit Committee ensures the regular rotation of the audit partners as required by law and interviews candidates for lead audit partner as part of such rotation process.
The charter of the Audit Committee provides that the committee is responsible for the pre-approval of all audit and permitted non-audit services to be performed by the independent registered public accounting firm, subject to the requirements of applicable law and the rules and regulations of the SEC and the Public Company Accounting Oversight Board (the “PCAOB”). In accordance with its charter, the Audit Committee may delegate the authority to grant such pre-approvals to the committee chair, which approvals would then be reviewed by the full committee at its next regular meeting. Typically, however, the Audit Committee itself reviews the matters to be approved. The procedures for pre-approving all audit and non-audit services provided by the independent registered public accounting firm include the Audit Committee reviewing a budget for audit services, audit-related services, tax services and other services. The budget includes a description of, and a budgeted amount for, particular categories of audit and non-audit services that are anticipated at the time the budget is submitted. Audit Committee approval is required to exceed the budgeted amount for a particular category of audit or non-audit services or to engage the independent registered public accounting firm for any services not included in the initial pre-approval. The Audit Committee periodically monitors the services rendered by and actual fees paid to the independent registered public accounting firm to ensure that such services are within the parameters approved by the Audit Committee. In its review and pre-approval of non-audit services, the Audit Committee considers, among other factors, the possible effect of the performance of such services on Ernst & Young’s independence.
To avoid potential conflicts of interest and to maintain auditor independence, SEC and PCAOB rules and regulations prohibit a publicly traded company from obtaining certain non-audit services from its independent registered public accountants. The Audit Committee does not pre-approve, and we do not obtain, any of those prohibited services from Ernst & Young. The Audit Committee does not delegate to management its responsibilities to pre-approve services performed by the independent registered public accountants.
44
Table of Contents
Fees Paid to Ernst & Young
The following table shows the fees for audit, audit-related, tax and other services provided by Ernst & Young for fiscal years 2013 and 2012, all of which were approved by the Audit Committee:
| 2013 | 2012 | |||||||
| ($ in thousands) | ||||||||
| Audit Fees |
4,700 | 4,500 | ||||||
| Audit-Related Fees |
— | — | ||||||
| Tax Fees |
1,700 | 500 | ||||||
| All Other Fees |
— | — | ||||||
|
|
|
|
|
|||||
| Total |
6,400 | 5,000 | ||||||
|
|
|
|
|
|||||
Audit Fees. Fees for audit services include fees associated with the annual audit and quarterly reviews of our consolidated financial statements, including the audit of the effectiveness of internal control over financial reporting, statutory audits required internationally, consents related to documents filed with the SEC and accounting and financial reporting consultations and research necessary to comply with generally accepted auditing standards.
Tax Fees. Fees for tax services include tax compliance and tax advice including, but not limited to, international tax compliance and advice, federal and state tax advice, mergers and acquisitions tax advice and assistance with the preparation of foreign tax returns, exclusive of tax services rendered in connection with the audit and quarterly reviews.
45
Table of Contents
REPORT OF THE AUDIT COMMITTEE OF THE BOARD
The Audit Committee of the Board is composed of independent directors as defined by the listing standards of NASDAQ and the rules of the SEC. In addition, the Board has determined that each member of the Audit Committee is an “audit committee financial expert” as defined by the rules of the SEC. The Audit Committee operates under a written charter adopted and approved by the Board, a copy of which is available on our website at http://investors.bmc.com.
The purpose of the Audit Committee is to assist the Board in fulfilling its responsibility to oversee (i) the quality and integrity of our financial statements and the processes that produce them, (ii) our compliance with legal and regulatory requirements, (iii) the quality and integrity of our risk management process, and (iv) the qualifications and independence of the independent registered public accountants. The Audit Committee also oversees the performance of BMC Software’s internal audit function. The Audit Committee has sole responsibility for the retention and termination of the independent registered public accountants. The Audit Committee members are not professional accountants or auditors, and their functions are not intended to duplicate or certify the activities of management and the independent auditors.
The Audit Committee has met and reviewed and discussed our audited financial statements as of and for the year ended March 31, 2013, with our management, which has the primary responsibility for our financial statements, as well as with our independent registered public accountants, Ernst & Young LLP, who are responsible for performing an independent audit of BMC Software’s consolidated financial statements in accordance with the auditing standards of the Public Company Accounting Oversight Board (United States) (“PCAOB”) and issuing a report thereon.
The Audit Committee has discussed with Ernst & Young LLP the matters required to be discussed by Statement on Auditing Standards No. 61, Communicating with Audit Committees, as amended, and as adopted by the PCAOB in Rule 3200T. The Audit Committee has received and reviewed the written disclosures from Ernst & Young LLP required by PCAOB Rule 3526, Communication with Audit Committees Concerning Independence, and has discussed with Ernst & Young LLP their independence. The Audit Committee also considered whether Ernst & Young LLP's non-audit services to us were compatible with their independence and concluded their independence was not compromised by the provision of such services.
Based on the reviews and discussions referred to above, the Audit Committee recommended to the Board that the audited financial statements referred to above be included in our Annual Report on Form 10-K for the year ended March 31, 2013, filed with the SEC.
Submitted by:
AUDIT COMMITTEE
Louis J. Lavigne, Jr., Chairman
Jon E. Barfield
Mark J. Hawkins
P. Thomas Jenkins
Kathleen A. O’Neil
46
Table of Contents
| Item 15. | Exhibits and Financial Statement Schedules |
(a) The following documents are filed as a part of this Report:
| 31.1 | Certification by the Chief Executive Officer pursuant to Section 302 of the Sarbanes-Oxley Act of 2002. | |
| 31.2 | Certification by the Chief Financial Officer pursuant to Section 302 of the Sarbanes-Oxley Act of 2002. | |
47
Table of Contents
SIGNATURES
Pursuant to the requirements of Section 13 or 15(d) of the Securities Exchange Act of 1934, the registrant has duly caused this report to be signed on its behalf by the undersigned, thereunto duly authorized, on July 26, 2013.
| BMC Software, Inc. | ||
| By: | /s/ CHRISTOPHER C. CHAFFIN | |
| Christopher C. Chaffin Vice President, Deputy General Counsel & Assistant Secretary | ||
48