Attached files
| file | filename |
|---|---|
| EX-99.1 - EX-99.1 - TEXAS CAPITAL BANCSHARES INC/TX | d573358dex991.htm |
| 8-K - FORM 8-K - TEXAS CAPITAL BANCSHARES INC/TX | d573358d8k.htm |
 TCBI Q2 2013
Earnings
Exhibit 99.2 |
 2
Certain matters discussed on this call may contain forward-looking
statements, which are subject to risks and uncertainties and are
based on Texas Capital’s current estimates or expectations of future events or future results. Texas
Capital is under no obligation, and expressly disclaims such
obligation, to update, alter or revise its forward-looking
statements, whether as a result of new information, future events or
otherwise. A number of factors, many of which are beyond Texas
Capital’s control, could cause actual results to differ materially from future results expressed or implied
by such forward-looking statements. These risks and uncertainties
include the risk of adverse impacts from general economic
conditions, competition, interest rate sensitivity and exposure to regulatory and legislative changes. These
and other factors that could cause results to differ materially from
those described in the forward-looking statements can be
found in the prospectus supplements, the Annual Report on Form 10-K and other filings made by Texas Capital
with the Securities and Exchange Commission
(SEC). |
 Opening Remarks
•
Strong continued core earnings growth, with increased provision as a
result of record growth in LHI
•
Required charge related to announced organizational change in
Q2-2013 •
Continued improvement in NPAs
•
Strong growth in deposits, specifically DDAs
•
LHS levels increased on a linked quarter basis; continuing to take
advantage of market demand with expectations for modest growth
for 2013 3 |
 Financial Review
Net Income and EPS
–
Decrease in net income and EPS compared to Q1-2013 and
Q2-2012, mainly as a result of the increased provision for
growth, $.06 full quarter of preferred stock dividend, and charge related to organizational
change
Operating Leverage, Core Earnings Power & NIM
–
Net Revenue
•
3% increase from Q1-2013
•
11% growth from Q2-2012
–
Exceptional growth in LHI average balances
•
Growth of 5% from Q1-2013
•
Growth of 20% from Q2-2012
–
Margin declined 8 bps from Q1-2013 to 4.19%
•
Strong LHI levels with favorable spreads; yields down only
slightly •
Improved funding profile at reduced cost from growth in DDA and total
deposits •
Increased levels in LHS with reduction in spreads, with strong growth
from Q2-2012 and above 2012 average; yields expected to
increase in Q3-2013 –
Increased provision for loan losses directly related to record
quarterly growth in LHI of $591 million –
$9.9 million of notable charges in non-interest expense in
Q2-13 •
$7.7
million
($0.12
per
share)
related
to
organizational
change,
most
related
to
future
performance
•
Assumptions about potential expense required to be estimated in
Q2-2013 •
$2.2 million related to probability of achieving performance targets
calculated using current stock price •
Highly variable and aligned with shareholder interests
4 |
 Financial Review
Loan Growth
–
Broad-based growth in LHI
•
Record quarterly growth of $591 million, or 9%, from Q1-2013
•
Period end balance $358 million over average balance for the
quarter •
Averages increased 5% from Q1-2013 and 20% from Q2-2012
–
Average LHS balances up 2% from Q1-2013 and 17% from
Q2-2012 Funding
–
Funding profile improved with exceptional DDA and total deposit
growth •
Average DDA increased 15% from Q1-2013 and 56% from
Q2-2012 •
Total average deposits increased 7% from Q1-2013 and 29% from
Q2-2012 –
LHS match funded with borrowings and deposits, producing excellent
spreads for highly liquid, short- duration earning
assets Credit Costs
–
Total credit costs of $7.4 million for Q2-2013
–
Favorable trend in NPA ratio with $6.3 million (11%) decrease from
Q1-13, including OREO reduction of $1.4 million (10%)
5
Results remained well above industry trends in mortgage origination
and warehouse •
Provision of $7.0 million compared to $2.0 million in Q1-2013,
with increase related to LHI growth OREO valuation cost of
$382,000 compared to $71,000 in Q1-2013 and $3.1 million in Q2-2012
NCOs of $2.4 million (13 bps) compared to $1.2 million (7 bps) in
Q1-2013 and 4 bps for Q2-2012 •
•
• |
 6
Review of Mortgage Finance
Highly profitable, sustainable business with favorable earning asset and
funding profile –
Strong position nationally with focus on large regional, privately
owned mortgage companies; consistent with middle market
position –
Asset generated characterized by exceptional yield, asset quality,
liquidity and risk profile –
Increased market share, now benefitting from focus on purchase money
mortgages –
Near perfect asset class in low rate environment with minimal
risk •
Reduction in yield and NIM, tracking national mortgage rates
•
Portfolio positioned to produce higher yields in Q3-2013
•
Excellent results from growth and operating leverage
–
$2.7 billion business (before participations); modest growth from
Q1-2013 and consistent with expectations and ahead of
average for 2012 –
Funding provided by $1.1 billion in deposits with balance supported by
borrowed funds LHS represents 25% of average total loans with
similar contribution to PTPP Income for YTD 2013 –
Return on allocated equity comparable to other lines of business
–
At 100% Risk Weight, Company allocating capital with after-tax
cost of <5% compared to ROIC >20% –
Contrast with ownership of securities compelling in terms of earnings
profile and long term risk characteristics
•
Lower NIM in current rate environment
•
No credit costs
•
Increased costs with employed approach but risk mitigated
•
Excellent operating leverage when volumes are high
|
 Income Statement -
Quarterly
7
(1) Excludes OREO valuation charge
Q2-13
Q1-13
Q4-12
Q3-12
Q2-12
Net interest income
$ 101,220
$ 98,042
$ 101,155
$ 96,855
$ 90,640
Non-interest income
11,128
11,281
12,836
10,552
10,462
Net revenue
112,348
109,323
113,991
107,407
101,102
Provision for credit losses
7,000
2,000
4,500
3,000
1,000
382
71
955
64
3,123
Total provision and OREO valuation
7,382
2,071
5,455
3,064
4,123
Non-interest expense
68,352
55,629
59,119
53,457
50,850
Income before income taxes
36,614
51,623
49,417
50,886
46,129
Income tax expense
12,542
18,479
17,982
18,316
16,506
Net income
24,072
33,144
31,435
32,570
29,623
Preferred stock dividends
2,438
81
–
–
–
Net income available to common shareholders
$ 21,634
$ 33,063
$ 31,435
$ 32,570
$ 29,623
Diluted EPS
$ .52
$ .80
$ .76
$ .80
$ .76
Net interest margin
4.19%
4.27%
4.27%
4.36%
4.49%
ROA
0.95%
1.38%
1.27%
1.40%
1.40%
ROE
9.94%
15.82%
15.35%
17.27%
18.08%
Efficiency
(1)
60.8%
50.9%
51.9%
49.8%
50.3%
OREO valuation and write-down expense |
 QTD Average Balances, Yields and Rates
8
(in thousands)
Q2 2013
Q1 2013
Q2 2012
Avg. Bal.
Yield Rate
Avg. Bal.
Yield Rate
Avg. Bal.
Yield Rate
Assets
Securities
$ 78,906
4.42%
$ 93,394
4.57%
$118,440
4.55%
Fed funds sold & liquidity investments
145,625
.20%
103,503
.23%
68,493
.31%
Loans held for sale
2,406,246
3.74%
2,362,646
3.89%
2,062,449
4.11%
Loans held for investment
7,152,323
4.71%
6,842,766
4.77%
5,950,913
4.95%
Total loans, net of reserve
9,483,563
4.50%
9,130,970
4.58%
7,941,583
4.78%
Total earning assets
9,708,094
4.44%
9,327,867
4.53%
8,128,516
4.73%
Total assets
$10,110,992
$9,729,559
$8,522,602
Liabilities
and
Stockholders’
Equity
Total interest bearing deposits
$ 5,130,200
.25%
$4,988,788
.26%
$4,388,120
.32%
Other borrowings
727,158
.20%
1,041,573
.17%
1,428,575
.21%
Subordinated notes
111,000
6.61%
111,000
6.68%
–
–
Long-term debt
113,406
2.24%
113,406
2.27%
113,406
2.44%
Total interest bearing liabilities
6,081,764
.40%
6,254,767
.40%
5,930,101
.33%
Demand deposits
2,914,341
2,529,927
1,864,456
Stockholders’
equity
1,023,279
854,327
658,969
Total
liabilities
and
stockholders’
equity
$10,110,992
.24%
$9,729,559
.26%
$8,522,602
.23%
Net interest margin
4.19%
4.27%
4.49% |
 Financial Summary
9
(in thousands)
QTD Averages
Q2 2013
Q1 2013
Q2 2012
Q2/Q1 %
Change
YOY %
Change
Total assets
$10,110,992
$9,729,559
$8,522,602
4%
19%
Loans held for investment
7,152,323
6,842,766
5,950,913
5%
20%
Loans held for sale
2,406,246
2,362,646
2,062,449
2%
17%
Total loans
9,558,569
9,205,412
8,013,362
4%
19%
Securities
78,906
93,394
118,440
(16)%
(33)%
Demand deposits
2,914,341
2,529,927
1,864,456
15%
56%
Total deposits
8,044,541
7,518,715
6,252,576
7%
29%
Stockholders’
equity
1,023,279
854,327
658,969
20%
55% |
 Financial Summary
10
(in thousands)
Period End
Q2 2013
Q1 2013
Q2 2012
Q2/Q1 %
Change
YOY %
Change
Total assets
$10,977,990
$10,020,565
$9,144,360
10%
20%
Loans held for investment
7,510,662
6,920,011
6,234,692
9%
20%
Loans held for sale
2,838,234
2,577,830
2,408,032
10%
18%
Total loans
10,348,896
9,497,841
8,642,724
9%
20%
Securities
75,861
87,527
114,964
(13)%
(34)%
Demand deposits
2,928,735
2,628,446
2,019,473
11%
45%
Total deposits
7,980,598
7,745,831
6,660,290
3%
20%
Stockholders’
equity
1,034,955
1,013,195
680,705
2%
52% |
 Revenue and Income Growth
($ in thousands)
11
Note:
Excludes OREO valuation charge for YTD 2013, 2012, 2011 and 2010. YTD
Q2 2013 data is annualized.
Operating Revenue CAGR: 23%
Net Interest
Income CAGR:
24%
Non-interest Income CAGR: 17%
Non-interest Expense CAGR: 20%
Net Income CAGR: 40%
$174,207
$225,951
$273,937
$335,169
$419,919
$443,342
109,651
137,733
154,985
181,403
212,961
247,904
0
50,000
100,000
150,000
200,000
250,000
300,000
350,000
400,000
450,000
500,000
2008
2009
2010
2011
2012
YTD Q2 2013
Non-interest Income
Net Interest Income
Non-interest Expense |
 12
EPS Growth
2008
2009^
2010
2011
2012
5 Year EPS CAGR: 27%
Q2-2013
^Excludes $.15 effect of preferred TARP dividend during 2009. Reported
EPS was $0.56. $0.89
$0.71
$1.00
$1.99
3.01
$1.31
$0.00
$0.50
$1.00
$1.50
$2.00
$2.50
$3.00
$3.50 |
 Deposit and Loan Growth
($ in millions)
13
$3,333
$4,121
$5,455
$5,556
$7,441
$7,981
$4,028
$4,457
$4,711
$5,572
$6,786
$7,511
0
1,000
2,000
3,000
4,000
5,000
6,000
7,000
8,000
9,000
2008
2009
2010
2011
2012
Q2 2013
Demand Deposits
Interest Bearing Deposits
Loans HFI
Demand Deposit CAGR: 43%
Total Deposit CAGR: 21%
Loans Held for Investment CAGR: 15% |
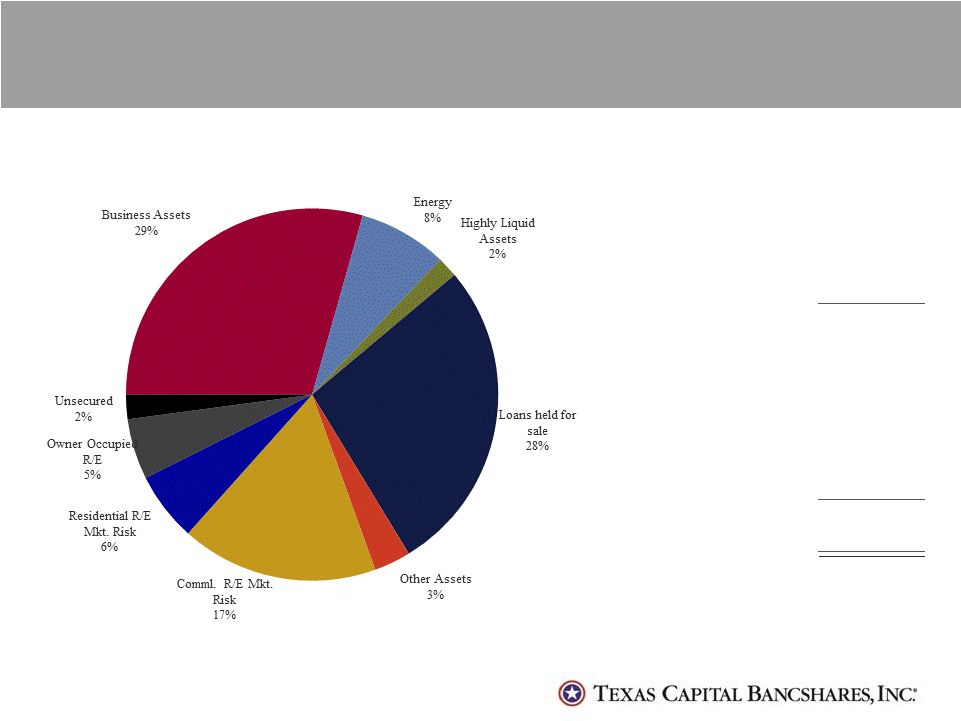 Loan Portfolio Statistics
14
Non-accrual loans
Commercial
$ 17,577
Construction
–
Real estate
20,799
Consumer
9
Equipment leases
65
Total non-accrual loans
$ 38,450
Non-accrual loans as % of
loans held for investment
.51%
Non-accrual loans as % of
total loans
.37%
OREO
13,053
Total Non-accruals +
OREO
$ 51,503
Non-accrual loans + OREO
as % of loans held for
investment + OREO
.68%
Total Loans $10,348,896
All numbers in thousands.
Loan Collateral by Type 6/30/13 |
 Credit Quality
Improved Credit Trends
–
Total credit cost of $7.4 million for Q2-2013, compared to $2.1
million in Q1-2013 and $4.1 million in Q2-2012
•
Provision of $7.0 million for Q2-2013 compared to $2.0 million for
Q1-2013 and $1.0 million in Q2-2012
•
Increase from Q1-2013 related to record growth, supported by
maintenance of exceptional metrics
•
NCOs $2.4 million (13 bps) in Q2-2013 compared to 7 bps in
Q1-2013 and 4 bps in Q2- 2012; NCO ratio of 10pbs for
YTD •
OREO valuation charge of $382,000 compared to $71,000 in Q1-2013
and $3.1 million in Q2-2012
–
NPA ratio continues to decline
•
Reduction of $6.3 million (11%) from Q1-2013 and $32.8 million
(39%) from Q2-2012 •
NPA ratio of .68% compared to .83% in Q1-2013 and 1.35% in
Q2-2012 •
NPLs at $38.5 million, down $4.9 million from Q1-2013 and down
$17.9 million from Q2-2012
•
NPL ratio at .37% of total loans and .51% of LHI
•
OREO reduction of $1.4 million (10%) from Q1-2013 and $14.8
million (53%) from Q2- 2012
15 |
 16
Credit Quality
Net Charge-offs / Average Loans
* Excludes loans held for sale.
Combined reserve /
Loans
*
1.11%
1.15%
1.31%
1.56%
1.59%
Non-accrual loans +
OREO to loans
*
+
OREO
.68%
1.06%
1.58%
3.25%
2.74%
Combined reserve to
non-accruals
2.1x
1.3x
1.3x
.6x
.7x
0.10%
0.10%
0.58%
1.14%
0.46%
0.00%
0.20%
0.40%
0.60%
0.80%
1.00%
1.20%
1.40%
2013
2012
2011
2010
2009 |
 Closing Comments
•
Strong
core
earnings
power,
profitability
and
growth
to
continue
in
2013
•
Credit continues positive trend
•
Strong LHI pipeline and new commitments present opportunity for growth
potential
•
LHS average balances to remain high with potential for modest growth
with increased market share and participation program
17 |
 Q&A
18 |