Attached files
| file | filename |
|---|---|
| EX-99.1 - EX-99.1 - OUTERWALL INC | d573550dex991.htm |
| 8-K - FORM 8-K - OUTERWALL INC | d573550d8k.htm |
Exhibit 99.2

Outerwall Inc. 2013 Second Quarter Earnings
Prepared Remarks from CEO J. Scott Di Valerio and CFO Galen C. Smith
July 25, 2013
Outerwall Inc. issued a press release today, July 25, 2013, announcing financial results for the 2013 second quarter ended June 30, 2013. These prepared remarks provide additional information related to the company’s 2013 second quarter operating and financial performance, acquisition of ecoATM and 2013 third quarter and full year guidance.
CEO J. Scott Di Valerio and CFO Galen C. Smith will host a conference call today at 2 p.m. PDT to answer questions related to the company’s business performance, financial results and guidance.
The Q2 press release, prepared remarks and conference call webcast are available on the Investor Relations section of Outerwall’s website at ir.outerwall.com.
Safe Harbor for Forward-Looking Statements
Certain statements in these prepared remarks are “forward-looking statements” within the meaning of the Private Securities Litigation Reform Act of 1995. The words “believe,” “estimate,” “expect,” “intend,” “anticipate,” “goals,” variations of such words, and similar expressions identify forward-looking statements, but their absence does not mean that the statement is not forward-looking. The forward-looking statements in this release include statements regarding Outerwall Inc.’s anticipated growth and future operating results, including 2013 second quarter and 2013 full year results. Forward-looking statements are not guarantees of future performance and actual results may vary materially from the results expressed or implied in such statements. Differences may result from actions taken by Outerwall Inc. and Redbox, as well as from risks and uncertainties beyond Outerwall Inc.‘s control. Such risks and uncertainties include, but are not limited to,
| • | competition from other digital entertainment providers, |
| • | the ability to achieve the strategic and financial objectives for our entry into a new business, |
| • | our limited ability to direct the management or policies of the new joint venture with Verizon Communications, |
| • | failure to receive the expected benefits of the NCR relationship, |
| • | the termination, non-renewal or renegotiation on materially adverse terms of our contracts with our significant retailers and suppliers, |
| • | payment of increased fees to retailers, suppliers and other third-party providers, including financial service providers, |
| • | the inability to receive delivery of DVDs on the date of their initial release to the general public, or shortly thereafter, or in sufficient quantity, for home entertainment viewing, |
| • | noteholders electing to convert our convertible notes, |
| • | the effective management of our content library, |
| • | the ability to attract new retailers, penetrate new markets and distribution channels and react to changing consumer demands, |
| • | the ability to adequately protect our intellectual property, and |
| • | the application of substantial federal, state, local and foreign laws and regulations specific to our business. |
The foregoing list of risks and uncertainties is illustrative, but by no means exhaustive. For more information on factors that may affect future performance, please review “Risk Factors” described in our most recent Annual Report on Form 10-K and any subsequent Quarterly Reports on Form 10-Q filed with the Securities and Exchange Commission. These forward-looking statements reflect Outerwall Inc.‘s expectations as of the date of these prepared remarks. Outerwall Inc. undertakes no obligation to update the information provided herein.
©2013 Outerwall Inc. All Rights Reserved. These materials may not be reproduced, altered or distributed without the express written consent of Outerwall Inc.
Outerwall Inc. 2013 Second Quarter Earnings
Prepared Remarks from CEO J. Scott Di Valerio and CFO Galen C. Smith
July 25, 2013
Use of Non-GAAP Financial Measures
Non-GAAP measures may be provided as a complement to results provided in accordance with United States generally accepted accounting principles (“GAAP”).
We use the following non-GAAP financial measures to evaluate our financial results:
| • | Core adjusted EBITDA; |
| • | Core diluted earnings per share (“EPS”); and |
| • | Free cash flow. |
These measures, the definitions of which are presented in Appendix A, are non-GAAP because they exclude certain amounts which are included in the most directly comparable measure calculated and presented in accordance with GAAP. Our non-GAAP financial measures are not meant to be considered in isolation or as a substitute for our GAAP financial measures and may not be comparable with similarly titled measures of other companies.
Core and Non-Core Results
We distinguish our core activities, those associated with our primary operations which we directly control, from non-core activities. Non-core activities are primarily nonrecurring events or events we do not directly control. Our non-core adjustments include i) acquisition costs primarily related to the NCR Asset Acquisition and acquisition of ecoATM, Inc., ii) a gain on the grant of a license to use certain Redbox trademarks to Redbox Instant™ by Verizon and iii) income or loss from equity method investments, which represents our share of income or loss from entities we do not consolidate or control (“Non-Core Adjustments”).
We believe investors should consider our core results because they are more indicative of our ongoing performance and trends, are more consistent with how management evaluates our operational results and trends, provide meaningful supplemental information to investors through the exclusion of certain expenses which are either non-recurring or may not be indicative of our directly controllable business operating results, allow for greater transparency in assessing our performance, help investors better analyze the results of our business and assist in forecasting future periods.
Additional information and reconciliations of the non-GAAP financial measures are included in Appendix A.
Page 2
©2013 Outerwall Inc. All Rights Reserved. These materials may not be reproduced, altered or distributed without the express written consent of Outerwall Inc.
Outerwall Inc. 2013 Second Quarter Earnings
Prepared Remarks from CEO J. Scott Di Valerio and CFO Galen C. Smith
July 25, 2013
Executing to Drive Profitable Growth
Q2 Highlights
| • | Q2 rentals grew 3.7% year over year in Q2 2013 after flat year over year rental growth in Q1 2013; growth was driven by Blu-ray rentals up 74.3% and video game rentals up 40.4% |
| • | We sold certain NCR kiosks through a wholly owned subsidiary which generated net cash proceeds of $11.8 million and a one-time tax benefit of $17.8 million |
| • | We repurchased $24.9 million of our common stock, bringing the year-to-date total to $71.4 million; we remain committed to a total of $100 million in share repurchases in 2013 |
| • | We retired a total of $86.6 million in face value of our September 2014 convertible notes through repurchases of $48.4 million and $38.2 million in conversions by investors leaving us with $53.7 million in face value outstanding |
| • | We changed the company name to Outerwall to capture the evolution of the company into multiple automated retail businesses and our focus on pushing out the walls of retail to deliver innovative solutions to consumers |
| • | After the end of the quarter, we closed the acquisition of ecoATM, which provides us with an opportunity for additional growth |
A summary of Outerwall Inc.’s consolidated results1 for the second quarter ended June 30, 2013, follows:
| Consolidated revenue |
$554.2 million | |||
| Net income |
$46.9 million | |||
| Core adjusted EBITDA2 |
$124.5 million | |||
| Diluted EPS |
$1.64 | |||
| Core diluted EPS2 |
$1.91 | |||
| Net cash provided by operating activities |
$29.6 million | |||
| Free cash flow2 |
$(5.9) million |
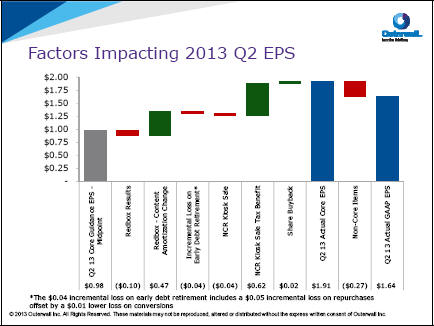
Several factors resulted in higher than expected EPS in Q2:
| • | During the quarter, we updated our method for amortizing content costs3 in the Redbox business, which led to a shifting of content costs that resulted in a pre-tax benefit of $21.7 million, equating to $0.47 of core diluted EPS for the quarter. This change was made to better align costs with revenue. |
1 In discussing financial results, the comparisons we make will be Q2 of 2013 versus Q2 of 2012, unless we state otherwise
2 Refer to Appendix A for a discussion of non-GAAP financial measures
3 For additional discussion, refer to Note 2 in our 10-Q for the period ended June 30, 2013
Page 3
©2013 Outerwall Inc. All Rights Reserved. These materials may not be reproduced, altered or distributed without the express written consent of Outerwall Inc.
Outerwall Inc. 2013 Second Quarter Earnings
Prepared Remarks from CEO J. Scott Di Valerio and CFO Galen C. Smith
July 25, 2013
| • | The impact of selling several thousand NCR kiosks through a wholly owned subsidiary which generated a tax benefit of $17.8 million benefitting core diluted EPS by $0.62. |
| • | Based on an updated purchase price allocation for the NCR acquisition and the costs associated with the sales of certain of these kiosks, we recognized a $1.9 million loss during the quarter including costs associated with the sale, translating into a negative $0.04 impact on core diluted EPS for the quarter. We expect to offset this loss in future quarters when the sale of additional kiosks close. |
| • | As a result of the repurchase of $48.4 million in face value of our 4% Senior Convertible Notes (“Convertible Notes”), we recorded an incremental loss of $2.2 million related to the early extinguishment of debt, which translates to approximately $0.05 of core diluted EPS. The total loss for early extinguishment of debt was $4.0 million this quarter. |
In Q2 the company had negative free cash flow (FCF) of $5.9 million, which reflects the impact of several working capital items including cash tax payments of $44.2 million, a reduction in accounts payable of $41.0 million due to timing between quarters and reflective of seasonality, along with $4.0 million of incremental interest expense associated with early retirement of our convertible notes. The forecast for the remainder of 2013 reflects increased revenue and EBITDA contributing to further increased cash flow.
Company name change to Outerwall
Over the past two decades, the company has evolved from a single product coin-counting business to a multi-faceted automated retail company. To recognize this evolution and provide a corporate umbrella
Page 4
©2013 Outerwall Inc. All Rights Reserved. These materials may not be reproduced, altered or distributed without the express written consent of Outerwall Inc.
Outerwall Inc. 2013 Second Quarter Earnings
Prepared Remarks from CEO J. Scott Di Valerio and CFO Galen C. Smith
July 25, 2013
brand broad enough to encompass our growing portfolio of products, we changed our name to Outerwall in June. We celebrated our new name, brand and logo by ringing the Opening Bell at NASDAQ on July 2, our first day of trading under the symbol OUTR.
As the Outerwall name suggests, we’re innovating beyond the traditional walls of retail to bring consumers new solutions. Our vision for Outerwall is to be a leader in the retail industry by delivering inventive products and services that create a better everyday for consumers and bring value to retailers, investors and employees.
Capital expenditures
We discuss our capital expenditures (CAPEX) on an accrual basis rather than a cash basis; we believe this better aligns the reported CAPEX to activities during the quarter driving the expenditures. In Q2 our total investment in CAPEX was $32.3 million, reflecting our focus on deploying capital to drive returns.
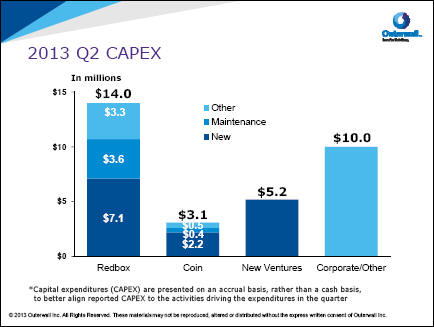
In Q2 Redbox continued to focus on maximizing productivity through optimizing the kiosk network. Redbox installed approximately 220 gross new kiosks and removed approximately 550 kiosks, not including the final 300 NCR kiosks that were removed during the quarter. In addition, we accelerated our Vertical Merchandising Zone (VMZ) retrofits and completed 20,000 by the end of the quarter. We continued new installations in Canada with 140 kiosks added in Q2, bringing the total to 500. The net result was negative 190 net new kiosk installations. As we continue to evaluate location performance, we may have additional quarters with negative net installs due to timing of redeployments. The kiosk CAPEX
Page 5
©2013 Outerwall Inc. All Rights Reserved. These materials may not be reproduced, altered or distributed without the express written consent of Outerwall Inc.
Outerwall Inc. 2013 Second Quarter Earnings
Prepared Remarks from CEO J. Scott Di Valerio and CFO Galen C. Smith
July 25, 2013
number for Redbox includes Canadian kiosks purchased during the quarter that will be installed in Q3 and beyond. Redbox also invested in office equipment and internal software projects (“Other” in the table above).
At our Coinstar line of business, which we formerly referred to as Coin, we had 100 net new installations in Q2, primarily related to TD Canada Trust-branded kiosks installed in Canada and U.S. grand openings and fill-in locations. Coinstar “New” CAPEX also includes certain kiosk component upgrades and software development expenses, as well as purchases of Coinstar and gift card exchange business kiosks to be installed in future quarters. “Other” includes vehicle leases under capital leases.
The New Ventures “New” CAPEX includes approximately 120 net new kiosk installs, the majority related to our Rubi™ coffee business, plus related parts, which we purchase in advance of manufacturing for continued expansion of Rubi installs in Q3.
Corporate CAPEX, which primarily includes investments in software and hardware, data centers, and our Enterprise Resource Planning (“ERP”) system to support our businesses, totaled $10 million for the quarter.
Additional Q2 consolidated metrics
Total net interest expense for Q2 was $12.0 million including $1.7 million of non-cash interest expense and approximately $4.0 million related to the loss from early extinguishment of Convertible Notes. We had $5.3 million in incremental interest expense, or approximately $0.12 per diluted share, from our new 6.000% Senior Unsecured Notes (the “Notes”) offering, which we completed in Q1.
The effective tax rate was 1.8% for Q2 compared with 40.2% in Q2 2012. The one-time significant decrease in effective tax rate was driven primarily by the tax benefit created by the sale of a wholly owned subsidiary with certain NCR kiosks.
Our balance sheet continues to be strong with $380.2 million of cash and cash equivalents and short term investments, including $95.8 million, which is cash owed to our retail partners in relation to our Coinstar coin-counting kiosks.
We ended the quarter with $556.9 million in face value of total outstanding debt, a gross debt to core adjusted EBITDA ratio of 1.2x, and a net debt to core adjusted EBITDA ratio of 0.4x, without adjustments.
Page 6
©2013 Outerwall Inc. All Rights Reserved. These materials may not be reproduced, altered or distributed without the express written consent of Outerwall Inc.
Outerwall Inc. 2013 Second Quarter Earnings
Prepared Remarks from CEO J. Scott Di Valerio and CFO Galen C. Smith
July 25, 2013
Share repurchase
In Q2 we repurchased $24.9 million of Coinstar common stock on the open market representing approximately 450,000 shares at an average price of $55.66. At the end of Q2, there was $322.8 million remaining under the Board’s aggregate stock repurchase authorization.
We continue to target the repurchase of a total of $100 million of shares in 2013 and will evaluate the level based on our financial performance and overall free cash flow generation. We consider stock buybacks an important component of our capital allocation strategy and intend to continue to be opportunistic in purchasing our shares at attractive price levels going forward.
Convertible Notes
During Q2 we retired $86.6 million in face value of our Convertible Notes through repurchases of $48.4 million and $38.2 million in conversions by investors for $107.1 million, excluding accrued interest, in cash and the issuance of approximately 255,500 shares of common stock. The total loss from early extinguishment of these notes was approximately $4.0 million, or approximately $0.09 of core diluted EPS, for the quarter, which was not included in our guidance. At the end of Q2, the aggregate outstanding principle of our Convertible Notes was $53.7 million.
Outerwall common stock traded above $52.38, 130% of the conversion price of $40.29, for at least 20 trading days during the 30 consecutive days prior to the end of Q2. As a result, our Convertible Notes are convertible in Q3. If noteholders elect to convert, we will be required to pay them the full face value of the Convertible Note in cash and deliver shares to cover any excess conversion value. Given that the notes are convertible, they are classified as a current liability and the debt conversion feature is classified as temporary equity on our balance sheet.
Redbox
Q2 showed areas of strong underlying fundamentals as total unique cards renting in the quarter were in line with Q1 2013 at approximately 41 million despite entering a seasonally weaker period. Furthermore, Blu-ray continued to show strong growth, setting record levels for revenue, rentals and percentage of rental mix. The combination of these factors helped us grow our market share to over 50% for the first time in company history.
Redbox segment operating results
Rentals grew 3.7% in Q2, driven primarily by continued strong performance of Blu-ray and video games, which posted year over year rental growth of 74.3% and 40.4%, respectively. Additionally, total unique credit cards renting in the quarter grew 6.9% year over year. The resulting 186.7 million rentals generated
Page 7
©2013 Outerwall Inc. All Rights Reserved. These materials may not be reproduced, altered or distributed without the express written consent of Outerwall Inc.
Outerwall Inc. 2013 Second Quarter Earnings
Prepared Remarks from CEO J. Scott Di Valerio and CFO Galen C. Smith
July 25, 2013
$478.5 million in revenue, which was up 4.5% compared with Q2 2012. We are encouraged by the rental growth in the quarter, but rental activity was below expectations due to weaker performance from several titles including The Hobbit, Les Miserables, Gangster Squad, Red Dawn, and Mama. Despite these challenges, momentum built toward end of the quarter to help set up a stronger Q3, and June ended as the third highest rental month in company history, trailing only December 2012 and March 2013.
Although we were successful in shifting our mix towards higher priced Blu-ray and video game rentals to drive higher value per rental, strong consumer response to promotional activity and a continued high percentage of one night rentals resulted in lower than expected net revenue per rental, or average check, of $2.56, translating into a $7.6 million impact on revenue in the quarter. At the same time, we are encouraged that customers continue to engage with our promotions. The ability to leverage our expanding addressable customer base through our marketable email list and SMS subscribers, which respectively grew 28% and 41% year over year, provides a solid foundation to continue driving increased rentals and revenue as we prepare to launch our campaign management and loyalty programs in the second half of the year.
Product margin for Q2 was 60.2%, helped by the $21.7 million benefit to content costs resulting from the change in our estimation of amortization explained above. Excluding the effect of the amortization change, product margin for Q2 would have been 55.7% compared with 59.2% in Q2 2012. The lower margin rate is primarily driven by higher costs associated with the Warner licensing agreement signed in October 2012 versus being in workaround during Q2 2012 as well as a continued shift to Blu-ray.
Same store sales improved from last quarter to negative 6.8%, up 5 percentage points from Q1 2013. The year over year decline was due primarily to an increase in single night and discounted rentals and an overall weaker box office during the quarter, as well as cannibalization of rentals as we installed over 5,200 new kiosks during the second half of 2012. Partially offsetting this was substantial growth in Blu-ray and video game rentals, up a combined 68.7%. We expect to see improving same store sales in the second half of 2013 as some of the converted installs begin contributing to comps in Q3 and product strength compares more favorably year over year.
During Q2 Redbox completed the removal of the last 300 NCR kiosks acquired in June 2012. The NCR kiosks made a negligible contribution to revenue in Q2. Redbox also sold several thousand NCR kiosks to buyers outside of the U.S. during the quarter, which led to a net cash inflow of $11.8 million. We have agreements to sell additional kiosks and will continue working to monetize as many of the remaining kiosks as possible. The transaction resulted in a one-time tax benefit that generated a diluted EPS benefit of $0.62 for Q2. The actual cash tax savings will occur over the coming years.
Page 8
©2013 Outerwall Inc. All Rights Reserved. These materials may not be reproduced, altered or distributed without the express written consent of Outerwall Inc.
Outerwall Inc. 2013 Second Quarter Earnings
Prepared Remarks from CEO J. Scott Di Valerio and CFO Galen C. Smith
July 25, 2013
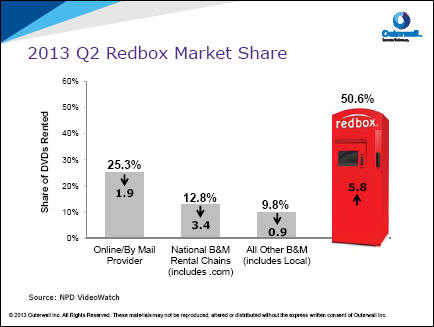
Market share gains
Redbox continued to gain share of the physical rental market in Q2. In May, for the first time in company history, Redbox exceeded 50% market share. For the quarter, market share was 50.6%, up 5.8 share points compared with Q2 last year and 2.7 share points compared with Q1 2013. Our year over year share growth came largely at the expense of By Mail and Brick and Mortar providers, and we believe there is opportunity for meaningful share growth through 2013 and beyond.
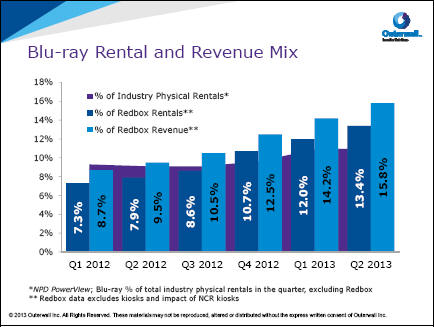
Blu-ray key driver of rentals and revenue
Blu-ray performance continues to be strong, growing 74% year over year. Blu-ray represented over 13% of rental volume in Q2, up 1.3 points sequentially. It also represented 15.6% of revenue. Strong Blu-ray performance was driven by continued growth in demand across genres. Top performing titles in the quarter included Jack Reacher, Django Unchained, Life of Pi, and Silver Linings Playbook. We also saw strong performance from late Q2 releases including Hansel and Gretel: Witch Hunters, Oz the Great and Powerful, and Snitch. Q1 releases such as Lincoln and Argo also continue to perform well.
Blu-ray remains a key focus for future growth as we continue to increase the rental mix of Blu-ray in 2013, shifting rentals to this higher revenue and higher margin dollar format.
Page 9
©2013 Outerwall Inc. All Rights Reserved. These materials may not be reproduced, altered or distributed without the express written consent of Outerwall Inc.
Outerwall Inc. 2013 Second Quarter Earnings
Prepared Remarks from CEO J. Scott Di Valerio and CFO Galen C. Smith
July 25, 2013
Continued strong video games performance
Video games continued to perform well in Q2, accounting for 4.7% of revenue and 2.1% of rentals. The 40% year over year growth in rental volume was driven by improved product mix assortment and continued marketing that is driving both new customers and improved retention. Additionally, a strong release slate in March, which included key titles such as Tomb Raider; God of War: Ascension; Gears of War: Judgment; and BioShock Infinite helped drive Q2 performance. We continue to see strong growth opportunities in the video games market and have gained support from publishers through joint marketing programs and consumer engagement.
Update on Redbox 2013 initiatives
Customer Strategy: As we have previously discussed, we believe that a key to our continued success will be growing customer engagement and increasing revenue per customer. We are particularly focused on the high frequency renters. We’ve made investments to support our customer strategy, including marketing campaign management, improved consumer data, and expanded consumer insight capabilities. We have already begun to see an incremental response from customers in the early testing of our enhanced marketing touch-points and online engagement strategies, which are focused on driving customer frequency and retention. Through the end of Q2 2013, we have grown our email and SMS lists by 28% and 41%, respectively, over Q2 2012. The growth in these lists provides an opportunity to further leverage our CRM and Redbox Loyalty programs as they begin to rollout in Q3 2013. For instance, improved title recommendations in the Friday spotlight email have improved the incremental revenue per opened message by 1%-3%. We expect this lift to continue to improve as we refine the model.
Page 10
©2013 Outerwall Inc. All Rights Reserved. These materials may not be reproduced, altered or distributed without the express written consent of Outerwall Inc.
Outerwall Inc. 2013 Second Quarter Earnings
Prepared Remarks from CEO J. Scott Di Valerio and CFO Galen C. Smith
July 25, 2013
While high frequency renters are the strategic focus of the Redbox Loyalty program, we have several key marketing/customer programs focused on our full customer base. Our existing major marketing efforts like Email, SMS, partner promotions, and at kiosk promotions like In-Cart continue to be focused on the full customer base. Our CRM system will serve to augment this to help us grow revenue per customer across the full customer base. We are launching a marketing campaign in the second half dedicated to converting active customers into online renters. Converting the average Redbox customer into an online renter can increase annual revenue per customer by upwards of 40%. We are also continuing to focus on converting DVD renters into Blu-ray renters, which can boost the average customer’s annual revenue by 50%.
Redbox Instant™ by Verizon: Redbox Instant by Verizon (RBI) continues to see positive results, with a steady increase in customer acquisition levels. In Q2 alone, they announced strategic partnerships with Roku and Sony expanding the availability of the service to millions of new streaming and gaming devices later this year. RBI also continues to see advancements in product performance. With regard to subscribers, RBI has found a market of customers eagerly taking advantage of credits at the kiosk and streaming. Redbox Instant is working across its partners to execute a number of initiatives, and Redbox will begin activating programs to promote the service to their customer base and at the kiosks.
Vertical Merchandising Zone Enhancement (VMZ): VMZ is a kiosk retrofit that will be installed on approximately 90% of all kiosks. This enhancement increases our capacity per kiosk by more than 80 slots and enables us to provide a greater selection of titles to customers. The initial phase of our conversion is on schedule with approximately 20,000 kiosks retrofitted through the end of June, and we are on track to complete the project in the early part of Q4 2013. As expected, initial machines with VMZ have demonstrated positive results with increased title breadth and depth resulting in a lift in customers transacting.
Canada: The install plans for our Canadian rollout have been significantly hampered by both the timing of negotiations with several high profile retailers and the actual deployment of kiosks once contracts have been signed. Significant consolidation is occurring within the grocery channel in Canada, with two major deals being announced — Loblaws’ acquisition of Shoppers Drug Mart and Sobeys’ acquisition of Safeway Canada. While we view the overall consolidation as an opportunity for the company’s automated retail portfolio as well as Redbox in the longer term, in the near term it delayed our rollout plans. As a result, we expect to install 500–1,000 kiosks this year. This change in the timing and number of installs has reduced our expected revenue from Canada in 2013 by approximately $40 million while also lowering our expected CAPEX spend in the year.
Page 11
©2013 Outerwall Inc. All Rights Reserved. These materials may not be reproduced, altered or distributed without the express written consent of Outerwall Inc.
Outerwall Inc. 2013 Second Quarter Earnings
Prepared Remarks from CEO J. Scott Di Valerio and CFO Galen C. Smith
July 25, 2013
At the end of Q2 we had executed contracts with Loblaws, Safeway, Wal-mart, Petro Canada, Giant Tiger, and Couche-Tard. On July 24, we executed a contract with Sobeys Inc. and, combined with Loblaws, Redbox Canada now has the top two Canadian grocery chains under contract. We are optimistic that the grocery channel will perform very well for us.
Additionally, we continue to adjust our marketing strategy to increase awareness for our existing network and refine our merchandising and product plans to ensure the product in the kiosk is aligned with consumer demand. While our progress in the short run has been slower than anticipated, we remain optimistic about our Canadian business for the long term.
Redbox Tickets: This quarter we concluded our Redbox Tickets pilots in Los Angeles and Philadelphia. While we were pleased with the consumer response and our operational capabilities, we did not see the momentum in aggregating inventory that we needed to scale with the existing go-to-market approach. We believe in the viability of a tickets offering under the Redbox brand, and are exploring alternative approaches to inventory acquisition. Our goal is to find an approach that allows us to scale this business with acceptable margins in the future.
Coinstar
Coinstar segment operating results
In Q2 Coinstar segment revenue was $74.5 million, an increase of just under 1%, reflecting a $2.48 increase in the average transaction size to $41.18, offset by approximately 1% fewer transactions than the prior year. We have seen several quarters of lower transaction counts but higher average transaction size year over year, potentially a sign of a general trend with consumers waiting longer between visits to the kiosk and accumulating more coins in the interim.
The Coinstar segment added approximately 500 net new installations year over year, with approximately 350 installed in March and April 2013 in connection with our agreement with TD Canada Trust (“TDCT”). The balance was a combination of grand openings and other fill-in locations.
While U.S. same store sales were slightly positive, same store sales were negative 1.1% overall in Q2, as same store sales in Canada were down on fewer transactions following the large spike in transactions in Q1 related to the Royal Canadian Mint’s penny reclamation efforts combined with slower accumulations with fewer pennies in circulation. The TDCT locations are currently not included in same store sales since they have not been in the marketplace for at least 13 months.
Page 12
©2013 Outerwall Inc. All Rights Reserved. These materials may not be reproduced, altered or distributed without the express written consent of Outerwall Inc.
Outerwall Inc. 2013 Second Quarter Earnings
Prepared Remarks from CEO J. Scott Di Valerio and CFO Galen C. Smith
July 25, 2013
Coinstar segment operating income was $25.4 million, compared with $25.7 million a year ago, and segment operating margin was 34.1%, down from 34.8% a year ago. The operating margin decrease reflects higher R&D expenses associated with hardware and software engineering projects supporting our Coinstar and gift card exchange business kiosks, as well as increased direct operating expenses, reflecting higher revenue share expense attributable to both revenue growth and increased revenue share rates resulting from certain contract renewals.
Coinstar growth initiatives
We continued to make progress across several growth initiatives in our Coinstar business during the quarter.
TD Canada Trust (TDCT): We completed the rollout of over 350 TDCT-branded coin-counting kiosks at locations across Canada the first week of April. To date the TDCT kiosks are performing as expected with minimal impact on existing locations. The financial institution channel continues to represent an important expansion opportunity.
PayPal: By the end of Q2, over 3,400 locations were activated with the PayPal functionality allowing consumers to load coin or cash onto their PayPal accounts and to withdraw funds from their accounts. We augmented our marketing programs in July to increase awareness among consumers and continue to work closely with PayPal on ongoing rollout and marketing plans.
Blackhawk: We continued to make progress with Blackhawk, the largest provider of consumer financial products and gift cards in the U.S., to expand our no-fee and prepaid card offerings. In July, the connection with Blackhawk was complete and we began transitioning existing and new card partners over to the Blackhawk network.
Gift Card Exchange (GCE): We moved the gift card exchange business from our New Ventures segment to the Coinstar segment in early Q1 and installed an additional 15 kiosks at the end of June. The approximately 70 installed kiosks are performing well on both a face-value per card and transaction per day basis, indicating at this early stage that consumer interest is high and the potential opportunity in the unused gift card space remains attractive. These kiosks are included in the total kiosk counts for Coinstar.
Page 13
©2013 Outerwall Inc. All Rights Reserved. These materials may not be reproduced, altered or distributed without the express written consent of Outerwall Inc.
Outerwall Inc. 2013 Second Quarter Earnings
Prepared Remarks from CEO J. Scott Di Valerio and CFO Galen C. Smith
July 25, 2013
New Ventures
We look to our new ventures to generate new growth opportunities for the company. Over the past 4 years, we have invested in 7 organic ventures and made strategic investments in 2 external companies; and the program has progressed according to our expectations in many areas:
| • | Rubi continues to be an important focus of the company, and while progress has been delayed versus initial expectations, we expect the business to grow significantly in the coming years. |
| • | Our gift card exchange business, which we moved under the Coinstar LOB to better leverage strategic synergies, is a key expansion opportunity and sister concept to Coinstar. |
| • | Our photo booth concept continues to develop well and will be increasingly aligned with the Redbox brand in order to leverage synergies in content and brand advertising. |
| • | SAMPLEit, though still in early development, has shown encouraging performance to date. |
| • | Crispmarket is also early in development and we are currently testing a handful of kiosks to determine the optimal environment for this business. |
| • | We have made strategic investments in SoloHealth and have successfully acquired ecoATM. |
| • | We also made the decision to shut down or sell 2 businesses—Chirp and Orango. The act of pruning businesses that do not meet their required milestones is an important aspect of the program and we will continue to do so when warranted. |
Looking forward, as we further develop the portfolio, we will continue to enhance our new venture process to ensure it remains robust and effective.
New Ventures segment operating results
Our New Ventures segment reported revenue of $1.2 million in Q2, compared with $0.4 million and a segment operating loss of $9.6 million, compared with $6.2 million in Q2 2012. The higher revenue reflects a year over year increase of approximately 280 kiosks in the marketplace, which includes the expansion of our Rubi coffee concept. The increased segment operating loss reflects $2.8 million in higher direct operating expenses primarily due to costs associated with adding kiosks to the marketplace, additional headcount to support growth and additional sales volume, as well as $1.9 million in increased G&A expenses including $1.7 million in expenses related to the acquisition of ecoATM.
Rubi update
We consider our Rubi business a key growth driver for the company based on the size of the market opportunity and the underlying economics. Both consumers and retailers like the product and the value proposition and, by end of Q2, we expanded to approximately 270 stores across 8 markets. We have spent considerable efforts developing the kiosk and have learned a great deal about what is required to
Page 14
©2013 Outerwall Inc. All Rights Reserved. These materials may not be reproduced, altered or distributed without the express written consent of Outerwall Inc.
Outerwall Inc. 2013 Second Quarter Earnings
Prepared Remarks from CEO J. Scott Di Valerio and CFO Galen C. Smith
July 25, 2013
deliver the optimal consumer experience at the optimal cost over the long term. Our assessment today is that the current kiosk technology is not yet meeting those requirements and further modifications are required to scale the business. Through the remainder of 2013, we have allocated additional engineering resources to continue to develop the best solution for our customers and retail partners. Due to this focus, we have reduced our target 2013 installations to between 500 and 1,000, and also reduced the capital expenditures related to this business for the year.
ecoATM – a new source of growth and future cash flow
We announced the acquisition of ecoATM on July 2, 2013, for an aggregate purchase price of $350 million, inclusive of our 23% stake. The transaction closed on July 23, 2013, resulting in a cash payment of $262.9 million, which includes certain purchase adjustments for working capital. Consideration was paid using cash on the balance sheet and a $100.0 million draw down on our revolving credit facility. As a result of the transaction, Outerwall has assumed unvested options and restricted stock plans.
We have been involved with the ecoATM business since 2009 and it is one of the most compelling kiosk concepts we have seen. The ecoATM team will make a great addition to the Outerwall new venture family, and we will utilize our corporate resources and infrastructure to help drive the business.
ecoATM capitalizes on the growing U.S. mobile device market where 175 million new devices are sold annually. Today, only 20% of used mobile phones are collected through third party resale and trade-in programs. We believe this represents a significant market opportunity and the expansion of the ecoATM footprint raises consumer awareness of a convenient trade-in solution that offers competitive pricing. In addition, the demand for refurbished mobile phones continues to accelerate, due largely to growth in emerging markets.
ecoATM derives its revenues through the sale of used devices collected at the kiosks to third-party refurb manufacturers and aggregators through an auction process. The devices are pre-sold on an as-is basis to the third parties at the time of collection at the kiosks, as such there is minimal inventory risk for the company. ecoATM recognizes revenue based on the price paid by the refurb manufacturers and aggregators for the devices and is recognized once the phones have been shipped to the purchaser.
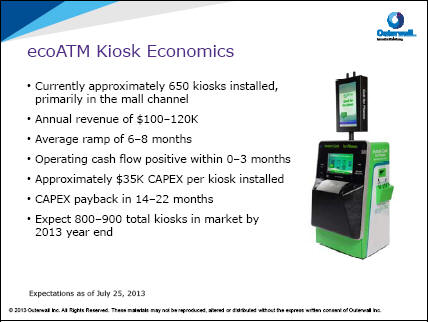
At close, ecoATM had an installed base of approximately 650 kiosks, primarily in the mall channel. Kiosks typically ramp to annual revenue of $100,000 to $120,000 with an average ramp of 6-8 months. The kiosks reach operating cash flow positive within 0–3 months and pay back CAPEX in 14–22 months. Due to the quick revenue ramp of kiosks, same store sales should be positive in its first year in the comp base and then flatten following that unless there is a shift in mix toward higher valued phones and devices.
Page 15
©2013 Outerwall Inc. All Rights Reserved. These materials may not be reproduced, altered or distributed without the express written consent of Outerwall Inc.
Outerwall Inc. 2013 Second Quarter Earnings
Prepared Remarks from CEO J. Scott Di Valerio and CFO Galen C. Smith
July 25, 2013
We expect to invest CAPEX of approximately $35,000 per installed ecoATM kiosk and believe this will come down over time. We currently expect 800–900 total kiosks in the marketplace by year end. Based on our current plans and view of the business, we expect the acquisition to be accretive to core EPS in 2014, excluding any costs related to purchase accounting, such as amortization of intangible assets. The full impact of these costs has yet to be determined.
Non-Core Results
During Q2, no additional funding was made to Redbox Instant by Verizon, our joint venture with Verizon. Our share of the total start-up losses for Q2 was $8.2 million for the joint venture and $1.4 million for our other equity method investments, in addition to $1.7 million in acquisition costs related to the acquisition of ecoATM.
Guidance
As we move into the second half of 2013, there are a number of initiatives that we have been working on this year that will start to have impact in Q3 and Q4.
At Redbox, we remain focused on growing rentals system-wide as the majority of our network has reached maturity and we have substantially slowed our kiosk growth, expecting to end the year with
Page 16
©2013 Outerwall Inc. All Rights Reserved. These materials may not be reproduced, altered or distributed without the express written consent of Outerwall Inc.
Outerwall Inc. 2013 Second Quarter Earnings
Prepared Remarks from CEO J. Scott Di Valerio and CFO Galen C. Smith
July 25, 2013
between 0–500 net new kiosks. Redbox results, and in turn results for the company, will continue to be strongly influenced by the release schedule, strength of titles, and availability of new release content in our kiosks. A number of the strategies we are employing—from our new CRM system to making more discs available through VMZ—allow us to develop deeper relationships with our consumers and should enable us to capture a higher percentage of their entertainment spend. New CRM strategies that consumers will begin to see starting this quarter include adaptive offers in Friday emails to drive consumer behavior while reducing total discounting, personalizing title recommendations based on rental history, and customized SMS promotions sent to consumers on the day they are most likely to respond with an incremental rent.
In our Coinstar business, 2013 growth will be driven by the ramping of the recently installed kiosks at TDCT and we will continue expansion of our gift card exchange business and PayPal products, laying the foundation for future growth.
2013 Q3 Consolidated Guidance
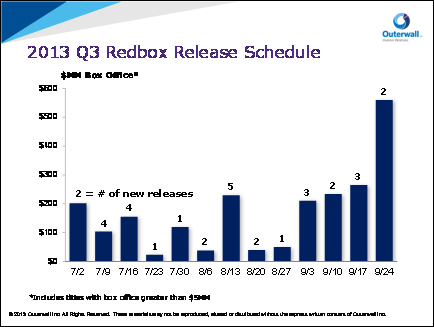
Q3 2013 has an estimated total box office of $2.3 billion—up 43% year over year—including 32 titles with a box office greater than or equal to $5 million. Unlike last year, when studios’ attempts to schedule around the Summer Olympics left Redbox with several weeks without any theatrical titles and a three-week stretch with only two theatricals totaling under $120 million, we expect every week of Q3 2013 to have at least one theatrical title and a three-week box office level over $180 million. The Q3 schedule includes 8 titles over $100 million, 6 of which release in September, compared with 3 titles with box office over $100 million in Q3 2012.
The Q3 box office breakdown for Redbox kiosks (including titles with a box greater than or equal to $5 million) by month is:
| • | JULY: 12 theatrical titles with total box office of approximately $600 million, including 2 titles with box office over $100 million – Identity Thief and G.I. Joe: Retaliation – as well as a robust slate of medium box office titles covering a broad variety of genres. |
| • | AUGUST: 10 theatrical titles with total box office of approximately $370 million. Though no titles in August have box office over $100 million, we expect G.I. Joe: Retaliation, which releases at the end of July, to be a strong driver of August rents and expect Olympus Has Fallen and Pain and Gain to be popular with our customers. |
| • | SEPTEMBER: 10 theatrical titles with total box office over $1.3 billion, including 6 titles with box office over $100 million and 2 titles with box office over $200 million. Each week in September is expected to have at least 2 new releases with a combined box office over $200 million between the titles. |
Page 17
©2013 Outerwall Inc. All Rights Reserved. These materials may not be reproduced, altered or distributed without the express written consent of Outerwall Inc.
Outerwall Inc. 2013 Second Quarter Earnings
Prepared Remarks from CEO J. Scott Di Valerio and CFO Galen C. Smith
July 25, 2013
As we head into Q3, we expect the strong seasonality we experienced at the end of Q2 to continue through July and August, propelled by the steady stream of quality, diverse titles. At the same time, we have also factored in the unusually high number of large budget movies that the studios are releasing throughout the summer, which may compete for our consumers’ entertainment viewing. Though we have a very strong September release slate, we typically experience a dip in seasonality as the new school year begins, and movies compete with the new TV schedule and the start of football season.
We expect Blu-ray rentals to represent approximately 15%–16% of Redbox revenue in Q3, similar to Q2 levels as title mix is slightly less favorable for Blu-ray in Q3.
We are expecting 8 new video game releases in Q3 compared with 7 in Q3 2012. We expect video game rentals will represent approximately 3% to 4% of Redbox revenue in Q3.
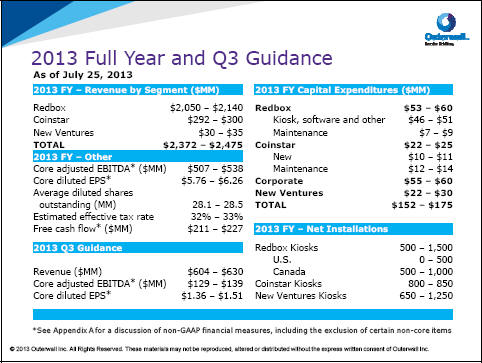
2013 Q3 consolidated guidance including ecoATM is as follows:
| • | Consolidated revenues between $604 and $630 million |
| • | Core adjusted EBITDA between $129 and $139 million |
| • | Core diluted EPS between $1.36 and $1.51 |
Q3 guidance for core diluted EPS includes the impact of $0.07 per diluted share, related to kiosk depreciation and a preliminary estimate of the purchase price accounting impact for ecoATM.
Page 18
©2013 Outerwall Inc. All Rights Reserved. These materials may not be reproduced, altered or distributed without the express written consent of Outerwall Inc.
Outerwall Inc. 2013 Second Quarter Earnings
Prepared Remarks from CEO J. Scott Di Valerio and CFO Galen C. Smith
July 25, 2013
2013 Q2 Non-Core Guidance
For Q3, we expect our share of the start-up losses of Redbox Instant by Verizon along with our other equity method investments as well as the costs related to the ecoATM acquisition to be in the range of approximately $14 million to $15 million. We expect to make an additional capital contribution in the range of $10–$14 million to Redbox Instant by Verizon in Q3.
2013 Full Year Consolidated Guidance
For Redbox we expect:
| • | Revenue growth of 7% to 12% for the full year, including Q2 actual revenue, reducing our Canada revenue expectations by $40 million for the full year, and removing expected Tickets revenue of approximately $14 million from our forecast. |
| • | Rents and revenue per kiosk to exceed 2012 levels in the second half of the year. |
| • | Blu-ray and video games will be important drivers of our growth; we also expect to benefit from the VMZ enhancement and CRM as the implementation of those initiatives continues in the second half. |
For Coinstar, we expect flat to single digit revenue growth for the year driven by the initiatives previously discussed.
For New Ventures, as noted previously, we expect to install 500–1,000 Rubi kiosks in 2013, down from our original expectation of 1,000–2,000, impacting expected revenue in the second half of the year. At the same time, we are revising expected segment results to include the following impact due to the acquisition of ecoATM:
| • | Revenue increase of $27–$30 million; |
| • | EBITDA decrease of $0–$1 million; |
| • | Preliminary impact from amortization of intangibles of $5.0–$6.0 million; and |
| • | 800–900 total ecoATM kiosks in the marketplace by year end. |
Guidance for core adjusted EBITDA and core diluted EPS includes the following:
| • | The change in estimation of content costs in the Redbox business provided a pre-tax benefit of $21.7 million to content costs in Q2, with marginal benefit in future quarters; |
| • | The sale of NCR kiosks during Q2 through a wholly owned subsidiary which generated net cash proceeds of $11.8 million and generated a tax benefit of $17.8 million that increased core diluted EPS in Q2 by $0.62; and |
| • | ecoATM kiosk depreciation and our preliminary estimate of the impact of purchase price accounting is $0.18 per diluted share. |
Page 19
©2013 Outerwall Inc. All Rights Reserved. These materials may not be reproduced, altered or distributed without the express written consent of Outerwall Inc.
Outerwall Inc. 2013 Second Quarter Earnings
Prepared Remarks from CEO J. Scott Di Valerio and CFO Galen C. Smith
July 25, 2013
For 2013 full year consolidated guidance including ecoATM, we expect:
| • | Consolidated revenue between $2.372 and $2.475 billion, which has been reduced by lower than expected Q2 revenue and the revised outlook for Tickets and Redbox Canada as stated previously; |
| • | Core adjusted EBITDA of $507 to $538 million, primarily driven by the benefit from the cost of sales change in Q2; and |
| • | Core diluted EPS between $5.76 and $6.26 reflecting the benefits of the cost of sales change and tax benefit in Q2 offset by the anticipated purchase price accounting impact from the ecoATM transaction. |
For 2013, we now expect capital expenditures of $152 million to $175 million which has been reduced by $35–$40 million due to a reduction in Redbox planned installs in the U.S. and Canada, the reduction of Rubi installs in the year and lower anticipated corporate capex spend:
| ¡ | Redbox – $53 to $60 million |
| ¡ | Kiosk, Other – $46 to $51 million for planned installs in the U.S. and Canada as well as software |
| ¡ | Maintenance – $7 to $9 million |
| ¡ | Coin – $22 to $25 million |
| ¡ | New – $10 to $11 million for planned installs as well as software |
| ¡ | Maintenance – $12 to $14 million |
| ¡ | New Ventures – $22 to $30 million |
| ¡ | New – $22 to $30 million for new installs, primarily for Rubi and ecoATM |
| ¡ | Corporate – $55 to $60 million |
| ¡ | LOB/Corporate growth – $13 to $15 million |
| ¡ | Infrastructure – $30 to $31 million |
| ¡ | Maintenance – $12 to $14 million |
Despite free cash flow of $1.9 million year to date, we have increased our view and now expect free cash flow for the year in the range of $211 million to $227 million, due to the increase in EBITDA and the reduction in CAPEX, offset by an increase in working capital.
Our current estimate for 2013 cash taxes remains in the range of $90 million to $105 million, including federal, state and foreign.
For the year, we expect average diluted shares in the range of 28.1 million and 28.5 million, which does not include the impact of any additional share repurchases we might execute in the second half of 2013.
Page 20
©2013 Outerwall Inc. All Rights Reserved. These materials may not be reproduced, altered or distributed without the express written consent of Outerwall Inc.
Outerwall Inc. 2013 Second Quarter Earnings
Prepared Remarks from CEO J. Scott Di Valerio and CFO Galen C. Smith
July 25, 2013
2013 Non-Core Guidance
For 2013, non-core adjustments, including our share of the start-up losses of Redbox Instant by Verizon along with our other equity method investments as well as the costs related to the ecoATM acquisition, are expected to be in the range of approximately $40 million to $43 million. This does not include an estimate of the gain on our previously held equity interest which will be recognized this quarter and is yet to be determined.
The following table includes a summary of 2013 full year and Q3 guidance:
Page 21
©2013 Outerwall Inc. All Rights Reserved. These materials may not be reproduced, altered or distributed without the express written consent of Outerwall Inc.
Outerwall Inc. 2013 Second Quarter Earnings
Prepared Remarks from CEO J. Scott Di Valerio and CFO Galen C. Smith
July 25, 2013
Summary
Our recent name change to Outerwall signifies the company’s growth as well as our evolution to a multifaceted automated retail company. It is fitting that we also announced our acquisition of ecoATM, which adds a compelling growth opportunity to our core Redbox and Coinstar businesses. Redbox remains focused on optimizing the kiosk network and increasing its base of users to drive growth. We continued to execute on key strategic initiatives that position the company for growth in the second half and beyond, including expanding the VMZ capability across a majority of the network, enhancing the one-on-one customer relationship through CRM, expanding the installed base in Canada to reach critical mass, and initiating marketing programs to raise awareness and drive subscriptions for Redbox Instant by Verizon. Coinstar also moved forward with plans that provide incremental growth opportunities, including PayPal and gift card exchange. We retired a significant portion of the Convertible Notes this quarter, repurchased approximately $25 million in common stock while also working to purchase ecoATM at the beginning of Q3. While we focus on innovating beyond the walls of retail, we will continue to focus on deploying our capital in a thoughtful and disciplined way to generate profitable growth, free cash flow and shareholder returns.
Page 22
©2013 Outerwall Inc. All Rights Reserved. These materials may not be reproduced, altered or distributed without the express written consent of Outerwall Inc.
Outerwall Inc. 2013 Second Quarter Earnings
Prepared Remarks from CEO J. Scott Di Valerio and CFO Galen C. Smith
July 25, 2013
APPENDIX A
Use of Non-GAAP Financial Measures
Non-GAAP measures may be provided as a complement to results provided in accordance with United States generally accepted accounting principles (“GAAP”).
We use the following non-GAAP financial measures to evaluate our financial results:
| • | Core adjusted EBITDA; |
| • | Core diluted earnings per share (“EPS”); and |
| • | Free cash flow. |
These measures, the definitions of which are presented below, are non-GAAP because they exclude certain amounts which are included in the most directly comparable measure calculated and presented in accordance with GAAP. Our non-GAAP financial measures are not meant to be considered in isolation or as a substitute for our GAAP financial measures and may not be comparable with similarly titled measures of other companies.
Core and Non-Core Results
We distinguish our core activities, those associated with our primary operations which we directly control, from non-core activities. Non-core activities are primarily nonrecurring events or events we do not directly control. Our non-core adjustments include i) acquisition costs primarily related to the NCR Asset Acquisition and acquisition of ecoATM, Inc., ii) a gain on the grant of a license to use certain Redbox trademarks to Redbox Instant™ by Verizon and iii) income or loss from equity method investments, which represents our share of income or loss from entities we do not consolidate or control (“Non-Core Adjustments”).
We believe investors should consider our core results because they are more indicative of our ongoing performance and trends, are more consistent with how management evaluates our operational results and trends, provide meaningful supplemental information to investors through the exclusion of certain expenses which are either non-recurring or may not be indicative of our directly controllable business operating results, allow for greater transparency in assessing our performance, help investors better analyze the results of our business and assist in forecasting future periods.
Core Adjusted EBITDA
Our non-GAAP financial measure core adjusted EBITDA is defined as earnings before depreciation, amortization and other; interest expense, net; income taxes; share-based payments expense; and Non-Core Adjustments.
A reconciliation of core adjusted EBITDA to net income, the most comparable GAAP financial measure, is presented in the following table:
| Three Months Ended June 30, | Six Months Ended June 30, | |||||||||||||||
| Dollars in thousands | 2013 | 2012 | 2013 | 2012 | ||||||||||||
| Net income |
$ | 46,857 | $ | 36,875 | $ | 69,461 | $ | 90,571 | ||||||||
| Depreciation, amortization and other |
49,624 | 43,629 | 101,079 | 84,420 | ||||||||||||
| Interest expense, net |
12,018 | 3,027 | 17,551 | 7,141 | ||||||||||||
| Income taxes |
847 | 24,775 | 13,606 | 60,447 | ||||||||||||
| Share-based payments expense(1) |
3,843 | 5,938 | 8,680 | 14,730 | ||||||||||||
|
|
|
|
|
|
|
|
|
|||||||||
| Adjusted EBITDA |
113,189 | 114,244 | 210,377 | 257,309 | ||||||||||||
| Non-core adjustments: |
||||||||||||||||
| Acquisition costs |
1,666 | 2,012 | 1,666 | 3,215 | ||||||||||||
| Loss from equity method investments |
9,629 | 5,044 | 16,654 | 9,385 | ||||||||||||
| Gain on formation of Redbox Instant by Verizon |
— | — | — | (19,500 | ) | |||||||||||
|
|
|
|
|
|
|
|
|
|||||||||
| Core adjusted EBITDA |
$ | 124,484 | $ | 121,300 | $ | 228,697 | $ | 250,409 | ||||||||
|
|
|
|
|
|
|
|
|
|||||||||
| (1) Includes both non-cash share-based compensation for executives, non-employee directors and employees as well as share-based payments for content arrangements. |
| |||||||||||||||
Page 23
©2013 Outerwall Inc. All Rights Reserved. These materials may not be reproduced, altered or distributed without the express written consent of Outerwall Inc.
Outerwall Inc. 2013 Second Quarter Earnings
Prepared Remarks from CEO J. Scott Di Valerio and CFO Galen C. Smith
July 25, 2013
Core Diluted EPS
Our non-GAAP financial measure core diluted EPS is defined as diluted earnings per share excluding Non-Core Adjustments, net of applicable taxes.
A reconciliation of core diluted EPS to diluted EPS, the most comparable GAAP financial measure, is presented in the following table:
| Three Months Ended June 30, | Six Months Ended June 30, | |||||||||||||||
| 2013 | 2012 | 2013 | 2012 | |||||||||||||
| Diluted EPS |
$ | 1.64 | $ | 1.11 | $ | 2.42 | $ | 2.75 | ||||||||
| Non-Core Adjustments, net of tax:(1) |
||||||||||||||||
| Acquisition costs |
0.06 | 0.04 | 0.06 | 0.06 | ||||||||||||
| Loss from equity method investments |
0.21 | 0.10 | 0.36 | 0.17 | ||||||||||||
| Gain on formation of the Joint Venture |
— | — | — | (0.36 | ) | |||||||||||
|
|
|
|
|
|
|
|
|
|||||||||
| Core diluted EPS |
$ | 1.91 | $ | 1.25 | $ | 2.84 | $ | 2.62 | ||||||||
|
|
|
|
|
|
|
|
|
|||||||||
| (1) Non-Core Adjustments are presented after-tax using the applicable effective tax rate for the respective periods. |
| |||||||||||||||
Free Cash Flow
Our non-GAAP financial measure free cash flow is defined as net cash provided by operating activities after capital expenditures. We believe free cash flow is an important non-GAAP measure as it provides additional information to users of the financial statements regarding our ability to service, incur or pay down indebtedness and repurchase our common stock.
A reconciliation of free cash flow to net cash provided by operating activities, the most comparable GAAP financial measure, is presented in the following table:
| Three Months Ended June 30, | Six Months Ended June 30, | |||||||||||||||
| Dollars in thousands | 2013 | 2012 | 2013 | 2012 | ||||||||||||
| Net cash provided by operating activities |
$ | 29,562 | $ | 139,303 | $ | 70,664 | $ | 194,221 | ||||||||
| Purchase of property and equipment |
(35,499 | ) | (38,694 | ) | (68,730 | ) | (76,701 | ) | ||||||||
|
|
|
|
|
|
|
|
|
|||||||||
| Free cash flow |
$ | (5,937 | ) | $ | 100,609 | $ | 1,934 | $ | 117,520 | |||||||
|
|
|
|
|
|
|
|
|
|||||||||
Page 24
©2013 Outerwall Inc. All Rights Reserved. These materials may not be reproduced, altered or distributed without the express written consent of Outerwall Inc.