Attached files
| file | filename |
|---|---|
| 8-K - FORM 8-K - WESTERN DIGITAL CORP | d573069d8k.htm |
| EX-99.1 - EX-99.1 - WESTERN DIGITAL CORP | d573069dex991.htm |
| Exhibit 99.2 |
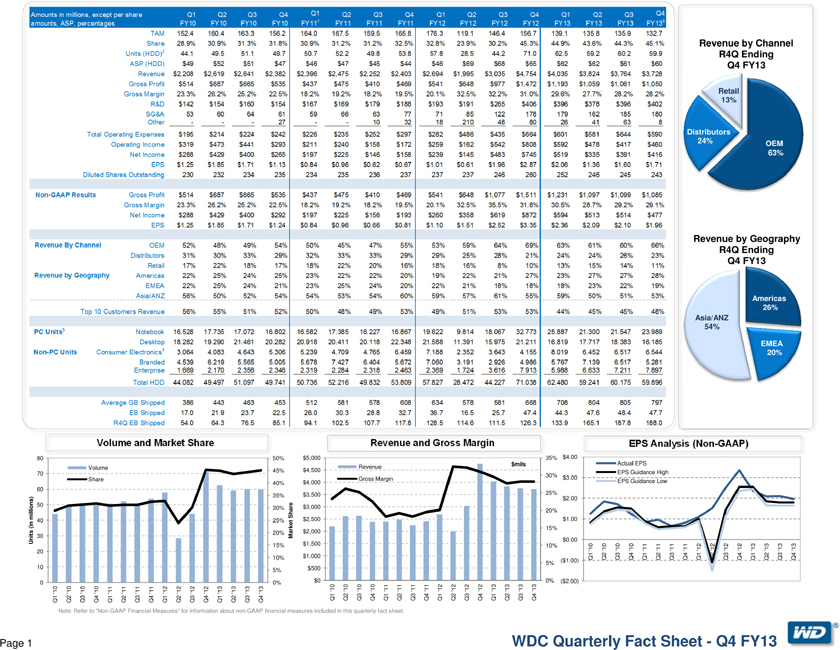
Amounts in millions, except per share amounts, ASP, percentages Q1 FY10 Q2 FY10 Q3 FY10 Q4 FY10 Q1 FY111 Q2 FY11 Q3 FY11 Q4 FY11 Q1 FY12 Q2 FY12 Q3 FY12 Q4 FY12 Q1 FY13 Q2 FY13 Q3 FY13 Q4 FY136 TAM 152.4 160.4 163.3 156.2 164.0 167.5 159.5 165.8 176.3 119.1 146.4 156.7 139.1 135.8 135.9 132.7 Share 28.9% 30.9% 31.3% 31.8% 30.9% 31.2% 31.2% 32.5% 32.8% 23.9% 30.2% 45.3% 44.9% 43.6% 44.3% 45.1% Units (HDD)2 44.1 49.5 51.1 49.7 50.7 52.2 49.8 53.8 57.8 28.5 44.2 71.0 62.5 59.2 60.2 59.9 ASP (HDD) $49 $52 $51 $47 $46 $47 $45 $44 $46 $69 $68 $65 $62 $62 $61 $60 Revenue $2,208 $2,619 $2,641 $2,382 $2,396 $2,475 $2,252 $2,403 $2,694 $1,995 $3,035 $4,754 $4,035 $3,824 $3,764 $3,728 Gross Profit $514 $687 $665 $535 $437 $475 $410 $469 $541 $648 $977 $1,472 $1,193 $1,059 $1,061 $1,050 Gross Margin 23.3% 26.2% 25.2% 22.5% 18.2% 19.2% 18.2% 19.5% 20.1% 32.5% 32.2% 31.0% 29.6% 27.7% 28.2% 28.2% R&D $142 $154 $160 $154 $167 $169 $179 $188 $193 $191 $265 $406 $396 $378 $396 $402 SG&A 53 60 64 61 59 66 63 77 71 85 122 178 179 162 185 180 Other ——27 — 10 32 18 210 48 80 26 41 63 8 Total Operating Expenses $195 $214 $224 $242 $226 $235 $252 $297 $282 $486 $435 $664 $601 $581 $644 $590 Operating Income $319 $473 $441 $293 $211 $240 $158 $172 $259 $162 $542 $808 $592 $478 $417 $460 Net Income $288 $429 $400 $265 $197 $225 $146 $158 $239 $145 $483 $745 $519 $335 $391 $416 EPS $1.25 $1.85 $1.71 $1.13 $0.84 $0.96 $0.62 $0.67 $1.01 $0.61 $1.96 $2.87 $2.06 $1.36 $1.60 $1.71 Diluted Shares Outstanding 230 232 234 235 234 235 236 237 237 237 246 260 252 246 245 243 Non-GAAP Results Gross Profit $514 $687 $665 $535 $437 $475 $410 $469 $541 $648 $1,077 $1,511 $1,231 $1,097 $1,099 $1,085 Gross Margin 23.3% 26.2% 25.2% 22.5% 18.2% 19.2% 18.2% 19.5% 20.1% 32.5% 35.5% 31.8% 30.5% 28.7% 29.2% 29.1% Net Income $288 $429 $400 $292 $197 $225 $156 $193 $260 $358 $619 $872 $594 $513 $514 $477 EPS $1.25 $1.85 $1.71 $1.24 $0.84 $0.96 $0.66 $0.81 $1.10 $1.51 $2.52 $3.35 $2.36 $2.09 $2.10 $1.96 Revenue By Channel OEM 52% 48% 49% 54% 50% 45% 47% 55% 53% 59% 64% 69% 63% 61% 60% 66% Distributors 31% 30% 33% 29% 32% 33% 33% 29% 29% 25% 28% 21% 24% 24% 26% 23% Retail 17% 22% 18% 17% 18% 22% 20% 16% 18% 16% 8% 10% 13% 15% 14% 11% Revenue by Geography Americas 22% 25% 24% 25% 23% 22% 22% 20% 19% 22% 21% 27% 23% 27% 27% 28% EMEA 22% 25% 24% 21% 23% 25% 24% 20% 22% 21% 18% 18% 18% 23% 22% 19% Asia/ANZ 56% 50% 52% 54% 54% 53% 54% 60% 59% 57% 61% 55% 59% 50% 51% 53% Top 10 Customers Revenue 56% 55% 51% 52% 50% 48% 49% 53% 49% 51% 53% 53% 44% 45% 45% 48% PC Units5 Notebook 16.528 17.735 17.072 16.802 16.582 17.385 16.227 16.867 19.622 9.814 18.067 32.773 25.887 21.300 21.547 23.989 Desktop 18.282 19.290 21.461 20.282 20.918 20.411 20.118 22.348 21.588 11.391 15.975 21.211 16.819 17.717 18.383 16.185 Non-PC Units Consumer Electronics4 3.064 4.083 4.643 5.306 5.239 4.709 4.765 6.459 7.188 2.352 3.643 4.155 8.019 6.452 6.517 6.544 Branded 4.539 6.219 5.565 5.005 5.678 7.427 6.404 5.672 7.060 3.191 2.926 4.986 5.767 7.139 6.517 5.281 Enterprise 1.669 2.170 2.356 2.346 2.319 2.284 2.318 2.463 2.369 1.724 3.616 7.913 5.988 6.633 7.211 7.897 Total HDD 44.082 49.497 51.097 49.741 50.736 52.216 49.832 53.809 57.827 28.472 44.227 71.038 62.480 59.241 60.175 59.896 Average GB Shipped 386 443 463 453 512 581 578 608 634 578 581 668 708 804 805 797 EB Shipped 17.0 21.9 23.7 22.5 26.0 30.3 28.8 32.7 36.7 16.5 25.7 47.4 44.3 47.6 48.4 47.7 R4Q EB Shipped 54.0 64.3 76.5 85.1 94.1 102.5 107.7 117.8 128.5 114.6 111.5 126.3 133.9 165.1 187.8 188.0 Revenue by Channel R4Q Ending Q4 FY13 Retail 13% Distributors 24% OEM 63% Revenue by Geography R4Q Ending Q4 FY13 Asia/ANZ 54% Americas 26% EMEA 20% EPS Analysis (Non-GAAP) Revenue and Gross Margin Volume and Market Share
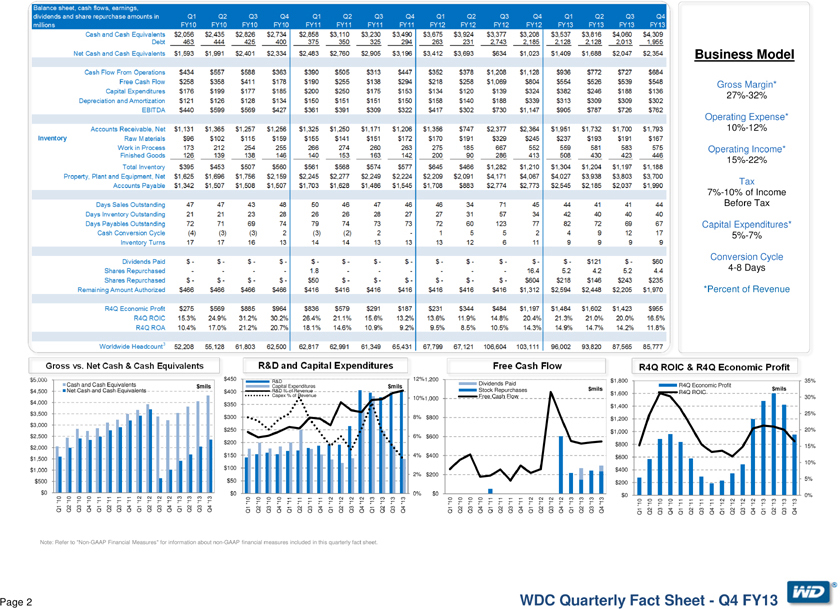
Balance sheet, cash flows, earnings, dividends and share repurchase amounts in millions Q1 FY10 Q2 FY10 Q3 FY10 Q4 FY10 Q1 FY11 Q2 FY11 Q3 FY11 Q4 FY11 Q1 FY12 Q2 FY12 Q3 FY12 Q4 FY12 Q1 FY13 Q2 FY13 Q3 FY13 Q4 FY13 Cash and Cash Equivalents $2,056 $2,435 $2,826 $2,734 $2,858 $3,110 $3,230 $3,490 $3,675 $3,924 $3,377 $3,208 $3,537 $3,816 $4,060 $4,309 Debt 463 444 425 400 375 350 325 294 263 231 2,743 2,185 2,128 2,128 2,013 1,955 Net Cash and Cash Equivalents $1,593 $1,991 $2,401 $2,334 $2,483 $2,760 $2,905 $3,196 $3,412 $3,693 $634 $1,023 $1,409 $1,688 $2,047 $2,354 Cash Flow From Operations $434 $557 $588 $363 $390 $505 $313 $447 $352 $378 $1,208 $1,128 $936 $772 $727 $684 Free Cash Flow $258 $358 $411 $178 $190 $255 $138 $294 $218 $258 $1,069 $804 $554 $526 $539 $548 Capital Expenditures $176 $199 $177 $185 $200 $250 $175 $153 $134 $120 $139 $324 $382 $246 $188 $136 Depreciation and Amortization $121 $126 $128 $134 $150 $151 $151 $150 $158 $140 $188 $339 $313 $309 $309 $302 EBITDA $440 $599 $569 $427 $361 $391 $309 $322 $417 $302 $730 $1,147 $905 $787 $726 $762 Accounts Receivable, Net $1,131 $1,365 $1,257 $1,256 $1,325 $1,250 $1,171 $1,206 $1,356 $747 $2,377 $2,364 $1,951 $1,732 $1,700 $1,793 Inventory Raw Materials $96 $102 $115 $159 $155 $141 $151 $172 $170 $191 $329 $245 $237 $193 $191 $167 Work in Process 173 212 254 255 266 274 260 263 275 185 667 552 559 581 583 575 Finished Goods 126 139 138 146 140 153 163 142 200 90 286 413 508 430 423 446 Total Inventory $395 $453 $507 $560 $561 $568 $574 $577 $645 $466 $1,282 $1,210 $1,304 $1,204 $1,197 $1,188 Property, Plant and Equipment, Net $1,625 $1,696 $1,756 $2,159 $2,245 $2,277 $2,249 $2,224 $2,209 $2,091 $4,171 $4,067 $4,027 $3,938 $3,803 $3,700 Accounts Payable $1,342 $1,507 $1,508 $1,507 $1,703 $1,628 $1,486 $1,545 $1,708 $883 $2,774 $2,773 $2,545 $2,185 $2,037 $1,990 Days Sales Outstanding 47 47 43 48 50 46 47 46 46 34 71 45 44 41 41 44 Days Inventory Outstanding 21 21 23 28 26 26 28 27 27 31 57 34 42 40 40 40 Days Payables Outstanding 72 71 69 74 79 74 73 73 72 60 123 77 82 72 69 67 Cash Conversion Cycle (4) (3) (3) 2 (3) (2) 2—1 5 5 2 4 9 12 17 Inventory Turns 17 17 16 13 14 14 13 13 13 12 6 11 9 9 9 9 Dividends Paid $—$—$—$—$—$—$—$—$—$—$—$—$—$121 $—$60 Shares Repurchased — — 1.8 — — — 16.4 5.2 4.2 5.2 4.4 Shares Repurchased $—$—$—$—$50 $—$—$—$—$—$—$604 $218 $146 $243 $235 Remaining Amount Authorized $466 $466 $466 $466 $416 $416 $416 $416 $416 $416 $416 $1,312 $2,594 $2,448 $2,205 $1,970 R4Q Economic Profit $275 $569 $885 $964 $836 $579 $291 $187 $231 $344 $484 $1,197 $1,484 $1,602 $1,423 $955 R4Q ROIC 15.3% 24.9% 31.2% 30.2% 26.4% 21.1% 15.6% 13.2% 13.6% 11.9% 14.8% 20.4% 21.3% 21.0% 20.0% 16.5% R4Q ROA 10.4% 17.0% 21.2% 20.7% 18.1% 14.6% 10.9% 9.2% 9.5% 8.5% 10.5% 14.3% 14.9% 14.7% 14.2% 11.8% Worldwide Headcount3 52,208 55,128 61,803 62,500 62,817 62,991 61,349 65,431 67,799 67,121 106,604 103,111 96,002 93,820 87,565 85,777
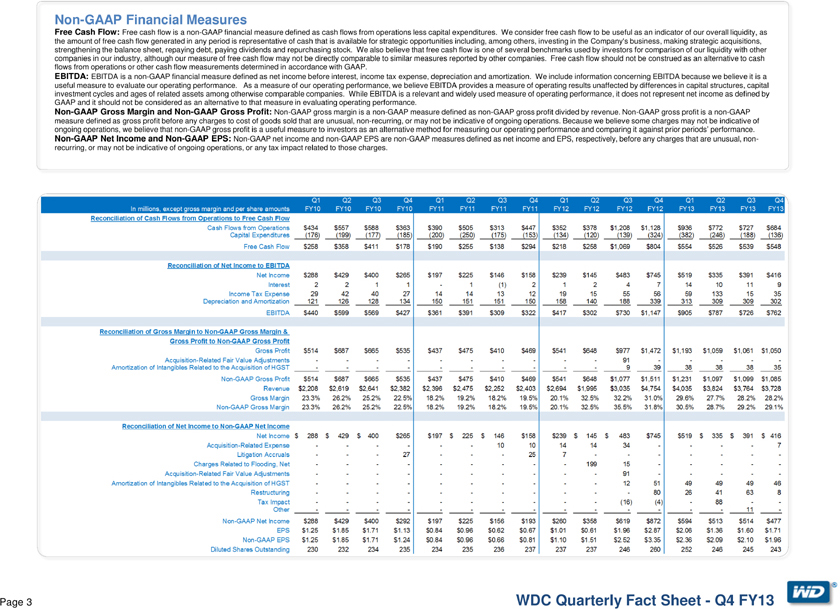
Non-GAAP Financial Measures Free Cash Flow: Free cash flow is a non-GAAP financial measure defined as cash flows from operations less capital expenditures. We consider free cash flow to be useful as an indicator of our overall liquidity, as the amount of free cash flow generated in any period is representative of cash that is available for strategic opportunities including, among others, investing in the Company’s business, making strategic acquisitions, strengthening the balance sheet, repaying debt, paying dividends and repurchasing stock. We also believe that free cash flow is one of several benchmarks used by investors for comparison of our liquidity with other companies in our industry, although our measure of free cash flow may not be directly comparable to similar measures reported by other companies. Free cash flow should not be construed as an alternative to cash flows from operations or other cash flow measurements determined in accordance with GAAP. EBITDA: EBITDA is a non-GAAP financial measure defined as net income before interest, income tax expense, depreciation and amortization. We include information concerning EBITDA because we believe it is a useful measure to evaluate our operating performance. As a measure of our operating performance, we believe EBITDA provides a measure of operating results unaffected by differences in capital structures, capital investment cycles and ages of related assets among otherwise comparable companies. While EBITDA is a relevant and widely used measure of operating performance, it does not represent net income as defined by GAAP and it should not be considered as an alternative to that measure in evaluating operating performance. Non-GAAP Gross Margin and Non-GAAP Gross Profit: Non-GAAP gross margin is a non-GAAP measure defined as non-GAAP gross profit divided by revenue. Non-GAAP gross profit is a non-GAAP measure defined as gross profit before any charges to cost of goods sold that are unusual, non-recurring, or may not be indicative of ongoing operations. Because we believe some charges may not be indicative of ongoing operations, we believe that non-GAAP gross profit is a useful measure to investors as an alternative method for measuring our operating performance and comparing it against prior periods’ performance. Non-GAAP Net Income and Non-GAAP EPS: Non-GAAP net income and non-GAAP EPS are non-GAAP measures defined as net income and EPS, respectively, before any charges that are unusual, non-recurring, or may not be indicative of ongoing operations, or any tax impact related to those charges. In millions, except gross margin and per share amounts Q1 FY10 Q2 FY10 Q3 FY10 Q4 FY10 Q1 FY11 Q2 FY11 Q3 FY11 Q4 FY11 Q1 FY12 Q2 FY12 Q3 FY12 Q4 FY12 Q1 FY13 Q2 FY13 Q3 FY13 Q4 FY13 Reconciliation of Cash Flows from Operations to Free Cash Flow Cash Flows from Operations $434 $557 $588 $363 $390 $505 $313 $447 $352 $378 $1,208 $1,128 $936 $772 $727 $684 Capital Expenditures (176) (199) (177) (185) (200) (250) (175) (153) (134) (120) (139) (324) (382) (246) (188) (136) Free Cash Flow $258 $358 $411 $178 $190 $255 $138 $294 $218 $258 $1,069 $804 $554 $526 $539 $548 Reconciliation of Net Income to EBITDA Net Income $288 $429 $400 $265 $197 $225 $146 $158 $239 $145 $483 $745 $519 $335 $391 $416 Interest 2 2 1 1—1 (1) 2 1 2 4 7 14 10 11 9 Income Tax Expense 29 42 40 27 14 14 13 12 19 15 55 56 59 133 15 35 Depreciation and Amortization 121 126 128 134 150 151 151 150 158 140 188 339 313 309 309 302 EBITDA $440 $599 $569 $427 $361 $391 $309 $322 $417 $302 $730 $1,147 $905 $787 $726 $762 Reconciliation of Gross Margin to Non-GAAP Gross Margin & Gross Profit to Non-GAAP Gross Profit Gross Profit $514 $687 $665 $535 $437 $475 $410 $469 $541 $648 $977 $1,472 $1,193 $1,059 $1,061 #### Acquisition-Related Fair Value Adjustments — — — — — 91 — ——Amortization of Intangibles Related to the Acquisition of HGST — — — — — 9 39 38 38 38 35 Non-GAAP Gross Profit $514 $687 $665 $535 $437 $475 $410 $469 $541 $648 $1,077 $1,511 $1,231 $1,097 $1,099 #### Revenue $2,208 $2,619 $2,641 $2,382 $2,396 $2,475 $2,252 $2,403 $2,694 $1,995 $3,035 $4,754 $4,035 $3,824 $3,764 #### Gross Margin 23.3% 26.2% 25.2% 22.5% 18.2% 19.2% 18.2% 19.5% 20.1% 32.5% 32.2% 31.0% 29.6% 27.7% 28.2% 28.2% Non-GAAP Gross Margin 23.3% 26.2% 25.2% 22.5% 18.2% 19.2% 18.2% 19.5% 20.1% 32.5% 35.5% 31.8% 30.5% 28.7% 29.2% 29.1% Reconciliation of Net Income to Non-GAAP Net Income Net Income $ 288 $ 429 $ 400 $265 $197 $ 225 $ 146 $158 $239 $ 145 $ 483 $745 $519 $ 335 $ 391 $ 416 Acquisition-Related Expense — — — 10 10 14 14 34 — — 7 Litigation Accruals ——27 ——25 7 — — ——Charges Related to Flooding, Net — — — ——199 15 — ——Acquisition-Related Fair Value Adjustments — — — — — 91 — ——Amortization of Intangibles Related to the Acquisition of HGST — — — — — 12 51 49 49 49 46 Restructuring — — — — ——80 26 41 63 8 Tax Impact — — — — — (16) (4)—88 — Other — — — — — — — 11—Non-GAAP Net Income $288 $429 $400 $292 $197 $225 $156 $193 $260 $358 $619 $872 $594 $513 $514 $477 EPS $1.25 $1.85 $1.71 $1.13 $0.84 $0.96 $0.62 $0.67 $1.01 $0.61 $1.96 $2.87 $2.06 $1.36 $1.60 $1.71 Non-GAAP EPS $1.25 $1.85 $1.71 $1.24 $0.84 $0.96 $0.66 $0.81 $1.10 $1.51 $2.52 $3.35 $2.36 $2.09 $2.10 $1.96 Diluted Shares Outstanding 230 232 234 235 234 235 236 237 237 237 246 260 252 246 245 243
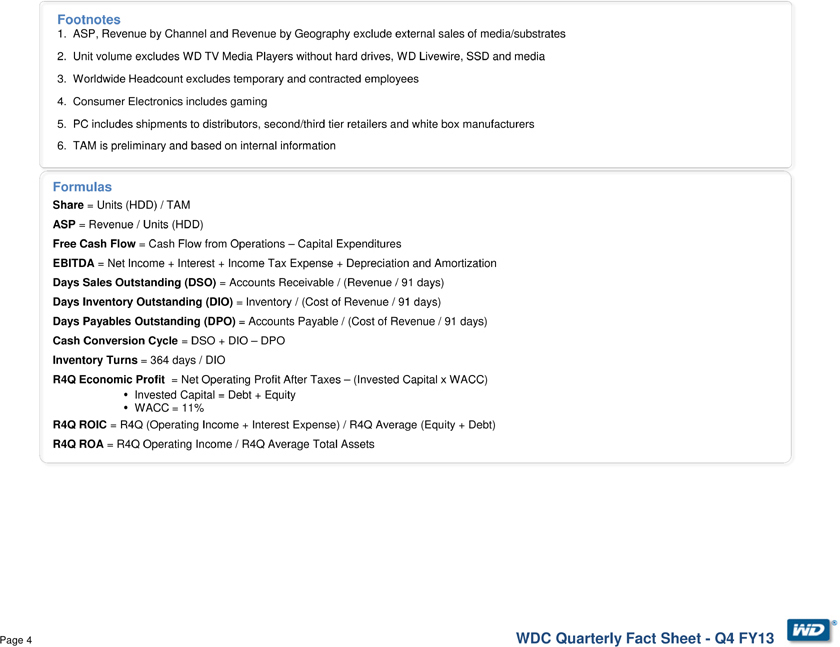
Footnotes 1. ASP, Revenue by Channel and Revenue by Geography exclude external sales of media/substrates 2. Unit volume excludes WD TV Media Players without hard drives, WD Livewire, SSD and media 3. Worldwide Headcount excludes temporary and contracted employees 4. Consumer Electronics includes gaming 5. PC includes shipments to distributors, second/third tier retailers and white box manufacturers TAM is preliminary and based on internal information Formulas Share = Units (HDD) / TAM ASP = Revenue / Units (HDD) Free Cash Flow = Cash Flow from Operations – Capital Expenditures EBITDA = Net Income + Interest + Income Tax Expense + Depreciation and Amortization Days Sales Outstanding (DSO) = Accounts Receivable / (Revenue / 91 days) Days Inventory Outstanding (DIO) = Inventory / (Cost of Revenue / 91 days) Days Payables Outstanding (DPO) = Accounts Payable / (Cost of Revenue / 91 days) Cash Conversion Cycle = DSO + DIO – DPO Inventory Turns = 364 days / DIO R4Q Economic Profit = Net Operating Profit After Taxes – (Invested Capital x WACC) ? Invested Capital = Debt + Equity ? WACC = 11% R4Q ROIC = R4Q (Operating Income + Interest Expense) / R4Q Average (Equity + Debt) R4Q ROA = R4Q Operating Income / R4Q Average Total Assets