Attached files
| file | filename |
|---|---|
| 8-K - FORM 8-K - Noranda Aluminum Holding CORP | a2013q2earningsreleaseform.htm |
| EX-99.1 - EXHIBIT 99.1 EARNINGS RELEASE - Noranda Aluminum Holding CORP | a2013q2earningsreleaseexhi.htm |
| EX-99.3 - EXHIBIT 99.3 DIVIDEND RELEASE - Noranda Aluminum Holding CORP | q22013dividendreleaseexhib.htm |

2nd Quarter 2013 Earnings Conference Call Noranda Aluminum Holding Corp July 24, 2013 10:00 AM Eastern / 9:00 AM Central Exhibit 99.2

The presentation and comments made by Noranda’s management on the quarterly conference call contain “forward- looking statements” within the meaning of the Private Securities Litigation Reform Act of 1995. Forward-looking statements are statements about future, not past, events and involve certain important risks and uncertainties, any of which could cause the Company’s actual results to differ materially from those expressed in forward-looking statements, including, without limitation: the cyclical nature of the aluminum industry and fluctuating commodity prices, which cause variability in earnings and cash flows; a downturn in general economic conditions, including changes in interest rates, as well as a downturn in the end-use markets for certain of the Company’s products; fluctuations in the relative cost of certain raw materials and energy compared to the price of primary aluminum and aluminum rolled products; the effects of competition in Noranda’s business lines; Noranda’s ability to retain customers, a substantial number of which do not have long-term contractual arrangements with the Company; the ability to fulfill the business’ substantial capital investment needs; labor relations (i.e. disruptions, strikes or work stoppages) and labor costs; unexpected issues arising in connection with Noranda’s operations outside of the United States; the ability to retain key management personnel; and Noranda’s expectations with respect to its acquisition activity, or difficulties encountered in connection with acquisitions, dispositions or similar transactions. Forward-looking statements contain words such as “believes,” “expects,” “may,” “should,” “seeks,” “approximately,” “intends,” “plans,” “estimates,” “anticipates” or similar expressions that relate to Noranda’s strategy, plans or intentions. All statements Noranda makes relating to its estimated and projected earnings, margins, costs, expenditures, cash flows, growth rates and financial results or to the Company’s expectations regarding future industry trends are forward-looking statements. Noranda undertakes no obligation to publicly update or revise any forward-looking statement as a result of new information, future events or otherwise, except as otherwise required by law. Readers are cautioned not to place undue reliance on forward-looking statements, which speak only as of the date on which they are made and which reflect management's current estimates, projections, expectations or beliefs. For a discussion of additional risks and uncertainties that may affect the future results of Noranda, please see the Company’s filings with the Securities and Exchange Commission, including its Annual Report on Form 10-K and Quarterly Reports on Form 10-Q. Forward-Looking Statements 2

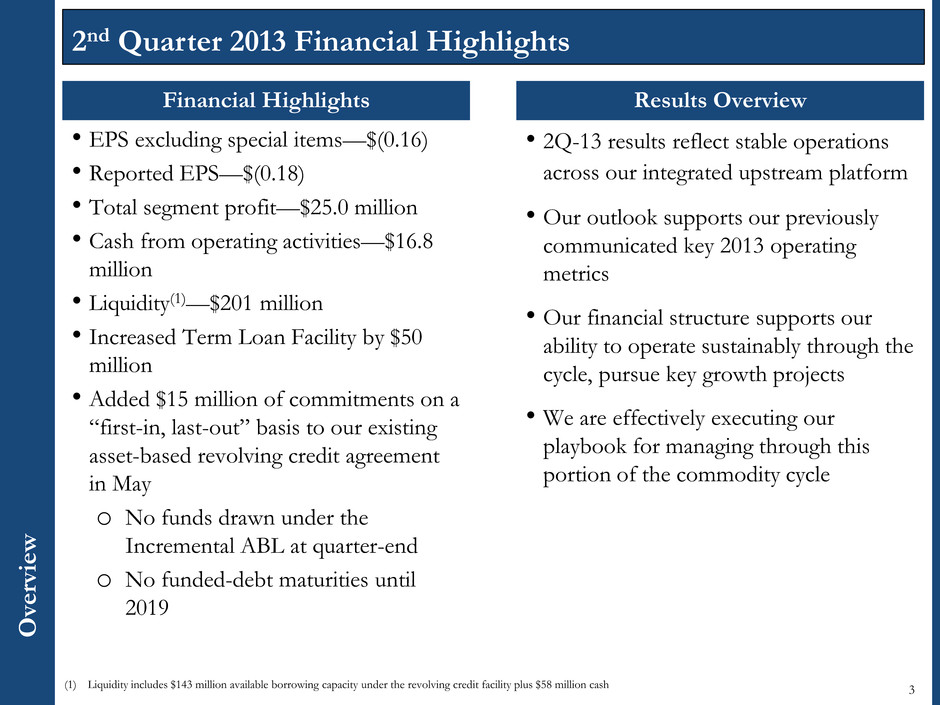
Ove rv ie w Results Overview • 2Q-13 results reflect stable operations across our integrated upstream platform • Our outlook supports our previously communicated key 2013 operating metrics • Our financial structure supports our ability to operate sustainably through the cycle, pursue key growth projects • We are effectively executing our playbook for managing through this portion of the commodity cycle Financial Highlights • EPS excluding special items—$(0.16) • Reported EPS—$(0.18) • Total segment profit—$25.0 million • Cash from operating activities—$16.8 million • Liquidity(1)—$201 million • Increased Term Loan Facility by $50 million • Added $15 million of commitments on a “first-in, last-out” basis to our existing asset-based revolving credit agreement in May o No funds drawn under the Incremental ABL at quarter-end o No funded-debt maturities until 2019 2nd Quarter 2013 Financial Highlights 3 (1) Liquidity includes $143 million available borrowing capacity under the revolving credit facility plus $58 million cash

288 289 271 262 276 298 0 50 100 150 200 250 300 350 Q1-12 Q2-12 Q3-12 Q4-12 Q1-13 Q2-13 K m ts CGA External SGA External SGA Intercompany 93 102 98 87 94 102 0 20 40 60 80 100 120 140 Q1-12 Q2-12 Q3-12 Q4-12 Q1-13 Q2-13 Po un ds in m illi on s Primary Aluminum Shipments Bauxite Shipments 4 Quarterly Shipment Information Flat-Rolled Product Shipments 142 1 6 139 145 142 148 5 100 150 Q1-12 Q2-12 Q3-12 Q4-12 Q1-13 Q -13 Po un ds in m illi on s Value-Added External sow Intercompany Alumina Shipments 1,145 1,162 1,26 1,185 1,209 1,149 0 300 600 90 1,200 1,500 Q1-12 Q2-12 Q3-12 Q4-1 Q1-13 Q2-13 K m ts Internal ExternalD e man d

Productivity Complements Growth in Creating Value P rodu c ti v it y 5 EBITDA Capex Working Capital • Cost Out – Impact materials prices through procurement practices – Reduce costs through improved yields – Avoid unproductive spending by rationalizing investments • Reliability and Effectiveness – Grow capacity through improved utilization and de- bottlenecking – Improve operational predictability – Eliminate unplanned losses Flat-Rolled Products $5.8 Primary Aluminum $12.1 Alumina $11.3 Bauxite $3.1 Corporate $- $ in millions EBITDA $30.0 Capex $1.8 Working Capital $0.6 $ in millions 2013 CORE Savings by Segment 2013 CORE Savings by Type $32 million in CORE savings during 2013 $19 million in CORE savings during 2Q-13

Demand Factors • Projected consumption CAGR through 2017(1) – Global—5.5% with China; 3.5% outside China – United States—3.1% • Global, emerging market drivers(2) – Working age population income growth – Low base level of aluminum consumption per capita – Urbanization & Industrialization • US demand drivers(2) – Auto demand–growth & increased sector penetration – Sustained recovery in construction – Working age population growth Supply Factor and Macroeconomic Factors • Supply Factors – World production/consumption balance(1) • 0.4 million MT surplus for 2012 • 0.1 million MT deficit for 2013 – Curtailments and disruptions for 2012/13(1) • 3.4 million MT curtailed; 0.4 million MT disrupted – LME warehouse inventories—5.5 million MT(3) • Macroeconomic Factors(2) – China’s structural economic slowdown – Europe’s inability to regain a sustained recovery – Strength/Weakness of U.S. dollar – U.S. economy continues to strengthen, albeit at slow pace Quarterly Average LME(3) $1.33 $0.62 $1.18 $0.83 $0.50 $0.60 $0.70 $0.80 $0.90 $1.00 $1.10 $1.20 $1.30 $1.40 Q1-2 0 0 7 Q2-2 0 0 7 Q3-2 0 0 7 Q4-2 0 0 7 Q1-2 0 0 8 Q2-2 0 0 8 Q3-2 0 0 8 Q4-2 0 0 8 Q1-2 0 0 9 Q2-2 0 0 9 Q3-2 0 0 9 Q4-2 0 0 9 Q1-2 0 1 0 Q2-2 0 1 0 Q3-2 0 1 0 Q4-2 0 1 0 Q1-2 0 1 1 Q2-2 0 1 1 Q3-2 0 1 1 Q4-2 0 1 1 Q1-2 0 1 2 Q2-2 0 1 2 Q3-2 0 1 2 Q4-2 0 1 2 Q1-2 0 1 3 Q2-2 0 1 3 LME Levels Were Lower Sequentially, Still Below Equilibrium Sna p shot o f Alumi n um Fundam e nta ls 6 Sources: (1) CRU (2) Harbor (3) LME

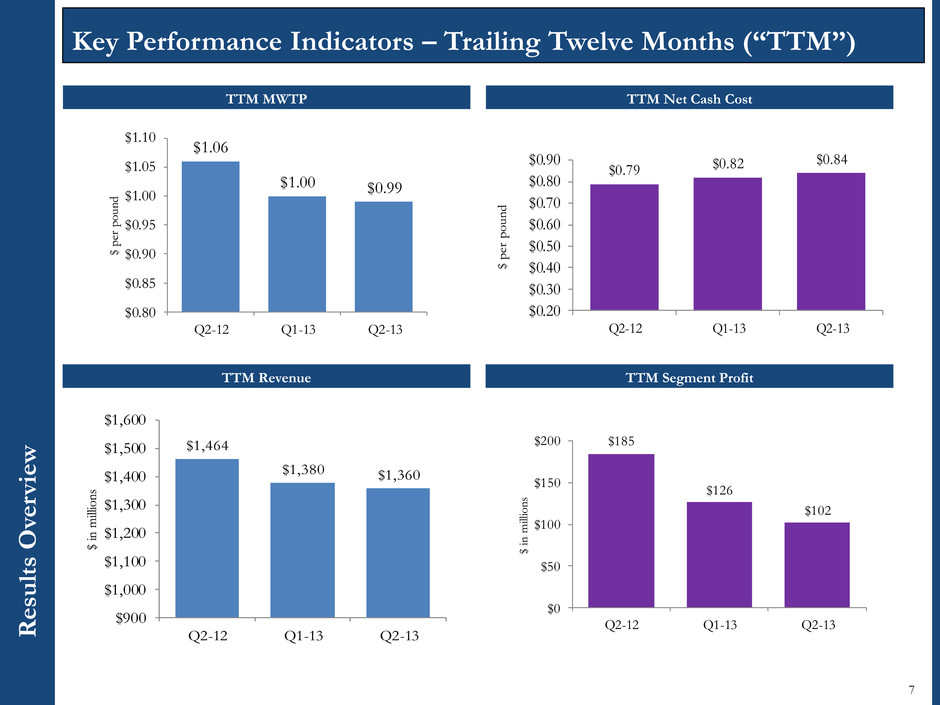
R esu lts O ve rv ie w TTM MWTP $1.06 $1.00 $0.99 $0.80 $0.85 $0.90 $0.95 $1.00 $1.05 $1.10 Q2-12 Q1-13 Q2-13 $ pe r p ou nd TTM Revenue TTM Net Cash Cost $185 $126 $102 $0 $50 $100 $150 $200 Q2-12 Q1-13 Q2-13 $ i n m illi on s Key Performance Indicators – Trailing Twelve Months (“TTM”) 7 $0.79 $0.82 $0.84 0.20 $0.30 0.40 $0.50 $0.60 $0.70 $0.80 $0.90 Q2-12 Q1-13 Q2-13 $ p er p ou nd TTM Segment Profit $1,464 $1,380 $1,360 $900 $1,000 $1,100 $1,200 $1,300 $1,400 $1,500 $1,600 Q2-12 1-13 Q2-13 $ i n m illi on s

Se g men t R esu lt s 8 Segment Profit Summary Q2 2012 Q1 2013 Q2 2013 Integrated upstream segment profit $40.8 $31.2 $18.9 Flat-Rolled Products segment profit 14.6 13.8 14.2 Corporate costs (6.3) (8.7) (8.1) Total segment profit $49.1 $36.3 $25.0

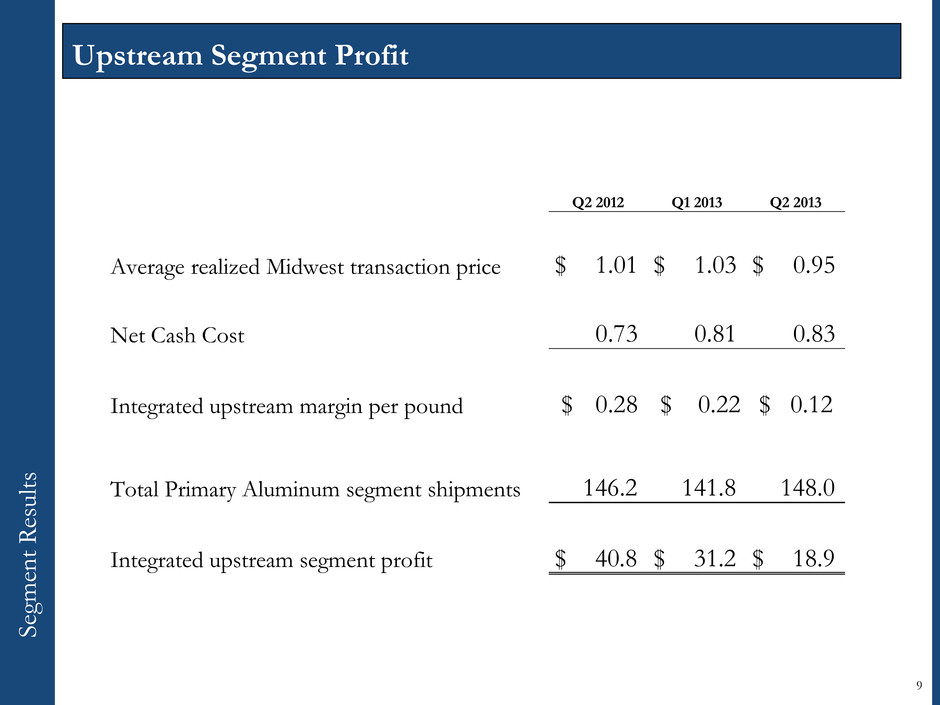
9 Upstream Segment Profit Q2 2012 Q1 2013 Q2 2013 Average realized Midwest transaction price $ 1.01 $ 1.03 $ 0.95 Net Cash Cost 0.73 0.81 0.83 Integrated upstream margin per pound $ 0.28 $ 0.22 $ 0.12 Total Primary Aluminum segment shipments 146.2 141.8 148.0 Integrated upstream segment profit $ 40.8 $ 31.2 $ 18.9 Se gm ent R es u lt s

In te g ra te d Net Cash Cos t 10 Segment Profit and Net Cash Cost Bridge $0.83 $0.02 $0.02 $0.02 $0.02 $0.04 $0.02 $0.81 $0.50 $0.55 $0.60 $0.65 $0.70 $0.75 $0.80 $0.85 $0.90 Q1 2013 Net Cash Cost Productivity & Reliability Employee Benefit Accrual Timing Eliminations LME Price Impact (Offset Sales) Electricity Commodity Costs (Natural Gas) Q2 2013 Net Cash Cost $ pe r p o u n d $25.0 $14.8 $5.3 $2.6 $3.1 $3.0 $2.4 $2.9 $36.3 $10 $20 $30 $40 $50 Q1 2013 Segment Profit Productivity & Reliability Employee Benefit Accrual Timing Volume Eliminations LME / MWP Price Impact Electricity Commodity Costs (Natural Gas) Q2 2013 Segment Profit $ in m illi o n s

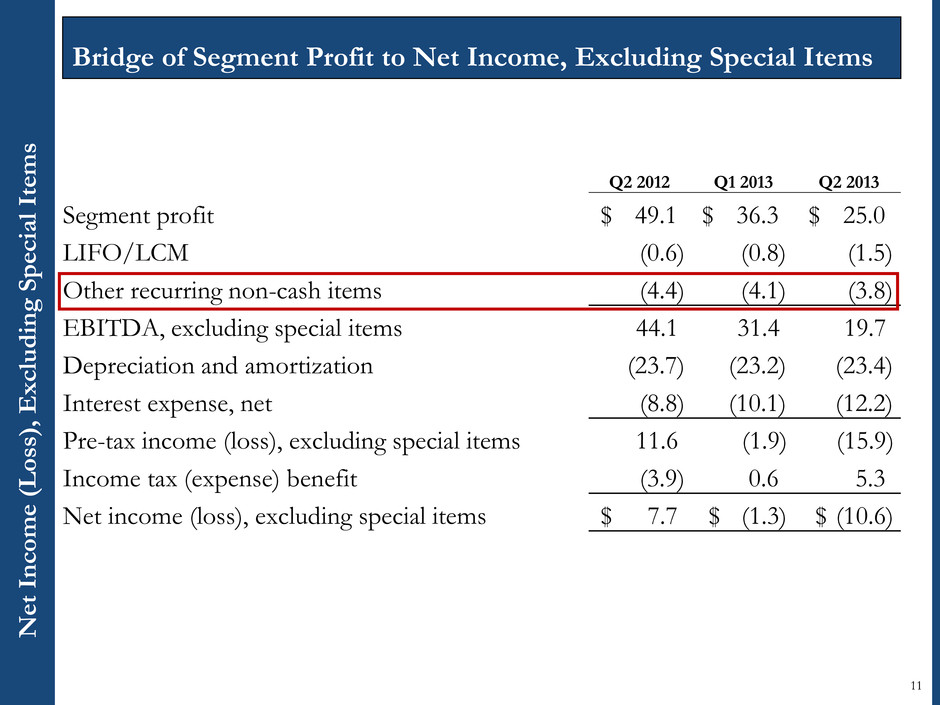
Ne t In c ome (Los s) , E x c ludin g Sp e cia l It e m s 11 Bridge of Segment Profit to Net Income, Excluding Special Items Q2 2012 Q1 2013 Q2 2013 Segment profit $ 49.1 $ 36.3 $ 25.0 LIFO/LCM (0.6) (0.8) (1.5) Other recurring non-cash items (4.4) (4.1) (3.8) EBITDA, excluding special items 44.1 31.4 19.7 Depreciation and amortization (23.7) (23.2) (23.4) Interest expense, net (8.8) (10.1) (12.2) Pre-tax income (loss), excluding special items 11.6 (1.9) (15.9) Income tax (expense) benefit (3.9) 0.6 5.3 Net income (loss), excluding special items $ 7.7 $ (1.3) $ (10.6)

Financia l Mana g em e nt Revie w 12 Liquidity and Capitalization Highlights $8.5 $6.9 $2.7 $20.0 $25.0 $7.2 $47.6 $16.1 $80.5 $57.8 $0 $10 $20 $30 $40 $50 $60 $70 $80 $90 Cash, March 2013 Segment Profit Operating Working Capital Taxesandother Cash Payments of Interest Term B Loan Proceeds, Net Cash Available for Investment, Distribution Regular Dividends Capital Expenditures Cash, June 2013 $ in m illi o n (1) Liquidity represents $143 million available borrowing capacity under the revolving credit facility plus $58 million cash • Net debt (debt minus cash) – $592.3 million • Net debt to trailing twelve month segment profit – 5.8x • No funded debt maturities before 2019 • Liquidity - $201 million(1)

2Q-13 results reflect improved operating reliability across our integrated upstream platform – Key performance metrics were consistent with previously communicated expectations – Stable shipment volumes across integrated platform – Consistently strong value-added and fabrication premiums for key aluminum products Our outlook supports previously communicated key 2013 operating metrics – Modest year-over-year volume improvement supported by further modest improvements in the U.S. economy and our productivity and reliability programs – Prices for key input costs remain stable – Third quarter cash cost bears full impact of peak power surcharge in New Madrid Our financial structure supports our ability to operate sustainably through the cycle – Increased our Term B Loan Facility by $50 million and added $15 million of commitments on a “first-in, last-out” basis to our existing asset-based revolving credit agreement in May – Approximately $201 million of liquidity as of end of 2Q-13(1) – No maintenance covenants other than minimum ABL availability requirement – Planning to move forward with previously announced capital projects, supported by options for project-specific financing We are effectively executing our playbook for managing through this portion of the commodity cycle – Near-term, have taken and continue to take actions to manage controllable costs and working capital Key Takeaways 13 1 2 Summa ry 3 4 (1) Represents $143 million available borrowing capacity under the revolving credit facility plus $58 million cash

Non-GAAP Measure: Disclaimer No n -GA A P M ea sure: Disclaim er This presentation contains non-GAAP financial measures as defined by SEC rules. We believe these measures are helpful to investors in measuring our financial performance and comparing our performance to our peers. However, our non-GAAP financial measures may not be comparable to similarly titled non- GAAP financial measures used by other companies. These non-GAAP financial measures have limitations as an analytical tool and should not be considered in isolation or as a substitute for U.S. GAAP financial measures. To the extent we disclose any non-GAAP financial measures, a reconciliation of each measure to the most directly comparable U.S. GAAP measure is available in the Press Release included as an exhibit to the Current Report on Form 8-K to which this presentation is also an exhibit. As such, this presentation should be read in conjunction with our Press Release. 14

