Attached files
| file | filename |
|---|---|
| 8-K - 8-K - SIGMA ALDRICH CORP | a8kwrapper.htm |

© 2013 Sigma-Aldrich Co. All rights reserved. Sigma-Aldrich Corporation •Q2 2013 Earnings Review & 2013 Outlook Enabling Science to Improve the Quality of Life

© 2013 Sigma-Aldrich Co. All rights reserved. 2 Cautionary Statements • The earnings call and this presentation contain “forward-looking statements” regarding future sales, earnings, return on equity, cost savings, process improvements, free cash flow, ROIC, share repurchases, capital expenditures, acquisitions and other matters. Such statements can be identified by words such as: “expected,” “expects,” “reaffirm,” “on track,” “forecast,” “would,” “estimate,” “will,” or similar expressions to future periods. Forward-looking statements are neither historical facts nor assurances of future performance. Instead, they are based only on our current beliefs, expectations and assumptions regarding the future of our business, future plans and strategies, projections, anticipated events and trends, the economy and other future conditions. Because forward-looking statements relate to the future, they are subject to inherent uncertainties, risks and changes in circumstances that are difficult to predict and many of which are outside of our control. Actual results could differ materially from those stated or implied in the forward-looking statements. For a list of factors, risks and uncertainties which could make our actual results differ from expected results, please see the accompanying earnings release posted to the investor relations’ section of our website at www.sigma-aldrich.com and Item 1A of Part I of our latest Annual Report on Form 10-K. We undertake no obligation to publicly update any forward-looking statement, whether written or oral, as a result of new information, future developments or otherwise. • The earnings call and this presentation also contain non-GAAP financial information. Management uses this information in its internal analysis of results and believes this information may be informative to investors in gauging the quality of our financial performance, identifying trends in our results and providing meaningful period-to-period comparisons. For a reconciliation of non-GAAP measures presented on the earnings call and in this presentation, see the accompanying earnings release and the Appendix to this presentation – Reconciliation of GAAP to Non-GAAP Financial Measures.
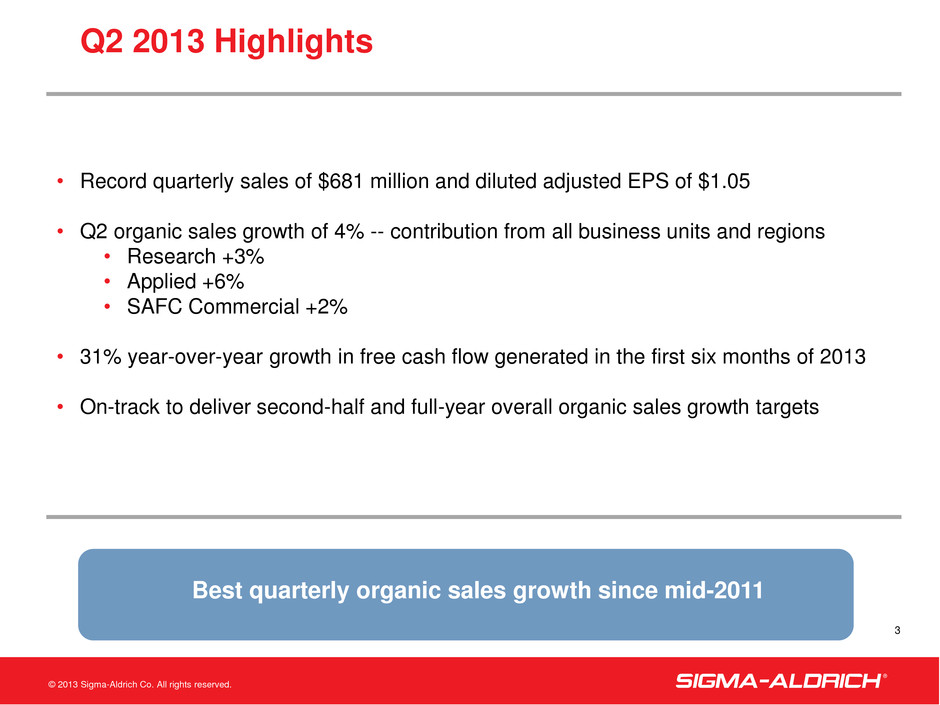
© 2013 Sigma-Aldrich Co. All rights reserved. • Record quarterly sales of $681 million and diluted adjusted EPS of $1.05 • Q2 organic sales growth of 4% -- contribution from all business units and regions • Research +3% • Applied +6% • SAFC Commercial +2% • 31% year-over-year growth in free cash flow generated in the first six months of 2013 • On-track to deliver second-half and full-year overall organic sales growth targets 3 Q2 2013 Highlights Best quarterly organic sales growth since mid-2011

© 2013 Sigma-Aldrich Co. All rights reserved. 4 Q1 Q2 (1%) 3% Academic/Govt/Hospitals (Mid-single) Low-single Pharma Flat Low-to-mid single Dealers Low-to-mid single Mid-single 2013 Overall Organic Percentage Growth:Q2 and Q1 Organic Sales Performance vs. Prior Year Business Unit: Research Improving trends in Pharma, new initiatives gaining traction Building foundation for improving organic sales growth in 2H 2013
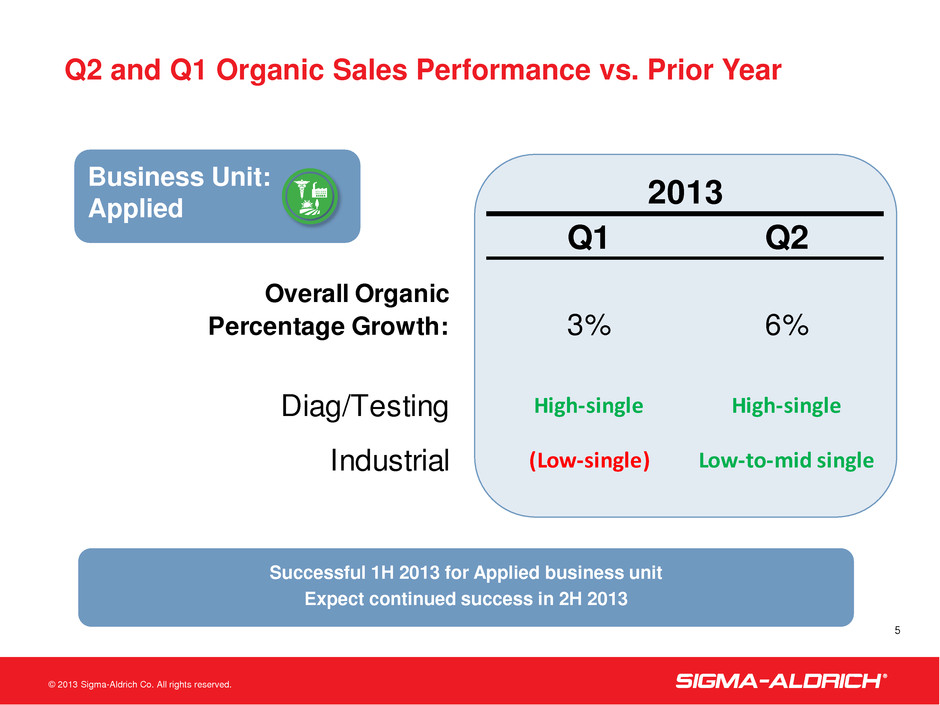
© 2013 Sigma-Aldrich Co. All rights reserved. 5 Q1 Q2 3% 6% Diag/Testing High-single High-single Industrial (Low-single) Low-to-mid single 2013 Overall Organic Percentage Growth: Q2 and Q1 Organic Sales Performance vs. Prior Year Successful 1H 2013 for Applied business unit Expect continued success in 2H 2013 Business Unit: Applied

© 2013 Sigma-Aldrich Co. All rights reserved. 6 Q1 Q2 Overall Organic Percentage Growth: 3% 2% High-single High-single Hitech Electronics (Double) (Double) Life Science Services (Mid-single) Low-single Life Science Products 2013 Q2 and Q1 Organic Sales Performance vs. Prior Year Excluding weakness in LED precursor market, SAFC Commercial would have grown organically in the mid-to-high single digits Business Unit: SAFC Commercial

© 2013 Sigma-Aldrich Co. All rights reserved. (1) See Slide 17 for Reconciliation of Net Cash Provided by Operating Activities to Free Cash Flow. (2) Excludes Other charges. 7 Second Quarter 2013 Financial Results ($ in millions, except per share amounts) YEAR-OVER-YEAR YEAR-OVER-YEAR As Reported Q2 2013 As Reported As Reported Q2 2013 Q2 2013 Organic Sales Growth Sales $ 681 3% $ 681 4 % As Reported Q2 2013 As Reported Adjusted Q2 2013 Adjusted (2) Operating Income $ 166 1% $ 178 4% Net Income $ 119 3% $ 127 8% Diluted EPS $0.98 4% $1.05 8% Free Cash Flow (1) $ 91 63% Record quarterly sales and adjusted EPS

© 2013 Sigma-Aldrich Co. All rights reserved. (1) See Slide 17 for Reconciliation of Net Cash Provided by Operating Activities to Free Cash Flow. (2) Excludes Other charges. 8 First Six Months 2013 Financial Results ($ in millions, except per share amounts) YEAR-OVER-YEAR YEAR-OVER- YEAR As Reported Six Months 2013 As Reported As Reported Six Months 2013 Six Months 2013 Organic Sales Growth Sales $ 1,356 2% $ 1,356 2 % As Reported Six Months 2013 As Reported Adjusted Six Months 2013 Adjusted (2) Operating Income $ 332 2% $ 344 1% Net Income $ 241 4% $ 249 4% Diluted EPS $1.99 5% $2.06 5% Free Cash Flow (1) $ 220 31% Changes in FX rates reduced operating income by $4 Million, or $0.02 of Adjusted EPS

© 2013 Sigma-Aldrich Co. All rights reserved. 9 Margin Trend Q3 2012 Q4 2012 Q1 2013 Q2 2013 Gross Margin % 50.7% 50.1% 51.0% 50.1% Adjusted Operating Margin % 25.0% 25.2% 24.6% 26.1% Gross margin and adjusted operating margin percentage remained relatively consistent with prior quarters

© 2013 Sigma-Aldrich Co. All rights reserved. 10 Updated 2013 Guidance Organic Sales Growth Changes in FX will result in $0.10 decline in full-year adjusted EPS 2013 full-year adjusted EPS expected to be in a range of $4.05 to $4.15 1st Half 2nd Half Full Year Research 1% Low-to-mid single digit Continue to expect overall low-to-mid single digit organic sales growth Applied 4% Mid-single digit SAFC Commercial 3% Mid-single digit

© 2013 Sigma-Aldrich Co. All rights reserved. Sigma-Aldrich Corporation Q2 2013 Earnings Review Questions?
© 2013 Sigma-Aldrich Co. All rights reserved. Appendix •Reconciliation of GAAP to Non-GAAP Financial Measures

© 2013 Sigma-Aldrich Co. All rights reserved. 2013 2012 2013 2012 Reported net income 119$ 115$ $0.98 $0.94 Other charges 8 3 0.07 0.03 Adjusted net income 127$ 118$ $1.05 $0.97 2013 2012 2013 2012 Reported net income 241$ 232$ 1.99$ 1.90$ Other charges 8 7 0.07 0.06 Adjusted net income 249$ 239$ 2.06$ 1.96$ June 30, June 30, Net Income Diluted Earnings (in millions) Per Share Six Months Ended Six Months Ended Three Months Ended Three Months Ended June 30, June 30, Net Income Diluted Earnings (in millions) Per Share Reconciliation of Reported Net Income and Diluted Earnings Per Share to Adjusted Net Income and Adjusted Diluted Earnings Per Share (Unaudited) 13

© 2013 Sigma-Aldrich Co. All rights reserved. Reconciliation of Reported Operating Income to Adjusted Operating Income (Unaudited) 14 2013 2012 Reported operating income 166$ 167$ Other charges 12 4 Adjusted operating income 178$ 171$ 2013 2012 Reported operating income 332$ 339$ Other charges 12 9 Adjusted operating income 344$ 348$ Six Months Ended June 30, Three Months Ended June 30, In millions
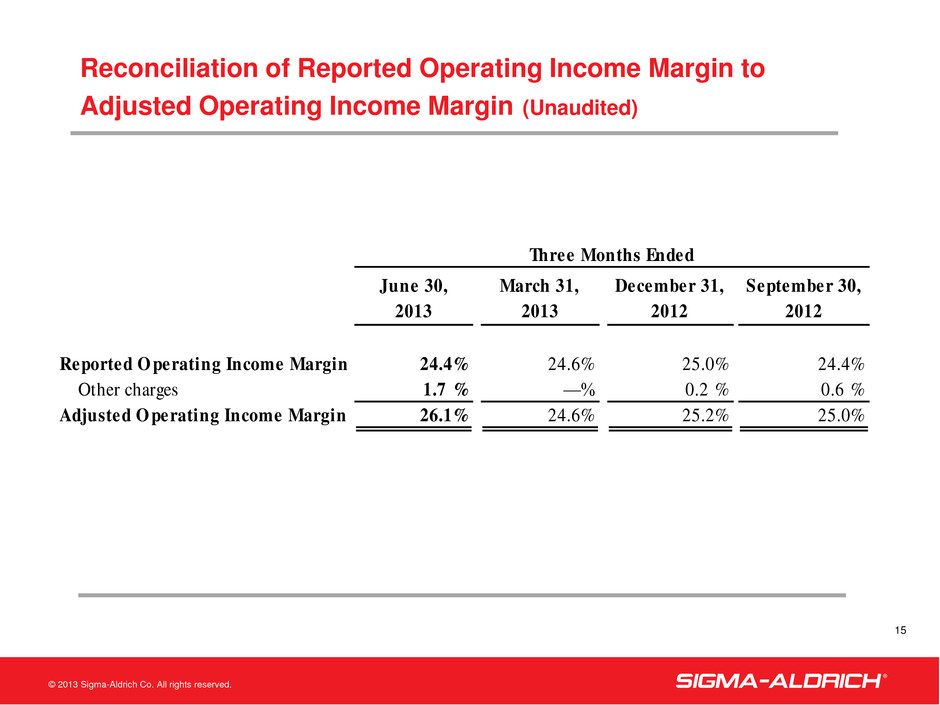
© 2013 Sigma-Aldrich Co. All rights reserved. Reconciliation of Reported Operating Income Margin to Adjusted Operating Income Margin (Unaudited) 15 June 30, March 31, December 31, September 30, 2013 2013 2012 2012 Reported O perating Income Margin 24.4% 24.6% 25.0% 24.4% Other charges 1.7 % —% 0.2 % 0.6 % Adjusted O perating Income Margin 26.1% 24.6% 25.2% 25.0% Three Months Ended

© 2013 Sigma-Aldrich Co. All rights reserved. Reconciliation of Reported Operating Income Margin to Adjusted Operating Income Margin (Unaudited) 16 2013 2012 2013 2012 Reported operating income margin 24.4% 25.2% 24.5% 25.5% Other charges 1.7% 0.6% 0.9% 0.7% Adjusted operating income margin 26.1% 25.8% 25.4% 26.2% Three Months Ended Six Months Ended June 30, June 30,
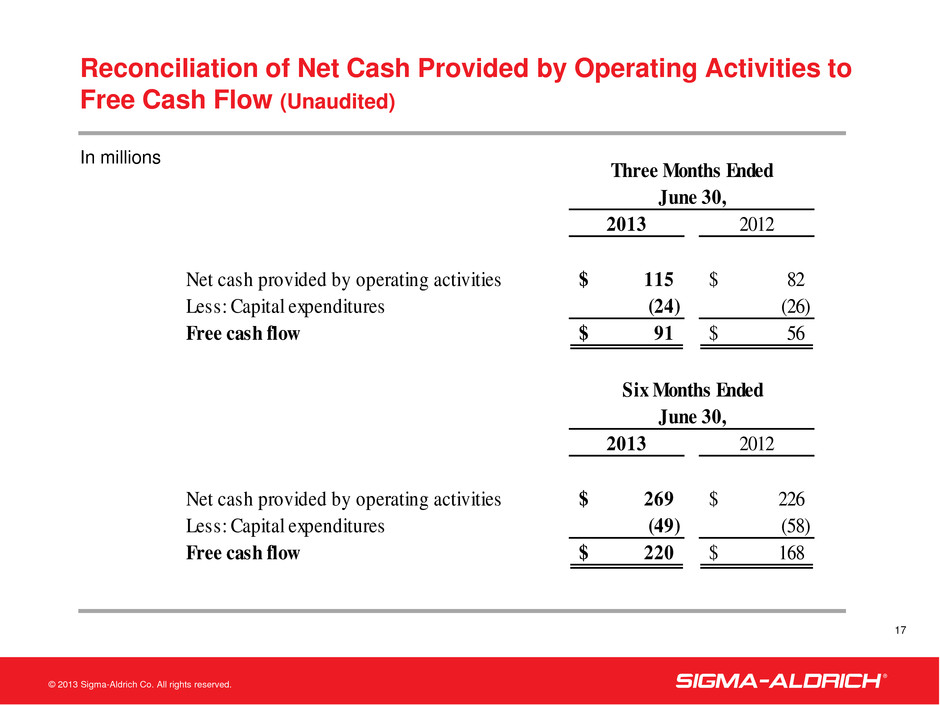
© 2013 Sigma-Aldrich Co. All rights reserved. Reconciliation of Net Cash Provided by Operating Activities to Free Cash Flow (Unaudited) 17 2013 2012 Net cash provided by operating activities 115$ 82$ Less: Capital expenditures (24) (26) Free cash flow 91$ 56$ 2013 2012 Net cash provided by operating activities 269$ 226$ Less: Capital expenditures (49) (58) Free cash flow 220$ 168$ Six Months Ended June 30, June 30, Three Months Ended In millions
