Attached files
| file | filename |
|---|---|
| EX-5.1 - EX-5.1 - CONTROL4 CORP | a2215893zex-5_1.htm |
| EX-23.1 - EX-23.1 - CONTROL4 CORP | a2215893zex-23_1.htm |
| EX-3.1.1 - EX-3.1.1 - CONTROL4 CORP | a2215893zex-3_11.htm |
Use these links to rapidly review the document
TABLE OF CONTENTS
INDEX TO CONSOLIDATED FINANCIAL STATEMENTS
As filed with the Securities and Exchange Commission on July 22, 2013
Registration No. 333-189736
UNITED STATES
SECURITIES AND EXCHANGE COMMISSION
WASHINGTON, D.C. 20549
Amendment No. 2
to
FORM S-1
REGISTRATION STATEMENT
UNDER
THE SECURITIES ACT OF 1933
Control4 Corporation
(Exact name of registrant as specified in its charter)
| Delaware (State or other jurisdiction of incorporation or organization) |
3670 (Primary Standard Industrial Classification Code Number) |
42-1583209 (I.R.S. Employer Identification Number) |
11734 S. Election Road
Salt Lake City, Utah 84020
(801) 523-3100
(Address, including zip code, and telephone number, including
area code, of registrant's principal executive offices)
Martin Plaehn
President and Chief Executive Officer
11734 S. Election Road
Salt Lake City, Utah 84020
(801) 523-3100
(Name, address, including zip code, and telephone number, including
area code, of agent for service)
| Copies to: | ||||
William J. Schnoor Richard A. Kline Michael J. Minahan Goodwin Procter LLP 135 Commonwealth Drive Menlo Park, California 94025 (650) 752-3100 |
Greg Bishop General Counsel, Chief Compliance Officer and Corporate Secretary 11734 S. Election Road Salt Lake City, Utah 84020 (801) 523-3100 |
Eric C. Jensen Andrew S. Williamson Cooley LLP 3175 Hanover Street Palo Alto, California 94304 (650) 843-5000 |
||
Approximate date of commencement of proposed sale to the public:
As soon as practicable after this registration statement becomes effective.
If any of the securities being registered on this Form are to be offered on a delayed or continuous basis pursuant to Rule 415 under the Securities Act of 1933 check the following box: o
If this Form is filed to register additional securities for an offering pursuant to Rule 462(b) under the Securities Act, please check the following box and list the Securities Act registration statement number of the earlier effective registration statement for the same offering. o
If this Form is a post-effective amendment filed pursuant to Rule 462(c) under the Securities Act, check the following box and list the Securities Act registration statement number of the earlier effective registration statement for the same offering. o
If this Form is a post-effective amendment filed pursuant to Rule 462(d) under the Securities Act, check the following box and list the Securities Act registration statement number of the earlier effective registration statement for the same offering. o
Indicate by check mark whether the registrant is a large accelerated filer, an accelerated filer, a non-accelerated filer, or a smaller reporting company. See the definitions of "large accelerated filer," "accelerated filer" and "smaller reporting company" in Rule 12b-2 of the Exchange Act. (Check one)
| Large accelerated filer o | Accelerated filer o | Non-accelerated filer ý (Do not check if a small reporting company) |
Smaller reporting company o |
CALCULATION OF REGISTRATION FEE
|
||||||||
| Title of Each Class of Securities to be Registered |
Amount to be Registered(1) |
Proposed Maximum Aggregate Offering Price Per Share(2) |
Proposed Maximum Aggregate Offering Price(2) |
Amount of Registration Fee(3) |
||||
|---|---|---|---|---|---|---|---|---|
Common Stock, par value $0.0001 per share |
4,600,000 | $17.00 | $78,200,000 | $10,667 | ||||
|
||||||||
- (1)
- Includes
600,000 shares of common stock that the underwriters may purchase to cover overallotments, if any.
- (2)
- Estimated
solely for the purpose of calculating the registration fee in accordance with Rule 457(a) of the Securities Act of 1933, as amended.
Includes offering price of additional shares that the underwriters have the option to purchase.
- (3)
- The registrant previously paid $8,184 of the registration fee with the initial filing of this registration statement.
The registrant hereby amends this registration statement on such date or dates as may be necessary to delay its effective date until the registrant shall file a further amendment which specifically states that this registration statement shall thereafter become effective in accordance with Section 8(a) of the Securities Act of 1933 or until the registration statement shall become effective on such date as the Securities and Exchange Commission, acting pursuant to said Section 8(a), may determine.
The information in this preliminary prospectus is not complete and may be changed. We may not sell these securities until the registration statement filed with the Securities and Exchange Commission is effective. This preliminary prospectus is not an offer to sell these securities and it is not soliciting an offer to buy these securities in any state where the offer or sale is not permitted.
Subject to Completion
Preliminary Prospectus dated July 19, 2013
PROSPECTUS
4,000,000 Shares

Common Stock
This is Control4 Corporation's initial public offering. We are selling 4,000,000 shares of our common stock.
We expect the public offering price to be between $15.00 and $17.00 per share. Currently, no public market exists for the shares. After pricing of the offering, we expect that the shares will trade on The NASDAQ Global Market under the symbol "CTRL".
We are an "emerging growth company" as defined in the Jumpstart our Business Startups Act of 2012 and, therefore, may comply with certain reduced public company reporting requirements.
Investing in the common stock involves risks that are described in the "Risk Factors" section beginning on page 15 of this prospectus.
| |
Per Share | Total | |||||
|---|---|---|---|---|---|---|---|
Public offering price |
$ | $ | |||||
Underwriting discount(1) |
$ | $ | |||||
Proceeds, before expenses, to us |
$ | $ | |||||
- (1)
- See "Underwriting" for a description of the compensation payable to the underwriters.
The underwriters may also exercise their option to purchase up to an additional 600,000 shares from us at the public offering price, less the underwriting discount, for 30 days after the date of this prospectus.
Neither the Securities and Exchange Commission nor any state securities commission has approved or disapproved of these securities or determined if this prospectus is truthful or complete. Any representation to the contrary is a criminal offense.
The shares will be ready for delivery on or about , 2013.
| BofA Merrill Lynch | Raymond James |
| Canaccord Genuity | Cowen and Company | Needham & Company |
The date of this prospectus is , 2013.

You should rely only on the information contained in this prospectus and in any free writing prospectus prepared by or on behalf of us and delivered or made available to you. We have not, and the underwriters have not, authorized anyone to provide you with information different from, or in addition to, that contained in this prospectus or any related free writing prospectus. We do not take responsibility for, and can provide no assurance as to the reliability of, any other information that others may give you. This prospectus is an offer to sell only the shares offered hereby but only under circumstances and in jurisdictions where it is lawful to do so. The information contained in this prospectus is current only as of its date.
No action is being taken in any jurisdiction outside the United States to permit a public offering of our common stock or possession or distribution of this prospectus in that jurisdiction. Persons who come into possession of this prospectus in a jurisdiction outside the United States are required to inform themselves about, and to observe any restrictions as to, this offering and the distribution of this prospectus applicable to that jurisdiction.
i
This summary highlights information contained elsewhere in this prospectus. Because this is only a summary, it does not contain all of the information that may be important to you. You should read this entire prospectus and should consider, among other things, the matters set forth under "Risk Factors," "Selected Consolidated Financial Data," "Management's Discussion and Analysis of Financial Condition and Results of Operations" and our consolidated financial statements and related notes thereto appearing elsewhere in this prospectus before making your investment decision.
Overview
Control4 is a leading provider of automation and control solutions for the connected home. We unlock the potential of connected devices, making entertainment systems easier to use, homes more comfortable and energy efficient, and families more secure. We provide our consumers with the ability to integrate music, video, lighting, temperature, security, communications and other functionalities into a unified home automation solution that enhances our consumers' daily lives. More than 75% of our consumers have integrated two or more of these functionalities with our solution. At the center of our solution is our advanced software platform, which we provide through our products that interface with a wide variety of connected devices that are developed both by us and by third parties.
Our solution functions as the operating system of the home, making connected devices work together to control, automate and personalize the homes of our consumers. For example, our solution can be configured so that:
- •
- A half hour before you wake up in the morning, the thermostat adjusts to heat up the house, the lights slowly become
brighter and the shades gradually open;
- •
- As you leave for work, one push of a button locks the doors, arms the security system, turns off all the lights, powers
down all non-essential devices and adjusts the temperature settings to the "away" mode;
- •
- When you return home in the evening, the push of a button opens your garage door, unlocks the door and adjusts the
thermostat to your preferred temperature;
- •
- When you are ready to watch a movie, instead of having to use several remotes, a single interface—be it a
touch screen, smartphone, tablet or simple remote—provides you with easy control of your entire entertainment system. As the movie starts, the window blinds close, the lights dim and the
temperature adjusts to keep your family comfortable; and
- •
- When it is time for bed, the press of a "goodnight" button closes the blinds, turns off the lights, locks the doors, arms the security system and turns off all televisions and game consoles.
At the center of the Control4 product line is the Control4 Home Operating System, which we refer to as the C4 OS. We embed our C4 OS in a range of products, including controller appliances, interfaces and connected devices that interact with various music, video, lighting, temperature, security, communications and other devices. We offer our 4Sight subscription service, which allows consumers to control and monitor their homes remotely from their smartphone, tablet or laptop, and allows our dealers to perform remote diagnostic services. For example, 4Sight allows a consumer to remotely unlock the front door to let in a repairman, to turn on the air conditioning on the way home, and to monitor the home security cameras from a smartphone. In addition, our 4Store application marketplace offers a range of third-party applications for use with our products. We derive virtually all of our revenue from the sale of products that contain our proprietary software, and a smaller portion from software licensing and annual service subscriptions.
1
We were founded in 2003 to deliver a home automation solution to the mainstream market by enabling consumers to unify their connected devices into a personalized system at an accessible and affordable entry point. Based on our analysis, through March 31, 2013, we estimate that we have automated more than 120,000 homes representing cumulative sales of more than 275,000 of our controller appliances, the brain of the connected home. We sell and deliver our solutions through an extensive worldwide dealer and distributor network and have solutions installed in 81 countries. Our top 100 dealers represented 24% of our total revenue in 2012.
We generated revenue of $74.9 million, $93.4 million and $109.5 million in 2010, 2011 and 2012, respectively, and $26.6 million for the three months ended March 31, 2013. We had a net loss of $16.3 million, $3.9 million and $3.7 million in 2010, 2011 and 2012, respectively, and $1.5 million for the three months ended March 31, 2013.
Our Industry
Market Opportunity
Consumers are becoming more reliant on network-aware devices in their everyday lives, contributing to the creation of a large opportunity in the mainstream home automation market. Growth in smart devices, such as smartphones and tablets, and the ubiquity of wireless networks have combined to create the "connected consumer." These consumers are seeking a connected home with expanded capabilities in the form of networks, connected devices and smart systems.
Historically, the home automation market was primarily comprised of luxury systems that were so expensive that only wealthy consumers could afford the programming and installation costs. As consumer awareness of home automation grows and expectations for interoperable and more affordable solutions increase, the mainstream segment of the home automation market is expected to expand rapidly. According to ABI Research, the mainstream segment of the home automation market was estimated to be a $571 million market in 2012 and a $2.6 billion market by 2017, representing a CAGR of 35%, as consumers look for centralized solutions to provide personalized control and automation of their homes.
Consumer Requirements
For mainstream consumers to embrace a home automation solution, we believe that the solution must have the following attributes:
- •
- Easy to
Use. Accustomed to easy-to-use smartphones, consumers want a simple, unified, yet powerful and innovative
interface for the unique set of devices and systems they have in their homes;
- •
- Interoperable. Consumers are looking for a single solution with the ability to manage
their network of current and future devices, regardless of manufacturer, technology or communication protocol;
- •
- Personalized and
Flexible. Consumers want to be able to easily personalize the behavior of the devices in their homes to reflect their own lifestyles and
preferences—now and into the future—providing flexibility as their needs and lifestyles change;
- •
- Affordable and
Future-Proof. Consumers want a home automation solution that delivers rich functionality at an affordable price point and that adapts to
changing needs over time without significant cost or disruption; and
- •
- Accessible Service and Support. Consumers are looking for solutions that are supported by local trained specialists who can provide both responsive initial consultation and installation, as well as ongoing service and support.
2
Limitations of Traditional Approaches
The home automation market has traditionally been comprised of:
- •
- Luxury
Installations. Generally found in the highest end segment of the market, these systems and installations are typically complex, lengthy,
inflexible and expensive;
- •
- Managed
Services. Generally provided by a cable, telephone or security provider, these services come as a non-personalized,
one-size-fits-all service with narrow capabilities and recurring monthly charges; and
- •
- Point Products. Generally supplied by companies focused on a discrete function within the home, these products typically lack interoperability with other devices.
Our Solution
The Control4 solution, built around our advanced software platform, sits at the center of the fast-growing mainstream segment of the home automation market. Our solution functions as the operating system of the home, integrating music, video, lighting, temperature, security, communications and other devices into a unified automation solution that enhances our consumers' daily lives. Our solution provides the consumer with the following key benefits:
- •
- Easy to
Use. Our solution is designed to be simple and intuitive. For example, our easy-to-use interfaces can be as
advanced as a smartphone, tablet, in-wall touch panel, television or multi-function remote control, or as simple as a single button or switch;
- •
- Broad Device
Interoperability. Our open and flexible solution provides consumers with access to a broad universe of over 6,400 discrete third-party
devices. With our solution, consumers can connect and automate the devices they already own—as well as the devices they purchase in the future—and have the confidence that all
of those devices will interoperate as seamlessly as if they were made by the same manufacturer;
- •
- Advanced
Personalization. Our adaptable solution enables consumers to personalize the features and functionality of their Control4 system. Our
modular design also enables the smooth integration of new third-party products to meet the evolving needs of our consumers as their lifestyles change;
- •
- Attractive Entry
Point. According to ABI Research, the typical luxury home automation installation can cost $60,000 or more for whole-home systems. With
our solution, consumers can start with a single-room multi-media automation experience for about $1,000 and scale to an integrated solution with an average cost of $26,000;
- •
- Professional Installation and Support Through Our Global Dealer
Network. We have built a global network of over 2,800 active direct dealers and distributors to help consumers develop and install their
customized home automation experiences with the Control4 solution; and
- •
- Remote Access and Specialized Apps. We have developed complementary services and applications offerings to provide consumers more access, control and enhanced functionality over their automated homes.
3
Our Growth Strategy
Our goal is to be the leading global provider of mainstream home automation solutions and the operating system of choice for the home. The following are key elements of our growth strategy:
- •
- Enhance Our Software Platform and
Products. We intend to continue to invest in our software platform to develop new products, features and capabilities that deliver
exceptional performance and value to our consumers;
- •
- Strengthen and Expand Our Global Dealer
Network. We plan to continue to expand, train, support and optimize our global certified dealer network to ensure that we have
sufficient geographic coverage across both existing and new markets;
- •
- Increase Penetration of Our North America Core
Market. We intend to continue to focus sales and marketing resources to increase penetration of the residential market in North America;
- •
- Expand Our Focus on Adjacent
Markets. We plan to continue making investments to capitalize on opportunities outside the residential market, including in the light
commercial, multi-dwelling unit and hospitality markets, and internationally;
- •
- Enhance Our Solution with Services and
Apps. We intend to continue to enhance our 4Sight subscription services and to support third-party apps via our 4Store application
marketplace to deliver more functionality and value to our consumers;
- •
- Pursue Technology Licensing
Opportunities. We plan to expand our licensing activities to leverage third-party distribution channels, grow our partner relationships,
and simplify the home automation experience for dealers and consumers; and
- •
- Pursue Strategic Acquisitions. We intend to identify, acquire and integrate strategic technologies, assets and businesses that we believe will enhance the overall strength of our business.
Risks Related to Our Business
Our business is subject to numerous risks and uncertainties, including those highlighted in "Risk Factors" immediately following this prospectus summary. These risks include, but are not limited to, the following:
- •
- We have incurred operating losses in the past, may incur operating losses in the future, and may not achieve or maintain
profitability;
- •
- The markets in which we participate are highly competitive and many companies, including large technology companies,
broadband and security service providers and other managed service providers, are actively targeting the home automation market. Our failure to differentiate ourselves and compete successfully with
these companies would make it difficult for us to add and retain consumers, and would reduce or impede the growth of our business;
- •
- Consumers may choose to adopt point products that provide control of a discrete home function rather than adopting our
unified home automation solution. If we are unable to increase market awareness of the benefits of our unified solution, our revenue may not continue to grow, or it may decline;
- •
- Many of the competitors in our market, including providers of luxury integrated solutions with long operating histories, established markets, broad user bases and proven consumer acceptance, may be successful in expanding into the mainstream home automation market, which may harm our growth and future prospects;
4
- •
- Since we rely on third-party dealers and distributors to sell and install our solutions, we do not have a direct sales
pipeline, which makes it difficult for us to accurately forecast future sales and correctly predict manufacturing requirements;
- •
- Our quarterly results of operations have fluctuated and may continue to fluctuate. As a result, we may fail to meet or
exceed the expectations of investors or securities analysts, which could cause our stock price to decline; and
- •
- If we are unable to develop new solutions, sell our solutions into new markets or further penetrate our existing markets, our revenue may not grow as expected.
Corporate Information
We were incorporated in Delaware in 2003. Our principal executive offices are located at 11734 South Election Road, Suite 200, Salt Lake City, Utah 84020, and our telephone number is (801) 523-3100. Our principal website address is www.control4.com. Information contained on our website does not constitute a part of, and is not incorporated by reference into, this prospectus.
Control4, the Control4 logo, 4Sight, 4Store and Control4 MyHome are registered trademarks or trademarks of Control4 Corporation in the United States and, in certain cases, in other countries. This prospectus contains additional trade names, trademarks and service marks of other companies. We do not intend our use or display of these companies' trade names, trademarks or service marks to imply a relationship with, or endorsement or sponsorship of us by, these other companies.
We are an emerging growth company as defined in the Jumpstart Our Business Startups Act of 2012, or the JOBS Act. We will remain an emerging growth company until the earliest to occur of: the last day of the fiscal year in which we have more than $1.0 billion in annual revenue; the date we qualify as a "large accelerated filer," with at least $700 million of equity securities held by non-affiliates; the issuance, in any three-year period, by us of more than $1.0 billion in non-convertible debt securities; or the last day of the fiscal year ending after the fifth anniversary of our initial public offering.
5
Common stock offered by Control4 Corporation |
4,000,000 shares | |
Common stock to be outstanding after the offering |
22,094,267 shares |
|
Option to purchase additional shares offered by Control4 Corporation. |
600,000 shares |
|
Use of Proceeds |
The net proceeds to us from this offering will be approximately $57.0 million (or approximately $65.9 million if the underwriters' option to purchase additional shares is exercised in full), based upon an assumed initial public offering price of $16.00 share, which is the midpoint of the price range set forth on the cover page of this prospectus, and after deducting estimated underwriting discounts and commissions and estimated offering expenses payable by us. We intend to use the net proceeds from this offering for general corporate purposes, including working capital and capital expenditures. We intend to use $2.25 million of the net proceeds from this offering to pay off the remaining amounts owed under a litigation settlement agreement. We may also use a portion of the net proceeds from this offering for acquisitions of complementary technologies, assets or businesses. |
|
Risk Factors |
See "Risk Factors" and the other information included in this prospectus for a discussion of factors you should carefully consider before deciding to invest in our common stock. |
|
Proposed NASDAQ Global Market trading symbol |
"CTRL" |
The number of shares of our common stock to be outstanding after the completion of this offering is based on:
- •
- 17,801,035 shares outstanding as of March 31, 2013;
- •
- 76,964 shares of common stock, on an as-converted basis, issuable upon the net exercise of a warrant to
purchase 182,666 shares of preferred stock outstanding as of March 31, 2013 at an exercise price of $9.26, which would terminate upon this offering in accordance with its terms; and
- •
- 216,268 shares of common stock issuable upon the net exercise of warrants to purchase 541,235 shares of common stock outstanding as of March 31, 2013 at a weighted average exercise price of $9.61, which would terminate upon this offering in accordance with their terms.
The number of shares of our common stock to be outstanding after the completion of this offering excludes:
- •
- 4,609,466 shares of common stock issuable upon the exercise of options outstanding as of March 31, 2013 at a weighted average exercise price of $5.56 per share of which 21,246
6
- •
- 389,782 shares of common stock issuable upon the exercise of options that were granted after March 31, 2013, with
an exercise price of $11.28 per share;
- •
- 11,715 shares of common stock, on an as-converted basis, issuable upon the exercise of warrants to purchase preferred
stock outstanding as of March 31, 2013 at a weighted average exercise price of $7.71 per share that will remain outstanding following this offering if not exercised; and
- •
- 2,200,000 shares reserved for future issuance under our 2013 Stock Option and Incentive Plan, as well as shares originally reserved for issuance under our 2003 Equity Incentive Plan, but which may become available for awards under our 2013 Stock Option and Incentive Plan, which plan will become effective in connection with this offering and contains provisions that will automatically increase its share reserve each year, as more fully described in "Executive Compensation—Employee Benefit Plans."
shares of common stock were issued upon the exercise of options with a weighted average exercise price of $5.93 after March 31, 2013;
Except for historical financial statements or as otherwise indicated, information in this prospectus reflects or assumes the following:
- •
- A 1-for-5.2 reverse stock split effected on July 18, 2013;
- •
- The filing of our amended and restated certificate of incorporation immediately prior to the closing of this offering;
- •
- The conversion of all of our outstanding preferred stock into an aggregate of 15,293,960 shares of common stock
immediately prior to the closing of this offering;
- •
- No exercise after March 31, 2013 of outstanding options or warrants; and
- •
- No exercise of the underwriters' option to purchase additional shares.
7
SUMMARY CONSOLIDATED FINANCIAL DATA
We have derived the summary consolidated statements of operations data for the fiscal years ended December 31, 2010, 2011 and 2012 from our audited consolidated financial statements included elsewhere in this prospectus. We have derived the summary consolidated statements of operations data for the three months ended March 31, 2012 and March 31, 2013 and our consolidated balance sheet data as of March 31, 2013 from our unaudited interim consolidated financial statements included elsewhere in this prospectus. The unaudited interim financial statements reflect, in the opinion of management, all adjustments of a normal, recurring nature that are necessary for the fair presentation of the financial statements. Our historical results are not necessarily indicative of our future results. The following summary consolidated financial data should be read in conjunction with "Management's Discussion and Analysis of Financial Condition and Results of Operations" and our consolidated financial statements and related notes included elsewhere in this prospectus.
| |
Years Ended December 31, | Three Months Ended March 31, |
||||||||||||||
|---|---|---|---|---|---|---|---|---|---|---|---|---|---|---|---|---|
| |
2010 | 2011 | 2012 | 2012 | 2013 | |||||||||||
| |
(In thousands, except per share data) |
|||||||||||||||
Consolidated Statements of Operations Data: |
||||||||||||||||
Revenue |
$ | 74,925 | $ | 93,376 | $ | 109,512 | $ | 22,628 | $ | 26,571 | ||||||
Cost of revenue |
43,357 | 50,534 | 57,225 | 12,466 | 13,550 | |||||||||||
Cost of revenue—inventory purchase commitment |
— | — | 1,840 | — | — | |||||||||||
Gross margin |
31,568 | 42,842 | 50,447 | 10,162 | 13,021 | |||||||||||
Operating expenses: |
||||||||||||||||
Research and development |
15,922 | 19,211 | 20,310 | 4,813 | 6,066 | |||||||||||
Sales and marketing |
22,491 | 17,546 | 20,182 | 5,038 | 5,605 | |||||||||||
General and administrative |
8,876 | 9,805 | 10,150 | 2,532 | 2,828 | |||||||||||
Litigation settlement |
— | — | 2,869 | — | — | |||||||||||
Total operating expenses |
47,289 | 46,562 | 53,511 | 12,383 | 14,499 | |||||||||||
Loss from operations |
(15,721 | ) | (3,720 | ) | (3,064 | ) | (2,221 | ) | (1,478 | ) | ||||||
Interest and other expense, net |
(544 | ) | (165 | ) | (518 | ) | (462 | ) | (49 | ) | ||||||
Loss before income taxes |
$ | (16,265 | ) | $ | (3,885 | ) | $ | (3,582 | ) | $ | (2,683 | ) | $ | (1,527 | ) | |
Income tax (expense) benefit |
— | — | (141 | ) | — | 56 | ||||||||||
Net loss |
$ | (16,265 | ) | $ | (3,885 | ) | $ | (3,723 | ) | $ | (2,683 | ) | $ | (1,471 | ) | |
Net loss per common share, basic and diluted |
$ | (9.93 | ) | $ | (2.02 | ) | $ | (1.58 | ) | $ | (1.19 | ) | $ | (0.59 | ) | |
Weighted-average number of shares, basic and diluted |
1,638 | 1,923 | 2,360 | 2,249 | 2,502 | |||||||||||
Pro forma net loss per common share, basic and diluted (unaudited)(1) |
$ | (0.21 | ) | $ | (0.08 | ) | ||||||||||
Pro forma weighted-average number of common shares, basic and diluted (unaudited) |
17,947 | 18,089 | ||||||||||||||
Other Non-GAAP Financial Data: |
||||||||||||||||
Adjusted gross margin |
$ | 31,596 | $ | 42,891 | $ | 52,365 | $ | 10,179 | $ | 13,037 | ||||||
Adjusted gross margin percentage |
42.2% | 45.9% | 47.8% | 45.0% | 49.1% | |||||||||||
Adjusted operating income (loss) |
$ | (14,252 | ) | $ | (1,707 | ) | $ | 4,514 | $ | (1,490 | ) | $ | (640 | ) | ||
- (1)
- Pro forma net loss per common share has been calculated assuming the conversion of all outstanding shares of our preferred stock as of March 31, 2013 into 15,293,960 shares of common stock and the net exercise of outstanding warrants to purchase 723,901 shares of capital stock into an aggregate of 293,232 shares of common stock as of March 31, 2013 prior to the completion of this offering.
8
Stock-based compensation expense included in the consolidated statements of operations data above was as follows:
| |
Years Ended December 31, | Three Months Ended March 31, |
||||||||||||||
|---|---|---|---|---|---|---|---|---|---|---|---|---|---|---|---|---|
| |
2010 | 2011 | 2012 | 2012 | 2013 | |||||||||||
| |
(In thousands) |
|||||||||||||||
Cost of revenue |
$ | 28 | $ | 49 | $ | 78 | $ | 17 | $ | 16 | ||||||
Research and development |
249 | 492 | 704 | 130 | 236 | |||||||||||
Sales and marketing |
546 | 523 | 580 | 144 | 184 | |||||||||||
General and administrative |
646 | 949 | 1,507 | 440 | 402 | |||||||||||
Total stock-based compensation expense |
$ | 1,469 | $ | 2,013 | $ | 2,869 | $ | 731 | $ | 838 | ||||||
Reconciliation of Non-GAAP Financial Data
Adjusted Gross Margin
A reconciliation of Adjusted gross margin to gross margin, the most directly comparable GAAP financial measure, is presented below:
| |
Years Ended December 31, | Three Months Ended March 31, |
||||||||||||||
|---|---|---|---|---|---|---|---|---|---|---|---|---|---|---|---|---|
| |
2010 | 2011 | 2012 | 2012 | 2013 | |||||||||||
| |
(Dollars in thousands) |
|||||||||||||||
Gross margin |
$ | 31,568 | $ | 42,842 | $ | 50,447 | $ | 10,162 | $ | 13,021 | ||||||
Stock-based compensation expense included in cost of revenue |
28 | 49 | 78 | 17 | 16 | |||||||||||
Cost of revenue—inventory purchase commitment |
— | — | 1,840 | — | — | |||||||||||
Adjusted gross margin |
$ | 31,596 | $ | 42,891 | $ | 52,365 | $ | 10,179 | $ | 13,037 | ||||||
Adjusted gross margin percentage |
42.2% | 45.9% | 47.8% | 45.0% | 49.1% | |||||||||||
To provide investors with additional information regarding our financial results, we have disclosed in the table above and within this prospectus Adjusted gross margin, a non-GAAP financial measure. We have included Adjusted gross margin in this prospectus because Adjusted gross margin is a key measure used by our management and board of directors to understand and evaluate our operating performance and trends, to prepare and approve our annual budget, and to develop short- and long-term operational plans.
Adjusted gross margin is defined as gross margin less stock-based compensation expense and loss on inventory purchase commitment. Management believes that the use of Adjusted gross margin provides consistency and comparability with our past and future performance, facilitates period-to-period comparisons and also facilitates comparisons with other companies.
Management believes that it is useful to exclude stock-based compensation expense from gross margin because the amount of such expense in any specific period may not directly correlate to the underlying performance of our business operations. We believe it is useful to exclude loss on inventory purchase commitment because it is an expense that arose from our commitment to purchase energy-related products from our contract manufacturing partner that we will not use due to our decision to discontinue our energy product line for utility customers. We have not incurred that type of expense in past periods and we believe that past and future periods are more comparable if we exclude that expense from gross margin.
9
Our use of Adjusted gross margin has limitations as an analytical tool and you should not consider it in isolation or a substitute for our analysis of our results as reported under GAAP. Some of these limitations are:
- •
- Adjusted gross margin does not reflect the potentially dilutive impact of equity-based compensation; and
- •
- Although we have not incurred significant loss on purchase commitments in the past, there is no guarantee that we will not incur those expenses in the future and therefore Adjusted gross margin may not be indicative of future performance.
Because of these limitations, you should consider Adjusted gross margin alongside other financial performance measures.
Adjusted Operating Income
A reconciliation of Adjusted operating income (loss) to loss from operations, the most directly comparable GAAP financial measure, is presented below:
| |
Years Ended December 31, | Three Months Ended March 31, |
||||||||||||||
|---|---|---|---|---|---|---|---|---|---|---|---|---|---|---|---|---|
| |
2010 | 2011 | 2012 | 2012 | 2013 | |||||||||||
| |
(In thousands) |
|||||||||||||||
Loss from operations |
$ | (15,721 | ) | $ | (3,720 | ) | $ | (3,064 | ) | $ | (2,221 | ) | $ | (1,478 | ) | |
Stock-based compensation expense |
1,469 | 2,013 | 2,869 | 731 | 838 | |||||||||||
Cost of revenue—inventory purchase commitment |
— | — | 1,840 | — | — | |||||||||||
Litigation settlement |
— | — | 2,869 | — | — | |||||||||||
Adjusted operating income (loss) |
$ | (14,252 | ) | $ | (1,707 | ) | $ | 4,514 | $ | (1,490 | ) | $ | (640 | ) | ||
To provide investors with additional information regarding our financial results, we have disclosed in the table above and within this prospectus Adjusted operating income, a non-GAAP financial measure. We have included Adjusted operating income in this prospectus because Adjusted operating income is a key measure used by our management and board of directors to understand and evaluate our operating performance and trends. We use it to prepare and approve our annual budget and to develop short- and long-term operational plans.
Adjusted operating income is defined as operating income less stock-based compensation expense, loss on inventory purchase commitment and litigation settlement expense. Management believes that the use of Adjusted operating income provides consistency and comparability with our past and future performance, facilitates period-to-period comparisons and also facilitates comparisons with other companies.
Management believes that it is useful to exclude stock-based compensation expense from operating income because the amount of such expense in any specific period may not directly correlate to the underlying performance of our business operations. We believe it is useful to exclude loss on inventory purchase commitment because it is an expense that arose from our commitment to purchase energy-related products from our contract manufacturing partner that we will not use due to our decision to discontinue our energy product line for utility customers. We have not incurred that type of expense in past periods and we believe that past and future periods are more comparable if we exclude that expense from operating income.
We believe it is useful to exclude litigation settlement expense from operating income because that expense was related to two separate legal settlements that were resolved in 2012. Those settlements are not indicative of past or future operating performance. We believe that past and future periods are more comparable if we exclude that expense from operating income.
10
Our use of Adjusted operating income has limitations as an analytical tool and you should not consider it in isolation or as a substitute for our analysis of our results as reported under GAAP. Some of these limitations are:
- •
- Adjusted operating income does not reflect the potentially dilutive impact of equity-based compensation;
- •
- Although we have not incurred significant loss on purchase commitments in the past, there is no guarantee that we will not
incur those expenses in the future and therefore Adjusted operating income may not be indicative of future performance; and
- •
- We are involved in litigation matters from time to time and we may incur litigation settlement expenses in future periods and, therefore, Adjusted operating income may not be indicative of future performance.
Because of these limitations, you should consider Adjusted operating income alongside other financial performance measures.
11
Consolidated Balance Sheet Data
The following table sets forth our summary consolidated balance sheet data as of March 31, 2013:
- •
- On an actual basis;
- •
- On a pro forma basis to reflect the conversion of all outstanding shares of our preferred stock into 15,293,960 shares of
our common stock, which will occur immediately prior to the closing of this offering assuming our valuation prior to this offering is at least $225 million and the net proceeds to us from this
offering are not less than $35 million, the net exercise of outstanding warrants to purchase 723,901 shares of capital stock into an aggregate of 293,232 shares of common stock as of
March 31, 2013, the corresponding reclassification of our warrant liability to additional paid-in capital, which will occur immediately prior to the closing of this offering unless earlier
exercised or expired, and the filing of our post-offering amended and restated certificate of incorporation, which will occur immediately prior to the closing of this offering; and
- •
- On a pro forma as adjusted basis to reflect the pro forma adjustments described above and (i) our receipt of the net proceeds from our sale of 4,000,000 shares of common stock in this offering at an assumed initial public offering price of $16.00 per share, which is the midpoint of the price range set forth on the cover page of this prospectus, after deducting estimated underwriting discounts and commissions and estimated offering expenses payable by us and (ii) the payment of the remaining amount owed under a litigation settlement agreement.
| |
As of March 31, 2013 | |||||||||
|---|---|---|---|---|---|---|---|---|---|---|
| |
Actual | Pro forma | Pro forma as adjusted(1) |
|||||||
| |
(In thousands) |
|||||||||
Consolidated Balance Sheet Data: |
||||||||||
Cash and cash equivalents |
$ | 14,573 | $ | 14,573 | $ | 69,343 | ||||
Property and equipment, net |
3,566 | 3,566 | 3,566 | |||||||
Working capital, excluding deferred revenue |
21,582 | 21,582 | 76,868 | |||||||
Total assets |
49,455 | 49,455 | 104,225 | |||||||
Redeemable convertible preferred stock |
116,313 | — | — | |||||||
Total stockholders' equity (deficit) |
(93,204 | ) | 23,685 | 80,515 | ||||||
- (1)
- A $1.00 increase (decrease) in the assumed initial public offering price of $16.00 per share, the midpoint of the range set forth on the cover page of this prospectus, would increase (decrease) cash and cash equivalents and each of working capital, excluding deferred revenue, total assets and total stockholders' equity (deficit) by $3.7 million, assuming that the number of shares offered by us, as set forth on the cover page of this prospectus, remains the same, and after deducting estimated underwriting discounts and commissions payable by us. Each increase or decrease of 1.0 million shares in the number of shares offered by us would increase or decrease cash and cash equivalents and each of working capital, excluding deferred revenue, total assets and total stockholders' equity (deficit) by $14.9 million assuming that the assumed price per share remains the same, and after deducting estimated underwriting discounts and commissions payable by us. The pro forma as adjusted information discussed above is illustrative only and will be adjusted based on the actual initial public offering price and other terms of this offering determined at pricing.
12
Recent Developments
The estimated ranges of our financial results and operating metrics below as of and for the three months ended June 30, 2013 are preliminary, based upon our estimates and are subject to completion of financial and operating closing procedures. We have begun our normal quarterly closing and review procedures for the three months ended June 30, 2013; however, given the timing of these estimates, final results as of and for the three months ended June 30, 2013 may differ from our estimated results, including as a result of the quarter-end closing procedures or review adjustments. The summary information below is not a comprehensive statement of our financial results or operating metrics for this period and our actual results and metrics may differ from the estimated ranges due to the completion of our financial and operating closing procedures and/or adjustments and other developments that may arise before the results for this period are finalized. These estimates should not be viewed as a substitute for full interim financial statements prepared in accordance with GAAP that have been reviewed by our auditors. In addition, these estimates as of and for the three months ended June 30, 2013, are not necessarily indicative of the results to be achieved for the remainder of 2013 or any future period. This information should be read in conjunction with the financial statements and the related notes and "Management's Discussion and Analysis of Financial Condition and Results of Operations" for prior periods included elsewhere in this prospectus.
The following are preliminary estimates for the three months ended June 30, 2013:
| |
As of or for the Three Months Ended June 30, 2013 |
|||||||||
|---|---|---|---|---|---|---|---|---|---|---|
| |
|
|
|
|||||||
| |
(Dollars in thousands) |
|||||||||
GAAP Disclosure: |
||||||||||
Revenue |
$ | 32,000 | — | $ | 32,500 | |||||
Gross margin |
$ | 16,100 | — | $ | 16,600 | |||||
Gross margin as a percentage of revenue |
50.3% | — | 51.1% | |||||||
Operating income |
$ | 1,100 | — | $ | 1,800 | |||||
Cash and cash equivalents |
$ | 18,100 | ||||||||
Other Non-GAAP Financial Data:(1) |
||||||||||
Adjusted gross margin |
||||||||||
Gross margin |
$ | 16,100 | — | $ | 16,600 | |||||
Stock-based compensation expense included in cost of revenue |
15 | — | 15 | |||||||
Cost of revenue—inventory purchase commitment |
(180 | ) | — | (180 | ) | |||||
Adjusted gross margin |
$ | 15,935 | — | $ | 16,435 | |||||
Adjusted gross margin percentage |
49.8% | — | 50.5% | |||||||
Adjusted operating income |
||||||||||
Operating income |
$ | 1,100 | — | $ | 1,800 | |||||
Stock-based compensation expense |
850 | — | 850 | |||||||
Cost of revenue—inventory purchase commitment |
(180 | ) | — | (180 | ) | |||||
Adjusted operating income |
$ | 1,770 | — | $ | 2,470 | |||||
- (1)
- See
"—Reconciliation of Non-GAAP Financial Data" above for statements disclosing the reasons why our management believes that
presentation of the non-GAAP financial measures provide useful information to investors regarding our financial condition and results of operations and the additional purposes for which our management
uses the non-GAAP financial measures.
13
We estimate total revenue to be in a range from $32.0 million to $32.5 million for the three months ended June 30, 2013, compared to $27.6 million for the three months ended June 30, 2012. We estimate our Core revenue will be in a range from $31.5 million to $31.9 million for the three months ended June 30, 2013. The estimated increase in total revenue is in the range of $4.4 million to $4.9 million, or 16% to 18%, compared to revenue for the three months ended June 30, 2012. The estimated increase was primarily due to the net increase in the number of direct dealers selling our products and an increase in sales from existing dealers in both North America and internationally.
We estimate gross margin to be in a range from $16.1 million to $16.6 million for the three months ended June 30, 2013, compared to $13.3 million for the three months ended June 30, 2012. As a percentage of revenue, we estimate gross margin for the three months ended June 30, 2013 to be in a range from 50.3% to 51.1%, compared to 48.1% for the three months ended June 30, 2012. During the three months ended June 30, 2013, we reduced our reserve for inventory purchase commitments by approximately $180,000, as our proceeds from liquidating the underlying inventory and our ability to consume common components exceeded our original estimates. As a result, our gross margin percentage is higher than it otherwise would have been. We expect our adjusted gross margin percentage to be in the range from 49.8% to 50.5%. The estimated increase in adjusted gross margin percentage from 48.2% in the three months ended June 30, 2012 to between 49.8% and 50.5% in the three months ended June 30, 2013 was due to higher prices charged for our controller appliances and associated software, higher sales of third-party products sold through our online distribution platform, lower component costs and lower fixed manufacturing overhead expenses as a percentage of revenue.
We expect the favorable impact on our gross margin as a percentage of revenue related to higher prices for our controller appliances and associated software to continue in future periods; however, the impact will decline as software sold separately for use with legacy controller appliances will diminish over time.
We expect the positive impact on our gross margin as a percentage of revenue resulting from increased sales of third-party products sold through our online distribution platform to continue in future periods; however, the impact will diminish as the growth rate of that revenue stabilizes in future periods.
We expect product component cost reductions to continue to have a positive impact on our gross margin as a percentage of revenue as those reductions are the result of negotiated price decreases with our manufacturing partners that are not short-term in nature.
The impact of lower manufacturing overhead as a percentage of revenue on our gross margin percentage will vary depending on manufacturing overhead spending in that period. In the three months ended June 30, 2013, we received a credit for duties paid in previous periods. We expect credits received in future periods, and the related favorable impact on our gross margin percentage, will be less significant in future periods.
We estimate our operating income for the three months ended June 30, 2013 to be between $1.1 million and $1.8 million compared to $369,000 for the three months ended June 30, 2012 and our adjusted operating income to be between $1.8 million and $2.5 million for the three months ended June 30, 2013 compared to $1.0 million for the three months ended June 30, 2012. The increase in estimated operating income was due to higher revenue and higher gross margin percentages offset by higher operating expenses.
We expect our cash balance at June 30, 2013 to be $18.1 million compared to $14.6 million at March 31, 2013 and $18.7 million at December 31, 2012. The $600,000 expected decrease in cash for the first half of 2013 was due to $2.1 million in purchases of property and equipment, which was offset by $700,000 in cash generated from operations and $800,000 in net proceeds from notes payable and common stock option exercises.
14
Investing in our common stock involves a high degree of risk. You should consider carefully the risks and uncertainties described below, together with all of the other information in this prospectus, including our financial statements and related notes, before deciding whether to purchase shares of our common stock. If any of the following risks is realized, our business, financial condition, results of operations and prospects could be materially and adversely affected. In that event, the price of our common stock could decline, and you could lose part or all of your investment.
Risks Related to Our Business and Industry
We have incurred operating losses in the past, may incur operating losses in the future, and may not achieve or maintain profitability.
We began our operations in 2003. For substantially all of our history, we have experienced net losses and negative cash flows from operations. As of March 31, 2013, we had an accumulated deficit of $107.1 million. We expect our operating expenses to increase in the future as we expand our operations. Furthermore, as a public company, we will incur additional legal, accounting and other expenses that we did not incur as a private company. If our revenue does not grow to offset these increased expenses, we will not become profitable. We may incur significant losses in the future for a number of reasons, including without limitation the other risks and uncertainties described in this prospectus. Additionally, we may encounter unforeseen operating or legal expenses, difficulties, complications, delays and other unknown factors that may result in losses in future periods. If these losses exceed our expectations or our revenue growth expectations are not met in future periods, our financial performance will be harmed.
The markets in which we participate are highly competitive and many companies, including large technology companies, broadband and security service providers and other managed service providers, are actively targeting the home automation market. Our failure to differentiate ourselves and compete successfully with these companies would make it difficult for us to add and retain consumers, and would reduce or impede the growth of our business.
The market for automation and control solutions for the connected home is increasingly competitive and global. Many large technology companies have expanded into the connected home market by developing their own solutions, or by acquiring other companies with home automation solution offerings. For example, Microsoft Corporation recently acquired id8 Group R2 Studios Inc., a home entertainment technology company. These large technology companies already have broad consumer awareness and sell a variety of devices for the home, and consumers may choose their offerings instead of ours, even if we offer superior products and services. Similarly, many managed service providers, such as cable TV, telephone and security companies, are beginning to offer services that provide device control and automation capability within the home for an additional monthly service fee. For example, Comcast is expanding its Xfinity service to provide residential security, energy and automation services. These managed service providers have the advantage of leveraging their existing consumer base, network of installation and support technicians and name recognition to gain traction in the home automation market. In addition, consumers may prefer the monthly service fee with little to no upfront cost offered by some of these managed service providers over a larger upfront cost with little to no monthly service fees.
We expect competition from these large technology companies and managed service providers to increase in the future. This increased competition could result in pricing pressure, reduced sales, lower margins or the failure of our solutions to achieve or maintain broad market acceptance. To remain competitive and to maintain our position as a leading provider of automation and control solutions for the connected home, we will need to invest continuously in product development, marketing, customer service and support and product delivery infrastructure. We may not have
15
sufficient resources to continue to make the investments in all of the areas needed to maintain our competitive position. In addition, most of our competitors have longer operating histories, greater name recognition, larger consumer bases and significantly greater financial, technical, sales, marketing and other resources than us, which may provide them with an advantage in developing, marketing or servicing new solutions. Increased competition could reduce our market share, revenue and operating margins, increase our operating costs, harm our competitive position and otherwise harm our business and results of operations.
Consumers may choose to adopt point products that provide control of discrete home functions rather than adopting our unified home automation solution. If we are unable to increase market awareness of the benefits of our unified solution, our revenue may not continue to grow, or it may decline.
Many vendors have emerged, and may continue to emerge, to provide point products with advanced functionality for use in the home, such as a thermostat that can be controlled by an application on a smartphone. We expect more and more consumer electronic and consumer appliance products to be network-aware and connected—each very likely to have its own smart device (phone or tablet) application. Consumers may be attracted to the relatively low costs of these point products and the ability to expand their home control solution over time with minimal upfront costs, despite some of the disadvantages of this approach. While we have built our solution to be flexible and support third-party point products, these products may reduce the revenue we receive for each installation. It is therefore important that we have technical expertise and provide attractive top quality products in many areas, such as lighting and video, and establish broad market awareness of these solutions. If a significant number of consumers in our target market choose to adopt point products rather than our unified automation solution, then our business, financial condition and results of operations will be harmed, and we may not be able to achieve sustained growth or our business may decline.
Many of the competitors in our market, including providers of luxury integrated installations with long operating histories, established markets, broad user bases and proven consumer acceptance, may be successful in expanding into the mainstream home automation market, which may harm our growth and future prospects.
Many companies with which we directly compete have been operating in this industry for many years and, as a result, have established significant name recognition in the home automation industry. For example, Crestron, a provider of luxury integrated installations, has been in business for over 40 years and has become an established presence in the home automation industry. Another provider of luxury integrated installations is Savant Systems, which provides home automation based on the Apple iOS operating platform. To the extent these providers are able to develop more affordable products that compete more directly with our solution, our growth may be constrained and our business could suffer. In addition, given the strong growth potential of the market, we expect there to be many new entrants in the future.
Since we rely on third-party dealers and distributors to sell and install our solutions, we do not have a direct sales pipeline, which makes it difficult for us to accurately forecast future sales and correctly predict manufacturing requirements.
We depend on our dealer and distributor network to sell and install our solution. As a result, we do not develop or control our sales pipeline, making it difficult for us to predict future sales. In addition, because the production of certain of our products requires long lead times, we enter into agreements for the manufacture and purchase certain of our products well in advance of the time in which those products will be sold. These contracts are based on our best estimates of our near-term product needs. If we underestimate consumer demand, we may forego revenue opportunities, lose market share and damage our relationships. Conversely, if we overestimate consumer demand, we may purchase more inventory than we are able to sell at any given time, or at all. If we fail to accurately
16
estimate demand for our products, we could have excess or obsolete inventory, resulting in a decline in the value of our inventory, which would increase our costs of revenues and reduce our liquidity. Our failure to accurately manage inventory relative to demand would adversely affect our results of operations.
We have relatively limited visibility regarding the consumers that ultimately purchase our products, and we often rely on information from third-party dealers and distributors to help us manage our business. If these dealers and distributors fail to provide timely or accurate information, our ability to quickly react to market changes and effectively manage our business may be harmed.
We sell our solutions through dealers and distributors. These dealers and distributors work with consumers to design, install, update and maintain their home automation installations. While we are able to track orders from dealers and distributors and have access to certain information about the configurations of their Control4 systems that we receive through our controller appliances, we also rely on dealers and distributors to provide us with information about consumer behavior, product and system feedback, consumer demographics, buying patterns and information on our competitors. We use this channel sell-through data, along with other metrics, to assess consumer demand for our solutions, develop new products, adjust pricing and make other strategic business decisions. Channel sell-through data is subject to limitations due to collection methods and the third-party nature of the data and thus may not be complete or accurate. In addition, to the extent we collect information directly from consumers, for example through surveys that we conduct, the consumers who supply this sell-through data self select and vary by geographic region and from period to period, which may impact the usefulness of the results. If we do not receive consumer information on a timely or accurate basis, or if we do not properly interpret this information, our ability to quickly react to market changes and effectively manage our business may be harmed.
Our quarterly results of operations have fluctuated and may continue to fluctuate. As a result, we may fail to meet or exceed the expectations of investors or securities analysts, which could cause our stock price to decline.
Our quarterly revenue and results of operations may fluctuate as a result of a variety of factors, many of which are outside of our control. If our quarterly revenue or results of operations fall below the expectations of investors or securities analysts, the price of our common stock could decline substantially. Fluctuations in our results of operations may be due to a number of factors, including:
- •
- Demand for and market acceptance of our solutions;
- •
- Our ability to increase, retain and incentivize the certified dealers and distributors that market, sell, install and
support our solutions;
- •
- The ability of our contract manufacturers to continue to manufacture high-quality products, and to supply
sufficient products to meet our demands;
- •
- The timing and success of introductions of new products, solutions or upgrades by us or our competitors and the entrance
of new competitors;
- •
- The strength of regional, national and global economies;
- •
- The impact of natural disasters or manmade problems such as terrorism;
- •
- Changes in our business and pricing policies or those of our competitors;
- •
- Competition, including entry into the industry by new competitors and new offerings by existing competitors;
- •
- The impact of seasonality on our business;
17
- •
- Issues related to introductions of new or improved products such as shortages of prior generation products or
short-term decreased demand for next generation products;
- •
- The amount and timing of expenditures, including those related to expanding our operations, increasing research and
development, introducing new solutions or paying litigation expenses; and
- •
- Changes in the payment terms for our solutions.
Due to the foregoing factors and the other risks discussed in this prospectus, you should not rely on quarter-to-quarter comparisons of our results of operations as an indication of our future performance. You should not consider our recent revenue growth as indicative of our future performance.
If we are unable to develop new solutions, sell our solutions into new markets or further penetrate our existing markets, our revenue may not grow as expected.
Our ability to increase sales will depend in large part on our ability to enhance and improve our solutions, to introduce new solutions in a timely manner, to sell into new markets and to further penetrate our existing markets. The success of any enhancement or new product or solution depends on several factors, including the timely completion, introduction and market acceptance of enhanced or new solutions, the ability to attract, retain and effectively train sales and marketing personnel, the ability to develop relationships with dealers and distributors and the effectiveness of our marketing programs. Any new product or solution we develop or acquire may not be introduced in a timely or cost-effective manner, and may not achieve the broad market acceptance necessary to generate significant revenue. Any new markets into which we attempt to sell our solutions, including new vertical markets and new countries or regions, may not be receptive. Our ability to further penetrate our existing markets depends on the quality of our solutions and our ability to design our solutions to meet consumer demand. Moreover, we are frequently required to enhance and update our solutions as a result of changing standards and technological developments, which makes it difficult to recover the cost of development and forces us to continually qualify new solutions with our consumers. If we are unable to successfully develop or acquire new solutions, enhance our existing solutions to meet consumer requirements, sell solutions into new markets or sell our solutions to additional consumers in our existing markets, our revenue may not grow as expected.
Our success depends, in part, on our ability to develop and expand our global network of dealers and distributors.
We have developed a global network of over 2,800 active direct dealers and 27 distributors to sell, install and support our solutions. We rely on our dealers and distributors to provide consumers with a successful Control4 home automation experience. In some cases, dealers may choose not to offer our solution and instead offer a product from one of our competitors or, in other cases, the dealer may simply discontinue its operations. In order to continue our growth and expand our business, it is important that we continue to add new dealers and distributors and maintain most of our existing relationships. We must also work to expand our network of dealers and distributors to ensure that we have sufficient geographic coverage and technical expertise to address new markets and technologies. While it is difficult to estimate the total number of available dealers in our markets, there are a finite number of dealers that are able to perform the types of technical installations required for home automation systems. In the event that we saturate the available dealer pool, or if market or other forces cause the available pool of dealers to decline, it may be increasingly difficult to grow our business. As consumers' home automation options grow, it is important that we enhance our dealer footprint by broadening the expertise of our dealers, working with larger and more sophisticated dealers and expanding the mainstream consumer products our dealers offer. If we are unable to expand our network of dealers and distributors, our business could be harmed.
18
We rely on our dealers and distributors to sell our solution, and if our dealers and distributors fail to perform, our ability to sell and distribute our products and services will be limited, and our results of operations may be harmed.
Substantially all of our revenue is generated through the sales of our solution by our dealers and distributors. Our dealers and distributors are independent businesses that voluntarily sell our products as well as the products of other companies to consumers. We provide our dealers and distributors with specific training and programs to assist them in selling our products, but we cannot assure that these steps will be effective. We have observed, and expect to continue to observe, high volatility in the monthly, quarterly and annual sales performance of individual dealers and distributors. Although we can make estimated forecasts of cumulative sales of large numbers of dealers and distributors, we cannot assure their accuracy collectively nor individually. Accordingly, we may not be able to reduce or slow our spending quickly enough if our actual sales fall short of our expectations. As a result, we expect that our revenues, results of operations and cash flows may fluctuate significantly on a quarterly basis. We believe that period-to-period comparisons of our revenues, results of operations and cash flows may not be meaningful and should not be relied upon as an indication of future performance.
Our dealers and distributors may be unsuccessful in marketing, selling, and supporting our products and services. If we are unable to develop and maintain effective sales incentive programs for our third-party dealers and distributors, we may not be able to incentivize them to sell our products to consumers and, in particular, to larger businesses and organizations. Our dealers and distributors may also market, sell and support products and services that are competitive with ours, and may devote more resources to the marketing, sales, and support of such competitive products. Our dealers and distributors may have incentives to promote our competitors' products to the detriment of our own, or may cease selling our products altogether. Our agreements with our dealers and distributors may generally be terminated for any reason by either party with advance notice. We cannot assure you that we will retain these dealers and distributors, or that we will be able to secure additional or replacement dealers and distributors. Further, if we alter our sales process in a region by switching from a distributor to a direct dealer model, our sales may be impacted leading up to or in connection with such change in sales process. In addition, while we take certain steps to protect ourselves from liability for the actions of our dealers and distributors, consumers may seek to recover amounts from us for any damages caused by dealers in connection with system installations, or the failure of a system to perform properly due to an incorrect installation by a dealer. In addition, our dealers and distributors may use our name and our brand in ways we do not authorize, and any such improper use may harm our reputation or expose us to liability for their actions.
If we fail to effectively manage our existing sales channels, if our dealers or distributors are unsuccessful in fulfilling the orders for our products, or if we are unable to enter into arrangements with, and retain a sufficient number of, high quality dealers and distributors in each of the regions in which we sell products, and keep them motivated to sell our products, our results of operations may be harmed. The termination of our relationship with any significant dealer or distributor may also adversely impact our sales and results of operations.
We have entered into several strategic arrangements and intend to pursue additional strategic opportunities in the future. If the intended benefits from our strategic relationships are not realized, our growth and results of operations may be harmed.
We are in the process of growing our relationships with strategic partners in order to attempt to reach markets that we cannot currently address cost-effectively and to increase awareness of our solution. If these relationships do not develop in the manner we intend, our future growth could be impacted. Furthermore, the termination of our relationship with a partner may cause us to incur expenses without corresponding revenue, incur a termination penalty and harm our sales and results of
19
operations. For example, in 2012, we discontinued energy products for utility customers and, in connection with that decision, we incurred an expense related to an inventory purchase commitment and paid a fee to our counterparty to terminate the arrangement. Any loss of a major partner or distribution channel or other channel disruption could harm our results of operations and make us more dependent on alternate channels, damage our reputation, increase pricing and promotional pressures from other partners and distribution channels, increase our marketing costs, or harm buying and inventory patterns, payment terms or other contractual terms.
If we do not maintain the compatibility of our solutions with third-party products and applications that our consumers use, demand for our solutions could decline.
Our solutions are designed to interoperate with a wide range of other third-party products, including products in the areas of music, video, lighting, temperature and security. If we do not support the continued integration of our solutions with third-party products and applications, including through the provision of application programming interfaces that enable data to be transferred readily between our solutions and third-party products and applications, demand for our solutions could decline and we could lose sales. We will also be required to make our solutions compatible with new or additional third-party products and applications that are introduced into the markets that we serve. To help us meet this challenge, we have developed our Simple Device Discovery Protocol, or SDDP, designed to enable our devices to recognize and control third-party products by embedding software in such products at the manufacturer, making it easier for dealers and consumers to add them to their Control4 systems. Although we are making SDDP available on a royalty-free basis to product manufacturers, its adoption is not yet substantial, and may not achieve greater or broad market acceptance. In addition, companies that provide popular point solutions have and may continue to eliminate or restrict our ability to control and be compatible with these products. For example, a thermostat company has restricted the interoperability of its products with our solutions. As a result, we may not be successful in making our solutions compatible with these third-party products and applications, which could reduce demand for our solutions. In addition, if prospective consumers require customized features or functions that we do not offer, then the market for our solutions may be harmed.
Our inability to adapt to technological change could impair our ability to remain competitive.
The market for home automation and control solutions is characterized by rapid technological change, frequent introductions of new products and evolving industry standards. Our ability to attract new consumers and increase revenue from existing consumers will depend in significant part on our ability to anticipate changes in industry standards and to continue to enhance or introduce existing solutions on a timely basis to keep pace with technological developments. We are currently changing several aspects of our operating system, and may utilize Android open source technology in the future, which may cause difficulties including compatibility, stability and time to market. The success of this or any enhanced or new product or solution will depend on several factors, including the timely completion and market acceptance of the enhanced or new product or solution. Similarly, if any of our competitors implement new technologies before we are able to implement them, those competitors may be able to provide more effective products than ours, possibly at lower prices. Any delay or failure in the introduction of new or enhanced solutions could harm our business, results of operations and financial condition.
20
We currently rely on contract manufacturers to manufacture our products and component vendors to supply parts used in our products. The majority of our components are supplied by a single source. Any disruption in our supply chain, or any our failure to successfully manage our relationships with our contract manufacturers or component vendors could harm our business.
Our reliance on contract manufacturers reduces our control over the assembly process, exposing us to risks, including reduced control over quality assurance, production costs and product supply. We rely on a limited number of contract manufacturers to manufacture substantially all of our products. We also do business with a number of component vendors, and the parts they supply may not perform as expected. For certain of our products and components, we rely on a sole-source manufacturer or supplier. In 2012, two contract manufacturers, Sanmina and LiteOn, manufactured 82% of our inventory purchases. Certain of our contract manufacturers and component vendors are located outside of the United States and may be subject to political, economic, social and legal uncertainties that may harm our relationships with these parties. If we fail to manage our relationships with our contract manufacturers or component vendors effectively, or if our contract manufacturers or component vendors experience delays, disruptions, capacity constraints or quality control problems in their operations, our ability to ship products may be impaired and our competitive position and reputation could be harmed. In addition, any adverse change in our contract manufacturers' or component vendors' financial or business condition could disrupt our ability to supply quality products to our dealers and distributors. If we are required to change contract manufacturers or component vendors, we may lose revenue, incur increased costs or damage our relationships, or we might be unable to find a new contract manufacturer or component vendor on acceptable terms, or at all. In addition, qualifying a new contract manufacturer or component vendor can be an expensive and lengthy process. If we experience increased demand that our contract manufacturers or component vendors are unable to fulfill, or if they are unable to provide us with adequate supplies of high-quality products for any reason, we could experience a delay in our order fulfillment, and our business, results of operations and financial condition would be harmed.
Growth of our business will depend on market awareness and a strong brand, and any failure to develop, maintain, protect and enhance our brand would hurt our ability to retain or attract consumers.
Because of the early stage of development of the mainstream home automation market, we believe that building and maintaining market awareness, brand recognition and goodwill is critical to our success. This will depend largely on our ability to continue to provide high-quality solutions, and we may not be able to do so effectively. While we may choose to engage in a broader marketing campaign to further promote our brand, this effort may not be successful. Our efforts in developing our brand may be affected by the marketing efforts of our competitors and our reliance on our dealers, distributors and strategic partners to promote our brand. If we are unable to cost-effectively maintain and increase awareness of our brand, our business, results of operations and financial condition could be harmed.
We operate in the emerging and evolving home automation market, which may develop more slowly or differently than we expect. If the mainstream home automation market does not grow as we expect, or if we cannot expand our solutions to meet the demands of this market, our revenue may decline, fail to grow or fail to grow at an accelerated rate, and we may incur additional operating losses.
The market for home automation and control solutions is in an early stage of development, and it is uncertain whether, how rapidly or how consistently this market will develop, and even if it does develop, whether our solutions will achieve and sustain high levels of demand and market acceptance. Some consumers may be reluctant or unwilling to use our solutions for a number of reasons, including satisfaction with traditional solutions, concerns for additional costs and lack of awareness of our solutions. Unified home automation solutions such as ours have traditionally been luxury purchases for the high end of the residential market. Our ability to expand the sales of our
21
solutions to a broader consumer base depends on several factors, including the awareness of our solutions, the timely completion, introduction and market acceptance of our solutions, the ability to attract, retain and effectively train sales and marketing personnel, the ability to develop relationships with dealers and distributors, the effectiveness of our marketing programs, the costs of our solutions and the success of our competitors. If we are unsuccessful in developing and marketing our home automation solutions to mainstream consumers, or if these consumers do not perceive or value the benefits of our solutions, the market for our solutions might not continue to develop or might develop more slowly than we expect, either of which would harm our revenue and growth prospects.
Our consumers may experience service failures or interruptions due to defects in the software, infrastructure, third-party components or processes that comprise our existing or new solutions, or due to dealer errors in product installation, any of which could harm our business.
Our solutions may contain undetected defects in the software, infrastructure, third-party components or processes. If these defects lead to service failures after introduction of or an upgrade to a product or solution, we could experience harm to our branded reputation, claims by our consumers, dealers, distributors, strategic partners or developers or lost revenue during the period required to address the cause of the defects. We may find defects in new or upgraded solutions, resulting in loss of, or delay in, market acceptance of our solutions, which could harm our business, results of operations and financial condition.
Since our solutions are installed by our dealers, if they do not install or maintain our solutions correctly, our solutions may not function properly. If the improper installation or maintenance of our solutions leads to service failures after introduction of, or an upgrade to, a product or solution, we could experience harm to our branded reputation, claims by our consumers, dealers, distributors, strategic partners or developers or lost revenue during the period required to address the cause of the problem. This could harm our business, results of operations and financial condition.
Any defect in, or disruption to, our solutions could cause consumers not to purchase additional products from us, prevent potential consumers from purchasing our solutions or harm our reputation. Although our contracts with our consumers limit our liability to our consumers for these defects, disruptions or errors, we nonetheless could be subject to litigation for actual or alleged losses to our consumers' businesses, which may require us to spend significant time and money in litigation or arbitration, or to pay significant settlements or damages. Defending a lawsuit, regardless of its merit, could be costly, divert management's attention and affect our ability to obtain or maintain liability insurance on acceptable terms and could harm our business. Although we currently maintain some warranty reserves, we cannot assure you that these warranty reserves will be sufficient to cover future liabilities. Furthermore, we may be required to indemnify our dealers, distributors and partners against certain liabilities they may incur as a result of defects of our products. In 2012, we incurred significant costs associated with the recall and replacement of a defective chip from a third-party component used within one of our products.
We encounter seasonality in sales, which could harm the amount, timing and predictability of our revenue and cause our stock price to fluctuate.
We have little recurring revenue or backlog and our revenue is generated from orders of our solutions from new and existing consumers, which may cause our quarterly results to fluctuate. We may experience seasonality in the sales of our solutions. Historically, our revenue is generally higher in the fourth quarter and lower in the first quarter. Seasonal variations in our sales may lead to significant fluctuations in our cash flows and results of operations on a quarterly basis. If we experience a delay in signing or a failure to sign a significant partner agreement in any particular quarter, then our results of operations for such quarter and for subsequent quarters may be below the expectations of securities analysts or investors, which may result in a decline in our stock price.
22
We may not generate significant revenue as a result of our current research and development efforts.
We have made and expect to continue to make significant investments in research and development and related product opportunities. In the year ended December 31, 2012, we spent $20.3 million on research and development expenses. High levels of expenditures for research and development could harm our results of operations, especially if not offset by corresponding future revenue increases. We believe that we must continue to dedicate a significant amount of resources to our research and development efforts to maintain our competitive position. However, it is difficult to estimate when, if ever, we will generate significant revenue as a result of these investments.
Our strategy includes pursuing acquisitions and our potential inability to successfully integrate newly-acquired technologies, assets or businesses may harm our financial results.
We believe part of our growth will be driven by acquisitions of other companies or their technologies, assets and businesses. Any acquisitions we complete will give rise to risks, including:
- •
- Incurring higher than anticipated capital expenditures and operating expenses;
- •
- Failing to assimilate the operations and personnel or failing to retain the key personnel of the acquired company or
business;
- •
- Failing to integrate the acquired technologies, or incurring significant expense to integrate acquired technologies into
our solutions;
- •
- Disrupting our ongoing business;
- •
- Dissipating our management resources;
- •
- Failing to maintain uniform standards, controls and policies;
- •
- Incurring significant accounting charges;
- •
- Impairing relationships with employees, dealers, distributors, partners or consumers;
- •
- Finding that the acquired technology, asset or business does not further our business strategy, that we overpaid for the
technology, asset or business or that we may be required to write off acquired assets or investments partially or entirely;
- •
- Failing to realize the expected synergies of the transaction;
- •
- Being exposed to unforeseen liabilities and contingencies that were not identified prior to acquiring the company; and
- •
- Being unable to generate sufficient revenue from acquisitions to offset the associated acquisition costs.
Fully integrating an acquired technology, asset or business into our operations may take a significant amount of time. We may not be successful in overcoming these risks or any other problems encountered with acquisitions. To the extent we do not successfully avoid or overcome the risks or problems related to any such acquisitions, our results of operations and financial condition could be harmed. Acquisitions also could impact our financial position and capital needs, or could cause fluctuations in our quarterly and annual results of operations. Acquisitions could include significant goodwill and intangible assets, which may result in future impairment charges that would reduce our stated earnings. We may incur significant costs in our efforts to engage in strategic transactions and these expenditures may not result in successful acquisitions.
23
Future acquisitions of technologies, assets or businesses, which are paid for partially or entirely through the issuance of stock or stock rights, could dilute the ownership of our existing stockholders.
We expect that the consideration we might pay for any future acquisitions of technologies, assets or businesses could include stock, rights to purchase stock, cash or some combination of the foregoing. If we issue stock or rights to purchase stock in connection with future acquisitions, net income (loss) per share and then-existing holders of our common stock may experience dilution.
Our gross margins can vary significantly depending on multiple factors, which can result in fluctuations in our results of operations.
Our gross margins are likely to vary due to consumer demand, product mix, new product introductions, unit volumes, commodity and supply chain costs, product delivery costs, geographic sales mix, foreign currency exchange rates, excess and obsolete inventory and the complexity and functionality of new product innovations. In particular, if we are not able to introduce new solutions in a timely manner at the cost we expect, or if consumer demand for our solutions is less than we anticipate, or if there are product pricing, marketing and other initiatives by our competitors to which we need to react that lower our margins, then our overall gross margin will be less than we project. The impact of these factors on gross margins can create unanticipated fluctuations in our results of operations, which may cause volatility in our stock price.
If we are unable to substantially utilize our net operating loss carryforwards, our financial results will be harmed.
As of December 31, 2012, our net operating loss, or NOL, carryforward amounts for U.S. federal income and state tax purposes were $83.6 million and $83.1 million, respectively. Under Section 382 of the Internal Revenue Code, a corporation that undergoes an "ownership change" may be subject to limitations on its ability to utilize its pre-change NOLs to offset future taxable income. Purchases of our common stock in amounts greater than specified levels, which will be beyond our control, could create an additional limitation on our ability to utilize our NOLs for tax purposes in the future. Limitations imposed on our ability to utilize NOLs could cause U.S. federal and state income taxes to be paid earlier than would be paid if such limitations were not in effect and could cause such NOLs to expire unused, in each case reducing or eliminating the benefit of such NOLs. Furthermore, we may not be able to generate sufficient taxable income to utilize our NOLs before they expire. If any of these events occur, we may not derive some or all of the expected benefits from our NOLs. In addition, at the state level there may be periods during which the use of NOLs is suspended or otherwise limited, which would accelerate or permanently increase state taxes owed.
Governmental regulations affecting the import or export of products could harm our revenue.
The U.S. and various foreign governments have imposed controls, export license requirements and restrictions on the import or export of some technologies, especially encryption technology, and may impose additional or broader controls, export license requirements and restrictions on the import or export of some technologies in the future. In addition, from time to time, governmental agencies have proposed additional regulation of encryption technology, such as requiring the escrow and governmental recovery of private encryption keys. Although we do not believe that any of our products currently require an export license, if our products or components of our products become subject to governmental regulation of encryption technology or other governmental regulation of imports or exports, we may be required to obtain import or export approval for such products, which could increase our costs and harm our international and domestic sales and our revenue. In addition, failure to comply with such regulations could result in penalties, costs and restrictions on export privileges, which would harm our results of operations.
24
If we are unable to manage our growth and diverse and complex operations, our reputation in the market and our ability to generate revenue from new or existing consumers may be harmed.
Because our operations are geographically diverse and complex, our personnel resources and infrastructure could become strained and our reputation in the market and our ability to successfully implement our business plan may be harmed. We have experienced a period of rapid growth in our headcount and operations. The growth in the size, complexity and diverse nature of our business and the expansion of our product lines and consumer base have placed increased demands on our management and operations, and further growth, if any, may place additional strains on our resources in the future. Our ability to effectively compete and to manage our planned future growth will depend on, among other things:
- •
- Maintaining continuity in our senior management and key personnel;
- •
- Increasing the productivity of our existing employees;
- •
- Attracting, retaining, training and motivating our employees, particularly our technical and management personnel;
- •
- Maintaining existing relationships and developing new relationships with contract manufacturers;
- •
- Effectively managing the inventory of our products;
- •
- Improving our operational, financial and management controls; and
- •
- Improving our information reporting systems and procedures.
If we do not manage the size, complexity and diverse nature of our business effectively, we could experience delayed product releases and longer response times for assisting our consumers with implementation of our solutions, and could lack adequate resources to support our consumers on an ongoing basis, any of which could harm our reputation in the market, our ability to successfully implement our business plan and our ability to generate revenue from new or existing consumers.
If we fail to retain our key employees, our business would be harmed and we might not be able to implement our business plan successfully.
Given the complex nature of the technology on which our business is based and the speed with which such technology advances, our future success is dependent, in large part, upon our ability to attract and retain highly qualified managerial, engineering and sales personnel. Competition for talented personnel is intense, and we cannot be certain that we can retain our managerial, engineering and sales personnel or that we can attract, assimilate or retain such personnel in the future. Our inability to attract and retain such personnel could harm our business, results of operations and financial condition.
Downturns in general economic and market conditions and reductions in spending may reduce demand for our solutions, which could harm our revenue, results of operations and cash flows.
Our revenue, results of operations and cash flows depend on the overall demand for our solutions. Concerns about the systemic impact of a potential widespread recession, energy costs, geopolitical issues, the availability and cost of credit and the global housing and mortgage markets have contributed to increased market volatility, decreased consumer confidence and diminished growth expectations in the U.S. economy and abroad. The current unstable general economic and market conditions have been characterized by a dramatic decline in consumer discretionary spending and have disproportionately affected providers of products and services that represent discretionary purchases. While the decline in consumer spending has recently moderated, these economic conditions could still lead to continued declines in consumer spending over the foreseeable future, and may have resulted in
25
a resetting of consumer spending habits that may make it unlikely that such spending will return to prior levels for the foreseeable future.
During weak economic times, the available pool of dealers and distributors may decline as the prospects for home building and home renovation projects diminish, which may have a corresponding impact on our growth prospects. In addition, there is an increased risk during these periods that an increased percentage of our dealers will file for bankruptcy protection, which may harm our reputation, revenue, profitability and results of operations. We also face risks from international dealers and distributors that file for bankruptcy protection in foreign jurisdictions, in that the outcome of the application of foreign bankruptcy laws may be more difficult to predict. In addition, we may determine that the cost of pursuing any claim may outweigh the recovery potential of such claim. Likewise, consumer bankruptcies can detrimentally affect the business stability of our dealers and distributors. Prolonged economic slowdowns and reductions in new home construction and renovation projects may result in diminished sales of our solutions. Further worsening, broadening or protracted extension of the economic downturn could have a negative impact on our business, revenue, results of operations and cash flows.
If our estimates or judgments relating to our critical accounting policies are based on assumptions that change or prove to be incorrect, our results of operations could fall below expectations of securities analysts and investors, resulting in a decline in our stock price.
The preparation of financial statements in conformity with generally accepted accounting principles, or GAAP, requires management to make estimates and assumptions that affect the amounts reported in our consolidated financial statements and accompanying notes. We base our estimates on historical experience and on various other assumptions that we believe to be reasonable under the circumstances, as provided in "Management's Discussion and Analysis of Financial Condition and Results of Operations," the results of which form the basis for making judgments about the carrying values of assets, liabilities and equity, and the amount of revenue and expenses that are not readily apparent from other sources. Significant assumptions and estimates used in preparing our consolidated financial statements include, or may in the future include, those related to revenue recognition, allowance for doubtful accounts, inventories, product warranties, income taxes and stock-based compensation expense. Our results of operations may be harmed if our assumptions change or if actual circumstances differ from those in our assumptions, which could cause our results of operations to fall below the expectations of securities analysts and investors, resulting in a decline in our stock price.
Changes in existing financial accounting standards or practices, or taxation rules or practices, may harm our results of operations.
Changes in existing accounting or taxation rules or practices, new accounting pronouncements or taxation rules, or varying interpretations of current accounting pronouncements or taxation practice could harm our results of operations or the manner in which we conduct our business.
Mergers or other strategic transactions involving our competitors could weaken our competitive position, which could harm our results of operations.
Our industry is highly fragmented, and we believe it is likely that some of our existing competitors will consolidate or be acquired. In addition, some of our competitors may enter into new alliances with each other or may establish or strengthen cooperative relationships with systems integrators, third-party consulting firms or other parties. Any such consolidation, acquisition, alliance or cooperative relationship could lead to pricing pressure and our loss of market share and could result in a competitor with greater financial, technical, marketing, service and other resources, all of which could harm our business, results of operations and financial condition.
26
We will incur increased costs and demands upon management as a result of complying with the laws and regulations affecting public companies, which could harm our results of operations and our ability to attract and retain qualified executives and board members.
As a public company, we will incur significant legal, accounting and other expenses that we did not incur as a private company, including costs associated with public company reporting and corporate governance requirements. These requirements include compliance with Section 404 and other provisions of the Sarbanes-Oxley Act of 2002, the Dodd-Frank Wall Street Reform and Consumer Protection Act, or the Dodd-Frank Act, as well as rules implemented by the Securities and Exchange Commission, or SEC, The NASDAQ Stock Market LLC, or NASDAQ, and other applicable securities or exchange-related rules and regulations. In addition, our management team will also have to adapt to the requirements of being a public company. We expect complying with these rules and regulations will substantially increase our legal and financial compliance costs and make some activities more difficult, time consuming or costly, particularly if we are no longer an "emerging growth company," as defined in the Jumpstart Our Business Startups Act of 2012, or the JOBS Act.
As a public company, we also expect that it may be more difficult and more expensive for us to obtain director and officer liability insurance, and we may be required to accept reduced policy limits and coverage or incur substantially higher costs to obtain the same or similar coverage. As a result, it may be more difficult for us to attract and retain qualified individuals to serve on our board of directors or as our executive officers.
We are an "emerging growth company," and any decision on our part to comply with certain reduced disclosure requirements applicable to emerging growth companies could make our common stock less attractive to investors.
We are an "emerging growth company," as defined in the JOBS Act, and we may take advantage of certain exemptions from various reporting requirements that are applicable to other public companies that are not "emerging growth companies" including not being required to comply with the auditor attestation requirements of Section 404 of the Sarbanes-Oxley Act, reduced disclosure obligations regarding executive compensation in our periodic reports and proxy statements, and exemptions from the requirements of holding an annual non-binding advisory vote on executive compensation and nonbinding stockholder approval of any golden parachute payments not previously approved. If we choose not to comply with the auditor attestation requirements of Section 404 of the Sarbanes-Oxley Act, our auditors will not be required to attest to the effectiveness of our internal control over financial reporting. As a result, investors may become less comfortable with the effectiveness of our internal controls and the risk that material weaknesses or other deficiencies in our internal controls go undetected may increase. If we choose to provide reduced disclosures in our periodic reports and proxy statements while we are an emerging growth company, investors would have access to less information and analysis about our executive compensation, which may make it difficult for investors to evaluate our executive compensation practices. We cannot predict if investors will find our common stock less attractive because we may rely on these exemptions and provide reduced disclosure. If some investors find our common stock less attractive as a result, there may be a less active trading market for our common stock and our stock price may be harmed. We will remain an "emerging growth company" for up to five years or such earlier time that we are no longer an emerging growth company. We will remain an emerging growth company until the earliest to occur of: the last day of the fiscal year in which we have more than $1.0 billion in annual revenue; the date we qualify as a "large accelerated filer," with at least $700 million of equity securities held by non-affiliates; the issuance, in any three-year period, by us of more than $1.0 billion in non-convertible debt securities; or the last day of the fiscal year ending after the fifth anniversary of our initial public offering.
27
In addition, Section 107 of the JOBS Act provides that an emerging growth company can take advantage of the extended transition period provided in Section 7(a)(2)(B) of the Securities Act of 1933, as amended, or the Securities Act, for complying with new or revised accounting standards. In other words, an emerging growth company can delay the adoption of certain accounting standards until those standards would otherwise apply to private companies. However, we have chosen to "opt out" of such extended transition period, and as a result, we will comply with new or revised accounting standards on the relevant dates on which adoption of such standards is required for non-emerging growth companies. Section 107 of the JOBS Act provides that our decision to opt out of the extended transition period for complying with new or revised accounting standards is irrevocable.
As a result of becoming a public company, we will be obligated to develop and maintain a system of effective internal controls over financial reporting. We may not complete our analysis of our internal control over financial reporting in a timely manner, or these internal controls may not be determined to be effective, which may harm investor confidence in our company and, as a result, the value of our common stock.
We will be required, pursuant to Section 404 of the Sarbanes-Oxley Act of 2002, to furnish a report by management on, among other things, the effectiveness of our internal control over financial reporting in the second annual report we file with the SEC. This assessment will need to include disclosure of any material weaknesses identified by our management in our internal control over financial reporting. However, our auditors will not be required to formally attest to the effectiveness of our internal control over financial reporting pursuant to Section 404 until we are no longer an "emerging growth company" as defined in the JOBS Act if we take advantage of the exemptions available to us through the JOBS Act.
We are in the very early stages of the costly and challenging process of compiling the system and processing documentation necessary to perform the evaluation needed to comply with Section 404. We may not be able to remediate any future material weaknesses, or to complete our evaluation, testing and any required remediation in a timely fashion. During the evaluation and testing process, if we identify one or more material weaknesses in our internal control over financial reporting, we will be unable to assert that our internal controls are effective. If we are unable to assert that our internal control over financial reporting is effective, or if our auditors are unable to express an opinion on the effectiveness of our internal controls when they are required to issue such opinion, investors could lose confidence in the accuracy and completeness of our financial reports, which could harm our stock price.
Our failure to raise additional capital or generate cash flows necessary to expand our operations and invest in new technologies in the future could reduce our ability to compete successfully and harm our results of operations.
We believe that our existing cash and cash equivalents will be sufficient to meet our anticipated cash requirements for at least the next 12 months. We may need to raise additional funds, and we may not be able to obtain additional debt or equity financing on favorable terms, if at all. If we raise additional equity financing, our security holders may experience significant dilution of their ownership interests and the value of shares of our common stock could decline. If we engage in debt financing, we may be required to accept terms that restrict our ability to incur additional indebtedness, force us to maintain specified liquidity or other ratios or restrict our ability to pay dividends or make acquisitions. If we need additional capital and cannot raise it on acceptable terms, if at all, we may not be able to, among other things:
- •
- Develop and enhance our solutions;
- •
- Continue to expand our research and development, sales and marketing organizations;
- •
- Hire, train and retain employees;
28
- •
- Respond to competitive pressures or unanticipated working capital requirements; or
- •
- Pursue acquisition opportunities.
Our inability to do any of the foregoing could reduce our ability to compete successfully and harm our results of operations.
We may be subject to additional tax liabilities, which would harm our results of operations.
We are subject to income, sales, use, value added and other taxes in the United States and other countries in which we conduct business, which laws and rates vary greatly by jurisdiction. Certain jurisdictions in which we do not collect sales, use, value added or other taxes on our sales may assert that such taxes are applicable, which could result in tax assessments, penalties and interest, and we may be required to collect such taxes in the future. Significant judgment is required in determining our worldwide provision for income taxes. These determinations are highly complex and require detailed analysis of the available information and applicable statutes and regulatory materials. In the ordinary course of our business, there are many transactions and calculations where the ultimate tax determination is uncertain. Although we believe our tax estimates are reasonable, the final determination of tax audits and any related litigation could be different from our historical tax practices, provisions and accruals. If we receive an adverse ruling as a result of an audit, or we unilaterally determine that we have misinterpreted provisions of the tax regulations to which we are subject, our tax provision, results of operations or cash flows could be harmed. In addition, liabilities associated with taxes are often subject to an extended or indefinite statute of limitations period. Therefore, we may be subject to additional tax liability (including penalties and interest) for a particular year for extended periods of time.
Our business is subject to the risks of earthquakes, fire, power outages, floods and other catastrophic events, and to interruption by manmade problems such as terrorism.
A significant natural disaster, such as an earthquake, fire or a flood, or a significant power outage could harm our business, results of operations and financial condition. Natural disasters could affect our manufacturing vendors or logistics providers' ability to perform services such as manufacturing products or assisting with shipments on a timely basis. Sanmina and LiteOn, two of our contract manufacturers that manufactured 82% of our inventory purchases in 2012, have manufacturing facilities located in China. In the event our manufacturing vendors' information technology systems or manufacturing or logistics abilities are hindered by any of the events discussed above, shipments could be delayed, resulting in missing financial targets, such as revenue and shipment targets, for a particular quarter. Further, if a natural disaster occurs in a region from which we derive a significant portion of our revenue, such as metropolitan areas in North America, consumers in that region may delay or forego purchases of our solutions from dealers and distributors in the region, which may harm our results of operations for a particular period. In addition, acts of terrorism could cause disruptions in our business or the business of our manufacturers, logistics providers, dealers, distributors, consumers or the economy as a whole. Given our typical concentration of sales at the end of each month and quarter, any disruption in the business of our manufacturers, logistics providers, dealers, distributors and consumers that impacts sales at the end of our quarter could have a greater impact on our quarterly results. All of the aforementioned risks may be augmented if the disaster recovery plans for us and our suppliers prove to be inadequate. To the extent that any of the above results in delays or cancellations of orders, or delays in the manufacture, deployment or shipment of our products, our business, financial condition and results of operations would be harmed.
29
Global or regional economic, political and social conditions could harm our business and results of operations.
External factors such as potential terrorist attacks, acts of war, financial crises, trade friction or geopolitical and social turmoil in those parts of the world that serve as markets for our solutions, such as Europe or Asia, or elsewhere could harm our business and results of operations. These uncertainties may cause our consumers to reduce discretionary spending on their home and make it difficult for us to accurately plan future business activities. More generally, these geopolitical, social and economic conditions could result in increased volatility in worldwide financial markets and economies that could harm our sales. We are not insured for losses or interruptions caused by terrorist acts or acts of war. The occurrence of any of these events or circumstances could harm our business and results of operations.
Failure to comply with laws and regulations could harm our business.
Our business is subject to regulation by various federal, state, local and foreign governmental agencies, including agencies responsible for monitoring and enforcing employment and labor laws, workplace safety, product safety, environmental laws, consumer protection laws, anti-bribery laws, import/export controls, federal securities laws and tax laws and regulations. In certain jurisdictions, these regulatory requirements may be more stringent than in the United States. Noncompliance with applicable regulations or requirements could subject us to investigations, sanctions, mandatory product recalls, enforcement actions, disgorgement of profits, fines, damages, civil and criminal penalties or injunctions. If any governmental sanctions are imposed, or if we do not prevail in any possible civil or criminal litigation, our business, results of operations and financial condition could be materially harmed. In addition, responding to any action will likely result in a significant diversion of management's attention and resources and an increase in professional fees. Enforcement actions and sanctions could further harm our business, results of operations and financial condition.
Risks Related to Our International Operations
In recent years, a significant amount of our revenue has come from sales outside of the United States, and we are therefore subject to a number of risks associated with international sales and operations.
We have a limited history of marketing, selling, and supporting our products and services internationally. However, consumers in countries outside of North America accounted for 25% of our revenue for the year ended December 31, 2012 and we expect that percentage to grow in the future. As a result, we must hire and train experienced personnel to staff and manage our foreign operations. To the extent that we experience difficulties in recruiting, training, managing, and retaining an international staff, and specifically staff related to sales management and sales personnel, we may experience difficulties in sales productivity in foreign markets.
If we are not able to increase the sales of our solutions to consumers located outside of North America, our results of operations or revenue growth may be harmed. In addition, in connection with our expansion into foreign markets, we are a receiver of currencies other than the U.S. dollar. Accordingly, changes in exchange rates, and in particular a strengthening of the U.S. dollar, will negatively affect our net sales and gross margins as expressed in U.S. dollars. There is also a risk that we will have to adjust local currency product pricing due to competitive pressures when there has been significant volatility in foreign currency exchange rates.
Conducting and launching operations on an international scale requires close coordination of activities across multiple jurisdictions and time zones and consumes significant management resources. Our limited experience in operating our business outside of the United States increases the risk that our current and any future international expansion efforts will not be successful. Conducting
30
international operations subjects us to risks that, generally, we do not face in the United States, including:
- •
- Fluctuations in currency exchange rates;
- •
- Unexpected changes in foreign regulatory requirements;
- •
- Longer accounts receivable payment cycles and difficulties in collecting accounts receivable;
- •
- Difficulties in managing and staffing international operations, including differences in labor laws;
- •
- Potentially adverse tax consequences, including the complexities of foreign value added tax systems and restrictions on
the repatriation of earnings;
- •
- Localization of our solutions, including translation into foreign languages and associated expenses;
- •
- Localization of our customer agreements under applicable foreign law;
- •
- The burdens of complying with a wide variety of foreign laws and different legal standards, including laws and regulations
related to privacy and data security and limitations on liability;
- •
- Increased financial accounting and reporting burdens and complexities;
- •
- Political, social and economic instability abroad, terrorist attacks and security concerns in general; and
- •
- Reduced or varied protection for intellectual property rights in some countries.
The impact of any one of these risks could harm our international business and, consequently, our results of operations generally. Additionally, operating in international markets also requires significant management attention and financial resources. We cannot be certain that the investment and additional resources required in establishing, acquiring or integrating operations in other countries will produce desired levels of revenue or profitability.
Due to the global nature of our business, we could be harmed by violations of the U.S. Foreign Corrupt Practices Act, the U.K. Bribery Act or similar anti-bribery laws in other jurisdictions in which we operate, or various international trade and export laws.
The global nature of our business creates various domestic and local regulatory challenges. The U.S. Foreign Corrupt Practices Act, or the FCPA, the U.K. Bribery Act 2010, or the U.K. Bribery Act, and similar anti-bribery laws in other jurisdictions generally prohibit U.S.-based companies and their intermediaries from making improper payments to non-U.S. officials for the purpose of obtaining or retaining business. In addition, U.S.-based companies are required to maintain records that accurately and fairly represent their transactions and have an adequate system of internal accounting controls. We operate in areas of the world that experience corruption by government officials to some degree and, in certain circumstances, compliance with anti-bribery laws may conflict with local customs and practices. Our global operations require us to import from and export to several countries, which geographically stretches our compliance obligations. In addition, changes in such laws could result in increased regulatory requirements and compliance costs which could harm our business, financial condition and results of operations. Our employees or other agents may engage in prohibited conduct and render us responsible under the FCPA, the U.K. Bribery Act or similar anti-bribery laws. If we are found to be in violation of the FCPA, the U.K. Bribery Act or other anti-bribery laws (either due to acts or inadvertence of our employees, or due to the acts or inadvertence of others), we could suffer criminal or civil penalties or other sanctions, which could harm on our business.
31
Risks Related to Our Intellectual Property
From time to time, we are defendants in legal proceedings as to which we are unable to assess our exposure and which could become significant liabilities in the event of an adverse judgment.
We are defendants in legal proceedings from time to time. Companies in our industry have been subject to claims related to patent infringement and product liability, as well as contract and employment-related claims. We may not be able to accurately assess the risks related to these suits, and we may be unable to accurately assess our level of exposure. In December 2012, we entered into a settlement agreement relating to alleged patent infringements, which included future royalty payments on certain products and the payment of a lump sum amount for alleged past damages.
If we fail to protect our intellectual property and proprietary rights adequately, our business could be harmed.
We believe that proprietary technology is essential to establishing and maintaining our leadership position. We seek to protect our intellectual property through trade secrets, copyrights, confidentiality, non-compete and nondisclosure agreements, patents, trademarks, domain names and other measures, some of which afford only limited protection. We also rely on patent, trademark, trade secret and copyright laws to protect our intellectual property. Despite our efforts to protect our proprietary rights, unauthorized parties may attempt to copy aspects of our technology or to obtain and use information that we regard as proprietary. Our means of protecting our proprietary rights may not be adequate or our competitors may independently develop similar or superior technology, or design around our intellectual property. In addition, the laws of some foreign countries do not protect our proprietary rights to as great an extent as the laws of the United States. Intellectual property protections may also be unavailable, limited or difficult to enforce in some countries, which could make it easier for competitors to capture market share. Our failure or inability to adequately protect our intellectual property and proprietary rights could harm our business, financial condition and results of operations.
To prevent substantial unauthorized use of our intellectual property rights, it may be necessary to prosecute actions for infringement and/or misappropriation of our proprietary rights against third parties. Any such action could result in significant costs and diversion of our resources and management's attention, and we cannot assure you that we will be successful in such action. Furthermore, many of our current and potential competitors have the ability to dedicate substantially greater resources to enforce their intellectual property rights than we do. Accordingly, despite our efforts, we may not be able to prevent third parties from infringing upon or misappropriating our intellectual property.
An assertion by a third party that we are infringing its intellectual property could subject us to costly and time-consuming litigation or expensive licenses that could harm our business and results of operations.
The industries in which we compete are characterized by the existence of a large number of patents, copyrights, trademarks and trade secrets, and by frequent litigation based on allegations of infringement or other violations of intellectual property rights. We have been subject to patent litigation in the past and we may be subject to similar litigation in the future. Given that our solution integrates with all aspects of the home, the risk that our solution may be subject to these allegations is exacerbated. As we seek to extend our solutions, we could be constrained by the intellectual property rights of others. In addition, our dealer and distributor contracts require us to indemnify them against certain liabilities they may incur as a result of our infringement of any third-party intellectual property.
We might not prevail in any intellectual property infringement litigation given the complex technical issues and inherent uncertainties in such litigation. Defending such claims, regardless of their merit, could be time-consuming and distracting to management, result in costly litigation or settlement, cause development delays or require us to enter into royalty or licensing agreements. In addition, we
32
currently have a limited portfolio of issued patents compared to our larger competitors, and therefore may not be able to effectively utilize our intellectual property portfolio to assert defenses or counterclaims in response to patent infringement claims or litigation brought against us by third parties. Further, litigation may involve patent holding companies or other adverse patent owners who have no relevant products or revenues and against which our potential patents provide no deterrence, and many other potential litigants have the capability to dedicate substantially greater resources to enforce their intellectual property rights and to defend claims that may be brought against them. If our solutions exceed the scope of in-bound licenses or violate any third-party proprietary rights, we could be required to withdraw those solutions from the market, re-develop those solutions or seek to obtain licenses from third parties, which might not be available on reasonable terms or at all. Any efforts to re-develop our solutions, obtain licenses from third parties on favorable terms or license a substitute technology might not be successful and, in any case, might substantially increase our costs and harm our business, financial condition and results of operations. If we were compelled to withdraw any of our solutions from the market, our business, financial condition and results of operations could be harmed.
We are generally obligated to indemnify our dealers, distributors and partners for certain expenses and liabilities resulting from intellectual property infringement claims regarding our products, which could force us to incur substantial costs.
We have agreed, and expect to continue to agree, to indemnify our dealers, distributors and partners for certain intellectual property infringement claims regarding our products. As a result, in the case of infringement claims against these dealers, distributors and partners, we could be required to indemnify them for losses resulting from such claims or to refund amounts they have paid to us. We expect that some of our dealers, distributors and partners may seek indemnification from us in connection with infringement claims brought against them. We evaluate each such request on a case-by-case basis and we may not succeed in refuting all such claims. If a dealer, distributor or partner elects to invest resources in enforcing a claim for indemnification against us, we could incur significant costs disputing it. If we do not succeed in disputing it, we could face substantial liability.
The use of open source software in our solutions may expose us to additional risks and harm our intellectual property.
Some of our solutions use or incorporate software that is subject to one or more open source licenses. Open source software is typically freely accessible, usable and modifiable. Certain open source software licenses require a user who intends to distribute the open source software as a component of the user's software to disclose publicly part or all of the source code to the user's software. In addition, certain open source software licenses require the user of such software to make any derivative works of the open source code available to others on potentially unfavorable terms or at no cost.
The terms of many open source licenses to which we are subject have not been interpreted by U.S. or foreign courts, and accordingly there is a risk that those licenses could be construed in a manner that imposes unanticipated conditions or restrictions on our ability to commercialize our solutions. In that event, we could be required to seek licenses from third parties in order to continue offering our solutions, to re-develop our solutions, to discontinue sales of our solutions or to release our proprietary software code under the terms of an open source license, any of which could harm our business. Further, given the nature of open source software, it may be more likely that third parties might assert copyright and other intellectual property infringement claims against us based on our use of these open source software programs.
While we monitor the use of all open source software in our products, solutions, processes and technology and seek to ensure that no open source software is used in such a way as to require us to disclose the source code to the related product or solution when we do not wish to do so, we are currently conducting a comprehensive audit of open source software contained in our solutions.
33
Although we are not aware of any use of open source software in our solutions that would require us to disclose all or a portion of the source code underlying our solutions, we have not completed our open source software audit; therefore, it is possible that such use may have inadvertently occurred in deploying our solutions. Additionally, if a third-party software provider has incorporated certain types of open source software into software we license from such third party for our solutions without our knowledge, we could, under certain circumstances, be required to disclose the source code to our solutions. This could harm our intellectual property position and our business, results of operations and financial condition.
We rely on the availability of third-party licenses. If these licenses are available to us only on less favorable terms or not at all in the future, our business and results of operations may be harmed.
We have incorporated third-party licensed technology into our products. It may be necessary in the future to renew licenses relating to various aspects of these products or to seek additional licenses for existing or new products. The necessary licenses may not be available on acceptable terms, or at all. The inability to obtain certain licenses or other rights, or to obtain those licenses or rights on favorable terms, or the need to engage in litigation regarding these matters, could result in our inability to include certain features in our products or delays in product releases until such time, if ever, as equivalent technology could be identified, licensed or developed and integrated into our products, which may have a material adverse effect on our business, results of operations and financial condition. Moreover, the inclusion in our products of intellectual property licensed from third parties on a nonexclusive basis could limit our ability to protect our proprietary rights in our products.
Failure to maintain the security of our information and technology networks, including information relating to our dealers, distributors, consumers and employees, could adversely affect us.
We are dependent on information technology networks and systems, including the Internet, to process, transmit and store electronic information and, in the normal course of our business, we collect and retain certain information pertaining to our dealers, distributors, consumers and employees. The legal, regulatory and contractual environment surrounding information security and privacy is constantly evolving and companies that collect and retain such information are under increasing attack by cyber-criminals around the world. A significant actual or potential theft, loss, fraudulent use or misuse of dealer, distributor, consumer, employee or other personally identifiable data, whether by third parties or as a result of employee malfeasance or otherwise, non-compliance with our contractual or other legal obligations regarding such data or a violation of our privacy and security policies with respect to such data could result in significant costs, fines, litigation or regulatory actions against us. Such an event could additionally result in adverse publicity and therefore adversely affect the market's perception of the security and reliability of our services. Security breaches of, or sustained attacks against, this infrastructure could create system disruptions and shutdowns that could result in disruptions to our operations. We cannot be certain that advances in cyber-capabilities or other developments will not compromise or breach the technology protecting the networks that access our products and services. If any one of these risks materializes our business, financial condition, results of operations and cash flows could be materially and adversely affected.
If security breaches in connection with the delivery of our services allow unauthorized third parties to obtain control or access of our consumers' appliances containing our products, our reputation, business, results of operations and financial condition could be harmed.
Certain of our employees and dealers can access and update certain of our home automation products and services through the Internet. If security breaches in connection with the delivery of our services via the Internet allow unauthorized third parties to obtain control of our consumers' appliances containing our products, our reputation, business, results of operations and financial condition could be
34
harmed. Furthermore, although we do not recommend or approve of port forwarding for remote access to our solutions, certain of our dealers have in the past and may in the future enable port forwarding, which could create security vulnerabilities in a consumer's home network. If security breaches in connection with the delivery of our solutions occur, our reputation, business, results of operations and financial condition could be harmed.
Risks Related to Owning Our Common Stock and this Offering
Our share price may be volatile and you may be unable to sell your shares at or above the offering price.
The initial public offering price for our shares was determined by negotiations between us and representatives of the underwriters and may not be indicative of prices that will prevail in the trading market. The market price of our common stock could be subject to wide fluctuations in response to many risk factors listed in this section, and others beyond our control, including:
- •
- Actual or anticipated fluctuations in our financial condition and results of operations;
- •
- Overall conditions in our industry and market;
- •
- Addition or loss of consumers;
- •
- Changes in laws or regulations applicable to our solutions;
- •
- Actual or anticipated changes in our growth rate relative to our competitors;
- •
- Announcements by us or our competitors of significant acquisitions, strategic partnerships, joint ventures or capital
commitments;
- •
- Additions or departures of key personnel;
- •
- Competition from existing products or new products that may emerge;
- •
- Issuance of new or updated research or reports by securities analysts;
- •
- Fluctuations in the valuation of companies perceived by investors to be comparable to us;
- •
- Disputes or other developments related to proprietary rights, including patents, litigation matters and our ability to
obtain intellectual property protection for our technologies;
- •
- Sales of our common stock by us or our stockholders;
- •
- Share price and volume fluctuations attributable to inconsistent trading volume levels of our shares;
- •
- The expiration of contractual lock-up agreements with our executive officers, directors and stockholders; and
- •
- General economic and market conditions.
Furthermore, the stock markets have experienced extreme price and volume fluctuations that have affected and continue to affect the market prices of equity securities of many companies. These fluctuations often have been unrelated or disproportionate to the operating performance of those companies. These broad market and industry fluctuations, as well as general economic, political and market conditions such as recessions, interest rate changes or international currency fluctuations, may harm the market price of our common stock. If the market price of our common stock after this offering does not exceed the initial public offering price, you may not realize any return on your investment in us and may lose some or all of your investment. In the past, companies that have experienced volatility in the market price of their stock have been subject to securities class action litigation. We may be the target of this type of litigation in the future. Securities litigation against us
35
could result in substantial costs and divert our management's attention from other business concerns, which could harm our business.
No public market for our common stock currently exists and an active trading market may not develop or be sustained following this offering.
Prior to this offering, there has been no public market for our common stock. An active trading market may not develop following the completion of this offering or, if developed, may not be sustained. The lack of an active market may impair your ability to sell your shares at the time you wish to sell them, or at a price that you consider reasonable. The lack of an active market may also reduce the fair market value of your shares. An inactive market may also impair our ability to raise capital to continue to fund operations by selling shares and may impair our ability to acquire other companies or technologies by using our shares as consideration.
If securities or industry analysts do not publish research or reports about our business, or publish negative reports about our business, our share price and trading volume could decline.
The trading market for our common stock will depend on the research and reports that securities or industry analysts publish about us or our business. We do not have any control over these analysts. If one or more of the analysts who cover us downgrade our shares or change their opinion of our shares, our share price would likely decline. If one or more of these analysts cease coverage of our company or fail to regularly publish research or reports on us, we could lose visibility in the financial markets, which could cause our stock price or trading volume to decline.
Future sales of our common stock in the public market could cause our share price to fall.
Sales of a substantial number of shares of our common stock in the public market after this offering, or the perception that these sales might occur, could depress the market price of our common stock and could impair our ability to raise capital through the sale of additional equity securities. Based on the number of shares of common stock outstanding as of March 31, 2013, upon the closing of this offering, we will have 22,094,267 shares of common stock outstanding, assuming no exercise of outstanding options or the underwriters' option to purchase additional shares.
All of the common stock sold in this offering will be freely tradable without restrictions or further registration under the Securities Act except for any shares held by our affiliates as defined in Rule 144 under the Securities Act. 18,020,718 shares of common stock outstanding after this offering, or 81.6% based on shares outstanding as of March 31, 2013 after giving effect to this offering, will be restricted as a result of securities laws, lock-up agreements or other contractual restrictions that restrict transfers for at least 180 days after the date of this prospectus, subject to certain extensions.
The underwriters may, in their sole discretion, release all or some portion of the shares subject to lock-up agreements with the underwriters prior to expiration of the lock-up period. See "Shares Eligible for Future Sale."
The holders of 16,130,909 shares of common stock outstanding after this offering, or 73.0% based on shares outstanding as of March 31, 2013 after giving effect to this offering, will be entitled to rights with respect to registration of such shares under the Securities Act pursuant to an investors' rights agreement between such holders and us. See "Description of Capital Stock—Registration Rights." If such holders, by exercising their registration rights, sell a large number of shares, the market price for our common stock could be harmed. If we file a registration statement for the purpose of selling additional shares to raise capital and are required to include shares held by these holders pursuant to the exercise of their registration rights, our ability to raise capital may be impaired. We intend to file a registration statement on Form S-8 under the Securities Act to register shares for issuance under our 2003 Equity Incentive Plan and 2013 Stock Option and Incentive Plan. Our 2013
36
Stock Option and Incentive Plan provides for automatic increases in the shares reserved for issuance under the plan which could result in additional dilution to our stockholders. Once we register these shares, they can be freely sold in the public market upon issuance and vesting, subject to a lock-up period of at least 180 days and other restrictions provided under the terms of the applicable plan and/or the option agreements entered into with option holders.
Our management team may invest or spend the proceeds of this offering in ways with which you may not agree, or in ways which may not yield a positive return.
The net proceeds from this offering may be used for working capital purposes and for other general corporate purposes, including the research and development of new solutions, sales and marketing activities, paying off remaining amounts owed under a litigation settlement agreement, financing acquisition opportunities and other capital expenditures. Although we may use a portion of the net proceeds to acquire complementary products, solutions, technologies or businesses, we have no current understandings, agreements or commitments to do so at this time.
Our management will have considerable discretion in the application of the net proceeds, and you will not have the opportunity, as part of your investment decision, to assess whether the proceeds are being used appropriately. The net proceeds may be used for corporate purposes that do not improve our results of operations or increase our market value.
Purchasers in this offering will experience immediate and substantial dilution in the book value of their investment.
The initial public offering price of our common stock is substantially higher than the net tangible book value per share of our outstanding common stock immediately after this offering. Therefore, if you purchase our common stock in this offering, you will incur immediate dilution of $12.39 in net tangible book value per share from the price you paid. In addition, following this offering, purchasers in this offering will have contributed 34.7% of the total consideration paid by our stockholders to purchase shares of common stock, in exchange for acquiring approximately 18.1% of our total outstanding shares as of March 31, 2013 after giving effect to this offering. In addition, if outstanding options to purchase our common stock are exercised, you will experience additional dilution.
Our directors, executive officers and principal stockholders will continue to have substantial control over us after this offering and could delay or prevent a change in corporate control.
After this offering, our directors, executive officers and holders of more than 5% of our common stock, together with their affiliates, will beneficially own, in the aggregate, 67.2% of our outstanding common stock, assuming no exercise of the underwriters' option to purchase additional shares of our common stock in this offering. As a result, these stockholders, acting together, would have the ability to control the outcome of matters submitted to our stockholders for approval, including the election of directors and any merger, consolidation or sale of all or substantially all of our assets. In addition, these stockholders, acting together, would have the ability to control the management and affairs of our company. Accordingly, this concentration of ownership might harm the market price of our common stock by:
- •
- Delaying, deferring or preventing a change in corporate control;
- •
- Impeding a merger, consolidation, takeover or other business combination involving us; or
- •
- Discouraging a potential acquirer from making a tender offer or otherwise attempting to obtain control of us.
37
Anti-takeover provisions in our charter documents and under Delaware law could make an acquisition of us, which may be beneficial to our stockholders, more difficult and may prevent attempts by our stockholders to replace or remove our current management and limit the market price of our common stock.
Provisions in our certificate of incorporation and bylaws, as amended and restated upon the closing of this offering, may have the effect of delaying or preventing a change of control or changes in our management. Our amended and restated certificate of incorporation and amended and restated bylaws, which will become effective upon the closing of this offering, include provisions that:
- •
- Authorize our board of directors to issue, without further action by the stockholders up to 25,000,000 shares of
undesignated preferred stock;
- •
- Require that any action to be taken by our stockholders be effected at a duly called annual or special meeting and not by
written consent;
- •
- Specify that special meetings of our stockholders can be called only by our board of directors, the Chairman of the Board,
the Chief Executive Officer or the President;
- •
- Establish an advance notice procedure for stockholder approvals to be brought before an annual meeting of our
stockholders, including proposed nominations of persons for election to our board of directors;
- •
- Provide that directors may be removed only for cause;
- •
- Provide that vacancies on our board of directors may be filled only by a majority of directors then in office, even though
less than a quorum;
- •
- Establish that our board of directors is divided into three classes—Class I, Class II and
Class III—with each class serving staggered terms; and
- •
- Require a super-majority of votes to amend certain of the above-mentioned provisions.
These provisions, alone or together, could delay or prevent hostile takeovers and changes in control. These provisions may also frustrate or prevent any attempts by our stockholders to replace or remove our current management by making it more difficult for stockholders to replace members of our board of directors, which is responsible for appointing the members of our management.
As a Delaware corporation, we are also subject to provisions of Delaware law, including Section 203 of the Delaware General Corporation law, which prevents some stockholders holding more than 15% of our outstanding common stock from engaging in certain business combinations without approval of the holders of substantially all of our outstanding common stock.
Any provision of our certificate of incorporation or bylaws or Delaware law that has the effect of delaying or deterring a change of control could limit the opportunity for our stockholders to receive a premium for their shares of our common stock, and could also affect the price that some investors are willing to pay for our common stock.
We do not intend to pay dividends for the foreseeable future.
We have never declared or paid any cash dividends on our common stock and do not intend to pay any cash dividends in the foreseeable future. We anticipate that we will retain all of our future earnings for use in the operation of our business and for general corporate purposes. Any determination to pay dividends in the future will be at the discretion of our board of directors. Accordingly, investors must rely on sales of their common stock after price appreciation, which may never occur, as the only way to realize any future gains on their investments.
38
SPECIAL NOTE REGARDING FORWARD-LOOKING STATEMENTS AND INDUSTRY DATA
This prospectus contains forward-looking statements that are based on our management's beliefs and assumptions and on information currently available to our management. The forward-looking statements are contained principally in, but not limited to, the "Prospectus Summary," "Risk Factors," "Management's Discussion and Analysis of Financial Condition and Results of Operations," "Business" and "Executive Compensation." Forward-looking statements include all statements that are not historical facts and can be identified by terms such as "anticipates," "believes," "could," "seeks," "estimates," "expects," "intends," "may," "plans," "potential," "predicts, "projects," "should," "will," "would" or similar expressions and the negatives of those terms. Forward-looking statements include, but are not limited to, statements about:
- •
- Our growth strategy;
- •
- Our plans for future enhancements to our software platform and product offerings;
- •
- Our results of operations;
- •
- Our ability to anticipate future market demands and the needs of our consumers;
- •
- Our ability to compete with other companies targeting the home automation market;
- •
- Our ability to manage and expand the dealers and distributors we rely on to sell our solution;
- •
- Our ability to effectively manage our growth;
- •
- Our expectations regarding the use of proceeds;
- •
- Our expectations regarding our expenses, sales and operations;
- •
- Our anticipated trends and challenges in the markets in which we operate;
- •
- Our ability to expand internationally;
- •
- Our ability to successfully enter new markets; and
- •
- Our intellectual property.
Forward-looking statements involve known and unknown risks, uncertainties and other factors that may cause our actual results, performance or achievements to be materially different from any future results, performance or achievements expressed or implied by the forward-looking statements. We discuss these risks in greater detail in "Risk Factors" and elsewhere in this prospectus. Given these uncertainties, you should not place undue reliance on these forward-looking statements. Also, forward-looking statements represent our management's beliefs and assumptions only as of the date of this prospectus. You should read this prospectus and the documents that we have filed as exhibits to the registration statement, of which this prospectus is a part, completely and with the understanding that our actual future results may be materially different from what we expect.
Except as required by law, we assume no obligation to update these forward-looking statements publicly, or to update the reasons actual results could differ materially from those anticipated in these forward-looking statements, even if new information becomes available in the future.
This prospectus also contains estimates and other information concerning our industry, including market size and growth rates, which are based on industry publications, surveys and forecasts, including those generated by ABI Research and IDC. These industry publications, surveys and forecasts generally indicate that their information has been obtained from sources believed to be reliable. The industry in which we operate is subject to a high degree of uncertainty and risk due to variety of factors, including those described in "Risk Factors."
39
We estimate that the net proceeds from our sale of 4,000,000 shares of common stock in this offering at an assumed initial public offering price of $16.00 per share, the midpoint of the price range set forth on the cover page of this prospectus, after deducting estimated underwriting discounts and commissions and estimated offering expenses payable by us, will be approximately $57.0 million, or $65.9 million if the underwriters' option to purchase additional shares is exercised in full. A $1.00 increase (decrease) in the assumed initial public offering price would increase (decrease) the net proceeds to us from this offering by $3.7 million, assuming the number of shares offered by us, as set forth on the cover page of this prospectus, remains the same and after deducting the estimated underwriting discounts and commissions.
We intend to use the net proceeds of this offering primarily for general corporate purposes, including working capital and capital expenditures. We intend to use $2.25 million of the net proceeds from this offering to pay off the remaining amounts owed under a litigation settlement agreement.
In addition, if appropriate opportunities arise to acquire or invest in complementary technologies, assets or businesses, we may use a portion of the net proceeds for such acquisition or investment. However, we are not currently discussing any such potential acquisition or investment with any third party. The amount and timing of these expenditures will vary depending on a number of factors, including competitive and technological developments and the rate of growth, if any, of our business.
Pending their use, we plan to invest our net proceeds from this offering in short-term, interest-bearing obligations, investment-grade instruments, certificates of deposit or direct or guaranteed obligations of the U.S. government.
We have never declared or paid cash dividends on our common stock. We currently intend to retain all available funds and any future earnings for use in the operation of our business and do not anticipate paying any dividends on our common stock in the foreseeable future. Any future determination to declare dividends will be made at the discretion of our board of directors and will depend on our financial condition, results of operations, capital requirements, general business conditions and other factors that our board of directors may deem relevant. In addition, our credit facility prohibits us from declaring or paying cash dividends on our capital stock.
40
The following table sets forth our capitalization as of March 31, 2013:
- •
- On an actual basis;
- •
- On a pro forma basis to reflect the conversion of all outstanding shares of our preferred stock into 15,293,960 shares of
our common stock, which will occur immediately prior to the closing of this offering assuming our valuation prior to this offering is at least $225 million and the net proceeds to us from this
offering are not less than $35 million, the net exercise of outstanding warrants to purchase 723,901 shares of capital stock into an aggregate of 293,232 shares of common stock as of
March 31, 2013 and the corresponding reclassification of our warrant liability to additional paid-in capital, which will occur immediately prior to the closing of this offering unless earlier
exercised or expired, and the filing of our post-offering amended and restated certificate of incorporation, which will occur immediately prior to the closing of this offering; and
- •
- On a pro forma as adjusted basis to reflect the pro forma adjustments described above and (i) our receipt of the net proceeds from our sale of 4,000,000 shares of common stock in this offering at an assumed initial public offering price of $16.00 per share, the midpoint of the price range set forth on the cover page of this prospectus, after deducting estimated underwriting discounts and commissions and estimated offering expenses payable by us and (ii) the payment of the remaining amount owed under a litigation settlement agreement.
The information below is illustrative only and our capitalization following the completion of this offering will be adjusted based on the actual initial public offering price and other terms of this offering determined at pricing. You should read this table together with "Management's Discussion and Analysis of Financial Condition and Results of Operations" and our financial statements and the related notes appearing elsewhere in this prospectus.
| |
As of March 31, 2013 | |||||||||
|---|---|---|---|---|---|---|---|---|---|---|
| |
Actual | Pro Forma | Pro Forma As Adjusted |
|||||||
| |
(In thousands) |
|||||||||
Total debt and settlement obligations |
$ | 7,233 | $ | 7,233 | $ | 5,173 | ||||
Warrant liability |
576 | — | — | |||||||
Redeemable Convertible Preferred stock, $0.0001 par value, 83,163,408 shares authorized, 15,293,960 shares issued and outstanding, actual; 83,163,408 shares authorized, no shares issued and outstanding, pro forma; no shares authorized, issued, and outstanding, pro forma as adjusted |
116,313 | — | — | |||||||
Stockholders' equity (deficit) |
||||||||||
Preferred stock, $0.0001 par value, no shares authorized, issued, and outstanding, actual and pro forma; 25,000,000 shares authorized, no shares issued and outstanding, pro forma as adjusted |
— | — | — | |||||||
Common stock, $0.0001 par value, 127,836,592 shares authorized, 2,507,075 shares issued and outstanding, actual; 500,000,000 shares authorized, 18,094,267 shares issued and outstanding, pro forma; 500,000,000 shares authorized, 22,094,267 shares issued and outstanding, pro forma as adjusted |
— | 2 | 2 | |||||||
Additional paid-in capital |
13,863 | 130,750 | 187,770 | |||||||
Accumulated deficit |
(107,058 | ) | (107,058 | ) | (107,248 | ) | ||||
Accumulated other comprehensive loss |
(9 | ) | (9 | ) | (9 | ) | ||||
Total stockholders' equity (deficit) |
(93,204 | ) | 23,685 | 80,515 | ||||||
Total capitalization |
$ | 30,918 | $ | 30,918 | $ | 85,688 | ||||
41
The number of shares of our common stock to be outstanding after the completion of this offering is based on:
- •
- 17,801,035 shares outstanding as of March 31, 2013;
- •
- 76,964 shares of common stock, on an as-converted basis, issuable upon the net exercise of a warrant to
purchase 182,666 shares of preferred stock outstanding as of March 31, 2013 at an exercise price of $9.26 that would terminate upon this offering in accordance with its terms; and
- •
- 216,268 shares of common stock issuable upon the net exercise of warrants to purchase 541,235 shares of common stock outstanding as of March 31, 2013 at an exercise price of $9.61 that would terminate upon this offering in accordance with their terms.
The number of shares of our common stock to be outstanding after the completion of this offering excludes:
- •
- 4,609,466 shares of common stock issuable upon the exercise of options outstanding as of March 31, 2013 at a
weighted average exercise price of $5.56 per share of which 19,324 shares of common stock were issued upon the exercise of options with a weighted average exercise price of $5.91 after
March 31, 2013;
- •
- 389,782 shares of common stock issuable upon the exercise of options that were granted after March 31, 2013, with
an exercise price of $11.28 per share;
- •
- 11,715 shares of common stock, on an as-converted basis, issuable upon the exercise of warrants to purchase
preferred stock outstanding as of March 31, 2013 at a weighted average exercise price of $7.71 per share; and
- •
- 2,200,000 shares reserved for future issuance under our 2013 Stock Option and Incentive Plan, as well as shares originally reserved for issuance under our 2003 Equity Incentive Plan, but which may become available for awards under our 2013 Stock Option and Incentive Plan, which plan will become effective in connection with this offering and contains provisions that will automatically increase its share reserve each year, as more fully described in "Executive Compensation—Employee Benefit Plans."
A $1.00 increase (decrease) in the assumed initial public offering price of $16.00 per share, the midpoint of the range set forth on the cover page of this prospectus, would increase (decrease) cash and cash equivalents and total stockholders' equity (deficit) and total capitalization by $3.7 million, assuming that the number of shares offered by us, as set forth on the cover page of this prospectus, remains the same, and after deducting estimated underwriting discounts and commissions payable by us. Each increase or decrease of 1.0 million shares in the number of shares offered by us, assuming that the assumed initial public offering price remains the same, would increase or decrease cash and cash equivalents and total stockholders' equity (deficit) and total capitalization by $14.9 million.
42
If you invest in our common stock, your interest will be diluted to the extent of the difference between the amount per share paid by purchasers of shares of common stock in this initial public offering and the pro forma as adjusted net tangible book value per share of common stock immediately after this offering.
At March 31, 2013, our pro forma net tangible book value was approximately $22.8 million, or $1.26 per share of common stock. Net tangible book value per share represents the amount of our total tangible assets less our total liabilities, divided by the shares of common stock outstanding at March 31, 2013. After giving effect to (i) our sale of 4,000,000 shares of common stock in this offering at an assumed initial public offering price of $16.00 per share, the midpoint of the price range set forth on the cover page of this prospectus, and after deducting estimated underwriting discounts and commissions and estimated offering expenses payable by us and (ii) the payment of the remaining amount owed under a litigation settlement agreement, our pro forma as adjusted net tangible book value at March 31, 2013 would have been $79.7 million, or $3.61 per share of common stock. This represents an immediate increase in pro forma as adjusted net tangible book value of $2.35 per share to existing stockholders and an immediate dilution of $12.39 per share to new investors.
The following table illustrates this dilution:
Assumed initial public offering price per share |
$ | 16.00 | |||||
Pro forma net tangible book value per share as of March 31, 2013 |
$ | 1.26 | |||||
Increase per share attributable to this offering |
2.35 | ||||||
Pro forma as adjusted net tangible book value per share after giving effect to this offering |
3.61 | ||||||
Net tangible book value dilution per share to investors in this offering |
$ | 12.39 | |||||
If the underwriters fully exercise their option to purchase additional shares, the pro forma as adjusted net tangible book value per share after giving effect to this offering would be $3.90 per share, and the dilution in pro forma net tangible book value per share to investors in this offering would be $12.10 per share.
The following table summarizes, on a pro forma as adjusted basis as of March 31, 2013, the total number of shares of common stock purchased from us, the total consideration paid to us and the average price per share paid to us by existing stockholders and by new investors purchasing shares in this offering at the assumed initial public offering price of $16.00 per share, the midpoint of the price range set forth on the cover page of this prospectus, before deducting estimated underwriting discounts and commissions and estimated offering expenses payable by us:
| |
Shares Purchased | Total Consideration | |
|||||||||||||
|---|---|---|---|---|---|---|---|---|---|---|---|---|---|---|---|---|
| |
Average Price Per Share |
|||||||||||||||
| |
Number | Percent | Amount | Percent | ||||||||||||
Existing stockholders |
18,094,267 | 81.9 | % | $ | 120,643,770 | 65.3 | % | $ | 6.67 | |||||||
New investors |
4,000,000 | 18.1 | 64,000,000 | 34.7 | 16.00 | |||||||||||
Total |
22,094,267 | 100.0 | % | $ | 184,643,770 | 100.0 | % | $ | 8.36 | |||||||
The foregoing calculations are based on:
- •
- 17,801,035 shares outstanding as of March 31, 2013;
- •
- 76,964 shares of common stock, on an as-converted basis, issuable upon the net exercise of a warrant to purchase 182,666 shares of preferred stock outstanding as of March 31, 2013 at
43
- •
- 216,268 shares of common stock issuable upon the net exercise of warrants to purchase 541,235 shares of common stock outstanding as of March 31, 2013 at an exercise price of $9.61 that would terminate upon this offering in accordance with their terms.
an exercise price of $9.26 that would terminate upon this offering in accordance with its terms; and
The foregoing calculations exclude:
- •
- 4,609,466 shares of common stock issuable upon the exercise of options outstanding as of March 31, 2013 at a
weighted average exercise price of $5.56 per share of which 21,246 shares of common stock were issued upon the exercise of options with a weighted average exercise price of $5.93 after
March 31, 2013;
- •
- 389,782 shares of common stock issuable upon the exercise of options that were granted after March 31, 2013, with
an exercise price of $11.28 per share;
- •
- 11,715 shares of common stock, on an as-converted basis, issuable upon the exercise of warrants to purchase
preferred stock outstanding as of March 31, 2013 at a weighted average exercise price of $7.71 per share; and
- •
- 2,200,000 shares reserved for future issuance under our 2013 Stock Option and Incentive Plan, as well as shares originally reserved for issuance under our 2003 Equity Incentive Plan, but which may become available for awards under our 2013 Stock Option and Incentive Plan, which plan will become effective in connection with this offering and contains provisions that will automatically increase its share reserve each year, as more fully described in "Executive Compensation—Employee Benefit Plans."
A $1.00 increase (decrease) in the assumed initial public offering price of $16.00 per share, the midpoint of the range set forth on the cover page of this prospectus, would increase (decrease) our pro forma as adjusted net tangible book value by $3.7 million, or $0.17 per share, and the pro forma dilution per share to investors in this offering would increase or decrease, as applicable, by $0.83 per share, assuming that the number of shares offered by us, as set forth on the cover page of this prospectus, remains the same, and after deducting estimated underwriting discounts and commissions payable by us. The pro forma information discussed above is illustrative only and will change based on the actual initial public offering price and other terms of this offering determined at pricing.
44
SELECTED CONSOLIDATED FINANCIAL DATA
We have derived the selected consolidated statements of operations data for the fiscal years ended December 31, 2010, 2011 and 2012 and the selected consolidated balance sheet data as of December 31, 2011 and 2012 from our audited consolidated financial statements and related notes included elsewhere in this prospectus. We have derived the selected consolidated statements of operations data for the three months ended March 31, 2012 and March 31, 2013 and the selected consolidated balance sheet data as of March 31, 2013 from our unaudited interim consolidated financial statements included elsewhere in this prospectus. We have derived the selected consolidated statements of operations data for the fiscal years ended December 31, 2008 and 2009 from our audited consolidated financial statements not included in this prospectus. We have derived the selected consolidated balance sheet data as of March 31, 2012 from our unaudited consolidated financial statements not included in this prospectus. Our unaudited interim consolidated financial statements have been prepared on the same basis as our annual consolidated financial statements and include all adjustments, consisting of only normal recurring adjustments, necessary for the fair presentation of those statements. The following selected consolidated financial data should be read in conjunction with "Management's Discussion and Analysis of Financial Condition and Results of Operations" and our consolidated financial statements and related notes included elsewhere in this prospectus. Our historical results are not necessarily indicative of the results to be expected for any future period and the results for any interim period are not necessarily indicative of the results to be expected in the full year.
| |
Years Ended December 31, | Three Months Ended March 31, |
||||||||||||||||||||
|---|---|---|---|---|---|---|---|---|---|---|---|---|---|---|---|---|---|---|---|---|---|---|
| |
2008 | 2009 | 2010 | 2011 | 2012 | 2012 | 2013 | |||||||||||||||
| |
(In thousands, except per share data) |
|
|
|||||||||||||||||||
Consolidated Statements of Operations Data: |
||||||||||||||||||||||
Revenue |
$ |
57,098 |
$ |
67,742 |
$ |
74,925 |
$ |
93,376 |
$ |
109,512 |
$ |
22,628 |
$ |
26,571 |
||||||||
Cost of revenue |
35,330 | 41,674 | 43,357 | 50,534 | 57,225 | 12,466 | 13,550 | |||||||||||||||
Cost of revenue—inventory purchase commitment |
— | — | — | — | 1,840 | — | — | |||||||||||||||
Gross margin |
21,768 | 26,068 | 31,568 | 42,842 | 50,447 | 10,162 | 13,021 | |||||||||||||||
Operating expenses: |
||||||||||||||||||||||
Research and development |
12,013 | 10,862 | 15,922 | 19,211 | 20,310 | 4,813 | 6,066 | |||||||||||||||
Sales and marketing |
15,079 | 16,483 | 22,491 | 17,546 | 20,182 | 5,038 | 5,605 | |||||||||||||||
General and administrative |
8,225 | 6,690 | 8,876 | 9,805 | 10,150 | 2,532 | 2,828 | |||||||||||||||
Litigation settlement |
3,937 | — | — | — | 2,869 | — | — | |||||||||||||||
Total operating expenses |
39,254 | 34,035 | 47,289 | 46,562 | 53,511 | 12,383 | 14,499 | |||||||||||||||
Loss from operations |
(17,486 | ) | (7,967 | ) | (15,721 | ) | (3,720 | ) | (3,064 | ) | (2,221 | ) | (1,478 | ) | ||||||||
Interest and other expense, net |
(47 | ) | (401 | ) | (544 | ) | (165 | ) | (518 | ) | (462 | ) | (49 | ) | ||||||||
Loss before income taxes |
(17,533 | ) | (8,368 | ) | (16,265 | ) | (3,885 | ) | (3,582 | ) | (2,683 | ) | (1,527 | ) | ||||||||
Income tax (expense) benefit |
— | — | — | — | (141 | ) | — | 56 | ||||||||||||||
Net loss |
$ | (17,533 | ) | $ | (8,368 | ) | $ | (16,265 | ) | $ | (3,885 | ) | $ | (3,723 | ) | $ | (2,683 | ) | $ | (1,471 | ) | |
Net loss per common share, |
$ | (11.85 | ) | $ | (5.42 | ) | $ | (9.93 | ) | $ | (2.02 | ) | $ | (1.58 | ) | $ | (1.19 | ) | $ | (0.59 | ) | |
Other Non-GAAP Financial Data: |
||||||||||||||||||||||
Adjusted gross margin |
$ |
21,811 |
$ |
26,094 |
$ |
31,596 |
$ |
42,891 |
$ |
52,365 |
$ |
10,179 |
$ |
13,037 |
||||||||
Adjusted gross margin percentage |
38.2% | 38.5% | 42.2% | 45.9% | 47.8% | 45.0% | 49.1% | |||||||||||||||
Adjusted operating income (loss) |
$ | (12,541 | ) | $ | (6,928 | ) | $ | (14,252 | ) | $ | (1,707 | ) | $ | 4,514 | $ | (1,490 | ) | $ | (640 | ) | ||
45
Stock-based compensation expense included in the consolidated statements of operations data above was as follows:
| |
Years Ended December 31, | Three Months Ended March 31, |
||||||||||||||||||||
|---|---|---|---|---|---|---|---|---|---|---|---|---|---|---|---|---|---|---|---|---|---|---|
| |
2008 | 2009 | 2010 | 2011 | 2012 | 2012 | 2013 | |||||||||||||||
| |
(In thousands) |
|
|
|||||||||||||||||||
Cost of revenue |
$ | 43 | $ | 26 | $ | 28 | $ | 49 | $ | 78 | $ | 17 | $ | 16 | ||||||||
Research and development |
167 | 229 | 249 | 492 | 704 | 130 | 236 | |||||||||||||||
Sales and marketing |
245 | 339 | 546 | 523 | 580 | 144 | 184 | |||||||||||||||
General and administrative |
553 | 445 | 646 | 949 | 1,507 | 440 | 402 | |||||||||||||||
Total stock-based compensation expense |
$ | 1,008 | $ | 1,039 | $ | 1,469 | $ | 2,013 | $ | 2,869 | $ | 731 | $ | 838 | ||||||||
Adjusted Gross Margin
A reconciliation of Adjusted gross margin to gross margin, the most directly comparable GAAP financial measure, is presented below:
| |
Years Ended December 31, | Three Months Ended March 31, |
||||||||||||||||||||
|---|---|---|---|---|---|---|---|---|---|---|---|---|---|---|---|---|---|---|---|---|---|---|
| |
2008 | 2009 | 2010 | 2011 | 2012 | 2012 | 2013 | |||||||||||||||
| |
(Dollars in thousands) |
|
|
|||||||||||||||||||
Gross margin |
$ | 21,768 | $ | 26,068 | $ | 31,568 | $ | 42,842 | $ | 50,447 | $ | 10,162 | $ | 13,021 | ||||||||
Stock-based compensation expense included in cost of revenue |
43 | 26 | 28 | 49 | 78 | 17 | 16 | |||||||||||||||
Cost of revenue—inventory purchase commitment |
— | — | — | — | 1,840 | — | — | |||||||||||||||
Adjusted gross margin |
$ | 21,811 | $ | 26,094 | $ | 31,596 | $ | 42,891 | $ | 52,365 | $ | 10,179 | $ | 13,037 | ||||||||
Adjusted gross margin percentage |
38.2% | 38.5% | 42.2% | 45.9% | 47.8% | 45.0% | 49.1% | |||||||||||||||
To provide investors with additional information regarding our financial results, we have disclosed in the table above and within this prospectus Adjusted gross margin, a non-GAAP financial measure. We have included Adjusted gross margin in this prospectus because Adjusted gross margin is a key measure used by our management and board of directors to understand and evaluate our operating performance and trends, to prepare and approve our annual budget and to develop short- and long-term operational plans.
Adjusted gross margin is defined as gross margin less stock-based compensation expense and loss on inventory purchase commitment. Management believes that the use of Adjusted gross margin provides consistency and comparability with our past and future performance, facilitates period-to-period comparisons and also facilitates comparisons with other companies.
Management believes that it is useful to exclude stock-based compensation expense from gross margin because the amount of such expense in any specific period may not directly correlate to the underlying performance of our business operations. We believe it is useful to exclude loss on inventory purchase commitment because it is an expense that arose from our commitment to purchase energy-related products from our contract manufacturing partner that we will not use due to our decision to discontinue our energy product line for utility customers. We have not incurred that type of expense in past periods and we believe that past and future periods are more comparable if we exclude that expense from gross margin.
46
Our use of Adjusted gross margin has limitations as an analytical tool and you should not consider it in isolation or a substitute for our analysis of our results as reported under GAAP. Some of these limitations are:
- •
- Adjusted gross margin does not reflect the potentially dilutive impact of equity-based compensation; and
- •
- Although we have not incurred significant loss on purchase commitments in the past, there is no guarantee that we will not incur those expenses in the future and therefore Adjusted gross margin may not be indicative of future performance.
Because of these limitations, you should consider Adjusted gross margin alongside other financial performance measures.
Adjusted Operating Income
A reconciliation of Adjusted operating income (loss) to loss from operations, the most directly comparable GAAP financial measure, is presented below:
| |
Years Ended December 31, | Three Months Ended March 31, |
||||||||||||||||||||
|---|---|---|---|---|---|---|---|---|---|---|---|---|---|---|---|---|---|---|---|---|---|---|
| |
2008 | 2009 | 2010 | 2011 | 2012 | 2012 | 2013 | |||||||||||||||
| |
(In thousands) |
|
|
|||||||||||||||||||
Loss from operations |
$ | (17,486 | ) | $ | (7,967 | ) | $ | (15,721 | ) | $ | (3,720 | ) | $ | (3,064 | ) | $ | (2,221 | ) | $ | (1,478 | ) | |
Stock-based compensation expense |
1,008 | 1,039 | 1,469 | 2,013 | 2,869 | 731 | 838 | |||||||||||||||
Cost of revenue—inventory purchase commitment |
— | — | — | — | 1,840 | — | — | |||||||||||||||
Litigation settlement |
3,937 | — | — | — | 2,869 | — | — | |||||||||||||||
Adjusted operating income (loss) |
$ | (12,541 | ) | $ | (6,928 | ) | $ | (14,252 | ) | $ | (1,707 | ) | $ | 4,514 | $ | (1,490 | ) | $ | (640 | ) | ||
To provide investors with additional information regarding our financial results, we have disclosed in the table above and within this prospectus Adjusted operating income, a non-GAAP financial measure. We have included Adjusted operating income in this prospectus because Adjusted operating income is a key measure used by our management and board of directors to understand and evaluate our operating performance and trends. We use it to prepare and approve our annual budget and to develop short- and long-term operational plans.
Adjusted operating income is defined as operating income less stock-based compensation expense, less loss on inventory purchase commitment and litigation settlement expense. Management believes that the use of Adjusted operating income provides consistency and comparability with our past and future performance, facilitates period-to-period comparisons and also facilitates comparisons with other companies.
Management believes that it is useful to exclude stock-based compensation expense from operating income because the amount of such expense in any specific period may not directly correlate to the underlying performance of our business operations. We believe it is useful to exclude loss on inventory purchase commitment because it is an expense that arose from our commitment to purchase energy-related products from our contract manufacturing partner that we will not use due to our decision to discontinue our energy product line for utility customers. We have not incurred that type of expense in past periods and we believe that past and future periods are more comparable if we exclude that expense from operating income. We believe it is useful to exclude litigation settlement expense
47
from operating income because that expense was related to two separate legal settlements that were resolved in 2012. Those settlements are not indicative of past or future operating performance. We believe that past and future periods are more comparable if we exclude that expense from operating income.
Our use of Adjusted operating income has limitations as an analytical tool and you should not consider it in isolation or a substitute for our analysis of our results as reported under GAAP. Some of these limitations are:
- •
- Adjusted operating income does not reflect the potentially dilutive impact of equity-based compensation;
- •
- Although we have not incurred significant loss on purchase commitments in the past, there is no guarantee that we will not
incur those expenses in the future and therefore Adjusted operating income may not be indicative of future performance; and
- •
- We are involved in litigation matters from time to time and we may incur litigation settlement expenses in future periods and therefore Adjusted operating income may not be indicative of future performance.
Because of these limitations, you should consider Adjusted operating income alongside other financial performance measures.
Consolidated Balance Sheet Data
The following table sets forth our selected consolidated balance sheet data as of the dates presented:
| |
As of December 31, | As of March 31, | |||||||||||
|---|---|---|---|---|---|---|---|---|---|---|---|---|---|
| |
2011 | 2012 | 2012 | 2013 | |||||||||
| |
(In thousands) |
|
|
||||||||||
Consolidated Balance Sheet Data: |
|||||||||||||
Cash and cash equivalents |
$ | 18,468 | $ | 18,695 | $ | 16,561 | $ | 14,573 | |||||
Property and equipment, net |
2,127 | 2,666 | 2,262 | 3,566 | |||||||||
Working capital, excluding deferred revenue |
24,908 | 23,832 | 23,156 | 21,582 | |||||||||
Total assets |
43,534 | 50,638 | 42,126 | 49,455 | |||||||||
Long-term debt, including current portion |
2,320 | 3,159 | 2,388 | 3,394 | |||||||||
Redeemable convertible preferred stock and warrant liability |
116,660 | 116,914 | 117,059 | 116,889 | |||||||||
Total stockholders' deficit |
(92,506 | ) | (92,603 | ) | (94,499 | ) | (93,204 | ) | |||||
48
MANAGEMENT'S DISCUSSION AND ANALYSIS OF FINANCIAL CONDITION
AND RESULTS OF OPERATIONS
You should read the following discussion and analysis of our financial condition and results of operations in conjunction with our consolidated financial statements and the notes thereto included elsewhere in this prospectus. The following discussion contains forward-looking statements that reflect our plans, estimates and beliefs. Our actual results could differ materially from those discussed in the forward-looking statements. Factors that could cause or contribute to these differences include those discussed below and elsewhere in this prospectus, particularly in the "Risk Factors" section.
Overview
Control4 is a leading provider of automation and control solutions for the connected home. We unlock the potential of connected devices, making entertainment systems easier to use, homes more comfortable and energy efficient, and families more secure. We provide our consumers with the ability to integrate music, video, lighting, temperature, security, communications and other functionalities into a unified home automation solution that enhances our consumers' daily lives. More than 75% of our consumers have integrated two or more of these functionalities with our solution. At the center of our solution is our advanced software platform, which we provide through our products that interface with a wide variety of connected devices that are developed by us and by third parties.
We derive virtually all of our revenue from the sale of products that contain our proprietary software, which functions as the operating system of the home. Currently, we derive a smaller portion of our revenue from licensing our MyHome software, which allows consumers to access their home control system from their smartphone, tablet or laptop. In the future, we plan to bundle MyHome software licenses with our controller appliances. We also generate revenue from the sale of annual subscriptions to our 4Sight service, which allows consumers to receive alerts regarding activities in their home, and also allows dealers to perform remote diagnostic services. Although our subscription-based revenue is currently insignificant, we intend over time to develop additional subscription-based services and increase our subscription-based revenue.
We outsource the manufacturing of our hardware products to contract manufacturers. The majority of our hardware products are manufactured by Sanmina and LiteOn at their respective facilities in southern China, with additional manufacturing performed by six other contract manufacturers throughout Asia.
Consumers purchase our products from our worldwide network of certified independent dealers, regional and national retailers and distributors. These dealers design and install a solution to fit the specific needs of each consumer, whether it is a one-room home theatre solution or a whole-home automation solution that includes the integration of music, video, lighting, temperature, security and communications devices. Our products are primarily installed in both new and existing residences. A portion of our revenue is attributable to small commercial installations and multi-dwelling units, including hotels. During the year ended December 31, 2012, we sold our products directly to over 2,800 active direct dealers in the United States, Canada, the United Kingdom and 40 other countries, and partnered with 27 distributors to cover an additional 38 countries where we do not have direct dealer relationships. These distributors sell our solutions through dealers and provide warehousing, training, technical support, billing and service for dealers in each of those countries.
We were founded in 2003 and began shipping our products and generating revenue in 2005. Our revenue has increased from $23.0 million for the year ended December 31, 2006 to $109.5 million for the year ended December 31, 2012. Our revenue for the three months ended March 31, 2013 was $26.6 million, compared to $22.6 million for the three months ended March 31, 2012. Our revenue growth has resulted primarily from a combination of adding new dealers and distributors to our sales
49
channel, as well as increasing revenue from existing dealers and distributors by enhancing and expanding our product offerings and solutions.
We refer to revenue from sales through our dealer and distributor network in the United States and Canada (which we refer to as North America) and outside of North America (which we refer to as International) as our Core revenue. Our Core revenue excludes revenue attributable to products we sell to hotels and other multi-dwelling units, and certain other revenue. Our North America Core revenue represented 74% and 77% of our revenue for the year ended December 31, 2012 and the three months ended March 31, 2013, respectively. Our International Core revenue has been growing at a faster rate than our North America Core revenue. Our International Core revenue for the three months ended March 31, 2013 increased by 20% compared to the three months ended March 31, 2012, primarily due to our addition of new international dealers and distributors.
To date, nearly all of our revenue growth has been organic. We have completed small acquisitions, but those acquisitions have been technology- and distribution-related and have not contributed materially to our revenue. We intend to identify, acquire and integrate strategic technologies, assets and businesses that we believe will enhance the overall strength of our business.
We have historically experienced seasonal variations in our revenue as a result of holiday-related factors that are common in our industry. Our revenue is generally highest in the fourth quarter due to consumers' desires to complete their home installations prior to the Thanksgiving and Christmas holidays. We generally see decreased sales in the first quarter due to the number of installations that were completed in the fourth quarter and the resulting decline in dealer activity in the first quarter. We generally expect these seasonal trends to continue in the future, which may cause quarterly fluctuations in our results of operations and certain financial metrics.
Factors and Trends Affecting Our Performance
A number of industry trends have facilitated our growth over the past several years, including the proliferation of connected devices and the ubiquity and growth of network-enabled homes. From 2006 through 2008, the majority of our sales were for use in new, single-family homes. During the slowdown in the new housing market beginning in 2008, our dealers redirected their focus to existing homes, and today, we estimate that the majority of our installations are in existing homes. We expect that future increases in either new home construction or existing home renovations will have a positive impact on our revenue.
We believe that the growth of our business and our future success are dependent upon many factors, including the rates at which consumers adopt our products and services, our ability to strengthen and expand our dealer and distributor network, our ability to expand internationally and our ability to meet competitive challenges. While each of these areas presents significant opportunities for us, they also pose important challenges that we must successfully address in order to sustain or expand the growth of our business and improve our results of operations. These challenges include:
- •
- Increasing Adoption Rates of Our Products and
Services. We are focused on increasing adoption rates of our products and services through enhancements to our software platform and
product offerings. We intend to accomplish these enhancements both organically and through acquisitions of complementary businesses and technologies;
- •
- Optimizing Our North America Dealer
Network. We intend to continue to optimize the performance of and expand our network of dealers in North America to ensure that we have
geographic coverage and technical expertise to address our existing markets and new markets into which we plan to expand;
- •
- Expanding our International Dealer and Distributor Network. We believe that our future growth will be significantly impacted by our ability to expand our dealer and distributor network
50
- •
- Managing Competition. The market for home automation is fragmented, highly competitive and continually evolving. A number of large technology companies such as Apple, Google, Microsoft and Samsung offer home control capabilities among some of their own products, applications and services and are engaged in ongoing development efforts to address the broader home automation market. Our ability to gain significant market share in the home automation market and interoperate with the new technologies developed by other large technology companies over the next several years will be key factors in our ability to continue to grow our business and meet or exceed our future expectations.
outside of North America, adapt our products and services to foreign markets and increase our brand awareness internationally. In particular, we believe that we will have significant opportunities to expand our business in emerging markets such as China and India; and
Key Operating and Financial Metrics
We use the following key operating and financial metrics to evaluate and manage our business.
| |
As of or for the Years Ended December 31, |
As of or for the Three Months Ended March 31, |
|||||||||||||||||
|---|---|---|---|---|---|---|---|---|---|---|---|---|---|---|---|---|---|---|---|
| |
2009 | 2010 | 2011 | 2012 | 2012 | 2013 | |||||||||||||
Number of North America Dealers |
1,633 | 1,944 | 2,215 | 2,350 | 2,240 | 2,371 | |||||||||||||
Number of Direct International Dealers |
159 | 261 | 375 | 501 | 400 | 514 | |||||||||||||
Number of Controller Appliances Sold |
36,796 | 49,703 | 62,760 | 69,209 | 15,222 | 17,758 | |||||||||||||
Core Revenue Growth |
13% | 26% | 24% | 20% | 17% | 19% | |||||||||||||
International Core Revenue as a Percentage of Total Revenue |
9% | 14% | 18% | 22% | 20% | 20% | |||||||||||||
Number of North America and Direct International Dealers
Because our dealers promote, sell, install and support our products, a broader dealer network allows us to reach more potential consumers across more geographic regions. We expect our dealer network to continue to grow, both in North America and internationally. While we have historically focused on dealers affiliated with the Custom Electronics Design and Installation Association, or CEDIA, we believe there is an opportunity to establish relationships with dealers outside of CEDIA, including electrical contractors, heating and cooling specialists, and security system installers. The number of dealers in the above table reflects active direct dealers that have placed an order with us in the trailing 12-month period.
Our international dealer network is growing at a faster rate than our North America dealer network, and we expect this trend to continue as we increase our presence in new and existing international markets. In addition, in some international markets, we plan to establish direct relationships with selected dealers that we previously served through distributors, which we expect will further increase our number of direct international dealers.
Number of Controller Appliances Sold
Our controller appliances contain our proprietary software and provide consumers with the essential software technology to enable home control, automation and personalization. Historically, on average, our consumers have purchased 2.26 controller appliances per installation. The number of controller appliances we sell in a given period provides us with an indication of consumer adoption of our technology. Our sales of controller appliances also create significant opportunity to sell our other products and services. Historically, for every one dollar of controller revenue we generate, we have recognized approximately two dollars of revenue from the sale of our other products and services,
51
although this varies from period to period. Once a consumer has deployed our controller appliances, we believe that the consumer is more likely to remain committed to our technology platform and purchase more of our products, applications and services in the future.
Core Revenue Growth
The majority of our revenue comes from sales of our products through our distribution channels comprised of dealers in the United States and Canada and dealers and distributors located throughout the rest of the world. We refer to revenue attributable to sales through dealers located in the United States and Canada as North America Core revenue and revenue attributable to sales through dealers and distributors located throughout the rest of the world as International Core revenue. Core revenue does not include revenue from sales to hotels or multi-dwelling units, sales to utility customers and certification fees paid to us. Our revenue from sales to hotels, multi-dwelling units and other sources is generally project-based and has been significant in some periods and insignificant in other periods. In the future, we expect revenue from these sources to continue to be attributable to large projects and will continue to be significant in some periods and insignificant in other periods. We, therefore, believe that our core revenue growth is a good measure of our market penetration and the growth of our business.
International Revenue as a Percentage of Total Revenue
We believe that the international market represents a large and underpenetrated opportunity for us. In recent years, we have established offices in international regions, we have formed relationships with international dealers and distributors and we have expanded foreign language support for our solutions. We track International revenue as a percentage of total revenue as a key measure of our success expanding our business internationally.
Basis of Presentation and Key Components of Results of Operations
Revenue
We derive revenue primarily from the sale of products that contain our proprietary software. We generally recognize revenue upon the shipment of our products. We also license software that allows our customers to manage and control their homes from their smartphones, tablets or laptops. We recognize software license revenue at the time the software license is provided to the customer. In addition, we sell a subscription service, 4Sight, that allows consumers to control and monitor their homes remotely from their smartphones, tablets or laptops, and allows our dealers to perform remote diagnostic services. We defer subscription revenue at the time of payment and recognize it ratably over the term the service is provided. We record estimated reductions to revenue for dealer and distributor incentives at the time of the initial sale. We also record estimated reductions to revenue for estimated returns from our dealers and distributors at the time of the initial sale.
52
The following is a breakdown of our revenue between North America and International and a further breakdown between our Core revenue and other revenue:
| |
Years Ended December 31, | Three Months Ended March 31, |
|||||||||||||||||
|---|---|---|---|---|---|---|---|---|---|---|---|---|---|---|---|---|---|---|---|
| |
2009 | 2010 | 2011 | 2012 | 2012 | 2013 | |||||||||||||
| |
(In thousands) |
||||||||||||||||||
North America Core Revenue |
$ | 50,134 | $ | 60,245 | $ | 71,472 | $ | 81,130 | $ | 17,257 | $ | 20,470 | |||||||
Other North America Revenue |
11,116 | 3,120 | 2,633 | 1,280 | 516 | 576 | |||||||||||||
Total North America Revenue |
61,250 | 63,365 | 74,105 | 82,410 | 17,773 | 21,046 | |||||||||||||
International Core Revenue |
6,106 |
10,699 |
16,797 |
24,471 |
4,507 |
5,386 |
|||||||||||||
Other International Revenue |
386 | 861 | 2,474 | 2,631 | 348 | 139 | |||||||||||||
Total International Revenue |
6,492 | 11,560 | 19,271 | 27,102 | 4,855 | 5,525 | |||||||||||||
Total Revenue |
$ |
67,742 |
$ |
74,925 |
$ |
93,376 |
$ |
109,512 |
$ |
22,628 |
$ |
26,571 |
|||||||
North America Core Revenue as a % of Total Revenue |
74% |
80% |
77% |
74% |
76% |
77% |
|||||||||||||
International Core Revenue as a % of Total Revenue |
9% | 14% | 18% | 22% | 20% | 20% | |||||||||||||
Cost of Revenue
Cost of revenue is comprised primarily of the price we pay our contract manufacturers for the components and products that they produce on our behalf. We closely monitor our product costs and continually work to reduce the cost of our products through negotiation with our contract manufacturers and component vendors, and engineering design changes. Cost of revenue also includes all of the overhead expenses associated with procuring, warehousing and shipping our products (both inbound and outbound). Cost of revenue also includes estimated and actual expenses associated with excess and obsolete inventory, as well as warranty expenses and royalty fees paid to third-party licensors.
Gross Margin
As a percentage of revenue, our gross margin has been and will continue to be affected by a variety of factors. Our gross margin is relatively consistent across our products. Our gross margin is higher on software licensing and subscription revenue than it is on product sales. Our gross margin is also higher on our sales made directly through dealers than it is on our sales made through distributors. Gross margin may also be negatively affected by price competition in our target markets. Our gross margin on third-party products we sell through our online distribution platform is higher than our gross margin on our other product sales because we only recognize our net profit on these sales as revenue.
In the near term, we generally expect our gross margin to increase modestly as a result of our continued efforts to work with our contract manufacturers and component vendors to reduce the cost of components we purchase, engineer product design improvements, manage our supply chain and realize economies of scale as we grow our business. We also expect increased third-party product sales through our online distribution platform to have a positive impact on our gross margin going forward. From time to time, however, we may experience fluctuations in our gross margin as a result of the factors discussed in the preceding paragraph.
53
Operating Expenses
Research and Development
Research and development expenses consist primarily of compensation for our engineers and product managers. Research and development expenses also include prototyping expenses incurred in the development of our products, including products used for testing. We also include fees paid to agencies to obtain regulatory certifications. We expect our research and development expenses to increase in absolute dollars for the foreseeable future as we continue to invest in the development of new solutions; however, we expect those expenses to fluctuate as a percentage of our revenue in future periods based on fluctuations in our revenue and the timing of those expenses.
Sales and Marketing
Sales and marketing expenses consist primarily of compensation and related travel expenses for our sales and marketing personnel. Sales and marketing expenses also include expenses associated with trade shows, marketing events, advertising and other marketing-related programs. We expect our sales and marketing expenses to increase in absolute dollars for the foreseeable future as we add sales personnel, particularly in our international channel, and continue to invest in advertising and promotions to increase awareness of our products. However, we also expect our sales and marketing expenses to fluctuate as a percentage of our revenue in future periods based on fluctuations in our revenue and the timing of those expenses.
General and Administrative
General and administrative expenses consist primarily of compensation for our employees in our executive administration, finance, information systems and legal departments. Also included in general and administrative expenses are outside legal fees, audit fees, facilities expenses and insurance costs. We expect our general and administrative expenses to increase in absolute dollars primarily as a result of the increased cost associated with being a public company. However, we also expect our general and administrative expenses to fluctuate as a percentage of our revenue in future periods based on fluctuations in our revenue and the timing of those expenses.
54
Results of Operations
The following tables set forth our results of operations for the periods presented in absolute dollars and as a percentage of our revenue for those periods.
| |
Years Ended December 31, | Three Months Ended March 31, |
||||||||||||||
|---|---|---|---|---|---|---|---|---|---|---|---|---|---|---|---|---|
| |
2010 | 2011 | 2012 | 2012 | 2013 | |||||||||||
| |
(In thousands) |
|||||||||||||||
Revenue |
$ | 74,925 | $ | 93,376 | $ | 109,512 | $ | 22,628 | $ | 26,571 | ||||||
Cost of revenue |
43,357 | 50,534 | 57,225 | 12,466 | 13,550 | |||||||||||
Cost of revenue—inventory purchase commitment |
— | — | 1,840 | — | — | |||||||||||
Gross margin |
31,568 | 42,842 | 50,447 | 10,162 | 13,021 | |||||||||||
Operating expenses: |
||||||||||||||||
Research and development |
15,922 | 19,211 | 20,310 | 4,813 | 6,066 | |||||||||||
Sales and marketing |
22,491 | 17,546 | 20,182 | 5,038 | 5,605 | |||||||||||
General and administrative |
8,876 | 9,805 | 10,150 | 2,532 | 2,828 | |||||||||||
Litigation settlement |
— | — | 2,869 | — | — | |||||||||||
Total operating expenses |
47,289 | 46,562 | 53,511 | 12,383 | 14,499 | |||||||||||
Loss from operations |
(15,721 | ) | (3,720 | ) | (3,064 | ) | (2,221 | ) | (1,478 | ) | ||||||
Other income (expense): |
||||||||||||||||
Interest expense, net |
(404 | ) | (392 | ) | (264 | ) | (62 | ) | (75 | ) | ||||||
Other income (expense) |
(140 | ) | 227 | (254 | ) | (400 | ) | 26 | ||||||||
Total other expense |
(544 | ) | (165 | ) | (518 | ) | (462 | ) | (49 | ) | ||||||
Loss before income taxes |
(16,265 | ) | (3,885 | ) | (3,582 | ) | (2,683 | ) | (1,527 | ) | ||||||
Income tax (expense) benefit |
— | — | (141 | ) | — | 56 | ||||||||||
Net loss |
$ | (16,265 | ) | $ | (3,885 | ) | $ | (3,723 | ) | $ | (2,683 | ) | $ | (1,471 | ) | |
Includes stock-based compensation expense as follows:
| |
Years Ended December 31, | Three Months Ended March 31, |
||||||||||||||
|---|---|---|---|---|---|---|---|---|---|---|---|---|---|---|---|---|
| |
2010 | 2011 | 2012 | 2012 | 2013 | |||||||||||
| |
(In thousands) |
|||||||||||||||
Cost of revenue |
$ | 28 | $ | 49 | $ | 78 | $ | 17 | $ | 16 | ||||||
Research and development |
249 | 492 | 704 | 130 | 236 | |||||||||||
Sales and marketing |
546 | 523 | 580 | 144 | 184 | |||||||||||
General and administrative |
646 | 949 | 1,507 | 440 | 402 | |||||||||||
Total stock-based compensation expense |
$ | 1,469 | $ | 2,013 | $ | 2,869 | $ | 731 | $ | 838 | ||||||
55
| |
Years Ended December 31, |
Three Months Ended March 31, |
||||||||||||||
|---|---|---|---|---|---|---|---|---|---|---|---|---|---|---|---|---|
| |
2010 | 2011 | 2012 | 2012 | 2013 | |||||||||||
| |
(As a percentage of revenue) |
|||||||||||||||
Revenue |
100 | % | 100 | % | 100 | % | 100 | % | 100 | % | ||||||
Cost of revenue |
58 | 54 | 52 | 55 | 51 | |||||||||||
Cost of revenue—inventory purchase commitment |
0 | 0 | 2 | — | — | |||||||||||
Gross margin |
42 | 46 | 46 | 45 | 49 | |||||||||||
Operating expenses: |
||||||||||||||||
Research and development |
21 | 21 | 19 | 21 | 23 | |||||||||||
Sales and marketing |
30 | 19 | 18 | 22 | 21 | |||||||||||
General and administrative |
12 | 11 | 9 | 11 | 11 | |||||||||||
Litigation settlement expense |
0 | 0 | 3 | — | — | |||||||||||
Total operating expenses |
63 | 50 | 49 | 55 | 55 | |||||||||||
Loss from operations |
(21 | ) | (4 | ) | (3 | ) | (10 | ) | (6 | ) | ||||||
Other income (expense): |
||||||||||||||||
Interest expense, net |
(1 | ) | 0 | 0 | 0 | 0 | ||||||||||
Other income (expense) |
0 | 0 | 0 | (2 | ) | 0 | ||||||||||
Total other expense |
(1 | ) | 0 | (0 | ) | (2 | ) | 0 | ||||||||
Loss before income taxes |
(22 | ) | (4 | ) | (3 | ) | (12 | ) | (6 | ) | ||||||
Income tax (expense) benefit |
0 | 0 | 0 | 0 | 0 | |||||||||||
Net loss |
(22 | )% | (4 | )% | (3 | )% | (12 | )% | (6 | )% | ||||||
Comparison of the Three Months Ended March 31, 2012 and 2013:
Revenue
| |
Three Months Ended March 31, |
Change | |||||||||||
|---|---|---|---|---|---|---|---|---|---|---|---|---|---|
| |
2012 | 2013 | $ | % | |||||||||
| |
(Dollars in thousands) |
||||||||||||
Revenue |
$ | 22,628 | $ | 26,571 | $ | 3,943 | 17% | ||||||
Revenue increased by $3.9 million, or 17%, in the three months ended March 31, 2013 compared to the three months ended March 31, 2012. North America core revenue increased by $3.2 million, or 19%, from $17.3 million in the three months ended March 31, 2012 to $20.5 million in the three months ended March 31, 2013, while International core revenue increased by $900,000, or 20%, from $4.5 million in the three months ended March 31, 2012 to $5.4 million in the three months ended March 31, 2013. The increase in North America core revenue was due to a combination of the net increase in the number of active direct dealers selling our products and services and an increase in sales from existing direct dealers, both resulting in an increased number of system sales. The increase in International core revenue was primarily due to an increase in the number of dealers and distributors selling our products and services and the resulting increase in the number of system sales. Our International core revenue increased at a slower rate than it increased for the full year 2012 compared to 2011 primarily due to lower sales in China and certain countries in Latin America. Other revenue declined by $200,000 from $900,000 for the three months ended March 31, 2012 to $700,000 for the three months ended March 31, 2013. The decline in other revenue is due primarily to sales to energy-related customers in 2012 that did not recur in 2013.
56
Gross Margin
| |
Three Months Ended March 31, |
Change | |||||||||||
|---|---|---|---|---|---|---|---|---|---|---|---|---|---|
| |
2012 | 2013 | $ | % | |||||||||
| |
(Dollars in thousands) |
||||||||||||
Gross margin |
$ | 10,162 | $ | 13,021 | $ | 2,859 | 28% | ||||||
Percentage of revenue |
45% | 49% | |||||||||||
As a percentage of revenue, our gross margin increased from 44.9% in the three months ended March 31, 2012 to 49.0% in the three months ended March 31, 2013. The increase in gross margin as a percentage of revenue was due to a combination of higher sales of third-party products sold through our online distribution platform, a decrease in fixed overhead as a percentage of revenue and component cost reductions. The higher sales of third-party products sold through our online distribution platform and the decrease in fixed overhead as a percentage of revenue each accounted for approximately 1.5 basis points of the increase in gross margin as a percentage of revenue and component cost reductions accounted for approximately 1.0 basis point of the increase in gross margin as a percentage of revenue. We believe that sales of third-party products sold through our online distribution platform will continue to have a positive impact on our gross margin as a percentage of revenue; however, we expect the impact on future periods to be less significant. We only sold third-party products through our online distribution platform for a portion of the three months ended March 31, 2012 as we began to sell these third-party products through our online distribution platform at the end of this period. We generated less than $50,000 in revenue from such sales in the three months ended March 31, 2012. In the three months ended March 31, 2013, we sold third-party products through our online distribution platform for the entire period and generated less than $500,000 in revenue from such sales. The timing of the commencement of the sales of third-party products through our online distribution platform resulted in a more significant impact of these sales on gross margin as a percentage of revenue when comparing the results from the three months ended March 31, 2013 to those from the three months ended March 31, 2012. We expect component cost reductions to continue to have a positive impact on our gross margin as a percentage of revenue in future periods as those reductions are the result of negotiated price decreases from our manufacturing partners that were not short-term in nature.
Research and Development Expenses
| |
Three Months Ended March 31, |
Change | |||||||||||
|---|---|---|---|---|---|---|---|---|---|---|---|---|---|
| |
2012 | 2013 | $ | % | |||||||||
| |
(Dollars in thousands) |
||||||||||||
Research and development expenses |
$ | 4,813 | $ | 6,066 | $ | 1,253 | 26% | ||||||
Percentage of revenue |
21% | 23% | |||||||||||
Research and development expenses increased by $1.3 million, or 26%, in the three months ended March 31, 2013 compared to the three months ended March 31, 2012. Research and development expenses increased as a percentage of revenue from 21% in the three months ended March 31, 2012 to 23% in the three months ended March 31, 2013. The increase in research and development expenses was due primarily to increased cash and stock compensation expense as a result of adding product development and product management personnel. Expenses associated with prototyping and test units associated with products announced or to be announced in 2013 also increased in the first quarter of 2013 compared to the first quarter of 2012.
57
Sales and Marketing Expenses
| |
Three Months Ended March 31, |
Change | |||||||||||
|---|---|---|---|---|---|---|---|---|---|---|---|---|---|
| |
2012 | 2013 | $ | % | |||||||||
| |
(Dollars in thousands) |
||||||||||||
Sales and marketing expenses |
$ | 5,038 | $ | 5,605 | $ | 567 | 11% | ||||||
Percentage of revenue |
22% | 21% | |||||||||||
Sales and marketing expenses increased by $567,000, or 11%, in the three months ended March 31, 2013 compared to the three months ended March 31, 2012. Sales and marketing expenses decreased as a percentage of revenue from 22% in the three months ended March 31, 2012 to 21% in in the three months ended March 31, 2013. The increase in sales and marketing expenses was due to increased compensation expense as a result of adding sales and marketing personnel, increased trade show-related expenses and increased credit card merchant fees associated with the increase in revenue.
General and Administrative Expenses
| |
Three Months Ended March 31, |
Change | |||||||||||
|---|---|---|---|---|---|---|---|---|---|---|---|---|---|
| |
2012 | 2013 | $ | % | |||||||||
| |
(Dollars in thousands) |
||||||||||||
General and administrative expenses |
$ | 2,532 | $ | 2,828 | $ | 296 | 12% | ||||||
Percentage of revenue |
11% | 11% | |||||||||||
General and administrative expenses increased by $296,000, or 12%, in the three months ended March 31, 2013 compared to the three months ended March 31, 2012. General and administrative expenses were 11% of revenue in the three months ended March 31, 2012 and 2013. The increase in general and administrative expenses was due primarily to increased consulting, accounting and legal fees. Compensation expense was also higher in the three months ended March 31, 2013 compared to the three months ended March 31, 2012 due to the addition of general and administrative personnel.
Other Income (Expense)
| |
Three Months Ended March 31, |
Change | ||||||||||
|---|---|---|---|---|---|---|---|---|---|---|---|---|
| |
2012 | 2013 | $ | % | ||||||||
| |
(Dollars in thousands) |
|||||||||||
Other income (expense) |
$ | (462 | ) | $ | (49 | ) | $ | 413 | (89)% | |||
Other expense increased by $413,000 for the three months ended March 31, 2013 compared to the three months ended March 31, 2012. The increase is due primarily to the change in the fair value of the warrant to purchase Series G-1 redeemable convertible preferred stock.
Comparison of the Years Ended December 31, 2010, 2011 and 2012
Revenue
| |
Years Ended December 31, | |
|
|||||||||||||
|---|---|---|---|---|---|---|---|---|---|---|---|---|---|---|---|---|
| |
2011 over 2010 |
2012 over 2011 |
||||||||||||||
| |
2010 | 2011 | 2012 | |||||||||||||
| |
(Dollars in thousands) |
|||||||||||||||
Revenue |
$ | 74,925 | $ | 93,376 | $ | 109,512 | 25% | 17% | ||||||||
58
2012 Compared to 2011
Revenue increased by 17% in 2012 compared to 2011. North America core revenue increased by $9.7 million, or 14%, from $71.5 million in 2011 to $81.1 million in 2012, while International core revenue increased by $7.7 million, or 46%, from $16.8 million in 2011 to $24.5 million in 2012. The increase in North America core revenue was primarily due to the net increase in the number of active direct dealers and the resulting increase in the number of system sales. Our International core revenue increased at a faster rate than our North America core revenue primarily due to the growth rate being measured from a smaller base, increased dealer penetration into regions where we had previously done business, and our expansion into new regions. As of December 31, 2012, we had 2,350 active dealers in North America compared to 2,215 at the end of 2011. Similarly, we had 501 active direct International dealers compared to 375 at the end of 2011. Other revenue declined by $1.2 million, or 23%, from $5.1 million in 2011 to $3.9 million in 2012. The decline was primarily due to a decrease in revenue from sales to hotels and multi-dwelling units. Revenue from sales to hotels and multi-dwelling units is difficult for us to predict and we are uncertain as to how much revenue we will receive from these projects in the future.
2011 Compared to 2010
Revenue increased by 25% in 2011 compared to 2010. North America core revenue increased by $11.3 million, or 19%, from $60.2 million in 2010 to $71.5 million in 2011, while International core revenue increased by $6.1 million, or 57%, from $10.7 million in 2010 to $16.8 million in 2011. The increase in North America core revenue was primarily due to an increase in the number of dealers selling our products and the resulting increase in the number of system sales. International core revenue increased at a faster rate than North America core revenue primarily due to increased penetration in countries and regions where we had previously done business, as well as our expansion into new countries and regions.
Gross Margin
| |
Years Ended December 31, | |
|
|||||||||||||
|---|---|---|---|---|---|---|---|---|---|---|---|---|---|---|---|---|
| |
2011 over 2010 |
2012 over 2011 |
||||||||||||||
| |
2010 | 2011 | 2012 | |||||||||||||
| |
(Dollars in thousands) |
|||||||||||||||
Gross margin |
$ | 31,568 | $ | 42,842 | $ | 50,447 | 36% | 18% | ||||||||
Percentage of revenue |
42% | 46% | 46% | |||||||||||||
2012 Compared to 2011
As a percentage of revenue, our gross margin increased from 45.9% in 2011 to 46.1% in 2012. In 2012, our total cost of revenue included the loss on inventory purchase commitments of $1.8 million recorded in the third quarter of 2012. The loss on inventory purchase commitments was the result of our commitment to purchase energy-related products from our contract manufacturing partner that we will not use due to our decision to discontinue our energy product line in 2012 because the near- and mid-term demand of utility customers for the energy product line was lower than expected and the costs of developing and servicing the energy product line was higher than we expected. Our energy product line consisted of a wireless thermostat and an in-home controller device that connected wirelessly to the home's smart meter, allowing utility customers to monitor their energy usage and to modify their energy consumption. We generated less than 1% of our total revenue from our energy product line in each of 2010, 2011 and 2012. Excluding the loss on inventory purchase commitments, gross margin would have increased by $9.4 million, or 22%, in 2012 compared to 2011. Gross margin would have increased as a percentage of revenue from 45.9% in 2011 to 47.7% in 2012. That increase in gross margin as a percentage of revenue was due primarily to a combination of a decrease in fixed manufacturing overhead as a percentage of revenue and component cost reductions.
59
2011 Compared to 2010
As a percentage of revenue, our gross margin increased from 42.1% in 2010 to 45.9% in 2011. The increase in gross margin was due to a combination of favorable sales mix and component cost reductions. In 2011, we began selling MyHome software applications, which represented approximately 5% of our revenue in 2011 and contributed to the favorable sales mix compared to 2010. Fixed overhead as a percentage of revenue was relatively constant in 2011 compared to 2010.
Research and Development Expenses
| |
Years Ended December 31, | |
|
|||||||||||||
|---|---|---|---|---|---|---|---|---|---|---|---|---|---|---|---|---|
| |
2011 over 2010 |
2012 over 2011 |
||||||||||||||
| |
2010 | 2011 | 2012 | |||||||||||||
| |
(Dollars in thousands) |
|||||||||||||||
Research and development expenses |
$ | 15,922 | $ | 19,211 | $ | 20,310 | 21% | 6% | ||||||||
Percentage of revenue |
21% | 21% | 19% | |||||||||||||
2012 Compared to 2011
Research and development expenses increased by $1.1 million, or 6%, in 2012 compared to 2011. Research and development expenses declined as a percentage of revenue from 21% in 2011 to 19% in 2012. The increase in research and development expenses was due primarily to increased cash and stock compensation expense as a result of adding product development and product management personnel. Expenses associated with prototyping and compliance agency approvals also increased in 2012 compared to 2011 due to new products introduced in 2012 and new products that will be introduced in 2013.
2011 Compared to 2010
Research and development expenses increased by $3.3 million, or 21%, in 2011 compared to 2010 and remained at 21% of revenue in both 2010 and 2011. The increase was primarily due to increased compensation paid for product management and product development personnel in 2011 compared to 2010. The increase in compensation was partially offset by a reduction in contract labor expense and recruiting and relocation expense.
Sales and Marketing Expenses
| |
Years Ended December 31, | |
|
|||||||||||||
|---|---|---|---|---|---|---|---|---|---|---|---|---|---|---|---|---|
| |
2011 over 2010 |
2012 over 2011 |
||||||||||||||
| |
2010 | 2011 | 2012 | |||||||||||||
| |
(Dollars in thousands) |
|||||||||||||||
Sales and marketing expenses |
$ | 22,491 | $ | 17,546 | $ | 20,182 | (22 | )% | 15% | |||||||
Percentage of revenue |
30% | 19% | 18% | |||||||||||||
2012 Compared to 2011
Sales and marketing expenses increased by $2.6 million, or 15%, in 2012 compared to 2011. Sales and marketing expenses declined as percentage of revenue from 19% in 2011 to 18% in 2012. The increase in sales and marketing expenses was due primarily to increased compensation expense as a result of adding marketing personnel. We also increased the amount spent on advertising and public relations and general marketing expenses in 2012 compared to 2011. These increases were partially offset by a reduction in the amount spent period-over-period on tradeshows, in particular due to our reduced investment in the Consumer Electronics Show, or CES.
60
2011 Compared to 2010
Sales and marketing expenses decreased by $4.9 million, or 22%, in 2011 compared to 2010 and decreased as a percentage of revenue from 30% in 2010 to 19% in 2011. The decrease was primarily due to a decrease in advertising and other discretionary marketing expenses in 2011 compared to 2010 resulting from higher advertising and promotions expenses in 2010. There was also a reduction in sales and marketing compensation in 2011 compared to 2010, primarily resulting from reduced investment in resources associated with energy-related products for utilities in 2011 compared to 2010.
General and Administrative Expenses
| |
Years Ended December 31, | |
|
|||||||||||||
|---|---|---|---|---|---|---|---|---|---|---|---|---|---|---|---|---|
| |
2011 over 2010 |
2012 over 2011 |
||||||||||||||
| |
2010 | 2011 | 2012 | |||||||||||||
| |
(Dollars in thousands) |
|||||||||||||||
General and administrative expenses |
$ | 8,876 | $ | 9,805 | $ | 10,150 | 10% | 4% | ||||||||
Percentage of revenue |
12% | 11% | 9% | |||||||||||||
2012 Compared to 2011
General and administrative expenses increased by $345,000, or 4%, in 2012 compared to 2011. General and administrative expenses declined as a percentage of revenue from 11% in 2011 to 9% in 2012. The increase in general and administrative expenses was due to increased cash and stock compensation expense resulting from the addition of administrative personnel. Professional services expenses, primarily external legal fees, were also higher in 2012 compared to 2011. These increased expenses were offset by lower facilities expenses resulting from the renegotiation of our corporate headquarters building lease and lower recruiting and relocation expenses in 2012 compared to 2011.
2011 Compared to 2010
General and administrative expenses increased by $929,000, or 10%, in 2011 compared to 2010 and declined as a percentage of revenue from 12% in 2010 to 11% in 2011. The increase was due to small increases in compensation, recruiting and relocation, and facilities expenses, as well as communications-related expenses. The increases were partially offset by a decrease in professional services fees, primarily outside legal fees.
Litigation Settlement Expense
In the third quarter of 2012, we recorded an expense of $2.9 million in connection with two separate legal settlements. In December 2012, we entered into a license agreement to settle a patent-related dispute resulting in an expense of $2.1 million. In addition, we made a payment of $750,000 to release our obligations under a long-term energy-related contract.
61
Unaudited Quarterly Results of Operations and Other Data
The following tables present our unaudited quarterly consolidated results of operations and other data for each of the nine quarters ended March 31, 2013, both in absolute dollars and as a percentage of revenue. This unaudited quarterly consolidated information has been prepared on the same basis as our audited consolidated financial statements and, in the opinion of management, the statement of operations data includes all adjustments, consisting of normal recurring adjustments, necessary for the fair presentation of the results of operations for these periods. You should read this table in conjunction with our audited consolidated financial statements and related notes located elsewhere in this prospectus. The results of operations for any quarter are not necessarily indicative of the results of operations for a full year or any future periods.
| |
Three Months Ended | |||||||||||||||||||||||||||
|---|---|---|---|---|---|---|---|---|---|---|---|---|---|---|---|---|---|---|---|---|---|---|---|---|---|---|---|---|
| |
March 31, 2011 |
June 30, 2011 |
Sept 30, 2011 |
Dec 31, 2011 |
March 31, 2012 |
June 30, 2012 |
Sept 30, 2012 |
Dec 31, 2012 |
March 31, 2013 |
|||||||||||||||||||
| |
(In thousands) |
|||||||||||||||||||||||||||
Revenue |
$ | 19,745 | $ | 23,772 | $ | 24,906 | $ | 24,953 | $ | 22,628 | $ | 27,614 | $ | 28,605 | $ | 30,665 | $ | 26,571 | ||||||||||
Cost of revenue |
10,830 | 12,593 | 13,308 | 13,803 | 12,466 | 14,326 | 14,918 | 15,515 | 13,550 | |||||||||||||||||||
Cost of revenue—inventory purchase commitment |
— | — | — | — | — | — | 1,840 | — | — | |||||||||||||||||||
Gross margin |
8,915 | 11,179 | 11,598 | 11,150 | 10,162 | 13,288 | 11,847 | 15,150 | 13,021 | |||||||||||||||||||
Operating expenses: |
||||||||||||||||||||||||||||
Research and development |
4,789 | 4,655 | 4,667 | 5,100 | 4,813 | 5,148 | 5,158 | 5,191 | 6,066 | |||||||||||||||||||
Sales and marketing |
4,957 | 4,115 | 4,644 | 3,830 | 5,038 | 5,108 | 5,333 | 4,703 | 5,605 | |||||||||||||||||||
General and administrative |
2,266 | 2,787 | 2,288 | 2,464 | 2,532 | 2,663 | 2,471 | 2,484 | 2,828 | |||||||||||||||||||
Litigation settlement |
— | — | — | — | — | — | 2,869 | — | — | |||||||||||||||||||
Total operating expenses |
12,012 | 11,557 | 11,599 | 11,394 | 12,383 | 12,919 | 15,831 | 12,378 | 14,499 | |||||||||||||||||||
Income (loss) from operations |
(3,097 | ) | (378 | ) | (1 | ) | (244 | ) | (2,221 | ) | 369 | (3,984 | ) | 2,772 | (1,478 | ) | ||||||||||||
Other income (expense): |
||||||||||||||||||||||||||||
Interest expense, net |
(133 | ) | (124 | ) | (67 | ) | (68 | ) | (62 | ) | (73 | ) | (63 | ) | (66 | ) | (75 | ) | ||||||||||
Other income (expense) |
75 | 33 | 93 | 26 | (400 | ) | 223 | (45 | ) | (32 | ) | 26 | ||||||||||||||||
Total other income (expense) |
(58 | ) | (91 | ) | 26 | (42 | ) | (462 | ) | 150 | (108 | ) | (98 | ) | (49 | ) | ||||||||||||
Income (loss) before income taxes |
$ | (3,155 | ) | $ | (469 | ) | $ | 25 | $ | (286 | ) | $ | (2,683 | ) | $ | 519 | $ | (4,092 | ) | $ | 2,674 | $ | (1,527 | ) | ||||
Income tax (expense) benefit |
— | — | — | — | — | — | — | (141 | ) | 56 | ||||||||||||||||||
Net income (loss) |
$ | (3,155 | ) | $ | (469 | ) | $ | 25 | $ | (286 | ) | $ | (2,683 | ) | $ | 519 | $ | (4,092 | ) | $ | 2,533 | $ | (1,471 | ) | ||||
62
Includes stock-based compensation expense as follows:
| |
Three Months Ended | |||||||||||||||||||||||||||
|---|---|---|---|---|---|---|---|---|---|---|---|---|---|---|---|---|---|---|---|---|---|---|---|---|---|---|---|---|
| |
March 31, 2011 |
June 30, 2011 |
Sept 30, 2011 |
Dec 31, 2011 |
March 31, 2012 |
June 30, 2012 |
Sept 30, 2012 |
Dec 31, 2012 |
March 31, 2013 |
|||||||||||||||||||
| |
(In thousands) |
|||||||||||||||||||||||||||
Cost of revenue |
$ | 7 | $ | 6 | $ | 22 | $ | 14 | $ | 17 | $ | 18 | $ | 18 | $ | 25 | $ | 16 | ||||||||||
Research and development |
152 | 109 | 117 | 114 | 130 | 129 | 202 | 243 | 236 | |||||||||||||||||||
Sales and marketing |
153 | 139 | 109 | 122 | 144 | 138 | 139 | 159 | 184 | |||||||||||||||||||
General and administrative |
191 | 249 | 165 | 344 | 440 | 356 | 363 | 348 | 402 | |||||||||||||||||||
Total stock-based compensation expense |
$ | 503 | $ | 503 | $ | 413 | $ | 594 | $ | 731 | $ | 641 | $ | 722 | $ | 775 | $ | 838 | ||||||||||
| |
Three Months Ended | |||||||||||||||||||||||||||
|---|---|---|---|---|---|---|---|---|---|---|---|---|---|---|---|---|---|---|---|---|---|---|---|---|---|---|---|---|
| |
March 31, 2011 |
June 30, 2011 |
Sept 30, 2011 |
Dec 31, 2011 |
March 31, 2012 |
June 30, 2012 |
Sept 30, 2012 |
Dec 31, 2012 |
March 31, 2013 |
|||||||||||||||||||
| |
(As a percentage of revenue) |
|||||||||||||||||||||||||||
Revenue |
100 | % | 100 | % | 100 | % | 100 | % | 100 | % | 100 | % | 100 | % | 100 | % | 100 | % | ||||||||||
Cost of revenue |
55 | 53 | 53 | 55 | 55 | 52 | 52 | 51 | 51 | |||||||||||||||||||
Cost of revenue—inventory purchase commitment |
0 | 0 | 0 | 0 | 0 | 0 | 6 | 0 | 0 | |||||||||||||||||||
Gross margin |
45 | 47 | 47 | 45 | 45 | 48 | 41 | 49 | 49 | |||||||||||||||||||
Operating expenses: |
||||||||||||||||||||||||||||
Research and development |
24 | 20 | 19 | 20 | 21 | 19 | 18 | 17 | 23 | |||||||||||||||||||
Sales and marketing |
25 | 17 | 19 | 15 | 22 | 18 | 19 | 15 | 21 | |||||||||||||||||||
General and administrative |
11 | 12 | 9 | 10 | 11 | 10 | 9 | 8 | 11 | |||||||||||||||||||
Litigation settlement |
0 | 0 | 0 | 0 | 0 | 0 | 10 | 0 | 0 | |||||||||||||||||||
Total operating expenses |
61 | 49 | 47 | 46 | 55 | 47 | 55 | 40 | 55 | |||||||||||||||||||
Income (loss) from operations |
(16 | ) | (2 | ) | 0 | (1 | ) | (10 | ) | 1 | (14 | ) | 9 | (6 | ) | |||||||||||||
Other income (expense) |
||||||||||||||||||||||||||||
Interest expense, net |
(1 | ) | (1 | ) | 0 | 0 | 0 | 0 | 0 | 0 | 0 | |||||||||||||||||
Other income (expense) |
0 | 0 | 0 | 0 | (2 | ) | 1 | 0 | 0 | 0 | ||||||||||||||||||
Total other income (expense) |
0 | 0 | 0 | 0 | (2 | ) | 1 | 0 | 0 | 0 | ||||||||||||||||||
Income (loss) before income taxes |
(16 | ) | (2 | ) | 0 | (1 | ) | (12 | ) | 2 | (14 | ) | 9 | (6 | ) | |||||||||||||
Income tax (expense) benefit |
0 | 0 | 0 | 0 | 0 | 0 | 0 | 0 | 0 | |||||||||||||||||||
Net income (loss) |
(16 | )% | (2 | )% | 0 | % | (1 | )% | (12 | )% | 2 | % | (14 | )% | 8 | % | (6 | )% | ||||||||||
63
Reconciliation of Non-GAAP Financial Data
Adjusted Gross Margin
| |
Three Months Ended | |||||||||||||||||||||||||||
|---|---|---|---|---|---|---|---|---|---|---|---|---|---|---|---|---|---|---|---|---|---|---|---|---|---|---|---|---|
| |
March 31, 2011 |
June 30, 2011 |
Sept 30, 2011 |
Dec 31, 2011 |
March 31, 2012 |
June 30, 2012 |
Sept 30, 2012 |
Dec 31, 2012 |
March 31, 2013 |
|||||||||||||||||||
Gross margin |
$ | 8,915 | $ | 11,179 | $ | 11,598 | $ | 11,150 | $ | 10,162 | $ | 13,288 | $ | 11,847 | $ | 15,150 | $ | 13,021 | ||||||||||
Stock-based compensation expense included in cost of revenue |
7 | 6 | 22 | 14 | 17 | 18 | 18 | 25 | 16 | |||||||||||||||||||
Cost of revenue—inventory purchase commitment |
— | — | — | — | — | — | 1,840 | — | ||||||||||||||||||||
Adjusted gross margin |
$ | 8,922 | $ | 11,185 | $ | 11,620 | $ | 11,164 | $ | 10,179 | $ | 13,306 | $ | 13,705 | $ | 15,175 | 13,037 | |||||||||||
Adjusted gross margin percentage |
45.2% | 47.1% | 46.7% | 44.7% | 45.0% | 48.2% | 47.9% | 49.5% | 49.1% | |||||||||||||||||||
Adjusted Operating Income
| |
Three Months Ended | |||||||||||||||||||||||||||
|---|---|---|---|---|---|---|---|---|---|---|---|---|---|---|---|---|---|---|---|---|---|---|---|---|---|---|---|---|
| |
March 31, 2011 |
June 30, 2011 |
Sept 30, 2011 |
Dec 31, 2011 |
March 31, 2012 |
June 30, 2012 |
Sept 30, 2012 |
Dec 31, 2012 |
March 31, 2013 |
|||||||||||||||||||
Income (loss) from operations |
$ | (3,097) | $ | (378) | $ | (1) | $ | (244) | $ | (2,221) | $ | 369 | $ | (3,984) | $ | 2,772 | $ | (1,478) | ||||||||||
Stock-based compensation expense |
503 | 503 | 413 | 594 | 731 | 641 | 722 | 775 | 838 | |||||||||||||||||||
Cost of revenue—inventory purchase commitment |
— | — | — | — | — | — | 1,840 | — | — | |||||||||||||||||||
Litigation settlement expense |
— | — | — | — | — | — | 2,869 | — | — | |||||||||||||||||||
Adjusted operating income (loss) |
$ | (2,594) | $ | 125 | $ | 412 | $ | 350 | $ | (1,490) | $ | 1,010 | $ | 1,447 | $ | 3,547 | $ | (640) | ||||||||||
We have historically experienced seasonal variations in our revenue as a result of holiday-related factors that are common in our industry. Our revenue is generally highest in the fourth quarter due to consumers' desire to complete their home installations prior to the Thanksgiving and Christmas holidays. We generally see decreased sales in the first quarter due to the number of installations that were completed in the fourth quarter and the resulting decline in dealer activity in the first quarter. In the fourth quarter of 2011, our revenue fell below our expectations and therefore did not increase at the rate it had in the fourth quarter of prior years. Our revenue in the fourth quarter of 2012 was representative of our historical percentage increase from the third quarter to the fourth quarter.
Our gross margin declined slightly in the fourth quarter of 2011 due to reserves that we recorded for excess and obsolete inventory in that quarter. Our gross margin in the first quarter of 2012 was equal to the fourth quarter of 2011, but lower than previous and subsequent quarters due to the mix of our product sales and higher fixed manufacturing overhead as a percentage of revenue. Our gross margin in the third quarter of 2012 was negatively impacted by the loss on inventory purchase commitments we recorded to recognize the loss resulting from our commitment to purchase energy-related products from one of our contract manufacturers that we will not use due to our decision to discontinue our energy product line for utility customers. Our gross margin in the fourth quarter of 2012 benefited from higher prices on product sales to international multi-dwelling unit customers and lower manufacturing overhead as a percentage of revenue.
64
Research and development expenses were relatively flat in absolute dollars during the four quarters of 2011, although they were slightly higher in the fourth quarter of 2011 compared to the first three quarters due to higher prototyping expenses and compliance agency fees associated with new product introductions. The increase in research and development expenses in the second, third and fourth quarters of 2012 compared to the first quarter was primarily due to higher sales and wages and higher prototyping expenses. The increase in research and development expenses in the first quarter of 2013 compared to the fourth quarter of 2012 was due primarily to higher salaries and wages resulting from the addition of product management and product development personnel late in the fourth quarter of 2012 and early in the first quarter of 2013. In addition, spending on research and development-related tools and supplies and travel associated with new product development was higher in the first quarter of 2013.
Sales and marketing expenses are typically higher in the first and third quarters of each year due to the timing of trade shows. The Consumer Electronics Show, or CES, and Integrated Systems Europe, or ISE, trade shows occur in the first quarter and the CEDIA trade show occurs in the third quarter. In 2012, trade show expenses in the first quarter were lower than in previous years due to reduced investment in CES. In addition, increased spending on compensation, advertising and marketing promotions in the second quarter resulted in total sales and marketing expenses in the second quarter approximately equal to the first quarter of 2012. The increases in sales and marketing expenses in 2012 compared to 2011 was due to higher compensation expenses resulting from the increase in the number of sales and marketing personnel and higher discretionary marketing expenses. The decrease in sales and marketing expenses in the fourth quarter of 2012 compared to the third quarter of 2012 was due to lower trade show expenses, lower discretionary marketing expenses and lower bad debt expense.
General and administrative expenses were higher in the second quarter of 2011 due to increased recruiting and relocation expenses and higher external legal fees. General and administrative expenses were higher in the second quarter of 2012 due to higher external legal fees related to patent litigation that was settled in the fourth quarter of 2012.
Liquidity and Capital Resources
As of March 31, 2013, we had $14.6 million in cash and cash equivalents. We consider all highly liquid short-term investments with original maturities of three months or less at the time of purchase to be cash equivalents.
Since inception, we have funded our operations primarily through private sales of equity securities and, to a lesser extent, from borrowings under secured credit facilities. We have raised $118.2 million through the sale of preferred stock to financial and strategic investors. Our last financing round was completed in February 2011. In that financing round, we generated net proceeds of $19.8 million from the sale of Series H Preferred Stock.
Our cash flows from operating activities are impacted by our net income or loss and the timing of the major components of working capital, with the primary variances occurring in accounts receivable, inventory, accounts payable and accrued liabilities. We closely monitor our inventory, our days sales outstanding and our payment terms with our major vendors to maximize our cash flows from operating activities. We turn our inventory approximately 5 times per year. Our days sales outstanding has averaged 37 over the past 12 months. We have 45- and 60-day payment terms with our two major contract manufacturers.
Our cash flows from investing activities are primarily due to our purchase of fixed assets to support the growth of the business.
65
Our cash flows from financing activities are primarily from the sale of preferred stock as well as the net proceeds from equipment loans and our revolving line of credit. We have also generated cash from the exercise of common stock options by current and former employees.
We believe that our existing cash and cash equivalents, excluding the net proceeds from this offering, will be sufficient to fund our operations and make payments under our settlement agreements for at least the next 12 months. From time to time, we may explore additional financing sources to develop or enhance our product solutions, to fund expansion of our business, to respond to competitive pressures, or to acquire or invest in complementary products, businesses or technologies. We cannot assure you that any additional financing will be available to us on acceptable terms, if at all. If we raise additional funds through the issuance of equity or convertible debt or other equity-linked securities, our existing stockholders could suffer significant dilution, and any new equity securities we issue could have rights, preferences and privileges senior to those of holders of our common stock, including shares of common stock sold in this offering.
Summary cash flow information for the years ended December 31, 2010, 2011 and 2012 and for the three months ended March 31, 2012 and 2013 is set forth below.
| |
Years Ended December 31, | Three Months Ended March 31, |
||||||||||||||
|---|---|---|---|---|---|---|---|---|---|---|---|---|---|---|---|---|
| |
2010 | 2011 | 2012 | 2012 | 2013 | |||||||||||
| |
(In thousands) |
|||||||||||||||
Cash and cash equivalents at beginning of period |
$ | 17,398 | $ | 6,054 | $ | 18,468 | $ | 18,468 | $ | 18,695 | ||||||
Net cash provided by (used in) operating activities |
(13,078 | ) | (586 | ) | 991 | (1,391 | ) | (2,937 | ) | |||||||
Net cash used in investing activities |
(2,344 | ) | (1,989 | ) | (2,360 | ) | (542 | ) | (1,431 | ) | ||||||
Net cash provided by financing activities |
4,042 | 14,999 | 1,624 | 68 | 272 | |||||||||||
Effect of exchange rate changes on cash and cash equivalents |
36 | (10 | ) | (28 | ) | (42 | ) | (26 | ) | |||||||
Net change in cash for the period |
(11,344 | ) | 12,414 | 227 | (1,907 | ) | (4,122 | ) | ||||||||
Cash and cash equivalents at the end of the period |
$ | 6,054 | $ | 18,468 | $ | 18,695 | $ | 16,561 | $ | 14,573 | ||||||
Net Cash Used in Operating Activities
Historically, we have experienced negative cash flows from operating activities primarily due to our continued investment in research and development and sales and marketing resources needed to design, develop, market and sell our solutions worldwide.
Our cash used in operating activities for the three months ended March 31, 2013 was comprised of the net loss of $1.5 million, offset by non-cash expenses of $1.5 million. Changes in working capital, other assets and long-term liabilities resulted in a net use of cash totaling $2.9 million. The non-cash expenses included in the net loss consist primarily of stock-based compensation expense of $838,000 and depreciation expense of $512,000. The changes in working capital were comprised primarily of an increase in other assets of $1.6 million and a decrease in accounts payable of $1.3 million. The increase in other assets was due primarily to deferred expenses related to this offering that have been recorded as other assets and will be offset against the proceeds of the offering. The decrease in accounts payable was due to the timing of payments to our vendors.
Our cash used in operating activities for the three months ended March 31, 2012 was comprised of the net loss of $2.7 million, offset by non-cash expenses of $1.7 million. Changes in working capital, other assets and long-term liabilities resulted in a net use of cash totaling $400,000. The non-cash expenses included in the net loss consist primarily of stock-based compensation expense of $731,000, depreciation expense of $407,000 and warrant liability expense of $399,000. The changes in working capital were comprised primarily of an increase in inventory of $492,000, a decrease in accrued
66
liabilities of $424,000 and a decrease in other long-term liabilities of $125,000. These uses of cash were offset by cash provided by an increase in accounts payable of $614,000.
Our cash provided by operating activities for the year ended December 31, 2012 was comprised of the net loss of $3.7 million, offset by non-cash expenses of $7.2 million. Changes in working capital, other assets and long-term liabilities resulted in a net use of cash totalling $2.5 million. The non-cash expenses included in the net loss primarily consist of a loss on inventory purchase commitments of $1.8 million, depreciation expense of $1.7 million, provision for doubtful accounts of $184,000 and stock-based compensation expense of $2.9 million. The changes in working capital were comprised of an increase in accounts payable and accrued liabilities of $6.7 million, offset by an increase in inventory of $4.9 million, an increase in accounts receivable of $2.6 million. In addition, we recognized a decrease in long-term liabilities of $621,000. These increases in inventory, accounts receivable, accounts payable and accrued liabilities were all a result of increased revenue, cost of revenue and expenses during 2012. The decrease in long-term liabilities was due to the payment of a liability resulting from a litigation settlement recorded in 2008.
Our cash used in operating activities for 2011 was comprised of net loss of $3.9 million offset by non-cash expenses of $3.8 million. Changes in working capital and long-term liabilities resulted in a net use of cash totalling $524,000. The change in working capital was due primarily to an increase in accounts receivable of $2.6 million offset by a decrease in inventory of $2.3 million and changes in other components of working capital of $363,000. In addition, we recognized a decrease in long-term liabilities of $565,000. The increase in accounts receivable was due to the increase in revenue. The decrease in inventory was the result of our concerted effort to reduce inventory levels and increase inventory turns in 2011.
Our cash used in operating activities for 2010 was comprised of net loss of $16.3 million offset by non-cash expenses of $3.7 million. Changes in working capital and long-term liabilities resulted in a net use of cash totalling $506,000. The net loss in 2010 was a result of lower than planned revenue growth combined with increased investments in research and development expenses and sales and marketing expenses. A portion of these increased operating expense investments were tied to the start-up of our energy-related product development for utility customers and additional sales and marketing efforts. The changes in working capital and long-term liabilities was attributable primarily to an increase in inventory of $4.7 million offset by a decrease in in accounts receivable of $1.6 million and an increase in accounts payable of $2.5 million.
Net Cash Used in Investing Activities
Net cash used in investing activities has historically been due primarily to purchases of property and equipment needed to support the growth of our business. Our purchases of property and equipment have been for computer equipment and software used internally, manufacturing tooling and test equipment that we purchase and own, but is located with our manufacturing partners, furniture and fixtures for our facilities, lab and warehouse equipment for our engineering and supply chain organizations, marketing equipment that is primarily used for trade shows, and leasehold improvements to our facilities.
For the three months ended March 31, 2013, our cash used in investing activities was $1.4 million and consisted entirely of purchases of property and equipment for general business use.
For the three months ended March 31, 2012, our cash used in investing activities was $542,000 and consisted entirely of purchases of property and equipment for general business use.
For the year ended December 31, 2012, our cash used in investing activities was $2.4 million and consisted entirely of purchases of property and equipment for general business use.
67
Our cash used in investing activities in 2011 was $2.0 million, consisting of the purchase of property and equipment of $1.3 million and acquisition of intangible assets of $725,000. The purchases of property and equipment were for general business use and the acquisition of intangible assets related to technology that we purchased to allow our customers to access and control their homes via their mobile Android-based devices.
Our cash used in investing activities in 2010 was $2.3 million, consisting of the purchase of property and equipment of $2.0 million and acquisition of intangible assets of $319,000. The purchases of property and equipment were for general business use and the acquisition of intangible assets related to technology that we purchased to allow our customers to access and control their homes via their mobile iOS-based devices.
Net Cash Provided by Financing Activities
Net cash provided by financing activities for the three months ended March 31, 2013 was $272,000 and consisted primarily of $235,000 in net proceeds from borrowings under our equipment loan.
Net cash provided by financing activities for the three months ended March 31, 2012 was $68,000 and consisted of net proceeds from borrowings under our equipment loan.
Net cash provided by financing activities for the year ended December 31, 2012 was $1.6 million and consisted of $839,000 in net proceeds from borrowings under our equipment loan and $785,000 in cash generated from the exercise of common stock options.
Net cash provided by financing activities in 2011 was $15.0 million and consisted of $19.8 million in net proceeds from the sale of Series H Preferred Stock and $1.2 million in proceeds from the exercise of common stock options. These proceeds were offset by the payment against our revolving credit line and equipment loans of $6.0 million. In 2011, we paid off the entire balance outstanding on our revolving credit line and we did not borrow against that credit line in 2012.
Net cash provided by financing activities in 2010 was $4.0 million and consisted of net borrowings against our revolving credit line and equipment loans of $3.8 million and proceeds from the exercise of common stock options of $202,000.
Debt Obligations
In June 2013, we entered into an Amended and Restated Loan and Security Agreement with Silicon Valley Bank, or the SVB Agreement, which consists of a revolving credit facility of $13.0 million (subject to certain borrowing base restrictions) and term borrowings to fund purchases of property and equipment. All borrowings under the SVB Agreement are collateralized by our general assets. The credit facility has a variable rate of interest of prime (as published in the Wall Street Journal) or LIBOR plus 2.50%, as selected by us. The SVB Agreement provides for $2.75 million in term borrowings to fund purchases of property and equipment. Term borrowings are payable in 42 equal monthly payments of principal plus interest and bear interest at prime plus 0.50%, which was 3.75% at March 31, 2013.
Borrowing under the revolving credit facility is subject to certain collateral restrictions relating primarily to our accounts receivable and inventory levels. As of March 31, 2013, our total borrowing capacity was approximately $12.9 million. We have not borrowed against the revolving credit facility as of December 31, 2011 or 2012 or March 31, 2013. The revolving credit facility has a maturity date of May 29, 2015.
The SVB Agreement contains various restrictive and financial covenants and we were in compliance with each of these covenants as of December 31, 2011 and 2012 and March 31, 2013.
68
Future principal payments on outstanding term borrowings as of December 31, 2012 are as follows (in thousands):
2013 |
$ | 1,321 | ||
2014 |
840 | |||
2015 |
588 | |||
2016 |
410 | |||
|
$ | 3,159 | ||
Off-Balance Sheet Arrangements
We do not engage in off-balance sheet activities. We do not have any off-balance interest in variable interest entities, which include special purpose entities and other structured finance entities.
Contractual Obligations
We enter into long-term contractual obligations in the normal course of business, primarily debt obligations and non-cancellable operating leases. In addition, in 2008 and 2012, we entered into settlement agreements with two different parties relating to alleged patent infringements, which included future payment obligations.
Our contractual cash obligations at December 31, 2012 are as follows:
| |
Total | Less than 1 year |
1-3 years | 3-5 years | More than 5 years |
|||||||||||
|---|---|---|---|---|---|---|---|---|---|---|---|---|---|---|---|---|
| |
(In thousands) |
|||||||||||||||
Long-term debt obligations, including interest |
$ | 3,397 | $ | 1,620 | $ | 1,414 | $ | 363 | $ | — | ||||||
Operating lease obligations |
5,872 | 794 | 2,488 | 2,101 | 489 | |||||||||||
Settlement agreements(1) |
4,200 | 2,400 | 1,200 | 600 | — | |||||||||||
Purchase commitments |
19,479 | 19,479 | — | — | — | |||||||||||
Total contractual obligations |
$ | 32,948 | $ | 24,293 | $ | 5,102 | $ | 3,064 | $ | 489 | ||||||
- (1)
- The counterparty in one of the settlement agreements has the contractual right to accelerate $900,000 of the future obligation due in 2014 to a $700,000 payment in June 2013.
Changes in our contractual obligations during the three months ended March 31, 2013 are insignificant and consist primarily of fluctuations in our purchase commitments in the ordinary course of business.
Quantitative and Qualitative Disclosures About Market Risk
We are exposed to market risk in the ordinary course of our business. Market risk represents the risk of loss that may impact our financial position due to adverse changes in financial market prices and rates. Our market risk exposure is primarily a result of fluctuations in interest rates and foreign currency exchange rates. We do not hold or issue financial instruments for trading purposes.
69
Interest Rate Risk
Our exposure to market risk for changes in interest rates relates primarily to our cash and cash equivalents as we do not have any short-term investments as of December 31, 2012 and March 31, 2013. Our cash and cash equivalents as of December 31, 2012 and March 31, 2013 were $18.7 million and $14.6 million, respectively, and consisted primarily of cash and money market funds. Our primary exposure to market risk is interest income sensitivity, which is affected by changes in the general level of the interest rates in the United States. However, because of the short-term nature of our interest-bearing securities, a 10% change in market interest rates would not be expected to have a material impact on our consolidated financial condition or results of operations.
Foreign Currency Exchange Risk
Our results of operations and cash flows are subject to fluctuations due to changes in foreign currency exchange rates, particularly changes in the Canadian dollar, the Euro and the British pound. The volatility of exchange rates depends on many factors that we cannot forecast with reliable accuracy. We believe that our operating activities act as a natural hedge for a substantial portion of our foreign currency exposure because we typically collect revenue and incur costs in the currency in the location in which we provide our solutions. Although we have experienced and will continue to experience fluctuations in our net income (loss) as a result of transaction gains (losses) related to transactions denominated in currencies other than the U.S. dollar, we believe that a 10% change in foreign exchange rates would not have a material impact on our financial condition or results of operations. To date, we have not entered into any foreign currency hedging contracts, but we may consider entering into such contracts in the future. As our international operations grow, we will continue to reassess our approach to managing our risk relating to fluctuations in foreign currency exchange rates.
Critical Accounting Estimates and Policies
Our consolidated financial statements are prepared in accordance with GAAP. The preparation of these consolidated financial statements requires us to make estimates and assumptions that affect the reported amounts of assets, liabilities, revenue, expenses and related disclosures. We evaluate our estimates and assumptions on an ongoing basis. Our estimates are based on historical experience and various other assumptions that we believe to be reasonable under the circumstances. Our actual results could differ from these estimates.
We believe that the assumptions and estimates associated with our revenue recognition, allowance for doubtful accounts, inventories, product warranty, income taxes and stock-based compensation have the greatest potential impact on our consolidated financial statements. Therefore, we consider these to be our critical accounting policies and estimates. For further information on all of our significant accounting policies, please see Note 1 of the accompanying notes to our consolidated financial statements.
We are choosing to "opt out" of the extended transition period provided in Section 7(a)(2)(B) of the Securities Act for complying with new or revised accounting standards and, as a result, we will comply with new or revised accounting standards on the relevant dates on which adoption of such standards is required for non-emerging growth companies. Section 107 of the JOBS Act provides that our decision to opt out of the extended transition period for complying with new or revised accounting standards is irrevocable.
Revenue Recognition
We sell our products through a network of independent dealers and distributors and not directly to consumers. These dealers and distributors generally sell our products to the consumer as part of a bundled sale, which typically includes other third-party products and related services, project design and installation services and ongoing support.
70
Our products include embedded software that is essential to the functionality of the hardware, but the software is not sold separately and doesn't have stand-alone value. Accordingly, the hardware and software are accounted for as a combined unit and revenue is recognized when both elements are delivered. We recognize revenue when persuasive evidence of an arrangement exists, delivery has occurred, the sales price is fixed or determinable, and collection is probable. Product is considered delivered to the customer once it has been shipped and title and risk of loss have been transferred. For most of our product sales, these criteria are met at the time the product is shipped. Payments received in advance of providing products are recorded as deferred revenue and recognized as revenue when the revenue recognition criteria are met and the earnings process is complete.
We record estimated reductions to revenue for dealer, retailer and distributor incentives, primarily comprised of volume rebates, at the time of the initial sale. The estimated reductions to revenue for rebates are based on the sales terms and our historical experience and trend analysis. The most common incentive relates to amounts paid or credited to customers for achieving defined volume levels or growth objectives.
Software license revenue represents fees earned from activating applications that allow consumers to manage and control their automation systems using tablets, smartphones and other third-party devices. Our perpetual software licenses do not include acceptance provisions, rights to updates or post-contract customer support. We generally recognize revenue at the time the software license is provided to the customer.
We offer a subscription service that allows consumers to control and monitor their homes remotely and allows our dealers to perform remote diagnostic services. Subscription revenue is deferred at the time of payment and recognized on a straight-line basis over the period the service is provided.
We recognize revenue net of cost of revenue for third-party products sold through our online ordering system. While we assume credit risk on sales to our customers, we do not determine the product selling price, do not retain associated inventory risks and are not the primary obligor to the customer.
Our agreements with dealers and distributors generally do not include rights of return or acceptance provisions. Even though contractual agreements do not provide return privileges, there are circumstances in which we will accept returns. In addition, agreements with certain retail customers contain stock rotation and other rights of return. We maintain a reserve for such returns based on retail sell-through and our historical return experience.
Shipping charges billed to customers are included in product revenue and related shipping costs are included in cost of revenue.
Allowance for Doubtful Accounts
We extend credit to the majority of our customers, which consist primarily of small, local businesses. Issuance of credit is based on ongoing credit evaluations by us of our customers' financial condition and generally requires no collateral. Trade accounts receivable are recorded at the invoiced amount and do not bear interest. We maintain an allowance for doubtful accounts to reserve for potential uncollectible receivables. The allowance is based upon the creditworthiness of our customers, the customers' historical payment experience, the age of the receivables and current market and economic conditions. Provisions for potentially uncollectible accounts are recorded in sales and marketing expenses. We write off accounts receivable balances to the allowance for doubtful accounts when it becomes likely that they will not be collected. As of December 31, 2011 and 2012 and March 31, 2013, the allowance for doubtful accounts was $0.7 million, $0.6 million and $0.6 million, respectively.
71
Inventories
Inventories consist of hardware and related component parts and are stated at the lower of cost or market using the first-in, first-out method. We periodically assess the recoverability of our inventory and reduce the carrying value of the inventory when items are determined to be obsolete, defective or in excess of forecasted sales requirements. Inventory write-downs for excess, defective and obsolete inventory are recorded as cost of revenue and totaled $1.1 million, $1.3 million, $1.5 million and $0.4 million in 2010, 2011 and 2012 and for the three months ended March 31, 2013, respectively.
Product Warranty
We provide our customers a limited product warranty of two years, which requires us to repair or replace defective products during the warranty period at no cost to the customer. We estimate the costs that may be incurred to replace or repair defective products and record a reserve at the time revenue is recognized. Factors that affect our warranty liability include the number of installed systems, our historical experience and management's judgment regarding anticipated rates of product warranty returns. We assess the adequacy of our recorded warranty liability each period and make adjustments to the liability as necessary. Our warranty liability was $775,000, $1.0 million, $1.2 million and $1.2 million as of December 31, 2010, 2011 and 2012 and March 31, 2013, respectively.
Income Taxes
We recognize deferred tax assets and liabilities for the future tax consequences attributable to the differences between the financial statement carrying value of existing assets and liabilities and their respective tax bases. Deferred tax assets and liabilities are measured using enacted tax rates in effect for the fiscal year in which those temporary differences are expected to be recovered or settled. Valuation allowances are established when necessary to reduce deferred tax assets to the amount expected to be realized.
We operate in various tax jurisdictions and are subject to audit by various tax authorities. We provide for tax contingencies whenever it is deemed probable that a tax asset has been impaired or a tax liability has been incurred for events such as tax claims or changes in tax laws. Tax contingencies are based upon their technical merits, relative tax law and the specific facts and circumstances as of each reporting period. Changes in facts and circumstances could result in material changes to the amounts recorded for such tax contingencies.
We recognize uncertain income tax positions taken on income tax returns at the largest amount that is more-likely-than-not to be sustained upon audit by the relevant taxing authority. An uncertain income tax position will not be recognized if it has less than a 50% likelihood of being sustained.
Our policy for recording interest and penalties associated with uncertain tax positions is to record such items as a component of our income tax provision. During the years December 31, 2010, 2011 and 2012 and for the three months ended March 31, 2012 and 2013, we did not record any material interest income, interest expense or penalties related to uncertain tax positions or the settlement of audits for prior periods.
Stock-Based Compensation
Stock-based compensation is measured at the grant date based on the fair value of the award and is recognized as expense, net of estimated forfeitures, over the requisite service period, which is the vesting period of the respective award.
Determining the fair value of stock-based awards at the grant date requires judgment. We use the Black-Scholes option-pricing model to determine the fair value of stock options. The determination of the grant date fair value of options using an option-pricing model is affected by our estimated common stock fair value as well as assumptions regarding a number of other complex and subjective variables. These variables include the fair value of our common stock, our expected stock price
72
volatility over the expected term of the options, stock option exercise and cancellation behaviors, risk-free interest rates and expected dividends, which are estimated as follows:
- •
- Fair Value of Our Common
Stock. Because our stock is not publicly traded, we must estimate the fair value of our common stock, as discussed in "Common Stock
Valuations" below.
- •
- Expected
Volatility. As we do not have a trading history for our common stock, the expected stock price volatility for our common stock was
estimated by taking the average of the historical volatilities of an index fund and industry peers based on daily price observations over a period equivalent to the expected term of the stock option
grants. We did not rely on implied volatilities of traded options in our industry peers' common stock because the volume of activity was relatively low. We intend to continue to consistently apply
this process using the same or similar public companies until a sufficient amount of historical information regarding the volatility of our own common stock share price becomes available.
- •
- Risk-Free Interest
Rate. The risk-free interest rate is based on the U.S. Treasury yield in effect at the time of the grant for
zero-coupon U.S. Treasury notes with remaining terms similar to the expected term of the options.
- •
- Expected Dividend
Yield. We have never declared or paid any cash dividends and do not presently plan to pay cash dividends in the foreseeable future.
Consequently, we used an expected dividend yield of zero.
- •
- Expected Term. The expected term represents the period that the stock-based awards are expected to be outstanding. For our option grants, we used the simplified method to determine the expected term as provided by the SEC. The simplified method calculates the expected term as the average of the time-to-vesting and the contractual life of the options. We used the simplified method to determine our expected term because of our limited history of stock option exercise activity.
In addition to the assumptions used in the Black-Scholes option-pricing model, we must also estimate a forfeiture rate to calculate the stock-based compensation for our awards. Our forfeiture rate is based on an analysis of our actual forfeitures. We will continue to evaluate the appropriateness of the forfeiture rate based on actual forfeiture experience, analysis of employee turnover and other factors. Quarterly changes in the estimated forfeiture rate can have a significant impact on our stock-based compensation expense as the cumulative effect of adjusting the rate is recognized in the period the forfeiture estimate is changed. If a revised forfeiture rate is higher than the previously estimated forfeiture rate, an adjustment is made that will result in a decrease to the stock-based compensation expense recognized in the financial statements. If a revised forfeiture rate is lower than the previously estimated forfeiture rate, an adjustment is made that will result in an increase to the stock-based compensation expense recognized in the financial statements.
We will continue to use judgment in evaluating the expected volatility, expected terms and forfeiture rates utilized for our stock-based compensation calculations on a prospective basis. As we continue to accumulate additional data related to our common stock, we may have refinements to the estimates of our expected volatility, expected terms and forfeiture rates, which could materially impact our future stock-based compensation expense. If any of the assumptions used in the Black-Scholes model changes significantly, stock-based compensation for future awards may differ materially compared with the awards granted previously.
73
The following table presents the weighted-average assumptions used to estimate the fair value of options granted during the periods presented:
| |
Years Ended December 31, |
Three Months Ended March 31, |
||||||||||||||
|---|---|---|---|---|---|---|---|---|---|---|---|---|---|---|---|---|
| |
2010 | 2011 | 2012 | 2012(1) | 2013(1) | |||||||||||
Expected volatility |
70-71% | 71-73% | 59-63% | — | — | |||||||||||
Expected dividends |
—% | —% | —% | — | — | |||||||||||
Expected term (in years) |
5.2-6.1 | 5.0-6.1 | 5.0-6.1 | — | — | |||||||||||
Risk-free rate |
2.2-3.0% | 1.1-2.5% | 0.7-1.0% | — | — | |||||||||||
Forfeiture rate |
8.1% | 11.6% | 7.9% | — | — | |||||||||||
- (1)
- No options were granted during the three months ended March 31, 2012 or 2013.
Common Stock Valuations
The fair value of the common stock underlying our stock options was determined by our board of directors, which intended all options granted to be exercisable at a price per share not less than the per share fair value of our common stock underlying those options on the date of grant. The valuations of our common stock were determined in accordance with the guidelines outlined in the American Institute of Certified Public Accountants Practice Aid, Valuation of Privately-Held-Company Equity Securities Issued as Compensation. The assumptions we use in the valuation model are based on future expectations combined with management judgment. In the absence of a public trading market, our board of directors, with input from management, exercised significant judgment and considered numerous objective and subjective factors to determine the fair value of our common stock as of the date of each option grant, including the following factors:
- •
- Independent third-party valuations of our common stock performed as of December 31, 2011, March 30, 2012,
June 30, 2012, September 30, 2012, December 31, 2012 and March 31, 2013;
- •
- The prices, rights, preferences and privileges of our preferred stock relative to our common stock;
- •
- Our operating and financial performance;
- •
- Current business conditions and projections;
- •
- Our stage of development;
- •
- The likelihood of achieving a liquidity event for the shares of common stock underlying these stock options, such as an
initial public offering or sale of our company, given prevailing market conditions;
- •
- The market performance of comparable publicly traded companies in the consumer technology, home automation and high-growth
company spaces; and
- •
- The U.S. and global capital market conditions.
In valuing our common stock, our board of directors determined the equity value of our business by taking a combination of the value indications under two valuation approaches, an income approach and a market approach.
The income approach estimates the fair value of a company based on the present value of the company's future estimated cash flows and the residual value of the company beyond the forecast period. These future values are discounted to their present values to reflect the risks inherent in the company achieving these estimated cash flows. Significant inputs of the income approach (in addition to our estimated future cash flows themselves) include the long-term growth rate assumed in the
74
residual value, discount rate, terminal value and normalized long-term operating margin. To estimate the value of cash flows after the defined projection period, a terminal value, which represents the estimated perpetual cash flows, was also calculated. To calculate the terminal value, a perpetual growth rate is applied to the last year of forecasted cash flows. This estimated perpetual cash flow is then divided by the capitalization rate.
The market approach estimates the fair value of a company by applying market multiples of comparable publicly traded companies in the same industry or similar lines of business. The market multiples are based on key metrics implied by the price investors have paid for publicly traded companies. Given our significant focus on investing in and growing our business, we primarily utilized the revenue multiple when performing valuation assessments under the market approach. When considering which companies to include in our comparable industry peer companies, we focused on U.S.-based publicly traded companies with businesses similar to ours. The selection of our comparable industry peer companies requires us to make judgments as to the comparability of these companies to us. We considered a number of factors including business description, business size, market share, revenue model, development stage and historical results of operations. We then analyzed the business and financial profiles of the selected companies for relative similarities to us and, based on this assessment, we selected our comparable industry peer companies. Several of the comparable industry peer companies are our competitors and are generally larger than us in terms of total revenue and assets.
The valuation reports prepared for us were based on the income approach. Due to the limited comparability with the guideline firms, a market approach was performed to assess the reasonableness of the income approach conclusions.
For each valuation, the equity value was then allocated to the common stock using either the Option Pricing Method, or OPM, or Probability Weighted Expected Return Method, or PWERM.
The OPM treats common stock and preferred stock as call options on an enterprise value, with exercise prices based on the liquidation preference of the preferred stock. Therefore, the common stock has value only if the funds available for distribution to the stockholders exceed the value of the liquidation preference at the time of a liquidity event such as a merger, sale or initial public offering, assuming the enterprise has funds available to make a liquidation preference meaningful and collectible by the stockholders. The common stock is modeled to be a call option with a claim on the enterprise at an exercise price equal to the remaining value immediately after the preferred stock is liquidated. The OPM uses the Black-Scholes option pricing model to price the call option. The OPM is appropriate to use when the range of possible future outcomes is so difficult to predict that forecasts would be highly speculative.
The PWERM involves a forward-looking analysis of the possible future outcomes of the enterprise. This method is particularly useful when discrete future outcomes can be predicted at a high confidence level with a probability distribution. Discrete future outcomes considered under the PWERM included non-initial public offering market based outcomes as well as initial public offering scenarios. In the non-initial public offering scenarios, a large portion of the equity value is allocated to the preferred stock to reflect the preferred stock liquidation preferences. In the initial public offering scenarios, the equity value is allocated pro rata among the shares of common stock and each series of preferred stock, which causes the common stock to have a higher relative value per share than under the non-initial public offering scenario. The fair value of the enterprise determined using the initial public offering and non-initial public offering scenarios was weighted according to the board of directors' estimate of the probability of each scenario.
Over time, as certainty developed regarding possible discrete events, including an initial public offering, or IPO, the allocation methodology utilized to allocate our enterprise value to our common stock transitioned away from exclusively the OPM, which was utilized for grants through December 31, 2011, to include a PWERM, which we utilized for grants beginning after September 26, 2012.
75
We granted stock options with the following terms between December 29, 2011 and the date of this prospectus:
Grant Date
|
Number of Options Granted |
Exercise Price Per Share |
Common Stock Fair Value Per Share |
Aggregate Grant Date Fair Value(1) |
|||||||||
|---|---|---|---|---|---|---|---|---|---|---|---|---|---|
December 29, 2011 |
444,919 | $ | 6.34 | $ | 6.34 | $ | 1,806,130 | ||||||
June 19, 2012 |
81,720 | 8.84 | 8.84 | 408,640 | |||||||||
June 27, 2012 |
173,076 | 8.84 | 8.84 | 915,352 | |||||||||
September 28, 2012 |
88,456 | 9.15 | 9.15 | 450,576 | |||||||||
December 14, 2012 |
28,839 | 9.93 | 9.93 | 156,048 | |||||||||
December 26, 2012 |
95,187 | 9.93 | 9.93 | 524,169 | |||||||||
December 28, 2012 |
247,927 | 9.93 | 9.93 | 1,348,583 | |||||||||
April 25, 2013 |
86,432 | 11.28 | 16.00 | (2) | 834,351 | ||||||||
June 11, 2013 |
156,724 | 11.28 | 16.00 | (2) | 1,635,444 | ||||||||
June 23, 2013 |
146,626 | 11.28 | 16.00 | (2) | 1,272,527 | (3) | |||||||
- (1)
- Aggregate
grant date fair value was determined using the Black-Scholes option pricing model.
- (2)
- Fair
value determined for financial reporting purposes in connection with a reassessment performed in July 2013. Subsequent to the
March 31, 2013 valuation of our common stock, in July 2013, we received an indication of the estimated preliminary price range for our common stock in this offering from the managing
underwriters. In light of the short period of time that had elapsed between our April 25, 2013, June 11, 2013 and June 23, 2013 equity grants and the receipt of the estimated
preliminary price range from the managing underwriters, we revised our estimated fair value of our common stock with respect to equity grants made on April 25, 2013, June 11, 2013 and
June 23, 2013 to be $16.00, which is the midpoint of the price range set forth on the cover page of this prospectus.
- (3)
- Includes the aggregate grant date fair value of $174,764 for 24,038 shares of common stock subject to an option granted in connection with the purchase of assets by us in June 2013, which will be recognized as part of the purchase price of such assets instead of stock-based compensation.
The intrinsic value of all outstanding options as of June 30, 2013 was $48.1 million, based on the estimated fair value for our common stock of $16.00 per share, which is the midpoint of the price range set forth on the cover page of this prospectus.
December 2011 Awards
As of December 29, 2011, our board of directors determined the fair value of the common stock to be $6.34 per share. We considered several objective and subjective factors, including our then-current stage of development, the value of comparable companies, the value of our assets, the purchase prices of our outstanding capital stock, the present value of our future cash flows (based upon projected revenue), the rights and preferences our current stockholders are entitled to, the lack of marketability of our common stock, the economy generally and a contemporaneous valuation report prepared for us in contemplation of such option grants, which report used the OPM valuation methodology described above given the difficulty of predicting possible future liquidity outcomes for the company at that time.
Total enterprise value was calculated using both the income approach and the market approach. With respect to the income approach, total enterprise value was calculated using estimated cash flows based on cash flow projections for the year ending December 31, 2011 through the year
76
ending December 31, 2021, which were discounted based on a weighted average cost of capital, or WACC, of 18.0%, given our stage of development and inherent risks. With respect to the market approach, our board of directors analyzed the financial performance of publicly traded companies in the consumer technology, home automation and high growth company spaces.
Based on the process described above, our board of directors determined that it had greater confidence in the income approach compared to the market approach given the lack of comparable industry peers, so it gave more weight to the income approach to determine total enterprise value. The enterprise value was then allocated to the common stock utilizing an OPM methodology using the assumptions described above. As a result, the fair value of the common stock was determined to be $6.34 per share.
June 2012 Awards
As of June 19, 2012 and June 27, 2012, our board of directors determined the fair value of the common stock to be $8.84 per share. We considered several objective and subjective factors, including our then-current stage of development, the value of comparable companies, the value of our assets, the purchase prices of our outstanding capital stock, the present value of our future cash flows (based upon projected revenue), the rights and preferences our current stockholders are entitled to, the lack of marketability of our common stock, the economy generally and an additional contemporaneous valuation report prepared for us in contemplation of such option grants, which report used the valuation methodology described above. Due to the continued difficulty of predicting possible future liquidity outcomes for the company, we continued to apply the OPM valuation methodology described above.
Total enterprise value was calculated using both the income approach and the market approach. With respect to the income approach, total enterprise value was calculated using estimated cash flows based on cash flow projections for the year ending December 31, 2012 through the year ending December 31, 2022, which were discounted based on WACC of 17.0%. With respect to the market approach, our board of directors analyzed the financial performance of publicly traded companies in the consumer technology, home automation and high growth company spaces.
Based on the process described above, our board of directors determined that it had greater confidence in the income approach compared to the market approach given the lack of comparable industry peers, so it gave more weight to the income approach to determine total enterprise value. The enterprise value was then allocated to the common stock utilizing an OPM methodology using the assumptions described above. As a result, the fair value of the common stock was determined to be $8.84 per share. The increase in value from the December 2011 grants was primarily due to an additional year of cash flow projections, our first quarter results of operations and an adjustment to our WACC given the slight reduction in the perceived risk associated with our company.
September 2012 Awards
As of September 28, 2012, our board of directors determined the fair value of the common stock to be $9.15 per share. We considered several objective and subjective factors, including our then-current stage of development, the value of comparable companies, the value of our assets, the purchase prices of our outstanding capital stock, the present value of our future cash flows (based upon projected revenue), the rights and preferences our current stockholders are entitled to, the lack of marketability of our common stock, the economy generally and an additional contemporaneous valuation report prepared for us in contemplation of such option grants, which report used a hybrid of the OPM and PWERM valuation methodologies described above. Since the date of the last report, we had begun considering the possibility of an initial public offering. As a result, the range of discrete events, specifically IPO and non-IPO scenarios, became easier to predict, therefore PWERM was utilized in part to estimate the fair value of our common stock during this period.
77
The expected outcomes were weighted between an IPO scenario occurring during early to middle of 2013, which was valued using the market approach, and a non-IPO scenario that involved remaining a private company, which was valued using the income approach. The enterprise value under each of these scenarios was, in part, based on cash flow projections for year ending December 31, 2012 through the year ending December 31, 2022, which were discounted by a WACC of 17.0%. As a result, the fair value of the common stock was determined to be $9.15 per share. The increase in fair value from June 2012 was primarily due to our results of operations and our preliminary planning for an IPO, including (i) management provided our board of directors with a preliminary initial public offering timeline for consideration, and (ii) the board of directors requested that management proceed with the beginning stages of commencing an initial public offering, including conducting preliminary meetings with various investment banks.
December 2012 Awards
As of December 14, 2012, December 26, 2012 and December 28, 2012, our board of directors, or a committee thereof, determined the fair value of the common stock to be $9.93 per share. We considered several objective and subjective factors, including our then-current stage of development, the value of comparable companies, the value of our assets, the purchase prices of our outstanding capital stock, the present value of our future cash flows (based upon projected revenue), the rights and preferences our current stockholders are entitled to, the lack of marketability of our common stock, the economy generally and an additional contemporaneous valuation report prepared for us in contemplation of such option grants, which report used a hybrid of the OPM and PWERM valuation methodologies described above. Since the date of the last report, we had taken additional steps toward an initial public offering. Given the continued potential for an IPO scenario, PWERM was utilized in part to estimate the fair value of our common stock during this period.
The expected outcomes continued to be weighted between an IPO scenario occurring during early to middle of 2013, which was valued using the market approach, and a non-IPO scenario that involved remaining a private company, which was valued using the income approach. The enterprise value under each of these scenarios was, in part, based on cash flow projections for year ending December 31, 2012 through the year ending December 31, 2022, which were discounted by a WACC of 16.0%. As a result, the fair value of the common stock was determined to be $9.93 per share. The increase in fair value from September 2012 was primarily due to our results of operations as well as our continued steps towards an IPO, including the selection of underwriters, an organizational meeting held in early December and the preparation of a registration statement on Form S-1.
April 2013 Awards
As of April 25, 2013, our board of directors determined the fair value of the common stock to be $11.28 per share. We considered several objective and subjective factors, including our then-current stage of development, the value of comparable companies, the value of our assets, the purchase prices of our outstanding capital stock, the present value of our future cash flows (based upon projected revenue), the rights and preferences our current stockholders are entitled to, the lack of marketability of our common stock, the economy generally and an additional contemporaneous valuation prepared for us in contemplation of such option grants, which used a hybrid of the OPM and PWERM valuation methodologies described above. Since the date of the last award, we had taken additional steps toward an initial public offering. Given the continued potential for an IPO scenario, the PWERM was utilized in part to estimate the fair value of our common stock during this period.
The expected outcomes were weighted between an IPO scenario occurring during the middle of 2013, which was valued using the market approach, and a non-IPO scenario that involved remaining a private company, which was valued using the income approach. The enterprise value under each of these scenarios was, in part, based on cash flow projections for the year ending December 31, 2013 through the year ending December 31, 2022, which were discounted by a WACC of 16.0%. As a result,
78
the fair value of the common stock was determined to be $11.28 per share. The increase in fair value from December 2012 was primarily due to our results of operations as well as our continued steps towards an IPO, including the continued preparation of a registration statement on Form S-1.
Subsequent to the April 25, 2013 stock option grants, we revised the estimate of the fair value of our common stock for financial reporting purposes, and assigned an estimated fair value of $16.00 per share, which is the midpoint of the price range set forth on the cover page of this prospectus, to the stock options granted on April 25, 2013. As the exercise price of the April 25, 2013 stock option grants was $11.28 per share, we are recognizing additional stock-based compensation expense over the vesting period of these stock options due to the revised estimate of the fair value.
June 2013 Awards
As of June 11, 2013 and June 23, 2013, our board of directors determined the fair value of the common stock to be $11.28 per share. We considered several objective and subjective factors, including our then-current stage of development, the value of comparable companies, the value of our assets, the purchase prices of our outstanding capital stock, the present value of our future cash flows (based upon projected revenue), the rights and preferences our current stockholders are entitled to, the lack of marketability of our common stock, the economy generally and an additional contemporaneous valuation prepared for us in contemplation of such option grants, which used a hybrid of the OPM and PWERM valuation methodologies described above. Given the continued potential for an IPO scenario, the PWERM was utilized in part to estimate the fair value of our common stock during this period.
The expected outcomes were weighted between an IPO scenario occurring during the middle of 2013, which was valued using the market approach, and a non-IPO scenario that involved remaining a private company, which was valued using the income approach. The enterprise value under each of these scenarios was, in part, based on cash flow projections for the year ending December 31, 2013 through the year ending December 31, 2022, which were discounted by a WACC of 16.0%. As a result, the fair value of the common stock was determined to be $11.28 per share.
Subsequent to the June 11, 2013 and June 23, 2013 stock option grants, we revised the estimate of the fair value of our common stock for financial reporting purposes, and assigned an estimated fair value of $16.00 per share, which is the midpoint of the price range set forth on the cover page of this prospectus, to the stock options granted on June 11, 2013 and June 23, 2013. As the exercise price of the June 11, 2013 and June 23, 2013 stock option grants was $11.28 per share, we are recognizing additional stock-based compensation expense over the vesting period of these stock options due to the revised estimate of the fair value.
Recent Accounting Pronouncements
In May 2011, the FASB issued new guidance for fair value measurements to provide a consistent definition of fair value and ensure that the fair value measurement and disclosure requirements are similar between GAAP and International Financial Reporting Standards. The guidance changes certain fair value measurement principles and enhances the disclosure requirements, particularly for level 3 fair value measurements. We adopted this guidance prospectively January 1, 2012 and noted no significant impact on our results of operations, financial position or cash flows.
In February 2013, the FASB issued ASU 2013-02, "Comprehensive Income: Reporting of Amounts Reclassified Out of Accumulated Other Comprehensive Income." The amended guidance requires an entity to present the effects on the line items of net income of significant reclassifications out of accumulated other comprehensive income if the amount being reclassified is required under U.S. generally accepted accounting principles to be reclassified in its entirety to net income in the same reporting period. The guidance is effective prospectively for the reporting periods beginning after December 15, 2012. We do not anticipate the adoption of the amended guidance to have significant impact on its consolidated financial statements.
79
In June 2011, the FASB issued new guidance that improves the comparability, consistency, and transparency of financial reporting and increases the prominence of items reported in other comprehensive income, or OCI, by eliminating the option to present components of OCI as part of the statement of changes in stockholders' equity. The amendments in this standard require that all non-owner changes in stockholders' equity be presented either in a single continuous statement of comprehensive income or in two separate but consecutive statements. Subsequently, in December 2011, the FASB issued additional guidance, which indefinitely defers the requirement to present on the face of the financial statements reclassification adjustments for items that are reclassified from OCI to net income in the statement where the components of net income and the components of OCI are presented. The amendments to these standards do not change the items that must be reported in OCI, when an item of OCI must be reclassified to net income, or change the option for an entity to present components. This new guidance was effective for us beginning January 1, 2012 and was required to be applied retrospectively. The adoption of this guidance did not have an impact on our results of operations, financial position or cash flows as it relates only to financial statement presentation.
80
Overview
We are a leading provider of automation and control solutions for the connected home. We unlock the potential of connected devices, making entertainment systems easier to use, homes more comfortable and energy efficient, and families more secure. We provide our consumers with the ability to integrate music, video, lighting, temperature, security, communications and other functionalities into a unified home automation solution that enhances our consumers' daily lives. More than 75% of our consumers have integrated two or more of these functionalities with our solution. At the center of our solution is our advanced software platform, which we provide through our products that interface with a wide variety of connected devices that are developed both by us and by third parties.
Our solution functions as the operating system of the home, making connected devices work together to control, automate and personalize the homes of our consumers. For example, our solution can be configured so that:
- •
- A half hour before you wake up in the morning, the thermostat adjusts to heat up the house, the lights slowly become
brighter and the shades gradually open;
- •
- As you leave for work, one push of a button locks the doors, arms the security system, turns off all the lights, powers
down all non-essential devices and adjusts the temperature settings to the "away" mode;
- •
- While you are at work, your Control4 system sends you a text message if your child has not returned home from school by
the expected time, if the gaming system has been in use for more than an hour or if there is a water leak detected in the laundry room;
- •
- When you return home in the evening, the push of a button opens your garage door, unlocks the door and adjusts the
thermostat to your preferred temperature;
- •
- When you are ready to watch a movie, instead of having to use several remotes, a single interface—be it a
touch screen, smartphone, tablet or simple remote—provides you with easy control of your entire entertainment system. As the movie starts, the window blinds close, the lights dim and the
temperature adjusts to keep your family comfortable; and
- •
- When it is time for bed, the press of a "goodnight" button closes the blinds, turns off the lights, locks the doors, arms the security system and turns off all televisions and game consoles.
Consumer need for simplicity and a personalized experience, combined with advances in technology, are driving rapid growth in the connected home market. As a result of the significant growth in smart devices, mobile data networks, home broadband access and in-home wireless networking, consumers are more comfortable with ubiquitous connectivity and device interoperability. Accustomed to network connectivity and control of their digital lives, consumers are now looking for affordable ways to extend this functionality into their homes, driving growth in the mainstream home automation market. According to ABI Research, this mainstream segment of the home automation market was estimated to be $571 million in 2012, and is expected to grow at a compound annual growth rate, or CAGR, of 35% to $2.6 billion by 2017.
We were founded in 2003 to deliver a mainstream home automation solution by enabling consumers to unify their connected devices into a personalized system at an accessible and affordable entry point. Sold through our worldwide network of over 2,800 active direct dealers, our solution sits at the center of the mainstream home automation market by providing integrated and extensible control of over 6,400 third-party devices and services. These devices and services span a broad variety of product categories including music, video, lighting, temperature, security, communications and other
81
devices. Our platform capabilities provide consumers with solutions that are easy to use, comprehensive, personalized, flexible and affordable.
Based on our analysis, we estimate that we have automated more than 120,000 homes representing cumulative sales of more than 275,000 of our controller appliances, the brain of the connected home. We sell and deliver our solutions through an extensive worldwide dealer and distributor network and have solutions installed in 81 countries. Our top 100 dealers represented 24% of our total revenue in 2012.
We generated revenue of $74.9 million, $93.4 million and $109.5 million in 2010, 2011 and 2012, respectively, and $26.6 million for the three months ended March 31, 2013. We had a net loss of $16.3 million, $3.9 million and $3.7 million in 2010, 2011 and 2012, respectively, and $1.5 million for the three months ended March 31, 2013.
Our Industry
Home Automation
Within the last decade, the pace of innovation in the electronics industry has accelerated rapidly. Network-aware devices—such as televisions, smartphones, tablets, thermostats, appliances and security systems—that separately connect to a home network create the "connected home." Home automation technology integrates devices in the connected home, unlocking the collective potential of these devices working together to improve consumers' lives. The home automation market has reached a major inflection point and is becoming a mainstream offering accessible by a broad base of consumers.
Home automation solutions unify the control of music, video, lighting, temperature, security, communications and other devices in the connected home to provide consumers with improved convenience, comfort, energy efficiency and security. The key functional elements of home automation include:
- •
- Control. Controlling devices is the most basic capability of home automation
solutions. From a single interface, consumers can operate a wide array of devices using wired or wireless connections. With the recent growth in smartphones and tablets, control functionality is
increasingly being extended to these mobile devices;
- •
- Automation. After initial programming, automation enables devices to function without
additional human intervention. Automation also enables various devices to work in concert to perform more complex tasks and to take actions based on external conditions; and
- •
- Personalization. Personalization enables home automation solutions to be tailored to the unique lifestyle requirements of individual consumers and their families. Personalization unlocks the full potential of home automation to enhance, enrich and simplify the lives of consumers.
Market Opportunity
Consumers are becoming more reliant on network-aware devices in their everyday lives, contributing to the creation of a large opportunity in the mainstream home automation market. Growth in smart devices, such as smartphones and tablets, and the ubiquity of wireless networks have combined to create the "connected consumer." Accustomed to connectivity, centralized access to content and control from anywhere using any device, consumers are now looking for new areas where they can extend the utility, security and enjoyment of this "always connected" capability. The home—with its increasing capabilities in the form of networks (such as broadband, ZigBee and Wi-Fi), connected
82
devices (such as tablets, smartphones, TVs and multi-room audio systems) and smart systems (such as lighting, temperature and security)—is the next center of attention for the connected consumer.
An automated home is created through technologies that unify and personalize the control of lighting, temperature, music, entertainment, security, consumer appliances and more, whether throughout the entire home or limited to a single room. The home automation market has traditionally been fragmented as participants offered point products that only control one application (such as entertainment or temperature), managed services (such as security) or luxury installations (such as an expensive whole home custom programming system that enables a single control point to turn off lights, arm the security system, lower the blinds and lock the doors). As consumers look for a unified solution at an affordable price point, they are looking beyond the traditional market participants.
The share of the market served by the mainstream home automation segment is expanding as a number of market dynamics evolve, including:
- •
- Continued Growth of Home
Networks. According to IDC, in 2012, there were 238.8 million home Wi-Fi networks, a number expected to reach
389.4 million by 2016, a CAGR of 13%;
- •
- Growing Number of Connected Devices and Smart
Appliances. According to IDC, since 2007, the number of smartphones sold has grown at a CAGR of 41%, with nearly 700 million
smartphones sold in 2012 alone. Additionally, according to ABI Research, 1.5 billion Wi-Fi enabled devices shipped in 2012;
- •
- Increased Consumer
Awareness. The growing consumer awareness and expectation that a single device, such as a smartphone or tablet, can act as a personal
control point for devices in the home; and
- •
- Consumer Expectations of a Unified Solution. The growing consumer expectation that distinct networked devices and services should work together in a unified solution and ecosystem.
As consumer awareness of home automation grows and expectations for interoperable solutions increase, the mainstream segment of the home automation market is expected to expand rapidly. The mainstream segment of the home automation market was estimated to be a $571 million market in 2012 and to become a $2.6 billion market by 2017, representing a CAGR of 35%, as consumers look for centralized solutions to provide personalized control and automation of their homes.
Consumer Requirements
For the mainstream consumer to embrace a home automation solution, the solution must have the following attributes:
- •
- Easy to
Use. Consumers want a solution that is as easy to use as a smartphone. The trend in the market, made popular by smartphones and tablets,
is for intuitive and easy-to-use devices. Consumers want a simple, yet powerful and innovative interface that is interoperable and personalized for the set of devices and
systems that they have in their homes. Consumers unfamiliar with a particular system should be able to navigate that system with the touch of a button and set up automation events and actions through
a simple user interface;
- •
- Interoperable. The growing number of devices and smart appliances built by different manufacturers, based on different technologies and using different communication protocols leads to increasing chaos and incompatibility within the home. As a result, consumers are forced to learn and use multiple interfaces. Consumers are looking for a single solution with the ability to manage an ecosystem of devices, regardless of manufacturer, technology or communication protocol, allowing the consumer to continue to choose best-of-breed products;
83
- •
- Personalized and
Flexible. Consumers want to be able to easily personalize the behavior of the devices in their homes to reflect their own lifestyles.
For example, parents may want to be notified when their children return home from school and monitor their entertainment usage, while other consumers may be more interested in assuring that their
video, music, security and lighting systems are seamlessly integrated for entertaining. Additionally, as consumers move through different stages in their lives, they will purchase additional and
replacement devices as well as develop new interests and preferences that require their home automation solution to be adaptable over time;
- •
- Affordable and
Future-Proof. Although consumer desire for home automation is increasing, widespread market adoption requires reasonable price points
and support costs. Consumers want a home automation solution that is affordable, personalized and easy to use while at the same time providing rich functionality and broad device interoperability.
Budget-conscious consumers also want a solution that can easily adapt to their changing requirements without the added cost, disruption or uncertainty of complete
rip-and-replace projects; and
- •
- Accessible Service and Support. Consumers are looking for solutions that are supported by trained specialists who can provide both responsive initial consultation and installation, as well as ongoing service and support. Local service and support remains the best resource for consumers looking to realize the full potential and functionality of their home automation systems.
Limitations of Traditional Approaches
The home automation market has traditionally been served by three categories that in general have been unable to meet all consumer requirements or overcome the impediments to broad market adoption.
- •
- Luxury
Installations. Generally found in the highest end segment of the market, these providers have delivered solutions for device integration
and control that require extensive, intricate and time-consuming custom programming. These complex characteristics force the dealers and installers of these systems to start from
square-one for each new consumer. As a result, these systems and installations are typically complex, lengthy, inflexible and expensive;
- •
- Managed
Services. Generally provided by a cable, telephone or security provider, these services provide a limited amount of device control
capability for an additional monthly fee over the amount already charged for the provider's core business. These services are generally limited to providing remote monitoring functionality and control
over a few select devices made by specific manufacturers. While such added services are generally perceived as affordable, they generally require an upfront investment and a non-cancelable
subscription contract for 24 to 36 months. Moreover, these services typically have limited functionality, do not interoperate with a broad set of devices, and come as a non-personalized,
one-size-fits-all service. The narrow focus of these services limits the types of devices that consumers can integrate into their connected homes; and
- •
- Point Products. Point products provide a discrete function within the home without being integrated with other devices. Taking advantage of advancements in technology, certain vendors have emerged to provide enhancements to point products used in the home. For example, home entertainment systems that stream music within the home or provide access to a music library from any device are becoming more commonplace. Products that provide advanced temperature control (enabling smarter energy consumption) have also recently been introduced. Each of these individual or discrete connected home devices sits in a separate technical "silo," and typically lack interoperability with other devices.
84
Our Solution
The Control4 solution, built around our advanced software platform, sits at the center of the fast growing mainstream segment of the home automation market. We unlock the potential of connected devices, making entertainment systems easier to use, homes more comfortable and energy efficient, and families more secure. Our solution functions as the operating system of the home, integrating music, video, lighting, temperature, security, communications and other devices into a unified automation solution that enhances our consumers' lives.
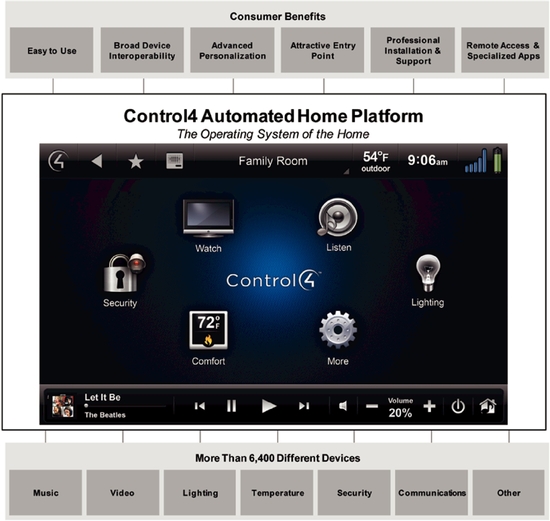
The Control4 solution integrates more than 6,400 third-party devices and systems into a unified, easy-to-use solution for mainstream consumers. As a result, our solution provides the consumer with the following benefits:
- •
- Easy to Use. Our solution is designed to be simple and intuitive. For example, our easy-to-use interfaces can be as advanced as a smartphone, tablet, in-wall touch panel, television or multi-function remote control, or as simple as a single button or switch. Through our unified software platform, consumers can easily interact with their entire automated home without learning multiple interfaces or numerous remote controls. We have designed our solution so that anyone, from a young child to a grandparent, can pick up a Control4 device, push a button and watch a movie without any prior instruction;
85
- •
- Broad Device
Interoperability. Our open and flexible platform provides consumers with access to a broad universe of third-party devices that become
connected and interoperable through our solution. The Control4 software platform currently operates with over 6,400 discrete third-party devices. With our solution, consumers can seamlessly connect
and automate the devices they already own—as well as the devices they purchase in the future—and have the confidence that all of those devices will interoperate as seamlessly
as if they were made by the same manufacturer;
- •
- Advanced
Personalization. Our adaptable solution enables our consumers to personalize the features and functionality of their Control4 system.
For example, while you are away on vacation, our solution can be personalized to turn off non-essential appliances to save energy, turn lights on and off at night to simulate occupancy,
and send you e-mail alerts of any status changes (such as a breach of the security system or a power outage). Our modular design also enables the smooth integration of new third-party
products to meet the evolving needs of our consumers as their lifestyles change;
- •
- Attractive Entry
Point. According to ABI Research, the typical luxury home automation installation can cost $60,000 or more for whole-home systems. The
Control4 solution is designed to be a much more affordable solution. Consumers can start with a single room multi-media automation experience for about $1,000 and scale to an integrated solution with
an average cost of $26,000. Based on our research, more than half of our consumers have Control4 system configurations with one controller costing between $670 and $25,000 with an average cost of
$3,500 (including estimated installation costs);
- •
- Professional Installation and Support through Our Global Dealer
Network. As the number and types of connected devices continues to grow, the need for local professional consultation, installation and
support is currently essential for a successful home automation experience. We have built a global network of over 2,800 active direct dealers and distributors. Our certified dealers receive
in-depth training, on-going education and support, enabling them to help consumers develop and install their personalized home automation experiences with the Control4
solution. To further increase consumer satisfaction, we also maintain a Customer Advocacy & Care Group that responds directly to consumer questions and concerns; and
- •
- Remote Access and Specialized Apps. We have developed complementary services and applications offerings, 4Sight and 4Store, to provide consumers even more access, control and enhanced functionality over their automated homes. 4Sight subscription services provide consumers with the ability to remotely monitor and adjust settings in their homes (such as lights, temperature settings, door locks, gates and cameras) as well as receive event-based email alerts when predefined events either occur or do not occur by a specific time. With our 4Store online application marketplace, consumers can find and install new third-party apps that enhance their Control4 experience for specific devices, systems and media services.
Our Growth Strategy
Our goal is to be the leading provider of mainstream home automation solutions and the operating system of choice for the home. The following are key elements of our growth strategy:
- •
- Enhance Our Software Platform and
Products. We believe that our success to-date has been largely driven by the capabilities of our software platform. We will
continue to invest in our software platform to develop and support new products, features and capabilities that deliver exceptional performance and value to our consumers;
- •
- Strengthen and Expand Our Global Dealer Network. We have developed a global network of over 2,800 active direct dealers and 27 distributors to sell, install and support our solutions.
86
- •
- Increase Penetration of Our North America Core
Market. We intend to continue to focus on the residential market in North America, which represented approximately 77% of our revenue
for the three months ended March 31, 2013. According to ABI Research, North America is currently the largest market for the mainstream segment of the home automation market, representing 69% of
the total worldwide market based on revenues in 2012. We believe the mainstream market in North America remains significantly underpenetrated. We also believe the residential market offers us an
opportunity for significant long-term growth, and we will continue to devote sales and marketing resources to increase penetration of that core market;
- •
- Expand Our Focus on Adjacent
Markets. We are also making investments to capitalize on opportunities outside the residential market and internationally.
Internationally, our products are now available in 28 languages and distributed in 81 countries. Our international core revenue in 2011 and 2012 and for the three months ended March 31, 2013
increased 57%, 46% and 20% period-over-period, respectively. In addition, we have had initial success in the light commercial, multi-dwelling unit and hospitality markets, and
we plan to increase our focus on these and other adjacent opportunities to expand our addressable market;
- •
- Enhance Our Solution with Services and
Apps. In addition to automating devices within the home, our solution also enables a wide variety of service and application
opportunities. We will continue to enhance our 4Sight subscription services to provide consumers with enhanced home monitoring and control capabilities from any Internet-connected mobile device or
computer. We will also continue to support apps developed by third parties, making them available through our 4Store application marketplace and our dealer network;
- •
- Pursue Technology Licensing
Opportunities. We plan to make our technology increasingly available to third parties through licensing agreements. For example, we
recently announced that Sony integrated our home automation technology into its new ES line of home theater receivers. We have also begun making our device auto-discovery technology,
Simple Device Discovery Protocol, or SDDP, available on a royalty-free basis to third parties to streamline and automate the setup, identification and configuration of their devices into
our system. We also plan to expand our licensing activities to leverage third-party distribution channels, grow our partner relationships and simplify the home automation experience for dealers and
consumers; and
- •
- Pursue Strategic Acquisitions. We believe that our software platform has a strategic position as the operating system of the connected home. As a result, we believe we are ideally positioned to identify, acquire and integrate strategic acquisitions that are complementary to our current offerings, strengthen and expand our technology foundation, enhance our market positioning, distribution channels and sales, and are consistent with our overall growth strategy.
We will continue to expand and optimize our dealer network to ensure that we have sufficient geographic coverage across both existing and new markets. We will also continue to devote significant resources to increase the productivity and competency of our dealers and distributors by providing them with ongoing training, tools and support;
87
Our Products and Services
The primary benefits we provide consumers and dealers lie in the value and competitive differentiation of our software platform. We deliver value and differentiation to consumers and generate revenues by embedding our software into a range of physical products. Our products sit at the center of the connected home and are designed to be:
- •
- Easy to use from a variety of user interfaces;
- •
- Adaptable to accommodate future devices and technologies;
- •
- Compatible in new and existing homes;
- •
- Affordable and cost-effective throughout installation and ownership; and
- •
- Easy to install without major construction or remodeling.
Software Platform
At the center of the Control4 product line is the Control4 Home Operating System, which we refer to as the C4 OS, and the associated application software and software development kits, or SDKs. The high-level software components include:
- •
- Director. Director is a real-time, extensible home operating system
kernel that is responsible for monitoring and receiving events from numerous devices and services, processing those events according to consumer personalized settings, and then dispatching commands to
the appropriate devices to perform predefined actions. Director runs on our controller appliances and certain authorized partner products such as Sony ES receivers;
- •
- Navigator. Navigator displays intuitive and rich graphical user interfaces on televisions, in-wall and table-top touch panels, smartphones and tablets, as well as list-based devices such as a remote controls with LCD text-displays;
Control4 Navigator Resides on Many Interface Devices

88
- •
- Composer Professional
Edition. Composer Professional Edition is a software application that enables trained and certified Control4 dealers and installers to
design, configure and personalize a Control4 home automation system for consumers;
- •
- Composer Home Edition and Composer Media
Edition. Composer Home Edition and Media Edition enable consumers to view and configure their Control4 managed devices. These
drag-and-drop programs provide the ability to manage digital media and create and modify simple programs and policies (such as changing lighting scenes, modifying custom
buttons and controlling behaviors among devices based on schedules or times of the day);
- •
- DriverWorks
SDK. DriverWorks SDK is a software development kit that enables dealers, programmers and device manufacturers to independently develop
and test custom two-way interface drivers to support the integration of a new device or device model into our system, or to customize and enhance an existing driver. DriverWorks SDK has
enabled 6,400 different products and services to be incorporated into the Control4 ecosystem; and
- •
- Navigator SDK and Application SDK. Navigator SDK and Application SDK are software development kits that enable third-party dealers and programmers to customize and deliver new application functionality within Navigator user interfaces on Control4 interface devices through the development of apps.
Products with Embedded Software and Services
Our products leverage our software platform to provide consumers with a comprehensive and easy-to-use connected home experience. We design and manufacture our products via contract manufacturers as well as certify partner products for sale through our dealers. Our products and services include:
- •
- Controller
Appliances. Our controller appliances run our Director software to monitor, process and automate events, statuses and actions for
numerous devices and services, creating a comprehensive connected home experience. Currently we offer the HC-800, a whole home controller appliance, and the HC-250, a
single-room controller appliance. We also license our Director software on the new Sony ES 5800 and 2800 receivers, transforming them into controller appliances with home theater audio and
video capabilities;
- •
- Interface
Devices. We offer touch panels, handheld remote controls and keypads as interface devices. We also develop and deliver software
applications for Apple iOS and Android smartphones and tablets that enable these personal devices to become control interfaces to Control4 connected homes, both on-premise and remotely;
- •
- Audio/Video
Equipment. We offer network-enabled 4x4 and 8x8 zone audio amplifiers, and a 16x16 audio matrix switch for versatile
multi-room and whole-home audio distribution. We also offer an integrated digital media player for integration of local digital audio and video, as well as Wi-Fi
and Ethernet amplified speaker points for streaming digital audio to speakers in areas without an audio receiver;
- •
- Lighting Products. We offer a suite of lighting products that provide personalized control and energy management. Our suite of wireless light switches and dimmers can easily replace devices in an existing home or be installed in new homes. We offer in-wall wireless switches and dimmers for 120V, 240V and 277V electrical loads, which meet the requirements of North America and many international markets. We also plan to offer panelized systems, where all of the lighting control will be done on a remote panel. Our new Control4 lighting products will have the ability to measure how much energy each load is using and provide suggestions to the consumer on how to conserve energy and reduce costs;
89
- •
- Thermostats. We offer devices that provide energy savings, convenience and efficiency
for temperature control. Our wireless multi-stage thermostat is completely programmable with up to six set points per day and, using our 4Sight subscription service, is remotely accessible and
controllable;
- •
- Security
Products. We provide a set of products and software services created by us as well as distribute certified third-party products,
including deadbolts, door and window sensors, motion sensors, garage access systems and water leak detection systems, from our security partners such as Baldwin, Card Access, Kwikset and Yale;
- •
- Communication
Products. We offer full motion video and hi-fidelity audio intercom capability through our in-wall and tabletop
touchscreens, as well as our exterior weather-resistant door stations; and
- •
- Subscription Services. 4Sight is a subscription service that enables 24x7 home monitoring and control from virtually anywhere, remote home programming and support, and instant email alerts based on home events so that homeowners are always in-the-know. For example, 4Sight allows a consumer to remotely unlock the front door to let in a repairman, to turn on the air conditioning on the way home, and to monitor the home security cameras from a smartphone.
Sales of our controller appliances, including software, represented 39% of our total revenue in 2012.
Our installed solutions include functionalities in the following percentages:
Video |
100 | % | ||
Music |
57 | |||
Lighting |
48 | |||
Communications |
32 | |||
Security |
29 | |||
Temperature |
24 |
More than 75% of our consumers have integrated two or more of these functionalities with our solution.
Our Distribution Network
In 2005, we started selling our solutions through a network of over 450 independent dealers. Since that time, our distribution network has grown to over 2,800 active direct dealers and distributors in 81 countries. Dealers range in size from small family businesses to very large organizations.
Our dealers are home automation specialists that have significant experience in designing, installing and servicing both low- and high-voltage systems including music, video, security, communications and temperature control. Every Control4 dealer has gone through extensive training and has passed the necessary certification tests—either in one of our training facilities located in the United States or the United Kingdom, or in a training facility of one of our distributors. Every installer for each dealer must complete course work and pass pre-training examinations, as well as pass rigorous testing at the conclusion of the multi-day formal training in order to become certified to sell and install our solutions.
We sell directly through dealers in the United States, Canada, the United Kingdom and 40 other countries. We partner with 27 distributors to serve 38 additional countries where currently we do not have dealer training and support facilities. Our distributors recruit, train and manage dealers within their region and also help dealers find country specific solutions for unique needs based on the special home automation market characteristics within each country. In recent years, we have moved more toward a dealer-direct model in specific international regions as we have added and continue to add sales and support staff, namely in the United Kingdom, China and India.
90
During the years ended December 31, 2010, 2011 and 2012 and the three months ended March 31, 2013, none of our dealers or distributors accounted for more than 5% of our revenue. None of our dealers or distributors have minimum or long-term purchase obligations. Dealer orders are typically placed on a project-by-project basis. As such, our dealers do not typically carry significant levels of inventory. The resulting just-in-time model helps reduce dealer inventory investment and also reduces dealer returns. Our dealers around the world are each responsible for local marketing, selling, installing and servicing the consumer.
Our Partners
The home automation market is made up of a collection of thousands of electronically controllable products made by hundreds of key manufacturers. We believe that our success has come, in part, due to our success in forming relationships with many of these manufacturers. As of January 2013, we had agreements with over 130 manufacturers, of which 42 have formally submitted their devices to us for Control4 certification so that our worldwide dealer network can be assured that these third-party devices work well with our platform.
In addition to standard interoperability with Control4, more and more manufacturers are realizing the value our technology can bring when it is embedded inside their products. For example, we recently launched our device auto-discovery technology, SDDP, which enables seamless installation of devices by embedding code at the manufacturer, making it easier for dealers and consumers to add new products to existing systems. Sony recently launched two home theater receivers with our platform embedded inside, giving consumers the full power of our software to automate the home.
Third-party manufacturers are currently selling 22 brands through our online store. This provides manufacturers valuable reach into our trained dealer network, and it helps our dealers gain easy access to 426 products that they know are certified by Control4. We also partner with other companies for purposes of strategic initiatives.
91
Our Technology
Core Automation Enabling Technology
At the core of the Control4 platform is the C4 OS. The C4 OS consists of two main components, Director and Navigator software, that work in concert with different modules within the system to provide consumers with a unified and comprehensive connected home experience. These modules help our software platform manage media, update connected devices and interoperate using a variety of communication protocols including Ethernet, Wi-Fi, Bluetooth, ZigBee, Infrared, or IR, serial interfaces and more. Our software platform does not currently support the communication protocol Z-Wave. The following diagram shows the relationship between Director and Navigator software:
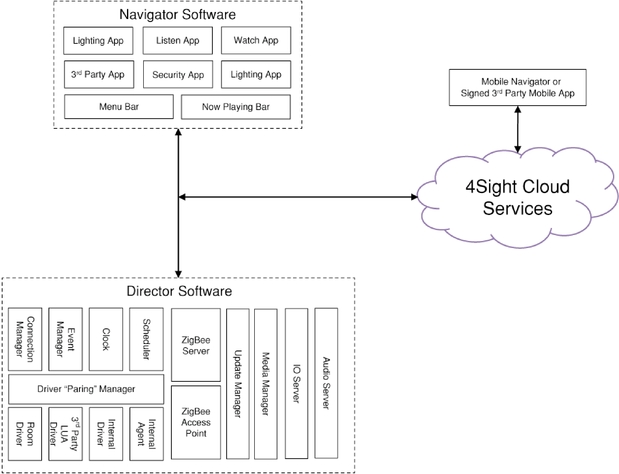
- •
- Director Software. Director is the brain of the C4 OS and interfaces with a Linux kernel. Director architecture includes a proprietary "driver pairing" technology that creates a hardware abstraction layer and exposes a single common software Applications Programming Interface, or API, for all devices of the same type. This enables an application developer to write an application to manage a lighting system that will work with any brand of lighting control equipment. Director also includes an advanced scheduling engine and astronomical clock that allows for time-based control of anything in a Control4 system. Director has a component called "Connection Manager" that is responsible for discovering new devices and maintaining connections with all of the diverse devices in an automation system.
92
- •
- Navigator
Software. Navigator is the C4 OS user interface application. Navigator connects to Director through the Director API and based on what
is in the system, automatically provides a customized user interface for control of the system. All Control4 controller appliances and touch panels run Navigator. When running on a controller
appliance, Navigator produces an "On-Screen" interface for use on TVs and projection systems with a remote control. Navigator can also produce an interface that is touch-based. Navigator
is also available for Macs, PCs, Apple iOS and Android devices.
- •
- Media
Manager. Media Manager discovers, scrubs and indexes media audio and video content across various sources—from local content
spread across Macs, PCs, NAS drives, tablets, smartphones, cable boxes and satellite receivers to streaming content scattered across online services such as Rhapsody, TuneIn, Netflix, Vudu, Hulu and
Amazon Prime. Using the C4 OS, a consumer can search for music by a particular artist and get a unified result of all content from that artist across all devices and services.
- •
- Update
Manager. Update Manager manages complex device and system updates in a synchronized way. The Update Manager will automatically check for
updates on devices connected to the Control4 system, and when prompted update all of the disparate devices in the correct order, whether or not they are directly connected to the Internet.
- •
- Audio
Server. Audio Server is the C4 OS component that manages music playback in a Control4 system. Audio Server implements Control4's
patented audio synchronization system that enables synchronized music playback across traditional analog, wired digital and wireless digital audio devices.
- •
- ZigBee
Server. ZigBee Server creates an Internet Protocol-to-ZigBee bridge and maintains a robust wireless
communications system through ZigBee's open wireless mesh networking standard. Our controller appliances use this bridge to communicate with low-bandwidth, low-cost and
low-power applications such as thermostats, light switches and remote controls.
- •
- IO Server. IO Server functions as an Internet Protocol bridge to various incompatible communication protocols such as IR, RS-232, RS-485 and contact closures. Our controller appliances implement these physical layers in order to handle the devices that do not implement Internet Protocol, allowing the connected home to communicate with more devices.
Simple Device Discovery Protocol (SDDP)
We have a patented device auto-discovery technology called Simple Device Discovery Protocol, or SDDP, that we developed to enable seamless installation of devices in our system. When a new SDDP-enabled device is installed in a home, the device sends out a signal that is immediately discovered by the system, thereby allowing the new device to easily be added.
4Sight Subscription Service
We offer a subscription service called 4Sight that enables remote access to the connected home without exposing the installer or consumer to the complexities of communicating around firewalls and private Internet Protocol addresses. This service facilitates connections between remote client devices and our systems through a cloud-based service. Using 4Sight, consumers can remotely monitor and control their Control4 systems as if they were at their homes.
Our Research and Development
Our flexible research and development model relies upon a combination of in-house staff and offshore design and manufacturing partners to improve and enhance our existing products and services,
93
as well as develop new products, features and functionality in a cost-effective manner. We believe that our software platform is critical to expanding our leadership position within the mainstream home automation market. As a result, we devote the majority of our research and development resources to software development. We work closely with our consumers to understand their current and future needs and have designed a product development process that captures and integrates feedback from our consumers.
As of March 31, 2013, we had 148 employees in our research and development organization, substantially all of whom were located at our headquarters in Salt Lake City, Utah. Our research and development expenses were $19.2 million in 2011, $20.3 million in 2012 and $6.1 million for the three months ended March 31, 2013. We intend to continue to significantly invest in research and development to expand our solutions and capabilities in the future.
Our Manufacturing
We outsource the manufacturing of our hardware products to contract manufacturers. The majority of our hardware products are manufactured by Sanmina and LiteOn at their respective facilities located in southern China, with additional manufacturing performed by six contract manufacturers located throughout Asia. Our agreement with Sanmina currently has no set term and may be terminated by us in writing at any time. Our agreement with LiteOn expires in December 2014, after which it automatically renews for successive one-year terms unless either party terminates the agreement with 180 days' notice. Our manufacturing partners assemble our products using our design specifications, quality assurance programs and standards, and procure components and assemble our products based on our demand forecasts. These forecasts represent our estimates of future demand for our products based upon historical trends and analysis from our sales and product management functions. We generally plan to have an average of six weeks of inventory on hand and in transit at any given time. We maintain fulfillment centers in Salt Lake City, Utah and York, England. Our manufacturing partners currently ship all hardware products to Utah and then we ship them directly to our dealers and distributors around the world.
We have multiple sources for most of our components. However, we do depend on single source manufacturers for certain critical components, including processors, memory modules and touch panels. We can choose to change processor and memory modules for any of our products but because of high implementation costs, we generally choose to make these changes only upon development of new products. We also rely on certain custom connectors, cables and mechanical enclosures for our hardware products that are single sourced because of the high tooling costs of sourcing the components from multiple suppliers. In each of these cases, we own the drawings and design of these custom components.
Our Marketing
Our marketing team supports our sales channel with dealer-directed advertising and promotions, lead-generation, social media engagements and training events, as well as the design and production of consumer-facing collateral, showroom signage and market-specific advertising. Our website is the anchor to our online and social media strategy, from which we direct leads to our dealers. Control4's bi-annual magazine, Home Smart Home, features lifestyle stories of Control4 installations from around the world and is available on iTunes and on our website. The publication is also reproduced and distributed to customers and prospects on our behalf by our dealers and partners.
We are active participants at global industry conferences and maintain a significant presence at CEDIA trade shows. Beyond CEDIA in the United States, we sponsored the 2012 CEDIA Conference in London and an exhibit at Integrated Systems Europe, or ISE, the annual industry trade show held in
94
Amsterdam. We are frequently featured in the trade press and maintain strong relationships with the industry's key analysts and associations.
In 2012, we also initiated strategic marketing alliances with partners such as Sony and Sub-Zero Wolf to broaden our marketing reach beyond the sales channel and go directly to the consumer. We also recently completed our first Control4 showroom, constructed within ABT Electronics, to bring the Control4 experience to life to their broad customer base.
We believe that partnering with device manufacturers, leveraging co-marketing partnerships, expanding our sales channels and increasing our brand recognition among consumers are key components of our growth strategy.
Our Competition
The market for home automation systems is fragmented, highly competitive and continually evolving. Our current competitors fall into several categories:
- •
- Providers that focus primarily on the luxury segment of the home automation market, including AMX, Crestron and Savant;
- •
- Providers of point products that address a narrow set of control and automation capabilities, including Logitech, Lutron,
Nest, Roku, Sonos and Universal Remote Control; and
- •
- Providers of managed home automation and security services, including ADT, Comcast, Verizon and Vivint (which in turn may utilize third-party software from companies including Alarm.com and iControl).
Companies that provide popular point solutions have and may continue to eliminate or restrict our ability to control and be compatible with their products. For example, a thermostat company has restricted the interoperability of its products with our solutions.
In addition, large technology companies such as Apple, Google, Microsoft and Samsung offer control capabilities among their own products, applications and services, and have ongoing development efforts to address the broader home automation market. Given the growth dynamics of this market, there are many new and existing companies targeting portions of the mainstream home automation market. To the extent that consumers adopt products, applications and services from a single large technology company or any of these companies broaden their home automation capabilities, we will face increased competition.
The principal competitive factors in our market include the:
- •
- Breadth of home automation capabilities provided;
- •
- Simplicity of use and installation;
- •
- Interoperability with third-party devices;
- •
- Price and total cost of ownership;
- •
- Sales reach and local installation and support capabilities; and
- •
- Brand awareness and reputation.
We believe that our home automation solution competes favorably with respect to these factors. Nevertheless, many of our competitors have substantially greater financial, technical and other resources, greater name recognition, larger sales and marketing budgets, broader distribution channels, and larger and more mature intellectual property portfolios than we do.
95
Our Intellectual Property
Our success and ability to compete effectively depend in part on our ability to protect our proprietary technology and to establish and adequately protect our intellectual property rights. To accomplish these objectives, we rely on a combination of patent, trademark, copyright and trade secret laws in the United States and other jurisdictions, as well as license agreements, confidentiality agreements and other contractual protections.
As of March 31, 2013, we owned 34 issued United States patents (16 of which are design patents) that are scheduled to expire between 2025 and 2030, with respect to utility patents, and between 2020 and 2022, with respect to design patents. We continue to file patent applications in multiple jurisdictions and as of March 31, 2013, we had two patent applications allowed, 13 patent applications published and 11 patent applications pending in the United States. We also had five issued patents and 14 pending patent applications under foreign jurisdictions and treaties such as Canada, Australia, New Zealand, the United Kingdom and the European Patent Convention. The claims for which we have sought patent protection apply to both our hardware and software products. Our patent and patent applications generally apply to the features and functions of our C4 OS and the applications associated with our platform.
We also rely on several registered and unregistered trademarks to protect our brand. We have registered the trademarks Control4, Control4 My Home, the Control4 logo and design, 4Store and Everyday Easy in the United States, and Control4 in the European Union. We have an additional five unregistered trademarks in the United States and 15 in foreign jurisdictions such as the European Union, China, India, Mexico and Brazil.
We have filed for United States copyright protection for our source code for all major releases of our software. We also license software from third parties for integration into or use with our products, including open-source software and other commercially available software.
In addition, we seek to protect our intellectual property rights by requiring our employees and independent contractors involved in development to enter into agreements acknowledging that all inventions, trade secrets, works of authorship, developments, concepts, processes, improvements and other works generated by them on our behalf are our intellectual property, and assigning to us any rights, including intellectual property rights, that they may claim in those works.
Our Employees
As of March 31, 2013, we had 333 full-time employees, including 310 employees in the United States and 23 employees internationally. None of our employees are represented by a labor union with respect to his or her employment with us. We have not experienced any work stoppages and we consider our relations with our employees to be good.
Our Facilities
Our corporate headquarters are located in Salt Lake City, Utah, where we lease approximately 56,000 square feet of commercial space under a lease that expires on June 30, 2018. We use this space for sales, research and development, customer service and administrative purposes. We also lease approximately 35,000 square feet of warehouse space in Salt Lake City, Utah under a lease that expires on March 31, 2017. In addition, we lease approximately 5,624 square feet of commercial space in York, United Kingdom under two separate leases that expire on November 14, 2014 and January 1, 2016. We use these properties for sales and training purposes and as fulfillment centers for the United Kingdom.
In connection with our sales efforts in the United States and abroad, we lease office space typically on a short-term renewable basis domestically in San Jose, California, Santa Clara, California,
96
Charlotte, North Carolina and Chicago, Illinois, and internationally in York, United Kingdom, Shanghai, China, Bangalore, India and Seoul, South Korea.
We believe that our facilities are suitable to meet our current needs. We intend to expand our existing facilities or add new facilities as we add employees and enter new geographic markets, and we believe that suitable additional or alternative space will be available as needed to accommodate any such growth. However, we expect to incur additional expenses in connection with such new or expanded facilities.
Our Legal Proceedings
From time to time, we may become involved in legal proceedings arising in the ordinary course of our business. We are not presently a party to any legal proceedings that, if determined adversely to us, we believe would individually or in the aggregate have a material adverse effect on our business, results of operations, financial condition or cash flows.
97
Executive Officers and Directors
The following table sets forth the names, ages and positions of our executive officers and directors as of March 31, 2013:
Name
|
Age | Position | |||
|---|---|---|---|---|---|
Martin Plaehn |
55 | President, Chief Executive Officer and Director | |||
Dan Strong |
54 | Chief Financial Officer | |||
William B. West |
50 | Founder, Chief Strategy Officer and Chairman of the Board | |||
Eric Anderson |
54 | Senior Vice President, Products | |||
James B. Arnold |
56 | Senior Vice President, Sales | |||
Greg Bishop |
54 | General Counsel, Chief Compliance Officer and Corporate Secretary | |||
Susan Cashen |
52 | Senior Vice President, Marketing | |||
Jeff Dungan |
43 | Senior Vice President, Supply Chain Operations and Senior Vice President, Business Development | |||
Rob Born(1)(3) |
45 | Director | |||
David C. Habiger(2)(3) |
44 | Director | |||
Len Jordan(2) |
47 | Director | |||
Christopher B. Paisley(1)(3) |
61 | Director | |||
Scott Petty(1) |
50 | Director | |||
Steven Vassallo(2) |
42 | Director | |||
- (1)
- Member
of the Audit Committee
- (2)
- Member
of the Compensation Committee
- (3)
- Member of the Nominating and Corporate Governance Committee
Martin Plaehn has served as our President and Chief Executive Officer, and a member of our board of directors since September 2011. Prior to joining our company, Mr. Plaehn served as senior vice president of product and service development at RealNetworks, Inc., a provider of Internet media delivery software and services, from 2010 to 2011. Prior to that, Mr. Plaehn served as an advisor to chief executive officers, executive teams and investors for technology companies from 2008 to 2010. Prior to that, Mr. Plaehn served as the president and chief executive officer at Bungee Labs, a cloud computing and platform-as-a-service company, from 2006 to 2008. Prior to that, Mr. Plaehn served as executive vice president of technology products and services at RealNetworks, Inc., from 1999 through 2004, and then led RealNetworks, Inc.'s casual games division from 2004 to 2005. Prior to that, Mr. Plaehn served as chairman and chief executive officer of Viewpoint Digital, which was acquired by CA, Inc., an information technology management company, in 1998. Mr. Plaehn holds a Bachelor of Arts in mathematics from the University of California, San Diego and is a graduate of the Executive Program for Scientists and Engineers at the University of California, San Diego.
We believe that Mr. Plaehn is qualified to serve as a director based on the perspective and experience he brings as our President and Chief Executive Officer and his experience as a seasoned executive.
Dan Strong has served as our Chief Financial Officer since January 2008. Prior to joining our company, Mr. Strong served as the chief financial officer at iBAHN, a hospitality networking company, from 2004 to 2008. Prior to joining iBAHN, Mr. Strong served as vice president of financial planning and analysis, vice president and corporate controller, and interim chief financial officer at Iomega Corporation, a producer of storage hardware, from 1996 to 2004. Mr. Strong has also held executive-level corporate finance positions at Campus Pipeline, Inc., a developer of a software platform
98
for colleges and universities. Mr. Strong holds a Bachelor of Science in accounting from the Eccles School of Business at the University of Utah.
William B. West co-founded our company in March 2003 and has served as the Chairman of our board of directors since October 2011. From 2003 to 2011, Mr. West served as our chief executive officer. Prior to that, Mr. West co-founded STSN (now known as iBAHN), a broadband services company designed for business travelers, and PHAST Corporation, a manufacturer of high-end home automation equipment. Mr. West holds a Bachelor of Arts in finance from the University of Utah and a Master of Business Administration from the Wharton School at the University of Pennsylvania. Mr. West also holds the Chartered Financial Analyst designation.
We believe that Mr. West is qualified to serve as a director based on the perspective and experience he brings as one of our co-founders, his experience as a seasoned executive and his knowledge of the industry in which we operate.
Eric Anderson has served as our Senior Vice President, Products, since June 2012. Prior to joining our company, Mr. Anderson was vice president, product management at NetIQ Corporation, a software company, from 2011 to 2012. Prior to that, Mr. Anderson held various executive positions at Novell, Inc., a security management software company, from 2006 to 2011, including chief technology officer and vice president of product management. Prior to that, Mr. Anderson, served in various management positions at BMC Software, Inc., a business service management software company, and Compaq Computer Corporation. Mr. Anderson holds a Bachelor of Science in marketing and a Master of Business Administration from Brigham Young University.
James B. Arnold has served as our Senior Vice President, Sales, since February 2007. Prior to joining our company, Mr. Arnold served as senior vice president of sales and distribution at DIRECTV, Inc. from 2002 to 2006. Mr. Arnold holds a Bachelor of Arts in psychology and sociology from Washington University in St. Louis.
Greg Bishop has served as our Vice President and General Counsel since March 2008. In January 2013, Mr. Bishop was also named our Chief Compliance Officer and Corporate Secretary. Prior to joining our company, Mr. Bishop operated his own legal consulting firm, Outsourced GC, PLLC, from 2004 to 2008. Prior to that, Mr. Bishop was general counsel of Murex S.A. in Paris, France, a developer of software solutions for large financial institutions, from 2002 to 2004. Prior to that, Mr. Bishop held executive-level legal positions at Campus Pipeline, Inc., a developer of a software platform for colleges and universities, and Iomega Corporation, a producer of storage hardware. Prior to that, Mr. Bishop worked as legal counsel for Corning, Incorporated, and prior to that, Mr. Bishop worked for eight years as a commercial litigation associate in Washington, D.C. Mr. Bishop holds a Bachelor of Arts in English literature, a Master of Business Administration and a Juris Doctor from Brigham Young University.
Susan Cashen has served as our Senior Vice President, Marketing, since June 2010. Prior to that, Ms. Cashen managed marketing for our company's energy business unit from 2009 to 2010. Prior to joining our company, Ms. Cashen served as vice president of marketing at MyWaves, a mobile video service, from 2006 to 2009. Prior to that, Ms. Cashen served as the vice president of communications and vice president of marketing at TiVo Inc. from 2000 to 2005. Ms. Cashen holds a Bachelor of Arts in Russian studies from Hamilton College.
Jeff Dungan has served as our Senior Vice President, Business Development, since April 2010, and our Senior Vice President, Supply Chain/Manufacturing, since June 2006. Prior to joining our company, Mr. Dungan held positions of senior director of information technology operations and general and administrative business solutions for BEA Systems, an enterprise infrastructure software products company, from 2001 to 2006. Mr. Dungan holds a Bachelor of Science in computer and electrical engineering from Colorado State University.
99
Rob Born has been a member of our board of directors since June 2011. Mr. Born joined Thomas Weisel Venture Partners in 2001 and is currently managing the fund as a partner. Mr. Born has served on the boards of several private companies in the past. Mr. Born also holds a Bachelor of Arts in English literature from Amherst College and a Master of Business Administration and a Juris Doctor from Duke University.
We believe that Mr. Born is qualified to serve as a director based on his experience as a seasoned investor, a manager of a fund and a current and former director of many companies and his knowledge of the industry in which we operate.
David C. Habiger has served as a member of our board of directors since September 2012. From 2011 to 2012, Mr. Habiger served as chief executive officer of NDS Group Ltd., a provider of video software and content security solutions, and served in that role until shortly prior to the time that the NDS business was acquired by Cisco Systems, Inc. Prior to that, Mr. Habiger served as chief executive officer of Sonic Solutions, Inc., a provider of software for digital media prior to its sale to Rovi Corporation, from 2005 to 2011. Mr. Habiger currently serves as a member of the board of directors of two public companies, RealD, Inc. and Echo Global Logistics, Inc., as well as several private companies. Mr. Habiger holds a Bachelor of Business Administration from St. Norbert College and a Master of Business Administration from the University of Chicago.
We believe that Mr. Habiger is qualified to serve as a director based on his service on other public company boards, his prior executive leadership and his experience in and knowledge of the industry in which we operate.
Len Jordan has been a member of our board of directors since June 2004. Mr. Jordan has served as the managing director of Madrona Venture Group since 2012 and joined Madrona Venture Group in 2010. Additionally, Mr. Jordan has served as a general partner of Frazier Technology Ventures since 2004. Prior to joining Frazier Technology Ventures, Mr. Jordan served as a senior vice president at RealNetworks, Inc. Mr. Jordan currently serves on the boards of several private companies. Mr. Jordan holds Bachelors of Science in finance and economics from the Eccles School of Business at the University of Utah.
We believe that Mr. Jordan is qualified to serve as a director based on his experience as a seasoned investor and a current and former director of many companies and his knowledge of the industry in which we operate.
Christopher B. Paisley has been a member of our board of directors since May 2006. Mr. Paisley served as chief financial officer of 3Com Corporation from 1985 to 2000. Mr. Paisley has served on the board of directors of Volterra Semiconductor Corporation, a semiconductor company, since 2000, Equinix, Inc., a networking company, since 2007, Ambarella Corporation, a semiconductor video processing solutions company, since 2012, Fortinet, Inc., a network security company, since 2012 and a member of its board of directors since 2004, and Bridge Capital Holdings, a holding company for venture capital banking, since 2011. Mr. Paisley served as a director of 3PAR Inc., a utility storage company that was publicly traded prior to its acquisition by Hewlett-Packard Company, from 2006 to 2010, and Electronics for Imaging, Inc., a digital printing company, from 2004 to 2008. Mr. Paisley currently also serves on the boards of several private companies. Mr. Paisley has been the Dean's Executive Professor of Accounting at the Leavey School of Business at Santa Clara University since 2001. Mr. Paisley holds a Bachelor of Arts in business economics from the University of California, Santa Barbara and a Master of Business Administration from the Anderson School at the University of California, Los Angeles.
We believe that Mr. Paisley is qualified to serve as a director based on his service on other public company boards, broad industry expertise, extensive financial leadership experience and insight into SEC reporting and compliance.
100
Scott Petty has served as a member of our board of directors since July 2003. Mr. Petty co-founded vSpring Capital (now Signal Peak Ventures) in 2000 and has been a managing director since its formation. Prior to that, Mr. Petty was chief operating officer and a member of the board of directors of Zuka Juice, Inc., a nutritional products company, from 1996 to 1999. Prior to that, Mr. Petty was a consultant with Bain & Company for seven years. Mr. Petty received a Bachelor of Science in economics from Brigham Young University and a Master of Business Administration from Harvard Business School.
We believe that Mr. Petty is qualified to serve as a director based on his experience as a seasoned investor and a current and former director of many companies and his knowledge of the industry in which we operate.
Steven Vassallo has served as a member of our board of directors since March 2011. Mr. Vassallo joined Foundation Capital in 2007 and has been a general partner since 2011. Prior to that, Mr. Vassallo helped launch Ning, Inc., a consumer Internet service, from 2004 to 2006. Prior to that, Mr. Vassallo was director of engineering at Immersion Corporation, from 1999 to 2002. Mr. Vassallo earned a Bachelor of Science in mechanical engineering from Worcester Polytechnic Institute, a Master of Science in mechanical engineering from Stanford University and a Master of Business Administration from the Stanford Graduate School of Business.
We believe that Mr. Vassallo is qualified to serve as a director based on his experience as a seasoned investor and a current and former director of many companies and his knowledge of the industry in which we operate.
There are no family relationships among any of our directors and/or executive officers.
Board Composition
Our board of directors is currently composed of eight members. Our amended and restated certificate of incorporation and bylaws provide that the number of our directors shall be fixed from time to time by a resolution of the majority of our board of directors. Our amended and restated certificate of incorporation to be effective upon completion of this offering will divide our board of directors into three staggered classes of directors. At each annual meeting of stockholders, a class of directors will be elected for a three-year term to succeed the same class of directors whose terms are then expiring. The terms of the directors will expire upon the election and qualification of successor directors at the annual meeting of stockholders to be held during 2014 for the Class I directors, 2015 for the Class II directors and 2016 for the Class III directors.
- •
- Our Class I directors will be Messrs. Jordan, Petty and Vassallo.
- •
- Our Class II directors will be Messrs. Born and West.
- •
- Our Class III directors will be Messrs. Habiger, Paisley and Plaehn.
The division of our board of directors into three classes with staggered three-year terms may delay or prevent a change of our management or a change of control. See "Description of Capital Stock—Anti-Takeover Effects of Delaware Law and Our Certificate of Incorporation and Bylaws" for a discussion of other anti-takeover provisions found in our amended and restated certificate of incorporation and bylaws.
Director Independence
NASDAQ rules require that independent directors must comprise a majority of a listed company's board of directors within a specified period of the completion of its offering. In addition, these rules require that, subject to specified exceptions, each member of a listed company's audit, compensation and nominating and corporate governance committees be independent. Audit committee members must also satisfy the independence criteria set forth in Rule 10A-3 under the Securities Exchange Act of 1934, as amended. In addition, NASDAQ rules state that a director will only qualify
101
as an "independent director" if, in the opinion of that company's board of directors, that person does not have a relationship that would interfere with the exercise of independent judgment in carrying out the responsibilities of a director.
In order to be considered independent for purposes of Rule 10A-3, a member of an audit committee of a listed company may not, other than in his or her capacity as a member of the audit committee, the board of directors or any other board committee: (1) accept, directly or indirectly, any consulting, advisory or other compensatory fee from the listed company or any of its subsidiaries, or (2) be an affiliated person of the listed company or any of its subsidiaries.
On January 24, 2013, our board of directors undertook a review of its composition, the composition of its committees and the independence of each director. Based upon information requested from and provided by each director concerning his background, employment and affiliations, our board of directors has determined that none of Messrs. Born, Habiger, Jordan, Paisley, Petty or Vassallo, representing six of our eight directors, has a relationship that would interfere with the exercise of independent judgment in carrying out the responsibilities of a director and that each of these directors is "independent" as that term is defined under NASDAQ rules. Our board of directors also determined that Messrs. Born, Paisley and Petty, who comprise our audit committee, Messrs. Habiger, Jordan and Vassallo, who comprise our compensation committee, and Messrs. Born, Habiger and Paisley, who comprise our nominating and corporate governance committee, satisfy the independence standards for those committees established by applicable SEC rules and NASDAQ rules. In making this determination, our board of directors considered the relationships that each non-employee director has with our company and all other facts and circumstances our board of directors deemed relevant in determining their independence, including the beneficial ownership of our capital stock by each non-employee director.
Role of the Board in Risk Oversight
One of the key functions of our board of directors is informed oversight of our risk management process. Our board of directors does not have a standing risk management committee, but rather administers this oversight function directly through the board of directors as a whole, as well as through its standing committees that address risks inherent in their respective areas of oversight. In particular, our board of directors is responsible for monitoring and assessing strategic risk exposure. Our audit committee is responsible for reviewing and discussing our major financial risk exposures and the steps our management has taken to monitor and control these exposures, including guidelines and policies with respect to risk assessment and risk management. Our audit committee also monitors compliance with legal and regulatory requirements, in addition to oversight of the performance of our external audit function. Our nominating and corporate governance committee monitors the effectiveness of our corporate governance guidelines. Our compensation committee reviews and discusses the risks arising from our compensation philosophy and practices applicable to all employees that are reasonably likely to have a materially adverse effect on us.
Board Committees
Our board of directors has an audit committee, a compensation committee and a nominating and corporate governance committee, each of which has the composition and responsibilities described below. The audit committee, compensation committee and nominating and corporate governance committee all operate under charters approved by our board of directors, which will be available on our website upon the closing of this offering. Our board of directors may from time to time establish other committees.
102
Audit Committee. Our audit committee oversees our corporate accounting and financial reporting process and assists the board of directors in monitoring our financial systems and our legal and regulatory compliance. Our audit committee will also:
- •
- Oversee the work of our independent auditors;
- •
- Approve the hiring, discharging and compensation of our independent auditors;
- •
- Approve engagements of the independent auditors to render any audit or permissible non-audit services;
- •
- Review the qualifications and independence of the independent auditors;
- •
- Monitor the rotation of partners of the independent auditors on our engagement team as required by law;
- •
- Review our financial statements and review our critical accounting policies and estimates;
- •
- Review the adequacy and effectiveness of our internal controls; and
- •
- Review and discuss with management and the independent auditors the results of our annual audit and our quarterly financial statements.
The members of our audit committee are Messrs. Born, Paisley and Petty. Mr. Paisley is our audit committee chairperson. Our board of directors has concluded that the composition of our audit committee meets the requirements for independence under, and the functioning of our audit committee complies with, the current requirements of applicable SEC and NASDAQ rules, and that Mr. Paisley is our audit committee financial expert as defined under applicable SEC rules.
Compensation Committee. Our compensation committee oversees our corporate compensation programs. The compensation committee will also:
- •
- Review and approve corporate goals and objectives relevant to compensation of our chief executive officer and other
executive officers;
- •
- Evaluate the performance of our executive officers in light of established goals and objectives;
- •
- Review and recommend compensation of our executive officers based on its evaluations;
- •
- Review and recommend compensation of our directors; and
- •
- Administer the issuance of stock options and other awards under our stock plans.
The members of our compensation committee are Messrs. Habiger, Jordan and Vassallo. Mr. Habiger is the chairperson of our compensation committee. Our board of directors has determined that each member of our compensation committee is independent under the applicable NASDAQ rules and SEC rules and regulations.
Nominating and Corporate Governance Committee. Our nominating and corporate governance committee oversees and assists our board of directors in reviewing and recommending corporate governance policies and nominees for election to our board of directors. The nominating and corporate governance committee will also:
- •
- Evaluate and make recommendations regarding the organization and governance of the board of directors and its committees;
- •
- Assess the performance of members of the board of directors and make recommendations regarding committee and chair
assignments;
- •
- Recommend desired qualifications for board of directors membership and conduct searches for potential members of the board
of directors; and
- •
- Review and make recommendations with regard to our corporate governance guidelines.
103
The members of our nominating and corporate governance committee are Messrs. Born, Habiger and Paisley. Mr. Born is the chairperson of our nominating and corporate governance committee. Our board of directors has determined that each member of our nominating and corporate governance committee is independent under the applicable NASDAQ rules.
Director Compensation
The following table sets forth information concerning compensation paid or accrued for services rendered to us by members of our board of directors for the fiscal year ended December 31, 2012. The table excludes Mr. Plaehn, who is one of our named executive officers, and Mr. West, who is one of our employees, neither of whom received any compensation from us in their role as directors in the fiscal year ended December 31, 2012. The compensation received during 2012 by Mr. Plaehn for his service as an employee is reflected under "Executive Compensation—Summary Compensation Table" below.
Name
|
Option Awards(1) |
Total | |||||
|---|---|---|---|---|---|---|---|
Rob Born |
— | — | |||||
David C. Habiger(2) |
$ | 211,200 | $ | 211,200 | |||
Len Jordan |
— | — | |||||
Thomas R. Kuhn(3) |
— | — | |||||
Christopher B. Paisley(4) |
— | — | |||||
Scott Petty |
— | — | |||||
Steven Vassallo |
— | — | |||||
- (1)
- The
amounts reported in the Option Awards column represent the grant date fair value of the stock options granted to the
non-employee directors during 2012, computed in accordance with ASC Topic 718. The assumptions used in calculating the grant date fair value of the stock options reported in the Option
Awards column are set forth in Note 1 in the notes to our consolidated financial statements included elsewhere in this prospectus. The amounts reported in this column reflect the accounting
cost for these stock-based awards, and do not correspond to the actual economic value that may be received by the non-employee directors from the awards.
- (2)
- As
of December 31, 2012, Mr. Habiger held an option to purchase 23,076 shares of our common stock.
- (3)
- As
of December 31, 2012, Mr. Kuhn held an option to purchase 46,834 shares of our common stock. Mr. Kuhn resigned from
our board of directors effective on February 28, 2013.
- (4)
- As of December 31, 2012, Mr. Paisley held options to purchase 35,193 shares of our common stock.
104
Our policy has been and will continue to be to reimburse our non-employee directors for their travel, lodging and other reasonable expenses incurred in attending meetings of our board of directors and committees of the board of directors. In 2012, we did not maintain any standard fee arrangements for the non-employee members of our board of directors for their service as a director.
In June 2013, our board of directors approved the following annual cash and equity retainers for our non-employee directors based on the recommendation of the compensation committee of our board of directors:
Annual Cash Retainers
| |
Cash Retainer | |||
|---|---|---|---|---|
Non-Employee Directors |
$ | 36,000 | ||
Board of Directors Chairperson |
24,000 | |||
Audit Committee Chairperson |
22,000 | |||
Audit Committee Non-Chairperson Member |
12,000 | |||
Compensation Committee Chairperson |
12,000 | |||
Compensation Committee Non-Chairperson Member |
6,000 | |||
Nominating and Corporate Governance Committee Chairperson |
9,000 | |||
Nominating and Corporate Governance Committee Non-Chairperson Member |
6,000 | |||
Equity Retainers
| |
Fair Market Value on the Date of Grant of Equity Grants Delivered as |
||||||
|---|---|---|---|---|---|---|---|
| |
Stock Options |
Restricted Stock Units |
|||||
Initial Retainer for Non-Employee Directors, or Initial Grant |
$ | 70,000 | $ | 70,000 | |||
Annual Retainer for Non-Employee Directors, or Annual Grant |
37,500 | 37,500 | |||||
The Initial Grant will be made to any new non-employee directors added to our board of directors following the completion of this offering. All shares subject to an Initial Grant for a non-employee director will vest annually over three years, provided such non-employee director continues to be a director on each such vesting date.
The Annual Grant will be made to our non-employee directors then serving on our board of directors on the date of the annual meeting of stockholders, beginning with the annual meeting of stockholders to be held in 2014. All shares subject to an Annual Grant for a non-employee director will vest on the one-year anniversary of the grant date, provided such non-employee director continues to be a director on such date.
Directors who are employees do not receive any compensation for their service on our board of directors.
Code of Business Conduct and Ethics
Prior to the completion of this offering, we expect to adopt a code of business conduct and ethics that is applicable to all of our employees, officers and directors including our chief executive officer and senior financial officers, which will be available on our website upon the closing of this offering.
Compensation Committee Interlocks and Insider Participation
During 2012, our compensation committee was comprised of Messrs. Born, Jordan and Vassallo. None of the members of our compensation committee is an officer or employee of our company. None of our executive officers currently serves, or in the past year has served, as a member of the board of directors or compensation committee of any entity that has one or more executive officers serving on our board of directors or compensation committee.
105
The following table provides information regarding the compensation of our principal executive officer and each of the named executive officers as required by Item 402(m)(2) of Regulation S-K during our fiscal year ended December 31, 2012.
Name and Principal Position
|
Year | Salary | Non-Equity Incentive Plan Compensation(1) |
Option Awards(2) |
All Other Compensation |
Total | |||||||||||||
|---|---|---|---|---|---|---|---|---|---|---|---|---|---|---|---|---|---|---|---|
Martin Plaehn |
2012 | $ | 360,000 | $ | 25,571 | $ | — | $ | — | $ | 385,571 | ||||||||
Eric Anderson |
2012 |
123,000 |
(3) |
— |
1,530,000 |
(4) |
3,025 |
(5) |
1,656,025 |
||||||||||
Jeff Dungan |
2012 |
200,000 |
(6) |
15,271 |
176,000 |
(7) |
— |
391,271 |
|||||||||||
- (1)
- Amounts
represent cash bonuses earned in 2012 and paid in 2013, based on the achievement of company performance objectives and other criteria
deemed important by our board of directors. Our 2012 company performance objectives were related to the attainment of revenue, gross margin and net income targets.
- (2)
- The
amounts reported in the Option Awards column represent the grant date fair value of the stock options granted to our named executive
officers during 2012 as computed in accordance with ASC Topic 718. The assumptions used in calculating the grant date fair value of the stock options reported in the Option Awards column are
set forth in Note 7 in the notes to our consolidated financial statements included elsewhere in this prospectus. Note that the amounts reported in this column reflect the accounting cost for
these stock options, and do not correspond to the actual economic value that may be received by the named executive officers from the options.
- (3)
- Mr. Anderson
joined us as our Senior Vice President, Products in June 2012 and received a prorated base salary based on an annual base
salary of $240,000. In June 2013, Mr. Anderson's base salary was increased to $250,000 effective July 1, 2013.
- (4)
- Represents
an option to purchase 173,076 shares of our common stock. The shares underlying this option vest as follows: 25% of the shares
underlying the option vest on June 27, 2013 and the remaining 75% of the shares vest in equal monthly installments over the next three years.
- (5)
- Represents
value of beta equipment provided to Mr. Anderson in 2012.
- (6)
- In
June 2013, Mr. Dungan's base salary was increased to $230,000 effective July 1, 2013.
- (7)
- Represents an option to purchase 19,230 shares of our common stock. The shares underlying this option vest as follows: 25% of the shares underlying the option vest on September 28, 2013 and the remaining 75% of the shares vest in equal monthly installments over the next three years.
106
Benefits
We provide the following benefits to our named executive officers, generally on the same basis provided to all of our employees:
- •
- Medical, dental and vision insurance;
- •
- 401(k) plan (see "Employee Benefit Plans—Retirement Plans" below for a description of our 401(k) plan);
- •
- Employee assistance program;
- •
- Short- and long-term disability, life insurance, accidental death and dismemberment insurance; and
- •
- Health and dependent care flexible spending accounts.
We also allow our vice presidents and officers, including our named executive officers, to receive our beta equipment at no cost up to certain annual limits.
Employment Agreements and Change of Control Arrangements
We have executed offer letters with each of our named executive officers, which are summarized below.
Mr. Plaehn
We entered into an offer letter with Mr. Plaehn on August 20, 2011. Currently, Mr. Plaehn is entitled to receive $360,000 in annual base salary and is eligible for an incentive bonus of up to $126,000, based upon criteria established by our board of directors in its sole discretion. Mr. Plaehn is also eligible to participate in all employee benefit plans and vacation programs. For information relating to potential payments upon termination under Mr. Plaehn's offer letter, see "Potential Payments upon Termination or Change of Control."
Mr. Anderson
We entered into an offer letter with Mr. Anderson on August 14, 2012. Currently, Mr. Anderson is entitled to receive $250,000 in annual base salary and, if our board of directors determines that our company has achieved requisite development, revenue and/or profitability milestones, Mr. Anderson may be entitled to receive an annual incentive bonus of up to $84,000. Mr. Anderson is also eligible to participate in all company employee benefit plans and vacation programs.
Mr. Dungan
We entered into an offer letter with Mr. Dungan on August 1, 2006. Currently Mr. Dungan is entitled to receive $230,000 in annual base salary and, if our board of directors determines that our company has achieved requisite development, revenue and/or profitability milestones, Mr. Dungan may be entitled to receive an annual incentive bonus of up to $78,750. Mr. Dungan is also eligible to participate in all company employee benefit plans and vacation programs.
Compensation Risk Assessment
We believe that our executive compensation program does not encourage excessive or unnecessary risk taking. This is primarily due to the fact that our compensation programs are designed to encourage our executive officers and other employees to remain focused on both short-term and long-term strategic goals, in particular in connection with our pay-for-performance compensation
107
philosophy. As a result, we do not believe that our compensation programs are reasonably likely to have a material adverse effect on our company.
Potential Payments upon Termination or Change of Control
Our compensation committee provides our executive officers with financial protection in the event of certain terminations of employment when it determines that such protection is necessary to attract or retain that executive. Under the terms of his offer letter, Mr. Plaehn is entitled to receive severance payments and benefits upon the occurrence of certain events, as set forth in his offer letter.
In the event that Mr. Plaehn's employment is terminated by our company without Cause or by him for Good Reason, he will be entitled to receive the continued payment of his base salary for six months (provided that if such termination occurs within 90 days prior to or 12 months after a Change of Control, he will be entitled to receive such continued payment for 12 months), continued medical, dental and vision coverage for him and his dependents for 12 months, and earned but unpaid salary, bonuses and unreimbursed business expenses. In addition, if such termination occurs within 90 days prior to or within 12 months after a Change of Control, Mr. Plaehn is entitled to accelerated vesting of 100% of the his unvested options to purchase shares of our common stock initially granted to him upon the commencement of his employment with us, as well as the greater of: (1) 50% of the then unvested portion of the second option to purchase shares of our common stock granted to him; and (2) 25% of the total number of shares of common stock subject to such stock option.
In addition, in the event Mr. Plaehn's employment with us is terminated by us without Cause or by Mr. Plaehn for Good Reason within 90 days prior to or within 12 months after a Change of Control, then 100% of the then unvested shares subject to the option granted to Mr. Plaehn on June 11, 2013 will vest and become exercisable.
"Cause" means: (1) an employee's repeated failure, in the reasonable judgment of our board of directors, to perform one or more of his essential duties and responsibilities to our company after written notice thereof from our board of directors to the employee describing the employee's failure to perform such duties or responsibilities and, if such failure is remediable, his failure to remedy same within 10 days of receiving written notice; (2) an employee's refusal or failure to comply with the legal directives of our board of directors after written notice thereof from our board of directors to the employee describing the employee's failure to comply and, if such failure is remediable, his failure to remedy same within 10 days of receiving written notice; (3) an employee's material violation of any policy of our company; (4) an employee's commission or conviction of, or entry of a plea of nolo contendere to, any felony or any act of fraud, embezzlement, dishonesty, moral turpitude, misappropriation or any other misconduct that has caused or is reasonably expected to result in material injury to our company or its affiliates; (5) an employee's unauthorized use or disclosure of any proprietary information or trade secrets of our company or any other party to whom he owes an obligation of nondisclosure as a result of his relationship with our company; (6) an employee's material breach of any of his obligations under any written agreement or covenant with our company; or (7) an employee's violation of a federal or state law or regulation applicable to our company which violation was or is reasonably likely to be injurious to our company.
"Good Reason" means that the employee's continuous status as an employee was "constructively terminated" by our company if within 90 days after the occurrence of one of the following actions by our company (unless the employee consents in writing to such action(s)), and after providing us with a reasonable opportunity to cure such action(s), the employee resigns in writing from his employment with us: (l) a material reduction in the employee's base salary as in effect immediately before such reduction; or (2) the relocation by us of the employee's then-current work site that has the effect of increasing the employee's then-current commute by more than 50 miles (not including any
108
regular business travel consistent with the business travel requirements of the employee's position with us).
"Change of Control" means our company's sale of all or substantially of its assets or property, our company's exclusive license of all or substantially all of its intellectual property, the acquisition of our company by another entity in which we are a party and pursuant to which our stockholders immediately prior to such transaction hold less than 50% of the voting power of the surviving or resulting entity.
Except as described above, there are currently no severance agreements or arrangements in place for Messrs. Plaehn, Anderson and Dungan.
Outstanding Equity Awards at Fiscal Year-End
The following table presents certain information concerning equity awards held by our named executive officers as of December 31, 2012.
| |
Option Awards | |||||||||||||||
|---|---|---|---|---|---|---|---|---|---|---|---|---|---|---|---|---|
| |
Number of Securities Underlying Unexercised Options |
|
|
|
||||||||||||
| |
Option Exercise Price |
Vesting Start Date |
Option Expiration Date |
|||||||||||||
Name
|
Exercisable | Unexercisable | ||||||||||||||
Martin Plaehn |
188,831 | 415,429 | (1) | $ | 6.14 | 9/29/2011 | 9/28/2021 | |||||||||
|
33,570 | 92,317 | (2) | 6.14 | 9/29/2011 | 9/28/2021 | ||||||||||
Eric Anderson |
— | 173,076 | (3) | 8.84 | 6/27/2012 | 6/29/2022 | ||||||||||
Jeff Dungan |
48,076 | — | (4) | 2.50 | 8/14/2006 | 9/20/2016 | ||||||||||
|
4,807 | — | (5) | 3.59 | 12/11/2007 | 12/10/2017 | ||||||||||
|
4,807 | — | (6) | 4.89 | 12/19/2008 | 12/18/2018 | ||||||||||
|
7,011 | 2,604 | (7) | 4.89 | 1/1/2010 | 1/14/2020 | ||||||||||
|
24,838 | 13,622 | (8) | 7.49 | 5/30/2010 | 7/8/2020 | ||||||||||
|
4,607 | 5,008 | (9) | 6.14 | 1/1/2011 | 5/25/2021 | ||||||||||
|
1,201 | 3,606 | (10) | 6.34 | 12/21/2011 | 12/28/2021 | ||||||||||
|
— | 19,230 | (11) | 9.15 | 9/28/2012 | 9/27/2022 | ||||||||||
- (1)
- The
shares underlying the option vest as follows: 25% of the shares underlying the option vested on September 29, 2012 and the
remaining 75% of the shares vest in equal monthly installments over the following three years. If Mr. Plaehn's employment is terminated by our company without Cause (as defined in his offer
letter) or by Mr. Plaehn for Good Reason (as defined in his offer letter) within 90 days prior to or 12 months after a Change of Control (as defined in his offer letter), 100% of
the unvested shares underlying this option will immediately vest and become exercisable.
- (2)
- The
shares underlying this option vest as follows: provided that certain annual milestones agreed upon by Mr. Plaehn and our board of
directors are achieved, then 25% of the shares underlying the option vest on September 29, 2012 and the remaining 75% of the shares vest in equal monthly installments over the following three
years. If Mr. Plaehn's employment is terminated by the Company without Cause or by Mr. Plaehn for Good Reason within 90 days prior to or 12 months after a Change of
Control, the greater of: (1) 50% of the unvested shares underlying this option; and (2) 25% of the total number of shares of underlying this option shall immediately vest and become
exercisable.
- (3)
- The shares underlying this option vest as follows: 25% of the shares underlying the option vest on June 27, 2013 and the remaining 75% of the shares vest in equal monthly installments over the following three years.
109
- (4)
- The
shares underlying this option vested as follows: 25% of the shares underlying the option vested on August 14, 2007 and the
remaining 75% of the shares vested in equal monthly installments over the following three years.
- (5)
- The
shares underlying this option vested as follows: 25% of the shares underlying the option vested on December 11, 2008 and the
remaining 75% of the shares vested in equal monthly installments over the following three years.
- (6)
- The
shares underlying this option vested as follows: 25% of the shares underlying the option vested on December 19, 2009 and the
remaining 75% of the shares vested in equal monthly installments over the following three years.
- (7)
- The
shares underlying this option vest as follows: 25% of the shares underlying the option vested on January 1, 2011 and the remaining
75% of the shares vest in equal monthly installments over the following three years.
- (8)
- The
shares underlying this option vest as follows: 25% of the shares underlying the option vested on May 30, 2011 and the remaining
75% of the shares vest in equal monthly installments over the following three years.
- (9)
- The
shares underlying this option vest as follows: 25% of the shares underlying the option vested on January 1, 2012 and the remaining
75% of the shares vest in equal monthly installments over the following three years.
- (10)
- The
shares underlying this option vest as follows: 25% of the shares underlying the option vested on December 21, 2012 and the
remaining 75% of the shares vest in equal monthly installments over the following three years.
- (11)
- The shares underlying this option vest as follows: 25% of the shares underlying the option vest on September 28, 2013 and the remaining 75% of the shares vest in equal monthly installments over the following three years.
On June 11, 2013, Martin Plaehn, our President and Chief Executive Officer, was granted an option to purchase 96,153 shares of our common stock at an exercise price per share of $11.28. This option was granted pursuant to our 2003 Equity Incentive Plan and is scheduled to vest, subject to Mr. Plaehn's continued role as a service provider to us, as to 25% of the total shares on September 29, 2016, with 1/48th of the total shares vesting monthly thereafter.
Employee Benefit Plans
2013 Stock Option and Incentive Plan
In June 2013, our board of directors, upon the recommendation of the compensation committee of the board of directors, adopted our 2013 Stock Option and Incentive Plan, or the 2013 Plan, which was subsequently approved by our stockholders. The 2013 Plan will replace the 2003 Equity Incentive Plan, or the 2003 Plan, as our board of directors has determined not to make additional awards under that plan following the consummation of our initial public offering. Our 2013 Plan provides flexibility to our compensation committee to use various equity-based incentive awards as compensation tools to motivate our workforce.
We have initially reserved 2,200,000 shares of our common stock for the issuance of awards under the 2013 Plan. The 2013 Plan provides that the number of shares reserved and available for issuance under the plan will automatically increase each January 1, beginning on January 1, 2014, by 5% of the outstanding number of shares of our common stock on the immediately preceding December 31 or such lesser number of shares as determined by our compensation committee. This
110
number is subject to adjustment in the event of a stock split, stock dividend or other change in our capitalization.
The shares we issue under the 2013 Plan will be authorized but unissued shares or shares that we reacquire. The shares of common stock underlying any awards that are forfeited, cancelled, held back upon exercise or settlement of an award to satisfy the exercise price or tax withholding, reacquired by us prior to vesting, satisfied without any issuance of stock, expire or are otherwise terminated (other than by exercise) under the 2013 Plan and 2003 Plan are added back to the shares of common stock available for issuance under the 2013 Plan.
The 2013 Plan is administered by our compensation committee. Our compensation committee has full power to select, from among the individuals eligible for awards, the individuals to whom awards will be granted, to make any combination of awards to participants, and to determine the specific terms and conditions of each award, subject to the provisions of the 2013 Plan. Persons eligible to participate in the 2013 Plan will be those full or part-time officers, employees, non-employee directors and other key persons (including consultants and prospective employees) as selected from time to time by our compensation committee in its discretion.
The 2013 Plan permits the granting of both options to purchase common stock intended to qualify as incentive stock options under Section 422 of the Code and options that do not so qualify. The option exercise price of each option will be determined by our compensation committee but may not be less than 100% of the fair market value of our common stock on the date of grant. The term of each option will be fixed by our compensation committee and may not exceed 10 years from the date of grant. Our compensation committee will determine at what time or times each option may be exercised.
Our compensation committee may award stock appreciation rights subject to such conditions and restrictions as we may determine. Stock appreciation rights entitle the recipient to shares of common stock, or cash, equal to the value of the appreciation in our stock price over the exercise price. The exercise price is the fair market value of the common stock on the date of grant.
Our compensation committee may award restricted shares of common stock and restricted stock units to participants subject to such conditions and restrictions as we may determine. These conditions and restrictions may include the achievement of certain performance goals and/or continued employment with us through a specified vesting period. Our compensation committee may also grant shares of common stock that are free from any restrictions under the 2013 Plan. Unrestricted stock may be granted to participants in recognition of past services or other valid consideration and may be issued in lieu of cash compensation due to such participant.
Our compensation committee may grant performance share awards to participants that entitle the recipient to receive shares of common stock upon the achievement of certain performance goals and such other conditions as our compensation committee shall determine.
Our compensation committee may grant cash bonuses under the 2013 Plan to participants, subject to the achievement of certain performance goals.
Our compensation committee may grant awards of restricted stock, restricted stock units, performance shares or cash-based awards under the 2013 Plan that are intended to qualify as "performance-based compensation" under Section 162(m) of the Code. Those awards would only vest or become payable upon the attainment of performance goals that are established by our compensation committee and related to one or more performance criteria. The performance criteria that would be used with respect to any such awards include: earnings before interest, taxes, depreciation and amortization, net income (loss) (either before or after interest, taxes, depreciation and/or amortization), changes in the market price of our common stock, economic value-added, funds from operations or similar measure, sales or revenue, acquisitions or strategic transactions, operating income (loss), cash
111
flow (including, but not limited to, operating cash flow and free cash flow), return on capital, assets, equity, or investment, stockholder returns, return on sales, gross or net profit levels, productivity, expense, margins, operating efficiency, customer satisfaction, working capital, earnings (loss) per share of stock, sales or market shares and number of customers, any of which may be measured either in absolute terms or as compared to any incremental increase or as compared to results of a peer group. From and after the time that we become subject to Section 162(m) of the Code, the maximum award that is intended to qualify as "performance-based compensation" under Section 162(m) of the Code that may be made to any one employee during any one calendar year period is 10,000,000 shares of common stock with respect to a stock-based award and $5,000,000 with respect to a cash-based award.
The 2013 Plan provides that in the case of, and subject to, the consummation of a "sale event" as defined in the 2013 Plan, all outstanding awards will be assumed, substituted or otherwise continued by the successor entity. To the extent that the successor entity does not assume, substitute or otherwise continue such awards, then (i) all stock options and stock appreciation rights will automatically become fully exercisable and the restrictions and conditions on all other awards with time-based conditions will automatically be deemed waived, and awards with conditions and restrictions relating to the attainment of performance goals may become vested and non-forfeitable in connection with a sale event in the compensation committee's discretion and (ii) upon the effectiveness of the sale event, all stock options and stock appreciation rights will automatically terminate. In the event of such termination, individuals holding options and stock appreciation rights will be permitted to exercise such options and stock appreciation rights prior to the sale event. In addition, in connection with a sale event, we may make or provide for a cash payment to participants holding options and stock appreciation rights equal to the difference between the per share cash consideration payable to stockholders in the sale event and the exercise price of the options or stock appreciation rights.
Our board of directors may amend or discontinue the 2013 Plan and our compensation committee may amend or cancel outstanding awards for purposes of satisfying changes in law or any other lawful purpose, but no such action may adversely affect rights under an award without the holder's consent. Certain amendments to the 2013 Plan require the approval of our stockholders.
No awards may be granted under the 2013 Plan after the date that is 10 years from the date of stockholder approval. No awards under the 2013 Plan have been made prior to the date hereof.
2003 Equity Incentive Plan
Our 2003 Equity Incentive Plan, or the 2003 Plan, was adopted by our board of directors and subsequently approved by our stockholders. We have reserved 6,438,575 shares of our common stock for issuance under the 2003 Plan. This number is subject to adjustment in the event of a stock split, stock dividend or other changes in our capitalization. Following the completion of this offering, any shares of common stock underlying any awards that are forfeited, cancelled, held back upon exercise or settlement of an award to satisfy the exercise price or tax withholding, reacquired by us prior to vesting, satisfied without any issuance of stock, expire or are otherwise terminated (other than by exercise) under the 2003 Plan will be added to the shares of common stock available for issuance under the 2013 Plan.
The 2003 Plan is administered by our board of directors. Our board of directors has the authority to delegate full power and authority to one or more committees of the board, to select the individuals to whom awards will be granted, to make any combination of awards to participants, to accelerate the exercisability or vesting of any award, to provide substitute awards and to determine the specific terms and conditions of each award.
The 2003 Plan permits us to make grants of incentive stock options, non-qualified stock options, stock appreciation rights, restricted stock units, shares of restricted stock or a direct award shares of stock to officers, employees, directors, consultants or other person providing us with services.
112
Upon a "Company Transaction" (as defined in the 2003 Plan) in which all awards are not assumed, substituted with awards issued by the successor entity, or substituted with cash consideration, the 2003 Plan and awards issued thereunder will be subject to accelerated vesting and, in the case of stock options, full exercisability, followed by the cancellation of such awards. For awards other than restricted stock, if the awards are assumed or substituted and the holder thereof is terminated without "cause" (as defined in the 2003 Plan) or resigns for "good reason" (as defined in the 2003 Plan) within six months of the sale event, then 50% of the unvested portion of such awards shall vest.
All stock option awards that are granted to employees are covered by a stock option agreement and vest in accordance with the vesting schedule set forth in such stock option agreement. Our board of directors may accelerate the vesting schedule in its discretion. We have not engaged in any option repricing or other modification to any of the outstanding equity awards.
Our board of directors has determined not to grant any further awards under the 2003 Plan after the completion of this offering. Following the completion of this initial public offering, we expect to make future awards under the 2013 Plan.
Retirement Plans
We maintain a tax-qualified 401(k) retirement plan for all employees who satisfy certain eligibility requirements. Under our 401(k) plan, employees may elect to defer up to 100% of their eligible compensation subject to applicable annual limits set pursuant to the Internal Revenue Code of 1986, as amended, or the Code. We may provide a discretionary employee matching contribution and discretionary profit sharing contribution under the 401(k) plan. We intend for the 401(k) plan to qualify, depending on the employee's election, under Section 401(a) of the Code so that contributions by employees, and income earned on those contributions, are not taxable to employees until withdrawn from the 401(k) plan.
Limitation on Liability and Indemnification Matters
Our amended and restated certificate of incorporation and bylaws that will become effective upon the completion of this offering contain provisions that limit the personal liability of our directors for monetary damages to the fullest extent permitted by Delaware law. Consequently, our directors will not be personally liable to us or our stockholders for monetary damages for any breach of fiduciary duties as directors, except liability for:
- •
- Any breach of the director's duty of loyalty to us or our stockholders;
- •
- Any act or omission not in good faith or that involves intentional misconduct or a knowing violation of law;
- •
- Unlawful payments of dividends or unlawful stock repurchases or redemptions as provided in Section 174 of the
Delaware General Corporation Law; or
- •
- Any transaction from which the director derived an improper personal benefit.
Our amended and restated certificate of incorporation and bylaws, each of which will become effective upon the completion of this offering, provide that we indemnify our directors and officers to the fullest extent permitted by Delaware law. Our amended and restated bylaws, that will become effective upon the completion of this offering, also provide that we shall advance expenses incurred by a director or officer in advance of the final disposition of any action or proceeding, and permit us to secure insurance on behalf of any officer, director, employee or other agent for any liability arising out of his or her actions in that capacity, regardless of whether we would otherwise be permitted to indemnify him or her under the provisions of Delaware law. We have entered and expect to continue to enter into agreements to indemnify our directors, executive officers and other employees as determined
113
by the board of directors. With certain exceptions, these agreements provide for indemnification for related expenses including, among others, attorneys' fees, judgments, fines and settlement amounts incurred by any of these individuals in any action or proceeding. We believe that these bylaw provisions and indemnification agreements are necessary to attract and retain qualified persons as directors and officers. We also maintain directors' and officers' liability insurance.
The limitation of liability and indemnification provisions in our amended and restated certificate of incorporation and bylaws, that will become effective upon the completion of this offering, may discourage stockholders from bringing a lawsuit against our directors for breach of their fiduciary duty of care. They may also reduce the likelihood of derivative litigation against our directors and officers, even though an action, if successful, might benefit us and other stockholders. Further, a stockholder's investment may be adversely affected to the extent that we pay the costs of settlement and damage awards against directors and officers. At present, there is no pending litigation or proceeding involving any of our directors, officers or employees for which indemnification is sought, and we are not aware of any threatened litigation that may result in claims for indemnification.
114
CERTAIN RELATIONSHIPS AND RELATED PARTY TRANSACTIONS
In addition to the director and executive compensation arrangements discussed above in "Management" and "Executive Compensation," we have been a party to the following transactions since January 1, 2010, in which the amount involved exceeded or will exceed $120,000, and in which any director, executive officer or holder of more than 5% of any class of our voting stock, or any member of the immediate family of or entities affiliated with any of them, had or will have a material interest. We also describe below certain transactions and series of similar transactions since January 1, 2010 with our directors, executive officers, holders of more than 5% of any class of our voting securities, or any member of the immediate family of or any entities affiliated with any of the foregoing persons to which we are party.
We have adopted a written policy, effective upon the completion of this offering, which provides that our executive officers, directors, holders of more than 5% of any class of our voting securities, and any member of the immediate family of and any entity affiliated with any of the foregoing persons, are not permitted to enter into a related party transaction with us without the prior consent of our audit committee, or other independent members of our board of directors in the case it is inappropriate for our audit committee to review such transaction due to a conflict of interest. Pursuant to such policy, any request for us to enter into a transaction with an executive officer, director, principal stockholder, or any of their immediate family members or affiliates, in which the amount involved exceeds $120,000 must first be presented to our audit committee for review, consideration and approval. In approving or rejecting any such proposal, our audit committee is to consider the relevant facts and circumstances available and deemed relevant to the audit committee, including, but not limited to, whether the transaction is on terms no less favorable than terms generally available to an unaffiliated third party under the same or similar circumstances and the extent of the related party's interest in the transaction. All of the transactions described below were entered into prior to the adoption of this policy.
Sales of Series H Preferred Stock
In January and February 2011, we issued and sold an aggregate of 2,014,641 shares of our Series H Preferred Stock at a per share price of $9.93, for an aggregate consideration of approximately $20.0 million. We believe that the terms obtained and consideration received in connection with the Series H financing are comparable to terms available and the amounts we would have received in an arm's length transaction.
The table below summarizes purchases of shares of our Series H Preferred Stock by our directors, executive officers, holders of more than 5% of any class of our voting securities, or any member of the immediate family of or any entities affiliated with any of the foregoing persons. Upon the issuance of our Series H Preferred Stock, Cisco Systems, Inc., or Cisco, became a beneficial owner of more than 5% of our Series H Preferred Stock. Each outstanding share of our Series H Preferred Stock will be converted into one share of our common stock upon the completion of this offering.
Purchasers
|
Shares of Series H Preferred Stock |
Aggregate Purchase Price |
|||||
|---|---|---|---|---|---|---|---|
Cisco Systems, Inc. |
1,510,981 | $ | 15,000,000 | ||||
Warrants
In January and February 2011, we issued warrants to purchase an aggregate of 470,082 shares of our common stock at an exercise price of $9.93 per share to Cisco. For a detailed description of these warrants, see "Description of Capital Stock—Warrants".
115
Transactions with Our Significant Stockholders
In January 2011, we entered into an OEM-in hardware (with software) purchase and license agreement with Cisco, which was amended and restated in February 2011 and further amended in June 2012. Our agreement with Cisco expires in February 2014, after which such agreement automatically renews for one-year terms unless either party receives notice of non-renewal at least 120 days prior to the expiration of the then-current term. Such notice of non-renewal by either party initiates a notice period, or Notice Period, in which the parties have agreed to define a mutually operable transition plan, which may include a new agreement. In addition, (i) either party may terminate the agreement immediately upon the bankruptcy or insolvency of the other party, (ii) either party may terminate the agreement for cause upon written notice of a material breach and if the other party does not cure such breach within 30 days of such notice, (iii) Cisco may terminate the agreement upon a change of control of our company, or (iv) we may terminate the agreement in certain situations if Cisco invests in a company that competes with our business, subject to applicable notice periods. In June 2013, we triggered the Notice Period with Cisco which will provide sufficient time to define an agreement for future periods. Although the parties intend to enter into a new agreement that would revise and optimize the current Control4 and Cisco collaboration, innovation and channel capabilities, there can be no assurance that such a revised agreement will be reached.
We have received revenues totaling approximately $477,538, $2,597,999 and $404,026 for the years ended December 31, 2011 and 2012 and the three months ended March 31, 2013, respectively, in connection with our commercial arrangements with Cisco. Our accounts receivable totaled approximately $51,106, $1,024,374 and $172,457 as of December 31, 2011 and 2012 and the three months ended March 31, 2013, respectively, in connection with our commercial arrangements with Cisco.
Investors' Rights Agreement
We have entered into an Eighth Amended and Restated Investors' Rights Agreement, or the Investors' Rights Agreement, with certain of our stockholders, including Christopher B. Paisley, William B. West, one or more entities affiliated with each of Cisco Systems, Frazier Technology Ventures, Foundation Capital, Thomas Weisel Partners and Signal Peak Ventures, and certain other stockholders. The Investors' Rights Agreement provides these and certain other holders of our capital stock certain information rights, a right of purchase in respect of certain issuances of our securities, including in connection with this offering (pursuant to which up to 400,000 shares may be purchased by our existing stockholders under this right; provided however, the managing underwriters of this offering may reduce such number of shares as they deem necessary to complete this offering), and certain registration rights with respect to certain shares of stock held by them. Such rights have been waived by our stockholders in connection with this offering. The right of purchase and the information rights granted to such stockholders will terminate upon the consummation of this offering. The registration rights granted to such stockholders will terminate five years following the consummation of this offering, or earlier under certain circumstances in which such stockholders may sell the shares of stock held by them without registration in compliance with Rule 144 of the Securities Act of 1933, as amended. For more information regarding the registration rights granted under this agreement, see "Description of Capital Stock—Registration Rights."
Employment Agreements
We have entered into agreements containing compensation, termination and change of control provisions, among others, with certain of our executive officers as described under "Executive Compensation—Employment Agreements and Change of Control Arrangements."
116
Advisor Agreement
We entered into an advisor agreement, effective February 28, 2013, with Thomas R. Kuhn, who resigned from our board of directors effective on February 28, 2013. The advisor agreement provides that Mr. Kuhn will provide us with certain strategic consulting and customer relation services through April 2014, or such earlier date if the advisor agreement is terminated pursuant to its terms. Mr. Kuhn's unvested shares subject to outstanding options will continue to vest pursuant to their terms during the period Mr. Kuhn continues to provide services to us pursuant to the advisor agreement.
Indemnification of Officers and Directors
We have also entered into indemnification agreements with each of our directors and executive officers. The indemnification agreements and our certificate of incorporation and bylaws require us to indemnify our directors and executive officers to the fullest extent permitted by Delaware law. See "Executive Compensation—Limitations on Liability and Indemnification Matters."
117
The following table sets forth information regarding beneficial ownership of our common stock as of March 31, 2013 and as adjusted to reflect the shares of common stock to be issued and sold in the offering assuming no exercise of the underwriters' option to purchase additional shares, by:
- •
- Each person or group of affiliated persons known by us to be the beneficial owner of more than 5% of our common stock;
- •
- Each of our named executive officers;
- •
- Each of our directors; and
- •
- All executive officers and directors as a group.
We have determined beneficial ownership in accordance with SEC rules. The information does not necessarily indicate beneficial ownership for any other purpose. Under these rules, the number of shares of common stock deemed outstanding includes shares issuable upon exercise of options and warrants held by the respective person or group which may be exercised or converted within 60 days after March 31, 2013. For purposes of calculating each person's or group's percentage ownership, stock options and warrants exercisable within 60 days after March 31, 2013 are included for that person or group but not the stock options or warrants of any other person or group. Certain options to purchase shares of our common stock included in the table below are early exercisable, and to the extent such shares are unvested as of a given date, such shares will remain subject to a right of repurchase held by us.
Applicable percentage ownership is based on 17,801,035 shares of common stock outstanding as of March 31, 2013, assuming the conversion of all outstanding shares of our preferred stock on a one-for-one basis into 15,293,960 shares of our common stock. For purposes of the table below, we have assumed that 22,094,267 shares of common stock will be outstanding upon completion of this offering.
Unless otherwise indicated and subject to applicable community property laws, to our knowledge, each stockholder named in the following table possesses sole voting and investment power
118
over the shares listed. Unless otherwise noted below, the address of each person listed on the table is c/o Control4 Corporation, 11734 S. Election Road, Salt Lake City, Utah 84020.
| |
Shares Beneficially Owned Prior to the Offering |
Shares Beneficially Owned Following the Offering |
|||||||||||
|---|---|---|---|---|---|---|---|---|---|---|---|---|---|
Name and Address of Beneficial Owner
|
Shares | Percentage | Shares | Percentage | |||||||||
5% Stockholders: |
|||||||||||||
Entities affiliated with Foundation Capital(1) |
5,077,358 | 28.5 | % | 5,077,358 | 23.0 | % | |||||||
Entities affiliated with Thomas Weisel Venture Partners(2) |
2,920,230 | 16.4 | 2,920,230 | 13.2 | |||||||||
Entities affiliated with Signal Peak Ventures(3) |
2,264,751 | 12.7 | 2,264,751 | 10.3 | |||||||||
Frazier Technology Ventures II, L.P.(4) |
2,188,168 | 12.3 | 2,188,168 | 9.9 | |||||||||
Cisco Systems, Inc.(5) |
1,981,063 | 10.8 | 1,981,063 | 8.8 | |||||||||
Named Executive Officers and Directors: |
|||||||||||||
Martin Plaehn(6) |
299,332 | 1.7 | 299,332 | 1.3 | |||||||||
Eric Anderson |
— | — | — | — | |||||||||
Jeff Dungan(7) |
101,857 | * | 101,857 | * | |||||||||
Rob Born(8) |
2,920,230 | 16.4 | 2,920,230 | 13.2 | |||||||||
David C. Habiger(9) |
5,128 | * | 5,128 | * | |||||||||
Len Jordan(10) |
2,188,168 | 12.3 | 2,188,168 | 9.9 | |||||||||
Christopher B. Paisley(11) |
69,407 | * | 69,407 | * | |||||||||
Scott Petty(12) |
2,264,751 | 12.7 | 2,264,751 | 10.3 | |||||||||
Steven Vassallo(13) |
243,016 | 1.4 | 243,016 | 1.1 | |||||||||
William B. West(14) |
627,606 | 3.5 | 627,606 | 2.8 | |||||||||
All executive officers and directors as a group (14 persons)(15) |
9,162,301 | 48.2 | 9,162,301 | 39.3 | |||||||||
- *
- Represents
beneficial ownership of less than 1%.
- (1)
- Consists of (i) 37,559 shares held of record by FC IV Active Advisors Fund, LLC ("FC Active Advisors"); (ii) 40,364 shares held of record by Foundation Capital IV Principals Fund, LLC ("Foundation IV Principals"); (iii) 4,756,419 shares held of record by Foundation Capital IV, L.P. ("Foundation IV"); (iv) 2,684 shares held of record by Foundation Capital VI Principals Fund L.L.C. ("Foundation VI Principals"); and (v) 240,332 shares held of record by Foundation Capital VI, L.P. ("Foundation VI"). Foundation Capital Management Co. IV, LLC ("FC4M") serves as the sole manager of Foundation IV, Foundation IV Principals and FC Active Advisors. William Elmore, Kathryn Gould, Paul Koontz, Mike Schuh, Paul Holland and Warren Weiss are managing members of FC4M. FC4M exercises sole voting and investment power over the shares held by Foundation IV, Foundation IV Principals and FC Active Advisors. As managing members of FC4M, Ms. Gould and Messrs. Elmore, Koontz, Schuh, Holland and Weiss may be deemed to share voting and investment power over the shares held by Foundation IV, Foundation IV Principals and FC Active Advisors. Each of the managing members of FC4M disclaims beneficial ownership of the securities held by Foundation IV, Foundation IV Principals and FC Active Advisors, except to the extent of his or her pecuniary interest therein. Foundation Capital Management Co. VI, LLC ("FC6M") serves as the sole manager of Foundation VI and Foundation VI Principals. William Elmore, Paul Koontz, Mike Schuh, Paul Holland, Richard Redelfs, Ashmeet Sidana, Charles Moldow, Steve Vassallo, one of our directors, and Warren Weiss are managing members of FC6M. FC6M exercises sole voting and investment power over the shares held by Foundation VI and Foundation VI Principals. As managing members of FC6M, Messrs. Elmore, Koontz, Schuh, Holland, Redelfs, Sidana, Moldow, Vassallo and Weiss may be deemed to share voting and investment power
119
over the shares held by Foundation VI and Foundation VI Principals. Each of the managing members of FC6M disclaims beneficial ownership of the reported securities, except to the extent of his pecuniary interest therein. The address for these entities is 250 Middlefield Road, Menlo Park, California 94025.
- (2)
- Consists
of (i) 2,896,199 shares held of record by Thomas Weisel Venture Partners, L.P. ("TWVP") and (ii) 24,031 shares
held of record by Thomas Weisel Venture Partners Employee Fund, L.P. ("TWVP Employee Fund"). Thomas Weisel Venture Partners LLC is the sole general partner of TWVP and Thomas Weisel
Capital Management LLC is the sole general partner of TWVP Employee Fund. Rob Born, one of our directors, is the fund manager for TWVP and TWVP Employee Fund, and may be deemed to have voting
and dispositive power of the shares held by TWVP and TWVP Employee Fund. The address for these entities is Thomas Weisel Venture Partners, One Montgomery Street, 37th Floor, San
Francisco, California 94104.
- (3)
- Consists
of (i) 63,542 shares held of record by vSpring III D, L.P. ("vSpring III D"); (ii) 226,819 shares held of
record by vSpring III, L.P. ("vSpring III"); (iii) 1,256 shares held of record by vSpring Partners III, L.P. ("vSpring Partners"); and (iv) 1,973,134 shares held of record
by vSpring SBIC, L.P. ("vSpring SBIC"). vSpring Management III D, L.L.C. ("vSpring Management III D") is the sole general partner of vSpring III D. vSpring Management III D
exercises sole voting and investment power over the shares held by vSpring III D. Each of Scott Petty, one of our directors, Dinesh Patel, Ron Heinz and Brandon Tidwell is a managing member of
vSpring Management III D and may be deemed to share voting and investment power over the shares held by vSpring III D. vSpring Management III, L.L.C. ("vSpring Management III") is the sole general
partner of vSpring III and vSpring Partners. vSpring Management III exercises sole voting and investment power over the shares held by vSpring III and vSpring Partners. Each of Scott Petty, Dinesh
Patel, Ron Heinz and Brandon Tidwell is a managing member of vSpring Management III and may be deemed to share voting and investment power over the shares held by vSpring III and vSpring Partners.
vSpring SBIC Management, L.L.C. ("vSpring SBIC Management") is the sole general partner of vSpring SBIC. vSpring SBIC Management exercises sole voting and investment power over the shares held by
vSpring SBIC. Each of Scott Petty and Dinesh Patel is a managing member of vSpring SBIC Management and may be deemed to share voting and investment power over the shares held by vSpring SBIC. The
address for these entities is 2795 E. Cottonwood Parkway, Suite 360, Salt Lake City, Utah 84121.
- (4)
- All
shares are held of record by Frazier Technology Ventures II, L.P. ("Frazier"). FTVM II, L.P. ("FTVM") is the sole general
partner of Frazier, and Frazier Technology Management, L.L.C. ("Frazier Tech Management") is the sole general partner of FTVM. Frazier Tech Management exercises sole voting and investment power over
the shares held by Frazier. Each of Scott Darling, Paul Bialek, Frazier Management LLC and Len Jordan, one of our directors, is a managing member of Frazier Tech Management and may be deemed to
share voting and investment power of the shares held by Frazier. The address for Frazier is 601 Union Street, Suite 3200, Seattle, Washington 98101.
- (5)
- Consists
of (i) 1,510,981 shares held of record by Cisco Systems, Inc. ("Cisco") and (ii) warrants to purchase 470,082
shares exercisable within 60 days of March 31, 2013 held of record by Cisco. Cisco has sole voting and dispositive power over these securities. The address for Cisco is 170 West Tasman
Drive, San Jose, California 95134.
- (6)
- Consists
of options to purchase 299,332 shares exercisable within 60 days of March 31, 2013.
- (7)
- Consists of options to purchase 101,857 shares exercisable within 60 days of March 31, 2013.
120
- (8)
- Consists
of the shares held of record by TWVP and TWVP Employee Fund as disclosed in footnote (2) above. Mr. Born is a fund
manager for TWVP and TWVP Employee Fund, and may be deemed to share voting and dispositive power of the shares held by TWVP and TWVP Employee Fund.
- (9)
- Consists
of options to purchase 5,128 shares exercisable within 60 days of March 31, 2013.
- (10)
- Consists
of the shares held of record by Frazier as disclosed in footnote (4) above. Mr. Jordan is a managing member of
Frazier Tech Management and may be deemed to share voting and dispositive power of the shares held by Frazier.
- (11)
- Consists
of (i) 48,079 shares held of record by Mr. Paisley and (ii) options to purchase 21,328 shares exercisable
within 60 days of March 31, 2013.
- (12)
- Consists
of the shares held of record by vSpring III D, vSpring III, vSpring Partners and vSpring SBIC as disclosed in footnote (3)
above. Mr. Petty is a managing member of vSpring Management III D, the sole general partner of vSpring III D, and may be deemed to share voting and investment power over the shares held
by vSpring III D. Mr. Petty is a managing member of vSpring Management III, the sole general partner of vSpring III and vSpring Partners, and may be deemed to share voting and investment power
over the shares held by vSpring III and vSpring Partners. Mr. Petty is a managing member of vSpring SBIC Management, the sole general partner of vSpring SBIC, and may be deemed to share voting
and investment power over the shares held by vSpring SBIC.
- (13)
- Consists
of the shares held of record by Foundation VI Principals and Foundation VI as disclosed in footnote (1) above.
Mr. Vassallo is a managing member of FC6M, the sole general partner of Foundation VI and Foundation VI Principals, and may be deemed to have shared voting and investment power over the shares
held by Foundation VI and Foundation VI Principals. Mr. Vassallo disclaims beneficial ownership of the securities held by Foundation VI and Foundation VI Principals, except to the extent of his
pecuniary interest therein.
- (14)
- Consists
of (i) 273,076 shares held of record by Mr. West and (ii) options to purchase 354,530 shares exercisable
within 60 days of March 31, 2013.
- (15)
- Consists of (i) 7,937,320 shares held of record by our current executive officers and directors and (ii) options to purchase 1,224,981 shares exercisable within 60 days of March 31, 2013.
121
General
The following is a summary of the rights of our common stock and preferred stock and of certain provisions of our amended and restated certificate of incorporation and bylaws, as they will be in effect upon the completion of this offering. For more detailed information, please see our amended and restated certificate of incorporation and bylaws, which are filed as exhibits to the registration statement of which this prospectus is part.
Immediately following the completion of this offering, our authorized capital stock will consist of 525,000,000 shares, all with a par value of $0.0001 per share, of which:
- •
- 500,000,000 shares are designated as common stock; and
- •
- 25,000,000 shares are designated as preferred stock.
The number of authorized shares of our common stock or preferred stock may from time to time be increased or decreased (but not below the number of shares of such class outstanding) by the affirmative vote of the holders of a majority in voting power of our outstanding shares of capital stock such that the number of authorized shares of a class may be increased without the affirmative vote of the holders of such class.
As of March 31, 2013, we had outstanding 18,094,267 shares of common stock held of record by 118 stockholders, assuming (i) the conversion of all outstanding shares of our preferred stock on a one-for-one basis into 15,293,960 shares of common stock and (ii) the issuance of 293,232 shares of common stock, on an as-converted basis, upon the net exercise of warrants to purchase 723,901 shares of capital stock outstanding as of March 31, 2013. Pursuant to the terms of our amended and restated certificate of incorporation, our preferred stock will automatically convert into common stock effective upon the closing of this offering. In addition, as of March 31, 2013, 4,609,466 shares of our common stock were subject to outstanding options and 11,715 shares of our common stock, on an as-converted basis, were issuable upon the exercise of outstanding warrants to purchase preferred stock.
Common Stock
The holders of our common stock are entitled to one vote per share on all matters to be voted on by our stockholders. Subject to preferences that may be applicable to any outstanding shares of preferred stock, holders of common stock are entitled to receive ratably such dividends as may be declared by our board of directors out of funds legally available for that purpose. In the event of our liquidation, dissolution or winding up, the holders of common stock are entitled to share ratably in all assets remaining after the payment of liabilities, subject to the prior distribution rights of preferred stock then outstanding. Holders of common stock have no preemptive, conversion or subscription rights. There are no redemption or sinking fund provisions applicable to the common stock.
Preferred Stock
Upon the closing of this offering, all currently outstanding shares of preferred stock will convert into shares of our common stock on a one-for-one basis, and there will be no shares of preferred stock outstanding.
Though we currently have no plans to issue any shares of preferred stock, upon the closing of this offering and the filing of our amended and restated certificate of incorporation, our board of directors will have the authority, without further action by our stockholders, to designate and issue up to 25,000,000 shares of preferred stock in one or more series. Our board of directors may also designate the rights, preferences and privileges of the holders of each such series of preferred stock, any or all of which may be greater than or senior to those granted to the holders of common stock.
122
Though the actual effect of any such issuance on the rights of the holders of common stock will not be known until such time as our board of directors determines the specific rights of the holders of preferred stock, the potential effects of such an issuance include:
- •
- Diluting the voting power of the holders of common stock;
- •
- Reducing the likelihood that holders of common stock will receive dividend payments;
- •
- Reducing the likelihood that holders of common stock will receive payments in the event of our liquidation, dissolution,
or winding up; and
- •
- Delaying, deterring or preventing a change-in-control or other corporate takeover.
Warrants
The following table sets forth information about outstanding warrants to purchase shares of our capital stock as of March 31, 2013.
Class of Stock
|
Number of Shares of Stock Subject to Warrant |
Exercise Price per Share |
Expiration Date | |||||||
|---|---|---|---|---|---|---|---|---|---|---|
| Common Stock | 402,928 | $ | 9.93 | January 21, 2014 | ||||||
| Common Stock | 67,154 | $ | 9.93 | February 15, 2014 | ||||||
| Series G-1 Preferred Stock | 182,666 | $ | 9.26 | June 24, 2014 | ||||||
| Common Stock | 71,153 | $ | 7.49 | October 25, 2015 | ||||||
| Series C Preferred Stock | 7,325 | $ | 5.50 | December 29, 2015 | ||||||
| Series E Preferred Stock | 4,390 | $ | 11.39 | June 13, 2017 | ||||||
Upon the conversion of all of our preferred stock into common stock immediately prior to the completion of this offering, other than the warrants with expiration dates of January 21, 2014, February 15, 2014, June 24, 2014 and October 25, 2015, which will expire upon the completion of this offering if not previously exercised, each warrant to purchase shares of our preferred stock will be exercisable for an equivalent number of shares of common stock and will remain exercisable until the expiration date of such warrant.
Exclusive Jurisdiction
Unless we consent in writing to the selection of an alternative forum, the Court of Chancery of the State of Delaware will be the sole and exclusive forum for (i) any derivative action or proceeding brought on behalf of us, (ii) any action asserting a claim of breach of a fiduciary duty owed by any of our directors, officers or other employees to Control4 or our stockholders, (iii) any action asserting a claim arising pursuant to any provision of the Delaware General Corporation Law or our certificate of incorporation or bylaws, or (iv) any action asserting a claim against us governed by the internal affairs doctrine. The enforceability of similar choice of forum provisions in other companies' certificates of incorporation has been challenged in legal proceedings, and it is possible that, in connection with any action, a court could find the choice of forum provisions contained in our amended and restated certificate of incorporation to be inapplicable or unenforceable in such action.
Registration Rights
As of March 31, 2013, the holders of an aggregate of 16,130,909 shares of our common stock issued or issuable upon conversion of preferred stock are entitled to the following rights with respect to the registration of such shares for public resale under the Securities Act of 1933, as amended, or the Securities Act, pursuant to an Investors' Rights Agreement by and among us and certain of our stockholders. We refer to these shares collectively as "registrable securities."
123
The registration of shares of common stock as a result of the following rights being exercised would enable the holders to trade these shares without restriction under the Securities Act when the applicable registration statement is declared effective. Ordinarily, we will be required to pay all expenses, other than underwriting discounts and commissions, related to any registration effected pursuant to the exercise of these registration rights.
The registration rights terminate five years after completion of this offering, upon a Deemed Liquidation Event (as defined in our certificate of incorporation) or, with respect to the registration rights of an individual holder, when such holder's registrable securities represent 1% or less of our outstanding common stock and can be sold pursuant to Rule 144 of the Securities Act.
Demand Registration Rights
If at any time after 180 days following this offering the holders of the registrable securities then outstanding request in writing that we effect a registration that has a reasonably anticipated aggregate price to the public of at least $5,000,000, we may be required to register their shares. At most, we are obligated to effect two registrations for the holders of registrable securities in response to these demand registration rights, subject to certain conditions. Depending on certain conditions, however, we may defer such registration for up to 120 days. If the holders requesting registration intend to distribute their shares by means of an underwriting, the managing underwriter of such offering will have the right to limit the number of shares to be underwritten for reasons related to the marketing of the shares.
Piggyback Registration Rights
If at any time after this offering we propose to register any shares of our securities under the Securities Act, the holders of registrable securities will be entitled to notice of the registration and to include their shares of registrable securities in the registration, subject to certain exceptions relating to employee benefit plans and mergers and acquisitions. If our proposed registration involves an underwriting, the managing underwriter of such offering will have the right to limit the number of shares to be underwritten, subject to certain restrictions, for reasons related to the marketing of the shares.
Form S-3 Registration Rights
If at any time after 180 days following this offering we become entitled under the Securities Act to register our shares on Form S-3 and the holders of registrable securities then outstanding request in writing that we register their shares for public resale on Form S-3 with a reasonably anticipated aggregate price to the public of at least $1,000,000, we will be required to use our best efforts to effect such registration; provided, however, that if such registration would be seriously detrimental to us or our stockholders, we may defer the registration for up to 120 days. We are only obligated to effect up to two registrations on Form S-3 in any 12-month period.
Voting Rights
Under the provisions of our amended and restated certificate of incorporation to become effective upon completion of this offering, holders of our common stock are entitled to one vote for each share of common stock held by such holder on any matter submitted to a vote at a meeting of stockholders. Our post-offering amended and restated certificate of incorporation does not provide cumulative voting rights to holders of our common stock.
124
Anti-Takeover Effects of Delaware Law and Our Certificate of Incorporation and Bylaws
Certain provisions of Delaware law and our restated certificate of incorporation and bylaws that will become effective upon completion of this offering contain provisions that could have the effect of delaying, deferring or discouraging another party from acquiring control of us. These provisions, which are summarized below, are expected to discourage certain types of coercive takeover practices and inadequate takeover bids. These provisions are also designed in part to encourage anyone seeking to acquire control of us to first negotiate with our board of directors. We believe that the advantages gained by protecting our ability to negotiate with any unsolicited and potentially unfriendly acquirer outweigh the disadvantages of discouraging such proposals, including those priced above the then-current market value of our common stock, because, among other reasons, the negotiation of such proposals could improve their terms.
Certificate of Incorporation and Bylaws
Our amended and restated certificate of incorporation and bylaws to become effective upon completion of this offering include provisions that:
- •
- Authorize our board of directors to issue, without further action by the stockholders, up to 25,000,000 shares of
undesignated preferred stock;
- •
- Require that any action to be taken by our stockholders be effected at a duly called annual or special meeting and not by
written consent;
- •
- Specify that special meetings of our stockholders can be called only by our board of directors, the Chairman of our board
of directors, the Chief Executive Officer or the President;
- •
- Establish an advance notice procedure for stockholder proposals to be brought before an annual meeting of our
stockholders, including proposed nominations of persons for election to our board of directors;
- •
- Provide that directors may be removed only for cause and only by the affirmative vote of the holders of 75% or more of the
outstanding shares of capital stock then entitled to vote at an election of directors;
- •
- Provide that vacancies on our board of directors may be filled only by a majority of directors then in office, even though
less than a quorum;
- •
- Establish that our board of directors is divided into three classes—Class I, Class II and
Class III—with each class serving staggered terms;
- •
- Require that our bylaws be amended or repealed by the affirmative vote of a majority of directors then in office or the
affirmative vote of at least 75% of the outstanding shares of capital stock entitled to vote on such amendment or repeal, except that if our board of directors recommends that stockholders approve
such amendment or repeal, such amendment or repeal shall only require the affirmative vote of the majority of the outstanding shares of capital stock entitled to vote on such amendment or repeal; and
- •
- Require a super-majority of votes to amend certain of the above-mentioned provisions.
Delaware Anti-Takeover Statute
We are subject to the provisions of Section 203 of the General Corporation Law of the State of Delaware regulating corporate takeovers. In general, Section 203 prohibits a publicly-held Delaware corporation from engaging, under certain circumstances, in a business combination with an interested
125
stockholder for a period of three years following the date the person became an interested stockholder unless:
- •
- Prior to the date of the transaction, the board of directors of the corporation approved either the business combination
or the transaction which resulted in the stockholder becoming an interested stockholder;
- •
- Upon completion of the transaction that resulted in the stockholder becoming an interested stockholder, the interested
stockholder owned at least 85% of the voting stock of the corporation outstanding at the time the transaction commenced, excluding for purposes of determining the voting stock outstanding, but not for
determining the outstanding voting stock owned by the interested stockholder, (1) shares owned by persons who are directors and also officers, and (2) shares owned by employee stock
plans in which employee participants do not have the right to determine confidentially whether shares held subject to the plan will be tendered in a tender or exchange offer; or
- •
- At or subsequent to the date of the transaction, the business combination is approved by the board of directors of the corporation and authorized at an annual or special meeting of stockholders, and not by written consent, by the affirmative vote of at least 66 2/3% of the outstanding voting stock which is not owned by the interested stockholder.
Generally, a business combination includes a merger, asset or stock sale, or other transaction resulting in a financial benefit to the interested stockholder. An interested stockholder is a person who, together with affiliates and associates, owns or, within three years prior to the determination of interested stockholder status, did own 15% or more of a corporation's outstanding voting stock. We expect the existence of this provision to have an anti-takeover effect with respect to transactions our board of directors does not approve in advance. We also anticipate that Section 203 may discourage business combinations or other attempts that might result in a premium over the market price for the shares of common stock held by our stockholders.
The provisions of Delaware law and our restated certificate of incorporation and bylaws to become effective upon completion of this offering could have the effect of discouraging others from attempting hostile takeovers and, as a consequence, may also inhibit temporary fluctuations in the market price of our common stock that often result from actual or rumored hostile takeover attempts. These provisions may also have the effect of preventing changes in our management. It is possible that these provisions could make it more difficult to accomplish transactions that stockholders may otherwise deem to be in their best interests.
Transfer Agent and Registrar
Upon the completion of this offering, the transfer agent and registrar for our common stock will be American Stock Transfer & Trust Company, LLC.
Listing
We have applied to list our common stock for quotation on The NASDAQ Global Market under the trading symbol "CTRL".
126
SHARES ELIGIBLE FOR FUTURE SALE
Before this offering, there has not been a public market for shares of our common stock. Future sales of substantial amounts of shares of our common stock, including shares issued upon the exercise of outstanding options, in the public market after this offering, or the possibility of these sales occurring, could cause the prevailing market price for our common stock to fall or impair our ability to raise equity capital in the future.
Upon the completion of this offering, a total of 22,094,267 shares of common stock will be outstanding, assuming that there are no exercises of options after March 31, 2013. Of these shares, all 4,000,000 shares of common stock sold in this offering by us, plus any shares sold upon exercise of the underwriters' option to purchase additional shares, will be freely tradable in the public market without restriction or further registration under the Securities Act, unless these shares are held by "affiliates," as that term is defined in Rule 144 under the Securities Act.
18,094,267 shares of common stock will be "restricted securities," as that term is defined in Rule 144 under the Securities Act. These restricted securities are eligible for public sale only if they are registered under the Securities Act or if they qualify for an exemption from registration under Rules 144 or 701 under the Securities Act, which are summarized below.
Subject to the lock up agreements described below and the provisions of Rules 144 and 701 under the Securities Act, these restricted securities will be available for sale in the public market as follows:
Date
|
Number of Shares |
|||
|---|---|---|---|---|
On the date of this prospectus |
73,549 | |||
Between 90 and 180 days after the date of this prospectus |
— | |||
At various times beginning more than 180 days after the date of this prospectus |
18,020,718 | |||
In addition, of the 4,609,466 shares of our common stock that were subject to stock options outstanding as of March 31, 2013, options to purchase 2,786,682 shares of common stock were vested as of March 31, 2013 and will be eligible for sale 180 days following the effective date of this offering.
Lock-Up Agreements
We and all of our directors and officers, as well as the other holders of substantially all shares of common stock outstanding immediately prior to this offering, have agreed that, without the prior written consent of Merrill Lynch, Pierce, Fenner & Smith Incorporated and Raymond James & Associates, Inc. on behalf of the underwriters, we and they will not, during the period ending 180 days after the date of this prospectus:
- •
- offer, pledge, sell, contract to sell, sell any option or contract to purchase, purchase any option or contract to sell,
grant any option, right or warrant to purchase, lend or otherwise transfer or dispose of, directly or indirectly, any shares of our common stock or any securities convertible into or exercisable or
exchangeable for shares of our common stock; or
- •
- enter into any swap or other arrangement that transfers to another, in whole or in part, any of the economic consequences of ownership of our common stock;
whether any transaction described above is to be settled by delivery of shares of our common stock or such other securities, in cash or otherwise.
The restrictions described in the immediately preceding paragraph do not apply to the following, provided that (1) Merrill Lynch, Pierce, Fenner & Smith Incorporated and Raymond
127
James & Associates, Inc. receive a signed lock-up agreement for the balance of the lock-up period from each donee, trustee, distributee, or transferee, as the case may be, (2) any such transfer shall not involve a disposition for value, (3) the transfers are not required during the lock-up period to be reported with the Securities and Exchange Commission in accordance with Section 16 of the Securities Exchange Act of 1934, as amended, and (4) the equity holder does not otherwise voluntarily effect any public filing or report regarding such transfers during the lock-up period:
- •
- a bona fide gift or gifts;
- •
- a transfer to any immediate family member of the equity holder or any trust for the direct or indirect benefit of the
equity holder or the immediate family of the equity holder;
- •
- a distribution to limited partners, stockholders, members or other equity holders of the equity holder;
- •
- a transfer to the equity holder's affiliates or to any investment fund or other entity controlled or managed by, or under
common control or managed by, the equity holder;
- •
- a transfer by operation of law, such as pursuant to a qualified domestic order or in connection with a divorce settlement;
or
- •
- a transfer by will or intestate succession upon the death of the equity holder.
Furthermore, an equity holder may (a) sell our shares purchased on the open market following this offering if and only if (i) such sales are not required during the lock-up period to be reported in any public report or filing with the Securities Exchange Commission, or otherwise and (ii) the equity holder does not otherwise voluntarily effect any public filing or report regarding such sales during the lock-up period, (b) exercise any rights to purchase equity securities, so long as the shares received upon such exercise shall remain subject to the terms of the lock-up agreement; and (c) sell shares in connection with a merger or sale of our company or our assets.
Rule 144
In general, under Rule 144 as currently in effect, once we have been subject to public company reporting requirements for at least 90 days, a person who is not deemed to have been one of our affiliates for purposes of the Securities Act at any time during 90 days preceding a sale and who has beneficially owned the shares proposed to be sold for at least six months, including the holding period of any prior owner other than our affiliates, is entitled to sell such shares without complying with the manner of sale, volume limitation or notice provisions of Rule 144, subject to compliance with the public information requirements of Rule 144. If such a person has beneficially owned the shares proposed to be sold for at least one year, including the holding period of any prior owner other than our affiliates, then such person is entitled to sell such shares without complying with any of the requirements of Rule 144.
In general, under Rule 144, as currently in effect, our affiliates or persons selling shares on behalf of our affiliates are entitled to sell upon expiration of the lock-up agreements described above, within any three-month period beginning 90 days after the date of this prospectus, a number of shares that does not exceed the greater of:
- •
-
1% of the number of shares of common stock then outstanding, which will equal approximately 220,943
shares immediately after this offering; or
- •
- The average weekly trading volume of the common stock during the four calendar weeks preceding the filing of a notice on Form 144 with respect to such sale.
128
Sales under Rule 144 by our affiliates or persons selling shares on behalf of our affiliates are also subject to certain manner of sale provisions and notice requirements and to the availability of current public information about us.
Rule 701
Rule 701 generally allows a stockholder who purchased shares of our common stock pursuant to a written compensatory plan or contract and who is not deemed to have been an affiliate of our company during the immediately preceding 90 days to sell these shares in reliance upon Rule 144, but without being required to comply with the public information, holding period, volume limitation, or notice provisions of Rule 144. Rule 701 also permits affiliates of our company to sell their Rule 701 shares under Rule 144 without complying with the holding period requirements of Rule 144. All holders of Rule 701 shares, however, are required to wait until 90 days after the date of this prospectus before selling such shares pursuant to Rule 701.
As of March 31, 2013, 1,290,156 shares of our outstanding common stock had been issued in reliance on Rule 701 as a result of exercises of stock options and stock awards.
Stock Options
We intend to file a registration statement on Form S-8 under the Securities Act covering all of the shares of our common stock subject to options outstanding or reserved for issuance under our stock plans and shares of our common stock issued upon the exercise of options by employees. We expect to file this registration statement as soon as practicable after this offering. In addition, we intend to file a registration statement on Form S-8 or such other form as may be required under the Securities Act for the resale of shares of our common stock issued upon the exercise of options that were not granted under Rule 701. We expect to file this registration statement as soon as permitted under the Securities Act. However, the shares registered on Form S-8 will be subject to volume limitations, manner of sale, notice and public information requirements of Rule 144 and will not be eligible for resale until expiration of the lock up agreements to which they are subject.
Registration Rights
Upon completion of this offering, the holders of an aggregate of 16,130,909 shares of our common stock issued or issuable upon conversion of preferred stock will be entitled to various rights with respect to the registration of these shares under the Securities Act. Registration of these shares under the Securities Act would result in these shares becoming fully tradable without restriction under the Securities Act immediately upon the effectiveness of the registration, except for shares purchased by affiliates. See "Description of Capital Stock—Registration Rights" for additional information.
129
MATERIAL U.S. FEDERAL INCOME AND ESTATE TAX CONSEQUENCES FOR NON-U.S. HOLDERS
The following is a summary of the material U.S. federal income and estate tax considerations relating to the acquisition, ownership and disposition of common stock pursuant to this offering by non-U.S. holders. This summary deals only with common stock held as a capital asset (within the meaning of Section 1221 of the Internal Revenue Code of 1986, as amended, (the "Code")) by such a holder and does not discuss the U.S. federal income and estate tax considerations applicable to a holder that is subject to special treatment under U.S. federal income and estate tax laws, including, but not limited to: a dealer in securities or currencies; a financial institution; a regulated investment company; a real estate investment trust; a tax-exempt organization; an insurance company; a person holding common stock as part of a hedging, integrated, conversion or straddle transaction or a person deemed to sell common stock under the constructive sale provisions of the Code; a trader in securities that has elected the mark-to-market method of accounting; a person liable for alternative minimum tax; an entity that is treated as a partnership or other pass-through entity for U.S. federal income tax purposes; a person that received such common stock in connection with services provided; a U.S. person whose "functional currency" is not the U.S. dollar; a "controlled foreign corporation;" a "passive foreign investment company;" or a U.S. expatriate.
This summary is based upon provisions of the Code, applicable U.S. Treasury regulations promulgated thereunder, published rulings and judicial decisions, all as in effect as of the date hereof. Those authorities may be changed, perhaps retroactively, or may be subject to differing interpretations, which could result in U.S. federal income or estate tax consequences different from those discussed below. This summary does not address all aspects of U.S. federal income and estate tax, does not deal with all tax considerations that may be relevant to stockholders in light of their personal circumstances and does not address the Medicare tax imposed on certain investment income or any state, local, foreign, gift or alternative minimum tax considerations.
For purposes of this discussion, a "U.S. holder" is a beneficial holder of common stock that is: an individual citizen or resident of the United States; a corporation (or any other entity treated as a corporation for U.S. federal income tax purposes) created or organized in or under the laws of the United States, any state thereof or the District of Columbia; an estate the income of which is subject to U.S. federal income taxation regardless of its source; or a trust if it (1) is subject to the primary supervision of a court within the United States and one or more U.S. persons have the authority to control all substantial decisions of the trust or (2) has a valid election in effect under applicable U.S. Treasury regulations to be treated as a U.S. person.
For purposes of this discussion a "non-U.S. holder" is a beneficial holder of common stock that is neither a U.S. holder nor a partnership (or any other entity or arrangement that is treated as a partnership) for U.S. federal income tax purposes. However, neither the term U.S. holder nor the term non-U.S. holder includes any entity or other person that is subject to special treatment under the Code. If a partnership (or an entity or arrangement that is treated as a partnership for U.S. federal income tax purposes) holds common stock, the tax treatment of a partner will generally depend upon the status of the partner and the activities of the partnership. A partner of a partnership holding common stock is urged to consult its own tax advisors.
PROSPECTIVE INVESTORS ARE URGED TO CONSULT THEIR OWN TAX ADVISORS CONCERNING THEIR PARTICULAR U.S. FEDERAL INCOME AND ESTATE TAX CONSEQUENCES IN LIGHT OFTHEIR SPECIFIC SITUATIONS, AS WELL AS THE TAX CONSEQUENCES ARISING UNDER ANY STATE, LOCAL OR NON-U.S. TAX LAWS AND ANY OTHER U.S. FEDERAL TAX LAWS (INCLUDING THE U.S. FEDERAL GIFT TAX LAWS).
130
Distributions on Our Common Stock
Distributions with respect to common stock, if any, generally will constitute dividends for U.S. federal income tax purposes to the extent paid out of current or accumulated earnings and profits, as determined for U.S. federal income tax purposes. Any portion of a distribution in excess of current or accumulated earnings and profits will be treated as a return of capital and will first be applied to reduce the holder's tax basis in its common stock, but not below zero. Any remaining amount will then be treated as gain from the sale or exchange of the common stock and will be treated as described under "—Disposition of our Common Stock" below.
Distributions treated as dividends that are paid to a non-U.S. holder, if any, with respect to shares of our common stock will be subject to U.S. federal withholding tax at a rate of 30% (or lower applicable income tax treaty rate) of the gross amount of the dividends unless the dividends are effectively connected with the non-U.S. holder's conduct of a trade or business in the United States. If a non-U.S. holder is engaged in a trade or business in the United States and dividends with respect to the common stock are effectively connected with the conduct of that trade or business and, if required by an applicable income tax treaty, are attributable to a U.S. permanent establishment maintained by the non-U.S. holder, then although the non-U.S. holder will generally be exempt from the 30% U.S. federal withholding tax, provided certain certification requirements are satisfied, the non-U.S. holder will be subject to U.S. federal income tax on those dividends on a net income basis at regular graduated U.S. federal income tax rates in the same manner as if such holder were a resident of the United States. Any such effectively connected income received by a foreign corporation may, under certain circumstances, be subject to an additional branch profits tax equal to 30% (or lower applicable income tax treaty rate) of its effectively connected earnings and profits for the taxable year, as adjusted under the Code. To claim the exemption from withholding with respect to any such effectively connected income, the non-U.S. holder must generally furnish to us or our paying agent a properly executed IRS Form W-8ECI (or applicable successor form). A non-U.S. holder of shares of common stock who wishes to claim the benefit of an exemption or reduced rate of withholding tax under an applicable treaty must furnish to us or our paying agent a valid IRS Form W-8BEN (or applicable successor form) certifying such holder's qualification for the exemption or reduced rate. If a non-U.S. holder is eligible for a reduced rate of U.S. withholding tax pursuant to an income tax treaty, it may obtain a refund of any excess amounts withheld by filing an appropriate claim for refund with the Internal Revenue Service. Non-U.S. holders are urged to consult their tax advisors regarding their entitlement to benefits under a relevant income tax treaty.
Disposition of Our Common Stock
Non-U.S. holders may recognize gain upon the sale, exchange, redemption or other taxable disposition of common stock. Subject to the discussion below regarding backup withholding and foreign accounts, such gain generally will not be subject to U.S. federal income tax unless: (i) that gain is effectively connected with the non-U.S. holder's conduct of a trade or business in the United States (and, if required by an applicable income tax treaty, is attributable to a U.S. permanent establishment maintained by the non-U.S. holder); (ii) the non-U.S. holder is a nonresident alien individual who is present in the United States for 183 days or more in the taxable year of that disposition, and certain other conditions are met; or (iii) we are or have been a "U.S. real property holding corporation" for U.S. federal income tax purposes at any time during the shorter of the five-year period preceding the date of disposition or the holder's holding period for our common stock, and certain other requirements are met. We believe that we are not and we do not anticipate becoming a "U.S. real property holding corporation" for U.S. federal income tax purposes.
If a non-U.S. holder is an individual described in clause (i) of the preceding paragraph, the non-U.S. holder will generally be subject to tax on a net income basis at the regular graduated U.S. federal individual income tax rates in the same manner as if such holder were a resident of the United
131
States, unless an applicable income tax treaty provides otherwise. If the non-U.S. holder is an individual described in clause (ii) of the preceding paragraph, the non-U.S. holder will generally be subject to a flat 30% tax on the gain, which may be offset by U.S. source capital losses even though the non-U.S. holder is not considered a resident of the United States, provided that the non-U.S. holder has timely filed U.S. federal income tax returns with respect to such losses. If a non-U.S. holder is a foreign corporation that falls under clause (i) of the preceding paragraph, it will be subject to tax on a net income basis at the regular graduated U.S. federal corporate income tax rates in the same manner as if it were a resident of the United States and, in addition, the non-U.S. holder may be subject to the branch profits tax at a rate equal to 30% (or lower applicable income tax treaty rate) of its effectively connected earnings and profits.
Information Reporting and Backup Withholding Tax
We report to our non-U.S. holders and the IRS the amount of dividends paid during each calendar year and the amount of any tax withheld. All distributions to holders of common stock are subject to any applicable withholding. Information reporting requirements apply even if no withholding was required because the distributions were effectively connected with the non-U.S. holder's conduct of a United States trade or business or withholding was reduced or eliminated by an applicable income tax treaty. This information also may be made available under a specific treaty or agreement with the tax authorities in the country in which the non-U.S. holder resides or is established. Under U.S. federal income tax law, interest, dividends and other reportable payments may, under certain circumstances, be subject to "backup withholding" at the then applicable rate. Backup withholding, however, generally will not apply to distributions to a non-U.S. holder of our common stock, provided the non-U.S. holder furnishes to us or our paying agent the required certification as to its non-U.S. status, such as by providing a valid IRS Form W-8BEN or IRS Form W-8ECI, or certain other requirements are met. Notwithstanding the foregoing, backup withholding may apply if either we or our paying agent has actual knowledge, or reason to know, that the holder is a U.S. person that is not an exempt recipient. Backup withholding is not an additional tax but merely an advance payment, which may be refunded to the extent it results in an overpayment of tax and the appropriate information is timely supplied to the IRS.
Foreign Account Tax Compliance Act
New rules in the Code generally will impose withholding taxes on certain types of payments made to "foreign financial institutions" (as specially defined under these rules), including when the foreign financial institution holds our common stock on behalf of a non-U.S. holder, and certain other non-U.S. entities if certification, information reporting and other specified requirements are not met. The legislation potentially imposes a 30% withholding tax on "withholdable payments" if they are paid to a foreign financial institution or to a foreign non-financial entity, unless (i) the foreign financial institution undertakes certain diligence and reporting obligations and other specified requirements are satisfied or (ii) the foreign non-financial entity either certifies it does not have any substantial U.S. owners or furnishes identifying information regarding each substantial U.S. owner and other specified requirements are satisfied. "Withholdable payment" generally means (i) any payment of interest, dividends, rents and certain other types of generally passive income if such payment is from sources within the United States, and (ii) any gross proceeds from the sale or other disposition of any property of a type that can produce interest or dividends from sources within the United States (including, for example, shares of our common stock). If the payee is a foreign financial institution, it generally will be required to enter into an agreement with the U.S. Treasury requiring, among other things, that it undertake to identify accounts held by certain U.S. persons or U.S.-owned foreign entities, annually report certain information about such accounts and withhold 30% on payments to account holders whose actions prevent it from complying with these reporting and other requirements. If an investor does not provide us with the information necessary to comply with the legislation, it is possible that
132
distributions to such investor that are attributable to withholdable payments, such as dividends, will be subject to the 30% withholding tax. Any withholding obligations with respect to dividends on our common stock, will not begin prior to January 1, 2014, and any withholding obligations with respect to gross proceeds from a sale or other disposition of our common stock will not begin prior to January 1, 2017. Prospective investors should consult their own tax advisers regarding this legislation.
Federal Estate Tax
An individual who at the time of death is not a citizen or resident of the United States and who is treated as the owner of, or has made certain lifetime transfers of, an interest in our common stock will be required to include the value thereof in his or her taxable estate for U.S. federal estate tax purposes, and may be subject to U.S. federal estate tax unless an applicable estate tax treaty provides otherwise. The test for whether an individual is a resident of the United States for federal estate tax purposes differs from the test used for U.S. federal income tax purposes. Some individuals, therefore, may be "Non-U.S. Holders" for U.S. federal income tax purposes, but not for U.S. federal estate tax purposes, and vice versa.
133
Merrill Lynch, Pierce, Fenner & Smith Incorporated and Raymond James & Associates, Inc. are acting as representatives of each of the underwriters named below. Subject to the terms and conditions set forth in an underwriting agreement among us and the underwriters, we have agreed to sell to the underwriters, and each of the underwriters has agreed, severally and not jointly, to purchase from us, the number of shares of common stock set forth opposite its name below.
| Underwriter |
Number of Shares |
|||
|---|---|---|---|---|
Merrill Lynch, Pierce, Fenner & Smith |
||||
Raymond James & Associates, Inc. |
||||
Canaccord Genuity Inc. |
||||
Cowen and Company, LLC |
||||
Needham & Company, LLC |
||||
Total |
4,000,000 | |||
Subject to the terms and conditions set forth in the underwriting agreement, the underwriters have agreed, severally and not jointly, to purchase all of the shares sold under the underwriting agreement if any of these shares are purchased. If an underwriter defaults, the underwriting agreement provides that the purchase commitments of the nondefaulting underwriters may be increased or the underwriting agreement may be terminated.
We have agreed to indemnify the underwriters against certain liabilities, including liabilities under the Securities Act, or to contribute to payments the underwriters may be required to make in respect of those liabilities.
The underwriters are offering the shares, subject to prior sale, when, as and if issued to and accepted by them, subject to approval of legal matters by their counsel, including the validity of the shares, and other conditions contained in the underwriting agreement, such as the receipt by the underwriters of officer's certificates and legal opinions. The underwriters reserve the right to withdraw, cancel or modify offers to the public and to reject orders in whole or in part.
Commissions and Discounts
The representatives have advised us that the underwriters propose initially to offer the shares to the public at the public offering price set forth on the cover page of this prospectus and to dealers at that price less a concession not in excess of $ per share. After the initial offering, the public offering price, concession or any other term of the offering may be changed.
The following table shows the public offering price, underwriting discount and proceeds before expenses to us. The information assumes either no exercise or full exercise by the underwriters of their option to purchase additional shares.
| |
Per Share | Without Option | With Option | |||||||
|---|---|---|---|---|---|---|---|---|---|---|
Public offering price |
$ | $ | $ | |||||||
Underwriting discount |
$ | $ | $ | |||||||
Proceeds, before expenses, to us |
$ | $ | $ | |||||||
The expenses of the offering, not including the underwriting discount, are estimated at $ and are payable by us, which includes an amount not to exceed $25,000 that we have agreed to reimburse the underwriters for certain FINRA-related expenses incurred by them in connection with this offering.
134
Option to Purchase Additional Shares
We have granted an option to the underwriters, exercisable for 30 days after the date of this prospectus, to purchase up to 600,000 additional shares at the public offering price, less the underwriting discount. If the underwriters exercise this option, each will be obligated, subject to conditions contained in the underwriting agreement, to purchase a number of additional shares proportionate to that underwriter's initial amount reflected in the above table.
No Sales of Similar Securities
We, our executive officers and directors and our other existing security holders have agreed not to sell or transfer any common stock or securities convertible into, exchangeable for, exercisable for, or repayable with common stock, for 180 days after the date of this prospectus without first obtaining the written consent of Merrill Lynch, Pierce, Fenner & Smith Incorporated and Raymond James & Associates, Inc. Specifically, we and these other persons have agreed, with certain limited exceptions, not to directly or indirectly
- •
- Offer, pledge, sell or contract to sell any common stock;
- •
- Sell any option or contract to purchase any common stock;
- •
- Purchase any option or contract to sell any common stock;
- •
- Grant any option, right or warrant for the sale of any common stock;
- •
- Lend or otherwise dispose of or transfer any common stock;
- •
- Request or demand that we file a registration statement related to the common stock; or
- •
- Enter into any swap or other agreement that transfers, in whole or in part, the economic consequence of ownership of any common stock whether any such swap or transaction is to be settled by delivery of shares or other securities, in cash or otherwise.
This lock-up provision applies to common stock and to securities convertible into or exchangeable or exercisable for or repayable with common stock. It also applies to common stock owned now or acquired later by the person executing the agreement or for which the person executing the agreement later acquires the power of disposition.
NASDAQ Global Market Listing
We expect the shares to be approved for listing on The NASDAQ Global Market, subject to notice of issuance, under the symbol "CTRL."
Before this offering, there has been no public market for our common stock. The initial public offering price will be determined through negotiations among us and the representatives. In addition to prevailing market conditions, the factors to be considered in determining the initial public offering price are
- •
- The valuation multiples of publicly traded companies that the representatives believe to be comparable to us;
- •
- Our financial information;
- •
- The history of, and the prospects for, our company and the industry in which we compete;
- •
- An assessment of our management, its past and present operations, and the prospects for, and timing of, our future
revenues;
- •
- The present state of our development; and
135
- •
- The above factors in relation to market values and various valuation measures of other companies engaged in activities similar to ours.
An active trading market for the shares may not develop. It is also possible that after the offering the shares will not trade in the public market at or above the initial public offering price.
The underwriters do not expect to sell more than 5% of the shares in the aggregate to accounts over which they exercise discretionary authority.
Price Stabilization, Short Positions and Penalty Bids
Until the distribution of the shares is completed, SEC rules may limit underwriters and selling group members from bidding for and purchasing our common stock. However, the representatives may engage in transactions that stabilize the price of the common stock, such as bids or purchases to peg, fix or maintain that price.
In connection with the offering, the underwriters may purchase and sell our common stock in the open market. These transactions may include short sales, purchases on the open market to cover positions created by short sales and stabilizing transactions. Short sales involve the sale by the underwriters of a greater number of shares than they are required to purchase in the offering. "Covered" short sales are sales made in an amount not greater than the underwriters' option to purchase additional shares described above. The underwriters may close out any covered short position by either exercising their option to purchase additional shares or purchasing shares in the open market. In determining the source of shares to close out the covered short position, the underwriters will consider, among other things, the price of shares available for purchase in the open market as compared to the price at which they may purchase shares through the option granted to them. "Naked" short sales are sales in excess of such option. The underwriters must close out any naked short position by purchasing shares in the open market. A naked short position is more likely to be created if the underwriters are concerned that there may be downward pressure on the price of our common stock in the open market after pricing that could adversely affect investors who purchase in the offering. Stabilizing transactions consist of various bids for or purchases of shares of common stock made by the underwriters in the open market prior to the completion of the offering.
The underwriters may also impose a penalty bid. This occurs when a particular underwriter repays to the underwriters a portion of the underwriting discount received by it because the representatives have repurchased shares sold by or for the account of such underwriter in stabilizing or short covering transactions.
Similar to other purchase transactions, the underwriters' purchases to cover the syndicate short sales may have the effect of raising or maintaining the market price of our common stock or preventing or retarding a decline in the market price of our common stock. As a result, the price of our common stock may be higher than the price that might otherwise exist in the open market. The underwriters may conduct these transactions on The NASDAQ Global Market, in the over-the-counter market or otherwise.
Neither we nor any of the underwriters make any representation or prediction as to the direction or magnitude of any effect that the transactions described above may have on the price of our common stock. In addition, neither we nor any of the underwriters make any representation that the representatives will engage in these transactions or that these transactions, once commenced, will not be discontinued without notice.
Electronic Distribution
In connection with the offering, certain of the underwriters or securities dealers may distribute prospectuses by electronic means, such as e-mail.
136
Other Relationships
Some of the underwriters and their affiliates may in the future engage in investment banking and other commercial dealings in the ordinary course of business with us or our affiliates. They may in the future receive, customary fees and commissions for these transactions.
In addition, in the ordinary course of their business activities, the underwriters and their affiliates may make or hold a broad array of investments and actively trade debt and equity securities (or related derivative securities) and financial instruments (including bank loans) for their own account and for the accounts of their customers. Such investments and securities activities may involve securities and/or instruments of ours or our affiliates. The underwriters and their affiliates may also make investment recommendations and/or publish or express independent research views in respect of such securities or financial instruments and may hold, or recommend to clients that they acquire, long and/or short positions in such securities and instruments.
Notice to Prospective Investors in the European Economic Area
In relation to each Member State of the European Economic Area which has implemented the Prospectus Directive (each, a "Relevant Member State"), with effect from and including the date on which the Prospectus Directive is implemented in that Relevant Member State (the "Relevant Implementation Date"), no offer of shares may be made to the public in that Relevant Member State other than:
- A.
- To
any legal entity which is a qualified investor as defined in the Prospectus Directive;
- B.
- To
fewer than 100 or, if the Relevant Member State has implemented the relevant provision of the 2010 PD Amending Directive, 150, natural or legal persons
(other than qualified investors as defined in the Prospectus Directive), as permitted under the Prospectus Directive, subject to obtaining the prior consent of the representatives; or
- C.
- In any other circumstances falling within Article 3(2) of the Prospectus Directive, provided that no such offer of shares shall require the Company or the representatives to publish a prospectus pursuant to Article 3 of the Prospectus Directive or supplement a prospectus pursuant to Article 16 of the Prospectus Directive.
Each person in a Relevant Member State who initially acquires any shares or to whom any offer is made will be deemed to have represented, acknowledged and agreed that (A) it is a "qualified investor" within the meaning of the law in that Relevant Member State implementing Article 2(1)(e) of the Prospectus Directive, and (B) in the case of any shares acquired by it as a financial intermediary, as that term is used in Article 3(2) of the Prospectus Directive, the shares acquired by it in the offering have not been acquired on behalf of, nor have they been acquired with a view to their offer or resale to, persons in any Relevant Member State other than "qualified investors" as defined in the Prospectus Directive, or in circumstances in which the prior consent of the representatives has been given to the offer or resale. In the case of any shares being offered to a financial intermediary as that term is used in Article 3(2) of the Prospectus Directive, each such financial intermediary will be deemed to have represented, acknowledged and agreed that the shares acquired by it in the offer have not been acquired on a non-discretionary basis on behalf of, nor have they been acquired with a view to their offer or resale to, persons in circumstances which may give rise to an offer of any shares to the public other than their offer or resale in a Relevant Member State to qualified investors as so defined or in circumstances in which the prior consent of the representatives has been obtained to each such proposed offer or resale.
The Company, the representatives and their affiliates will rely upon the truth and accuracy of the foregoing representation, acknowledgement and agreement.
137
This prospectus has been prepared on the basis that any offer of shares in any Relevant Member State will be made pursuant to an exemption under the Prospectus Directive from the requirement to publish a prospectus for offers of shares. Accordingly any person making or intending to make an offer in that Relevant Member State of shares which are the subject of the offering contemplated in this prospectus may only do so in circumstances in which no obligation arises for the Company or any of the underwriters to publish a prospectus pursuant to Article 3 of the Prospectus Directive in relation to such offer. Neither the Company nor the underwriters have authorized, nor do they authorize, the making of any offer of shares in circumstances in which an obligation arises for the Company or the underwriters to publish a prospectus for such offer.
For the purpose of the above provisions, the expression "an offer to the public" in relation to any shares in any Relevant Member State means the communication in any form and by any means of sufficient information on the terms of the offer and the shares to be offered so as to enable an investor to decide to purchase or subscribe the shares, as the same may be varied in the Relevant Member State by any measure implementing the Prospectus Directive in the Relevant Member State and the expression "Prospectus Directive" means Directive 2003/71/EC (including the 2010 PD Amending Directive, to the extent implemented in the Relevant Member States) and includes any relevant implementing measure in the Relevant Member State and the expression "2010 PD Amending Directive" means Directive 2010/73/EU.
Notice to Prospective Investors in the United Kingdom
In addition, in the United Kingdom, this document is being distributed only to, and is directed only at, and any offer subsequently made may only be directed at persons who are "qualified investors" (as defined in the Prospectus Directive) (i) who have professional experience in matters relating to investments falling within Article 19 (5) of the Financial Services and Markets Act 2000 (Financial Promotion) Order 2005, as amended (the "Order") and/or (ii) who are high net worth companies (or persons to whom it may otherwise be lawfully communicated) falling within Article 49(2)(a) to (d) of the Order (all such persons together being referred to as "relevant persons"). This document must not be acted on or relied on in the United Kingdom by persons who are not relevant persons. In the United Kingdom, any investment or investment activity to which this document relates is only available to, and will be engaged in with, relevant persons.
Notice to Prospective Investors in Switzerland
The shares may not be publicly offered in Switzerland and will not be listed on the SIX Swiss Exchange ("SIX") or on any other stock exchange or regulated trading facility in Switzerland. This document has been prepared without regard to the disclosure standards for issuance prospectuses under art. 652a or art. 1156 of the Swiss Code of Obligations or the disclosure standards for listing prospectuses under art. 27 ff. of the SIX Listing Rules or the listing rules of any other stock exchange or regulated trading facility in Switzerland. Neither this document nor any other offering or marketing material relating to the shares or the offering may be publicly distributed or otherwise made publicly available in Switzerland.
Neither this document nor any other offering or marketing material relating to the offering, the Company, the shares have been or will be filed with or approved by any Swiss regulatory authority. In particular, this document will not be filed with, and the offer of shares will not be supervised by, the Swiss Financial Market Supervisory Authority FINMA (FINMA), and the offer of shares has not been and will not be authorized under the Swiss Federal Act on Collective Investment Schemes ("CISA"). The investor protection afforded to acquirers of interests in collective investment schemes under the CISA does not extend to acquirers of shares.
138
Notice to Prospective Investors in the Dubai International Financial Centre
This prospectus relates to an Exempt Offer in accordance with the Offered Securities Rules of the Dubai Financial Services Authority ("DFSA"). This prospectus is intended for distribution only to persons of a type specified in the Offered Securities Rules of the DFSA. It must not be delivered to, or relied on by, any other person. The DFSA has no responsibility for reviewing or verifying any documents in connection with Exempt Offers. The DFSA has not approved this prospectus nor taken steps to verify the information set forth herein and has no responsibility for the prospectus. The shares to which this prospectus relates may be illiquid and/or subject to restrictions on their resale. Prospective purchasers of the shares offered should conduct their own due diligence on the shares. If you do not understand the contents of this prospectus you should consult an authorized financial advisor.
Notice to Prospective Investors in Australia
No placement document, prospectus, product disclosure statement or other disclosure document has been lodged with the Australian Securities and Investments Commission ("ASIC"), in relation to the offering. This prospectus does not constitute a prospectus, product disclosure statement or other disclosure document under the Corporations Act 2001 (the "Corporations Act"), and does not purport to include the information required for a prospectus, product disclosure statement or other disclosure document under the Corporations Act.
Any offer in Australia of the shares may only be made to persons (the "Exempt Investors") who are "sophisticated investors" (within the meaning of section 708(8) of the Corporations Act), "professional investors" (within the meaning of section 708(11) of the Corporations Act) or otherwise pursuant to one or more exemptions contained in section 708 of the Corporations Act so that it is lawful to offer the shares without disclosure to investors under Chapter 6D of the Corporations Act.
The shares applied for by Exempt Investors in Australia must not be offered for sale in Australia in the period of 12 months after the date of allotment under the offering, except in circumstances where disclosure to investors under Chapter 6D of the Corporations Act would not be required pursuant to an exemption under section 708 of the Corporations Act or otherwise or where the offer is pursuant to a disclosure document which complies with Chapter 6D of the Corporations Act. Any person acquiring shares must observe such Australian on-sale restrictions.
This prospectus contains general information only and does not take account of the investment objectives, financial situation or particular needs of any particular person. It does not contain any securities recommendations or financial product advice. Before making an investment decision, investors need to consider whether the information in this prospectus is appropriate to their needs, objectives and circumstances, and, if necessary, seek expert advice on those matters.
Notice to Prospective Investors in Hong Kong
The shares have not been offered or sold and will not be offered or sold in Hong Kong, by means of any document, other than (a) to "professional investors" as defined in the Securities and Futures Ordinance (Cap. 571) of Hong Kong and any rules made under that Ordinance; or (b) in other circumstances which do not result in the document being a "prospectus" as defined in the Companies Ordinance (Cap. 32) of Hong Kong or which do not constitute an offer to the public within the meaning of that Ordinance. No advertisement, invitation or document relating to the shares has been or may be issued or has been or may be in the possession of any person for the purposes of issue, whether in Hong Kong or elsewhere, which is directed at, or the contents of which are likely to be accessed or read by, the public of Hong Kong (except if permitted to do so under the securities laws of Hong Kong) other than with respect to shares which are or are intended to be disposed of only to persons outside Hong Kong or only to "professional investors" as defined in the Securities and Futures Ordinance and any rules made under that Ordinance.
139
Notice to Prospective Investors in Japan
The shares have not been and will not be registered under the Financial Instruments and Exchange Law of Japan (Law No. 25 of 1948, as amended) and, accordingly, will not be offered or sold, directly or indirectly, in Japan, or for the benefit of any Japanese Person or to others for re-offering or resale, directly or indirectly, in Japan or to any Japanese Person, except in compliance with all applicable laws, regulations and ministerial guidelines promulgated by relevant Japanese governmental or regulatory authorities in effect at the relevant time. For the purposes of this paragraph, "Japanese Person" shall mean any person resident in Japan, including any corporation or other entity organized under the laws of Japan.
Notice to Prospective Investors in Singapore
This prospectus has not been registered as a prospectus with the Monetary Authority of Singapore. Accordingly, this prospectus and any other document or material in connection with the offer or sale, or invitation for subscription or purchase, of the shares may not be circulated or distributed, nor may the shares be offered or sold, or be made the subject of an invitation for subscription or purchase, whether directly or indirectly, to persons in Singapore other than (i) to an institutional investor under Section 274 of the Securities and Futures Act, Chapter 289 of Singapore (the "SFA"), (ii) to a relevant person pursuant to Section 275(1), or any person pursuant to Section 275(1A), and in accordance with the conditions specified in Section 275, of the SFA, or (iii) otherwise pursuant to, and in accordance with the conditions of, any other applicable provision of the SFA.
Where the shares are subscribed or purchased under Section 275 of the SFA by a relevant person which is:
- (a)
- a
corporation (which is not an accredited investor (as defined in Section 4A of the SFA)) the sole business of which is to hold investments and the
entire share capital of which is owned by one or more individuals, each of whom is an accredited investor; or
- (b)
- a trust (where the trustee is not an accredited investor) whose sole purpose is to hold investments and each beneficiary of the trust is an individual who is an accredited investor,
securities (as defined in Section 239(1) of the SFA) of that corporation or the beneficiaries' rights and interest (howsoever described) in that trust shall not be transferred within six months after that corporation or that trust has acquired the shares pursuant to an offer made under Section 275 of the SFA except:
- (a)
- to
an institutional investor or to a relevant person defined in Section 275(2) of the SFA, or to any person arising from an offer referred to in
Section 275(1A) or Section 276(4)(i)(B) of the SFA;
- (b)
- where
no consideration is or will be given for the transfer;
- (c)
- where
the transfer is by operation of law;
- (d)
- as
specified in Section 276(7) of the SFA; or
- (e)
- as specified in Regulation 32 of the Securities and Futures (Offers of Investments) (Shares and Debentures) Regulations 2005 of Singapore.
140
The validity of the shares of common stock offered hereby will be passed upon for us by Goodwin Procter LLP, Menlo Park, California. Certain legal matters in connection with this offering will be passed upon for the underwriters by Cooley LLP, Palo Alto, California. Cooley LLP has in the past provided, and continues to provide, legal services to us.
The consolidated financial statements of Control4 Corporation at December 31, 2011 and 2012, and for each of the three years in the period ended December 31, 2012 appearing in this prospectus and registration statement, have been audited by Ernst & Young LLP, independent registered public accounting firm, as set forth in their report thereon and appearing elsewhere herein, and are included in reliance on such report given on the authority of such firm as experts in accounting and auditing.
WHERE YOU CAN FIND MORE INFORMATION
We have filed with the SEC a registration statement on Form S-1 under the Securities Act with respect to the shares of common stock we are offering. The registration statement, including the attached exhibits and schedules, contains additional relevant information about us and our common stock. This prospectus does not contain all of the information set forth in the registration statement and the exhibits and schedules thereto. The rules and regulations of the SEC allow us to omit from this prospectus certain information included in the registration statement.
For further information about us and our common stock, you may inspect a copy of the registration statement and the exhibits and schedules to the registration statement without charge at the offices of the SEC at 100 F Street, N.E., Washington, D.C. 20549. You may obtain copies of all or any part of the registration statement from the Public Reference Section of the SEC, 100 F Street, N.E., Washington, D.C. 20549 upon the payment of the prescribed fees.
You may obtain information on the operation of the Public Reference Room by calling the SEC at 1-800-SEC-0330. The SEC maintains a website at www.sec.gov that contains reports, proxy and information statements and other information regarding registrants like us that file electronically with the SEC. You can also inspect our registration statement on this website.
Upon the closing of this offering, we will become subject to the reporting and information requirements of the Exchange Act, and we will file reports, proxy statements and other information with the SEC.
141
INDEX TO CONSOLIDATED FINANCIAL STATEMENTS
F-1
Report of Independent Registered Public Accounting Firm
The
Board of Directors and Stockholders of
Control4 Corporation
We have audited the accompanying consolidated balance sheets of Control4 Corporation as of December 31, 2012 and 2011, and the related consolidated statements of operations, comprehensive loss, redeemable convertible preferred stock and stockholders' equity (deficit), and cash flows for each of the three years in the period ended December 31, 2012. These financial statements are the responsibility of the Company's management. Our responsibility is to express an opinion on these financial statements based on our audits.
We conducted our audits in accordance with the standards of the Public Company Accounting Oversight Board (United States). Those standards require that we plan and perform the audit to obtain reasonable assurance about whether the financial statements are free of material misstatement. We were not engaged to perform an audit of the Company's internal control over financial reporting. Our audits included consideration of internal control over financial reporting as a basis for designing audit procedures that are appropriate in the circumstances, but not for the purpose of expressing an opinion on the effectiveness of the Company's internal control over financial reporting. Accordingly, we express no such opinion. An audit also includes examining, on a test basis, evidence supporting the amounts and disclosures in the financial statements, assessing the accounting principles used and significant estimates made by management, and evaluating the overall financial statement presentation. We believe that our audits provide a reasonable basis for our opinion.
In our opinion, the financial statements referred to above present fairly, in all material respects, the consolidated financial position of Control4 Corporation at December 31, 2012 and 2011, and the consolidated results of its operations and its cash flows for each of the three years in the period ended December 31, 2012, in conformity with U.S. generally accepted accounting principles.
/s/ Ernst & Young LLP
Salt Lake City, Utah
March 15, 2013, except for the first paragraph of Note 10, as to which the date is July 19, 2013
F-2
CONSOLIDATED BALANCE SHEETS
(in thousands, except share data)
| |
December 31, | |
Pro Forma as of March 31, 2013 |
||||||||||
|---|---|---|---|---|---|---|---|---|---|---|---|---|---|
| |
March 31, 2013 |
||||||||||||
| |
2011 | 2012 | |||||||||||
| |
|
|
(unaudited) |
(unaudited) |
|||||||||
Assets |
|||||||||||||
Current assets: |
|||||||||||||
Cash and cash equivalents |
$ | 18,468 | $ | 18,695 | $ | 14,573 | $ | ||||||
Accounts receivable, net |
10,662 | 13,078 | 13,255 | ||||||||||
Inventories |
9,497 | 12,515 | 12,538 | ||||||||||
Prepaid expenses and other current assets |
1,519 | 1,871 | 2,183 | ||||||||||
Total current assets |
40,146 | 46,159 | 42,549 | ||||||||||
Property and equipment, net |
2,127 | 2,666 | 3,566 | ||||||||||
Intangible assets, net |
1,197 | 926 | 858 | ||||||||||
Other assets |
64 | 887 | 2,482 | ||||||||||
Total assets |
$ | 43,534 | $ | 50,638 | $ | 49,455 | |||||||
Liabilities, redeemable convertible preferred stock and stockholders' equity (deficit) |
|||||||||||||
Current liabilities: |
|||||||||||||
Accounts payable |
$ | 9,813 | $ | 14,435 | $ | 12,917 | |||||||
Accrued liabilities |
4,454 | 6,571 | 6,625 | ||||||||||
Deferred revenue |
552 | 542 | 1,035 | ||||||||||
Current portion of notes payable |
971 | 1,321 | 1,425 | ||||||||||
Total current liabilities |
15,790 | 22,869 | 22,002 | ||||||||||
Notes payable |
1,349 | 1,838 | 1,969 | ||||||||||
Warrant liability |
347 | 601 | 576 | ||||||||||
Other long-term liabilities |
2,241 | 1,620 | 1,799 | ||||||||||
Total liabilities |
19,727 | 26,928 | 26,346 | 25,770 | |||||||||
Commitments and contingencies |
|||||||||||||
Redeemable convertible preferred stock, $0.0001 par value; 83,163,408 shares authorized; 15,293,960 shares issued and outstanding at December 31, 2011 and 2012 and March 31, 2013 (unaudited); aggregate liquidation preference of $118,150 at December 31, 2011 and 2012 and March 31, 2013; no shares authorized, issued and outstanding, pro forma (unaudited) |
116,313 | 116,313 | 116,313 | — | |||||||||
Stockholders' equity (deficit): |
|||||||||||||
Preferred stock, $0.0001 par value, no shares authorized, issued and outstanding, actual; 25,000,000 shares authorized, no shares issued and outstanding, pro forma (unaudited) |
|||||||||||||
Common stock, $0.0001 par value; 117,836,592, 127,836,592 and 127,836,592 shares authorized; 2,245,521, 2,490,870 and 2,507,075 shares issued and outstanding at December 31, 2011 and 2012 and March 31, 2013 (unaudited), respectively; 500,000,000 shares authorized, 18,094,267 shares issued and outstanding, pro forma (unaudited) |
— | — | — | 2 | |||||||||
Additional paid-in capital |
9,334 | 12,988 | 13,863 | 130,750 | |||||||||
Accumulated deficit |
(101,864 | ) | (105,587 | ) | (107,058 | ) | (107,058 | ) | |||||
Accumulated other comprehensive income (loss) |
24 | (4 | ) | (9 | ) | (9 | ) | ||||||
Total stockholders' equity (deficit) |
(92,506 | ) | (92,603 | ) | (93,204 | ) | 23,685 | ||||||
Total liabilities, redeemable convertible preferred stock and stockholders' equity (deficit) |
$ | 43,534 | $ | 50,638 | $ | 49,455 | $ | 49,455 | |||||
See accompanying notes to consolidated financial statements.
F-3
CONTROL4 CORPORATION
CONSOLIDATED STATEMENTS OF OPERATIONS
(in thousands, except per share data)
| |
Years Ended December 31, | Three Months Ended March 31, |
||||||||||||||
|---|---|---|---|---|---|---|---|---|---|---|---|---|---|---|---|---|
| |
2010 | 2011 | 2012 | 2012 | 2013 | |||||||||||
| |
|
|
|
(unaudited) |
||||||||||||
Revenue |
$ | 74,925 | $ | 93,376 | $ | 109,512 | $ | 22,628 | $ | 26,571 | ||||||
Cost of revenue |
43,357 | 50,534 | 57,225 | 12,466 | 13,550 | |||||||||||
Cost of revenue—inventory purchase commitment |
— | — | 1,840 | — | — | |||||||||||
Gross margin |
31,568 | 42,842 | 50,447 | 10,162 | 13,021 | |||||||||||
Operating expenses: |
||||||||||||||||
Research and development |
15,922 | 19,211 | 20,310 | 4,813 | 6,066 | |||||||||||
Sales and marketing |
22,491 | 17,546 | 20,182 | 5,038 | 5,605 | |||||||||||
General and administrative |
8,876 | 9,805 | 10,150 | 2,532 | 2,828 | |||||||||||
Litigation settlement |
— | — | 2,869 | — | — | |||||||||||
Total operating expenses |
47,289 | 46,562 | 53,511 | 12,383 | 14,499 | |||||||||||
Loss from operations |
(15,721 | ) | (3,720 | ) | (3,064 | ) | (2,221 | ) | (1,478 | ) | ||||||
Other income (expense): |
||||||||||||||||
Interest income |
7 | 4 | 13 | 3 | 3 | |||||||||||
Interest expense |
(411 | ) | (396 | ) | (277 | ) | (65 | ) | (78 | ) | ||||||
Other income (expense) |
(140 | ) | 227 | (254 | ) | (400 | ) | 26 | ||||||||
Total other expense |
(544 | ) | (165 | ) | (518 | ) | (462 | ) | (49 | ) | ||||||
Loss before income taxes |
(16,265 | ) | (3,885 | ) | (3,582 | ) | (2,683 | ) | (1,527 | ) | ||||||
Income tax (expense) benefit |
— | — | (141 | ) | — | 56 | ||||||||||
Net loss |
$ | (16,265 | ) | $ | (3,885 | ) | $ | (3,723 | ) | $ | (2,683 | ) | $ | (1,471 | ) | |
Net loss per common share, basic and diluted |
$ | (9.93 | ) | $ | (2.02 | ) | $ | (1.58 | ) | $ | (1.19 | ) | $ | (0.59 | ) | |
Weighted-average number of shares, basic and diluted |
1,638 | 1,923 | 2,360 | 2,249 | 2,502 | |||||||||||
Pro forma net loss per common share, basic and diluted |
$ | (0.21 | ) | $ | (0.08 | ) | ||||||||||
Pro forma weighted-average number of common shares, basic and diluted |
17,947 | 18,089 | ||||||||||||||
See accompanying notes to consolidated financial statements.
F-4
CONTROL4 CORPORATION
CONSOLIDATED STATEMENTS OF COMPREHENSIVE LOSS
(in thousands)
| |
Years Ended December 31, | Three Months Ended March 31, |
||||||||||||||
|---|---|---|---|---|---|---|---|---|---|---|---|---|---|---|---|---|
| |
2010 | 2011 | 2012 | 2012 | 2013 | |||||||||||
| |
|
|
|
(unaudited) |
||||||||||||
Net loss |
$ | (16,265 | ) | $ | (3,885 | ) | $ | (3,723 | ) | $ | (2,683 | ) | $ | (1,471 | ) | |
Other comprehensive income (loss): |
||||||||||||||||
Unrealized gain (loss) on foreign currency exchange |
36 | (10 | ) | (28 | ) | (42 | ) | (5 | ) | |||||||
Total other comprehensive income (loss) |
36 | (10 | ) | (28 | ) | (42 | ) | (5 | ) | |||||||
Comprehensive loss |
$ | (16,229 | ) | $ | (3,895 | ) | $ | (3,751 | ) | $ | (2,725 | ) | $ | (1,476 | ) | |
See accompanying notes to consolidated financial statements.
F-5
CONTROL4 CORPORATION
CONSOLIDATED STATEMENTS OF REDEEMABLE CONVERTIBLE PREFERRED STOCK
AND STOCKHOLDERS' EQUITY (DEFICIT)
(in thousands, except
share data)
| |
|
|
Stockholders' Equity (Deficit) | ||||||||||||||||||||||
|---|---|---|---|---|---|---|---|---|---|---|---|---|---|---|---|---|---|---|---|---|---|---|---|---|---|
| |
Redeemable Convertible Preferred Stock |
Common Stock | |
|
|
|
|||||||||||||||||||
| |
|
|
Accumulated Other Comprehensive (Loss) Income |
Total Stockholders' Equity (Deficit) |
|||||||||||||||||||||
| |
Number of Shares |
|
Additional Paid-In Capital |
Accumulated Deficit |
|||||||||||||||||||||
| |
Shares | Amount | Amount | ||||||||||||||||||||||
Balance at December 31, 2009 |
13,279,319 | $ | 97,670 | 1,567,357 | $ | — | $ | 2,987 | $ | (81,714 | ) | $ | (2 | ) | $ | (78,729 | ) | ||||||||
Net loss |
— | — | — | — | — | (16,265 | ) | — | (16,265 | ) | |||||||||||||||
Other comprehensive income |
— | — | — | — | — | — | 36 | 36 | |||||||||||||||||
Stock-based compensation |
— | — | — | — | 1,469 | — | — | 1,469 | |||||||||||||||||
Issuance of common stock upon exercise of stock options |
— | — | 96,687 | — | 202 | — | — | 202 | |||||||||||||||||
Issuance of common stock warrants in exchange for acquired assets |
— | — | — | — | 313 | — | — | 313 | |||||||||||||||||
Balance at December 31, 2010 |
13,279,319 | 97,670 | 1,664,044 | — | 4,971 | (97,979 | ) | 34 | (92,974 | ) | |||||||||||||||
Net loss |
— | — | — | — | — | (3,885 | ) | — | (3,885 | ) | |||||||||||||||
Other comprehensive loss |
— | — | — | — | — | — | (10 | ) | (10 | ) | |||||||||||||||
Issuance of Series H redeemable convertible preferred stock for cash in February 2011, net of issuance costs of $211 |
2,014,641 | 18,643 | — | — | — | — | — | — | |||||||||||||||||
Issuance of common stock warrants |
— | — | — | — | 1,146 | — | — | 1,146 | |||||||||||||||||
Stock-based compensation |
— | — | — | — | 1,988 | — | — | 1,988 | |||||||||||||||||
Issuance of common stock upon exercise of stock options |
— | — | 577,437 | — | 1,204 | — | — | 1,204 | |||||||||||||||||
Issuance of common stock in exchange for services |
— | — | 4,040 | — | 25 | — | — | 25 | |||||||||||||||||
Balance at December 31, 2011 |
15,293,960 | 116,313 | 2,245,521 | — | 9,334 | (101,864 | ) | 24 | (92,506 | ) | |||||||||||||||
Net loss |
— | — | — | — | — | (3,723 | ) | — | (3,723 | ) | |||||||||||||||
Other comprehensive loss |
— | — | — | — | — | — | (28 | ) | (28 | ) | |||||||||||||||
Stock-based compensation |
— | — | — | — | 2,869 | — | — | 2,869 | |||||||||||||||||
Issuance of common stock upon exercise of stock options |
— | — | 245,349 | — | 785 | — | — | 785 | |||||||||||||||||
Balance at December 31, 2012 |
15,293,960 | 116,313 | 2,490,870 | — | 12,988 | (105,587 | ) | (4 | ) | (92,603 | ) | ||||||||||||||
Net loss (unaudited) |
— | — | — | — | — | (1,471 | ) | — | (1,471 | ) | |||||||||||||||
Other comprehensive loss (unaudited) |
— | — | — | — | — | — | (5 | ) | (5 | ) | |||||||||||||||
Stock-based compensation (unaudited) |
— | — | — | — | 838 | — | — | 838 | |||||||||||||||||
Issuance of common stock upon exercise of stock options (unaudited) |
— | — | 16,205 | — | 37 | — | — | 37 | |||||||||||||||||
Balance at March 31, 2013 (unaudited) |
15,293,960 | $ | 116,313 | 2,507,075 | $ | — | $ | 13,863 | $ | (107,058 | ) | $ | (9 | ) | $ | (93,204 | ) | ||||||||
See accompanying notes to consolidated financial statements.
F-6
CONTROL4 CORPORATION
CONSOLIDATED STATEMENTS OF CASH FLOWS
(in thousands)
| |
Years Ended December 31, | Three Months Ended March 31, |
||||||||||||||
|---|---|---|---|---|---|---|---|---|---|---|---|---|---|---|---|---|
| |
2010 | 2011 | 2012 | 2012 | 2013 | |||||||||||
| |
|
|
|
(unaudited) |
||||||||||||
Operating activities |
||||||||||||||||
Net loss |
$ | (16,265 | ) | $ | (3,885 | ) | $ | (3,723 | ) | $ | (2,683 | ) | $ | (1,471 | ) | |
Adjustments to reconcile net loss to net cash (used in) provided by operating activities: |
||||||||||||||||
Depreciation expense |
1,593 | 1,615 | 1,714 | 407 | 512 | |||||||||||
Amortization of intangible assets |
21 | 139 | 271 | 68 | 68 | |||||||||||
Provision for doubtful accounts |
470 | 283 | 184 | 114 | 70 | |||||||||||
Loss on inventory purchase commitment |
— | — | 1,840 | — | — | |||||||||||
Loss on disposal of property and equipment |
— | — | 107 | — | — | |||||||||||
Stock-based compensation |
1,469 | 2,013 | 2,869 | 731 | 838 | |||||||||||
Warrant liability (income) expense |
140 | (227 | ) | 254 | 399 | (25 | ) | |||||||||
Changes in assets and liabilities: |
||||||||||||||||
Accounts receivable |
1,561 | (2,645 | ) | (2,600 | ) | (54 | ) | (332 | ) | |||||||
Inventories |
(4,705 | ) | 2,323 | (4,858 | ) | (492 | ) | (94 | ) | |||||||
Prepaid expenses and other current assets |
(212 | ) | 396 | (352 | ) | (1 | ) | (338 | ) | |||||||
Other assets |
(41 | ) | 155 | (823 | ) | 1 | (1,595 | ) | ||||||||
Accounts payable |
2,464 | (975 | ) | 4,622 | 614 | (1,319 | ) | |||||||||
Accrued liabilities |
589 | 882 | 2,117 | (424 | ) | 77 | ||||||||||
Deferred revenue |
195 | (95 | ) | (10 | ) | 54 | 493 | |||||||||
Other long-term liabilities |
(357 | ) | (565 | ) | (621 | ) | (125 | ) | 179 | |||||||
Net cash (used in) provided by operating activities |
(13,078 | ) | (586 | ) | 991 | (1,391 | ) | (2,937 | ) | |||||||
Investing activities |
||||||||||||||||
Purchases of property and equipment |
(2,025 | ) | (1,264 | ) | (2,360 | ) | (542 | ) | (1,431 | ) | ||||||
Acquisition of intangible assets |
(319 | ) | (725 | ) | — | — | — | |||||||||
Net cash used in investing activities |
(2,344 | ) | (1,989 | ) | (2,360 | ) | (542 | ) | (1,431 | ) | ||||||
Financing activities |
||||||||||||||||
Net proceeds from issuance of redeemable convertible preferred stock and common stock warrants |
— | 19,789 | — | — | — | |||||||||||
Proceeds from exercise of options for common stock |
202 | 1,204 | 785 | — | 37 | |||||||||||
Net (repayment) borrowing against revolving line of credit |
4,314 | (6,314 | ) | — | — | — | ||||||||||
Proceeds from notes payable |
893 | 1,064 | 1,876 | 311 | 435 | |||||||||||
Repayment of notes payable |
(1,367 | ) | (744 | ) | (1,037 | ) | (243 | ) | (200 | ) | ||||||
Net cash provided by financing activities |
4,042 | 14,999 | 1,624 | 68 | 272 | |||||||||||
Effect of exchange rate changes on cash and cash equivalents |
36 | (10 | ) | (28 | ) | (42 | ) | (26 | ) | |||||||
Net increase (decrease) in cash and cash equivalents |
(11,344 | ) | 12,414 | 227 | (1,907 | ) | (4,122 | ) | ||||||||
Cash and cash equivalents at beginning of period |
17,398 | 6,054 | 18,468 | 18,468 | 18,695 | |||||||||||
Cash and cash equivalents at end of period |
$ | 6,054 | $ | 18,468 | $ | 18,695 | $ | 16,561 | $ | 14,573 | ||||||
Supplemental disclosure of cash flow information |
||||||||||||||||
Cash paid for interest |
$ | 416 | $ | 396 | $ | 278 | $ | 66 | $ | 63 | ||||||
Cash paid for taxes |
— | — | 26 | — | 50 | |||||||||||
See accompanying notes to consolidated financial statements.
F-7
CONTROL4 CORPORATION
NOTES TO CONSOLIDATED FINANCIAL STATEMENTS
(INFORMATION AS OF MARCH 31, 2013 AND FOR THE
THREE MONTHS ENDED
MARCH 31, 2012 AND 2013 IS UNAUDITED)
1. Description of Business and Summary of Significant Accounting Policies
Control4 Corporation ("Control4" or the "Company") is a leading provider of automation and control solutions for the connected home. We unlock the potential of connected devices, making entertainment systems easier to use, homes more comfortable, appliances more comfortable and energy efficient, and families more secure. The Company was incorporated in the state of Delaware on March 27, 2003.
Reclassifications
Certain prior-year amounts have been reclassified in order to conform to the current-year presentation. These reclassifications related primarily to customer rebates which in prior periods were included in accrued liabilities and have now been presented net with accounts receivable as well as reclassification of depreciation expense into the applicable functional captions on the statements of operations. These reclassifications had no effect on previously reported net loss.
Unaudited Financial Information
The accompanying interim consolidated balance sheet as of March 31, 2013, the consolidated statements of operations, comprehensive loss and cash flows for the three months ended March 31, 2012 and 2013, and the consolidated statement of redeemable convertible preferred stock and stockholders' equity (deficit) for the three months ended March 31, 2013 are unaudited. These unaudited interim consolidated financial statements have been prepared in accordance with U.S. generally accepted accounting principles ("GAAP") on the same basis as the audited consolidated financial statements and, in the opinion of management, reflect all adjustments, consisting of only normal recurring adjustments, considered necessary to present fairly the Company's financial position as of March 31, 2013 and its results of operations and cash flows for the three months ended March 31, 2012 and 2013. The results of operations for the three months ended March 31, 2013 are not necessarily indicative of the results that may be expected for the year ending December 31, 2013, or any other future interim or annual period.
Unaudited Pro Forma Balance Sheet
The unaudited pro forma balance sheet gives effect to the conversion of all outstanding shares of redeemable preferred stock into 15,293,960 shares of common stock, the net exercise of warrants to purchase capital stock into an aggregate of 293,232 shares of common stock and the reclassification of the associated warrant liability to additional paid in capital as if an initial public offering occurred on March 31, 2013 and assuming the valuation of the Company prior to such initial public offering is at least $225 million and the net proceeds to the Company from such initial public offering are not less than $35 million.
Basis of Presentation
The consolidated financial statements include the accounts of the Company and its wholly owned subsidiaries. All intercompany balances and transactions have been eliminated in the consolidated financial statements.
F-8
CONTROL4 CORPORATION
NOTES TO CONSOLIDATED FINANCIAL STATEMENTS (Continued)
(INFORMATION AS OF MARCH 31, 2013 AND FOR THE
THREE MONTHS ENDED MARCH 31, 2012 AND 2013 IS UNAUDITED)
1. Description of Business and Summary of Significant Accounting Policies (Continued)
Segment Reporting
Operating segments are identified as components of an enterprise about which separate discrete financial information is available for evaluation by the chief operating decision-maker, the Chief Executive Officer, in making decisions regarding resource allocation and accessing performance. To date, the Company has viewed its operations and manages its business as one segment.
Use of Accounting Estimates
The preparation of financial statements in conformity with U.S. generally accepted accounting principles requires management to make estimates and assumptions that affect the reported amounts of assets and liabilities as of the date of the financial statements and the reported amounts of revenues and expenses during the reporting period. On an ongoing basis, the Company evaluates its estimates including those related to revenue recognition, sales returns, provisions for doubtful accounts, product warranty, inventory obsolescence, litigation, determination of fair value of stock options, deferred tax asset valuation allowances and income taxes. Actual results may differ from those estimates.
Revenue Recognition
The Company sells its products through a network of independent dealers, regional and national retailers and distributors. These dealers, retailers and distributors generally sell the Company's products to the end consumer as part of a bundled sale, which typically includes other third-party products and related services, project design and installation services and on-going support.
The Company recognizes revenue when persuasive evidence of an arrangement exists, delivery has occurred, the sales price is fixed or determinable, and collection is reasonably assured. Product is considered delivered to the customer once it has been shipped and title and risk of loss have been transferred. For most of the Company's product sales, these criteria are met at the time the product is shipped. Payments received in advance of providing products are recorded as deferred revenue and recorded as revenue when the revenue recognition criteria are met and the earnings process is complete.
The Company records estimated reductions to revenue for dealer, retailer and distributor incentives, primarily comprised of volume rebates, at the time of the initial sale. The estimated reductions to revenue for rebates are based on the sales terms and the Company's historical experience and trend analysis. The most common incentive relates to amounts paid or credited to customers for achieving defined volume levels or growth objectives.
Software license revenue represents fees earned from activating applications which allow end consumers to manage and control their automation systems using tablets, smartphones and other third-party devices. The Company's perpetual software licenses do not include acceptance provisions, rights to updates or post-contract customer support; the Company generally recognizes revenue at the time the software license is provided to the customer.
The Company offers a subscription service that allows consumers to control and monitor their homes remotely and allows the Company's dealers to perform remote diagnostic services.
F-9
CONTROL4 CORPORATION
NOTES TO CONSOLIDATED FINANCIAL STATEMENTS (Continued)
(INFORMATION AS OF MARCH 31, 2013 AND FOR THE
THREE MONTHS ENDED MARCH 31, 2012 AND 2013 IS UNAUDITED)
1. Description of Business and Summary of Significant Accounting Policies (Continued)
Subscription revenue is deferred at the time of payment and recognized on a straight-line basis over the period the service is provided.
Total revenue for subscription services and software represents less than 10 percent of total revenue for all periods presented.
The Company recognizes revenue net of cost of revenue for third-party products sold through the Company's online ordering system. While the Company assumes credit risk on sales to its customers for third-party products, the Company does not determine the product selling price, does not retain associated inventory risks and is not the primary obligor to the end consumer.
The Company's agreements with dealers and distributors generally do not include rights of return or acceptance provisions. Even though contractual agreements do not provide return privileges, there are circumstances in which the Company will accept returns. In addition, agreements with certain retail customers contain stock rotation and other rights of return. The Company maintains a reserve for such returns based on the Company's historical return experience.
Shipping charges billed to customers are included in revenue and related shipping costs are included in cost of revenue.
Cost of Revenue
Cost of revenue includes the following: the cost of inventory sold during the period, inventory write-down costs, payroll and other direct installation services costs, purchasing costs, royalty obligations, shipping expenses to customers and warehousing costs, which include inbound freight costs from manufacturers, rent and payroll and benefit costs.
Cash and Cash Equivalents
The Company considers all highly liquid short-term investments with original maturities of three months or less at the time of purchase to be cash equivalents. Cash equivalents consist primarily of money market funds.
Allowance for Doubtful Accounts
The Company extends credit to the majority of its customers, which consist primarily of small, local businesses. Issuance of credit is based on ongoing credit evaluations by the Company of customers' financial condition and generally requires no collateral. Trade accounts receivable are recorded at the invoiced amount and do not bear interest. The Company maintains an allowance for doubtful accounts to reserve for potential uncollectible receivables. The allowance is based upon the creditworthiness of the Company's customers, the customers' historical payment experience, the age of the receivables and current market and economic conditions. Provisions for potentially uncollectible accounts are recorded in sales and marketing expenses. The Company writes off accounts receivable balances to the allowance for doubtful accounts when it becomes likely that they will not be collected.
F-10
CONTROL4 CORPORATION
NOTES TO CONSOLIDATED FINANCIAL STATEMENTS (Continued)
(INFORMATION AS OF MARCH 31, 2013 AND FOR THE
THREE MONTHS ENDED MARCH 31, 2012 AND 2013 IS UNAUDITED)
1. Description of Business and Summary of Significant Accounting Policies (Continued)
The following table presents the changes in the allowance for doubtful accounts (in thousands):
| |
Years Ended December 31, |
|
|||||||||||
|---|---|---|---|---|---|---|---|---|---|---|---|---|---|
| |
Three Months Ended March 31, 2013 |
||||||||||||
| |
2010 | 2011 | 2012 | ||||||||||
Balance at beginning of period |
$ | 773 | $ | 619 | $ | 651 | $ | 643 | |||||
Provision |
470 | 283 | 184 | 70 | |||||||||
Deductions |
(624 | ) | (251 | ) | (192 | ) | (68 | ) | |||||
Balance at end of period |
$ | 619 | $ | 651 | $ | 643 | $ | 645 | |||||
Concentrations of Risk
Financial instruments that potentially subject the Company to a concentration of credit risk consist of cash and cash equivalents and accounts receivable. The Company deposits cash and cash equivalents with one high-credit-quality financial institution and maintains balances that exceed federally insured amounts. The Company has policies that limit its investments as to types of investments, maturity, liquidity, credit quality, concentration and diversification of issuers.
The Company's accounts receivable are derived from revenue earned from customers primarily located in the United States and Canada. The Company's sales to customers located outside the United States are generally denominated in United States dollars, except for sales to customers located in the United Kingdom, which are denominated in pounds sterling. There were no individual account balances greater than 10% of total accounts receivable at December 31, 2011 and 2012 and March 31, 2013.
No customer accounted for more than 10% of total revenue for the years ended December 31, 2010, 2011 and 2012 or for the three months ended March 31, 2012 and 2013.
The Company relies on a limited number of suppliers for its contract manufacturing. A significant disruption in the operations of these manufacturers would impact the production of the Company's products for a substantial period of time, which could have a material adverse effect on the Company's business, financial condition and results of operations.
Geographic Information
The Company's revenue includes amounts earned through sales to customers located outside of the United States. With the exception of Canada, no single foreign country accounted for more than 10% of total revenue during the years ended December 31, 2010, 2011 and 2012 or for the three
F-11
CONTROL4 CORPORATION
NOTES TO CONSOLIDATED FINANCIAL STATEMENTS (Continued)
(INFORMATION AS OF MARCH 31, 2013 AND FOR THE
THREE MONTHS ENDED MARCH 31, 2012 AND 2013 IS UNAUDITED)
1. Description of Business and Summary of Significant Accounting Policies (Continued)
months ended March 31, 2012 and 2013. The following table sets forth revenue from U.S., Canadian and all other international customers combined (in thousands):
| |
Years Ended December 31, | Three Months Ended March 31, |
||||||||||||||
|---|---|---|---|---|---|---|---|---|---|---|---|---|---|---|---|---|
| |
2010 | 2011 | 2012 | 2012 | 2013 | |||||||||||
| |
|
|
|
(unaudited) |
||||||||||||
Revenue—United States |
$ | 53,566 | $ | 63,625 | $ | 69,957 | $ | 15,311 | $ | 17,702 | ||||||
Revenue—Canada |
9,799 | 10,480 | 12,453 | 2,462 | 3,345 | |||||||||||
Revenue—all other international sources |
11,560 | 19,271 | 27,102 | 4,855 | 5,524 | |||||||||||
Total revenue |
$ | 74,925 | $ | 93,376 | $ | 109,512 | $ | 22,628 | $ | 26,571 | ||||||
International revenue (excluding Canada) as a percent of total revenue |
15% | 21% | 25% | 21% | 21% | |||||||||||
Inventories
Inventories consist of hardware and related component parts and are stated at the lower of cost or market using the first-in, first-out method. The Company periodically assesses the recoverability of its inventory and reduces the carrying value of the inventory when items are determined to be obsolete, defective or in excess of forecasted sales requirements. Inventory write-downs for excess, defective and obsolete inventory are recorded as a cost of revenue and totaled $1.1 million, $1.3 million, $1.5 million, $0.4 million and $0.4 million for the years ended December 31, 2010, 2011 and 2012 and for the three months ended March 31, 2012 and 2013, respectively.
In December 2012, the Company finalized termination of a sales contract and, as a result of the contract termination, recorded a $1.8 million expense associated with an anticipated loss on firm purchase commitments for components that would have been required to meet the Company's obligations under the terminated contract. The $1.8 million charge has been recorded as Cost of Revenue—Inventory Purchase Commitment in the accompanying consolidated statement of operations during the year ended December 31, 2012.
Property and Equipment
Property and equipment are recorded at historical cost, less accumulated depreciation. Depreciation is computed using the straight-line method over the following estimated useful lives:
Furniture and fixtures |
5 years | |
Manufacturing tooling and test equipment |
2-3 years | |
Lab, marketing and warehouse equipment |
3 years | |
Computer equipment and software |
3 years | |
Marketing equipment |
1-3 years |
F-12
CONTROL4 CORPORATION
NOTES TO CONSOLIDATED FINANCIAL STATEMENTS (Continued)
(INFORMATION AS OF MARCH 31, 2013 AND FOR THE
THREE MONTHS ENDED MARCH 31, 2012 AND 2013 IS UNAUDITED)
1. Description of Business and Summary of Significant Accounting Policies (Continued)
Maintenance and repairs that do not extend the life of or improve the asset are expensed in the year incurred. Leasehold improvements are depreciated over the estimated useful life (usually 3-5 years) or the life of the associated lease, whichever is less.
Intangible Assets
Intangible assets consist of acquired technology. The Company amortizes, to cost of revenue, definite-lived intangible assets on a straight-line basis over the life of the technology, which is estimated to be five years.
Impairment of Long-Lived Assets
The carrying value of long-lived assets is reviewed for impairment whenever events or changes in circumstances indicate that the carrying amount of an asset or asset group may not be recoverable. An impairment loss is recognized when the carrying amount of an asset exceeds the estimated undiscounted future cash flows expected to result from the use of the asset and its eventual disposition. The amount of the impairment loss to be recorded is calculated by the excess of the asset's carrying value over its fair value. Fair value is generally determined using a discounted cash flow analysis.
Product Warranty
The Company provides its customers a limited product warranty of two years, which requires the Company to repair or replace defective products during the warranty period at no cost to the customer. The Company estimates the costs that may be incurred to replace or repair defective products and records a reserve at the time revenue is recognized. Factors that affect the Company's warranty liability include the number of installed systems, the Company's historical experience and management's judgment regarding anticipated rates of product warranty returns. The Company assesses the adequacy of its recorded warranty liability each period and makes adjustments to the liability as necessary.
The following table presents the changes in the product warranty liability (in thousands):
| |
Years Ended December 31, |
|
|||||||||||
|---|---|---|---|---|---|---|---|---|---|---|---|---|---|
| |
Three Months Ended March 31, 2013 |
||||||||||||
| |
2010 | 2011 | 2012 | ||||||||||
| |
|
|
|
(unaudited) |
|||||||||
Balance at beginning of period |
$ | 775 | $ | 775 | $ | 1,030 | $ | 1,155 | |||||
Warranty costs accrued |
320 | 727 | 1,050 | 139 | |||||||||
Warranty claims |
(320 | ) | (472 | ) | (925 | ) | (140 | ) | |||||
Balance at end of period |
$ | 775 | $ | 1,030 | $ | 1,155 | $ | 1,154 | |||||
Redeemable Convertible Preferred Stock Warrant
Freestanding warrants and other similar instruments related to shares that are redeemable are accounted for in accordance with ASC 480, "Distinguishing Liabilities and Equity." Under ASC 480, freestanding warrants that relate to the Company's redeemable convertible preferred stock are
F-13
CONTROL4 CORPORATION
NOTES TO CONSOLIDATED FINANCIAL STATEMENTS (Continued)
(INFORMATION AS OF MARCH 31, 2013 AND FOR THE
THREE MONTHS ENDED MARCH 31, 2012 AND 2013 IS UNAUDITED)
1. Description of Business and Summary of Significant Accounting Policies (Continued)
classified as a liability on the balance sheet. The warrant to purchase Series G-1 redeemable convertible preferred stock is subject to re-measurement at each balance sheet date and any change in fair value is recognized as a component of other income or expense. Fair value is measured using the Black-Scholes option pricing model. The Company will continue to adjust the liability for changes in fair value until the completion of its planned initial public offering, at which time the redeemable convertible preferred stock warrants will expire or be exercised and converted into common stock and, accordingly, the liability will be reclassified to equity.
Foreign Currency Translation
The functional currency of the Company's subsidiaries in England, China and India are the pound sterling, the Chinese Yuan and the Indian Rupee, respectively. The subsidiary's assets and liabilities have been translated to U.S. dollars using the exchange rates in effect at the balance sheet date. Statements of operations amounts have been translated using the average exchange rate for each year. Resulting gains or losses from translating foreign currency financial statements are recorded as other comprehensive income (loss). Foreign currency transaction gains (losses) resulting from exchange rate fluctuations on transactions denominated in a currency other than the local currency are included in earnings.
Stock-Based Compensation
The Company recognizes compensation expense for all stock-based awards issued to employees and directors based on estimated grant date fair values. The Company selected the Black-Scholes option-pricing model to determine the estimated fair value at the date of grant for stock options. The Company elected to amortize compensation expense using the straight-line attribution method, under which stock-based compensation expense is recognized on a straight-line basis over the period the employee performs the related services, generally the vesting period of four years, net of estimated forfeitures. The Company has estimated forfeiture rates based on its historical experience and will update the rates, as necessary, in subsequent periods if actual forfeitures differ from initial estimates.
The Black-Scholes option-pricing model requires management assumptions regarding various factors that require extensive use of accounting judgment and financial estimates. The Company estimates the expected term for options using the simplified method, which utilizes the weighted average expected life of each tranche of the stock option, determined based on the sum of each tranche's vesting period plus one-half of the period from the vesting date of each tranche to the stock option's expiration, because the Company's options are considered "plain vanilla." The Company computed the expected volatility using multiple peer companies for a period approximating the expected term. The risk-free interest rate was determined using the implied yield on U.S. Treasury issues with a remaining term within the expected life of the award.
The Company accounts for stock-based instruments and awards issued to non-employees at fair value using the Black-Scholes option-pricing model. Management believes that the fair value of the stock-based awards is more reliably measured than the fair value of the services received. The fair value of each non-employee award is re-measured each period until a commitment date is reached, which is generally the vesting date.
F-14
CONTROL4 CORPORATION
NOTES TO CONSOLIDATED FINANCIAL STATEMENTS (Continued)
(INFORMATION AS OF MARCH 31, 2013 AND FOR THE
THREE MONTHS ENDED MARCH 31, 2012 AND 2013 IS UNAUDITED)
1. Description of Business and Summary of Significant Accounting Policies (Continued)
Income Taxes
The Company recognizes deferred tax assets and liabilities for the future tax consequences attributable to the differences between the financial statement carrying value of existing assets and liabilities and their respective tax bases. Deferred tax assets and liabilities are measured using enacted tax rates in effect for the fiscal year in which those temporary differences are expected to be recovered or settled. Valuation allowances are established when necessary to reduce deferred tax assets to the amount expected to be realized.
The Company operates in various tax jurisdictions and is subject to audit by various tax authorities. The Company provides for tax contingencies whenever it is deemed probable that a tax asset has been impaired or a tax liability has been incurred for events such as tax claims or changes in tax laws. Tax contingencies are based upon their technical merits, relative tax law and the specific facts and circumstances as of each reporting period. Changes in facts and circumstances could result in material changes to the amounts recorded for such tax contingencies.
The Company recognizes uncertain income tax positions taken on income tax returns at the largest amount that is more-likely-than-not to be sustained upon audit by the relevant taxing authority. An uncertain income tax position will not be recognized if it has less than a 50% likelihood of being sustained.
The Company's policy for recording interest and penalties associated with uncertain tax positions is to record such items as a component of its income tax provision.
Presentation of Certain Taxes
The Company collects various taxes from customers and remits these amounts to the applicable taxing authorities. The Company's accounting policy is to exclude these taxes from revenue and cost of revenue.
Net Loss Per Share and Unaudited Pro Forma Net Loss Per Share
Basic net loss per share is computed by dividing the net loss by the weighted-average number of common shares outstanding during the period. Basic and diluted net loss per share of common stock is calculated by dividing the net loss by the weighted-average number of common shares outstanding during the period. Diluted net loss per share of common stock is the same as basic net loss per share of common stock, since the effects of potentially dilutive securities are anti-dilutive. Potentially dilutive common shares result from the assumed exercise of outstanding stock options and the assumed conversion of outstanding convertible preferred stock and warrants using the if-converted method.
Pro forma basic and diluted net loss per common share have been computed to give effect to the conversion of the Company's convertible preferred stock and warrants into common stock (using the if-converted method) as though the conversion had occurred at the beginning of the period presented.
F-15
CONTROL4 CORPORATION
NOTES TO CONSOLIDATED FINANCIAL STATEMENTS (Continued)
(INFORMATION AS OF MARCH 31, 2013 AND FOR THE
THREE MONTHS ENDED MARCH 31, 2012 AND 2013 IS UNAUDITED)
1. Description of Business and Summary of Significant Accounting Policies (Continued)
The following table presents the reconciliation of the numerator and denominator used in the calculation of basic and diluted net loss per share and the shares of common stock used to compute pro forma net loss per common share (in thousands):
| |
Years Ended December 31, | Three Months Ended March 31, |
||||||||||||||
|---|---|---|---|---|---|---|---|---|---|---|---|---|---|---|---|---|
| |
2010 | 2011 | 2012 | 2012 | 2013 | |||||||||||
| |
|
|
|
(unaudited) |
||||||||||||
Numerator: |
||||||||||||||||
Net loss |
$ | (16,265 | ) | $ | (3,885 | ) | $ | (3,723 | ) | $ | (2,683 | ) | $ | (1,471 | ) | |
Denominator: |
||||||||||||||||
Weighted-average common shares outstanding, basic and diluted |
1,638 | 1,923 | 2,360 | 2,249 | 2,502 | |||||||||||
Assumed conversion of convertible preferred stock into shares of common stock |
15,294 | 15,294 | ||||||||||||||
Assumed conversion of warrants into shares of common stock |
293 | 293 | ||||||||||||||
Pro forma weighted-average number of common shares, basic and diluted |
17,947 | 18,089 | ||||||||||||||
The following weighted-average common stock equivalents were anti-dilutive and therefore were excluded from the calculation of diluted net loss per share (in thousands):
| |
Years Ended December 31, | Three Months Ended March 31, |
||||||||||||||
|---|---|---|---|---|---|---|---|---|---|---|---|---|---|---|---|---|
| |
2010 | 2011 | 2012 | 2012 | 2013 | |||||||||||
| |
|
|
|
(unaudited) |
||||||||||||
Convertible preferred stock |
13,279 | 15,257 | 15,294 | 15,294 | 15,294 | |||||||||||
Options to purchase common stock |
3,484 | 3,953 | 4,317 | 4,338 | 4,629 | |||||||||||
Warrants to purchase common stock |
13 | 510 | 541 | 541 | 541 | |||||||||||
Warrants to purchase preferred stock |
194 | 194 | 194 | 194 | 194 | |||||||||||
Total |
16,970 | 19,914 | 20,346 | 20,367 | 20,658 | |||||||||||
Fair Value of Financial Instruments
The carrying amounts reported in the accompanying consolidated financial statements for cash and cash equivalents, accounts payable and accrued liabilities approximate their fair value because of the short-term nature of the accounts. The fair value of the notes payable approximates its carrying value based on the variable nature of interest rates and current market rates available to the Company. The fair value of the warrant liability is discussed in Notes 3 and 7.
F-16
CONTROL4 CORPORATION
NOTES TO CONSOLIDATED FINANCIAL STATEMENTS (Continued)
(INFORMATION AS OF MARCH 31, 2013 AND FOR THE
THREE MONTHS ENDED MARCH 31, 2012 AND 2013 IS UNAUDITED)
1. Description of Business and Summary of Significant Accounting Policies (Continued)
Recent Accounting Pronouncements
In June 2011, the FASB issued new guidance which improves the comparability, consistency, and transparency of financial reporting and increases the prominence of items reported in other comprehensive income ("OCI") by eliminating the option to present components of OCI as part of the statement of changes in stockholders' equity. The amendments in this standard require that all non-owner changes in stockholders' equity be presented either in a single continuous statement of comprehensive income or in two separate but consecutive statements. Subsequently in December 2011, the FASB issued additional guidance, which indefinitely defers the requirement to present on the face of the financial statements reclassification adjustments for items that are reclassified from OCI to net income in the statement where the components of net income and the components of OCI are presented. The amendments to these standards do not change the items that must be reported in OCI, when an item of OCI must be reclassified to net income, or change the option for an entity to present components. This new guidance was effective for the Company beginning January 1, 2012 and was required to be applied retrospectively. The adoption of this guidance did not have an impact on the Company's results of operations, financial position, or cash flows as it relates only to financial statement presentation.
In February 2013, the FASB issued ASU 2013-02, "Comprehensive Income: Reporting of Amounts Reclassified Out of Accumulated Other Comprehensive Income." The amended guidance requires an entity to present the effects on the line items of net income of significant reclassifications out of accumulated other comprehensive income if the amount being reclassified is required under U.S. generally accepted accounting principles to be reclassified in its entirety to net income in the same reporting period. The guidance is effective prospectively for the reporting periods beginning after December 15, 2012. The Company does not anticipate the adoption of the amended guidance to have a significant impact on its consolidated financial statements.
In May 2011, the FASB issued new guidance for fair value measurements to provide a consistent definition of fair value and ensure that the fair value measurement and disclosure requirements are similar between GAAP and International Financial Reporting Standards. The guidance changes certain fair value measurement principles and enhances the disclosure requirements, particularly for level 3 fair value measurements. The Company adopted this guidance prospectively on January 1, 2012 and noted no significant impact on the Company's results of operations, financial position, or cash flows.
F-17
CONTROL4 CORPORATION
NOTES TO CONSOLIDATED FINANCIAL STATEMENTS (Continued)
(INFORMATION AS OF MARCH 31, 2013 AND FOR THE
THREE MONTHS ENDED MARCH 31, 2012 AND 2013 IS UNAUDITED)
2. Balance Sheet Components
Inventories consisted of the following (in thousands):
| |
December 31, | |
||||||||
|---|---|---|---|---|---|---|---|---|---|---|
| |
March 31, 2013 |
|||||||||
| |
2011 | 2012 | ||||||||
| |
|
|
(unaudited) |
|||||||
Finished goods |
$ | 8,044 | $ | 12,306 | $ | 12,185 | ||||
Component parts |
1,453 | 209 | 353 | |||||||
|
$ | 9,497 | $ | 12,515 | $ | 12,538 | ||||
Property and equipment, net consisted of the following (in thousands):
| |
December 31, | |
||||||||
|---|---|---|---|---|---|---|---|---|---|---|
| |
March 31, 2013 |
|||||||||
| |
2011 | 2012 | ||||||||
| |
|
|
(unaudited) |
|||||||
Computer equipment and software |
$ | 3,157 | $ | 3,518 | $ | 3,635 | ||||
Manufacturing tooling and test equipment |
2,203 | 2,731 | 3,095 | |||||||
Furniture and fixtures |
1,705 | 1,801 | 1,985 | |||||||
Lab and warehouse equipment |
1,631 | 1,974 | 2,197 | |||||||
Marketing equipment |
503 | 419 | 419 | |||||||
Leasehold improvements |
598 | 803 | 1,277 | |||||||
|
9,797 | 11,246 | 12,608 | |||||||
Less: accumulated depreciation |
(7,670 | ) | (8,580 | ) | (9,042 | ) | ||||
|
$ | 2,127 | $ | 2,666 | $ | 3,566 | ||||
Intangible assets, net consisted of the following (in thousands):
| |
December 31, | |
||||||||
|---|---|---|---|---|---|---|---|---|---|---|
| |
March 31, 2013 |
|||||||||
| |
2011 | 2012 | ||||||||
| |
|
|
(unaudited) |
|||||||
Acquired technology |
$ | 1,357 | $ | 1,357 | $ | 1,357 | ||||
Less: accumulated amortization |
(160 | ) | (431 | ) | (499 | ) | ||||
|
$ | 1,197 | $ | 926 | $ | 858 | ||||
Other assets consisted of the following (in thousands):
| |
December 31, | |
||||||||
|---|---|---|---|---|---|---|---|---|---|---|
| |
March 31, 2013 |
|||||||||
| |
2011 | 2012 | ||||||||
| |
|
|
(unaudited) |
|||||||
Deferred offering costs |
$ | — | $ | — | $ | 1,522 | ||||
Prepaid licensing |
— | 700 | 773 | |||||||
Deposits |
64 | 187 | 187 | |||||||
|
$ | 64 | $ | 887 | $ | 2,482 | ||||
F-18
CONTROL4 CORPORATION
NOTES TO CONSOLIDATED FINANCIAL STATEMENTS (Continued)
(INFORMATION AS OF MARCH 31, 2013 AND FOR THE
THREE MONTHS ENDED MARCH 31, 2012 AND 2013 IS UNAUDITED)
2. Balance Sheet Components (Continued)
Accrued liabilities consisted of the following (in thousands):
| |
December 31, | |
||||||||
|---|---|---|---|---|---|---|---|---|---|---|
| |
March 31, 2013 |
|||||||||
| |
2011 | 2012 | ||||||||
| |
|
|
(unaudited) |
|||||||
Current portion of settlement obligations (see Notes 5 and 9) |
$ | 488 | $ | 2,229 | $ | 2,235 | ||||
Sales returns and warranty accrual |
1,924 | 2,045 | 2,122 | |||||||
Compensation accruals |
1,254 | 1,495 | 1,131 | |||||||
Other accrued liabilities |
788 | 802 | 1,137 | |||||||
|
$ | 4,454 | $ | 6,571 | $ | 6,625 | ||||
3. Fair Value Measurements
The Company's financial instruments that are measured at fair value on a recurring basis consist of money market funds and redeemable preferred stock warrants. The following three levels of inputs are used to measure the fair value of financial instruments:
| Level 1: | Quoted prices in active markets for identical assets or liabilities. The Company classifies its money market funds as Level 1 instruments as they are traded in active markets with sufficient volume and frequency of transactions. | |
Level 2: |
Observable prices that are based on inputs not quoted on active markets, but corroborated by market data. The Company did not have any Level 2 instruments during the reported periods. |
|
Level 3: |
Unobservable inputs are used when little or no market data is available. The Company utilized a Black-Scholes option pricing model in order to determine the fair value of the redeemable preferred stock warrant, with such value determined on an as-converted basis. Certain inputs used in the model are unobservable. The fair values could change significantly based on future market conditions. |
The fair values of these financial assets and the redeemable preferred stock warrant were determined using the following inputs (in thousands):
| |
Fair Value Measurements at December 31, 2011 using |
||||||||||||
|---|---|---|---|---|---|---|---|---|---|---|---|---|---|
| |
Level 1 | Level 2 | Level 3 | Total | |||||||||
Cash equivalents: |
|||||||||||||
Money market funds |
$ | 12,539 | $ | — | $ | — | $ | 12,539 | |||||
Other liabilities: |
|||||||||||||
Redeemable preferred stock warrants |
— | — | 347 | 347 | |||||||||
F-19
CONTROL4 CORPORATION
NOTES TO CONSOLIDATED FINANCIAL STATEMENTS (Continued)
(INFORMATION AS OF MARCH 31, 2013 AND FOR THE
THREE MONTHS ENDED MARCH 31, 2012 AND 2013 IS UNAUDITED)
3. Fair Value Measurements (Continued)
| |
Fair Value Measurements at December 31, 2012 using |
||||||||||||
|---|---|---|---|---|---|---|---|---|---|---|---|---|---|
| |
Level 1 | Level 2 | Level 3 | Total | |||||||||
Cash equivalents: |
|||||||||||||
Money market funds |
$ | 15,554 | $ | — | $ | — | $ | 15,554 | |||||
Other liabilities: |
|||||||||||||
Redeemable preferred stock warrants |
— | — | 601 | 601 | |||||||||
| |
Fair Value Measurements at March 31, 2013 using |
||||||||||||
|---|---|---|---|---|---|---|---|---|---|---|---|---|---|
| |
Level 1 | Level 2 | Level 3 | Total | |||||||||
| |
(unaudited) |
||||||||||||
Cash equivalents: |
|||||||||||||
Money market funds |
$ | 12,407 | $ | — | $ | — | $ | 12,407 | |||||
Other liabilities: |
|||||||||||||
Redeemable preferred stock warrants |
— | — | 576 | 576 | |||||||||
The following table summarizes the change in value of the convertible preferred stock warrant liability (in thousands):
| |
Years Ended December 31, | |
||||||||
|---|---|---|---|---|---|---|---|---|---|---|
| |
Three Months Ended March 31, 2013 |
|||||||||
| |
2011 | 2012 | ||||||||
| |
|
|
(unaudited) |
|||||||
Balance at the beginning of the period |
$ | 574 | $ | 347 | $ | 601 | ||||
Change in fair value included in other (income) expense |
(227 | ) | 254 | (25 | ) | |||||
Balance at the end of the period |
$ | 347 | $ | 601 | $ | 576 | ||||
4. Intangible Assets
In 2011, the Company entered into a purchase agreement to acquire software technology to be used in certain software applications. The total purchase price was determined based on a revenue-sharing formula for software licenses sold with the acquired technology between December 2011 and November 2012. The purchase agreement includes a minimum purchase price of $725,000 and a maximum purchase price of $2.0 million. In 2011, the Company recorded a finite-lived intangible asset and corresponding obligation for the minimum purchase price of $725,000, based on estimated future license sales under the agreement. Based on sales during that period, the final purchase price was $725,000. The asset is being amortized and expensed to cost of revenue on a straight-line basis over the estimated life of the associated technology, which was determined to be five years.
In 2010, the Company completed the acquisition of software technology to be used in certain software applications for a total purchase price that consisted of a cash payment of approximately $0.3 million and the issuance of a warrant to purchase 71,153 shares of the Company's common stock. The warrant has a five-year term, was immediately exercisable in full and has an exercise price of $7.49 per share.
F-20
CONTROL4 CORPORATION
NOTES TO CONSOLIDATED FINANCIAL STATEMENTS (Continued)
(INFORMATION AS OF MARCH 31, 2013 AND FOR THE
THREE MONTHS ENDED MARCH 31, 2012 AND 2013 IS UNAUDITED)
4. Intangible Assets (Continued)
The fair value of the warrant, totaling approximately $0.3 million, was calculated based on the following assumptions:
Dividend yield |
0 | % | ||
Volatility |
71 | % | ||
Risk-free interest rate |
1.20 | % | ||
Remaining contractual term (in years) |
5.0 |
The total purchase price of approximately $0.6 million was recorded as a finite-lived intangible asset and is being amortized and expensed to cost of revenue on a straight-line basis over the estimated life of the associated technology which was determined to be five years.
Amortization of finite-lived intangible assets as of December 31, 2012 is as follows for the next four years:
2013 |
$ | 271 | ||
2014 |
271 | |||
2015 |
250 | |||
2016 |
134 | |||
|
$ | 926 | ||
5. Long-Term Obligations
Loan and Security Agreement
The Company has entered into a borrowing agreement and related amendments with Silicon Valley Bank (the "SVB Agreement"), which consists of a revolving credit facility of $13.0 million (subject to certain borrowing base restrictions) and term borrowings to fund purchases of property and equipment. Borrowings under the SVB Agreement are collateralized by the general assets of the Company. The credit facility has a variable rate of interest of prime (as published in the Wall Street Journal) plus 0.25%, which was 3.50% at March 31, 2013. In addition, the Company pays an annual commitment fee of $20,000 and a quarterly unused line fee of 0.375% based on the difference between the borrowing commitment of $13.0 million and the then-current balance. Term borrowings are payable in 42 equal monthly payments of principal plus interest and bear interest at prime plus 0.50%, which was 3.75% at March 31, 2013.
Borrowing under the revolving credit facility is subject to certain collateral restrictions relating primarily to the Company's accounts receivable and inventory levels. As of March 31, 2013, total borrowing capacity was approximately $12.9 million. The Company had not borrowed against the revolving credit facility at December 31, 2011 or 2012 or March 31, 2013. The revolving credit facility has a maturity date of May 29, 2014.
The SVB Agreement contains various restrictive and financial covenants and the Company was in compliance with each of these covenants as of December 31, 2011 and 2012 and March 31, 2013.
F-21
CONTROL4 CORPORATION
NOTES TO CONSOLIDATED FINANCIAL STATEMENTS (Continued)
(INFORMATION AS OF MARCH 31, 2013 AND FOR THE
THREE MONTHS ENDED MARCH 31, 2012 AND 2013 IS UNAUDITED)
5. Long-Term Obligations (Continued)
Future principal payments on outstanding term borrowings as of December 31, 2012 are as follows (in thousands):
2013 |
$ | 1,321 | ||
2014 |
840 | |||
2015 |
588 | |||
2016 |
410 | |||
|
$ | 3,159 | ||
Settlement Obligation
The Company has entered into various settlement agreements (see Note 9) relating to alleged patent infringements, which included future payments under non-interest bearing, unsecured notes payable. The carrying value of the notes payable have been discounted using implied interest rates between 3.75% and 4.5%.
Future annual payments on the settlement obligations as of December 31, 2012 are shown in the table below (in thousands):
2013 |
$ | 2,400 | ||
2014 |
600 | |||
2015 |
600 | |||
2016 |
600 | |||
|
4,200 | |||
Less amount representing interest |
(296 | ) | ||
Present value of settlement obligations |
3,904 | |||
Less current portion of settlement obligations |
(2,229 | ) | ||
Long-term portion of settlement obligations |
$ | 1,675 | ||
The long-term portion of the settlement obligations is included in Other Long-Term Liabilities in the accompanying consolidated balance sheets.
Interest Expense on Long-Term Obligations
The Company incurred $411,000, $396,000, $277,000, $65,000 and $78,000 of interest during each of the years ended December 31, 2010, 2011, and 2012, and for the three months ended March 31, 2012 and 2013, respectively.
F-22
CONTROL4 CORPORATION
NOTES TO CONSOLIDATED FINANCIAL STATEMENTS (Continued)
(INFORMATION AS OF MARCH 31, 2013 AND FOR THE
THREE MONTHS ENDED MARCH 31, 2012 AND 2013 IS UNAUDITED)
6. Income Taxes
The domestic and foreign components of net income (loss) before income tax expense consists of the following for the periods shown below (in thousands):
| |
Years Ended December 31, | |||||||||
|---|---|---|---|---|---|---|---|---|---|---|
| |
2010 | 2011 | 2012 | |||||||
Income (loss) before income taxes: |
||||||||||
Domestic |
$ | (16,394 | ) | $ | (4,697 | ) | $ | (4,055 | ) | |
Foreign |
129 | 812 | 473 | |||||||
Total loss before income taxes |
$ | (16,265 | ) | $ | (3,885 | ) | $ | (3,582 | ) | |
The provision (benefit) for income taxes consisted of the following components (in thousands):
| |
Years Ended December 31, | |||||||||
|---|---|---|---|---|---|---|---|---|---|---|
| |
2010 | 2011 | 2012 | |||||||
Current: |
||||||||||
Domestic |
||||||||||
Federal |
$ | — | $ | — | $ | 15 | ||||
State |
— | — | 57 | |||||||
Foreign |
— | — | 69 | |||||||
Total current tax expense |
— | — | 141 | |||||||
Deferred: |
||||||||||
Domestic |
||||||||||
Federal |
(5,397 | ) | (1,773 | ) | (710 | ) | ||||
State |
(587 | ) | (280 | ) | (65 | ) | ||||
Foreign |
36 | 251 | 88 | |||||||
Valuation allowance |
5,948 | 1,802 | 687 | |||||||
Total deferred tax expense |
— | — | — | |||||||
Total income tax expense |
$ | — | $ | — | $ | 141 | ||||
A reconciliation from the U.S. statutory federal income tax rate to the effective income tax rate follows:
| |
Years Ended December 31, | |||||||||
|---|---|---|---|---|---|---|---|---|---|---|
| |
2010 | 2011 | 2012 | |||||||
Federal income tax rate |
(34.0 | )% | (34.0 | )% | (34.0 | )% | ||||
State taxes, net of federal benefit |
(3.0 | ) | (4.1 | ) | 1.1 | |||||
Stock-based compensation expense |
2.5 | 9.1 | 15.0 | |||||||
Research and development credits |
(3.2 | ) | (16.0 | ) | — | |||||
Change in valuation allowance |
36.8 | 46.4 | 17.3 | |||||||
Other, net |
0.9 | (1.4 | ) | 4.5 | ||||||
Effective income tax rate |
0.0 | % | 0.0 | % | 3.9 | % | ||||
F-23
CONTROL4 CORPORATION
NOTES TO CONSOLIDATED FINANCIAL STATEMENTS (Continued)
(INFORMATION AS OF MARCH 31, 2013 AND FOR THE
THREE MONTHS ENDED MARCH 31, 2012 AND 2013 IS UNAUDITED)
6. Income Taxes (Continued)
Deferred tax assets and (liabilities) are comprised of the following (in thousands):
| |
December 31, | ||||||
|---|---|---|---|---|---|---|---|
| |
2011 | 2012 | |||||
Deferred Tax Assets: |
|||||||
Reserves and accruals |
$ | 2,582 | $ | 3,396 | |||
Inventories |
472 | 606 | |||||
Net operating loss carryforwards |
31,020 | 30,165 | |||||
Property, plant and equipment |
909 | 1,054 | |||||
Stock-based compensation |
419 | 783 | |||||
Research and development credits |
3,239 | 3,254 | |||||
Other |
134 | 204 | |||||
Total deferred tax assets |
38,775 | 39,462 | |||||
Valuation allowance |
(38,775 | ) | (39,462 | ) | |||
Net deferred tax asset |
$ | — | $ | — | |||
During the year ended December 31, 2012, the Company reversed the valuation allowance for deferred tax assets related to its subsidiary operating in England totaling $92,000. This subsidiary had a history of generating income and used its remaining net operating loss carryforwards in the year ended December 31, 2012.
At December 31, 2011 and 2012, the Company had a full valuation allowance against the deferred tax assets of its domestic and other foreign operations as it believes it is more likely than not that these benefits will not be realized. Significant judgment is required in making this assessment, and it is very difficult to predict when, if ever, the assessment may conclude that the remaining portion of the deferred tax assets are realizable. The net valuation allowance increased by approximately $1.8 million and $0.7 million during the years ended December 31, 2011 and 2012, respectively.
Net operating loss and tax credit carryforwards as of December 31, 2012 are as follows (in thousands):
| |
Amount | Expiration Years | |||
|---|---|---|---|---|---|
Net operating losses, federal |
$ | 83,612 | 2023-2031 | ||
Net operating losses, state |
83,101 | 2018-2031 | |||
Tax credit carryforwards, federal |
2,472 | 2023-2031 | |||
Tax credit carryforwards, state |
1,162 | 2018-2025 | |||
Net operating losses, foreign |
24 | None | |||
Approximately $2.7 million of the net operating losses reported above represents unrecorded tax benefits for stock-based compensation, which will be recorded in additional paid in capital when realized. Utilization of the net operating loss carryforwards and credits may be subject to a substantial annual limitation due to the ownership change limitations provided by the Internal Revenue Code of 1986, as amended (the "IRC"), and similar state provisions. The Company has not performed a detailed analysis to determine whether an ownership change under Section 382 of the IRC has occurred
F-24
CONTROL4 CORPORATION
NOTES TO CONSOLIDATED FINANCIAL STATEMENTS (Continued)
(INFORMATION AS OF MARCH 31, 2013 AND FOR THE
THREE MONTHS ENDED MARCH 31, 2012 AND 2013 IS UNAUDITED)
6. Income Taxes (Continued)
or will occur. The effect of an ownership change would be the imposition of an annual limitation on the use of net operating loss carryforwards attributable to periods before the change.
The following is a reconciliation of the changes in the gross balance of unrecognized tax benefits, excluding interest and penalties (in thousands):
| |
Years Ended December 31, | |||||||||
|---|---|---|---|---|---|---|---|---|---|---|
| |
2010 | 2011 | 2012 | |||||||
Balance at the beginning of the period |
$ | 1,477 | $ | 1,862 | $ | 2,318 | ||||
Current year additions |
385 | 456 | — | |||||||
Balance at the end of the period |
$ | 1,862 | $ | 2,318 | $ | 2,318 | ||||
The Company does not believe there will be any material changes in its unrecognized tax benefits over the next 12 months. As of December 31, 2012, the amount of unrecognized tax benefits that would, if recognized, impact the Company's effective income tax rate is approximately $2.3 million.
The Company files income tax returns in the United States, including various state and local jurisdictions. The Company's subsidiaries' file income tax returns in the United Kingdom. The Company is subject to examination in the United States, the United Kingdom and various state jurisdictions for periods since inception. As of December 31, 2012, the Company was not under examination by any tax authorities. Tax years beginning in 2008 are subject to examination by taxing United States tax authorities, although net operating loss and credit carryforwards from all years are subject to examinations and adjustments for at least three years following the year in which the attributes are used. Tax years beginning in 2009 are subject to examination by the taxing authorities in the United Kingdom.
At December 31, 2012, the Company had undistributed foreign earnings of $107,000, which the Company intends to permanently reinvest in the foreign subsidiary. The Company anticipates that future overseas earnings will also be reinvested indefinitely. In accordance with the indefinite reversal criteria, the foreign currency gains recorded in other comprehensive income related to foreign currency translation have not been tax effected.
F-25
CONTROL4 CORPORATION
NOTES TO CONSOLIDATED FINANCIAL STATEMENTS (Continued)
(INFORMATION AS OF MARCH 31, 2013 AND FOR THE
THREE MONTHS ENDED MARCH 31, 2012 AND 2013 IS UNAUDITED)
7. Redeemable Convertible Preferred Stock and Stockholders' Deficit
Redeemable Convertible Preferred Stock
Redeemable convertible preferred stock consisted of the following at December 31, 2011 and 2012 and March 31, 2013 (in thousands, except share data):
| |
Shares Authorized |
Shares Issued and Outstanding |
Aggregate Liquidation Preference |
|||||||
|---|---|---|---|---|---|---|---|---|---|---|
Series A |
8,150,000 | 1,567,306 | $ | 4,075 | ||||||
Series B |
18,124,230 | 3,485,425 | 14,735 | |||||||
Series C |
14,215,791 | 2,726,476 | 15,000 | |||||||
Series D |
7,789,215 | 1,497,921 | 15,890 | |||||||
Series E |
5,045,662 | 965,927 | 11,000 | |||||||
Series F |
5,988,024 | 1,151,542 | 20,000 | |||||||
Series G |
8,677,338 | 1,668,707 | 15,450 | |||||||
Series G-1 |
2,073,148 | 216,015 | 2,000 | |||||||
Series H |
13,100,000 | 2,014,641 | 20,000 | |||||||
|
83,163,408 | 15,293,960 | $ | 118,150 | ||||||
All redeemable convertible preferred stockholder agreements provide for the following:
- •
- Voting with common stockholders in an amount equal to the number of common shares into which the preferred shares are
convertible.
- •
- Protective provisions that require the consent of holders of 50 percent of all Preferred Stockholders for certain
transactions or events.
- •
- Priority over any other class of outstanding capital stock of the Company with respect to dividend rights and liquidation, winding up or dissolution rights.
The Series A, Series B, Series C, Series D, Series E, Series F, Series G, Series G-1 and Series H redeemable convertible preferred stockholders (collectively, the "Preferred Stockholders") are entitled to receive, when, as and if declared by the Company's Board of Directors (the "Board of Directors"), dividends at a rate of $0.21, $0.34, $0.44, $0.85, $0.91, $1.39, $0.74, $0.74, and $0.79 per share per year, respectively. To the extent that additional dividends are declared by the Board of Directors, those amounts would be distributed equally among the Preferred Stockholders and common stockholders. As of December 31, 2012, no dividends had been declared by the Board of Directors.
In the event of any liquidation, dissolution or winding up of the Company, either voluntary or involuntary, the Preferred Stockholders are entitled to receive a liquidation preference payment prior to any distribution of any assets or surplus funds of the Company to the common stockholders. The
F-26
CONTROL4 CORPORATION
NOTES TO CONSOLIDATED FINANCIAL STATEMENTS (Continued)
(INFORMATION AS OF MARCH 31, 2013 AND FOR THE
THREE MONTHS ENDED MARCH 31, 2012 AND 2013 IS UNAUDITED)
7. Redeemable Convertible Preferred Stock and Stockholders' Deficit (Continued)
following table lists the payment priority and preference to the respective Preferred Stockholders in the event of a liquidation of the Company:
| |
Payment Priority |
Per Share Preference |
|||||
|---|---|---|---|---|---|---|---|
Series H |
1 | $ | 9.93 | ||||
Series G-1 |
1 | 9.26 | |||||
Series G |
2 | 9.26 | |||||
Series F |
2 | 17.37 | |||||
Series E |
3 | 11.39 | |||||
Series D |
4 | 10.61 | |||||
Series C |
5 | 5.50 | |||||
Series B |
6 | 4.23 | |||||
Series A |
6 | 2.60 | |||||
Each share of Preferred Stock may be converted, at the option of the holder, into common stock at a conversion ratio determined by dividing the original issuance price per share, as defined, by the effective conversion price for such share then outstanding. As of December 31, 2012, the effective conversion price per share for Series A, Series B, Series C, Series D, Series E, Series F, Series G, Series G-1 and Series H redeemable convertible preferred stock was $2.60, $4.23, $5.50, $10.61, $11.39, $17.37, $9.26, $9.26 and $9.93, respectively. The effective conversion price per share is subject to certain anti-dilution provisions. The Preferred Stock will automatically convert to common stock upon the consent of holders of a majority of the shares of Preferred Stock outstanding or the closing of an initial public offering of common stock that reflects a pre-money valuation of at least $225 million and results in net proceeds to the Company of not less than $35 million.
The Company is obligated, upon election of a majority of the holders of Preferred Stock at any time on or after December 12, 2015, to redeem the Series A, Series B, Series C, Series D, Series E, Series F, Series G, Series G-1 and Series H redeemable convertible preferred stock at $2.60, $4.23, $5.50, $10.61, $11.39, $17.37, $9.26, $9.26 and $9.93 per share, respectively, plus declared but unpaid dividends. If the Preferred Stockholders elect to redeem the preferred stock, the Series G-1 preferred shares will be redeemed 40 days following the redemption election date (the "Original Redemption Date"). Thereafter, the redemption of the remaining preferred shares will occur in three annual installments starting on the Original Redemption Date.
F-27
CONTROL4 CORPORATION
NOTES TO CONSOLIDATED FINANCIAL STATEMENTS (Continued)
(INFORMATION AS OF MARCH 31, 2013 AND FOR THE
THREE MONTHS ENDED MARCH 31, 2012 AND 2013 IS UNAUDITED)
7. Redeemable Convertible Preferred Stock and Stockholders' Deficit (Continued)
Warrants to Purchase Stock and Preferred Stock Warrant Liability
Warrants to purchase common and preferred stock at December 31, 2012 and March 31, 2013 are summarized in the following table:
| |
Number of Shares Subject to Warrant |
Exercise Price | |||||
|---|---|---|---|---|---|---|---|
Warrants to purchase common shares |
71,153 | $ | 7.49 | ||||
Warrants to purchase common shares |
470,082 | 9.93 | |||||
Warrants to purchase Series C redeemable convertible preferred stock |
7,325 | 5.50 | |||||
Warrants to purchase Series E redeemable convertible preferred stock |
4,390 | 11.39 | |||||
Warrants to purchase Series G-1 redeemable convertible preferred stock |
182,666 | 9.26 | |||||
|
735,616 | ||||||
In 2011, the Company issued warrants to purchase 470,082 shares of common stock to one Series H investor. The warrants became immediately exercisable upon the closing of the Series H financing and have a term of three years. The total proceeds of $20 million from the Series H financing were allocated between the Series H redeemable preferred stock and the common stock warrants based on their relative fair market value. The fair value of the warrants was calculated using the Black-Scholes option pricing model based on the following assumptions:
Dividend yield |
0 | % | ||
Expected volatility |
82 | % | ||
Risk-free interest rate |
1.05-1.39 | % | ||
Remaining contractual term (in years) |
3.0 |
In 2009, the Series G-1 investors received warrants to purchase 182,666 shares of Series G-1 redeemable convertible preferred stock at a price of $9.26 per share. The warrants became immediately exercisable upon the closing of the Series G-1 financing and the fair value of $0.4 million was recorded as a liability with the offsetting charge to expense. Because the holders of the preferred stock may elect to redeem the shares for cash, the Company's outstanding preferred stock warrants are classified as liabilities and are revalued at the end of each reporting period using the Black-Scholes option pricing valuation model. Changes in fair value are reflected in the Company's statements of operations as other income or expense. In the event of an initial public offering, the warrant to purchase Series G-1 redeemable convertible preferred stock must be either exercised or the warrant will expire upon the closing of the initial public offering. Upon exercise of the warrant, the purchased Series G-1 redeemable convertible preferred stock are convertible into shares of common stock. Since the strike price for the warrant equals the liquidation preference for the Series G-1 redeemable convertible preferred stock, it would only be optimal for the holder to exercise the warrant when the Company's enterprise value is high enough that it would be advantageous for the holders of the preferred stock to convert. As a result, the fair market value of the Company's common stock has been used to value the
F-28
CONTROL4 CORPORATION
NOTES TO CONSOLIDATED FINANCIAL STATEMENTS (Continued)
(INFORMATION AS OF MARCH 31, 2013 AND FOR THE
THREE MONTHS ENDED MARCH 31, 2012 AND 2013 IS UNAUDITED)
7. Redeemable Convertible Preferred Stock and Stockholders' Deficit (Continued)
warrant liability using the Black-Scholes option pricing model. The fair value of the warrants was calculated using the income approach and is based on the following assumptions:
| |
December 31, | |
|||||||||||
|---|---|---|---|---|---|---|---|---|---|---|---|---|---|
| |
March 31, 2013 |
||||||||||||
| |
2010 | 2011 | 2012 | ||||||||||
Dividend yield |
0 | % | 0 | % | 0 | % | 0 | % | |||||
Expected volatility |
87 | % | 60 | % | 54 | % | 44 | % | |||||
Risk-free interest rate |
1.02 | % | 0.36 | % | 0.16 | % | 0.14 | % | |||||
Remaining contractual term (in years) |
3.5 | 2.5 | 1.5 | 1.2 | |||||||||
Stock Options
In 2003, the Board of Directors adopted the 2003 Equity Incentive Plan (the 2003 Plan), which provides for the granting of nonqualified and incentive stock options, stock appreciation rights, stock awards and restricted stock. Under the 2003 Plan, the Company may grant nonqualified and incentive stock options to directors, employees and non-employees providing services to the Company. The Board of Directors, on an option-by-option basis, determines the number of shares, terms and exercise period. Options granted generally have a ten-year life and vest over a period of four years. The exercise price of options on the date of grant is equivalent to the estimated fair value of the stock as determined by the Board of Directors based upon information available to it at the time of grant. Because there has been no public market for the common stock, the Company's Board of Directors has determined the fair value of the Company's common stock based on a variety of factors, including periodic valuations of the Company's common stock, arm's-length sales of the Company's common stock, the Company's financial position, historical financial performance, projected financial performance, valuations of publicly traded peer companies and the illiquid nature of the Company's common stock. As of March 31, 2013, an aggregate of 6,438,575 shares are authorized for issuance under the 2003 Plan. The Company's Board of Directors has determined not to grant any further awards under the 2003 Plan after the completion of the Company's initial public offering (see Note 11).
F-29
CONTROL4 CORPORATION
NOTES TO CONSOLIDATED FINANCIAL STATEMENTS (Continued)
(INFORMATION AS OF MARCH 31, 2013 AND FOR THE
THREE MONTHS ENDED MARCH 31, 2012 AND 2013 IS UNAUDITED)
7. Redeemable Convertible Preferred Stock and Stockholders' Deficit (Continued)
A summary of stock option activity under the Plan for the years ended December 31, 2010, 2011 and 2012 and for the three months ended March 31, 2013 is presented below:
| |
Shares Subject to Options Outstanding |
Weighted Average Grant Date Fair Value |
Weighted Average Exercise Price |
Weighted Average Remaining Contractual Life (Years) |
|||||||
|---|---|---|---|---|---|---|---|---|---|---|---|
Balance at December 31, 2009 |
2,699,521 | $ | 1.59 | $ | 2.94 | 7.1 | |||||
Options granted |
1,016,032 | 3.30 | 5.19 | ||||||||
Options exercised |
(96,687 | ) | 1.17 | 2.02 | |||||||
Options expired |
(25,108 | ) | 1.92 | 3.64 | |||||||
Options forfeited |
(220,646 | ) | 2.89 | 4.84 | |||||||
Balance at December 31, 2010 |
3,373,112 | 2.02 | 3.51 | 6.9 | |||||||
Options granted |
1,988,044 | 3.94 | 6.19 | ||||||||
Options exercised |
(577,437 | ) | 1.20 | 2.08 | |||||||
Options expired |
(186,736 | ) | 2.39 | 4.33 | |||||||
Options forfeited |
(244,279 | ) | 3.22 | 5.30 | |||||||
Balance at December 31, 2011 |
4,352,704 | 2.93 | 4.79 | 7.6 | |||||||
Options granted |
715,205 | 5.31 | 9.45 | ||||||||
Options exercised |
(245,349 | ) | 1.92 | 3.20 | |||||||
Options expired |
(14,148 | ) | 2.97 | 4.91 | |||||||
Options forfeited |
(159,174 | ) | 3.63 | 5.71 | |||||||
Balance at December 31, 2012 |
4,649,238 | 3.33 | 5.56 | 7.2 | |||||||
Options granted |
— | — | — | ||||||||
Options exercised |
(16,205 | ) | 1.10 | 2.21 | |||||||
Options expired |
(2,303 | ) | 3.89 | 6.14 | |||||||
Options forfeited |
(21,264 | ) | 4.35 | 7.29 | |||||||
Balance at March 31, 2013 |
4,609,466 | $ | 3.33 | $ | 5.56 | 6.9 | |||||
Exercisable options at December 31, 2012 |
2,640,278 | $ | 2.50 | $ | 4.26 | 5.8 | |||||
Vested during the year ended December 31, 2012 |
824,083 | 3.69 | 5.93 | ||||||||
Vested and expected to vest at December 31, 2012 |
4,280,084 | 3.22 | 5.41 | ||||||||
Non-vested options at December 31, 2012 |
2,009,505 | 4.37 | 7.28 | ||||||||
Exercisable options at March 31, 2013 |
2,786,682 |
2.60 |
4.37 |
5.7 |
|||||||
Vested during the three months ended March 31, 2013 |
166,018 | 3.95 | 6.29 | ||||||||
Vested and expected to vest at March 31, 2013 |
4,266,066 | 3.28 | 5.41 | ||||||||
Non-vested options at March 31, 2013 |
1,822,222 | 4.42 | 7.38 | ||||||||
F-30
CONTROL4 CORPORATION
NOTES TO CONSOLIDATED FINANCIAL STATEMENTS (Continued)
(INFORMATION AS OF MARCH 31, 2013 AND FOR THE
THREE MONTHS ENDED MARCH 31, 2012 AND 2013 IS UNAUDITED)
7. Redeemable Convertible Preferred Stock and Stockholders' Deficit (Continued)
The following table summarizes information about stock options outstanding and exercisable at March 31, 2013:
| |
Options Outstanding | Options Exercisable | ||||||||||||||
|---|---|---|---|---|---|---|---|---|---|---|---|---|---|---|---|---|
Range of Exercise Prices
|
Weighted Average Exercise Price |
Number of Underlying Shares |
Weighted- Average Remaining Contractual Life (in years) |
Number of Underlying Shares |
Weighted- Average Remaining Contractual Life (in years) |
|||||||||||
$0.26 - 1.30 |
$ | 0.57 | 196,375 | 1.7 | 196,375 | 1.7 | ||||||||||
1.35 - 2.60 |
2.18 | 480,076 | 3.2 | 480,076 | 3.2 | |||||||||||
2.65 - 3.90 |
3.22 | 341,308 | 4.3 | 341,308 | 4.3 | |||||||||||
3.95 - 5.20 |
4.89 | 981,498 | 6.0 | 898,516 | 5.9 | |||||||||||
5.25 - 6.50 |
6.19 | 1,789,325 | 8.5 | 760,101 | 8.4 | |||||||||||
6.55 - 7.80 |
7.49 | 118,947 | 7.3 | 84,537 | 7.3 | |||||||||||
7.85 - 9.10 |
8.84 | 244,219 | 9.2 | 16,338 | 9.2 | |||||||||||
9.15 - 10.40 |
9.78 | 457,718 | 9.7 | 9,431 | 9.6 | |||||||||||
|
4,609,466 | 2,786,682 | ||||||||||||||
The following table summarizes the aggregate intrinsic-value of options exercised, outstanding and exercisable (in millions):
| |
Years Ended December 31, |
|
|||||||||||
|---|---|---|---|---|---|---|---|---|---|---|---|---|---|
| |
Three Months Ended March 31, 2013 |
||||||||||||
| |
2010 | 2011 | 2012 | ||||||||||
| |
|
|
|
(unaudited) |
|||||||||
Options Exercised |
$ | 0.30 | $ | 2.40 | $ | 1.31 | $ | 0.14 | |||||
Options Outstanding |
$ | 9.17 | $ | 9.11 | $ | 23.48 | $ | 26.38 | |||||
Options Exercisable |
$ | 7.66 | $ | 7.10 | $ | 16.80 | $ | 19.26 | |||||
The fair value of each option award is estimated on the date of grant using the Black-Scholes option pricing model with the following assumptions:
| |
Years Ended December 31, |
|
|||||||||||
|---|---|---|---|---|---|---|---|---|---|---|---|---|---|
| |
2010 | 2011 | 2012 | |
|||||||||
Expected volatility |
70-71 | % | 71-73 | % | 59-63 | % | |||||||
Expected dividends |
— | % | — | % | — | % | |||||||
Expected term (in years) |
5.2-6.1 | 5.0-6.1 | 5.0-6.1 | ||||||||||
Risk-free rate |
2.2-3.0 | % | 1.1-2.5 | % | 0.7-1.0 | % | |||||||
Forfeiture rate |
8.1 | % | 11.6 | % | 7.9 | % | |||||||
Expected volatility is based on the average volatility of similar public companies. The expected term was calculated based on the average of the vesting period and contractual term. The risk-free
F-31
CONTROL4 CORPORATION
NOTES TO CONSOLIDATED FINANCIAL STATEMENTS (Continued)
(INFORMATION AS OF MARCH 31, 2013 AND FOR THE
THREE MONTHS ENDED MARCH 31, 2012 AND 2013 IS UNAUDITED)
7. Redeemable Convertible Preferred Stock and Stockholders' Deficit (Continued)
interest rate was determined using the implied yield on U.S. Treasury issues with a remaining term within the expected life of the award. The Company uses historical data to determine forfeiture rates.
Total stock-based compensation expense has been classified as follows in the accompanying statements of operations (in thousands):
| |
Years Ended December 31, |
Three Months Ended March 31, |
||||||||||||||
|---|---|---|---|---|---|---|---|---|---|---|---|---|---|---|---|---|
| |
2010 | 2011 | 2012 | 2012 | 2013 | |||||||||||
| |
|
|
|
(unaudited) |
||||||||||||
Cost of revenue |
$ | 28 | $ | 49 | $ | 78 | $ | 17 | $ | 16 | ||||||
Research and development |
249 | 492 | 704 | 130 | 236 | |||||||||||
Sales and marketing |
546 | 523 | 580 | 144 | 184 | |||||||||||
General and administrative |
646 | 949 | 1,507 | 440 | 402 | |||||||||||
|
$ | 1,469 | $ | 2,013 | $ | 2,869 | $ | 731 | $ | 838 | ||||||
At March 31, 2013, there was $6.2 million of total unrecognized compensation cost related to non-vested stock option awards that will be recognized over a weighted-average period of 2.8 years.
Reserved Shares
At March 31, 2013, the Company had reserved shares of its common stock for future issuance as follows:
Stock options under the 2003 Plan: |
||||
Options outstanding |
4,609,466 | |||
Reserved for future grants |
538,344 | |||
Convertible preferred stock: |
||||
Issued and outstanding (as-if-converted basis) |
15,293,960 | |||
Warrants to purchase common and preferred stock |
735,616 | |||
|
21,177,386 | |||
F-32
CONTROL4 CORPORATION
NOTES TO CONSOLIDATED FINANCIAL STATEMENTS (Continued)
(INFORMATION AS OF MARCH 31, 2013 AND FOR THE
THREE MONTHS ENDED MARCH 31, 2012 AND 2013 IS UNAUDITED)
8. Related Party Transactions
The Company has entered into sales agreements with certain of its investors. The following table sets forth revenue from product sales to companies affiliated with these investors (in thousands):
| |
Years Ended December 31, |
Three Months Ended March 31, |
||||||||||||||
|---|---|---|---|---|---|---|---|---|---|---|---|---|---|---|---|---|
| |
2010 | 2011 | 2012 | 2012 | 2013 | |||||||||||
| |
|
|
|
(unaudited) |
||||||||||||
Company 1 |
$ | 620 | $ | 995 | $ | 2,142 | $ | 226 | $ | 558 | ||||||
Company 2 |
— | — | 1,807 | — | 119 | |||||||||||
Company 3 |
1,174 | 2,134 | 1,290 | 350 | 126 | |||||||||||
Company 4 |
— | 478 | 791 | 167 | 285 | |||||||||||
|
$ | 1,794 | $ | 3,607 | $ | 6,030 | $ | 743 | $ | 1,088 | ||||||
As of December 31, 2011 and 2012 and March 31, 2013, the Company had accounts receivable from these companies totaling $0.6 million, $1.5 million and $0.8 million, respectively.
9. Commitments and Contingencies
Operating Leases
The Company leases office and warehouse space under operating leases that expire between 2013 and 2018. The terms of the leases include periods of free rent, options for the Company to extend the leases (three to five years) and increasing rental rates over time. The Company recognizes rental expense under these operating leases on a straight-line basis over the lives of the leases and has accrued for rental expense recorded but not paid.
Rental expense was approximately $0.9 million, $1.0 million and $1.1 million for the years ended December 31, 2010, 2011 and 2012, respectively.
In March 2012, the Company entered into a 66-month lease modification on its corporate office lease, which was set to expire on December 31, 2012. Future minimum rental payments required under non-cancelable operating leases with initial or remaining terms in excess of one year consist of the following as of December 31, 2012 (in thousands):
2013 |
$ | 794 | ||
2014 |
1,238 | |||
2015 |
1,250 | |||
2016 |
1,109 | |||
2017 |
992 | |||
Thereafter |
489 | |||
|
$ | 5,872 | ||
F-33
CONTROL4 CORPORATION
NOTES TO CONSOLIDATED FINANCIAL STATEMENTS (Continued)
(INFORMATION AS OF MARCH 31, 2013 AND FOR THE
THREE MONTHS ENDED MARCH 31, 2012 AND 2013 IS UNAUDITED)
9. Commitments and Contingencies (Continued)
Purchase Commitments
The Company had non-cancellable purchase commitments for the purchase of inventory, which extend through August 2013 totaling approximately $19.5 million at December 31, 2012.
Employment Agreements
The Company has signed employment agreements with certain executive officers who are entitled to receive certain benefits if their employment is terminated by the Company, including severance payments, accelerated vesting of stock options and continuation of certain insurance benefits.
Legal Matters
The Company is subject to various lawsuits and other claims that arise from time to time in the ordinary course of business. These actions are based on alleged patent infringement and other matters. The Company intends to defend itself vigorously against any such actions. The Company establishes reserves for specific liabilities in connection with legal actions that it deems to be probable and estimable.
In December 2012, the Company entered into a settlement agreement relating to alleged patent infringements, which included future royalty payments on certain products and the payment of a lump sum amount totaling $2.9 million. The lump sum amount included a payment of $1.1 million which was made in December 2012 and future payments that are non-interest bearing and unsecured. The Company has recorded a liability of $1.7 million to reflect the carrying value of the future payments that have been discounted using an implied interest rate of 3.75%. The future payments are included in current liabilities as the licensor has the ability to request an accelerated but discounted payment at June 30, 2013. The lump sum amount was attributed to previous sales of products alleged to have infringed on the patents and to prepaid future sales of certain products. As a result, $700,000 has been recorded in other assets as of December 31, 2012.
In December 2012, the Company finalized termination of a sales contract and agreed to pay a $750,000 early termination penalty. As a result of the contract termination, the Company also recorded a $1.8 million expense associated with an anticipated loss on firm purchase commitments for components that would have been required to meet the Company's obligations under the terminated contract. The $750,000 penalty and the $1.8 million charge have been recorded as Litigation Settlement and Cost of Revenue—Inventory Purchase Commitment, respectively, in the accompanying consolidated statement of operations during the year ended December 31, 2012.
In management's opinion, the Company is not currently involved in any legal proceedings which, individually or in the aggregate, could have a material effect on the Company's financial condition, operations or cash flows.
10. Subsequent Events
In July 2013, the Company's board of directors and stockholders approved an amendment to the Company's amended and restated certificate of incorporation. The amendment provided for a
F-34
CONTROL4 CORPORATION
NOTES TO CONSOLIDATED FINANCIAL STATEMENTS (Continued)
(INFORMATION AS OF MARCH 31, 2013 AND FOR THE
THREE MONTHS ENDED MARCH 31, 2012 AND 2013 IS UNAUDITED)
10. Subsequent Events (Continued)
1-for-5.2 reverse stock split of the outstanding common stock and outstanding convertible preferred stock (collectively, "Capital Stock"), which became effective on July 18, 2013. Accordingly, (i) every 5.2 shares of Capital Stock have been combined into one share of Capital Stock, (ii) the number of shares of Capital Stock into which each outstanding option or warrant to purchase Capital Stock is exercisable, as the case may be, have been proportionately decreased on a 5.2-for-1 basis, and (iii) the exercise price for each such outstanding option or warrant to purchase Capital Stock has been proportionately increased on a 1-for-5.2 basis. All of the share numbers, share prices, and exercise prices have been adjusted within these financial statements, on a retroactive basis, to reflect this 1-for-5.2 reverse stock split.
The Company has evaluated all other subsequent events through March 15, 2013, the date on which the financial statements were available to be issued.
11. Subsequent Events (Unaudited)
For our interim consolidated financial statement as of March 31, 2013, and for the three months then ended, we have evaluated subsequent events through July 19, 2013, which is the date the financial statements were available to be issued.
In April 2013, the Company's Board of Directors approved an amendment to the Company's certificate of incorporation to authorize 500,000,000 shares of common stock and 25,000,000 shares of undesignated preferred stock effective on the closing of its planned initial public offering.
The Company granted options to employees and consultants to purchase shares of common stock as summarized in the following table:
Grant Date
|
Number of Options Granted |
Exercise Price per Share |
Common Stock Fair Value |
Aggregate Grant Date Fair Value(1) |
|||||||||
|---|---|---|---|---|---|---|---|---|---|---|---|---|---|
April 25, 2013 |
86,432 | $ | 11.28 | $ | 16.00 | (2) | $ | 834,351 | |||||
June 11, 2013 |
156,724 | 11.28 | 16.00 | (2) | 1,635,444 | ||||||||
June 23, 2013 |
146,626 | 11.28 | 16.00 | (2) | 1,272,527 | (3) | |||||||
|
389,782 | $ | 3,742,322 | (3) | |||||||||
- (1)
- Aggregate
grant date fair value was determined using the Black-Scholes option pricing model.
- (2)
- Fair value determined for financial reporting purposes in connection with a reassessment performed in July 2013. Subsequent to the March 31, 2013 valuation of the Company's common stock, in July 2013, the Company received an indication of the estimated preliminary price range for the Company's common stock in this offering from the managing underwriters. In light of the short period of time that had elapsed between the Company's April 25, 2013, June 11, 2013 and June 23, 2013 equity grants and the receipt of the estimated preliminary price range from the managing underwriters, the Company revised its estimated fair value of the
F-35
CONTROL4 CORPORATION
NOTES TO CONSOLIDATED FINANCIAL STATEMENTS (Continued)
(INFORMATION AS OF MARCH 31, 2013 AND FOR THE
THREE MONTHS ENDED MARCH 31, 2012 AND 2013 IS UNAUDITED)
11. Subsequent Events (Unaudited) (Continued)
Company's common stock with respect to equity grants made on April 25, 2013, June 11, 2013 and June 23, 2013 to be $16.00, which is the midpoint of the price range set forth on the cover page of this prospectus.
- (3)
- Includes the aggregate grant date fair value of $174,764 for 24,038 shares of common stock subject to an option granted in connection with the purchase of assets by the Company in June 2013, which will be recognized as part of the purchase price of such assets instead of stock-based compensation.
The aggregate grant date fair value of the options to purchase shares of common stock granted by the Company in the three months ended June 30, 2013 was $3.7 million, of which the Company expects $65,000 will be recognized as stock-based compensation in the three months ended June 30, 2013.
On June 11, 2013, the Company's Board of Directors adopted the 2013 Stock Option and Incentive Plan (the "2013 Plan"), which was subsequently approved by the Company's stockholders. The Company has initially reserved 2,200,000 shares of its Common Stock for issuance of awards under the 2013 Plan. The 2013 Plan provides for annual increases in the number of reserved shares of up to 5% of the outstanding number of shares of the Company's Common Stock.
On June 17, 2013, the Company entered into an Amended and Restated Loan and Security Agreement with Silicon Valley Bank (the "New SVB Agreement") which amends and restates the Loan and Security Agreement, as amended, by and between Silicon Valley Bank and the Company. The New SVB Agreement extends the maturity date of the revolving credit facility to May 29, 2015 and changes the interest rate to either the published Wall Street Journal prime rate or LIBOR plus 2.50%, as selected by the Company. In addition, the New SVB Agreement provides for an additional $2.75 million in term borrowings to fund purchases of property and equipment.
On June 21, 2013, the Company entered into a purchase agreement to acquire the assets, which consist primarily of software technology, and assume certain liabilities of a software technology company. As consideration for the acquisition, the Company will pay approximately $100,000 in cash and issue options to acquire shares of common stock of the Company. The acquisition will be accounted for as a business combination and therefore, the purchase price will be allocated to the assets acquired and liabilities assumed, based on estimated fair values. The Company anticipates that the fair value of the total purchase consideration will be less than $500,000. The determination of the final purchase price is subject to potential adjustment, based on the finalization of the value of the equity options. Additionally, the allocation of the purchase price may change based upon the finalization of the fair value of the identified acquired intangible assets.
F-36

Through and including, , 2013 (the 25th day after the date of this prospectus), all dealers effecting transactions in these securities, whether or not participating in this offering, may be required to deliver a prospectus. This is in addition to a dealer's obligation to deliver a prospectus when acting as an underwriter and with respect to an unsold allotment or subscription.
Shares

Common Stock
PROSPECTUS
| BofA Merrill Lynch | Raymond James | |||
Canaccord Genuity |
Cowen and Company |
Needham & Company |
, 2013
PART II
INFORMATION NOT REQUIRED IN THE PROSPECTUS
Item 13. Other Expenses of Issuance and Distribution.
Estimated expenses, other than underwriting discounts and commissions, payable by the Registrant in connection with the sale of the common stock being registered under this registration statement are as follows:
SEC registration fee |
$ | 10,667 | ||
FINRA filing fee |
12,230 | |||
NASDAQ Listing fee |
125,000 | |||
Printing and engraving expenses |
250,000 | |||
Legal fees and expenses |
1,100,000 | |||
Accounting fees and expenses |
900,000 | |||
Transfer agent and registrar fees and expenses |
20,000 | |||
Miscellaneous |
82,103 | |||
Total |
$ | 2,500,000 | ||
Item 14. Indemnification of Directors and Officers.
On completion of this offering, the Registrant's amended and restated certificate of incorporation will contain provisions that eliminate, to the maximum extent permitted by the General Corporation Law of the State of Delaware, the personal liability of the Registrant's directors and executive officers for monetary damages for breach of their fiduciary duties as directors or officers. The Registrant's amended and restated certificate of incorporation and bylaws will provide that the Registrant must indemnify its directors and executive officers and may indemnify its employees and other agents to the fullest extent permitted by the General Corporation Law of the State of Delaware.
Sections 145 and 102(b)(7) of the General Corporation Law of the State of Delaware provide that a corporation may indemnify any person made a party to an action by reason of the fact that he or she was a director, executive officer, employee or agent of the corporation or is or was serving at the request of a corporation against expenses (including attorneys' fees), judgments, fines and amounts paid in settlement actually and reasonably incurred by him or her in connection with such action if he or she acted in good faith and in a manner he or she reasonably believed to be in, or not opposed to, the best interests of the corporation and, with respect to any criminal action or proceeding, had no reasonable cause to believe his or her conduct was unlawful, except that, in the case of an action by or in right of the corporation, no indemnification may generally be made in respect of any claim as to which such person is adjudged to be liable to the corporation.
The Registrant has entered into indemnification agreements with its directors and executive officers, in addition to the indemnification provided for in its amended and restated certificate of incorporation and bylaws, and intends to enter into indemnification agreements with any new directors and executive officers in the future.
The Registrant has purchased and intend to maintain insurance on behalf of each person who is or was a director or officer of the Registrant against any loss arising from any claim asserted against him or her and incurred by him or her in any such capacity, subject to certain exclusions.
The Underwriting Agreement (Exhibit 1.1 hereto) provides for indemnification by the underwriters of the Registrant and its executive officers and directors, and by the Registrant of the underwriters, for certain liabilities, including liabilities arising under the Securities Act.
See also the undertakings set out in response to Item 17 herein.
II-1
Item 15. Recent Sales of Unregistered Securities.
During the last three years, we sold the following unregistered securities:
- (1)
- From
July 1, 2010 through June 30, 2013, we sold and issued to our employees, consultants or former service providers an aggregate of 879,319
shares of common stock pursuant to option exercises under the 2003 Equity Incentive Plan at prices ranging from $0.26 to $8.84 per share for an aggregate purchase price of $2,157,653.28.
- (2)
- From
July 1, 2010 through June 30, 2013, we granted options under our 2003 Equity Incentive Plan to purchase an aggregate of 3,211,978 shares
of common stock to our employees, directors and consultants, having exercise prices ranging from $6.14 to $11.28 per share for an aggregate exercise price of $24,343,139.01.
- (3)
- In
May 2011, we issued to a consultant an aggregate of 4,040 shares of common stock at a purchase price of $6.14 per share for an aggregate purchase price
of $24,789.44. The consultant paid for the purchase price of such shares of common stock with services rendered in connection with identifying certain employee candidates for us.
- (4)
- In January and February 2011, we sold and issued 2,014,641 shares of Series H preferred stock to 3 accredited investors, at $9.93 per share, for a total consideration of $20.0 million.
None of the foregoing transactions involved any underwriters, underwriting discounts or commissions, or any public offering, and the registrant believes that each transaction was exempt from the registration requirements of the Securities Act in reliance on the following exemptions:
- •
- with respect to the transactions described in paragraphs (1) and (2), Rule 701 promulgated under the
Securities Act as transactions pursuant to a compensatory benefit plan approved by the registrant's board of directors or Section 4(2) of the Securities Act as transactions by an issuer not
involving a public offering;
- •
- with respect to the transactions described in paragraph (3), Section 4(2) of the Securities Act as
transactions by an issuer not involving a public offering; and
- •
- with respect to the transactions described in paragraph (4), Section 4(2) of the Securities Act, or Rule 506 of Regulation D promulgated thereunder, as transactions by an issuer not involving a public offering. Each recipient of the securities in these transactions represented his or her intention to acquire the securities for investment only and not with a view to, or for resale in connection with, any distribution thereof, and appropriate legends were affixed to the share certificates issued in each such transaction. In each case, the recipient received adequate information about the Registrant or had adequate access, through his or her relationship with the registrant, to information about the Registrant.
Item 16. Exhibits and Financial Statement Schedules.
(a) Exhibits:
See Exhibit Index immediately following the signature pages.
(b) Financial Statement Schedules.
All other schedules have been omitted because the information required to be presented in them is not applicable or is shown in the consolidated financial statements or related notes.
II-2
The undersigned Registrant hereby undertakes to provide to the underwriters at the closing specified in the Underwriting Agreement, certificates in such denominations and registered in such names as required by the underwriters to permit prompt delivery to each purchaser.
Insofar as indemnification for liabilities arising under the Securities Act may be permitted to directors, officers and controlling persons of the Registrant pursuant to the foregoing provisions, or otherwise, the Registrant has been advised that in the opinion of the Securities and Exchange Commission such indemnification is against public policy as expressed in the Securities Act and is, therefore, unenforceable. In the event that a claim for indemnification against such liabilities (other than the payment by the Registrant of expenses incurred or paid by a director, officer or controlling person of the Registrant in the successful defense of any action, suit or proceeding) is asserted by such director, officer or controlling person in connection with the securities being registered, the Registrant will, unless in the opinion of its counsel the matter has been settled by controlling precedent, submit to a court of appropriate jurisdiction the question whether such indemnification by it is against public policy as expressed in the Securities Act and will be governed by the final adjudication of such issue.
The undersigned Registrant hereby undertakes that:
- (1)
- For
purposes of determining any liability under the Securities Act, the information omitted from the form of prospectus filed as part of this Registration
Statement in reliance upon Rule 430A and contained in a form of prospectus filed by the Registrant pursuant to Rule 424(b)(1) or (4) or 497(h) under the Securities Act shall be
deemed to be part of this Registration Statement as of the time it was declared effective.
- (2)
- For
the purpose of determining any liability under the Securities Act, each post-effective amendment that contains a form of prospectus shall be
deemed to be a new registration statement relating to the securities offered therein, and the offering of such securities at that time shall be deemed to be the initial bona fide offering thereof.
- (3)
- That,
for the purpose of determining liability of the registrant under the Securities Act of 1933 to any purchaser in the initial distribution of the
securities: the undersigned Registrant undertakes that in a primary offering of securities of the undersigned Registrant pursuant to this registration statement, regardless of the underwriting method
used to sell the securities to the purchaser, if the securities are offered or sold to such purchaser by means of any of the following communications, the undersigned Registrant will be a seller to
the purchaser and will be considered to offer or sell such securities to such purchaser:
- (i)
- Any
preliminary prospectus or prospectus of the undersigned Registrant relating to the offering required to be filed pursuant to Rule 424;
- (ii)
- Any
free writing prospectus relating to the offering prepared by or on behalf of the undersigned Registrant or used or referred to by the undersigned
Registrant;
- (iii)
- The
portion of any other free writing prospectus relating to the offering containing material information about the undersigned Registrant or its
securities provided by or on behalf of the undersigned Registrant; and
- (iv)
- Any other communication that is an offer in the offering made by the undersigned Registrant to the purchaser.
II-3
Pursuant to the requirements of the Securities Act of 1933, the registrant has duly caused this registration statement to be signed on its behalf by the undersigned, thereunto duly authorized, in the City of Salt Lake City, State of Utah, on July 19, 2013.
| CONTROL4 CORPORATION | ||||
By: |
/s/ MARTIN PLAEHN Martin Plaehn President and Chief Executive Officer |
|||
Pursuant to the requirements of the Securities Act of 1933, this registration statement has been signed by the following persons in the capacities and on July 19, 2013:
Signature
|
Title
|
|
|---|---|---|
| /s/ MARTIN PLAEHN Martin Plaehn |
Director, President and Chief Executive Officer (Principal Executive Officer) |
|
/s/ DAN STRONG Dan Strong |
Chief Financial Officer (Principal Financial and Accounting Officer) |
|
* William B. West |
Chairman of the Board of Directors |
|
* Rob Born |
Director |
|
* David C. Habiger |
Director |
|
* Len Jordan |
Director |
|
* Christopher B. Paisley |
Director |
|
* Scott Petty |
Director |
|
* Steven Vassallo |
Director |
| *By | /s/ DAN STRONG Dan Strong Attorney-in-Fact |
II-4
| Exhibit Number |
Exhibit Title | ||
|---|---|---|---|
| 1.1 | ** | Form of Underwriting Agreement. | |
| 3.1 | ** | Amended and Restated Certificate of Incorporation of the Registrant, as currently in effect. | |
| 3.1.1 | Certificate of Amendment to the Amended and Restated Certificate of Incorporation of the Registrant, as currently in effect. | ||
| 3.2 | ** | Form of Amended and Restated Certificate of Incorporation of the Registrant, to be effective upon closing of the offering. | |
| 3.3 | ** | Bylaws of the Registrant, as currently in effect. | |
| 3.4 | ** | Form of Amended and Restated Bylaws of the Registrant, to be effective upon closing of the offering. | |
| 4.1 | ** | Specimen Common Stock Certificate of the Registrant. | |
| 4.2 | ** | Eighth Amended and Restated Investors' Rights Agreement, dated January 21, 2011. | |
| 4.3 | ** | Warrant to Purchase Shares of the Common Stock of the Registrant issued to Control UI, LLC, dated October 25, 2010. | |
| 4.4 | ** | Warrant to Purchase Stock of the Registrant issued to Silicon Valley Bank, dated December 29, 2005. | |
| 4.5 | ** | Warrant to Purchase Stock of the Registrant issued to Silicon Valley Bank, dated June 13, 2007. | |
| 5.1 | Opinion of Goodwin Procter LLP. | ||
| 10.1 | **# | Form of Director and Executive Officer Indemnification Agreement. | |
| 10.2 | **# | 2003 Equity Incentive Plan and forms of option agreements thereunder. | |
| 10.3 | **# | 2013 Stock Option and Incentive Plan and forms of option agreements thereunder to be in effect upon the closing of this offering. | |
| 10.4 | **# | Offer Letter to Martin Plaehn, dated August 20, 2011. | |
| 10.5 | **# | Employment Agreement, dated July 28, 2003 and as amended on June 17, 2004 and August 3, 2011, between the Registrant and William B. West. | |
| 10.6 | **# | Employment Agreement, dated on or about January 4, 2008, between the Registrant and Dan Strong. | |
| 10.7 | **# | Offer Letter to Jeff Dungan, dated August 1, 2006. | |
| 10.8 | **# | Offer Letter to Eric Anderson, dated June 19, 2012. | |
| 10.9 | ** | Relationship Agreement, dated June 27, 2013, between the Registrant and Sanmina Corporation. | |
| 10.10 | ** | OEM Supply Agreement: OEM Design, dated December 3, 2010, between the Registrant and Lite-On Electronic Company Ltd. | |
| 10.11 | ** | Amended and Restated Loan and Security Agreement, dated June 17, 2013, between the Registrant and Silicon Valley Bank. | |
| 10.12 | ** | Lease dated June 29, 2004 by and between the Registrant and WDCI, Inc., as amended on May 24, 2006, February 25, 2011 and November 7, 2011. | |
| 10.13 | **# | Advisor Agreement, effective as of February 28, 2013, by and between the registrant and Tom Kuhn. | |
| 21.1 | ** | List of Subsidiaries of the Registrant. | |
| 23.1 | Consent of Ernst & Young LLP, Independent Registered Public Accounting Firm. | ||
| 23.2 | Consent of Goodwin Procter LLP (included in Exhibit 5.1). | ||
| 24.1 | ** | Power of Attorney (see page II-4 to the original filing of this registration statement on Form S-1). | |
- **
- Previously
filed.
- #
- Indicates a management contract or compensatory plan.