Attached files
| file | filename |
|---|---|
| EX-99.1 - EX-99.1 - PNC FINANCIAL SERVICES GROUP, INC. | d562498dex991.htm |
| 8-K - FORM 8-K - PNC FINANCIAL SERVICES GROUP, INC. | d562498d8k.htm |
 The PNC
Financial Services Group, Inc. Second Quarter 2013
Earnings Conference Call
July 17, 2013
Exhibit 99.2 |
 2
Cautionary Statement Regarding Forward-Looking
Information and Adjusted Information
This
presentation
includes
“snapshot”
information
about
PNC
used
by
way
of
illustration.
It
is
not
intended
as
a
full
business
or
financial
review
and
should
be viewed in the context of all of the information made available by PNC in its SEC filings.
The presentation also contains forward-looking statements regarding our
outlook
for
earnings,
revenues,
expenses,
capital
levels
and
ratios,
liquidity
levels,
asset
levels,
asset
quality,
financial
position,
and
other matters
regarding or affecting PNC and its future business and operations. Forward-looking
statements are necessarily subject to numerous assumptions, risks and uncertainties,
which change over time. The forward-looking statements in this presentation are qualified by the factors affecting forward-looking statements
identified
in
the
more
detailed
Cautionary
Statement
included
in
the
Appendix,
which
is
included
in
the
version
of
the
presentation
materials posted on our
corporate website at www.pnc.com/investorevents and in our SEC filings. We provide greater
detail regarding these as well as other factors in our 2012 Form 10-K
and
1
Quarter
2013
Form
10-Q,
including
in
the
Risk
Factors
and
Risk
Management
sections
and
in
the
Legal
Proceedings
and
Commitments and
Guarantees Notes of the Notes To Consolidated Financial Statements in those reports, and in
our subsequent SEC filings. Our forward-looking statements may also be subject to
other risks and uncertainties, including those we may discuss in this presentation or in SEC filings, accessible on the SEC’s website at
www.sec.gov and on PNC’s corporate website at www.pnc.com/secfilings. We have included
web addresses in this presentation as inactive textual references only. Information on
those websites is not part of this presentation. Future events or circumstances may change our outlook and may also affect the nature of
the assumptions, risks and uncertainties to which our forward-looking statements are
subject. Forward-looking statements in this presentation speak only as of the date
of this presentation. We do not assume any duty and do not undertake to update those statements. Actual results or future events could differ, possibly
materially, from those anticipated in forward-looking statements, as well as from
historical performance. In
this
presentation,
we
may
sometimes
refer
to
adjusted
results
to
help
illustrate
the
impact
of
certain
types
of
items,
such
as
provisions
for residential
mortgage repurchase obligations, gains on sales of a portion of our VISA shares, non-cash
charges related to redemptions of trust preferred securities, expenses for residential
mortgage foreclosure-related matters, and integration costs. This information supplements our results as reported in accordance with GAAP and
should not be viewed in isolation from, or as a substitute for, our GAAP results. We believe
that this additional information and the reconciliations we provide may be useful to
investors, analysts, regulators and others to help evaluate the impact of these respective items on our operations. We may also provide
information on the components of net interest income (purchase accounting accretion and the
core remainder), the impact of purchase accounting accretion on net interest margin,
core net interest margin (net interest margin less (annualized purchase accounting accretion divided by average interest-earning assets)),
and pretax pre-provision earnings (total revenue less noninterest expense). Where
applicable, we provide GAAP reconciliations for such additional information, including
in the slides, the Appendix and/or other slides and materials on our corporate website at www.pnc.com/investorevents and in our SEC filings. In
certain discussions, we may also provide information on yields and margins for all
interest-earning assets calculated using net interest income on a taxable-
equivalent basis by increasing the interest income earned on tax-exempt assets to make it
fully equivalent to interest income earned on taxable investments. We believe this
adjustment may be useful when comparing yields and margins for all earning assets. We may also use annualized, proforma, estimated or third
party numbers for illustrative or comparative purposes only. These may not reflect actual
results. This presentation may also include discussion of other non-GAAP financial
measures, which, to the extent not so qualified therein or in the Appendix, is qualified
by GAAP reconciliation information available on our corporate website at www.pnc.com under
“About PNC–Investor Relations.” st |
 3
2Q13 Highlights
Strong financial performance: Net income of $1.1 billion; EPS of
$1.99; ROAA of 1.49%
Select items:
–
Asset sales and valuations
–
Lower provision for credit losses
–
Additional provision for residential mortgage repurchase obligations
Continued improvement in overall credit quality and capital position
Demonstrated progress on strategic priorities
–
Client fee income growth
PNC Is Well-Positioned to Continue to Create Shareholder Value.
|
 4
Continued Loan Growth and Capital Improvement
Investment securities declined
from end of 1Q13 primarily due
to prepayments, maturities and
sales which exceeded purchases
–
Securities run-off reinvested
for future delivery at higher
rates
Continued growth in loans
of
$3.3 billion over end of 1Q13
–
Commercial lending increased
$3.0 billion or 2.7% as a
result of asset-based lending,
healthcare, real estate and
public finance
Capital ratios and shareholders’
equity increased despite the
decline in AOCI
(5)
(1)
Estimated as of June 30, 2013. (2)
See Note 1 in the Appendix for further details. (3) PNC’s pro forma Basel III Tier 1
common capital ratio was estimated without benefit of phase-ins. See
Estimated Pro forma Basel III Tier 1 Common Capital and related information in the Appendix
for further details. (4) Pro forma Basel III Tier 1 common capital ratio estimate not provided
in 2Q12. (5) Accumulated other comprehensive income.
Highlights
% change from:
Category (billions)
Jun. 30,
2013
Mar. 31,
2013
Jun. 30,
2012
Investment securities
$57
(3.2%)
(7.2%)
Total commercial lending
$113
2.7%
8.8%
Total consumer lending
77
0.4%
0.3%
Total loans
$190
1.8%
5.2%
Total assets
$304
1.2%
1.6%
Transaction deposits
176
0.1%
5.7%
Total deposits
$212
0.3%
2.6%
Total shareholders’
equity
$40
1.6%
8.9%
Capital ratios
(1)
:
Basel I Tier 1 common capital
ratio
(2)
10.1%
9.8%
9.3%
Pro forma Basel III Tier 1
common capital ratio
(3)
8.2%
8.0%
*
(4)
Balances at period-end |
 5
Revenue Growth and Improved Credit Quality Drove
Profitability and Returns
Highlights
Revenue grew 3% linked
quarter driven by higher
noninterest income partially
offset by lower net interest
income
Expense grew 2% linked
quarter, as expected, reflecting
disciplined expense
management
Pretax pre-provision earnings
(1)
grew 4% linked quarter
primarily due to higher
noninterest income
Credit costs declined as overall
credit trends continued to
improve
ROAA and ROACE increased to
1.49% and 11.81%
(millions)
2Q13
1Q13
2Q12
Net interest income
$2,258
$2,389
$2,526
Noninterest income
1,806
1,566
1,097
Total revenue
$4,064
$3,955
$3,623
Noninterest expense
($2,435)
($2,395)
($2,648)
Pretax pre-provision
earnings
(1)
$1,629
$1,560
$975
Provision
(157)
(236)
(256)
Pretax earnings
(2)
1,472
1,324
719
Net income
$1,123
$1,004
$546
Returns
ROAA
(3)
1.49%
1.34%
.74%
ROACE
(3)
11.81%
10.68%
6.23%
(1),(2),(3) See Notes 2, 3 and 4 respectively in the Appendix for additional details.
|
 6
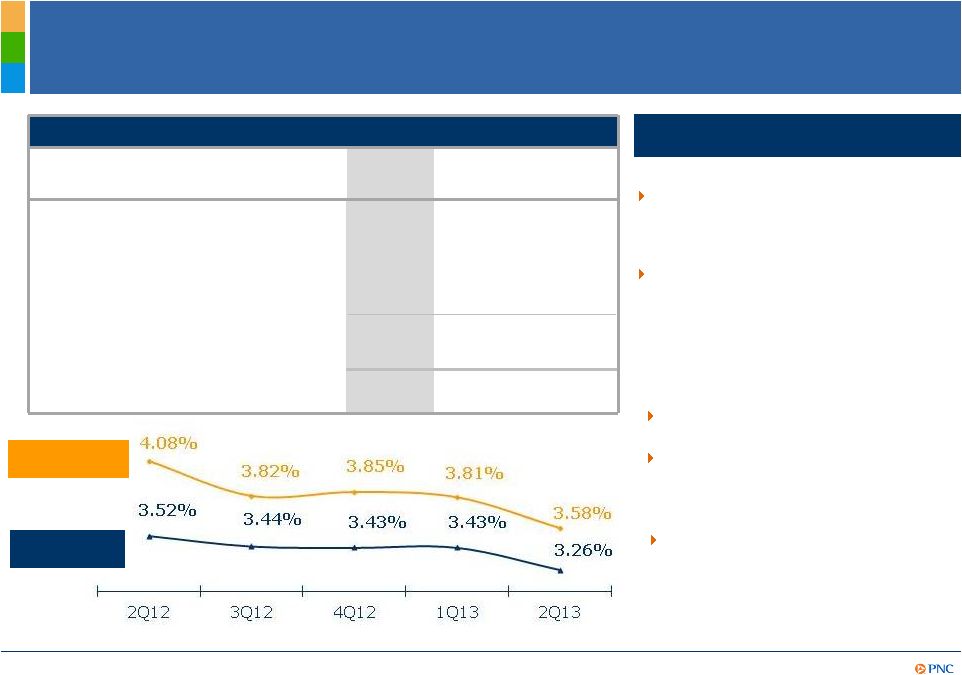
Net Interest Income and NIM Declined
(1) Core net interest income (Core NII) is total net interest income (NII), as reported, less
related purchase accounting accretion (scheduled and excess cash recoveries). (2) See
Note 5 in Appendix for further details. (3) Net interest margin less (annualized PAA/average interest-earning
assets). See Reconcilement in Appendix. (4) Refer to Cautionary Statement in the Appendix,
including economic and other assumptions. Core NII
(1)
$2,054
$2,140
$2,183
Scheduled accretion
193
199
292
Excess cash recoveries
(2)
11
50
51
Total purchase accounting
accretion (PAA)
204
249
343
Total NII
$2,258
$2,389
$2,526
Highlights
Linked quarter:
Prior year quarter:
Average interest-earning assets
remained flat as decrease in
securities was offset by loan growth
of 1.3%
NII declined
–
Core NII
(1)
declined 4% due to
lower securities balances and
lower yields on securities and
loans, including swap maturities
–
Lower PAA, as expected
Average interest-earning assets
growth of 2% driven by loan growth
Core NII
(1)
decreased primarily due
to decline in asset yields and PAA
was also lower
Expect NII to be down modestly
when compared with 2Q13 primarily
due to decline in PAA and lower loan
yields partially offset by expected
loan growth and additional securities
invested at higher interest rates
Third Quarter 2013 Outlook
(4)
:
(billions)
2Q13
1Q13
2Q12
Average interest-earning assets
$256
$256
$250
Net interest
Margin(NIM)
Core NIM
(3)
(millions) |
 7
Diversified Businesses and Select Items Delivered
Strong Noninterest Income
Highlights
(1) Asset management includes the Asset Management Group and BlackRock. (2) Commercial
mortgage servicing rights valuation adjustments, net of economic hedge (CMSR) and
credit valuations related to customer-initiated hedging activities (CVA).
Noninterest income increased 15%
–
Strong fee income growth
partially impacted by higher
provision for residential
mortgage repurchase
obligations
–
Higher gains on asset sales
(VISA and securities) and
higher valuations (CMSR and
CVA)
(2)
due to higher interest
rates, may not continue at
2Q13 levels
Noninterest income to total
revenue increased to 44%
compared to 40%
last quarter and
30% in the prior year quarter
Linked quarter:
(millions)
2Q13
1Q13
2Q12
Asset management
(1)
$340
$308
$278
Consumer services
314
296
290
Corporate services
326
277
290
Residential mortgage
Residential mortgage banking
240
238
265
Provision for residential
mortgage repurchase
obligations
(73)
(4)
(438)
Deposit service charges
147
136
144
Fee income
$1,294
$1,251
$829
Net gains on sales of securities
less net OTTI
57
4
28
Gain on VISA sale
83
-
-
Other
372
311
240
Total noninterest income
$1,806
$1,566
$1,097
Prior Year Quarter:
Fee income increased due to lower
provision for residential mortgage
repurchase obligations and strong
growth in Asset Management,
Corporate and Consumer Services |
 8
Disciplined Expense Management While Investing for
Growth
(millions)
2Q13
1Q13
2Q12
Adjusted for specified items
(1)
:
Personnel
$1,186
$1,169
$1,107
Occupancy
206
211
198
Equipment
189
183
174
Marketing
67
45
56
Other
754
772
888
Noninterest expense, adjusted
for TPS charges and Other
specified items
(1)
$2,402
$2,380
$2,423
Trust preferred securities
redemption-related charges
30
-
130
Other specified items
3
15
95
Total noninterest expense
$2,435
$2,395
$2,648
Efficiency ratio
(4)
60%
61%
73%
Efficiency ratio, adjusted
(4,5)
59%
61%
68%
As expected, noninterest expense
increased $40 million or 2%
primarily due to:
–
Trust preferred securities
redemption charge of $30 million
and higher marketing expense
On track to exceed $700 million
CIP
(2)
target
Highlights
Linked quarter:
(1) Specified items are Trust preferred securities redemption-related charges
and Other specified items. Other specified items are residential mortgage foreclosure-related matters and
integration
costs.
See
Reconcilement
section
of
the
Appendix
for
impact
of
each
specified
item
on
each
category
of
noninterest
expense,
where
applicable.
(2)
CIP
refers
to
PNC’s
Continuous Improvement Program. (3) Refer to Cautionary Statement in the Appendix, including
economic and other assumptions. Does not take into account the impact of potential legal
and regulatory contingencies. (4) See Note 6 in the Appendix. (5) Efficiency ratio adjusted for integration costs and trust preferred securities redemption-related charges in each
quarter
where
applicable.
See
Reconcilement
section
of
the
Appendix.
Prior Year Quarter:
Noninterest expense decrease of
8% reflects lower TPS redemption
charges, lower additions to legal
reserves, 2Q12 integration costs
and decreased expenses related to
residential mortgage foreclosure-
related matters and other real
estate owned
Third Quarter 2013 Outlook
(3)
:
Expect noninterest expense to be up
modestly when compared to 2Q13 |
 Overall Credit
Quality Trends Continued to Improve Highlights
($ in millions)
2Q13
1Q13
2Q12
Commercial
lending
Provision
($27)
$55
$44
Net charge-offs
30
121
93
Build/Release
($57)
($66)
($49)
Consumer
lending
Provision
$184
$181
$212
Net charge-offs
178
335
222
Build/Release
$6
($154)
($10)
Adjusted Build/Release
(1)
($20)
Total
PNC
Provision
$157
$236
$256
Net charge-offs
208
456
315
Build/Release
($51)
($220)
($59)
Adjusted Build/Release
(1)
($86)
Total accruing
loans
past
due
(2,3)
decreased 11%
Nonperforming loans
(2,4)
of $3.3
billion declined 3%
Net charge-offs declined from
$456 million to $208 million
Provision of $157 million
decreased 33%, may not continue
at these levels
Linked quarter:
9
As of quarter end except net charge-offs and provision, which are for the quarter. (1)
Build/release adjusted for the impact to consumer lending charge-offs of $134 million related to the
alignment with regulatory guidance on consumer lending in 1Q13. See Reconcilement section of
the Appendix (2) Loans acquired from National City or RBC Bank (USA) that were impaired
are not included as they were recorded at estimated fair value when acquired and are currently
considered performing loans due to the accretion of interest in purchase accounting. (3)
Includes loans that are government guaranteed/insured, primarily residential mortgages. These
loans totaled $2.1 billion in 2Q13. (4) Does not include loans held for sale or foreclosed and
other assets. Excludes certain government insured or guaranteed loans and loans accounted for
under the fair value option. –
The impact of 1Q13 alignment
with regulatory guidance
related to consumer lending
resulted in $134 million of
the decrease
–
Commercial net charge-offs
decrease of $91 million,
may not continue at these levels
–
30-89 days declined 17%
–
90 days+ declined 8%
–
Continued commercial reserve
release |
 10
Outlook
1
–
3Q13 vs. 2Q13
(1) Refer to Cautionary Statement in the Appendix, including economic and other assumptions.
Does not take into account impact of potential legal and regulatory
contingencies. Strong financial performance in 2Q13 included select items that may not
continue at these levels
Expectation for 3Q13 vs. 2Q13: |
 11
Cautionary Statement Regarding Forward-Looking
Information
Appendix
This presentation includes “snapshot”
information about PNC used by way of illustration and is not intended as a full business or
financial review. It should not be viewed in isolation but rather in the context of all
of the information made available by PNC in its SEC filings. We also make statements in
this presentation, and we may from time to time make other statements, regarding our outlook for earnings,
revenues, expenses, capital levels and ratios, liquidity levels,
asset levels, asset quality, financial position, and other matters regarding or
affecting PNC and its future business and operations that are
forward-looking statements within the meaning of the Private Securities
Litigation Reform Act. Forward-looking statements are typically identified by words
such as “believe,” “plan,”
“expect,”
“anticipate,”
“see,”
“look,”
“intend,”
“outlook,”
“project,”
“forecast,”
“estimate,”
“goal,”
“will,”
“should”
and other similar words and expressions.
Forward-looking statements are subject to numerous assumptions, risks and uncertainties,
which change over time. Forward-looking statements speak only as of the date
made. We do not assume any duty and do not undertake to update forward-looking
statements. Actual results or future events could differ, possibly materially, from
those anticipated in forward-looking statements, as well as from historical
performance. Our forward-looking statements are subject to the following principal
risks and uncertainties. •Our businesses, financial results and balance sheet values are affected by business and economic conditions,
including the following:
•Changes
in interest rates and valuations in debt, equity and other financial markets.
•Disruptions
in the liquidity and other functioning of U.S. and global financial markets.
•The
impact on financial markets and the economy of any changes in the credit ratings of U.S. Treasury obligations and other U.S.
government-backed debt, as well as issues surrounding the level of U.S.
and European government debt and concerns regarding
the creditworthiness of certain sovereign governments, supranationals and financial
institutions in Europe. •Actions by Federal Reserve, U.S. Treasury and other government agencies, including those that impact money
supply and market interest rates.
•Changes
in
customers’,
suppliers’
and
other
counterparties’
performance
and
creditworthiness.
•Slowing
or failure of the current moderate economic expansion. •Continued effects of aftermath of recessionary conditions and uneven spread of positive impacts of recovery on
the economy and our counterparties, including adverse impacts on levels of
unemployment, loan utilization rates, delinquencies, defaults and counterparty ability
to meet credit and other obligations. •Changes in customer preferences and behavior, whether due to changing business and economic conditions,
legislative and regulatory initiatives, or other factors.
•Our
forward-looking financial statements are subject to the risk that economic and financial market conditions will be substantially different
than we are currently expecting.
These statements are based on our current view that the moderate
U.S. economic expansion will persist,
despite drags from Federal fiscal restraint and a European recession, and short-term
interest rates will remain very low but bond yields will
be higher in the second half of 2013. These forward-looking statements also do not,
unless otherwise indicated, take into account the
impact of potential legal and regulatory contingencies. |
 12
Cautionary Statement Regarding Forward-Looking
Information (continued)
Appendix
•PNC’s ability to take certain capital actions, including paying dividends and any plans to increase common stock dividends,
repurchase common stock under
current or future programs, or issue or redeem preferred stock or other regulatory capital instruments, is subject to the
review of such proposed actions by the Federal Reserve as part of PNC’s comprehensive
capital plan for the applicable period in connection with the regulators’
Comprehensive Capital Analysis and Review (CCAR) process and
to
the acceptance of such capital plan and non-
objection to such capital actions by the Federal Reserve.
•PNC’s regulatory capital ratios in the future will depend on, among other things, the company’s financial performance, the scope and terms
of final capital regulations then in effect (particularly those implementing the Basel Capital
Accords), and management actions affecting the composition of PNC’s balance
sheet. In addition, PNC’s ability to determine, evaluate and forecast regulatory
capital ratios, and to take
actions (such as capital distributions) based on actual or forecasted capital ratios, will be
dependent on the ongoing development, validation and regulatory approval of related
models. •Legal and regulatory
developments could have an impact on our ability to operate our businesses, financial condition, results
of operations,
competitive position, reputation, or pursuit of attractive acquisition opportunities.
Reputational impacts could affect matters such as
business generation and retention, liquidity, funding, and ability to attract and retain
management. These developments could include:
•Changes resulting from legislative and
regulatory reforms, including major reform of the regulatory oversight structure of the
financial services industry and changes to laws and regulations involving tax, pension,
bankruptcy, consumer protection, and other industry aspects, and changes in accounting
policies and principles. We will be impacted by extensive reforms provided for in the
Dodd-Frank Wall Street Reform and Consumer Protection Act (the “Dodd-Frank
Act”) and otherwise growing out of the recent financial crisis, the precise
nature, extent and timing of which, and their impact on us, remains uncertain.
•Changes to regulations governing bank
capital and liquidity standards, including due to the Dodd-Frank Act and to Basel-related
initiatives.
•Unfavorable resolution of legal
proceedings or other claims and regulatory and other governmental investigations or other inquiries.
In addition to matters relating to PNC’s business and activities, such matters may
include proceedings, claims, investigations, or
inquiries relating to pre-acquisition business and activities of acquired companies, such
as National City. These matters may result in monetary judgments or settlements
or other remedies, including fines, penalties, restitution or alterations in our business
practices, and in additional expenses and collateral costs, and may cause reputational harm to
PNC. •Results of the regulatory
examination and supervision process, including our failure to satisfy requirements of agreements with
governmental agencies.
•Impact on business and operating
results of any costs associated with obtaining rights in intellectual property
claimed by others and of adequacy of our intellectual property protection in
general. |
 13
Cautionary Statement Regarding Forward-Looking
Information (continued)
Appendix
•Business and operating results are
affected by our ability to identify and effectively manage risks inherent in our businesses, including,
where appropriate, through effective use of third-party insurance, derivatives, and
capital management techniques, and to meet evolving
regulatory capital standards. In particular, our results currently depend on our ability
to manage elevated levels of impaired assets. •Business and operating results also include impacts relating to our equity interest in BlackRock, Inc. and rely to a significant
extent on
information provided to us by BlackRock. Risks and uncertainties that could affect
BlackRock are discussed in more detail by BlackRock in its SEC filings.
•We grow our business in part by
acquiring from time to time other financial services companies, financial services assets and related
deposits and other liabilities. Acquisition risks and uncertainties include those
presented by the nature of the business acquired, including in some cases those
associated with our entry into new businesses or new geographic or other markets and risks resulting from our
inexperience in those new areas, as well as risks and uncertainties related to the acquisition
transactions themselves, regulatory issues, and the integration of the acquired
businesses into PNC after closing.
•Competition can have an impact on
customer acquisition, growth and retention and on credit spreads and product pricing, which can affect
market share, deposits and revenues. Industry restructuring in the current environment
could also impact our business and financial performance through changes in
counterparty creditworthiness and performance and in the competitive and regulatory
landscape. Our
ability to anticipate and respond to technological changes can also impact our ability to
respond to customer needs and meet competitive demands.
•Business and operating results can also
be affected by widespread natural and other disasters, dislocations, terrorist activities or
international hostilities through impacts on the economy and financial markets generally or on
us or our counterparties specifically. We provide greater detail regarding these as well
as other factors in our 2012 Form 10-K and 1
Quarter 2013 Form 10-Q, including in the
Risk Factors and Risk Management sections and the Legal Proceedings and Commitments and
Guarantees Notes of the Notes To Consolidated Financial Statements in those reports,
and in our subsequent SEC filings. Our forward-looking statements may also be subject
to other risks and uncertainties, including those we may discuss
elsewhere in this presentation or in SEC filings, accessible on
the SEC’s
website at www.sec.gov and on our corporate website at www.pnc.com/secfilings. We have
included these web addresses as inactive textual references only. Information on
these websites is not part of this document. Any annualized, proforma, estimated, third
party or consensus numbers in this presentation are used for illustrative or comparative
purposes only and may not reflect actual results. Any consensus
earnings estimates are calculated based on the earnings projections
made by analysts who cover that company. The analysts’
opinions, estimates or forecasts (and therefore the consensus earnings
estimates) are theirs alone, are not those of PNC or its management, and may not reflect
PNC’s or other company’s actual or anticipated results.
st |
 14
Notes
Appendix
Explanatory Notes
(1) Basel I Tier 1 common capital ratio is period-end Basel I Tier 1 common capital
divided by period-end Basel I risk-weighted assets.
(5) Excess cash recoveries represent cash payments from customers that exceeded the recorded
investment of the designated impaired loans.
(3) Pretax earnings is defined as income before income taxes and noncontrolling interests.
(6) Efficiency ratio calculated as noninterest expense divided by total revenue.
(2) Pretax pre-provision earnings is defined as total revenue less noninterest expense. We
believe that pretax pre-provision earnings, a non-GAAP measure, is useful as a
tool to help evaluate the ability to provide for credit costs through operations. (4)
ROAA is Return on Average Assets and ROACE is Return on Average Common Shareholders' Equity. |
 15
Estimated Pro forma Basel III Tier 1 Common Capital
Appendix
Basel I Tier 1 Common Capital Ratio
Dollars in millions
June 30, 2013 (a)
March 31, 2013
December 31, 2012
Basel I Tier 1 common capital
$26,694
$25,680
$24,951
Basel I risk-weighted assets
265,449
261,491
260,847
Basel I Tier 1 common capital ratio
10.1%
9.8%
9.6%
(a) Estimated as of June 30, 2013.
Estimated Pro forma Basel III Tier 1 Common Capital Ratio
Dollars in millions
June 30, 2013
March 31, 2013
December 31, 2012
Basel I Tier 1 common capital
$26,694
$25,680
$24,951
Less regulatory capital adjustments:
Basel III quantitative limits
(2,216)
(2,076)
(2,330)
Accumulated other comprehensive income (a)
(241)
289
276
All other adjustments
(311)
(367)
(396)
Estimated Basel III Tier 1 common capital
$23,926
$23,526
$22,501
Estimated Basel III risk-weighted assets
292,414
293,810
301,006
Pro forma Basel III Tier 1 common capital ratio
8.2%
8.0%
7.5%
(a) Represents net adjustments related to accumulated other comprehensive income
for available for sale securities and pension and other postretirement benefit plans.
We
provide
information
below
regarding
PNC’s
pro
forma
fully
phased-in
Basel
III
Tier
1
common
capital
ratio
and
how
it
differs
from
the
Basel
I Tier 1 common capital ratio as the Basel III ratio will replace the current Basel I ratio
for this regulatory metric when PNC exits the parallel run qualification phase. The
Federal Reserve Board announced final rules implementing Basel III on July 2, 2013. PNC continues its evaluation
of these rules. Pending completion of that evaluation, we have estimated our Basel III capital
information set forth below, as we have in prior disclosures, based on our
understanding of the prior Basel III rule proposals. Tier 1 common capital as defined
under the Basel III rules differs materially from Basel I. For example, under Basel III, significant common
stock investments in unconsolidated financial institutions, mortgage servicing rights and
deferred tax assets must be deducted from capital to the extent they individually
exceed 10%, or in the aggregate exceed 15%, of the institution's adjusted Tier 1 common capital. Also, Basel I
regulatory capital excludes certain other comprehensive income related to both available for
sale securities and pension and other postretirement plans, whereas under Basel III
these items are a component of PNC's capital. Basel III risk-weighted assets were estimated
under the advanced approaches included in the Basel III rules and application of Basel II.5,
and reflect credit, market and operational risk. PNC utilizes this capital ratio
estimate to assess its Basel III capital position (without benefit of phase-ins),
including comparison to similar estimates made by other financial institutions. This
Basel III capital estimate is likely to be impacted by PNC's ongoing analysis of the recently
issued Basel III final rules and the ongoing evolution, validation and regulatory approval of
PNC's models integral to the calculation of advanced approaches risk-weighted
assets. |
 16
Non-GAAP to GAAP Reconcilement
Appendix
$ in millions
Jun. 30, 2013
Mar. 31, 2013
Jun. 30, 2012
Total revenue, as reported
$4,064
$3,955
$3,623
Total noninterest expense, as reported
$2,435
$2,395
$2,648
Efficiency ratio, as reported
60%
61%
73%
Total revenue, as reported
$4,064
$3,955
$3,623
Total noninterest expense, as reported
$2,435
$2,395
$2,648
Adjustments:
Noncash charges for unamortized discounts related to
redemption of trust preferred securities
(30)
-
(130)
Integration costs
-
-
(52)
Total noninterest expense, as adjusted
$2,405
$2,395
$2,466
Efficiency ratio, as adjusted
59%
61%
68%
* Efficiency ratio calculated as noninterest expense divided by total revenue.
For the three months ended
$ in millions
Jun. 30, 2013
Mar. 31, 2013
Dec. 31, 2012
Sept. 30, 2012
Jun. 30, 2012
Net interest margin, as reported
3.58%
3.81%
3.85%
3.82%
4.08%
Purchase accounting accretion (1)
$204
$249
$273
$245
$343
Purchase accounting accretion, if annualized
$818
$1,010
$1,086
$975
$1,380
Avg. interest earning assets
$256,102
$256,180
$253,643
$252,606
$250,132
Annualized purchase accounting accretion/Avg. interest earning assets
0.32%
0.38%
0.42%
0.38%
0.56%
Core net interest margin (2)
3.26%
3.43%
3.43%
3.44%
3.52%
(1) Puchase accounting accretion is scheduled purchase accounting accretion plus cash
recoveries. For the three months ended
(2) PNC believes that core net interest margin, a non-GAAP measure, is useful as a tool to
help evaluate the impact of purchase accounting accretion on net interest margin. To
calculate core net interest margin, net interest margin has been adjusted by annualized purchase accounting accretion divided by
average interest-earning assets. |
 17
Non-GAAP to GAAP Reconcilement
Appendix
In millions
Jun. 30, 2013
Mar. 31, 2013
Jun. 30, 2012
Personnel, as reported
$1,186
$1,169
$1,119
Integration costs
12
Personnel, as adjusted
1,186
1,169
1,107
Occupancy, as reported
206
211
199
Integration costs
1
Occupancy, as adjusted
206
211
198
Equipment, as reported
189
183
181
Integration costs
7
Equipment, as adjusted
189
183
174
Marketing, as reported
67
45
67
Integration costs
11
Marketing, as adjusted
67
45
56
Other, as reported
$787
$787
$1,082
Residential mortgage foreclosure-related matters
(3)
(15)
(43)
TPS redemption-related charges
(30)
-
(130)
Integration costs
-
-
(21)
Other, as adjusted
$754
$772
$888
Noninterest expense, adjusted for specified items
$2,402
$2,380
$2,423
Specified items - Total
33
15
225
Total noninterest expense
$2,435
$2,395
$2,648
For the quarter ended |
 Non-GAAP
to GAAP Reconcilement Appendix
Consumer Lending Reserve Build/Release
$ in millions
March 31, 2013
Provision for credit losses, as reported
$181
Net charge-offs, as reported
$335
Build/(Release)
($154)
Provision for credit losses, as reported
$181
Net charge-offs, as reported
$335
Net charge-offs, as adjusted
$201
Build/(Release), as adjusted
($20)
As of or for the three months ended
(1) Pursuant to alignment with interagency guidance on practices for loans and lines of credit
related to consumer lending in the first quarter of 2013, additional charge-offs of
$134 million were taken. Adjustment for impact of alignment with regulatory
guidance (1)
($134)
Total PNC Reserve Build/Release
$ in millions
March 31, 2013
Provision for credit losses, as reported
$236
Net charge-offs, as reported
$456
Build/(Release)
($220)
Provision for credit losses, as reported
$236
Net charge-offs, as reported
$456
Net charge-offs, as adjusted
$322
Build/(Release), as adjusted
($86)
As of or for the three months ended
Adjustment for impact of alignment with regulatory
guidance (1)
($134)
(1) Pursuant to alignment with interagency guidance on practices for loans and lines of credit
related to consumer lending in the first quarter of 2013, additional charge-offs of
$134 million were taken. 18 |