Attached files
| file | filename |
|---|---|
| EX-5.1 - EX-5.1 - BOISE CASCADE Co | a2215985zex-5_1.htm |
| EX-23.1 - EX-23.1 - BOISE CASCADE Co | a2215985zex-23_1.htm |
Use these links to rapidly review the document
TABLE OF CONTENTS
As filed with the Securities and Exchange Commission on July 15, 2013
No. 333-
UNITED STATES
SECURITIES AND EXCHANGE COMMISSION
Washington, D.C. 20549
FORM S-1
REGISTRATION STATEMENT
UNDER
THE SECURITIES ACT OF 1933
Boise Cascade Company
(Exact name of registrant as specified in its charter)
| Delaware | 5030 | 20-1496201 | ||
| (State or other jurisdiction of incorporation or organization) |
(Primary Standard Industrial Classification Code Number) |
(I.R.S. Employer Identification No.) |
||
1111 West Jefferson Street, Suite 300 Boise, Idaho 83702-5389 (208) 384-6161 (Address, including zip code and telephone number, including area code, of registrant's principal executive offices) |
||||
John T. Sahlberg
Senior Vice President, Human Resources and General Counsel
Boise Cascade Company
1111 West Jefferson Street, Suite 300
Boise, Idaho 83702-5389
(208) 384-6161
(Name, address, including zip code and telephone number, including area code, of agent for service)
| Copies of all communications, including communications sent to agent for service, should be sent to: | ||
Carol Anne Huff Ellen K. McIntosh Kirkland & Ellis LLP 300 North LaSalle Chicago, Illinois 60654 (312) 862-2000 |
James J. Junewicz Winston & Strawn LLP 35 W. Wacker Drive Chicago, Illinois 60601 (312) 558-5600 |
|
Approximate date of commencement of proposed sale to the public: As soon as practicable after this Registration Statement becomes effective.
If any of the securities being registered on this Form are to be offered on a delayed or continuous basis pursuant to Rule 415 under the Securities Act, check the following box. o
If this Form is filed to register additional securities for an offering pursuant to Rule 462(b) under the Securities Act, please check the following box and list the Securities Act registration statement number of the earlier effective registration statement for the same offering. o
If this Form is a post-effective amendment filed pursuant to Rule 462(c) under the Securities Act, check the following box and list the Securities Act registration statement number of the earlier effective registration statement for the same offering. o
If this Form is a post-effective amendment filed pursuant to Rule 462(d) under the Securities Act, check the following box and list the Securities Act registration statement number of the earlier effective registration statement for the same offering. o
Indicate by check mark whether the registrant is a large accelerated filer, an accelerated filer, a non-accelerated filer, or a smaller reporting company. See the definitions of "large accelerated filer," "accelerated filer" and "smaller reporting company" in Rule 12b-2 of the Exchange Act (Check one):
| Large accelerated filer o | Accelerated filer o | Non-accelerated filer ý (Do not check if a smaller reporting company) |
Smaller reporting company o |
CALCULATION OF REGISTRATION FEE
|
||||||||
| Title of Each Class of Securities to be Registered |
Amount to be Registered(1) |
Proposed Maximum Offering Price Per Share(2) |
Proposed Maximum Offering Price(2) |
Amount of Registration Fee(3) |
||||
|---|---|---|---|---|---|---|---|---|
Common Stock, $0.01 par value per share |
11,500,000 | $27.02 | $310,730,000 | $42,384 | ||||
|
||||||||
- (1)
- Includes
shares of common stock that may be sold if the option to purchase additional shares granted by the selling stockholder to the underwriters is
exercised in full.
- (2)
- Estimated
solely for the purpose of calculating the registration fee pursuant to Rule 457(c) under the Securities Act of 1933, as amended, on the
basis of the average high and low prices of the registrant's common stock on July 10, 2013, as reported by the New York Stock Exchange.
- (3)
- Calculated by multiplying 0.00013640 by the proposed maximum offering price.
The registrant hereby amends this Registration Statement on such date or dates as may be necessary to delay its effective date until the registrant shall file a further amendment which specifically states that this Registration Statement shall thereafter become effective in accordance with Section 8(a) of the Securities Act of 1933 or until this Registration Statement shall become effective on such date as the Commission, acting pursuant to said Section 8(a), may determine.
The information in this prospectus is not complete and may be changed. These securities may not be sold until the registration statement filed with the Securities and Exchange Commission is effective. This prospectus is not an offer to sell these securities nor a solicitation of an offer to buy these securities in any jurisdiction where the offer and sale is not permitted.
Subject to Completion
Preliminary Prospectus dated July 15, 2013
PROSPECTUS
10,000,000 Shares

Boise Cascade
Common Stock
The selling stockholder named in this prospectus is selling 10,000,000 shares of our common stock. We will not receive any of the proceeds from the sale of the shares of common stock being sold in this offering.
Our common stock is traded on the New York Stock Exchange under the symbol "BCC." On July 12, 2013, the last reported sale price of our common stock on the New York Stock Exchange was $28.16 per share.
Investing in our common stock involves risks that are described in the "Risk Factors" section beginning on page 14 of this prospectus.
| |
Per Share
|
Total
|
|||||
|---|---|---|---|---|---|---|---|
Public offering price |
$ | $ | |||||
Underwriting discounts |
$ | $ | |||||
Proceeds, before expenses, to the selling stockholder |
$ | $ | |||||
The underwriters may also exercise their option to purchase up to 1,500,000 additional shares from the selling stockholder at the public offering price, less the underwriting discount, for a period of 30 days after the date of this prospectus. We will not receive any of the proceeds from the sale of shares by the selling stockholder if the underwriters exercise their option to purchase additional shares of common stock.
Neither the Securities and Exchange Commission nor any state securities commission has approved or disapproved of these securities or determined if this prospectus is truthful or complete. Any representation to the contrary is a criminal offense.
The shares will be ready for delivery on or about , 2013.
| BofA Merrill Lynch | Goldman, Sachs & Co. |
| Deutsche Bank Securities | J.P. Morgan | Wells Fargo Securities | ||
Barclays |
Citi |
D.A. Davidson & Co. |
The date of this prospectus is , 2013.

Neither we, the selling stockholder nor the underwriters have authorized anyone to provide you with any information other than that contained in this prospectus or in any free writing prospectus prepared by or on behalf of us or to which we have referred you. The selling stockholder is offering to sell, and seeking offers to buy, shares of our common stock only in jurisdictions where such offers and sales are permitted. The information in this prospectus or any free writing prospectus is accurate only as of its date, regardless of its time of delivery or the time of any sale of shares of our common stock. Our business, financial condition, results of operations and prospects may have changed since that date.
i
The following is a summary of material information discussed in this prospectus or in the documents incorporated by reference herein. This summary may not contain all the details concerning our business, our common stock or other information that may be important to you. You should carefully review this entire prospectus, including the "Risk Factors" section and our consolidated financial statements and the notes thereto incorporated by reference in this prospectus, before making an investment decision. Unless the context requires otherwise, references herein to "Boise Cascade," "we," "us" or "our" refer to Boise Cascade Company and its predecessor, Boise Cascade, L.L.C., together with its subsidiaries. For a definition of EBITDA, see Note 6 to "—Summary Historical Consolidated Financial Data." In addition, for a definition of segment income (loss) and a reconciliation of segment income (loss) to EBITDA for the twelve months ended March 31, 2013 ("LTM" or the "LTM period"), see "Business—Wood Products" and "—Building Material Distribution," as applicable.
We are a large, vertically-integrated wood products manufacturer and building materials distributor with widespread operations throughout the United States and Canada. We believe we are one of the largest stocking wholesale distributors of building products in the United States. We are the second largest manufacturer of laminated veneer lumber ("LVL"), I-joists (together "engineered wood products" or "EWP") and plywood in North America, according to Resource Information Systems Inc.'s ("RISI") Capacity Report ("RISI's Capacity Report"). Our broad line of products is used primarily in new residential construction, residential repair and remodeling projects, light commercial construction and industrial applications. We have a broad base of more than 4,500 customers, which includes a diverse mix of retail lumberyards, home improvement centers, leading wholesalers and industrial converters. We believe our large, vertically-integrated operations provide us with significant advantages over less integrated competitors and position us to optimally serve our customers. For the LTM period, we generated sales of $2,937.0 million, net income of $120.7 million, adjusted net income of $52.0 million and EBITDA of $115.1 million.
We supply our customers through 49 strategically located facilities (consisting of 18 manufacturing facilities and 31 distribution facilities). In addition to the vertical integration between our manufacturing and distribution operations, our EWP manufacturing facilities are closely integrated with our nearby plywood operations, which allows us to optimize both production processes. Throughout the housing downturn, we have continued to make strategic capital investments to increase our manufacturing capacity and expand our building materials distribution network. We believe that our scale, closely integrated businesses and significant capital investments throughout the downturn provide us with substantial operating leverage to benefit from a recovery in the U.S. housing market.
1
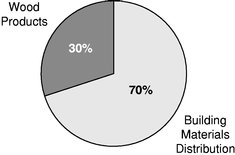
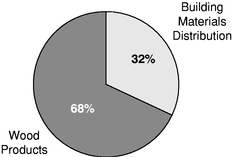
We operate our company through two primary segments: our Wood Products segment and our Building Materials Distribution segment. The charts below summarize the breakdown of our business for the LTM period.
| LTM SALES BY SEGMENT(1)(2) | LTM EBITDA BY SEGMENT(1)(3) | |
|
|
|
Total Sales: $2,937.0 million |
Total EBITDA: $115.1 million |
- (1)
- Financial
data for the LTM period presented in this prospectus is derived by adding financial data for the year ended December 31, 2012 to financial
data for the three months ended March 31, 2013 and subtracting financial data for the three months ended March 31, 2012.
- (2)
- Segment
percentages are calculated before intersegment eliminations.
- (3)
- Segment percentages exclude Corporate and Other segment expenses.
Wood Products ($90.6 million, or 68%, of LTM EBITDA). Our Wood Products segment is the second largest manufacturer of EWP and plywood in North America, according to RISI's Capacity Report, with a highly integrated national network of 17 manufacturing facilities. Our wood products are used primarily in new residential construction, residential repair and remodeling projects and light commercial construction. We manufacture LVL, I-joists and laminated beams, which are high-grade, value-added structural products used in applications where additional strength and consistent quality are required. We also produce plywood, studs, particleboard and ponderosa pine lumber, a premium lumber grade sold primarily to manufacturers of specialty wood windows, moldings and doors. Our EWP manufacturing facilities are closely integrated with our nearby plywood operations to optimize our veneer utilization by enabling us to dedicate higher quality veneers to higher margin applications and lower quality veneers to plywood products, giving us an advantage over our less integrated competitors. For the LTM period, EWP, plywood and lumber accounted for 35%, 45% and 9%, respectively, of our Wood Products sales. Most of our wood products are sold to leading wholesalers (including our Building Materials Distribution segment), home improvement centers, retail lumberyards and industrial converters. For the LTM period, approximately 38% of our Wood Products sales, including approximately 74% of our EWP sales, were to our Building Materials Distribution segment. For the LTM period, our Wood Products segment generated sales, income before interest and taxes and EBITDA of $1,001.3 million, $65.8 million and $90.6 million, respectively.
Building Materials Distribution ($41.7 million, or 32%, of LTM EBITDA). We believe we are one of the largest national stocking wholesale distributors of building materials in the United States. Our nationwide network of 31 strategically-located distribution facilities sells a broad line of building materials, including EWP, oriented strand board ("OSB"), plywood, lumber and general line items such as framing accessories, composite decking, roofing, siding and insulation. We also operate a truss manufacturing plant located in Maine. Our products are used in the construction of new residential housing, including single-family, multi-family and manufactured homes, repair and remodeling projects and the construction of light industrial and commercial buildings. Except for EWP, we purchase most of
2
these building materials from more than 1,000 third-party suppliers ranging from large manufacturers, such as James Hardie Building Products, Trex Company, Louisiana-Pacific and Georgia-Pacific, to smaller regional producers.
We market our products primarily to retail lumberyards and home improvement centers that then sell the products to end customers, who are typically professional builders, independent contractors and homeowners engaged in residential construction projects. We also market our products to industrial converters, which use our products to assemble windows, doors, agricultural bins and other value-added products used in industrial and repair and remodel applications. Unlike many of our competitors who focus primarily on a narrow range of products, we are a one-stop resource for our customers' building materials needs, which allows for more cost-efficient ordering, delivery and receiving. For the LTM period, our Building Materials Distribution segment generated sales, income before interest and taxes and EBITDA of $2,319.9 million, $32.8 million and $41.7 million, respectively.
The building products manufacturing and distribution industry in North America is highly competitive, with a number of producers manufacturing and selling a broad range of products. Demand for our products is principally influenced by new residential construction, light commercial construction and repair and remodeling activity in the United States. Drivers of new residential construction, light commercial construction and repair and remodeling activity include new household formation, the age of the housing stock, availability of credit and other macroeconomic factors, such as GDP growth, population growth and migration, interest rates, employment and consumer sentiment. Purchasing decisions made by the customers who buy our wood products are generally based on price, quality and, particularly with respect to EWP, customer service and product support.
From 2005 to 2011, total housing starts in the United States declined by more than 70%. According to the U.S. Census Bureau, total housing starts in the United States were 0.59 million in 2010, 0.61 million in 2011 and 0.78 million in 2012. While 2012 housing starts increased from 2011 levels, they remained significantly less than the 50-year average rate of 1.5 million. Prior to 2008, the housing market had not experienced a year with total housing starts below 1.0 million since the U.S. Census Bureau began its annual recordkeeping in 1959.
As of July 2013, the Blue Chip Economic Indicators median consensus forecast of single- and multi-family housing starts in the U.S. was approximately 1.00 million units for 2013 and approximately 1.20 million units for 2014, which represent annual increases of 28% and 20%, respectively. We believe that over the long-term, there is considerable growth potential in the U.S. housing sector. As of July 2013, IHS Global Insight estimates that total U.S. single- and multi-family housing starts will average 1.49 million units per year from 2013 through 2022, levels that are approaching the 50-year historical average.
Our products are not only used in new residential construction, but also in residential repair and remodeling projects. Residential repair and remodeling spending increased significantly over the past 15 years. According to the Home Improvement Research Institute ("HIRI"), total U.S. home improvement product sales increased 81.5% from $165 billion in 1996 to a peak of $300 billion in 2006. U.S. Repair and remodeling spending declined between 2006 and 2010 but posted modest growth thereafter, with total spending in 2012 equaling $276 billion. The overall age of the U.S. housing stock, increased focus on making homes more energy efficient, rising home prices and availability of consumer capital at low interest rates are expected to drive long-term growth in repair and remodeling expenditures. HIRI estimates that total U.S. sales of home maintenance, repair and improvement products will grow at a compounded annual rate of 4.6% from 2012 through 2017.
3
We believe the following key competitive strengths have contributed to our success and will enable us to execute our growth strategy:
Leadership Positions in Wood Products Manufacturing and Building Materials Distribution on a National Scale
We believe we are one of the leading manufacturers in the North American wood products industry. According to RISI's Capacity Report, we are the second largest producer of EWP and plywood in North America and we are the largest producer of plywood in the Western United States. We also operate the two largest EWP facilities in North America, as reported in RISI's Capacity Report. From 2005 to 2012, we increased our sales of LVL and I-joists per North American housing start by 69% and 37%, respectively. We have positioned ourselves to take advantage of improving demand in our core markets by expanding our EWP and plywood capacity through capital investments in low-cost, internal veneer manufacturing.
We believe we are one of the largest national stocking wholesale distributors of building materials in the United States and we believe we offer one of the broadest product lines in the industry. Measured on a sales-per-housing start basis, our Building Materials Distribution business has grown significantly from 2005 to 2012, with penetration increasing from $1,476 to $2,806, or approximately 90%, per U.S. housing start. Our national platform of 31 strategically-located distribution facilities supplies products to all major markets in the United States and provides us with significant scale and capacity relative to most of our competitors; however, certain of our competitors are larger than we are and may have greater scale and capacity than we do.
Strongly Situated to Serve our Customers with Vertically-Integrated Manufacturing and Distribution Operations
We believe that we are the only large-scale manufacturer of plywood and EWP in North America that is vertically-integrated from log procurement through distribution. The integration of our manufacturing and distribution operations allows us to make procurement, manufacturing, veneer merchandising and marketing decisions that reduce our manufacturing and supply chain costs and allow us to more effectively control quality and working capital. Furthermore, our vertically-integrated operations combined with our national distribution network significantly enhance our ability to assure product supply for our end customers. We believe our vertical integration was an important factor in our ability to increase market share during the recent housing downturn.
Low-Cost Manufacturing and Distribution Footprint
We believe that we have a highly competitive asset base across both of our operating segments, in part because we continued to strategically invest throughout the housing downturn. Our large-scale EWP production facilities are integrated with our nearby plywood operations to optimize our veneer utilization, which we believe helps position us as a competitive manufacturer in the growing EWP business. In the past three years, we completed a number of initiatives in our Wood Products segment that strengthened our asset base, substantially reduced our costs and enhanced our operating performance.
We believe that our plywood facilities in Kettle Falls, Washington and Elgin, Oregon are among the lowest cost Douglas fir plywood facilities in North America. Additionally, in the active timberland markets in which we operate, our manufacturing facilities are clustered to enable us to efficiently utilize fiber resources and to shift production depending on demand. We believe we are the only manufacturer in the inland Pacific Northwest with the integrated primary and secondary facilities necessary to process all softwood species.
4
Significant Capital Invested to Position us for Growth as the Housing Market Recovers
Our operations are well-positioned to serve our customers and take advantage of the recovery that we believe is underway in the U.S. housing market. From 2005 to 2012, we invested approximately $300 million (excluding acquisitions) to upgrade and maintain our Wood Products facilities and opportunistically expand our Building Materials Distribution facilities. Since 2005, we have increased our covered warehouse space by over 65% and have more than doubled our outdoor storage acreage. We expect to make further capital investments in cost and operational improvements, primarily related to internal veneer production, which will further enhance our competitive position and allow us to capture growth opportunities. For the year ended December 31, 2012, we operated our EWP facilities at approximately 52% of LVL press capacity, providing us with substantial unused capacity. Additionally, we believe that our Building Materials Distribution facilities can support a considerable ramp-up in housing starts with no significant requirement for new capacity and will allow us to double our sales without increasing our existing footprint.
Experienced Management Team
Our senior management team has an average of approximately 30 years of experience in forest products manufacturing and building materials distribution with a track record of financial and operational excellence in both favorable and challenging market conditions.
We intend to capitalize on our strong market position in wood products manufacturing and building materials distribution to increase revenues and profits and maximize cash flow as the U.S. housing market recovers. We seek to achieve this objective by executing on the following strategies:
Grow our Wood Products Segment Operations with a Focus on Expanding our Market Position in EWP
We will continue to expand our market position in EWP by focusing on our large-scale manufacturing position, comprehensive customer service, design support capabilities and efficient distribution network. We have positioned ourselves to take advantage of expected increases in the demand for EWP per housing start by expanding our capacity through capital investments in low-cost, internal veneer manufacturing. We have also developed strategic relationships with third-party veneer suppliers to support additional EWP production as needed. Additionally, we intend to grow our Wood Products business through strategic acquisitions.
Grow Market Share in our Building Materials Distribution Segment
We intend to grow our Building Materials Distribution business in existing markets by adding products and services to better serve our customers. We also plan to opportunistically expand our Building Materials Distribution business into nearby geographies that we currently serve using off-site storage arrangements or longer truck routes. We will continue to grow our Building Materials Distribution business by opportunistically acquiring facilities, adding new products, opening new locations, relocating and expanding capacity at existing facilities and capturing local market share through our superior supply chain capabilities and customer service.
Further Differentiate our Products and Services to Capture Market Share
We seek to continue to differentiate ourselves from our competitors by providing a broad line of high-quality products and superior customer service. Our highly efficient logistics system allows us to deliver superior customer service and assist our customers in optimizing their working capital. Our national distribution platform, coupled with the manufacturing capabilities of our Wood Products
5
segment, differentiates us from most of our competitors and is critical to servicing retail lumberyards, home improvement centers and industrial converters. Additionally, this system allows us to procure product more efficiently and to develop and maintain stronger relationships with our vendors. Because of these relationships and our national presence, many of our vendors have offered us favorable pricing and provide us with enhanced product introductions and ongoing marketing support.
Continue to Improve our Competitiveness through Operational Excellence
We use a disciplined cost management approach to maximize our competitiveness without sacrificing our ability to react to future growth opportunities. Additionally, we have made capital investments and process improvements in certain facilities, which have decreased our production costs and allowed us to produce lower-cost, higher-quality veneers. Beginning in 2009, we adopted a data-driven process improvement program to further strengthen our manufacturing operations. Because of the significant gains we continue to see from this program, we believe there are opportunities to apply similar techniques and methods to different functional areas (including sales and marketing) to realize efficiencies in those areas.
Preliminary Financial Results for the Three Months Ended June 30, 2013
Our preliminary estimated unaudited financial results as of and for the three months ended June 30, 2013 are set forth below. Estimates of results are inherently uncertain and subject to change, and we undertake no obligation to update this information. Our estimates contained in this prospectus may differ from actual results. Actual results remain subject to the completion of management's and our Audit Committee's final review. During the course of the preparation of the financial statements and related notes, additional items that would require material adjustments to the preliminary financial information presented below may be identified. The estimates set forth below were prepared by our management and are based upon a number of assumptions. See "Management's Discussion and Analysis of Financial Condition and Results of Operations—Critical Accounting Estimates," "Risk Factors—Risks Relating to Our Business" and "Cautionary Statement Concerning Forward-Looking Statements."
These estimates should not be viewed as a substitute for full financial statements prepared in accordance with generally accepted accounting principles ("GAAP"). In addition, these preliminary estimates as of and for the three months ended June 30, 2013 are not necessarily indicative of the results to be achieved in any future period. Our consolidated financial statements and related notes as of and for the three months ended June 30, 2013 are not expected to be filed with the Securities and Exchange Commission ("SEC") until after this offering is completed.
As reflected below, we expect to report improvements in total sales and EBITDA but a decrease in net income for the three months ended June 30, 2013 as compared to the comparable prior period.
- •
- For the three months ended June 30, 2013, we expect to report total sales in the range of $840.0 million to
$860.0 million as compared to $732.9 million for the three months ended June 30, 2012. The increase in total sales was due primarily to increases in sales prices and volumes in
our Building Materials Distribution segment. Housing starts, which are a primary driver of our sales, increased for the three months ended June 30, 2013 compared to the same period in 2012.
- •
- We expect to report net income in the range of $9.2 million to $11.7 million for the three months ended June 30, 2013 as compared to net income of $15.0 million for the three months ended June 30, 2012. The decrease in net income was driven by the recording of
6
- •
- We expect to report total company EBITDA in the range of $28.6 million to $32.6 million for the three months
ended June 30, 2013 as compared to $28.2 million for the three months ended June 30, 2012.
- •
- In our Wood Products segment, we expect to report EBITDA between $28.5 million and $30.5 million for the
three months ended June 30, 2013 as compared to $21.7 million for the three months ended June 30, 2012. The EBITDA improvement was driven primarily by higher plywood, EWP and
lumber prices offset partially by higher wood fiber costs.
- •
- In our Building Materials Distribution segment, we expect to report EBITDA between $4.5 million and
$6.5 million for the three months ended June 30, 2013 as compared to $10.9 million for the three months ended June 30, 2012. The decline in EBITDA was driven primarily by
lower gross margins. While year-over-year average commodity prices were higher and drove higher sales, a steady downward trajectory in commodity prices during the three months ended June 30,
2013 negatively impacted gross margins, which include lower of cost or market inventory write-downs.
- •
- At June 30, 2013, we had no borrowings outstanding on our $300.0 million revolving credit facility and our unused borrowing capacity on the facility, net of approximately $9.0 million of letters of credit, was approximately $291.0 million.
entity-level federal and state income taxes upon our conversion from a limited liability company to a corporation in 2013.
| |
Three Months Ended June 30 |
|||||||||
|---|---|---|---|---|---|---|---|---|---|---|
| |
|
2013 | ||||||||
| |
2012 | |||||||||
| |
Low | High | ||||||||
| |
|
(estimated) |
||||||||
| |
(in millions) |
|||||||||
Segment sales |
||||||||||
Wood Products |
$ | 241.8 | $ | 275.0 | $ | 285.0 | ||||
Building Materials Distribution |
580.5 | 670.0 | 690.0 | |||||||
Intersegment eliminations |
(89.4 | ) | (105.0 | ) | (115.0 | ) | ||||
Total sales |
$ | 732.9 | $ | 840.0 | $ | 860.0 | ||||
Net income |
$ |
15.0 |
$ |
9.2 |
$ |
11.7 |
||||
Segment EBITDA(1) |
||||||||||
Wood Products |
$ | 21.7 | $ | 28.5 | $ | 30.5 | ||||
Building Materials Distribution |
10.9 | 4.5 | 6.5 | |||||||
Corporate and Other |
(4.4 | ) | (4.4 | ) | (4.4 | ) | ||||
Total EBITDA(2) |
$ | 28.2 | $ | 28.6 | $ | 32.6 | ||||
Total cash and cash equivalents |
$ | 174.1 | $ | 231.0 | $ | 235.0 | ||||
Long-term debt |
$ | 219.6 | $ | 250.0 | $ | 250.0 | ||||
- (1)
- EBITDA is defined as income (loss) before interest (interest expense and interest income), income taxes and depreciation and amortization. EBITDA is the primary measure used by our chief operating decision maker to evaluate segment operating performance and to decide how to allocate resources to segments. We believe EBITDA is useful to investors because it provides a means to evaluate the operating performance of our segments and our company on an ongoing basis using criteria that are used by our internal decision makers and because it is frequently used by investors and other interested parties when comparing companies in our industry that have
7
- different
financing and capital structures and/or tax rates. We believe EBITDA is a meaningful measure because it presents a transparent view of
our recurring operating performance and allows management to readily view operating trends, perform analytical comparisons and identify strategies to improve operating performance. EBITDA, however, is
not a measure of our liquidity or financial performance under GAAP and should not be considered as an alternative to net income (loss), income (loss) from operations, or any other performance measure
derived in accordance with GAAP or as an alternative to cash flow from operating activities as a measure of our liquidity. The use of EBITDA instead of net income (loss) or segment income (loss) has
limitations as an analytical tool, including the inability to determine profitability; the exclusion of interest expense, interest income and associated significant cash requirements; and the
exclusion of depreciation and amortization, which represent unavoidable operating costs. Management compensates for the limitations of EBITDA by relying on our GAAP results. Our measure of EBITDA is
not necessarily comparable to other similarly titled captions of other companies due to potential inconsistencies in the methods of calculation.
- Adjusted
EBITDA is not shown for the periods presented in this "—Preliminary Financial Results for the Three Months Ended
June 30, 2013" because there were no unusual items applicable to such periods.
- (2)
- The following is a reconciliation of net income to EBITDA:
| |
Three Months Ended June 30 |
|||||||||
|---|---|---|---|---|---|---|---|---|---|---|
| |
|
2013 | ||||||||
| |
2012 | Low | High | |||||||
| |
|
(estimated) |
||||||||
| |
(in millions) |
|||||||||
Net income |
$ | 15.0 | $ | 9.2 | $ | 11.7 | ||||
Interest, net |
4.7 | 4.7 | 4.7 | |||||||
Income tax provision |
0.1 | 5.9 | 7.5 | |||||||
Depreciation and amortization |
8.3 | 8.8 | 8.8 | |||||||
EBITDA |
$ | 28.2 | $ | 28.6 | $ | 32.6 | ||||
Our principal stockholder and the selling stockholder in this offering, Boise Cascade Holdings, L.L.C. ("BC Holdings"), is controlled by Forest Products Holdings, L.L.C. ("FPH"), an entity controlled by an investment fund managed by Madison Dearborn. Madison Dearborn, based in Chicago, is an experienced private equity investment firm that has raised over $18 billion of capital. Since its formation in 1992, Madison Dearborn's investment funds have invested in approximately 125 companies across a broad spectrum of industries, including basic industries; business and government services; consumer; financial services; healthcare; and telecom, media and technology services. Madison Dearborn's objective is to invest in companies with strong competitive characteristics that it believes have the potential for significant long-term equity appreciation. To achieve this objective, Madison Dearborn seeks to partner with outstanding management teams that have a solid understanding of their businesses as well as track records of building stockholder value. After the consummation of this offering, BC Holdings will beneficially own approximately 45.6% of our common stock, assuming the underwriters do not exercise their option to purchase additional shares. If the underwriters exercise in full their option to purchase additional shares, BC Holdings will beneficially own approximately 42.1% of our common stock.
8
We were formed under the name Boise Cascade, L.L.C., a Delaware limited liability company, in October 2004 in connection with our acquisition of OfficeMax's forest products and paper assets. On February 4, 2013, we converted from a limited liability company into a Delaware corporation and became Boise Cascade Company. We completed our initial public offering on February 11, 2013 and our common stock is traded on the NYSE under the symbol "BCC."
Our principal executive offices are located at 1111 West Jefferson Street, Suite 300, Boise, Idaho 83702. Our telephone number at that location is (208) 384-6161. Our website address is www.bc.com. The reference to our website is a textual reference only. We do not incorporate the information on our website into this prospectus and you should not consider any information on, or that can be accessed through, our website as part of this prospectus.
Our key registered trademarks include BOISE CASCADE® and the TREE-IN-A-CIRCLE® logo. This prospectus also refers to the products or services of other companies by the trademarks and trade names used and owned by those companies.
In considering our competitive strengths, our business strategies and an investment in our common stock generally, you should carefully consider the information described under "Risk Factors" in this prospectus. Certain risks that may affect the successful execution of our business strategies include the following:
- •
- the commodity nature of our products and their price movements, which are driven largely by capacity utilization rates and
industry cycles that affect supply and demand;
- •
- general economic conditions, including but not limited to housing starts, repair and remodel activity and light commercial
construction, inventory levels of new and existing homes for sale, foreclosure rates, interest rates, unemployment rates, relative currency values and mortgage availability and pricing, as well as
other consumer financing mechanisms, that ultimately affect demand for our products;
- •
- the timing and extent of any recovery in the housing market and our ability to grow our business and offset the fixed
costs relating to our recent capital investments;
- •
- the risk of material disruption at our manufacturing facilities, which would also impact our Building Materials
Distribution business due to our vertical integration;
- •
- the fact that certain of our competitors have greater financial resources than we do, which may afford those competitors
greater purchasing power, increased financial flexibility and more capital resources for expansion and improvement;
- •
- availability and affordability of raw materials, including wood fiber, glues and resins and energy;
- •
- the impact of actuarial assumptions and regulatory activity on pension costs and pension funding requirements; and
- •
- the need to successfully implement succession plans for certain members of our senior management team.
9
Common stock offered by the selling stockholder |
10,000,000 shares | |
Common stock to be outstanding prior to and immediately after this offering |
43,229,412 shares |
|
Selling Stockholder |
Boise Cascade Holdings, L.L.C. |
|
Option to purchase additional shares |
The selling stockholder has agreed to allow the underwriters to purchase up to an additional 1,500,000 shares from the selling stockholder, at the public offering price, less the underwriting discount, within 30 days of the date of this prospectus. |
|
Use of proceeds |
We will not receive any of the proceeds from the sale of the shares sold in this offering. See "Use of Proceeds." |
|
New York Stock Exchange symbol |
"BCC." |
Unless otherwise indicated, all information in this prospectus relating to the number of shares of common stock to be outstanding immediately after this offering is based on the number of shares of common stock outstanding as of July 15, 2013 and excludes:
- •
- 161,257 shares of common stock issuable upon vesting and exercise of stock options outstanding as of July 15, 2013
at an exercise price of $27.19 per share;
- •
- an aggregate of 104,285 shares of common stock issuable upon vesting of restricted stock units and performance stock units
outstanding as of July 15, 2013; and
- •
- shares of common stock reserved for future issuance under the Boise Cascade Company 2013 Incentive Plan (the "2013 Incentive Plan").
10
Summary Historical Consolidated Financial Data
The following tables set forth our summary consolidated historical financial data. You should read the information set forth below in conjunction with "Capitalization" and "Management's Discussion and Analysis of Financial Condition and Results of Operations" and our consolidated historical financial statements and notes thereto incorporated by reference in this prospectus. The statements of operations data for each of the years ended December 31, 2010, 2011 and 2012 and the balance sheet data as of December 31, 2012 set forth below are derived from our audited consolidated financial statements incorporated by reference herein. The statements of operations data for each of the three month periods ended March 31, 2012 and 2013 and the balance sheet data as of March 31, 2013 set forth below are derived from our unaudited quarterly consolidated financial statements incorporated by reference in this prospectus and contain all adjustments, consisting of normal recurring adjustments, that management considers necessary for a fair presentation of our financial position and results of operations for the periods presented. Operating results for the three-month periods are not necessarily indicative of results for a full financial year, or any other periods.
| |
Year Ended December 31 | Three Months Ended March 31 |
||||||||||||||
|---|---|---|---|---|---|---|---|---|---|---|---|---|---|---|---|---|
| |
2010 | 2011 | 2012 | 2012 | 2013 | |||||||||||
| |
(in thousands, except per share data) |
|||||||||||||||
Statements of Operations Data |
||||||||||||||||
Sales |
$ | 2,240,591 | $ | 2,248,088 | $ | 2,779,062 | $ | 586,986 | $ | 744,878 | ||||||
Costs and expenses(1) |
2,253,753 | 2,275,134 | 2,715,931 | 580,737 | 720,240 | |||||||||||
Income (loss) from operations |
(13,162 | ) | (27,046 | ) | 63,131 | 6,249 | 24,638 | |||||||||
Foreign exchange gain (loss) |
352 | (497 | ) | 37 | 186 | (80 | ) | |||||||||
Gain on repurchase of long-term debt(2) |
28 | — | — | — | — | |||||||||||
Interest expense |
(21,005 | ) | (18,987 | ) | (21,757 | ) | (4,813 | ) | (4,891 | ) | ||||||
Interest income |
790 | 407 | 392 | 107 | 62 | |||||||||||
|
(19,835 | ) | (19,077 | ) | (21,328 | ) | (4,520 | ) | (4,909 | ) | ||||||
Income (loss) before income taxes |
(32,997 | ) | (46,123 | ) | 41,803 | 1,729 | 19,729 | |||||||||
Income tax (provision) benefit(3) |
(300 | ) | (240 | ) | (307 | ) | (61 | ) | 61,107 | |||||||
Net income (loss) |
$ | (33,297 | ) | $ | (46,363 | ) | $ | 41,496 | $ | 1,668 | $ | 80,836 | ||||
Net income (loss) per common share: |
||||||||||||||||
Basic and diluted(4) |
$ | (1.12 | ) | $ | (1.56 | ) | $ | 1.40 | $ | 0.06 | $ | 2.15 | ||||
Weighted average shares outstanding: |
||||||||||||||||
Basic and diluted(4) |
29,700 | 29,700 | 29,700 | 29,700 | 37,569 | |||||||||||
Other Financial Data |
||||||||||||||||
Depreciation and amortization |
$ | 34,899 | $ | 37,022 | $ | 33,407 | $ | 8,119 | $ | 8,477 | ||||||
Capital expenditures(5) |
35,751 | 39,319 | 29,741 | 7,082 | 5,316 | |||||||||||
EBITDA(6) |
22,117 | 9,479 | 96,575 | 14,554 | 33,035 | |||||||||||
Adjusted EBITDA(6) |
17,476 | 9,479 | 96,575 | 14,554 | 33,035 | |||||||||||
Adjusted net income (loss)(7) |
(37,938 | ) | (46,363 | ) | 41,496 | 1,668 | 12,170 | |||||||||
Adjusted net income (loss) per common share: |
||||||||||||||||
Basic and diluted(7) |
(1.28 | ) | (1.56 | ) | 1.40 | 0.06 | 0.32 | |||||||||
11
| |
December 31, 2012 |
March 31, 2013 |
|||||
|---|---|---|---|---|---|---|---|
| |
(in thousands) |
||||||
Balance Sheet Data |
|||||||
Cash and cash equivalents |
$ | 54,507 | $ | 233,547 | |||
Total current assets |
527,457 | 857,862 | |||||
Property and equipment, net |
265,924 | 261,221 | |||||
Total assets |
836,398 | 1,209,797 | |||||
Total long-term debt |
275,000 | 250,000 | |||||
Total stockholders' equity |
97,764 | 449,433 | |||||
- (1)
- In
2010, costs and expenses include $4.6 million of income associated with receiving proceeds from a litigation settlement related to vendor product
pricing. In 2011, costs and expenses include $3.8 million of expense related to the closure of a laminated beam plant and noncash asset write-downs.
- (2)
- Represents
gain on the repurchase of $8.6 million of our senior subordinated notes in 2010.
- (3)
- The
three months ended March 31, 2013 includes a $68.7 million income tax benefit associated with the recording of net deferred tax assets
upon our conversion to a corporation.
- (4)
- We
have adjusted our historical financial statements to retroactively reflect the common stock authorized and outstanding following our conversion from a
limited liability company to a corporation, resulting in a retroactive adjustment to weighted average shares outstanding.
- (5)
- 2011
includes $5.8 million of cash paid for the acquisition of a laminated beam and decking manufacturing plant in Homedale, Idaho. The year ended
December 31, 2012 and the three months ended March 31, 2012 include $2.4 million for the acquisition of a sawmill in Arden, Washington.
- (6)
- EBITDA is defined as income (loss) before interest (interest expense and interest income), income taxes and depreciation and amortization. EBITDA is the primary measure used by our chief operating decision maker to evaluate segment operating performance and to decide how to allocate resources to segments. We believe EBITDA is useful to investors because it provides a means to evaluate the operating performance of our segments and our company on an ongoing basis using criteria that are used by our internal decision makers and because it is frequently used by investors and other interested parties when comparing companies in our industry that have different financing and capital structures and/or tax rates. We believe EBITDA is a meaningful measure because it presents a transparent view of our recurring operating performance and allows management to readily view operating trends, perform analytical comparisons and identify strategies to improve operating performance. EBITDA, however, is not a measure of our liquidity or financial performance under GAAP and should not be considered as an alternative to net income (loss), income (loss) from operations, or any other performance measure derived in accordance with GAAP or as an alternative to cash flow from operating activities as a measure of our liquidity. The use of EBITDA instead of net income (loss) or segment income (loss) has limitations as an analytical tool, including the inability to determine profitability; the exclusion of interest expense, interest income and associated significant cash requirements; and the exclusion of depreciation and amortization, which represent unavoidable operating costs. Management compensates for the limitations of EBITDA by relying on our GAAP results. Our measure of EBITDA is not necessarily comparable to other similarly titled captions of other companies due to potential inconsistencies in the methods of calculation.
12
- Adjusted
EBITDA is defined as EBITDA before certain other unusual items, including gain on the repurchase of long-term debt and a litigation
gain.
- The following is a reconciliation of net income (loss) to EBITDA and Adjusted EBITDA:
| |
Year Ended December 31 | Three Months Ended March 31 |
||||||||||||||
|---|---|---|---|---|---|---|---|---|---|---|---|---|---|---|---|---|
| |
2010 | 2011 | 2012 | 2012 | 2013 | |||||||||||
| |
(in millions) |
|||||||||||||||
Net income (loss) |
$ | (33.3 | ) | $ | (46.4 | ) | $ | 41.5 | $ | 1.7 | $ | 80.8 | ||||
Interest expense |
21.0 | 19.0 | 21.8 | 4.8 | 4.9 | |||||||||||
Interest income |
(0.8 | ) | (0.4 | ) | (0.4 | ) | (0.1 | ) | (0.1 | ) | ||||||
Income tax provision (benefit)(a) |
0.3 | 0.2 | 0.3 | 0.1 | (61.1 | ) | ||||||||||
Depreciation and amortization |
34.9 | 37.0 | 33.4 | 8.1 | 8.5 | |||||||||||
EBITDA |
$ | 22.1 | $ | 9.5 | $ | 96.6 | $ | 14.6 | $ | 33.0 | ||||||
Gain on repurchase of long-term debt(b) |
(0.0 | ) | — | — | — | — | ||||||||||
Litigation gain(c) |
(4.6 | ) | — | — | — | — | ||||||||||
Adjusted EBITDA |
$ | 17.5 | $ | 9.5 | $ | 96.6 | $ | 14.6 | $ | 33.0 | ||||||
- (a)
- See
Note (3) above.
- (b)
- See
Note (2) above.
- (c)
- See Note (1) above.
- (7)
- Adjusted
net income (loss) is defined as net income (loss) before certain unusual items. We believe adjusted net income (loss) is useful to investors
because it provides a more meaningful means to evaluate our operating performance. Adjusted net income (loss), however, is not a measure of our financial performance under GAAP and should not be
considered as an alternative to net income (loss), income (loss) from operations, or any other performance measure derived in accordance with GAAP. Our measure of adjusted net income (loss) is not
necessarily comparable to other similarly titled captions of other companies due to potential inconsistencies in the methods of calculation.
The following is a reconciliation of net income (loss) to adjusted net income (loss):
| |
Year Ended December 31 | Three Months Ended March 31 |
||||||||||||||
|---|---|---|---|---|---|---|---|---|---|---|---|---|---|---|---|---|
| |
2010 | 2011 | 2012 | 2012 | 2013 | |||||||||||
Net income (loss) |
$ | (33.3 | ) | $ | (46.4 | ) | $ | 41.5 | $ | 1.7 | $ | 80.8 | ||||
Impact of deferred tax benefit(a) |
— | — | — | — | (68.7 | ) | ||||||||||
Gain on repurchase of long-term debt(b) |
(0.0 | ) | — | — | — | — | ||||||||||
Litigation gain(c) |
(4.6 | ) | — | — | — | — | ||||||||||
Adjusted net income (loss) |
$ | (37.9 | ) | $ | (46.4 | ) | $ | 41.5 | $ | 1.7 | $ | 12.2 | ||||
- (a)
- See
Note (3) above.
- (b)
- See
Note (2) above.
- (c)
- See Note (1) above.
13
Investing in our common stock involves a high degree of risk. You should carefully consider the risk factors set forth below as well as the other information contained in this prospectus before investing in our common stock. Any of the following risks could materially and adversely affect our business, financial condition and results of operations. In such case, you may lose all or part of your original investment.
Risks Relating to Our Business
Many of the products we manufacture or purchase and resell are commodities whose price is determined by the market's supply and demand for such products, and the markets in which we operate are cyclical and competitive. The depressed state of the housing, construction and home improvement markets could continue to adversely affect demand and pricing for our products.
Many of the building products we produce or distribute, including OSB, plywood, lumber and particleboard, are commodities that are widely available from other manufacturers or distributors with prices and volumes determined frequently in an auction market-based on participants' perceptions of short-term supply and demand factors. At times, the price for any one or more of the products we produce may fall below our cash production costs, requiring us to either incur short-term losses on product sales or cease production at one or more of our manufacturing facilities. Therefore, our profitability with respect to these commodity products depends, in significant part, on managing our cost structure, particularly raw materials and labor, which represent the largest components of our operating costs. Commodity wood product prices could be volatile in response to operating rates and inventory levels in various distribution channels. Commodity price volatility affects our distribution business, with falling price environments generally causing reduced revenues and margins, resulting in substantial declines in profitability and possible net losses.
Historically, demand for the products we manufacture, as well as the products we purchase and distribute, has been closely correlated with new residential construction in the United States and, to a lesser extent, light commercial construction and residential repair and remodeling activity. New residential construction activity remained substantially below average historical levels during 2012 and so did demand for many of the products we manufacture and distribute. There is significant uncertainty regarding the timing and extent of any recovery in such construction activity and resulting product demand levels. Demand for new residential construction is influenced by seasonal weather factors, mortgage availability and rates, unemployment levels, household formation rates, domestic population growth, immigration rates, residential vacancy and foreclosure rates, demand for second homes, existing home prices, consumer confidence and other general economic factors.
Wood products industry supply is influenced primarily by price-induced changes in the operating rates of existing facilities but is also influenced over time by the introduction of new product technologies, capacity additions and closures, restart of idled capacity and log availability. The balance of wood products supply and demand in the United States is also heavily influenced by imported products, principally from Canada.
We have very limited control of the foregoing, and as a result, our profitability and cash flow may fluctuate materially in response to changes in the supply and demand balance for our primary products.
Our industry is highly competitive. If we are unable to compete effectively, our sales, operating results and growth strategies could be negatively affected.
The markets for the products we manufacture in our Wood Products segment are highly competitive. Our competitors range from very large, fully integrated forest and building products firms to smaller firms that may manufacture only one or a few types of products. We also compete less
14
directly with firms that manufacture substitutes for wood building products. Certain mills operated by our competitors may be lower-cost manufacturers than the mills operated by us.
The building products distribution industry that our Building Materials Distribution segment competes in is highly fragmented and competitive, and the barriers to entry for local competitors are relatively low. Competitive factors in our industry include pricing and availability of product, service and delivery capabilities, ability to assist customers with problem solving, customer relationships, geographic coverage and breadth of product offerings. Also, financial stability is important to suppliers and customers in choosing distributors and allows for more favorable terms on which to obtain products from suppliers and sell products to customers. If our financial condition deteriorates in the future, our support from suppliers may be negatively affected.
Some of our competitors are larger companies and, therefore, have access to greater financial and other resources than we do. These resources may afford those competitors greater purchasing power, increased financial flexibility and more capital resources for expansion and improvement, which may enable those competitors to compete more effectively than we can.
Our manufacturing businesses may have difficulty obtaining wood fiber at favorable prices or at all.
Wood fiber is our principal raw material, which accounted for approximately 43% of the aggregate amount of materials, labor and other operating expenses, including from related parties (excluding depreciation), for our Wood Products segment in 2012. Wood fiber is a commodity and prices have been cyclical historically in response to changes in domestic and foreign demand and supply. Foreign demand for timber exports, particularly from China, increased timber costs in the western U.S. in 2010 and 2011 and negatively affected wood products manufacturers in the region. In 2012, China's demand for timber exports from the western U.S. declined from 2011 levels, but in the future we expect that the level of foreign demand for timber exports from the western U.S. will continue to fluctuate based on the economic activity in China and other Pacific Rim countries, currency exchange rates and the availability of timber supplies from other countries such as Canada, Russia and New Zealand. Sustained periods of high timber costs may impair the cost competitiveness of our manufacturing facilities.
We currently enjoy the benefit of supply agreements put in place in 2005 following the sale of our timberlands (or successor arrangements), under which we purchase timber at market based prices. For 2012, approximately 33% of our timber was supplied pursuant to agreements assumed by (or replacement master supply agreements with) Hancock Natural Resource Group, Inc. ("Hancock"), The Molpus Woodlands Group LLC ("Molpus") and Rayonier Louisiana Timberlands, LLC, a timberland real estate investment trust ("Rayonier"). The supply agreements with these parties terminate on December 31, 2014, subject to additional one-year extensions unless notice is provided to the other party at least six months prior to expiration of the applicable agreement. If a counterparty to these agreements elects not to continue these agreements or we are unable to renegotiate these agreements on terms that are acceptable to us, we would need to locate a replacement supplier for our timber requirements, which could include private purchases with other suppliers, open-market purchases and purchases from governmental sources. If we are unable to locate a replacement supplier in a particular region to satisfy our timber needs at satisfactory prices, it could have an adverse effect on our results of operations.
In 2012, we purchased approximately 21% of our timber from federal, state and local governments. In certain regions in which we operate, a substantial portion of our timber is purchased from governmental authorities. As a result, existing and future governmental regulation can affect our access to, and the cost of, such timber. Future domestic or foreign legislation and litigation concerning the use of timberlands, timber harvest methodologies, forest road construction and maintenance, the protection of endangered species, forest-based carbon sequestration, the promotion of forest health and
15
the response to and prevention of catastrophic wildfires can affect timber and fiber supply from both government and private lands. Availability of harvested timber and fiber may be further limited by fire, insect infestation, disease, ice storms, windstorms, hurricanes, flooding and other natural and man-made causes, thereby reducing supply and increasing prices.
Availability of residual wood fiber for our particleboard operation has been negatively affected by significant mill closures and curtailments that have occurred among solid-wood product manufacturers. Future development of wood cellulose biofuel or other new sources of wood fiber demand could interfere with our ability to source wood fiber or lead to significantly higher costs.
Significant changes in discount rates, actual investment return on pension assets and other factors could affect our earnings, equity and pension contributions in future periods.
Our earnings may be negatively affected by the amount of income or expense we record for our pension plans. GAAP requires that we calculate income or expense for the plans using actuarial valuations. These valuations reflect assumptions relating to financial market and other economic conditions. Changes in key economic indicators can change the assumptions. The most significant year-end assumptions used to estimate pension expense are the discount rate and the expected long-term rate of return on plan assets. In addition, we are required to make an annual measurement of plan assets and liabilities, which may result in a significant change to equity through a reduction or increase to "Accumulated other comprehensive loss." A decline in the market value of the pension assets will increase our funding requirements. Our pension plan liabilities are sensitive to changes in interest rates. As interest rates decrease, the liabilities increase, potentially increasing benefit costs and funding requirements. Changes in demographics, including increased numbers of retirements or changes in life expectancy assumptions, may also increase the funding requirements of the obligations related to the pension plans. At December 31, 2012, the net underfunded status of our defined benefit pension plans was $192.5 million. If the status of our defined benefit plans continues to be underfunded, we anticipate significant future funding obligations, reducing the cash available for our business. For more discussion regarding how our financial statements can be affected by pension plan estimates, see "Management's Discussion and Analysis of Financial Condition and Results of Operations—Critical Accounting Estimates—Pensions."
Our recent significant capital investments have increased fixed costs, which could negatively affect our profitability.
In the past three years, we have completed a number of capital investments, including significantly increasing our outdoor storage acreage and leasing additional warehouse space. In the future, we expect to make further capital investments, primarily related to internal veneer production. These significant capital investments have resulted in increased fixed costs, which could negatively affect our profitability if the housing market does not recover and revenues do not improve to offset our incremental fixed costs.
A material disruption at one of our manufacturing facilities could prevent us from meeting customer demand, including the demand from our Building Materials Distribution business, reduce our sales, and/or negatively affect our financial results.
Any of our manufacturing facilities, or any of our machines within an otherwise operational facility, could cease operations unexpectedly due to a number of events, including but not limited to:
- •
- equipment failure, particularly a press at one of our major EWP production facilities;
- •
- fires, floods, earthquakes, hurricanes or other catastrophes;
- •
- unscheduled maintenance outages;
16
- •
- utility and transportation infrastructure disruptions;
- •
- labor difficulties;
- •
- other operational problems; or
- •
- ecoterrorism or threats of ecoterrorism.
Any downtime or facility damage could prevent us from meeting customer demand for our products and/or require us to make unplanned capital expenditures. If our machines or facilities were to incur significant downtime, our ability to satisfy customer requirements would be impaired, resulting in lower sales and net income.
Because approximately 38% of our Wood Products sales in the LTM period, including approximately 74% of our EWP sales, were to our Building Materials Distribution business, a material disruption at our Wood Products facilities would also negatively impact our Building Materials Distribution business. We are therefore exposed to a larger extent to the risk of disruption to our Wood Products manufacturing facilities due to our vertical integration and the resulting impact on our Building Materials Distribution business.
In addition, a number of our suppliers are subject to the manufacturing facility disruption risks noted above. Our suppliers' inability to produce the necessary raw materials for our manufacturing processes or supply the finished goods that we distribute through our Building Materials Distribution segment may adversely affect our results of operations, cash flows and financial position.
Adverse conditions may increase the credit risk from our customers.
Our Building Materials Distribution and Wood Products segments extend credit to numerous customers who are heavily exposed to the effects of downturns in the housing market. Unfavorable housing market conditions could result in financial failures of one or more of our significant customers, which could impair our ability to fully collect receivables from such customers and negatively affect our operating results, cash flow and liquidity.
A significant portion of our sales are concentrated with a relatively small number of customers.
For the year ended December 31, 2012, our top ten customers represented approximately 29% of our sales, with one customer accounting for approximately 11% of sales. At December 31, 2012 and March 31, 2013, receivables from such customer accounted for approximately 14% and 12%, respectively, of total receivables. Although we believe that our relationships with our customers are strong, the loss of one or more of these customers could have a material adverse effect on our operating results, cash flow and liquidity.
Our ability to service our indebtedness or to fund our other liquidity needs is subject to various risks.
Our ability to make scheduled payments on our indebtedness and fund other liquidity needs depends on and is subject to our financial and operating performance, which in turn is affected by general and regional economic, financial, competitive, business and other factors, including the availability of financing in the banking and capital markets as well as the other risks described herein. In particular, demand for our products correlates to a significant degree to the level of residential construction activity in North America, which historically has been characterized by significant cyclicality. Over the last several years, housing starts remained below historical levels. This reduced level of building was caused, in part, by an increase in the inventory of homes for sale, a more restrictive mortgage market, and a slowed economy. There can be no assurance as to when or if the housing market will rebound to historical levels. We have experienced significant losses from operations and used significant cash for operating activities in recent periods.
17
We cannot assure you that our business will generate sufficient cash flows from operations or that future borrowings will be available to us in an amount sufficient to enable us to service our debt or to fund our other liquidity needs. If we are unable to service our debt obligations or to fund our other liquidity needs, we could be forced to curtail our operations, reorganize our capital structure, or liquidate some or all of our assets.
We are subject to environmental regulation and environmental compliance expenditures, as well as other potential environmental liabilities.
Our businesses are subject to a wide range of general and industry-specific environmental laws and regulations, particularly with respect to air emissions, wastewater discharges, solid and hazardous waste management and site remediation. Enactment of new environmental laws or regulations, including those aimed at addressing greenhouse gas emissions, or changes in existing laws or regulations might require significant expenditures or restrict operations.
From time to time, legislative bodies and environmental regulatory agencies may promulgate new regulatory programs imposing significant incremental operating costs or capital costs on us. In December 2012, the U.S. Environmental Protection Agency (the "EPA") finalized a revised series of four regulations commonly referred to collectively as Boiler MACT, which are intended to regulate the emission of hazardous air pollutants from industrial boilers. Facilities in our Wood Products segment will be subject to one or more of these regulations and must be in compliance with the applicable rules by early 2016. We are currently undertaking a complete review of the revised rules to assess how they will affect our operations. Even with the revised rules finalized, considerable uncertainty still exists, as there will likely be legal challenges to the final rules from industry and/or environmental organizations. Notwithstanding that uncertainty, we are proceeding with efforts to analyze the applicability and requirements of the regulations, including the capital and operating costs required to comply. At this time, we cannot accurately forecast the capital or operating cost changes that may result from compliance with the regulations.
As an owner and operator of real estate, we may be liable under environmental laws for the cleanup of past and present spills and releases of hazardous or toxic substances on or from our properties and operations. We could be found liable under these laws whether or not we knew of, or were responsible for, the presence of such substances. In some cases, this liability may exceed the value of the property itself.
We may be unable to generate funds or other sources of liquidity and capital to fund unforeseen environmental liabilities or expenditures to the extent we are not indemnified by third parties. For example, in connection with the completion of our acquisition of the forest products and paper assets of OfficeMax in 2004 (the "Forest Products Acquisition"), OfficeMax is generally obligated to indemnify us for hazardous substance releases and other environmental violations that occurred prior to the Forest Products Acquisition. However, OfficeMax may not have sufficient funds to fully satisfy its indemnification obligations when required, and in some cases, we may not be contractually entitled to indemnification by OfficeMax. In addition, in connection with the sale of our Paper and Packaging & Newsprint assets in 2008, Boise Inc. and its affiliates assumed any and all environmental liabilities arising from our ownership or operation of the assets and businesses sold to them, and we believe we are entitled to indemnification by them from third-party claims in the event they fail to fully discharge any such liabilities on the basis of common law rules of indemnification. However, Boise Inc. may not have sufficient funds to discharge its obligations when required or to indemnify us from third-party claims arising out of any such failure. For additional information on how environmental regulation and compliance affects our business, see "Management's Discussion and Analysis of Financial Condition and Results of Operations—Environmental."
18
Labor disruptions or increased labor costs could adversely affect our business.
As of June 30, 2013, we had approximately 4,760 employees. Approximately 30% of these employees work pursuant to collective bargaining agreements. As of June 30, 2013, we had nine collective bargaining agreements. Two agreements, covering 358 employees at our facility in Florien, Louisiana, and 278 employees at our facility in Oakdale, Louisiana, were scheduled to expire on July 15, 2013 but, pending further negotiations, have been indefinitely extended by the parties, subject to each party's right to terminate by providing a 10-day prior written notice. These two agreements are being negotiated together. If these agreements are terminated before definite negotiations conclude, we could experience a material labor disruption or significantly increased labor costs, which could prevent us from meeting customer demand or reduce our sales and profitability.
If our long-lived assets become impaired, we may be required to record noncash impairment charges that could have a material impact on our results of operations.
We review the carrying value of long-lived assets for impairment when events or changes in circumstances indicate that the carrying amount of the assets may not be recoverable. Should the markets for our products deteriorate further or should we decide to invest capital differently than as expected, or should other cash flow assumptions change, it is possible that we will be required to record noncash impairment charges in the future with respect to the investments we have completed and expect to complete, which could have a material impact on our results of operations.
The terms of our revolving credit facility and the indenture governing our senior notes restrict, and covenants contained in agreements governing indebtedness in the future may restrict, our ability to operate our business and to pursue our business strategies.
Our revolving credit facility and the indenture governing our senior notes contain, and any future indebtedness of ours may contain, a number of restrictive covenants that impose customary operating and financial restrictions on us. Our revolving credit facility and the indenture governing our senior notes limit our ability and the ability of our restricted subsidiaries, among other things, to:
- •
- incur additional debt;
- •
- declare or pay dividends, redeem stock, or make other distributions to stockholders;
- •
- make investments;
- •
- create liens or use assets as security in other transactions; merge or consolidate, or sell, transfer, lease or dispose of
substantially all of our assets;
- •
- enter into transactions with affiliates;
- •
- sell or transfer certain assets; and
- •
- make prepayments on our senior notes and subordinated indebtedness.
In addition, our revolving credit facility provides that if an event of default occurs or excess availability under our revolving credit facility drops below a threshold amount equal to the greater of 12.5% of the aggregate commitments under our revolving credit facility or $31.25 million (and until such time as excess availability for two consecutive fiscal months exceeds that threshold amount and no event of default has occurred and is continuing), we will be required to maintain a monthly minimum fixed coverage charge ratio of 1.0:1.0, determined on a trailing twelve-month basis.
Our failure to comply with any of these covenants could result in an event of default which, if not cured or waived, could result in the acceleration of all of our indebtedness.
19
We may be unable to attract and retain key management and other key employees.
Our key managers are important to our success and may be difficult to replace because they have an average of 30 years of experience in forest products manufacturing and building materials distribution. While our senior management team has considerable experience, certain members of our management team are nearing or have reached normal retirement age. The failure to successfully implement succession plans could result in inadequate depth of institutional knowledge or inadequate skill sets, which could adversely affect our business.
As a result of the sale of our Paper and Packaging & Newsprint assets, we now rely on Boise Inc. for many of our administrative services.
In conjunction with the sale of our Paper and Packaging & Newsprint assets in 2008, we entered into an Outsourcing Services Agreement, under which Boise Inc. provides a number of corporate staff services to us at cost. These services include information technology, accounting and human resource transactional services. Most of the Boise Inc. staff that provides these services are providing the same services they provided when they were our employees. Nevertheless, we cannot be assured that these employees will remain with Boise Inc. or that there will not be a disruption in the continuity or level of service provided. If Boise Inc. is unwilling or unable to provide services at the same quality levels as those services have been provided in the past, our business and compliance activities and results of operations could be substantially and negatively affected.
Risks Relating to Ownership of Our Common Stock
The price of our common stock may fluctuate significantly, and you could lose all or part of your investment.
Volatility in the market price of our common stock may prevent you from being able to sell your shares at or above the price you paid for them. The market price for our common stock could fluctuate significantly for various reasons, including:
- •
- our operating and financial performance and prospects;
- •
- our quarterly or annual earnings or those of other companies in our industry;
- •
- the public's reaction to our press releases, our other public announcements and our filings with the SEC;
- •
- changes in, or failure to meet, earnings estimates or recommendations by research analysts who track our common stock or
the stock of other companies in our industry;
- •
- the failure of research analysts to cover our common stock;
- •
- general economic, industry and market conditions;
- •
- strategic actions by us, our customers or our competitors, such as acquisitions or restructurings;
- •
- new laws or regulations or new interpretations of existing laws or regulations applicable to our business;
- •
- changes in accounting standards, policies, guidance, interpretations or principles;
- •
- material litigation or government investigations;
- •
- changes in general conditions in the U.S. and global economies or financial markets, including those resulting from war,
incidents of terrorism or responses to such events;
- •
- changes in key personnel;
- •
- sales of common stock by us, our principal stockholder or members of our management team;
20
- •
- termination of lock-up agreements with our management team and principal stockholder;
- •
- the granting or exercise of employee stock options;
- •
- volume of trading in our common stock; and
- •
- the impact of the facts described elsewhere in "Risk Factors."
In addition, in recent years, the stock market has regularly experienced significant price and volume fluctuations. This volatility has had a significant impact on the market price of securities issued by many companies, including companies in our industry. The changes frequently appear to occur without regard to the operating performance of the affected companies. Hence, the price of our common stock could fluctuate based upon factors that have little or nothing to do with us and these fluctuations could materially reduce our share price.
The requirements of being a public company increase certain of our costs and require significant management focus.
As a public company, our legal, accounting and other expenses associated with compliance related and other activities have increased. For example, in connection with our initial public offering, we created new board committees and appointed independent directors to comply with the corporate governance requirements of the NYSE. Costs to obtain director and officer liability insurance contribute to our increased costs. As a result of the associated liability, it may be more difficult for us to attract and retain qualified persons to serve on our board of directors or as executive officers. Advocacy efforts by stockholders and third parties may also prompt even more changes in governance and reporting requirements, which could further increase our compliance costs.
We are exempt from certain corporate governance requirements since we are currently a "controlled company" within the meaning of the NYSE rules and, as a result, you will not have the protections afforded by these corporate governance requirements.
BC Holdings currently holds a majority of our common stock and, therefore, we are considered a "controlled company" for the purposes of the NYSE listing requirements. Under these rules, a company of which more than 50% of the voting power is held by a group is a "controlled company" and may elect not to comply with certain NYSE corporate governance requirements, including the requirements that our board of directors, our Compensation Committee and our Corporate Governance and Nominating Committee meet the standard of independence established by those corporate governance requirements. Upon completion of this offering, we will cease to be a controlled company and we will have one year from the date we cease to be a controlled company to comply with all of NYSE's corporate governance requirements. Accordingly, you may not have the same protections afforded to stockholders of companies that are subject to all of the NYSE's corporate governance requirements until the phase-in period expires.
Our significant stockholder, BC Holdings, has the ability to significantly influence corporate activities and its interests may not coincide with yours.
After the consummation of this offering, BC Holdings will beneficially own approximately 45.6% of our common stock, assuming the underwriters do not exercise their option to purchase additional shares. If the underwriters exercise in full their option to purchase additional shares, BC Holdings will beneficially own approximately 42.1% of our common stock. As a result of its ownership, BC Holdings (and Madison Dearborn as its indirect controlling equityholder) has the ability to significantly influence the outcome of matters submitted to a vote of stockholders and, through our board of directors, the ability to significantly influence decision-making with respect to our business direction and policies.
21
Matters over which BC Holdings, directly or indirectly, exercises control include:
- •
- election of directors;
- •
- mergers and other business combination transactions, including proposed transactions that would result in our stockholders
receiving a premium price for their shares;
- •
- other acquisitions or dispositions of businesses or assets;
- •
- incurrence of indebtedness and the issuance of equity securities;
- •
- repurchase of stock and payment of dividends; and
- •
- the issuance of shares to management under the 2013 Incentive Plan.
In addition, BC Holdings has a contractual right to designate a number of directors proportionate to its stock ownership. See "Certain Relationships and Related Party Transactions—Nomination of our Directors."
Conflicts of interest may arise because some of our directors are principals of our largest stockholder.
Messrs. Mencoff, Norton and Soueleles, who are officers or employees of Madison Dearborn, serve on our board of directors. Madison Dearborn is the ultimate principal equityholder of BC Holdings. Madison Dearborn and entities controlled by it may hold equity interests in entities that directly or indirectly compete with us, and companies in which it currently invests may begin competing with us. As a result of these relationships, when conflicts between the interests of Madison Dearborn, on the one hand, and of other stockholders, on the other hand, arise, these directors may not be disinterested. Although our directors and officers have a duty of loyalty to us under Delaware law and our certificate of incorporation, transactions that we enter into in which a director or officer has a conflict of interest are generally permissible so long as (1) the material facts relating to the director's or officer's relationship or interest as to the transaction are disclosed to our board of directors and a majority of our disinterested directors approves the transaction, (2) the material facts relating to the director's or officer's relationship or interest as to the transaction are disclosed to our stockholders and a majority of our disinterested stockholders approve the transaction or (3) the transaction is otherwise fair to us. Our certificate of incorporation also provides that any principal, officer, member, manager and/or employee of Madison Dearborn or any entity that controls, is controlled by or under common control with Madison Dearborn (other than FPH, BC Holdings, us or any company that is controlled by us) or any investment funds managed by Madison Dearborn is not required to offer any transaction opportunity of which they become aware to us and could take any such opportunity for themselves or offer it to other companies in which they have an investment, unless such opportunity is offered to them solely in their capacities as our directors.
We do not currently intend to pay dividends on our common stock.
We historically have not paid dividends on our common stock. In the future, the declaration and payment of dividends, if any, will be at the discretion of our board of directors and will depend upon our financial condition, earnings, contractual obligations, applicable laws and other factors that our board of directors may deem relevant. In addition, our existing indebtedness restricts, and we anticipate our future indebtedness may restrict, our ability to pay dividends. Therefore, you may not receive a return on your investment in our common stock by receiving a payment of dividends. See "Dividend Policy."
Future sales of our common stock, or the perception in the public markets that these sales may occur, may depress our stock price.
Sales of substantial amounts of our common stock in the public market, or the perception that these sales could occur, could adversely affect the price of our common stock and could impair our
22
ability to raise capital through the sale of additional shares. Upon completion of this offering, there will be 43,229,412 shares of our common stock outstanding. Of these, the 13,529,412 shares sold in our initial public offering and up to 10,000,000 shares offered by BC Holdings, the selling stockholder in this offering (or up to 11,500,000 if the underwriters exercise their option to purchase additional shares in full), will be freely tradable immediately after this offering (except for any shares purchased by affiliates, if any). The remaining 19,700,000 shares of our common stock outstanding (or 18,200,000 if the underwriters exercise their option to purchase additional shares in full) will be restricted from immediate resale under the federal securities laws and the expiration of the lock-up agreement between the selling stockholder, our directors and officers, and the underwriters, as applicable, for a period of 90 days after the date of this prospectus (subject in some cases to volume limitations).
BC Holdings currently owns a majority of our common stock. Sales by BC Holdings of a substantial number of shares after this offering could significantly reduce the market price of our common stock. BC Holdings has the right to require us to register the shares of our common stock held by it pursuant to the terms of a registration rights agreement entered into in connection with our initial public offering. Following the consummation of this offering, there will be 19,700,000 shares subject to registration under the registration rights agreement (or 18,200,000 if the underwriters exercise their option to purchase additional shares in full). We have also registered 3,100,000 shares of our common stock that we may issue under the 2013 Incentive Plan. If a large number of these shares are sold in the public market, the sales could reduce the trading price of our common stock.
We may issue shares of our common stock or other securities from time to time as consideration for future acquisitions and investments and pursuant to compensation and incentive plans. If any such acquisition or investment is significant, the number of shares of our common stock, or the number or aggregate principal amount, as the case may be, of other securities that we may issue may in turn be substantial. We also may grant registration rights covering those shares of our common stock or other securities in connection with any such acquisitions and investments.
We cannot predict the size of future issuances of our common stock or the effect, if any, that future issuances and sales of our common stock will have on the market price of our common stock. Sales of substantial amounts of our common stock (including shares of our common stock issued in connection with an acquisition or compensation or incentive plan), or the perception that such sales could occur, may adversely affect prevailing market prices for our common stock.
Our future operating results may fluctuate significantly and our current operating results may not be a good indication of our future performance. Fluctuations in our quarterly financial results could affect our stock price in the future.
Our revenues and operating results have historically varied from period-to-period and we expect that they will continue to do so as a result of a number of factors, many of which are outside of our control. If our quarterly financial results or our predictions of future financial results fail to meet the expectations of securities analysts and investors, our stock price could be negatively affected. Any volatility in our quarterly financial results may make it more difficult for us to raise capital in the future or pursue acquisitions that involve issuances of our stock. Our operating results for prior periods may not be effective predictors of future performance.
Factors associated with our industry, the operation of our business and the markets for our products may cause our quarterly financial results to fluctuate, including:
- •
- the commodity nature of our products and their price movements, which are driven largely by capacity utilization rates and
industry cycles that affect supply and demand;
- •
- general economic conditions, including but not limited to housing starts, repair and remodel activity and light commercial construction, inventory levels of new and existing homes for
23
- •
- the highly competitive nature of our industry;
- •
- availability and affordability of raw materials, including wood fiber, glues and resins and energy;
- •
- the impact of actuarial assumptions and regulatory activity on pension costs and pension funding requirements;
- •
- actions of suppliers, customers and competitors, including merger and acquisition activities, plant closures and financial
failures;
- •
- the financial condition and creditworthiness of our customers;
- •
- concentration of our sales among a relatively small group or customers;
- •
- our substantial indebtedness, including the possibility that we may not generate sufficient cash flows from operations, or
that future borrowings may not be available in amounts sufficient to fulfill our debt obligations and fund other liquidity needs;
- •
- cost of compliance with government regulations, in particular environmental regulations;
- •
- labor disruptions, shortages of skilled and technical labor or increased labor costs;
- •
- impairment of our long-lived assets;
- •
- attraction and retention of key management and other key employees;
- •
- our reliance on Boise Inc. for many of our administrative services;
- •
- major equipment failure; and
- •
- severe weather phenomena such as drought, hurricanes, tornadoes and fire.
sale, foreclosure rates, interest rates, unemployment rates, relative currency values, mortgage availability and pricing, as well as other consumer financing mechanisms, that ultimately affect demand for our products;
Any one of the factors above or the cumulative effect of some of the factors referred to above may result in significant fluctuations in our quarterly financial and other operating results, including fluctuations in our key metrics. The variability and unpredictability could result in our failing to meet our internal operating plan or the expectations of securities analysts or investors for any period. If we fail to meet or exceed such expectations for these or any other reasons, the market price of our shares could fall substantially and we could face costly lawsuits, including securities class action suits.
Certain provisions of our organizational documents and other contractual provisions may make it difficult for stockholders to change the composition of our board of directors and may discourage hostile takeover attempts that some of our stockholders may consider to be beneficial.
Certain provisions of our certificate of incorporation and bylaws may have the effect of delaying or preventing changes in control if our board of directors determines that such changes in control are not in the best interests of us and our stockholders. The provisions in our certificate of incorporation and bylaws include, among other things, the following:
- •
- a classified board of directors with three-year staggered terms;
- •
- the ability of our board of directors to issue shares of preferred stock and to determine the price and other terms, including preferences and voting rights, of those shares without stockholder approval;
24
- •
- stockholder action can only be taken at a special or regular meeting and not by written consent following the time that
Madison Dearborn Capital Partners IV, L.P., one of Madison Dearborn's investment funds ("MDCP IV"), and its affiliates cease to beneficially own a majority of our common stock;
- •
- advance notice procedures for nominating candidates to our board of directors or presenting matters at stockholder
meetings;
- •
- removal of directors only for cause following the time that MDCP IV and its affiliates cease to beneficially own a
majority of our common stock;
- •
- allowing only our board of directors to fill vacancies on our board of directors; and
- •
- following the time that MDCP IV and its affiliates cease to beneficially own a majority of our common stock, super-majority voting requirements to amend our bylaws and certain provisions of our certificate of incorporation.
In addition, we are party to a Director Nomination Agreement with BC Holdings that provides BC Holdings the right to designate nominees for election to our board of directors for so long as BC Holdings beneficially owns 10% or more of the total number of shares of our common stock then outstanding. The Director Nomination Agreement also provides that MDCP IV may cause BC Holdings to assign such right to MDCP IV or to an MDCP IV affiliate so long as MDCP IV and its affiliates are the beneficial owners of 50% or more of BC Holdings' voting equity interests.
We have elected in our certificate of incorporation not to be subject to Section 203 of the General Corporation Law of the State of Delaware ("DGCL"), an anti-takeover law. In general, Section 203 prohibits a publicly held Delaware corporation from engaging in a business combination, such as a merger, with a person or group owning 15% or more of the corporation's voting stock for a period of three years following the date the person became an interested stockholder, unless (with certain exceptions) the business combination or the transaction in which the person became an interested stockholder is approved in a prescribed manner. Accordingly, we are not subject to any anti-takeover effects of Section 203. However, our certificate of incorporation contains provisions that have the same effect as Section 203, except that they provide that Madison Dearborn, its affiliates (including any investment funds managed by Madison Dearborn) and any person that becomes an interested stockholder as a result of a transfer of 5% or more of our voting stock by the forgoing persons to such person are excluded from the "interested stockholder" definition in our certificate of incorporation and are therefore not subject to the restrictions set forth therein that have the same effect as Section 203.
While these provisions have the effect of encouraging persons seeking to acquire control of our company to negotiate with our board of directors, they could enable the board of directors to hinder or frustrate a transaction that some, or a majority, of the stockholders might believe to be in their best interests and, in that case, may prevent or discourage attempts to remove and replace incumbent directors.
These provisions may frustrate or prevent any attempts by our stockholders to replace or remove our current management by making it more difficult for stockholders to replace members of our board of directors, which is responsible for appointing the members of our management. For more information, see "Description of Capital Stock."
Any issuance of preferred stock could make it difficult for another company to acquire us or could otherwise adversely affect holders of our common stock, which could depress the price of our common stock.
Our board of directors has the authority to issue preferred stock and to determine the preferences, limitations and relative rights of shares of preferred stock and to fix the number of shares
25
constituting any series and the designation of such series, without any further vote or action by our stockholders. Our preferred stock could be issued with voting, liquidation, dividend and other rights superior to the rights of our common stock. The potential issuance of preferred stock may delay or prevent a change in control of us, discouraging bids for our common stock at a premium over the market price, and adversely affect the market price and the voting and other rights of the holders of our common stock.
Failure to establish and maintain effective internal controls in accordance with Section 404 of the Sarbanes-Oxley Act could have a material adverse effect on our business and stock price.
Upon becoming a public company, we became subject to the SEC's rules implementing Section 302 and 404 of the Sarbanes-Oxley Act, which require management to certify financial and other information in our quarterly and annual reports and provide an annual management report on the effectiveness of controls over financial reporting. However, even though we are required to disclose changes made in our internal controls and procedures on a quarterly basis, we will not be required to make our first annual assessment of our internal control over financial reporting pursuant to Section 404 until our fiscal year 2013 Form 10-K to be filed with the SEC in 2014. To comply with the requirements of being a public company, we may need to undertake various actions, such as implementing new internal controls and procedures and hiring accounting or internal audit staff. Testing and maintaining internal control could divert our management's attention from other matters that are important to the operation of our business.
Our independent registered public accounting firm is not required to formally attest to the effectiveness of our internal controls over financial reporting until our fiscal year 2014 Form 10-K. At such time, our independent registered public accounting firm may issue a report that is adverse, in the event it is not satisfied with the level at which our controls are documented, designed or operating. If we are unable to conclude that we have effective internal control over financial reporting, our independent registered public accounting firm is unable to provide us with an unqualified report as required by Section 404 or we are required to restate our financial statements, we may fail to meet our public reporting obligations and investors could lose confidence in our reported financial information, which could have a negative effect on the trading price of our common stock.
Our business and stock price may suffer as a result of our lack of public company operating experience.
Prior to our initial public offering, we were a privately-held company. Our lack of recent public company operating experience may make it difficult to forecast and evaluate our future prospects. If we are unable to execute our business strategy, either as a result of our inability to effectively manage our business in a public company environment or for any other reason, our business, prospects, financial condition and results of operations may be harmed.
If securities or industry analysts do not publish research or publish inaccurate or unfavorable research about our business, our stock price and trading volume could decline.
The trading market for our common stock relies in part on the research and reports that securities analysts and other third parties choose to publish about us. We do not control whether these analysts or other third parties provide research regarding our company. If one or more of the analysts who covers us downgrades our stock or publishes inaccurate or unfavorable research about our business, our stock price would likely decline. In addition, if one or more of these analysts ceases coverage of us or fails to publish reports on us regularly, demand for our stock could decrease, which could cause our stock price and trading volume to decline.
26
CAUTIONARY STATEMENT CONCERNING FORWARD-LOOKING STATEMENTS
Certain statements made in this prospectus contain forward-looking statements. Forward-looking statements are subject to risks and uncertainties that may cause our actual results, performance or achievements to be materially different from any future results, performance or achievements expressed or implied by these forward-looking statements. Forward-looking statements include information concerning our future financial performance, business strategy, plans, goals and objectives.
Statements preceded or followed by, or that otherwise include, the words "believes," "expects," "anticipates," "intends," "project," "estimates," "plans," "forecast," "is likely to" and similar expressions or future or conditional verbs such as "will," "may," "would," "should" and "could" are generally forward-looking in nature and not historical facts. Such statements are based upon the current beliefs and expectations of our management and are subject to significant risks and uncertainties. Actual results may differ materially from those set forth in the forward-looking statements.
The following factors, among others, could cause our actual results, performance or achievements to differ from those set forth in the forward-looking statements:
- •
- the commodity nature of our products and their price movements, which are driven largely by capacity utilization rates and
industry cycles that affect supply and demand;
- •
- general economic conditions, including but not limited to housing starts, repair and remodeling activity and light
commercial construction, inventory levels of new and existing homes for sale, foreclosure rates, interest rates, unemployment rates, relative currency values and mortgage availability and pricing, as
well as other consumer financing mechanisms, that ultimately affect demand for our products;
- •
- the highly competitive nature of our industry;
- •
- availability and affordability of raw materials, including wood fiber, glues and resins and energy;
- •
- the impact of actuarial assumptions and regulatory activity on pension costs and pension funding requirements;
- •
- the difficulty in offsetting fixed costs related to our recent capital investments if the housing market does not recover;
- •
- material disruptions at our manufacturing facilities;
- •
- the financial condition and creditworthiness of our customers;
- •
- concentration of our sales among a relatively small group of customers;
- •
- our substantial indebtedness, including the possibility that we may not generate sufficient cash flows from operations or
that future borrowings may not be available in amounts sufficient to fulfill our debt obligations and fund other liquidity needs;
- •
- cost of compliance with government regulations, in particular environmental regulations;
- •
- labor disruptions, shortages of skilled and technical labor, or increased labor costs;
- •
- impairment of our long-lived assets;
- •
- the need to successfully implement succession plans for certain members of our senior management team;
- •
- our reliance on Boise Inc. for many of our administrative services;
27
- •
- major equipment failure;
- •
- severe weather phenomena such as drought, hurricanes, tornadoes and fire;
- •
- increased costs as a public company; and
- •
- fluctuations in the market for our equity.
Certain of these and other factors are discussed in more detail in "Risk Factors" in this prospectus. These factors should not be construed as exhaustive and should be read in conjunction with the other cautionary statements that are included in this prospectus. While we believe that our forecasts and assumptions are reasonable, we caution that actual results may differ materially. If one or more of these or other risks or uncertainties materialize, or if our underlying assumptions prove to be incorrect, actual results may vary materially from what we projected. Consequently, actual events and results may vary significantly from those included in or contemplated or implied by our forward-looking statements. The forward-looking statements included in this prospectus are made only as of the date of this prospectus and we undertake no obligation to publicly update or review any forward-looking statement made by us or on our behalf, whether as a result of new information, future developments, subsequent events or circumstances or otherwise.
28
We obtained the industry, market and competitive position data used throughout this prospectus, or in the documents incorporated by reference herein, from our own internal estimates and research as well as from industry publications and research, surveys and studies conducted by third parties. Third party industry publications include APA—The Engineered Wood Association's First Quarter Engineered Wood Statistics (published in April 2013), RISI's 2012 Capacity Report (published in August 2012) and HIRI's Home Improvement Products Market Forecast (published in March 2013), as well as data published by the Blue Chip Economic Indicators as of July 2013, Random Lengths as of May 2013, IHS Global Insight as of July 2013, RISI as of April 2013 and the U.S. Census Bureau as of June 2013. Industry publications, studies and surveys generally state that they have been obtained from sources believed to be reliable, although they do not guarantee the accuracy or completeness of such information. The information derived from the sources cited in this prospectus represents the most recently available data and, therefore, we believe such data remains reliable. While we believe our internal company research is reliable and the market definitions are appropriate, neither such research nor these definitions have been verified by any independent source.
29
We will not receive any proceeds from the sale of any shares of our common stock offered by the selling stockholder.
30
MARKET PRICE OF OUR COMMON STOCK
Our common stock began trading on the NYSE under the symbol "BCC" on February 6, 2013. Prior to that, there was no public market for our common stock. The following table sets forth the high and low sales prices per share of our common stock as reported by the NYSE since February 6, 2013:
| |
High Sale Price |
Low Sale Price |
|||||
|---|---|---|---|---|---|---|---|
2013 |
|||||||
Third Quarter (through July 12, 2013) |
$ | 28.58 | $ | 25.29 | |||
Second Quarter |
$ | 33.99 | $ | 24.90 | |||
First Quarter (beginning February 6, 2013) |
$ | 34.54 | $ | 25.25 | |||
On July 12, 2013 there were 43,229,412 shares of our common stock outstanding, held by two stockholders of record, one of which was Cede & Co., which is the nominee of shares held through The Depository Trust Company. On July 12, 2013, the closing price of our common stock was $28.16.
31
We do not currently plan to pay a regular dividend on our common stock. In the future, the declaration and payment of dividends, if any, will be at the discretion of our board of directors and will depend upon our financial condition, earnings, contractual obligations, restrictions imposed by our revolving credit facility and the indenture governing our senior notes or applicable laws and other factors that our board of directors may deem relevant.
See "Management's Discussion and Analysis of Financial Condition and Results of Operations—Liquidity and Capital Resources—Debt Structure—Asset-Based Revolving Credit Facility" and "—Debt Refinancing" for a description of the restrictions in our revolving credit facility and the indenture governing our senior notes, respectively, on our ability to declare and pay dividends.
32
The following table presents our cash and cash equivalents and our consolidated capitalization as of March 31, 2013. This table should be read in conjunction with "Management's Discussion and Analysis of Financial Condition and Results of Operations" and the consolidated historical financial statements and notes thereto incorporated by reference in this prospectus.
| |
As of March 31, 2013 |
|||
|---|---|---|---|---|
| |
(in thousands) |
|||
Cash and cash equivalents |
$ | 233,547 | ||
Long-term debt (including current portion): |
||||
Revolving credit facility |
— | |||
63/8 senior notes due 2020 |
250,000 | |||
Total debt |
250,000 | |||
Stockholders' equity: |
||||
Preferred stock, $0.01 par value per share; 50,000 shares authorized, no shares issued and outstanding |
— | |||
Common stock, $0.01 par value per share; 300,000 shares authorized, 43,229 shares issued and outstanding |
432 | |||
Additional paid-in capital |
494,216 | |||
Accumulated other comprehensive loss |
(119,820 | ) | ||
Retained earnings |
74,605 | |||
Total stockholders' equity |
449,433 | |||
Total capitalization |
$ | 699,433 | ||
33
SELECTED HISTORICAL CONSOLIDATED FINANCIAL DATA
The following tables set forth our selected consolidated historical financial data. You should read the information set forth below in conjunction with "Capitalization," "Management's Discussion and Analysis of Financial Condition and Results of Operations" and our consolidated historical financial statements and notes thereto incorporated by reference in this prospectus. The statements of operations data for each of the years ended December 31, 2010, 2011 and 2012 and the balance sheet data as of December 31, 2011 and 2012 set forth below are derived from our audited consolidated financial statements incorporated by reference in this prospectus. The statements of operations data for each of the three-month periods ended March 31, 2012 and 2013 and the balance sheet data as of March 31, 2013 set forth below are derived from our unaudited quarterly consolidated financial statements incorporated by reference in this prospectus and contain all adjustments, consisting of normal recurring adjustments, that management considers necessary for a fair presentation of our financial position and results of operations for the periods presented. Operating results for the three-month periods are not necessarily indicative of results for a full financial year, or any other periods. The statements of operations data for each of the years ended December 31, 2008 and 2009 and the balance sheet data as of December 31, 2008, 2009 and 2010 are derived from our audited consolidated financial statements not included or incorporated by reference herein.
| |
Year Ended December 31 | Three Months Ended March 31 |
||||||||||||||||||||
|---|---|---|---|---|---|---|---|---|---|---|---|---|---|---|---|---|---|---|---|---|---|---|
| |
2008(1) | 2009 | 2010 | 2011 | 2012 | 2012 | 2013 | |||||||||||||||
| |
(in thousands, except per share data) |
|||||||||||||||||||||
Statements of Operations Data |
||||||||||||||||||||||
Sales |
$ | 2,977,498 | $ | 1,973,250 | $ | 2,240,591 | $ | 2,248,088 | $ | 2,779,062 | $ | 586,986 | $ | 744,878 | ||||||||
Costs and expenses(2) |
3,002,002 | 2,056,699 | 2,253,753 | 2,275,134 | 2,715,931 | 580,737 | 720,240 | |||||||||||||||
Income (loss) from operations |
(24,504 | ) | (83,449 | ) | (13,162 | ) | (27,046 | ) | 63,131 | 6,249 | 24,638 | |||||||||||
Foreign exchange gain (loss) |
(1,831 | ) | 1,025 | 352 | (497 | ) | 37 | 186 | (80 | ) | ||||||||||||
Change in fair value of contingent value rights(3) |
(507 | ) | 194 | — | — | — | — | — | ||||||||||||||
Change in fair value of interest rate swaps(4) |
(6,284 | ) | — | — | — | — | — | — | ||||||||||||||
Gain on repurchase of long-term debt(5) |
— | 6,026 | 28 | — | — | — | — | |||||||||||||||
Interest expense |
(34,313 | ) | (22,520 | ) | (21,005 | ) | (18,987 | ) | (21,757 | ) | (4,813 | ) | (4,891 | ) | ||||||||
Interest income |
4,931 | 886 | 790 | 407 | 392 | 107 | 62 | |||||||||||||||
|
(38,004 | ) | (14,389 | ) | (19,835 | ) | (19,077 | ) | (21,328 | ) | (4,520 | ) | (4,909 | ) | ||||||||
Income (loss) before income taxes |
(62,508 | ) | (97,838 | ) | (32,997 | ) | (46,123 | ) | 41,803 | 1,729 | 19,729 | |||||||||||
Income tax (provision) benefit(6) |
(470 | ) | (660 | ) | (300 | ) | (240 | ) | (307 | ) | (61 | ) | 61,107 | |||||||||
Net income (loss) |
$ | (62,978 | ) | $ | (98,498 | ) | $ | (33,297 | ) | $ | (46,363 | ) | $ | 41,496 | $ | 1,668 | $ | 80,836 | ||||
Net income (loss) per common share: |
||||||||||||||||||||||
Basic and diluted(7) |
$ | (2.12 | ) | $ | (3.32 | ) | $ | (1.12 | ) | $ | (1.56 | ) | $ | 1.40 | $ | 0.06 | $ | 2.15 | ||||
Weighted average shares outstanding: |
||||||||||||||||||||||
Basic and diluted(7) |
29,700 | 29,700 | 29,700 | 29,700 | 29,700 | 29,700 | 37,569 | |||||||||||||||
Other Financial Data |
||||||||||||||||||||||
Depreciation and amortization |
$ | 36,258 | $ | 40,874 | $ | 34,899 | $ | 37,022 | $ | 33,407 | $ | 8,119 | $ | 8,477 | ||||||||
Capital expenditures(8) |
51,867 | 21,404 | 35,751 | 39,319 | 29,741 | 7,082 | 5,316 | |||||||||||||||
EBITDA(9) |
9,416 | (35,330 | ) | 22,117 | 9,479 | 96,575 | 14,554 | 33,035 | ||||||||||||||
Adjusted EBITDA(9) |
(13,789 | ) | (41,550 | ) | 17,476 | 9,479 | 96,575 | 14,554 | 33,035 | |||||||||||||
Adjusted net income (loss)(10) |
(86,183 | ) | (104,718 | ) | (37,938 | ) | (46,363 | ) | 41,496 | 1,668 | 12,170 | |||||||||||
Adjusted net income (loss) per common share: |
||||||||||||||||||||||
Basic and diluted(10) |
(2.90 | ) | (3.53 | ) | (1.28 | ) | (1.56 | ) | 1.40 | 0.06 | 0.32 | |||||||||||
34
| |
December 31 | |
|||||||||||||||||
|---|---|---|---|---|---|---|---|---|---|---|---|---|---|---|---|---|---|---|---|
| |
March 31, 2013 |
||||||||||||||||||
| |
2008 | 2009 | 2010 | 2011 | 2012 | ||||||||||||||
| |
(in thousands) |
||||||||||||||||||
Balance Sheet Data |
|||||||||||||||||||
Cash and cash equivalents |
$ | 275,802 | $ | 287,101 | $ | 264,601 | $ | 182,455 | $ | 54,507 | $ | 233,547 | |||||||
Total current assets |
643,533 | 623,242 | 637,385 | 595,230 | 527,457 | 857,862 | |||||||||||||
Property and equipment, net |
291,999 | 270,229 | 273,569 | 266,456 | 265,924 | 261,221 | |||||||||||||
Total assets |
979,453 | 937,917 | 952,233 | 902,831 | 836,398 | 1,209,797 | |||||||||||||
Total debt |
315,000 | 303,146 | 219,560 | 219,560 | 275,000 | 250,000 | |||||||||||||
Total stockholders' equity |
329,372 | 359,285 | 409,093 | 282,619 | 97,764 | 449,433 | |||||||||||||
- (1)
- On
February 22, 2008, we sold our Paper and Packaging & Newsprint assets and most of our Corporate and Other assets to Boise Inc. 2008
includes the operating results of our sold Paper and Packaging & Newsprint assets through February 21, 2008.
- (2)
- In
2008, costs and expenses include $11.3 million of expenses related to closing our veneer operations in St. Helens, Oregon and our plywood
manufacturing facility in White City, Oregon, a $5.7 million net gain on the sale of our indirect wholly owned subsidiary in Brazil and a $2.9 million gain on the sale of our Paper and
Packaging & Newsprint assets. In 2009, costs and expenses include $8.9 million of expenses related to a facility closure, of which $3.7 million was included in EBITDA and
$5.2 million was accelerated depreciation recorded in depreciation and amortization. In 2010, costs and expenses include $4.6 million of income associated with receiving proceeds from a
litigation settlement related to vendor product pricing. In 2011, costs and expenses include $3.8 million of expense related to the closure of a laminated beam plant and noncash asset
write-downs.
- (3)
- Represents
the change in fair value of contingent value rights issued in connection with the sale of our Paper and Packaging & Newsprint assets in
2008.
- (4)
- 2008
includes $6.3 million of expense related to changes in the fair value of our interest rate swaps that we accounted for as economic hedges.
- (5)
- Represents
gain on the repurchase of $11.9 million and $8.6 million of our senior subordinated notes in 2009 and 2010, respectively.
- (6)
- The
three months ended March 31, 2013 includes a $68.7 million income tax benefit associated with the recording of net deferred tax assets
upon our conversion to a corporation.
- (7)
- We
have adjusted our historical financial statements to retroactively reflect the common stock authorized and outstanding following our conversion from a
limited liability company to a corporation, resulting in a retroactive adjustment to weighted average shares outstanding.
- (8)
- For
2009, includes $0.9 million of cash paid for the purchase of a truss assembly operation and EWP sales office in Saco and Biddeford, Maine,
respectively and $3.7 million of cash paid for the purchase of a sawmill in Pilot Rock, Oregon. For 2011, includes $5.8 million of cash paid for the acquisition of a laminated beam and
decking manufacturing plant in Homedale, Idaho. The year ended December 31, 2012, and the three months ended March 31, 2012 include $2.4 million for the acquisition of a sawmill
in Arden, Washington.
- (9)
- EBITDA is defined as income (loss) before interest (interest expense and interest income), income taxes and depreciation and amortization. EBITDA is the primary measure used by our chief operating decision maker to evaluate segment operating performance and to decide how to allocate resources to segments. We believe EBITDA is useful to investors because it provides a means to evaluate the operating performance of our segments and our company on an ongoing basis using criteria that are used by our internal decision makers and because it is frequently used by investors and other interested parties when comparing companies in our industry that have different financing and capital structures and/or tax rates. We believe EBITDA is a meaningful measure because it presents a transparent view of our recurring operating performance and allows management to readily view operating trends, perform analytical comparisons and identify strategies to improve operating performance. EBITDA, however, is not a measure of our liquidity or financial performance under GAAP and should not be considered as an alternative to net income (loss), income (loss) from operations, or any other performance measure derived in accordance with GAAP or as an alternative to cash flow from operating activities as a measure of our liquidity. The use of EBITDA instead of net income (loss) or segment income (loss) has limitations as an analytical tool, including the inability to determine profitability; the exclusion of interest expense, interest income and associated significant cash requirements; and the exclusion of depreciation and amortization, which represent unavoidable operating costs. Management compensates for the limitations of EBITDA by relying on our GAAP results. Our measure of EBITDA is not necessarily comparable to other similarly titled captions of other companies due to potential inconsistencies in the methods of calculation.
35
- Adjusted
EBITDA is defined as EBITDA before the change in fair value of contingent value rights issued in connection with the sale of our Paper
and Packaging & Newsprint assets, as well as certain other unusual items, including gain on the repurchase of long-term debt and a litigation gain. For 2008, Adjusted EBITDA also excludes the
operating results related to the Paper and Packaging & Newsprint assets sold in February 2008.
- The following is a reconciliation of net income (loss) to EBITDA and Adjusted EBITDA:
| |
Year Ended December 31, | Three Months Ended March 31 |
||||||||||||||||||||
|---|---|---|---|---|---|---|---|---|---|---|---|---|---|---|---|---|---|---|---|---|---|---|
| |
2008(c) | 2009 | 2010 | 2011 | 2012 | 2012 | 2013 | |||||||||||||||
| |
(in millions) |
|||||||||||||||||||||
Net income (loss) |
$ | (63.0 | ) | $ | (98.5 | ) | $ | (33.3 | ) | $ | (46.4 | ) | $ | 41.5 | $ | 1.7 | $ | 80.8 | ||||
Change in fair value of interest rate swaps(a) |
6.3 | — | — | — | — | — | — | |||||||||||||||
Interest expense |
34.3 | 22.5 | 21.0 | 19.0 | 21.8 | 4.8 | 4.9 | |||||||||||||||
Interest income |
(4.9 | ) | (0.9 | ) | (0.8 | ) | (0.4 | ) | (0.4 | ) | (0.1 | ) | (0.1 | ) | ||||||||
Income tax provision (benefit)(b) |
0.5 | 0.7 | 0.3 | 0.2 | 0.3 | 0.1 | (61.1 | ) | ||||||||||||||
Depreciation and amortization |
36.3 | 40.9 | 34.9 | 37.0 | 33.4 | 8.1 | 8.5 | |||||||||||||||
EBITDA |
$ | 9.4 | $ | (35.3 | ) | $ | 22.1 | $ | 9.5 | $ | 96.6 | $ | 14.6 | $ | 33.0 | |||||||
Paper segment(c) |
(21.1 | ) | — | — | — | — | — | — | ||||||||||||||
Packaging & Newsprint segment(c) |
(5.7 | ) | — | — | — | — | — | — | ||||||||||||||
Change in fair value of contingent value rights(d) |
0.5 | (0.2 | ) | — | — | — | — | — | ||||||||||||||
Gain on repurchase of long-term debt(e) |
— | (6.0 | ) | (0.0 | ) | — | — | — | — | |||||||||||||
Litigation gain(f) |
— | — | (4.6 | ) | — | — | — | — | ||||||||||||||
Facility closures and sales, net(f) |
3.1 | — | — | — | — | — | — | |||||||||||||||
Adjusted EBITDA |
$ | (13.8 | ) | $ | (41.6 | ) | $ | 17.5 | $ | 9.5 | $ | 96.6 | $ | 14.6 | $ | 33.0 | ||||||
- (a)
- See
Note (4) above.
- (b)
- See
Note (6) above.
- (c)
- See
Note (1) above.
- (d)
- See
Note (3) above.
- (e)
- See
Note (5) above.
- (f)
- See Note (2) above.
- (10)
- Adjusted net income (loss) is defined as net income (loss) before certain unusual items. We believe adjusted net income (loss) is useful to investors because it provides a more meaningful means to evaluate our operating performance. Adjusted net income (loss), however, is not a measure of our financial performance under GAAP and should not be considered as an alternative to net income (loss), income (loss) from operations, or any other performance measure derived in accordance with GAAP. Our measure of adjusted net income (loss) is not necessarily comparable to other similarly titled captions of other companies due to potential inconsistencies in the methods of calculation.
36
- The following is a reconciliation of net income (loss) to adjusted net income (loss):
| |
Year Ended December 31 | Three Months Ended March 31 |
||||||||||||||||||||
|---|---|---|---|---|---|---|---|---|---|---|---|---|---|---|---|---|---|---|---|---|---|---|
| |
2008 | 2009 | 2010 | 2011 | 2012 | 2012 | 2013 | |||||||||||||||
Net income (loss) |
$ | (63.0 | ) | $ | (98.5 | ) | $ | (33.3 | ) | $ | (46.4 | ) | $ | 41.5 | $ | 1.7 | $ | 80.8 | ||||
Paper segment(a) |
(21.1 | ) | — | — | — | — | — | — | ||||||||||||||
Packaging & Newsprint segment(a) |
(5.7 | ) | — | — | — | — | — | — | ||||||||||||||
Change in fair value of contingent value rights(b) |
0.5 | (0.2 | ) | — | — | — | — | — | ||||||||||||||
Gain on repurchase of long-term debt(c) |
— | (6.0 | ) | (0.0 | ) | — | — | — | — | |||||||||||||
Litigation gain(d) |
— | — | (4.6 | ) | — | — | — | — | ||||||||||||||
Facility closures and sales, net(d) |
3.1 | — | — | — | — | — | — | |||||||||||||||
Impact of deferred tax benefit(e) |
— | — | — | — | — | — | (68.7 | ) | ||||||||||||||
Adjusted net income (loss) |
$ | (86.2 | ) | $ | (104.7 | ) | $ | (37.9 | ) | $ | (46.4 | ) | $ | 41.5 | $ | 1.7 | $ | 12.2 | ||||
- (a)
- See
Note (1) above.
- (b)
- See
Note (3) above.
- (c)
- See
Note (5) above.
- (d)
- See
Note (2) above.
- (e)
- See Note (6) above.
37
MANAGEMENT'S DISCUSSION AND ANALYSIS OF FINANCIAL CONDITION AND RESULTS OF OPERATIONS
You should read this discussion and analysis in conjunction with our historical consolidated financial statements and the notes thereto incorporated by reference in this prospectus. Our historical results may not be indicative of our future performance. This discussion and analysis contains forward-looking statements and involves numerous risks and uncertainties, including, but not limited to, those discussed in "Risk Factors." Our actual results may differ materially from those contained in any forward-looking statements. References to "fiscal year" or "fiscal" refer to our fiscal year ended on December 31, 2012.
Overview
Company Background
We are a building products company headquartered in Boise, Idaho. Prior to the initial public offering of shares of our common stock, discussed in Note 13, "Equity," to our audited consolidated financial statements incorporated by reference herein, we were 100% owned by BC Holdings. We are a large, vertically-integrated wood products manufacturer and building materials distributor with widespread operations throughout the United States and Canada. We have three reportable segments: (i) Wood Products, which manufactures and sells EWP, plywood, studs, particleboard and ponderosa pine lumber; (ii) Building Materials Distribution, which is a wholesale distributor of building materials; and (iii) Corporate and Other, which includes corporate support staff services, related assets and liabilities and foreign exchange gains and losses. For more information, see Note 14, "Segment Information," to our audited consolidated financial statements incorporated by reference herein and Note 11, "Segment Information," to our unaudited consolidated financial statements incorporated by reference herein. Our broad line of products is used primarily in new residential construction, residential repair and remodeling projects, light commercial construction and industrial applications. We have a broad base of more than 4,500 customers, which includes a diverse mix of retail lumberyards, home improvement centers, leading wholesalers and industrial converters. Our Wood Products and Building Materials Distribution segments are vertically integrated from wood procurement through distribution. For the LTM period, approximately 38% of our Wood Products sales, including approximately 74% of our EWP sales, were to our Building Materials Distribution segment.
Factors That Affect Our Operating Results
Our results of operations and financial performance are influenced by a variety of factors, including: (i) the commodity nature of the products we manufacture and distribute; (ii) general economic and industry conditions affecting demand; and (iii) availability and affordability of raw materials, including wood fiber, glues, resins and energy. These factors have historically produced cyclicality in our results of operations, and we expect this cyclicality to continue in future periods.
Commodity Nature of Our Products
Many of the building products we manufacture or distribute, including OSB, plywood, lumber and particleboard, are commodities that are widely available from other manufacturers or distributors with prices and volumes determined frequently based on participants' perceptions of short-term supply and demand factors. At times, the price for any one or more of the products we produce may fall below our cash production costs, requiring us to either incur short-term losses on product sales or cease production at one or more of our manufacturing facilities. As a result, our profitability with respect to these commodity products depends, in significant part, on managing our cost structure, particularly raw materials and labor, which represent the largest components of our operating costs, as well as the purchase cost for commodities we distribute. Commodity wood product prices could be volatile in response to operating rates and inventory levels in various distribution channels.
38
The following table provides changes in the average composite panel (a composite calculation based on index prices for OSB and plywood) and average composite lumber prices as reflected by Random Lengths for the periods noted below:
| |
Year Ended December 31 | Three Months Ended March 31 |
|||||||||||
|---|---|---|---|---|---|---|---|---|---|---|---|---|---|
| |
2010 versus 2009 |
2011 versus 2010 |
2012 versus 2011 |
2013 versus 2012 |
|||||||||
Increase (decrease) in panel prices |
25 | % | (10 | )% | 32 | % | 50 | % | |||||
Increase (decrease) in lumber prices |
27 | % | (4 | )% | 19 | % | 43 | % | |||||
Periods of increasing prices provide the opportunity for higher sales and increased margins, while declining price environments may result in declines in sales and profitability. Commodity price increases and higher sales volumes during the three months ended March 31, 2013, compared with the same period in 2012, were the primary drivers of our improved total sales and income from operations for the three months ended March 31, 2013, which increased $157.9 million and $18.4 million, respectively. Commodity wood product prices have been, and we anticipate will continue to be, volatile in response to operating rates and inventory in various distribution channels, among other factors. For further discussion of the impact of commodity prices on historical periods, see "—Our Operating Results."
In our Wood Products segment, we plan to continue to respond to market conditions by actively managing our production facilities to balance supply with demand. In addition, we plan to further expand our market position in EWP. We believe that EWP will continue to gain market share from dimensional lumber products and that margins for EWP over time will be higher and more stable than those for most dimensional lumber products. We are focused on leveraging our manufacturing position, comprehensive customer service offering, design support capabilities and efficient distribution network to continue to gain market share among home builders, building products retailers and other distributors.
General Economic and Industry Conditions Affecting Demand
The level of housing starts is especially important to our results of operations. From 2005 to 2012, total housing starts in the United States declined by more than 60% and remained substantially below average historical levels during 2012. The significant drop in new residential construction created challenging conditions for building products distributors and manufacturers, with substantial reductions in manufacturing and distribution capacity occurring since late 2008, as companies adjusted to lower industry demand.
In contrast, housing starts increased substantially in 2012, and as a result, demand for the products we distribute and manufacture has also increased. As of July 2013, the Blue Chip Economic Indicators median consensus forecast for 2013 single- and multi-family housing starts in the U.S. was approximately 1.00 million units, compared with actual housing starts of 0.78 million in 2012 and 0.61 million in 2011, as reported by the U.S. Census Bureau. Many economists expect housing starts to continue to increase. We believe that, over the long-term, there is considerable growth potential in the U.S. housing sector.
Unemployment rates in the U.S. improved to 7.6% as of March 31, 2013, from 8.2% as of March 31, 2012. We believe continued employment growth and improved consumer confidence will be necessary to increase household formation rates. Improved household formation rates in turn will help stimulate new construction.
39
Demand for new residential construction is also influenced by several other economic conditions, including domestic population growth, immigration rates, residential vacancy and foreclosure rates, demand for second homes, existing home prices and consumer confidence.
We believe that our product line diversification provides us some protection from declines in new residential construction. Our products are used not only in new residential construction, but also in residential repair and remodeling projects. We believe the overall age of the U.S. housing stock, resales of existing homes, increased focus on making homes more energy efficient, rising home prices and availability of consumer loans at low interest rates will continue to support long-term growth in repair and remodeling expenditures and increased demand through home improvement centers and our other customers that service professional contractors.
Availability and Affordability of Raw Materials
Our principal raw material is wood fiber, which accounted for approximately 43% of the aggregate amount of materials, labor and other operating expenses, including from related parties (excluding depreciation), for our Wood Products segment in 2012. Timber comprises nearly 80% of our wood fiber costs, and we satisfy our timber requirements through a combination of purchases under supply agreements, open-market purchases and purchases pursuant to contracts awarded under public timber auctions. The fiber supply agreements require the timberland owners to sell a specified amount of timber to us at prices generally related to market prices. In 2012, approximately 33% of our timber was supplied pursuant to these agreements. See "Business—Raw Materials and Input Costs" for a description of these agreements.
We also bid in auctions conducted by federal, state and local authorities for the purchase of timber, generally at fixed prices, under contracts with a term of generally one to three years. In 2012, approximately 21% of our timber was supplied under government contracts. The remainder of our log supply in 2012 was supplied through private purchases directly from timber owners or through dealers.
The following table provides changes in our average per-unit log costs for the periods noted below:
| |
Year Ended December 31 | Three Months Ended March 31 |
|||||||||||
|---|---|---|---|---|---|---|---|---|---|---|---|---|---|
| |
2010 versus 2009 |
2011 versus 2010 |
2012 versus 2011 |
2013 versus 2012 |
|||||||||
Increase in per-unit log costs |
1 | % | 6 | % | 5 | % | 10 | % | |||||
The cost of timber is strongly correlated with prevailing product prices for building materials and manufacturers' expectations for future product prices, with an increase in product prices driving increases in timber costs. Because wood fiber is a commodity, prices have been cyclical historically in response to changes in domestic and foreign demand and supply. Demand for dimension lumber has a strong influence on pricing, as the dimension lumber industry is the largest consumer of timber. We anticipate that wood fiber costs will fluctuate in the future as building material product prices fluctuate. Generally, increases in the cost of timber lag product price increases, as improved manufacturer profitability often leads to increased demand for timber.
Foreign demand for timber exports, particularly from China, increased timber costs in the western U.S. in 2010 and 2011 and negatively affected wood products manufacturers in the region. In 2012, China's demand for timber exports from the western U.S. declined from 2011 levels, but in the future we expect that the level of foreign demand for timber exports from the western U.S. will continue to fluctuate based on the economic activity in China and other Pacific Rim countries, currency exchange rates and the availability of timber supplies from other countries such as Canada, Russia and
40
New Zealand. Sustained periods of high timber costs may impair the cost competitiveness of our manufacturing facilities. Availability of residual wood fiber for our particleboard operation has been negatively affected by significant mill closures and curtailments that have occurred among solid-wood product producers.
Our aggregate cost of obtaining timber is also affected by fuel costs and the distance between our fiber source and our facilities, as we are often required to transport the timber we purchase from the source to our facilities.
We also use various resins and glues in our manufacturing processes, which accounted for approximately 6% of the aggregate amount of materials, labor and other operating expenses, including from related parties (excluding depreciation), for our Wood Products segment in 2012. The costs of resins and glues are influenced by changes in the prices of raw material input costs, primarily fossil fuel products. We purchase many of our raw materials through long-term contracts that contain price adjustment mechanisms that take into account changes in market prices. Therefore, although our long-term contracts provide us with supplies of raw materials and energy that are more stable than open-market purchases, in many cases, they may not alleviate fluctuations in market prices.
We also purchase OSB, which is used as the vertical web to assemble I-joists, from third parties. OSB accounted for approximately 5% of the aggregate amount of materials, labor and other operating expenses, including from related parties (excluding depreciation), for our Wood Products segment in 2012.
The following table provides average weekly OSB composite prices as reflected by Random Lengths for the years ended December 31, 2010, December 31, 2011 and December 31, 2012, and the three months ended March 31, 2013:
| |
Year Ended December 31 | |
|||||||||||
|---|---|---|---|---|---|---|---|---|---|---|---|---|---|
| |
Three Months Ended March 31, 2013 |
||||||||||||
| |
2010 | 2011 | 2012 | ||||||||||
OSB composite prices |
$ | 253 | $ | 209 | $ | 302 | $ | 472 | |||||
41
Our Operating Results
The following tables set forth our operating results in dollars and as a percentage of sales for the years ended December 31, 2010, 2011 and 2012, and the three months ended March 31, 2012 and 2013:
| |
Year Ended December 31 | Three Months Ended March 31, 2013 |
||||||||||||||
|---|---|---|---|---|---|---|---|---|---|---|---|---|---|---|---|---|
| |
2010 | 2011 | 2012 | 2012 | 2013 | |||||||||||
Sales |
(millions) | |||||||||||||||
Trade |
$ | 2,240.6 | $ | 2,248.1 | $ | 2,779.1 | $ | 587.0 | $ | 744.9 | ||||||
Costs and expenses |
||||||||||||||||
Materials, labor and other operating expenses (excluding depreciation) |
1,981.0 | 1,992.7 | 2,403.4 | 510.1 | 644.8 | |||||||||||
Depreciation and amortization |
34.9 | 37.0 | 33.4 | 8.1 | 8.5 | |||||||||||
Selling and distribution expenses |
202.5 | 205.0 | 235.1 | 53.8 | 57.0 | |||||||||||
General and administrative expenses |
40.0 | 37.2 | 43.1 | 9.0 | 10.0 | |||||||||||
Other (income) expense, net |
(4.6 | ) | 3.2 | 0.9 | (0.4 | ) | (0.1 | ) | ||||||||
|
2,253.8 | 2,275.1 | 2,715.9 | 580.7 | 720.2 | |||||||||||
Income (loss) from operations |
$ | (13.2 | ) | $ | (27.0 | ) | $ | 63.1 | $ | 6.2 | $ | 24.6 | ||||
Sales |
(percentage of sales) |
|||||||||||||||
Trade |
100.0 | % | 100.0 | % | 100.0 | % | 100.0 | % | 100.0 | % | ||||||
Costs and expenses |
||||||||||||||||
Materials, labor and other operating expenses (excluding depreciation) |
88.4 | % | 88.6 | % | 86.5 | % | 86.9 | % | 86.6 | % | ||||||
Depreciation and amortization |
1.6 | 1.6 | 1.2 | 1.4 | 1.1 | |||||||||||
Selling and distribution expenses |
9.0 | 9.1 | 8.5 | 9.2 | 7.7 | |||||||||||
General and administrative expenses |
1.8 | 1.7 | 1.6 | 1.5 | 1.3 | |||||||||||
Other (income) expense, net |
(0.2 | ) | 0.1 | — | (0.1 | ) | — | |||||||||
|
100.6 | % | 101.2 | % | 97.7 | % | 98.9 | % | 96.7 | % | ||||||
Income (loss) from operations |
(0.6 | )% | (1.2 | )% | 2.3 | % | 1.1 | % | 3.3 | % | ||||||
Sales Volumes and Prices
Set forth below are historical U.S. housing starts data, segment sales volumes and average net selling prices for the principal products sold by our Wood Products segment, and sales mix and gross margin information for our Building Materials Distribution segment, in each case for the years ended December 31, 2010, 2011 and 2012 and the three months ended March 31, 2012 and 2013.
42
| |
Year Ended December 31 | Three Months Ended March 31 |
||||||||||||||
|---|---|---|---|---|---|---|---|---|---|---|---|---|---|---|---|---|
| |
2010 | 2011 | 2012 | 2012 | 2013 | |||||||||||
U.S. Housing Starts(a) |
(millions) | |||||||||||||||
Single-family |
0.47 | 0.43 | 0.54 | 0.11 | 0.14 | |||||||||||
Multi-family |
0.12 | 0.18 | 0.24 | 0.05 | 0.07 | |||||||||||
|
0.59 | 0.61 | 0.78 | 0.16 | 0.21 | |||||||||||
Segment Sales |
(millions) |
|||||||||||||||
Wood Products |
$ | 687.4 | $ | 712.5 | $ | 943.3 | $ | 211.1 | $ | 269.2 | ||||||
Building Materials Distribution |
1,778.0 | 1,779.4 | 2,190.2 | 451.4 | 581.1 | |||||||||||
Intersegment eliminations |
(224.8 | ) | (243.7 | ) | (354.4 | ) | (75.6 | ) | (105.5 | ) | ||||||
|
$ | 2,240.6 | $ | 2,248.1 | $ | 2,779.1 | $ | 587.0 | $ | 744.9 | ||||||
Wood Products |
(millions) |
|||||||||||||||
Sales Volumes |
||||||||||||||||
Laminated veneer lumber (LVL) (cubic feet) |
6.6 | 7.1 | 9.1 | 2.1 | 2.7 | |||||||||||
I-joists (equivalent lineal feet) |
106 | 110 | 145 | 30 | 41 | |||||||||||
Plywood (sq. ft.) (3/8" basis) |
1,088 | 1,106 | 1,356 | 328 | 346 | |||||||||||
Lumber (board feet) |
149 | 153 | 188 | 41 | 50 | |||||||||||
Wood Products |
(dollars per unit) |
|||||||||||||||
Average Net Selling Prices |
||||||||||||||||
Laminated veneer lumber (LVL) (cubic foot) |
$ | 15.53 | $ | 15.51 | $ | 14.80 | $ | 15.05 | $ | 15.25 | ||||||
I-joists (1,000 equivalent lineal feet) |
937 | 957 | 921 | 935 | 964 | |||||||||||
Plywood (1,000 sq. ft.) (3/8" basis) |
248 | 232 | 295 | 267 | 331 | |||||||||||
Lumber (1,000 board feet) |
424 | 421 | 430 | 414 | 463 | |||||||||||
Building Materials Distribution |
(percentage of Building Materials Distribution sales) |
|||||||||||||||
Product Line Sales |
||||||||||||||||
Commodity |
49.5 | % | 47.0 | % | 49.9 | % | 50.2 | % | 54.1 | % | ||||||
General line |
39.2 | % | 40.6 | % | 36.3 | % | 36.5 | % | 31.0 | % | ||||||
Engineered wood products |
11.3 | % | 12.4 | % | 13.8 | % | 13.3 | % | 14.9 | % | ||||||
Gross margin percentage(b) |
11.9 | % | 11.7 | % | 11.7 | % | 11.5 | % | 11.0 | % | ||||||
- (a)
- Actual
U.S. housing starts as reported by the U.S. Census Bureau.
- (b)
- We define gross margin as "Sales" less "Materials, labor and other operating expenses (excluding depreciation)." Materials, labor and other operating expenses for our Building Materials Distribution segment primarily includes costs of inventory purchased for resale. Gross margin percentage is gross margin as a percentage of segment sales.
43
Three Months Ended March 31, 2013 Compared With Three Months Ended March 31, 2012
Sales
For the three months ended March 31, 2013, total sales increased $157.9 million, or 27%, to $744.9 million from $587.0 million during the three months ended March 31, 2012. The increase in sales was driven primarily by increases in sales volumes and prices for many of the products we manufacture and distribute. Average composite panel and average composite lumber prices for the three months ended March 31, 2013, were 50% and 43% higher, respectively, than in the same period in the prior year, as reflected by Random Lengths composite panel and lumber pricing. Increases in OSB and dimension lumber were the primary drivers of the price increases within the composite indexes. These price changes were a major contributor to the mix shift to a greater proportion of commodity sales, as well as an 18% increase in sales prices in our Building Materials Distribution segment when compared to the same quarter in the prior year. U.S. housing starts increased 34% in first quarter 2013, compared with the same period in the prior year. Single-family housing starts, which are a primary driver of our sales and typically result in higher building product utilization per start than multi-family units, experienced an increase of 29% for the quarter, compared with the same period in 2012.
Wood Products. Sales, including sales to our Building Materials Distribution segment, increased $58.1 million, or 28%, to $269.2 million for the three months ended March 31, 2013, from $211.1 million for the three months ended March 31, 2012. The increase in sales was due primarily to higher plywood prices and volumes, resulting in increases of $22.3 million and $4.8 million, respectively, as well as increased EWP volumes resulting in an increase of $20.3 million. Lumber sales volumes and prices also contributed $3.7 million and $2.4 million, respectively, to the increase in sales. Laminated veneer lumber (LVL) and I-joist sales volumes increased 28% and 37%, respectively, due to higher levels of residential construction activity, additional sales to existing customers, and sales to new EWP customers. In addition, lumber and plywood sales volumes increased 22% and 5%, respectively. Plywood and lumber prices increased 24% and 12%, respectively, while LVL and I-joist sales prices improved modestly by 1% and 3%, respectively.
Building Materials Distribution. Sales increased $129.7 million, or 29%, to $581.1 million for the three months ended March 31, 2013, from $451.4 million for the three months ended March 31, 2012. Commodity pricing increased significantly in the comparative periods, with the overall increase in sales driven primarily by improvements in sales prices and volumes of 18% and 9%, respectively. By product line, sales of EWP (substantially all of which is sourced through our Wood Products segment) increased 44%, or $26.5 million; commodity sales increased 39%, or $87.6 million; and general line product sales increased 9%, or $15.6 million.
Costs and Expenses
Materials, labor, and other operating expenses increased $134.7 million, or 26%, to $644.8 million for the three months ended March 31, 2013, compared with $510.1 million during the same period in the prior year. The increase primarily reflects higher manufacturing costs, including wood costs, labor, glues and resins, and energy, driven by higher sales volumes of EWP, lumber, and plywood in our Wood Products segment, as well as higher per-unit log costs, which increased approximately 10%, compared with the same period in 2012. However, materials, labor, and other operating expenses as a percentage of sales ("MLO rate") in our Wood Products segment decreased by 160 basis points. The decrease in the MLO rate was primarily the result of improved leveraging of labor costs of 360 basis points due to higher sales, offset partially by increases in wood fiber costs and other manufacturing costs, including inventory purchased for resale, of 140 and 60 basis points, respectively. In addition, the increase in materials, labor, and other operating expenses was driven by higher purchased materials costs as a result of higher sales volumes in our Building Materials
44
Distribution segment, as well as a 50-basis-point increase in the MLO rate, compared with the prior year, in our Building Materials Distribution segment.
Depreciation and amortization expenses were relatively flat for the three months ended March 31, 2013, compared with the same period in the prior year.
Selling and distribution expenses increased $3.2 million, or 6%, to $57.0 million for the three months ended March 31, 2013, compared with $53.8 million for the same period in the prior year. The increase was due primarily to higher employee-related expenses of $2.1 million and higher transportation costs in our Building Materials Distribution segment of $0.5 million due to increased sales volumes.
General and administrative expenses increased $1.0 million, or 11%, to $10.0 million for the three months ended March 31, 2013, compared with $9.0 million for the same period in the prior year. The increase was due primarily to higher professional service expenses of $0.6 million and higher employee-related expenses of $0.4 million.
For both the three months ended March 31, 2013 and 2012, other (income) expense, net, was insignificant.
Income (Loss) From Operations
Income from operations increased $18.4 million to $24.6 million of income for the three months ended March 31, 2013, compared with $6.2 million for the three months ended March 31, 2012. Our improved financial results were driven primarily by higher sales volumes and prices for many of the products we manufacture and distribute, as well as leveraging of labor costs, as discussed above.
Wood Products. Segment income improved $10.0 million to $20.8 million of income for the three months ended March 31, 2013, from $10.8 million of income for the three months ended March 31, 2012. The increase in segment income was driven primarily by higher plywood, lumber, and EWP sales prices, as well as improved leveraging of selling and distribution expenses and depreciation and amortization. These improvements were offset partially by higher wood fiber costs.
Building Materials Distribution. Segment income (loss) improved $8.8 million to $8.0 million of income for the three months ended March 31, 2013, from a $0.8 million loss for the three months ended March 31, 2012. The improvement in segment income was driven primarily by a higher gross margin of $12.2 million, which was generated by increased sales, offset partially by a decline in gross margin percentage of 50 basis points, compared with the same period in the prior year. While total selling and distribution expenses increased 6%, these costs decreased as a percentage of segment sales by 180 basis points, as selling and distribution expenses did not increase at the same rate as sales.
Income Tax (Provision) Benefit
On February 4, 2013, we converted from a limited liability company to a corporation. In addition, we elected to be treated as a corporation for federal and state income tax purposes effective as of January 1, 2013. Therefore, we became subject to federal and state income tax expense beginning January 1, 2013. As a result of our conversion to a corporation, we recorded deferred tax assets, net of deferred tax liabilities, of $68.7 million on our Consolidated Balance Sheet, the effect of which was recorded as an income tax benefit in our Consolidated Statement of Operations during the three months ended March 31, 2013. As a corporation, we are subject to typical corporate U.S. federal and state income tax rates, which results in a statutory tax rate of approximately 38% under current tax law. For the three months ended March 31, 2013, excluding the discrete establishment of net deferred tax assets, we recorded $7.6 million of income tax expense and had an effective rate of 38.3%. During the three months ended March 31, 2013, the primary reason for the difference from the federal statutory income tax rate of 35% was the effect of state taxes.
45
Prior to January 1, 2013, as a limited liability company, we were not subject to entity-level federal or state income taxation. Our income tax provision generally consisted of income taxes payable to state jurisdictions that did not allow for the income tax liability to be passed through to our former sole member as well as income taxes payable by our separate subsidiaries that are taxed as corporations. As a limited liability company, we had an effective tax rate of less than 1%.
2012 Compared With 2011
Sales
For the year ended December 31, 2012, total sales increased $531.0 million, or 24%, to $2,779.1 million from $2,248.1 million during the year ended December 31, 2011, driven primarily by higher plywood sales volumes and prices, which increased 23% and 27%, respectively, as well as higher EWP sales volumes, which increased 30%, in our Wood Products segment, in each case as compared with the same period in the prior year. In addition, the increase in sales was driven by increases in sales volumes and prices of 13% and 9%, respectively, in our Building Materials Distribution segment, as compared with the same period in 2011. Average composite panel and average composite lumber prices for the year ended December 31, 2012, were 32% and 19% higher, respectively, than in the same period in the prior year, as reflected by Random Lengths composite panel and lumber pricing. Single-family housing starts, which are a primary driver of our sales and typically result in higher building product utilization per start than multi-family units, experienced an increase of 24% for the year, compared with 2011.
Wood Products. During the year ended December 31, 2012, sales, including sales to our Building Materials Distribution segment, increased $230.8 million, or 32%, to $943.3 million from $712.5 million in 2011. The increase in sales was due primarily to higher plywood prices and volumes of $84.6 million and $58.0 million, respectively, as well as increased EWP volumes of $63.9 million, with the remaining increases due to increased lumber volumes, offset partially by declines in EWP prices. The increase in sales volumes also drove an increase in shipping and handling revenue of $15.3 million. Plywood sales volumes increased 23%, primarily as a result of increased operating rates and market share gains. LVL and I-joist sales volumes increased 28% and 31%, respectively, due to higher levels of residential construction activity, additional sales to existing customers and sales from new EWP customers. In addition, lumber sales volumes increased 23%. Plywood prices increased 27%, while LVL and I-joist sales prices declined 5% and 4%, respectively.
Building Materials Distribution. During the year ended December 31, 2012, sales increased $410.8 million, or 23%, to $2,190.2 million from $1,779.4 million for the prior year. The increase in sales was driven primarily by improvements in sales volumes and prices of 13% and 9%, respectively. By product line, sales of EWP (substantially all of which is sourced through our Wood Products segment) increased 37%, or $81.6 million; commodity sales increased 31%, or $256.6 million; and general line products sales increased 10%, or $72.6 million.
Costs and Expenses
Materials, labor and other operating expenses, including from related parties (excluding depreciation), increased $410.7 million, or 21%, to $2,403.4 million for the year ended December 31, 2012, compared with $1,992.7 million during the prior year. Higher manufacturing costs, including wood costs, labor, glues and resins and energy, were driven by higher sales volumes of plywood and EWP in our Wood Products segment, as well as higher per-unit log costs, which increased 5% as compared with the same period in 2011. However, the MLO rate in our Wood Products segment decreased by 600 basis points due to higher sales. The decrease in the MLO rate was primarily the result of improved leveraging of labor costs and other manufacturing costs of 340 and 260 basis points, respectively. Wood fiber costs as a percentage of sales for the year ended December 31, 2012 were flat, compared with the
46
prior year. In addition, the increase primarily reflects higher purchased materials costs as a result of higher sales volumes in our Building Materials Distribution segment. The MLO rate was flat, compared with the prior year in our Building Materials Distribution segment.
Depreciation and amortization expenses decreased $3.6 million, or 10%, to $33.4 million for the year ended December 31, 2012, compared with $37.0 million during the prior year. The decrease was due primarily to certain property and equipment becoming fully depreciated during 2011.
Selling and distribution expenses increased $30.1 million, or 15%, to $235.1 million for the year ended December 31, 2012, compared with $205.0 million for the prior year. The increase was due primarily to increased compensation and benefit costs of $20.5 million, including performance-based incentive costs, due to our improved operating results, as well as higher transportation costs of $4.1 million in our Building Materials Distribution segment due to increased sales volumes. The change in transportation costs excludes payroll costs related to shipping and handling, which are included in the change in compensation and benefit costs discussed above.
General and administrative expenses increased $5.9 million, or 16%, to $43.1 million for the year ended December 31, 2012, compared with $37.2 million for the prior year. The increase was due primarily to higher performance-based incentive costs as a result of improved operating results.
Outsourcing Services Agreement. Included in the 2012 and 2011 costs and expenses set forth above are $15.0 million and $14.7 million, respectively, of expenses related to the Outsourcing Services Agreement we have with Boise Inc., under which Boise Inc. provides a number of corporate staff services to us at cost. For more information related to the Outsourcing Services Agreement, see Note 3, "Outsourcing Services Agreement," to our audited consolidated financial statements incorporated by reference in this prospectus.
Other (income) expense, net, for the year ended December 31, 2012, was $0.9 million of expense. Other (income) expense, net, for the year ended December 31, 2011, was $3.2 million of expense, including $1.3 million related to the closure of a laminated beam manufacturing plant in Emmett, Idaho, and $2.0 million in noncash asset write-downs.
Income (Loss) From Operations
Income from operations increased $90.2 million to $63.1 million for the year ended December 31, 2012, compared with a $27.0 million loss for the year ended December 31, 2011. Our improved financial results were driven primarily by higher sales volumes and prices for many of the products we manufacture and distribute, as well as leveraging of labor and manufacturing costs, as discussed above. In addition, during the year ended December 31, 2011, we recorded $3.8 million of charges related to the closure of a manufacturing plant in our Wood Products segment and noncash asset write-downs. These charges are discussed in more detail below.
Wood Products. For the year ended December 31, 2012, segment income improved $70.9 million to $55.8 million of income from a $15.1 million loss for the year ended December 31, 2011. The increase in segment income was driven primarily by higher plywood sales prices as well as lower per-unit manufacturing costs resulting from higher sales volumes of EWP and plywood and productivity improvements. These improvements were offset partially by higher wood fiber costs, an increase in selling and distribution costs and declines in EWP prices. In addition, during 2011, we recorded charges of $2.6 million related to the closure of a manufacturing plant in our Wood Products segment and noncash asset write-downs.
47
Building Materials Distribution. For the year ended December 31, 2012, segment income increased $22.0 million to $24.0 million from $2.0 million for the year ended December 31, 2011. The improvement in segment income was driven primarily by a 13% improvement in sales volumes with gross margin as a percentage of sales flat, compared with the prior year. While total selling and distribution expenses increased 13%, these costs decreased as a percentage of segment sales by 90 basis points, as selling and distribution expenses did not increase at the same rate as sales. In addition, during 2011, we recorded a noncash asset write-down of $1.2 million.
Other
Foreign Exchange Gain (Loss). For the year ended December 31, 2012, foreign exchange gain (loss) was approximately break-even, compared with a loss of $0.5 million for the prior year. During 2012, the U.S. dollar, compared with the Canadian dollar, was flat.
Interest Expense. Interest expense increased $2.8 million, or 15%, to $21.8 million for the year ended December 31, 2012, compared with $19.0 million for the prior year. Amortization of deferred financing costs increased approximately $1.7 million from the prior year due primarily to the write-off of deferred financing costs associated with our senior subordinated notes that were redeemed in the fourth quarter of 2012. In addition, in conjunction with the issuance of our senior notes on October 22, 2012, we also issued a redemption notice on the remaining senior subordinated notes outstanding, which required us to pay $1.0 million of interest through the redemption date of November 21, 2012.
2011 Compared With 2010
Sales
For the year ended December 31, 2011, total sales increased $7.5 million, or 0.3%, to $2,248.1 million from $2,240.6 million during the year ended December 31, 2010, driven primarily by increases in sales volumes for LVL, I-joists and plywood of 8%, 5% and 2%, respectively, as compared with 2010, as well as higher byproduct sales, offset partially by a decrease in plywood prices of 6%, as compared with 2010. U.S. housing starts increased 4% in 2011, compared with the prior year. However, single-family housing starts, which are a primary driver of our sales and typically result in higher building product utilization per start than multi-family units, declined 9% for the year, compared with 2010. Commodity product prices in 2011 were much less volatile than commodity product prices in 2010. Average composite lumber and panel prices in 2011 were 4% and 10% lower, respectively, than in 2010, as reflected by Random Lengths composite lumber and panel pricing.
Wood Products. For the year ended December 31, 2011, sales, including sales to our Building Materials Distribution segment, increased $25.1 million, or 4%, to $712.5 million from $687.4 million in 2010. The increase in sales was due primarily to higher EWP and plywood sales volumes of $12.7 million and $4.6 million, respectively, as well as higher byproduct sales of $11.3 million, offset partially by lower plywood prices of $16.9 million. The increase in sales volumes also drove an increase in shipping and handling revenue of $6.8 million. In 2011, LVL and I-joist sales volumes increased 8% and 5%, respectively, due to the capture of further sales opportunities with customers in the U.S. and Canada and further EWP market penetration. Compared with 2010, I-joist prices increased 2%, while LVL prices were flat. Plywood volumes increased 2% in 2011, while plywood prices decreased 6%, compared with the prior year.
Building Materials Distribution. For the year ended December 31, 2011, sales increased $1.4 million, or 0.1%, to $1,779.4 million from $1,778.0 million for the year ended December 31, 2010. Compared with 2010, the overall volume of product sold and product sales prices were flat. By product line, sales of EWP increased 10%, or $19.7 million, and general line product sales increased 3%, or $25.5 million, offset by a 5%, or $43.8 million, decline in commodity sales due to lower pricing.
48
Costs and Expenses
Materials, labor and other operating expenses, including from related parties (excluding depreciation), increased $11.7 million, or 1%, to $1,992.7 million for the year ended December 31, 2011, compared with $1,981.0 million during the prior year. The increase primarily reflects higher manufacturing costs, including wood costs, labor, glues and resins and energy, as a result of higher sales volumes of EWP and plywood in our Wood Products segment. In addition, the MLO rate increased by 20 basis points. Within wood costs, delivered-log costs were 6% higher in 2011, as compared with 2010, driven by higher log costs in the Pacific Northwest, offset partially by lower costs for OSB in our I-joist production. In our Wood Products segment, the MLO rate increased by 50 basis points. The increase in the Wood Products segment MLO rate was primarily the result of higher wood fiber costs and labor costs of 230 and 40 basis points, respectively, offset partially by a 220-basis-point decrease in other manufacturing costs.
Depreciation and amortization expenses increased $2.1 million, or 6%, to $37.0 million for the year ended December 31, 2011, compared with $34.9 million during the prior year. The increase was due primarily to purchases of property and equipment and accelerated depreciation of $0.4 million on a closed manufacturing plant in our Wood Products segment.
Selling and distribution expenses increased $2.5 million, or 1%, to $205.0 million for the year ended December 31, 2011, compared with $202.5 million for the prior year. The increase was due primarily to higher employee-related expenses of $1.4 million, including costs in our Wood Products segment to support our growing EWP sales in Canada. In addition, in our Building Materials Distribution segment, higher transportation costs of $1.4 million were offset partially by lower other variable expenses. The change in transportation costs excludes payroll costs related to shipping and handling, which are included in the change in compensation and benefit costs discussed above.
General and administrative expenses, including from related party, decreased $2.8 million, or 7%, to $37.2 million for the year ended December 31, 2011, compared with $40.0 million for the prior year. The decrease was due primarily to lower incentive compensation costs.
Outsourcing Services Agreement. Included in the 2011 and 2010 costs and expenses set forth above are $14.7 million and $14.4 million, respectively, of expenses related to the Outsourcing Services Agreement we have with Boise Inc., under which Boise Inc. provides a number of corporate staff services to us at cost. For more information related to the Outsourcing Services Agreement, see Note 3, "Outsourcing Services Agreement," to our audited consolidated financial statements incorporated by reference in this prospectus.
Other (income) expense, net, for the year ended December 31, 2011, was $3.2 million of expense, including $1.3 million related to the closure of a laminated beam manufacturing plant in Emmett, Idaho, and $2.0 million in noncash asset write-downs. In 2010, other (income) expense included $4.6 million of income associated with receiving proceeds from a litigation settlement related to vendor product pricing.
Income (Loss) From Operations
Loss from operations increased $13.8 million to a $27.0 million loss for the year ended December 31, 2011, compared with a $13.2 million loss for the year ended December 31, 2010, due primarily to a 20-basis-point decline in gross margins, as further described below, and $3.8 million of charges related to the closure of a laminated beam manufacturing plant in Emmett, Idaho, and noncash asset write-downs. Also, 2010 benefited from $4.6 million of income from a litigation settlement related to vendor product pricing. These changes are discussed in more detail below.
Wood Products. Segment loss increased $7.0 million, or 86%, to $15.1 million for the year ended December 31, 2011, from $8.1 million for the year ended December 31, 2010. The increase in
49
segment loss was driven primarily by a 6% decrease in plywood prices, offset partially by higher prices and sales volumes in our EWP business, as well as higher byproduct sales. In addition, depreciation and amortization expense and selling and distribution costs increased in 2011, compared with the prior year. During 2011, we also recorded charges of $2.6 million related to the closure of a laminated beam manufacturing plant in Emmett, Idaho, and noncash asset write-downs. During 2010, the segment benefited from $0.5 million of income from a litigation settlement related to vendor product pricing. Excluding the $2.6 million of closure costs and noncash asset write-downs from the 2011 results and the $0.5 million litigation settlement from the 2010 results, segment loss increased $3.9 million.
Building Materials Distribution. Segment income decreased $9.6 million, or 83%, to $2.0 million for the year ended December 31, 2011, from $11.6 million for the year ended December 31, 2010. The decrease in income was driven by a 20-basis-point decline in gross margins resulting from competitive pressures and more stable commodity pricing, allowing for less margin opportunity, a $0.9 million increase in depreciation and amortization expense and higher transportation costs. In addition, during 2011, we recorded $1.2 million of noncash asset write-downs. During 2010, the segment benefited from $4.1 million of income from a litigation settlement related to vendor product pricing. Excluding the $1.2 million of noncash asset write-downs from the 2011 results and the $4.1 million litigation settlement from the 2010 results, segment income declined $4.3 million.
Other
Foreign Exchange Gain (Loss). For the year ended December 31, 2011, foreign exchange loss was $0.5 million, compared with a gain of $0.4 million for the prior year. The 2011 loss was driven primarily by the strengthening of the U.S. dollar, compared with the Canadian dollar.
Interest Expense. Interest expense decreased $2.0 million, or 10%, to $19.0 million for the year ended December 31, 2011, compared with $21.0 million for the prior year. We paid down outstanding borrowings on our revolving credit facility in April 2010 and repurchased $8.6 million of our senior subordinated notes in December 2010, which subsequently lowered our interest expense. In addition, interest expense was higher in 2010 due to the write-off of a portion of deferred financing costs associated with the April 2010 paydown and commitment reduction of our prior revolving credit facility.
Industry Mergers and Acquisitions
On December 13, 2012, International Paper announced that it had reached an agreement to sell its Temple-Inland Building Products division to Georgia-Pacific LLC for $750 million in cash.
There have been no other major transactions in the North American building products manufacturing and distribution sectors in the past several months.
Acquisitions
In February 2012, we completed the purchase of a sawmill in Arden, Washington, which we believe will improve fiber integration and enhance the product mix capabilities of our Inland Region lumber operations.
Liquidity and Capital Resources
On February 11, 2013, we issued 13,529,412 shares of common stock in our initial public offering. Following this initial public offering, we received proceeds of approximately $262.7 million, net of underwriting discounts and offering expenses. We used $25.0 million of the net proceeds to repay borrowings under our revolving credit facility, and we intend to use the remainder for general corporate purposes.
We ended first quarter 2013 with $233.5 million of cash and $250.0 million of long-term debt. At March 31, 2013, we had $523.8 million of available liquidity (cash and cash equivalents and unused
50
borrowing capacity under our revolving credit facility). We generated $179.0 million of cash during the three months ended March 31, 2013, as cash provided by net proceeds from our initial public offering was offset by cash used for operations, net payments of $25.0 million on our revolving credit facility, and capital spending, as discussed below.
On September 7, 2012, we entered into a first amendment to our revolving credit facility, which increased the aggregate lending commitments under our revolving credit facility from $250.0 million to $300.0 million. On October 12, 2012, we borrowed $50.0 million under our revolving credit facility to partially fund the redemption of $75.0 million of our senior subordinated notes. In addition, on October 22, 2012, we issued $250.0 million aggregate amount of our senior notes to fund the redemption of our remaining senior subordinated notes and for general corporate purposes. We repaid $25.0 million of borrowings under our revolving credit facility on December 20, 2012. See "—Financing Activities" below for more information.
We ended 2012 with $54.5 million of cash and cash equivalents and $275.0 million of long-term debt. At December 31, 2012, we had $250.2 million of available liquidity (unrestricted cash and cash equivalents and unused borrowing capacity under our revolving credit facility). We used $127.9 million of cash during the year ended December 31, 2012, as cash provided by operations and issuances of long-term debt were more than offset by distributions to BC Holdings, debt payments, capital spending and acquisitions, as discussed below.
At March 31, 2013, our cash was invested in high-quality, short-term investments, which we record in "Cash and cash equivalents." The credit quality of our portfolio of short-term investments remains strong, with the majority of our cash and cash equivalents invested in money market funds that are broadly diversified and invested in high-quality, short-duration securities, including commercial paper, certificates of deposit, U.S. government agency securities and similar instruments. We have significant amounts of cash and cash equivalents that are in excess of federally insured limits. Though we have not experienced any losses on our cash and cash equivalents to date and we do not anticipate incurring any losses, we cannot be assured that we will not experience losses on our short-term investments.
We believe that our cash flows from operations, combined with our current cash levels and available borrowing capacity, will be adequate to fund debt service requirements and provide cash, as required, to support our ongoing operations, capital expenditures, lease obligations, working capital, and pension contributions for at least the next 12 months. In response to the continued economic uncertainty and to conserve our liquidity, we will continue to manage production levels to sales demand.
In recent years, our reported pension benefit obligations have grown significantly, primarily due to the low-interest-rate environment in the U.S. and its impact on the discount rate assumptions used to measure the present value of our pension benefit obligations. Assuming the low-interest-rate environment persists, we expect to have significant pension funding obligations. At December 31, 2012, we used a discount rate assumption of 3.75% to measure the present value of our pension benefit obligations, which resulted in a reported pension benefit obligation of approximately $504.7 million. The fair value of our pension plan assets at December 31, 2012, was approximately $312.2 million, and thus we reported an underfunded status of our defined benefit pension plans of approximately $192.5 million. If our discount rate assumption had declined by an additional 50 basis points to 3.25%, we estimate that our reported pension benefit obligation and underfunded status of our plans would have increased by approximately $37 million at December 31, 2012.
We intend to fund our future pension obligations with cash on hand, cash generated from operations and external financing. See "—Contractual Obligations" for an estimate of future minimum pension funding obligations. Also see "—Critical Accounting Estimates" and Note 11, "Retirement and Benefit Plans," to our audited consolidated financial statements incorporated by reference in this
51
prospectus for a further discussion of the assumptions used to measure the present value of our pension benefit obligations.
Sources and Uses of Cash
We generate cash from sales of our products, short-term and long-term borrowings and equity offerings. Our primary uses of cash are for expenses related to the manufacture and distribution of building products, including inventory purchased for resale, fiber, labor, energy and glues and resins. In addition to paying for ongoing operating costs, we use cash to invest in our business, repay debt and meet our contractual obligations and commercial commitments. Below is a discussion of our sources and uses of cash for operating activities, investing activities and financing activities.
| |
Year Ended December 31 | Three Months Ended March 31 |
||||||||||||||
|---|---|---|---|---|---|---|---|---|---|---|---|---|---|---|---|---|
| |
2010 | 2011 | 2012 | 2012 | 2013 | |||||||||||
| |
(thousands) |
|||||||||||||||
Net cash provided by (used for) operations |
$ | 10,287 | $ | (42,981 | ) | $ | 80,136 | $ | (9,961 | ) | $ | (53,742 | ) | |||
Net cash used for investment |
(35,453 | ) | (36,617 | ) | (29,434 | ) | (8,053 | ) | (4,805 | ) | ||||||
Net cash provided by (used for) financing |
2,666 | (2,548 | ) | (178,650 | ) | — | 237,587 | |||||||||
Operating Activities
Three Months Ended March 31, 2013 Compared With Three Months Ended March 31, 2012
For the three months ended March 31, 2013, our operating activities used $53.7 million of cash, compared with $10.0 million of cash used for operations in the same period in 2012. The $53.7 million of cash used for operations was due primarily to a $72.8 million increase in working capital and pension contributions of $9.7 million, offset partially by $24.4 million of income (before noncash income and expenses). The $10.0 million of cash used for operations during the three months ended March 31, 2012, was driven primarily by increases in working capital of $18.5 million and pension contributions of $3.9 million, offset partially by $13.2 million of income (before noncash income and expenses).
The increases in working capital in both periods were attributable primarily to higher receivables and inventories, offset partially by an increase in accounts payable and accrued liabilities. The increases in receivables in both periods primarily reflect increased sales of approximately 36% and 23%, comparing sales for the months of March 2013 and 2012 with sales for the months of December 2012 and 2011, respectively. The increase in inventories during the three months ended March 31, 2013, represents normal seasonal inventory build, product line expansions, and cost inflation on inventory purchased for resale and key raw materials we consume in the manufacture of wood products. The increase in accounts payable and accrued liabilities provided $57.5 million of cash during the three months ended March 31, 2013, compared with $58.8 million in the same period a year ago.
2012 Compared With 2011
In 2012, our operating activities generated $80.1 million of cash, compared with $43.0 million of cash used for operating activities in 2011. Compared with 2011, the $123.1 million increase in cash provided by operations in 2012 relates primarily to the following:
- •
- A $70.9 million increase in income in our Wood Products segment and a $22.0 million increase in income in our Building Materials Distribution segment. As discussed under "—Operating Results," the improvement in results for 2012 was the result of higher sales volumes and prices for many of the products we manufacture and distribute, as well as leveraging of labor and manufacturing costs.
52
- •
- A $6.7 million increase in working capital during 2012, compared with a $34.8 million increase in working
capital during 2011. Working capital is subject to cyclical operating needs, the timing of the collection of receivables, the payment
of payables and expenses, and to a lesser extent, seasonal fluctuations in our operations. The increases in working capital in both periods were attributable primarily to higher receivables and
inventories, offset partially by an increase in accounts payable and accrued liabilities. The increases in receivables in both periods primarily reflect increased sales of approximately 16% and 11%,
comparing sales for the months of December 2012 and 2011 with sales for the months of December 2011 and 2010, respectively. While inventory turns improved in 2012, compared with 2011, inventories
increased in 2012 due primarily to an increase in finished goods inventory in each of our segments due to product line expansions and an improvement in demand for our products from higher residential
construction activity and market share gains. Accounts payable and accrued liabilities increased in 2012 driven primarily by higher compensation and benefit-related accrued liabilities, as well as
higher accounts payable, driven by higher inventories. We accrued more incentive compensation during the year ended December 31, 2012, compared with 2011, resulting from improved results of
operations in 2012. We expect to pay out the majority of accrued incentive compensation in the first quarter of 2013.
- •
- A decrease in cash contributions to our pension plans. During 2012, we used $8.5 million of cash to make pension contributions, compared with $13.6 million during 2011.
2011 Compared With 2010
In 2011, our operating activities used $43.0 million of cash, compared with $10.3 million of cash provided by operating activities in 2010. Compared with 2010, the $53.3 million increase in cash used for operations in 2011 relates primarily to the following:
- •
- A $9.6 million decrease in income in our Building Materials Distribution segment and a $7.0 million increase
in losses in our Wood Products segment. The decline in results for 2011 was the result of a 20-basis-point decline in gross margins and
higher transportation costs in our Building Materials Distribution segment. During 2010, we recorded $4.6 million of income for cash received from a litigation settlement related to vendor
product pricing, of which $4.1 million was recorded in the Building Materials Distribution segment and $0.5 million in the Wood Products segment. Also, in our Wood Products segment, the
increased loss was driven by a decrease in plywood selling prices and an increase in selling and distribution costs, offset partially by higher prices and sales volumes in our EWP business as well as
higher byproduct sales.
- •
- A $34.8 million increase in working capital during 2011, compared with a $2.6 million increase in working capital during 2010. Working capital is subject to cyclical operating needs, the timing of the collection of receivables, the payment of payables and expenses, and to a lesser extent, seasonal fluctuations in our operations. The increases in working capital in both periods were attributable primarily to higher receivables and inventories, offset partially by an increase in accounts payable and accrued liabilities. The increases in receivables in both periods primarily reflect increased sales of approximately 11% and 14%, comparing sales for the months of December 2011 and 2010 with sales for the months of December 2010 and 2009, respectively. The increase in inventories in 2011 primarily represents an increase in log and plywood inventory in our Wood Products segment. Accounts payable and accrued liabilities increased in 2011, as higher accounts payable, driven by higher inventories, were mostly offset by lower compensation and benefit-related accrued liabilities. We accrued less incentive compensation during the year ended December 31, 2011, compared with 2010, and the majority of the employee incentive compensation that was accrued in 2010 was paid out in first quarter 2011.
53
- •
- An increase in cash contributions to our pension plans. During 2011, we used $13.6 million of cash to make pension contributions, compared with $3.9 million during 2010.
Investment Activities
Net cash used for investing activities was $4.8 million and $8.1 million during the three-month period ended March 31, 2013 and 2012, respectively, and $29.4 million, $36.6 million and $35.5 million during 2012, 2011 and 2010, respectively.
Three Months Ended March 31, 2013 Compared With Three Months Ended March 31, 2012
During the three months ended March 31, 2013 and 2012, we used approximately $5.3 million and $4.7 million, respectively, of cash for purchases of property and equipment, including business improvement and quality/efficiency projects, replacement and expansion projects, and ongoing environmental compliance. We expect capital expenditures in 2013 to total approximately $40 million to $45 million, excluding acquisitions. This level of capital expenditures could increase or decrease as a result of a number of factors, including our financial results, future economic conditions, and timing of equipment purchases. Our capital spending in 2013 will be for business improvement and quality/efficiency projects, replacement projects and ongoing environmental compliance. During the three months ended March 31, 2012, we also used $2.4 million for the acquisition of a sawmill in Arden, Washington, which we believe improves fiber integration and enhances the product mix capabilities in our Inland Region lumber operations.
2012
During the year ended December 31, 2012, we used approximately $27.4 million of cash for purchases of property and equipment, which included expenditures for the rebuild of veneer dryers, as well as costs related to other replacement projects and ongoing environmental compliance. In addition, we spent $2.4 million for the acquisition of a sawmill in Arden, Washington, which we believe will improve fiber integration and enhance the product mix capabilities in our Inland Region lumber operations.
Details of 2012 capital investment by segment are included in the table below:
| |
Year Ended December 31, 2012 | ||||||||||||
|---|---|---|---|---|---|---|---|---|---|---|---|---|---|
| |
Acquisition/ Expansion |
Quality/ Efficiency(a) |
Replacement, Environmental, and Other(b) |
Total | |||||||||
| |
(millions) |
||||||||||||
Wood Products |
$ | 2.4 | $ | 4.4 | $ | 15.9 | $ | 22.7 | |||||
Building Materials Distribution |
1.7 | 0.7 | 4.7 | 7.1 | |||||||||
Corporate and Other |
— | — | — | — | |||||||||
|
$ | 4.1 | $ | 5.1 | $ | 20.6 | $ | 29.7 | |||||
- (a)
- Quality
and efficiency projects include quality improvements, modernization, energy and cost-saving projects.
- (b)
- During 2012, we spent approximately $1.3 million on environmental compliance. We expect to spend approximately $3.5 million in 2013 for this purpose.
2011
During the year ended December 31, 2011, we used approximately $33.5 million of cash for purchases of property and equipment, which included expansions of certain facilities (particularly Dallas, Texas) in our Building Materials Distribution segment. In addition, we spent $5.8 million for the
54
acquisition of a laminated beam and decking manufacturing plant in Homedale, Idaho and received proceeds of $3.1 million from the sale of assets, including the sale of certain land and timber holdings.
Details of 2011 capital investment by segment are included in the table below:
| |
Year Ended December 31, 2011 | ||||||||||||
|---|---|---|---|---|---|---|---|---|---|---|---|---|---|
| |
Acquisition/ Expansion |
Quality/ Efficiency(a) |
Replacement, Environmental, and Other(b) |
Total | |||||||||
| |
(millions) |
||||||||||||
Wood Products |
$ | 5.9 | $ | 6.2 | $ | 17.2 | $ | 29.3 | |||||
Building Materials Distribution |
3.9 | 0.1 | 6.0 | 10.0 | |||||||||
Corporate and Other |
— | — | — | — | |||||||||
|
$ | 9.8 | $ | 6.3 | $ | 23.2 | $ | 39.3 | |||||
- (a)
- Quality
and efficiency projects include quality improvements, modernization, energy and cost-saving projects.
- (b)
- During 2011, we spent approximately $2.4 million on environmental compliance.
2010
During 2010, we used approximately $35.8 million of cash for purchases of property and equipment, which included expenditures for a new veneer dryer as well as costs related to other replacement projects and ongoing environmental compliance. During 2010, we received $1.3 million of net proceeds from the sale of property and equipment.
Details of 2010 capital investment by segment are included in the table below:
| |
Year Ended December 31, 2010 | ||||||||||||
|---|---|---|---|---|---|---|---|---|---|---|---|---|---|
| |
Acquisition/ Expansion |
Quality/ Efficiency(a) |
Replacement, Environmental, and Other(b) |
Total | |||||||||
| |
(millions) |
||||||||||||
Wood Products |
$ | 0.4 | $ | 12.3 | $ | 10.2 | $ | 22.9 | |||||
Building Materials Distribution |
0.9 | — | 12.0 | 12.9 | |||||||||
Corporate and Other |
— | — | — | — | |||||||||
|
$ | 1.3 | $ | 12.3 | $ | 22.2 | $ | 35.8 | |||||
- (a)
- Quality
and efficiency projects include quality improvements, modernization, energy and cost-saving projects.
- (b)
- During 2010, we spent approximately $1.7 million on environmental compliance.
Financing Activities
On February 11, 2013, we issued 13,529,412 shares of common stock in our initial public offering. Following this initial public offering, we received proceeds of approximately $262.7 million, after deducting underwriting discounts and commissions of approximately $19.2 million and offering expenses of approximately $2.2 million.
During the three months ended March 31, 2013, we borrowed $55.0 million under our revolving credit facility to fund working capital needs, which was subsequently repaid during the same period with cash on hand. We used $25.0 million of the net proceeds from our initial public offering to repay the remaining borrowings under our revolving credit facility, resulting in no borrowings outstanding under our revolving credit facility at March 31, 2013.
55
During 2012, we repaid our senior subordinated notes with cash on hand, borrowings under our revolving credit facility and the issuance of our senior notes. On October 12, 2012, we borrowed $50.0 million under the revolving credit facility to partially fund the redemption of $75.0 million of our senior subordinated notes. In addition, on October 22, 2012, we issued $250.0 million aggregate amount of our senior notes to fund the redemption of our remaining senior subordinated notes and for general corporate purposes. We repaid $25.0 million of borrowings under the revolving credit facility on December 20, 2012. We also used $5.8 million of cash for financing costs related primarily to the senior notes. In addition, during 2012, we made $228.3 million of distributions to BC Holdings, our sole equityholder at the time.
During 2011, we used $2.5 million of cash for financing costs related to our revolving credit facility, as discussed below.
During 2010, we received $86.1 million from BC Holdings from its sale of 18.3 million Boise Inc. shares. We repurchased $8.6 million of senior subordinated notes for $8.5 million, plus accrued interest. On April 1, 2010, we borrowed $45.0 million under our revolving credit facility, bringing the total amount outstanding to $120.0 million. On April 30, 2010, we repaid the $120.0 million, and we permanently reduced the lending commitments by a like amount, bringing the total commitments under our revolving credit facility to $170.0 million. This debt reduction, in combination with capital spending, fulfilled our obligations under the indenture governing our senior subordinated notes with respect to net available cash received in connection with the sale of Boise Inc. shares.
Debt Structure
At December 31, 2011 and 2012 and March 31, 2013, our long-term debt was as follows:
| |
December 31 | |
||||||||
|---|---|---|---|---|---|---|---|---|---|---|
| |
March 31 2013 |
|||||||||
| |
2011 | 2012 | ||||||||
| |
(millions) |
|||||||||
Asset-based revolving credit facility |
$ | — | $ | 25.0 | $ | — | ||||
6.375% senior notes |
— | 250.0 | 250.0 | |||||||
7.125% senior subordinated notes |
219.6 | — | — | |||||||
Total long-term debt |
$ | 219.6 | $ | 275.0 | $ | 250.0 | ||||
Asset-Based Revolving Credit Facility
On July 13, 2011, Boise Cascade and its principal operating subsidiaries, Boise Cascade Wood Products, L.L.C. and Boise Cascade Building Materials Distribution, L.L.C., as borrowers, and Boise Cascade Wood Products Holdings Corp., as guarantor, entered into the $250 million revolving credit facility with Wells Fargo Capital Finance, L.L.C., as agent, and the banks named therein as lenders. Borrowings under the revolving credit facility are constrained by a borrowing base formula dependent upon levels of eligible receivables and inventory reduced by outstanding borrowings and letters of credit ("Availability"). On September 7, 2012, we entered into a first amendment to the credit agreement governing the revolving credit facility, which increased the aggregate lending commitments under the revolving credit facility to $300 million. Other key terms of the credit agreement were unchanged by the amendment. On December 20, 2012, we entered into a Limited Consent and Amendment to Loan Documents with the lenders under our revolving credit facility. The consent and amendment provided consent to, among other things, the distributions of $225.0 million in aggregate to BC Holdings made in late December 2012 and our conversion to a corporation effected on February 4, 2013. On May 15, 2013, we entered into a third amendment to the credit agreement governing the credit facility, which reduced unused commitment fees as described below. See "Description of Certain Indebtedness."
56
The revolving credit facility generally permits dividends only if certain conditions are met, including complying with the minimum Availability requirements and having a fixed charge coverage ratio of 1:1 on a pro forma basis.
Interest rates under the revolving credit facility are based, at the company's election, on either London Interbank Offered Rate ("LIBOR") or a base rate, as defined in the agreement, plus a spread over the index elected that ranges from 1.75% to 2.25% for loans based on LIBOR and from 0.75% to 1.25% for loans based on the base rate. The spread is determined on the basis of a pricing grid that results in a higher spread as average quarterly Availability declines. Letters of credit are subject to a 0.15% fronting fee payable to the issuing bank and a fee payable to the lenders equal to the LIBOR margin rate. In addition, effective with the third amendment, the company is required to pay an unused commitment fee at a rate of 0.375% per annum of the average unused portion of the lending commitments. If we have utilized more than 40% of the commitments, the unused commitment fee percentage reduces to 0.25%.
At March 31, 2013, and December 31, 2012, we had no borrowings and $25.0 million outstanding, respectively, under the revolving credit facility and $9.8 million and $10.0 million, respectively, of letters of credit outstanding. These letters of credit and borrowings reduced our borrowing capacity under the revolving credit facility by an equivalent amount. The maximum borrowings under the revolving credit facility were $75.0 million during the three months ended March 31, 2013.
Senior Subordinated Notes
In October 2004, Boise Cascade issued $400 million of 7.125% senior subordinated notes due in 2014. Through 2011, we repurchased a portion of the senior subordinated notes, resulting in $219.6 million of notes outstanding at December 31, 2011. On October 15, 2012, we redeemed $75.0 million of the senior subordinated notes at par value with $25.0 million of cash on hand and $50.0 million borrowed under the revolving credit facility. Net proceeds from the offering of the senior notes (as discussed below in "—Debt Refinancing") were used to redeem the remaining $144.6 million of the senior subordinated notes, plus $1.0 million of interest through the related redemption date of November 21, 2012.
Debt Refinancing
On October 22, 2012, Boise Cascade, L.L.C. (as the predecessor to Boise Cascade Company) and its former wholly owned subsidiary, Boise Cascade Finance Corporation, issued $250 million of senior notes through a private placement exempt from the registration requirements of the Securities Act. In accordance with the terms of the indenture governing the senior notes, on March 28, 2013, Boise Cascade Finance Corporation was merged with and into Boise Cascade, with Boise Cascade as the surviving entity. After such merger, Boise Cascade survives as the sole issuer of the senior notes. Interest on the senior notes is payable semiannually in arrears on May 1 and November 1, commencing on May 1, 2013. The senior notes are guaranteed by each of our existing and future direct or indirect domestic subsidiaries that is a guarantor or co-borrower under the revolving credit facility. See "Description of Certain Indebtedness."
The indenture governing our senior notes restricts the issuance of dividends other than a $100 million basket and except to the extent we have a consolidated leverage ratio no greater than 3.5:1.0. In addition, subject to compliance with a 2.0:1.0 consolidated coverage ratio, we will be entitled to make dividends in an amount generally equal to 50% of our net income from the date of the indenture governing our senior notes plus any contribution to equity or proceeds from sales of equity; provided that such amount will be reduced to the extent of certain other restricted payments, including pursuant to the 3.5:1.0 leverage ratio.
57
As a result of this refinancing, we extended the maturity of a portion of our long-term debt and lowered the related interest rate. Following the sale of the senior notes, we used a portion of the net proceeds of the sale to repay the senior subordinated notes at par plus interest through the redemption date. The remaining proceeds are available for general corporate purposes.
Cash Paid for Interest
For the years ended December 31, 2010, 2011 and 2012, and the three months ended March 31, 2012 and 2013, cash payments for interest were $18.6 million, $16.7 million, $18.1 million, $0.3 million and $0.5 million, respectively.
Contractual Obligations
In the table below, we set forth our enforceable and legally binding obligations as of December 31, 2012. Some of the amounts included in the table are based on management's estimates and assumptions about these obligations, including their duration, the possibility of renewal, anticipated actions by third parties and other factors. Because these estimates and assumptions are necessarily subjective, our actual payments may vary from those reflected in the table. Purchase orders made in the ordinary course of business are excluded from the table below. Any amounts for which we are liable under purchase orders are reflected on the Consolidated Balance Sheets as accounts payable and accrued liabilities.
| |
Payments Due by Period | |||||||||||||||
|---|---|---|---|---|---|---|---|---|---|---|---|---|---|---|---|---|
| |
2013 | 2014 - 2015 | 2016 - 2017 | Thereafter | Total | |||||||||||
| |
(millions) |
|||||||||||||||
Long-term debt(a) |
$ | — | $ | — | $ | 25.0 | $ | 250.0 | $ | 275.0 | ||||||
Interest(b) |
16.8 | 32.9 | 32.2 | 47.8 | 129.7 | |||||||||||
Operating leases(c) |
12.3 | 22.5 | 17.6 | 36.7 | 89.2 | |||||||||||
Purchase obligations |
||||||||||||||||
Raw materials and finished goods inventory(d) |
100.1 | 116.0 | 5.6 | 5.4 | 227.1 | |||||||||||
Utilities(e) |
8.6 | — | — | — | 8.6 | |||||||||||
Other |
1.5 | 0.4 | — | — | 1.9 | |||||||||||
Other long-term liabilities reflected on our Balance Sheet |
||||||||||||||||
Compensation and benefits, including pension funding obligations(f) |
17.0 | 49.0 | 42.1 | 105.2 | 213.3 | |||||||||||
Other(g)(h) |
2.7 | 3.0 | 1.8 | 5.7 | 13.2 | |||||||||||
|
$ | 159.0 | $ | 223.8 | $ | 124.3 | $ | 450.8 | $ | 958.0 | ||||||
- (a)
- These
borrowings are further explained in "—Liquidity and Capital Resources—Financing Activities." The table assumes our long-term
debt is held to maturity.
- (b)
- Amounts
represent estimated interest payments on the notes and outstanding borrowings under the revolving credit facility as of December 31, 2012,
assuming these instruments are held to maturity. Unused commitment fees and letter of credit fees payable under the revolving credit facility are excluded from the table above.
- (c)
- We enter into operating leases in the normal course of business. We lease a portion of our distribution centers as well as other property and equipment under operating leases. Some lease agreements provide us with the option to renew the lease or purchase the leased property. Our operating lease obligations would change if we exercised these renewal options and/or if we entered into additional operating lease agreements. For more information, see Note 6, "Leases," to our audited consolidated financial statements incorporated by reference in this prospectus.
58
- (d)
- Amounts
represent contracts to purchase approximately $227 million of wood fiber, approximately $50 million of which is purchased pursuant to
fixed-price contracts and approximately $177 million of which is purchased pursuant to variable-price contracts. The $177 million is estimated using first quarter 2013 pricing, but the
actual prices will depend on future market prices. Under most of these log and fiber supply agreements, we have the right to cancel or reduce our commitments in the event of a mill curtailment or
shutdown. Future purchase prices under most of these agreements will be set quarterly or semiannually based on regional market prices. Our log and fiber obligations are subject to change based on,
among other things, the effect of governmental laws and regulations, our manufacturing operations not operating in the normal course of business, log and fiber availability and the status of
environmental appeals. Except for deposits required pursuant to wood supply contracts, these obligations are not recorded in our consolidated financial statements until contract payment terms take
effect.
- (e)
- We
enter into utility contracts for the purchase of electricity and natural gas. We also purchase these services under utility tariffs. These payment
obligations were valued either at market prices as of December 31, 2012, or at a fixed price, in each case in accordance with the terms of the related utility contract or tariff. Because we
consume the energy in the manufacture of our products, these obligations represent the face value of the contracts, not resale value.
- (f)
- Amounts
consist primarily of our pension obligation and, to a lesser extent, the current portion of employee-related compensation liabilities of
$5.3 million. Actuarially determined liabilities related to pension benefits are recorded based on estimates and assumptions. Key factors used in developing estimates of these liabilities
include assumptions related to discount rates, expected rate of compensation increases, retirement and mortality rates and other factors. Changes in estimates and assumptions related to the
measurement of funded status could have a material impact on the amount reported. In the table above, we allocated our pension obligations by year based on the future required minimum pension
contributions, as determined by our actuaries.
- (g)
- Includes
current liabilities of $2.7 million.
- (h)
- We have excluded $3.0 million and $1.0 million of deferred lease costs and deferred gains, respectively, from the other long-term liabilities in the above table. These amounts have been excluded because deferred lease costs relate to operating leases which are already reflected in the operating lease category above and deferred gains do not represent a contractual obligation that will be settled in cash.
In addition to the contractual obligations quantified in the table above, we have other obligations for goods and services and raw materials entered into in the normal course of business.
Off-Balance-Sheet Activities
At March 31, 2013 and December 31, 2012, we had no material off-balance-sheet arrangements with unconsolidated entities.
Guarantees
Note 9, "Debt," Note 15, "Commitments, Legal Proceedings and Contingencies, and Guarantees" and Note 18, "Consolidating Guarantor and Nonguarantor Financial Information," to our audited consolidated financial statements incorporated by reference in this prospectus describe the nature of our guarantees, including the approximate terms of the guarantees, how the guarantees arose, the events or circumstances that would require us to perform under the guarantees and the maximum
59
potential undiscounted amounts of future payments we could be required to make. As of March 31, 2013, there have not been any material changes to such guarantees.
Seasonal and Inflationary Influences
We are exposed to fluctuations in quarterly sales volumes and expenses due to seasonal factors. These seasonal factors are common in the building products industry. Seasonal changes in levels of building activity affect our building products businesses, which are dependent on housing starts, repair and remodeling activities and light commercial construction activities. We typically report lower sales in the first and fourth quarters due to the impact of poor weather on the construction market, and we generally have higher sales in the second and third quarters, reflecting an increase in construction due to more favorable weather conditions. We typically have higher working capital in the second and third quarters due to the summer building season. Seasonally cold weather increases costs, especially energy consumption, at most of our manufacturing facilities.
Our major costs of production are wood fiber, labor, glue and resins and energy. Wood fiber costs, glue and resin costs and diesel fuel prices have been volatile in recent years.
Employees
As of June 30, 2013, we had approximately 4,760 employees. Approximately 30% of these employees work pursuant to collective bargaining agreements. As of June 30, 2013, we had nine collective bargaining agreements. Two agreements, covering 358 employees at our facility in Florien, Louisiana, and 278 employees at our facility in Oakdale, Louisiana, were scheduled to expire on July 15, 2013 but, pending further negotiations, have been indefinitely extended by the parties, subject to each party's right to terminate by providing a 10-day prior written notice. These two agreements are being negotiated together. If these agreements are terminated before definite negotiations conclude, we could experience a material labor disruption or significantly increased labor costs, which could prevent us from meeting customer demand or reduce our sales and profitability.
Disclosures of Financial Market Risks
In the normal course of business, we are exposed to financial risks such as changes in interest rates, foreign currency exchange rates and commodity price risk. In 2010, 2011 and 2012, and the three months ended March 31, 2013, we did not use derivative instruments.
Interest Rate Risk
When we have loan amounts outstanding on the revolving credit facility, we are exposed to interest rate risk arising from fluctuations in interest rates. In 2010, 2011 and 2012, and the three months ended March 31, 2013, we did not use any interest rate swap contracts to manage this risk.
Foreign Currency Risk
We have sales in countries outside the United States. As a result, we are exposed to movements in foreign currency exchange rates, primarily in Canada, but we do not believe our exposure to currency fluctuations is significant. In 2010, 2011 and 2012, and the three months ended March 31, 2013, we did not use any foreign currency hedges to manage this risk.
Commodity Price Risk
Many of the products we manufacture or purchase and resell and some of our key production inputs are commodities whose price is determined by the market's supply and demand for such products. Price fluctuations in our selling prices and key costs have a significant effect on our financial
60
performance. The markets for most of these commodities are cyclical and are affected by factors such as global economic conditions, including the strength of the U.S. housing market, changes in or disruptions to industry production capacity, changes in inventory levels and other factors beyond our control. In 2010, 2011 and 2012, and the three months ended March 31, 2013, we did not manage commodity price risk with derivative instruments.
Financial Instruments
The table below provides information as of December 31, 2012, about our financial instruments that are sensitive to changes in interest rates. The table presents principal cash flows and related weighted average interest rates by expected maturity dates. For obligations with variable interest rate sensitivity, the table sets forth payout amounts based on December 31, 2012 rates and does not attempt to project future rates. Other instruments subject to market risk, such as obligations for pension plans and other postretirement benefits, are not reflected in the table.
| |
|
|
|
|
December 31, 2012 | ||||||||||||||
|---|---|---|---|---|---|---|---|---|---|---|---|---|---|---|---|---|---|---|---|
| |
2013 - 2015 | 2016 | 2017 | Thereafter | Total | Fair Value(b) |
|||||||||||||
| |
(millions) |
||||||||||||||||||
Long-term debt |
|||||||||||||||||||
Fixed-rate debt payments(a) |
|||||||||||||||||||
Senior notes |
$ | — | $ | — | $ | — | $ | 250.0 | $ | 250.0 | $ | 251.6 | |||||||
Average interest rates |
— | — | — | 6.4 | % | 6.4 | % | — | |||||||||||
Variable-rate debt payments(a) |
$ | — | $ | 25.0 | $ | — | $ | — | $ | 25.0 | $ | 25.0 | |||||||
Average interest rates |
— | 2.0 | % | — | — | 2.0 | % | — | |||||||||||
- (a)
- These
obligations are further explained in "—Liquidity and Capital Resources—Financing Activities." The table assumes our long-term
debt is held to maturity.
- (b)
- We estimated the fair value based on quoted market prices as of December 31, 2012, for our debt.
Critical Accounting Estimates
The preparation of financial statements in accordance with GAAP requires management to make estimates and assumptions about future events. These estimates and the underlying assumptions affect the amounts of assets and liabilities reported, disclosures about contingent assets and liabilities and reported amounts of revenues and expenses. Actual results could differ from these estimates. We believe that the accounting estimates discussed below represent the accounting estimates requiring the exercise of judgment where a different set of judgments could result in the greatest changes to reported results. We reviewed the development, selection and disclosure of our critical accounting estimates with the Audit Committee of our board of directors. Our current critical accounting estimates are as follows:
Pensions
We calculate pension expense and liabilities using actuarial assumptions, including discount rates, expected return on plan assets, expected rate of compensation increases, retirement and mortality rates, expected contributions and other factors. We based the assumptions used to calculate pension expense on the following factors:
Discount Rate Assumption. The discount rate reflects the current rate at which the pension obligations could be settled based on the measurement dates of the plans—December 31. In all years presented, the discount rates were determined by matching the expected plan benefit payments against a spot rate yield curve constructed to replicate the yields of Aa-rated corporate bonds.
61
Asset Return Assumption. We base our expected long-term rate of return on plan assets on a weighted average of our expected returns for the major asset classes (equities, fixed-income securities, a hedge fund and real estate) in which we invest. The weights we assign each asset class are based on our investment strategy. Expected returns for the asset classes are based on long-term historical returns, inflation expectations, forecasted gross domestic product, earnings growth and other economic factors. We developed our return assumption based on a review of the fund manager's estimates of future market expectations by broad asset class, actuarial projections and expected long-term rates of return from external investment managers. In 2012, the investment return on our pension asset portfolio was approximately 13%, as the U.S. equity and fixed-income portions of the portfolio experienced strong performance as a result of equity and debt market conditions. The investment return was above our expected return on plan assets of 6.75% for 2012. In 2011, weak U.S. equity and negative international equity market performance drove poor overall investment portfolio performance of approximately 1%, below our expected return on plan assets of 7.0% for 2011. The weighted average expected return on plan assets we will use in our calculation of 2013 net periodic benefit cost is 6.50%.
Rate of Compensation Increases. Generally, this assumption reflects our long-term actual experience, the near-term outlook and assumed inflation. However, in connection with amending the salaried and nonqualified plans on March 18, 2009, to freeze pension benefits effective December 31, 2009 (see Note 11, "Retirement and Benefit Plans," to our audited consolidated financial statements incorporated by reference in this prospectus), we changed the assumption for the rate of compensation increase to zero. In addition to the salaried benefits being frozen, there are currently no scheduled increases in pension benefit rates applicable to past service in the active plan covering our hourly employees.
Retirement and Mortality Rates. These rates are developed to reflect actual and projected plan experience.
Expected Contributions. Plan obligations and expenses are based on existing retirement plan provisions. No assumption is made for future changes to benefit provisions beyond those to which we are presently committed. For example, we may commit to changes in future labor contracts. In 2012, we made $8.5 million in cash contributions to our pension plans. We expect to contribute approximately $11 million to our pension plans in 2013, of which $9.3 million was contributed in February 2013. For information related to pension contributions, see "Cash Flows" in Note 11, "Retirement and Benefit Plans," to our audited consolidated financial statements incorporated by reference in this prospectus.
We recognize the funded status of our pension plans on our Consolidated Balance Sheet and recognize the actuarial and experience gains and losses and the prior service costs and credits, net of tax, in our Consolidated Statements of Comprehensive Income (Loss). Actual results that differ from assumptions are accumulated and amortized over future periods and, therefore, generally affect recognized expense in future periods. While we believe that the assumptions used to measure our pension obligations are reasonable, differences in actual experience or changes in assumptions may materially affect our pension obligations and future expense.
We believe that the accounting estimate related to pensions is a critical accounting estimate because it is highly susceptible to change from period to period. The future effects of pension plans on our financial position and results of operations will depend on economic conditions, employee demographics, mortality rates, retirement rates, investment performance, the pension regulatory environment, benefit plan design and funding decisions, among other factors. The following table
62
presents selected assumptions used and expected to be used in the measurement of pension expense in the following periods:
| |
Year Ended December 31 |
|
||||||||
|---|---|---|---|---|---|---|---|---|---|---|
| |
Year Ending December 31, 2013 |
|||||||||
| |
2011 | 2012 | ||||||||
| |
(millions, except for percentages) |
|||||||||
Pension expense |
$ | 11.4 | $ | 12.7 | $ | 10.9 | ||||
Discount rate |
5.35 | % | 4.20 | % | 3.75 | % | ||||
Expected rate of return on plan assets |
7.00 | % | 6.75 | % | 6.50 | % | ||||
Rate of compensation increases(a) |
— | — | — | |||||||
- (a)
- The compensation increase is zero due to the fact that the salaried and nonqualified benefits were frozen December 31, 2009. In addition to the salaried benefits being frozen, there are currently no scheduled increases in pension benefit rates applicable to past service in the active plan covering our hourly employees.
A change of 0.25% in either direction to the discount rate or the expected rate of return on plan assets would result in the following effect on 2012 and 2013 pension expense. These sensitivities are specific to 2012 and 2013. The sensitivities may not be additive, so the impact of changing multiple factors simultaneously cannot be calculated by combining the individual sensitivities shown.
| |
|
Increase (Decrease) in Pension Expense |
||||||||
|---|---|---|---|---|---|---|---|---|---|---|
| |
Base Expense |
0.25% Increase |
0.25% Decrease |
|||||||
| |
(millions) |
|||||||||
2012 Expense |
||||||||||
Discount rate |
$ | 12.7 | $ | (1.4 | ) | $ | 1.4 | |||
Expected rate of return on plan assets |
12.7 | (0.7 | ) | 0.7 | ||||||
2013 Expense |
||||||||||
Discount rate |
$ | 10.9 | $ | (1.3 | ) | $ | 1.3 | |||
Expected rate of return on plan assets |
10.9 | (0.7 | ) | 0.7 | ||||||
Income Taxes
On February 4, 2013, we converted from a limited liability company to a corporation. In addition, we elected to be treated as a corporation for federal and state income tax purposes effective as of January 1, 2013. Therefore, we are subject to federal and state income tax expense beginning January 1, 2013. As a result of our conversion to a corporation, we recorded deferred tax assets, net of deferred tax liabilities, of $68.7 million on our consolidated balance sheet, the effect of which was recorded as an income tax benefit in the Consolidated Statement of Operations during the three months ended March 31, 2013.
Deferred tax assets and liabilities are recognized for the future tax consequences attributable to differences between the financial statement carrying amounts of existing assets and liabilities and respective tax bases, as measured by enacted tax rates that are expected to be in effect in the periods where deferred tax assets and liabilities are expected to be realized or settled.
Deferred tax assets related to investments in foreign subsidiaries and capital loss carryforwards were $15.8 million and $6.1 million, respectively, at March 31, 2013. Both of these items are fully offset by valuation allowances as we believe it is more likely than not that we will not be able to meet applicable tax thresholds that govern realization of these deferred tax asset items.
63
Assessing the realizability of deferred tax assets requires significant judgment. We consider all available evidence to determine whether it is more likely than not that some portion or all of the deferred tax assets will be realized. The ultimate realization of deferred tax assets is dependent upon the generation of future taxable income during the periods in which those temporary differences become realizable. In the event that we determine that a deferred tax asset will not be realized, a valuation allowance is recorded against the deferred tax asset with a corresponding charge to tax expense in the period we make such determination. Based upon our projections of future reversals of existing temporary differences, the historical level of taxable income, and projections for future taxable income over the periods in which the deferred tax assets are deductible, we believe it is more likely than not that we will realize the benefits of substantially all of these deductible differences, except as discussed above. Though we believe that no additional valuation allowance of deferred tax assets is necessary as of March 31, 2013, if we were to not generate sufficient future taxable income, it is possible that we could record a valuation allowance in a future period.
Long-Lived Asset Impairment
We review long-lived assets for impairment when events or changes in circumstances indicate that the carrying amount of assets may not be recoverable. An impairment of a long-lived asset exists when the carrying value is not recoverable through future undiscounted cash flows from operations and when the carrying value of an asset or asset group exceeds its fair value.
Long-lived asset impairment is a critical accounting estimate, as it is susceptible to change from period to period. We estimate the fair value of an asset or asset group based on quoted market prices for similar assets (the amount for which the asset(s) could be bought or sold in a current transaction with a third party) when available (Level 2 measurement). When quoted market prices are not available, we use a discounted cash flow model to estimate fair value (Level 3 measurement). To measure future cash flows, we are required to make assumptions about future production volumes, future product pricing and future expenses to be incurred. Estimates of future cash flows may change based on overall economic conditions, the availability of wood fiber, environmental requirements, capital spending and other strategic management decisions.
Should the markets for our products deteriorate further or should we decide to invest capital differently or should other cash flow assumptions change, it is possible that we will be required to record noncash impairment charges in the future that could have a material impact on our results of operations. Due to the numerous variables associated with our judgments and assumptions relating to the valuation of assets and the effects of changes on these valuations, both the precision and reliability of our estimates are subject to uncertainty. As additional information becomes known, we may change our estimates.
Allowance for Doubtful Accounts
We make ongoing estimates relating to the collectability of our accounts receivable and maintain a reserve for estimated losses resulting from the inability of our customers to meet their financial obligations to us. At December 31, 2011 and 2012, we had $2.1 million and $2.7 million recorded as allowances for doubtful accounts. Estimating our allowance for doubtful accounts is a critical accounting estimate, as it involves complex judgments about our customers' ability to pay. In determining the amount of the reserve, we consider our historical level of credit losses, customer concentrations, current economic trends and changes in customer creditworthiness. Our sales are principally to customers in the building products industry located in the United States and Canada. A significant portion of our sales are concentrated with a relatively small number of customers. In 2012, our top ten customers represented approximately 29% of sales. In order to manage credit risk, we consider customer concentrations and current economic trends and monitor the creditworthiness of significant customers based on ongoing credit evaluations. At both December 31, 2011 and 2012,
64
receivables from a single customer accounted for approximately 14% of total receivables. No other customer accounted for 10% or more of total receivables.
The low level of new residential construction in the U.S. and disruptions in the capital markets have affected the ability of our customers and our customers' customers to fund their operations, which makes it difficult for us to estimate future credit losses. Although we have not experienced material credit losses in recent years, our actual future losses from uncollectible accounts may differ materially from our current estimates. As additional information becomes known, we may change our estimates. In the event we determine that a change in the reserve is appropriate, we will record a charge to "Selling and distribution expenses" in our Consolidated Statements of Operations in the period we make such a determination.
Goodwill and Intangible Asset Impairment
Goodwill represents the excess of the cost of an acquired business over the fair value of the identifiable tangible and intangible assets acquired and liabilities assumed in a business combination. At December 31, 2012, we had $12.2 million of goodwill recorded on our Consolidated Balance Sheet, of which $6.6 million was recorded in our Wood Products segment and $5.6 million was recorded in our Building Materials Distribution segment. At December 31, 2012, the net carrying amount of intangible assets with indefinite lives, which represent our trade names and trademarks, was $8.9 million.
We maintain two reporting units for purposes of our goodwill impairment testing, Wood Products and Building Materials Distribution, which are the same as our operating segments discussed in Note 14, "Segment Information," to our audited consolidated financial statements incorporated by reference in this prospectus. We test goodwill in each of our reporting units and indefinite-lived intangible assets for impairment annually in the fourth quarter or sooner if events or changes in circumstances indicate that the carrying value of the asset may exceed fair value. We completed our annual assessment of goodwill in fourth quarter 2012 using a qualitative approach. The qualitative goodwill impairment assessment requires evaluating factors, based on the weight of evidence, to determine whether a reporting unit's carrying value would more likely than not exceed its fair value. As part of our goodwill qualitative testing process for each reporting unit, we evaluate various factors that are specific to the reporting unit as well as industry and macroeconomic factors in order to determine whether it is reasonably likely to have a material impact on the fair value of our reporting units. Examples of the factors that were considered include the results of the most recent quantitative impairment tests, current and long-term forecasted financial results, changes in the discount rate between current and prior years and operating strategy for each reporting unit. See below for further discussion of our forecasts and discount rates. Based on the qualitative analysis performed in 2012, we concluded that there were no changes that were reasonably likely to cause the fair value of the reporting units to be less than the reporting units' carrying value and determined that there was no impairment of our goodwill. Although we believe the qualitative factors considered in the impairment analysis are reasonable, significant changes in any one of our assumptions could produce a significantly different result and result in impairment charges that could be material to our consolidated financial statements.
In the event we were to determine that a reporting unit's carrying value would more likely than not exceed its fair value, quantitative testing would be performed comparing carrying values to estimated fair values. Quantitative testing involves a two-step process. The first step, used to identify potential impairment, is a comparison of each reporting unit's estimated fair value to its carrying value, including goodwill. If the fair value of a reporting unit exceeds its carrying value, goodwill is not considered impaired. If the carrying value exceeds fair value, we perform a second step to compare the implied fair value of the reporting unit's goodwill to its book value. The implied fair value of the goodwill is determined based on the estimated fair value of the reporting unit less the fair value of the reporting unit's identifiable assets and liabilities. If the goodwill assigned to a reporting unit exceeds the
65
implied fair value of the goodwill, an impairment charge is recorded for the excess. In conducting a quantitative goodwill impairment analysis, we utilize the discounted cash flow approach that estimates the projected future cash flows to be generated by our reporting units, discounted to present value using a discount rate reflecting weighted average cost of capital for a potential market participant (Level 3 measurement).
For our intangible asset impairment testing, we use a discounted cash flow approach, based on a relief from royalty method (Level 3 measurement). This method assumes that through ownership of trademarks and trade names, we avoid royalty expense associated with licensing, resulting in cost savings. An estimated royalty rate, determined as a percentage of net sales, is used to estimate the value of the intangible assets. Based on the impairment tests of our intangible assets with indefinite lives, we determined that the fair value of our intangible assets exceeds their carrying value and, therefore, there was no impairment. Differences in assumptions used in projecting future cash flows and cost of funds could have a significant impact on the determination of fair value.
The following assumptions are key to our estimates of fair value:
Business projections. Projections are based on five-year forecasts that are developed internally by management for use in managing the business and reviewed by the board of directors. These projections include significant assumptions such as estimates of future revenues, profits, working capital requirements, operating plans and capital expenditures. Our forecasts are driven by consensus estimates of key economic indicators that affect our operating results, most notably new residential and light commercial construction and repair and remodeling activity. These economic indicators are then used to estimate future production volumes, selling prices and key input costs for our manufactured products. Our forecasts also take into consideration recent sales data for existing products, planned timing of capital projects and anticipated conversion and distribution expenses. Our pricing assumptions are estimated based upon an assessment of industry supply and demand dynamics for our major products.
Growth rates. A growth rate is used to calculate the terminal value in the discounted cash flow model. The growth rate is the expected rate at which earnings or revenue is projected to grow beyond the five-year forecast period.
Discount rates. Future cash flows are discounted at a rate that is consistent with a weighted average cost of capital for a potential market participant. The weighted average cost of capital is an estimate of the overall after-tax rate of return required by equity and debt holders of a business enterprise. The discount rates selected are based on existing conditions within our industry and reflect adjustments for potential risk premiums in those markets as well as weighting of the market cost of equity versus debt.
New and Recently Adopted Accounting Standards
For information related to new and recently adopted accounting standards, see Note 2 "Summary of Significant Accounting Policies" to our audited consolidated financial statements incorporated by reference in this prospectus.
66
Our Company
We are a large, vertically-integrated wood products manufacturer and building materials distributor with widespread operations throughout the United States and Canada. We believe we are one of the largest stocking wholesale distributors of building products in the United States. We are the second largest manufacturer of EWP and plywood in North America, according to RISI's Capacity Report. Our broad line of products is used primarily in new residential construction, residential repair and remodeling projects, light commercial construction and industrial applications. We have a broad base of more than 4,500 customers, which includes a diverse mix of retail lumberyards, home improvement centers, leading wholesalers and industrial converters. We believe our large, vertically-integrated operations provide us with significant advantages over less integrated competitors and position us to optimally serve our customers. For the LTM period, we generated sales of $2,937.0 million, net income of $120.7 million, adjusted net income of $52.0 million and EBITDA of $115.1 million.
We supply our customers through 49 strategically located facilities (consisting of 18 manufacturing facilities and 31 distribution facilities). The following map indicates our headquarters, EWP and other manufacturing facilities and building materials distribution facilities:
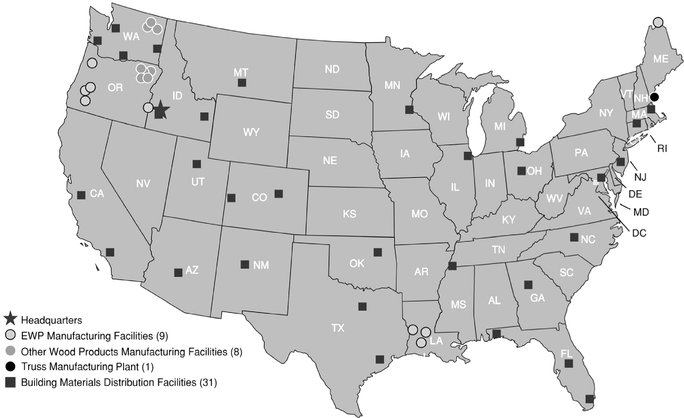
In addition to the vertical integration between our manufacturing and distribution operations, our EWP manufacturing facilities are closely integrated with our nearby plywood operations, which allows us to optimize both production processes. Throughout the housing downturn, we have continued to make strategic capital investments to increase our manufacturing capacity and expand our building materials distribution network. We believe that our scale, closely integrated businesses and significant capital investments throughout the downturn provide us with substantial operating leverage to benefit from a recovery in the U.S. housing market.
67
We operate our company through two primary segments: our Wood Products segment and our Building Materials Distribution segment. The charts below summarize the breakdown of our business for the LTM period.
| LTM SALES BY SEGMENT(1)(2) | LTM EBITDA BY SEGMENT(1)(3) | |
|
|
|
|
Total Sales: $2,937.0 million |
Total EBITDA: $115.1 million |
- (1)
- Financial
data for the LTM period presented in this prospectus is derived by adding financial data for the year ended December 31, 2012 to financial
data for the three months ended March 31, 2013 and subtracting financial data for the three months ended March 31, 2012.
- (2)
- Segment
percentages are calculated before intersegment eliminations.
- (3)
- Segment percentages exclude Corporate and Other segment expenses.
Wood Products ($90.6 million, or 68%, of LTM EBITDA). Our Wood Products segment is the second largest manufacturer of EWP and of plywood in North America, according to RISI's Capacity Report, with a highly integrated national network of 17 manufacturing facilities. Our wood products are used primarily in new residential construction, residential repair and remodeling projects and light commercial construction. We are focused on profitably gaining EWP market share and maintaining a strong market presence in plywood and pine lumber by providing superior customer service and distribution support. We manufacture LVL, I-joists and laminated beams, which are high-grade, value-added structural products used in applications where additional strength and consistent quality are required. We also produce plywood, studs, particleboard and ponderosa pine lumber, a premium lumber grade sold primarily to manufacturers of specialty wood windows, moldings and doors. Our EWP manufacturing facilities are closely integrated with our nearby plywood operations to optimize our veneer utilization by enabling us to dedicate higher quality veneers to higher margin applications and lower quality veneers to plywood products, giving us an advantage over our less integrated competitors. For the LTM period, EWP, plywood and lumber accounted for 35%, 45% and 9%, respectively, of our Wood Products sales. Most of our wood products are sold to leading wholesalers (including our Building Materials Distribution segment), home improvement centers, retail lumberyards and industrial converters. For the LTM period, approximately 38% of our Wood Products sales, including approximately 74% of our EWP sales, were to our Building Materials Distribution segment. For the LTM period, our Wood Products segment generated sales, income before interest and taxes and EBITDA of $1,001.3 million, $65.8 million and $90.6 million, respectively.
Building Materials Distribution ($41.7 million, or 32%, of LTM EBITDA). We believe we are one of the largest national stocking wholesale distributors of building materials in the United States. Our nationwide network of 31 strategically-located distribution facilities sells a broad line of building materials, including EWP, OSB, plywood, lumber and general line items such as framing accessories, composite decking, roofing, siding and insulation. We also operate a truss manufacturing plant located in Maine. Our products are used in the construction of new residential housing, including single-family,
68
multi-family and manufactured homes, repair and remodeling projects and the construction of light industrial and commercial buildings. Except for EWP, we purchase most of these building materials from more than 1,000 third-party suppliers ranging from large manufacturers, such as James Hardie Building Products, Trex Company, Louisiana-Pacific and Georgia-Pacific, to smaller regional producers.
We market our products primarily to retail lumberyards and home improvement centers that then sell the products to end customers, who are typically professional builders, independent contractors and homeowners engaged in residential construction projects. We also market our products to industrial converters, which use our products to assemble windows, doors, agricultural bins and other value-added products used in industrial and repair and remodel applications. Unlike many of our competitors who are specialized, local or regional distributors that focus primarily on a narrow range of products, we are a one-stop resource for our customers' building materials needs, which allows for more cost-efficient ordering, delivery and receiving. Furthermore, we believe that our national presence and long-standing relationships with many of our key suppliers allow us to obtain favorable price and term arrangements and offer excellent customer service on top brands in the building materials industry. We have expertise in special-order sourcing and merchandising support, which is a key service for our home improvement center customers that choose not to stock certain items in inventory. Our highly efficient logistics system allows us to deliver superior customer service and assist our customers in optimizing their working capital, which we believe has led to increased market share during the housing downturn. For the LTM period, our Building Materials Distribution segment generated sales, income before interest and taxes and EBITDA of $2,319.9 million, $32.8 million and $41.7 million, respectively.
The following diagram illustrates our value chain:
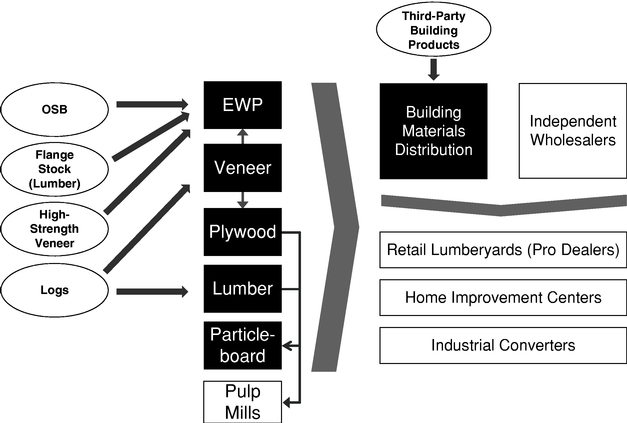
69
Our Industry
The building products manufacturing and distribution industry in North America is highly competitive, with a number of producers manufacturing and selling a broad range of products. Demand for our products is principally influenced by new residential construction, light commercial construction and repair and remodeling activity in the United States. Drivers of new residential construction, light commercial construction and repair and remodeling activity include new household formation, the age of the housing stock, availability of credit and other macroeconomic factors, such as GDP growth, population growth, migration, interest rates, employment and consumer sentiment. Purchasing decisions made by the customers who buy our wood products are generally based on price, quality and, particularly with respect to EWP, customer service and product support.
From 2005 to 2011, total housing starts in the United States declined by more than 70%. According to the U.S. Census Bureau, total housing starts in the United States were 0.59 million in 2010, 0.61 million in 2011 and 0.78 million in 2012. While 2012 housing starts increased from 2011 levels, they remained significantly less than the 50-year average rate of 1.5 million. Prior to 2008, the housing market had not experienced a year with total housing starts below 1.0 million since the U.S. Census Bureau began its annual recordkeeping in 1959.
As of July 2013, the Blue Chip Economic Indicators median consensus forecast of single- and multi-family housing starts in the U.S. was approximately 1.00 million units for 2013 and approximately 1.20 million units for 2014, which represent annual increases of 28% and 20%, respectively. We believe that over the long-term, there is considerable growth potential in the U.S. housing sector. As of July 2013, IHS Global Insight estimates that total U.S. single- and multi-family housing starts will average 1.49 million units per year from 2013 through 2022, levels that are approaching the 50-year historical average.
The following table sets forth historical and projected annual U.S. single- and multi-family housing starts for the periods indicated:
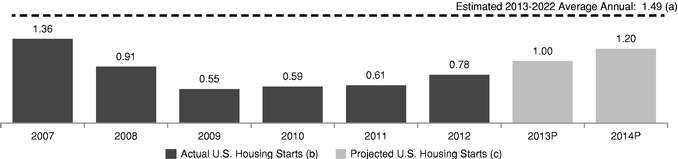
- (a)
- 2013-2022
average annual U.S. single- and multi-family housing starts estimate per IHS Global Insight as of July 2013.
- (b)
- U.S.
single- and multi-family housing starts per U.S. Census Bureau.
- (c)
- Projected 2013 and 2014 U.S. single- and multi-family housing starts represent median consensus forecast per Blue Chip Economic Indicators as of July 2013.
During the housing downturn, demand for EWP declined less than demand from many products dependent on new residential construction. According to APA—The Engineered Wood Association, LVL production volumes in North America increased 53% from 32.7 million cubic feet in 2009 to 49.9 million cubic feet in 2012 and I-joist production volumes in North America increased 46% from 380.1 million linear feet in 2009 to 555.7 million linear feet in 2012. Longer term demand trends are expected to improve further. RISI forecasts that I-joist demand in North America will increase 23% and LVL billet demand in North America will increase 23% in 2013, followed by further demand increases in 2014 through 2016. RISI expects the I-joist and LVL billet demand to reach 1,050 million linear feet and 95.5 million cubic feet, respectively, by 2017.
70
Our products are not only used in new residential construction, but also in residential repair and remodeling projects. Residential repair and remodeling spending increased significantly over the past 15 years. According to HIRI, total U.S. home improvement product sales increased 81.5% from $165 billion in 1996 to a peak of $300 billion in 2006. U.S. Repair and remodeling spending declined between 2006 and 2010 but posted modest growth thereafter, with total spending in 2012 equaling $276 billion. The overall age of the U.S. housing stock increased focus on making homes more energy efficient, rising home prices and availability of consumer capital at low interest rates are expected to drive long-term growth in repair and remodeling expenditures. HIRI estimates that total U.S. sales of home maintenance, repair and improvement products will grow at a compounded annual rate of 4.6% from 2012 through 2017.
Our Competitive Strengths
We believe the following key competitive strengths have contributed to our success and will enable us to execute our growth strategy:
Leadership Positions in Wood Products Manufacturing and Building Materials Distribution on a National Scale
We believe we are one of the leading manufacturers in the North American wood products industry. According to RISI's Capacity Report, we are the second largest producer of EWP and plywood in North America and we are the largest producer of plywood in the Western United States. We also operate the two largest EWP facilities in North America, as reported in RISI's Capacity Report. From 2005 to 2012, we increased our sales of LVL and I-joists per North American housing start by 69% and 37%, respectively. We have positioned ourselves to take advantage of improving demand in our core markets by expanding our EWP and plywood capacity through capital investments in low-cost, internal veneer manufacturing. Our Wood Products segment operates a highly-integrated national network of 17 manufacturing facilities that are well-maintained and cost-efficient as a result of continued capital improvements.
We believe we are one of the largest national stocking wholesale distributors of building materials in the United States and we believe we offer one of the broadest product lines in the industry. Measured on a sales-per-housing-start basis, our Building Materials Distribution business has grown significantly from 2005 to 2012, with penetration increasing from $1,476 to $2,808, or approximately 90%, per U.S. housing start. Our national platform of 31 strategically-located distribution facilities supplies products to all major markets in the United States and provides us with significant scale and capacity relative to most of our competitors; however, certain of our competitors are larger than we are and may have greater scale and capacity than we do. We also have one truss manufacturing plant that is located in Maine. Our broad geographic presence reduces our exposure to market factors in any single region. We have developed and maintain long-standing relationships with our customer segments, including retail lumberyards, home improvement centers and industrial converters. We believe that our strong and diverse customer relationships and support from leading industry manufacturers will enable us to capture additional market share as demand for building products improves.
Strongly Situated to Serve our Customers with Vertically-Integrated Manufacturing and Distribution Operations
We believe that we are the only large-scale manufacturer of plywood and EWP in North America that is vertically-integrated from log procurement through distribution. The integration of our manufacturing and distribution operations allows us to make procurement, manufacturing, veneer merchandising and marketing decisions that reduce our manufacturing and supply chain costs and allow us to more effectively control quality and working capital. Furthermore, our vertically-integrated
71
operations combined with our national distribution network significantly enhance our ability to assure product supply for our end customers. We believe our vertical integration was an important factor in our ability to increase market share during the recent housing downturn.
Low-Cost Manufacturing and Distribution Footprint
We believe that we have a highly competitive asset base across both of our operating segments, in part because we continued to strategically invest throughout the housing downturn. Our large-scale EWP production facilities are integrated with our nearby plywood operations to optimize our veneer utilization, which we believe helps position us as a competitive manufacturer in the growing EWP business. In the past three years, we completed a number of initiatives in our Wood Products segment that strengthened our asset base, substantially reduced our costs and enhanced our operating performance. In our plywood and veneer operations, we reduced costs by reducing headcount and closing three facilities in Western Oregon. At the same time, we installed two new large-scale, state-of-the-art dryers at our Medford, Oregon, plywood facility. In our EWP operations, we executed significant operational improvements to take advantage of additional low-cost, internal veneer production at our plywood facilities.
We believe that our plywood facilities in Kettle Falls, Washington and Elgin, Oregon, are among the lowest cost Douglas fir plywood facilities in North America. Additionally, in the active timberland markets in which we operate, our manufacturing facilities are clustered to enable us to efficiently utilize fiber resources and to shift production depending on demand. We believe we are the only manufacturer in the inland Pacific Northwest with the integrated primary and secondary facilities necessary to process all softwood species.
Significant Capital Invested to Position us for Growth as the Housing Market Recovers
Our operations are well-positioned to serve our customers and take advantage of the recovery that we believe is underway in the U.S. housing market. From 2005 to 2012, we invested approximately $300 million (excluding acquisitions) to upgrade and maintain our Wood Products facilities and opportunistically expand our Building Materials Distribution facilities. Since 2005, we have increased our covered warehouse space by over 65% and have more than doubled our outdoor storage acreage. We expect to make further capital investments in cost and operational improvements, primarily related to internal veneer production, which will further enhance our competitive position and allow us to capture growth opportunities. For the year ended December 31, 2012, we operated our EWP facilities at approximately 52% of LVL press capacity, providing us with substantial unused capacity. Additionally, we believe that our Building Materials Distribution facilities can support a considerable ramp-up in housing starts with no significant requirement for new capacity and will allow us to double our sales without increasing our existing footprint.
Experienced Management Team
Our senior management team has an average of approximately 30 years of experience in forest products manufacturing and building materials distribution with a track record of financial and operational excellence in both favorable and challenging market conditions. We have established the 2013 Incentive Plan so that we can align management's compensation with our financial performance. See "Executive Compensation—2013 Incentive Plan."
72
Our Business Strategy
We intend to capitalize on our strong market position in wood products manufacturing and building materials distribution to increase revenues and profits and maximize cash flow as the U.S. housing market recovers. We seek to achieve this objective by executing on the following strategies:
Grow our Wood Products Segment Operations with a Focus on Expanding our Market Position in EWP
We will continue to expand our market position in EWP by focusing on our large-scale manufacturing position, comprehensive customer service, design support capabilities and efficient distribution network. We have positioned ourselves to take advantage of expected increases in the demand for EWP per housing start by expanding our capacity through capital investments in low-cost, internal veneer manufacturing. We have also developed strategic relationships with third-party veneer suppliers to support additional EWP production as needed. Additionally, we intend to grow our Wood Products business through strategic acquisitions.
Grow Market Share in our Building Materials Distribution Segment
We intend to grow our Building Materials Distribution business in existing markets by adding products and services to better serve our customers. For example, we have added cedar board inventory and door shops in additional locations. We also plan to opportunistically expand our Building Materials Distribution business into nearby geographies that we currently serve using off-site storage arrangements or longer truck routes. Sales in our Building Materials Distribution segment are strongly correlated with new residential construction in the United States. Measured on a sales-per-housing-start basis, our Building Materials Distribution business has grown significantly from 2005 to 2012, with penetration increasing from $1,476 to $2,808, or approximately 90%, per U.S. housing start. We will continue to grow our Building Materials Distribution business by opportunistically acquiring facilities, adding new products, opening new locations, relocating and expanding capacity at existing facilities and capturing local market share through our superior supply chain capabilities and customer service.
Further Differentiate our Products and Services to Capture Market Share
We seek to continue to differentiate ourselves from our competitors by providing a broad line of high-quality products and superior customer service. Throughout the housing downturn, we believe we have grown market share by strengthening relationships with our customers by stocking sufficient inventory and retaining our primary sales team. Our highly efficient logistics system allows us to deliver superior customer service and assist our customers in optimizing their working capital. Our national distribution platform, coupled with the manufacturing capabilities of our Wood Products segment, differentiates us from most of our competitors and is critical to servicing retail lumberyards, home improvement centers and industrial converters locally, regionally and nationally. Additionally, this system allows us to procure product more efficiently and to develop and maintain stronger relationships with our vendors. Because of these relationships and our national presence, many of our vendors have offered us favorable pricing and provide us with enhanced product introductions and ongoing marketing support.
Continue to Improve our Competitiveness through Operational Excellence
We use a disciplined cost management approach to maximize our competitiveness without sacrificing our ability to react to future growth opportunities. Additionally, we have made capital investments and process improvements in certain facilities, which have enabled us to close or divest five manufacturing facilities during the housing downturn without any adverse impact on our production capacity. These capital investments and process improvements have decreased our production costs and
73
allowed us to produce lower-cost, higher-quality veneers. Beginning in 2009, we adopted a data-driven process improvement program to further strengthen our manufacturing operations. Because of the significant gains we continue to see from this program, we believe there are opportunities to apply similar techniques and methods to different functional areas (including sales and marketing) to realize efficiencies in those areas.
Wood Products
Products
We manufacture and sell EWP, consisting of LVL, I-joists and laminated beams, which are high-grade, value-added structural products used in applications where extra strength and consistent quality is required, such as headers and beams. LVL is also used in the manufacture of engineered I-joists, which are assembled by combining a vertical web of oriented strand board ("OSB") with top and bottom LVL or solid wood flanges. We also produce plywood, studs, particleboard and ponderosa pine lumber, a premium lumber grade sold primarily to manufacturers of specialty wood windows, moldings and doors.
For the LTM period, EWP (LVL and I-joists), plywood and lumber accounted for 35%, 45% and 9%, respectively, of our Wood Products sales. Most of our wood products are sold to leading wholesalers (including our Building Materials Distribution segment), home improvement centers, retail lumberyards and industrial converters. In the LTM period, approximately 38% of our Wood Products sales, including approximately 74% of our EWP sales, were to our Building Materials Distribution segment.
The following table sets forth the annual capacity and production of our principal products for the periods indicated:
| |
Year Ended December 31 | |||||||||||||||
|---|---|---|---|---|---|---|---|---|---|---|---|---|---|---|---|---|
| |
2008 | 2009 | 2010 | 2011 | 2012 | |||||||||||
| |
(millions) |
|||||||||||||||
Capacity(a) |
||||||||||||||||
Laminated veneer lumber (LVL) (cubic feet)(b) |
27.5 | 27.5 | 27.5 | 27.5 | 27.5 | |||||||||||
Plywood (sq. ft.) (3/8" basis)(c) |
1,600 | 1,430 | 1,475 | 1,500 | 1,630 | |||||||||||
Lumber (board feet)(d) |
230 | 180 | 180 | 200 | 235 | |||||||||||
Production |
||||||||||||||||
Laminated veneer lumber (LVL) (cubic feet)(b) |
11.2 | 7.9 | 10.0 | 10.7 | 14.2 | |||||||||||
I-joists (equivalent lineal feet)(b) |
109 | 81 | 105 | 112 | 149 | |||||||||||
Plywood (sq. ft.) (3/8" basis)(c) |
1,351 | 1,066 | 1,183 | 1,240 | 1,482 | |||||||||||
Lumber (board feet)(d) |
189 | 141 | 149 | 152 | 196 | |||||||||||
- (a)
- Annual
capacity is production assuming normal operating shift configurations. Accordingly, production can exceed capacity under some operating conditions.
- (b)
- A
portion of LVL production is used to manufacture I-joists at two EWP plants. Capacity is based on LVL production only.
- (c)
- Approximately
13%, 10%, 11%, 12% and 15%, respectively, of the plywood we produced in 2008, 2009, 2010, 2011 and 2012 was utilized internally to produce
EWP.
In response to the housing downturn, in March 2009, we closed our plywood manufacturing facility in White City, Oregon, and curtailed our Oakdale, Louisiana, plywood operation. The Oakdale, Louisiana, mill resumed plywood operations in June 2010.
74
- (d)
- In June 2009, we closed our lumber facility in La Grande, Oregon. This facility was reopened on a limited operating basis in April 2011. In June 2009, we purchased a lumber manufacturing facility in Pilot Rock, Oregon. In February 2012, we purchased a lumber facility in Arden, Washington.
The following table sets forth segment sales, segment income (loss), depreciation and amortization and EBITDA for the periods indicated:
| |
|
|
|
|
|
Three Months Ended March 31 |
Twelve Months Ended March 31 2013 |
||||||||||||||||||
|---|---|---|---|---|---|---|---|---|---|---|---|---|---|---|---|---|---|---|---|---|---|---|---|---|---|
| |
Year Ended December 31 | ||||||||||||||||||||||||
| |
2008(a) | 2009(b) | 2010(c) | 2011(d) | 2012 | 2012 | 2013 | ||||||||||||||||||
| |
(millions) |
|
|
||||||||||||||||||||||
Segment sales(e) |
$ | 795.9 | $ | 550.8 | $ | 687.4 | $ | 712.5 | $ | 943.3 | $ | 211.1 | $ | 269.2 | $ | 1,001.3 | |||||||||
Segment income (loss)(f) |
(55.1 | ) | (77.3 | ) | (8.1 | ) | (15.1 | ) | 55.8 | 10.8 | 20.8 | 65.8 | |||||||||||||
Segment depreciation and amortization |
27.7 | 33.0 | 27.1 | 28.4 | 24.4 | 5.9 | 6.3 | 24.8 | |||||||||||||||||
Segment EBITDA(g) |
$ | (27.4 | ) | $ | (44.3 | ) | $ | 19.0 | $ | 13.3 | $ | 80.2 | $ | 16.7 | $ | 27.1 | $ | 90.6 | |||||||
- (a)
- In
2008, segment loss included $11.3 million of expenses related to closing our veneer operations in St. Helens, Oregon, and our plywood
manufacturing facility in White City, Oregon, offset partially by a $5.7 million net gain related to the sale of our wholly owned subsidiary in Brazil that manufactured veneer.
- (b)
- In
2009, segment loss included $8.9 million of expense related to the June 2009 closure of our lumber manufacturing facility in La Grande, Oregon, of
which $3.7 million was included in EBITDA and $5.2 million was accelerated depreciation recorded in "Depreciation and amortization."
- (c)
- In
2010, segment loss and EBITDA included $0.5 million of income for cash received from a litigation settlement related to vendor product pricing.
- (d)
- In
2011, segment loss included $2.6 million of expense related to the permanent closure of a laminated beam plant in Emmett, Idaho, and noncash asset
write-downs, of which $2.2 million reduced EBITDA and $0.4 million was accelerated depreciation recorded in "Depreciation and amortization."
- (e)
- Segment
sales are calculated before intersegment eliminations.
- (f)
- Segment
income (loss) excludes Corporate and Other segment expenses.
- (g)
- Segment EBITDA is calculated as segment income (loss) before depreciation and amortization, excluding Corporate and Other segment expenses. EBITDA is the primary measure used by our chief operating decision maker to evaluate segment operating performance and to decide how to allocate resources to segments. See "Selected Financial Data" for a description of our reasons for using EBITDA, for a discussion of the limitations of such a measure, and for a reconciliation of our consolidated EBITDA to net income (loss).
Facilities
Our Wood Products segment currently operates four EWP facilities and seven plywood and veneer plants, five of which manufacture inputs used in our EWP facilities. Our EWP facilities have a high degree of raw material and manufacturing integration with our plywood and veneer facilities. We also operate five sawmills, including the Arden, Washington, facility purchased in February 2012, and one particleboard plant. During 2011, we closed our laminated beam manufacturing plant in Emmett,
75
Idaho and purchased a laminated beam and decking manufacturing plant in Homedale, Idaho, that provides us a broader product mix and a larger, more efficient operation.
Raw Materials and Input Costs
Wood fiber. The primary raw material in our Wood Products segment is wood fiber. For the year ended December 31, 2012, wood fiber accounted for 43% of materials, labor and other operating expenses, including from related parties (excluding depreciation), in our Wood Products segment. Our plywood and veneer facilities use Douglas fir, white woods and pine logs as raw materials. We use ponderosa pine, spruce and white fir logs to manufacture various grades of lumber. Our EWP facilities in Louisiana and Oregon use parallel-laminated veneer panels produced by our facilities and veneers produced by our facilities and purchased from third parties, together with OSB purchased from third parties, to manufacture LVL and I-joists. Our manufacturing facilities are located in close proximity to active wood markets. We have long-term market-based contracts for a significant portion of our fiber needs.
Timber comprises nearly 80% of our wood fiber costs, and we satisfy our timber requirements through a combination of purchases under supply agreements, open-market purchases and purchases pursuant to contracts awarded under public timber auctions. In February 2005, one of our affiliates sold its timberland operations to Forest Capital, an unaffiliated third party. In connection with this sale, we entered into a series of fiber supply agreements with Forest Capital. These fiber supply agreements required Forest Capital to sell a specified amount of timber to us at prices generally related to market prices. In 2012, approximately 33% of our timber was supplied pursuant to these agreements. In July 2011, Forest Capital sold approximately 50,000 acres of the timberlands in Louisiana to Rayonier. In July 2012, Forest Capital sold the remaining legacy timberlands in Louisiana, Washington, Oregon, Minnesota and Idaho to a group of purchasers whose investments in the timberlands are managed by Hancock. In July 2012, Hancock resold approximately 110,000 acres of the Louisiana timberlands to a group of purchasers whose investments in the timberlands are managed by Molpus. The purchasers of the timberlands (other than Molpus and Rayonier) assumed Forest Capital's obligations under the 2005 wood supply agreements. The Molpus entities and Rayonier each entered into a new master harvest rights agreement on substantially the same terms. As a result of Forest Capital's sale of the timberlands to various purchasers, our sources of timber are more diversified.
All of the supply agreements require us to purchase (and the suppliers to sell) a minimum specified volume of timber per year at prices that are reset quarterly based on agreed-upon market data. Prior to the beginning of each contract year, we provide each supplier with a harvest plan. To the extent the volumes specified in the harvest plan exceed the specified minimum volume, the parties have agreed to negotiate in good faith with respect to the purchase of the additional timber. If agreement is not reached, then the parties have agreed to a public auction process designed to provide us with equal opportunity to purchase such additional quantities. The agreements generally also provide us with rights to reduce the specified minimum volumes in the event we close a mill or permanently cease operation of any portion of a mill. All of the supply agreements terminate on December 31, 2014, subject to additional one-year extensions unless notice is provided to the other party at least six months prior to expiration of the applicable agreement. The agreements generally restrict the ability of the owner of the timberlands to transfer any interest in the timberlands during the terms of the applicable supply agreement without our consent.
We also bid in auctions conducted by federal, state and local authorities for the purchase of timber, generally at fixed prices, under contracts with a term of generally one to three years. In 2012, approximately 21% of our timber was supplied under government contracts. The remainder of our log supply in 2012 was supplied through private purchases directly from timber owners or through dealers.
76
Under most of our timber and fiber supply agreements, we have the right to cancel or reduce our commitments in the event of a mill curtailment or shutdown. Future purchase prices under most of these agreements will be set quarterly or semiannually based on regional market prices. Our timber and fiber obligations are subject to change based on, among other things, the effect of governmental laws and regulations, our manufacturing operations not operating in the normal course of business, timber and fiber availability and the status of environmental appeals. For a discussion of contractual commitments relating to fiber supply agreements, see "Management's Discussion and Analysis of Financial Condition and Results of Operations—Contractual Obligations."
The cost of timber is strongly correlated with product prices for building materials, with the increase in product prices driving increases in timber costs. Because wood fiber is a commodity, prices have been cyclical historically in response to changes in domestic and foreign demand and supply. Demand for dimension lumber has a strong influence on pricing, as the dimension lumber industry is the largest consumer of timber.
Foreign demand for timber exports, particularly from China, increased timber costs in the western U.S. in 2010 and 2011 and negatively affected wood products manufacturers in the region. In 2012, China's demand for timber exports from the western U.S. declined from 2011 levels, but in the future we expect that the level of foreign demand for timber exports from the western U.S. will continue to fluctuate based on the economic activity in China and other Pacific Rim countries, currency exchange rates and the availability of timber supplies from other countries such as Canada, Russia and New Zealand. Sustained periods of high timber costs may impair the cost competitiveness of our manufacturing facilities. Availability of residual wood fiber for our particleboard operation has been negatively affected by significant mill closures and curtailments that have occurred among solid-wood product producers.
Our aggregate cost of obtaining timber is also affected by fuel costs and the distance of the fiber source from our facilities, as we are often required to transport the timber we purchase from the source to our facilities.
Other raw materials and energy costs. We use a significant quantity of various resins and glues in our manufacturing processes. Resin and glue product costs are influenced by changes in the prices of raw material input costs, primarily fossil fuel products. We purchase resins and glues, other raw materials and energy used to manufacture our products in both the open market and through supply contracts. The contracts are generally with regional suppliers who agree to supply all of our needs for a certain raw material or energy at one of our facilities. These contracts have terms of various lengths and typically contain price adjustment mechanisms that take into account changes in market prices. Therefore, although our long-term contracts provide us with supplies of raw materials and energy that are more stable than open-market purchases, in many cases, they may not alleviate fluctuations in market prices.
Sales, Marketing and Distribution
Our EWP sales force is managed centrally through a main office that oversees regional sales teams. Our sales force spends a significant amount of time working with end customers who purchase our EWP. Our sales force provides a variety of technical support services, including integrated design, engineering, product specification software, distributor inventory management software and job-pack preparation systems. Sales of plywood, lumber and particleboard are managed centrally by product. The majority of our wood products are sold to distributors, including our Building Materials Distribution segment and other distributors.
77
The following table lists sales volumes for our principal wood products for the periods indicated:
| |
Year Ended December 31 | |||||||||||||||
|---|---|---|---|---|---|---|---|---|---|---|---|---|---|---|---|---|
| |
2008 | 2009 | 2010 | 2011 | 2012 | |||||||||||
| |
(millions) |
|||||||||||||||
Laminated veneer lumber (LVL) (cubic feet) |
7.6 | 5.6 | 6.6 | 7.1 | 9.1 | |||||||||||
I-joists (equivalent lineal feet) |
117 | 87 | 106 | 110 | 145 | |||||||||||
Plywood (sq. ft.) (3/8" basis) |
1,228 | 992 | 1,088 | 1,106 | 1,356 | |||||||||||
Lumber (board feet) |
191 | 146 | 149 | 153 | 188 | |||||||||||
Building Materials Distribution
Products
We sell a broad line of building materials, including EWP, OSB, plywood, lumber and general line items such as siding, metal products, insulation, roofing and composite decking. Except for EWP, we purchase most of these building materials from a vendor base of more than 1,000 third-party suppliers ranging from large manufacturers, such as James Hardie Building Products, Trex Company, Louisiana-Pacific and Georgia-Pacific, to small regional producers. Substantially all of our EWP is sourced from our Wood Products segment. Our products are used in the construction of new residential housing, including single-family, multi-family and manufactured homes, the repair and remodeling of existing housing and the construction of light industrial and commercial buildings.
The following table sets forth segment sales; segment income (loss); and segment EBITDA for the periods indicated:
| |
|
|
|
|
|
Three Months Ended March 31 |
Twelve Months Ended March 31 2013 |
||||||||||||||||||
|---|---|---|---|---|---|---|---|---|---|---|---|---|---|---|---|---|---|---|---|---|---|---|---|---|---|
| |
Year Ended December 31 | ||||||||||||||||||||||||
| |
2008 | 2009 | 2010(a) | 2011(a) | 2012 | 2012 | 2013 | ||||||||||||||||||
| |
(millions) |
|
|
|
|||||||||||||||||||||
Segment sales(b) |
$ | 2,109.4 | $ | 1,609.8 | $ | 1,778.0 | $ | 1,779.4 | $ | 2,190.2 | $ | 451.4 | $ | 581.1 | $ | 2,319.9 | |||||||||
Segment income (loss)(c) |
19.5 | 8.0 | 11.6 | 2.0 | 24.0 | (0.8 | ) | 8.0 | 32.8 | ||||||||||||||||
Segment depreciation and amortization |
7.7 | 7.6 | 7.5 | 8.4 | 8.8 | 2.2 | 2.2 | 8.8 | |||||||||||||||||
Segment EBITDA(d) |
$ | 27.2 | $ | 15.5 | $ | 19.1 | $ | 10.4 | $ | 32.9 | $ | 1.4 | $ | 10.2 | $ | 41.7 | |||||||||
- (a)
- In
2010, segment income and EBITDA included $4.1 million of income for cash received from a litigation settlement related to vendor product pricing.
In 2011, segment income and EBITDA included $1.2 million of noncash asset write-downs.
- (b)
- Segment
sales are calculated before intersegment eliminations.
- (c)
- Segment
income excludes Corporate and Other segment expenses.
- (d)
- Segment EBITDA is calculated as segment income (loss) before depreciation and amortization, excluding Corporate and Other segment expenses. EBITDA is the primary measure used by our chief operating decision maker to evaluate segment operating performance and to decide how to allocate resources to segments. See "Selected Financial Data" for a description of our reasons for using EBITDA, for a discussion of the limitations of such a measure, and for a reconciliation of our consolidated EBITDA to net income (loss).
78
Facilities
Our Building Materials Distribution segment operates a nationwide network of 31 building materials distribution facilities throughout the United States. We also operate a single truss manufacturing plant. Our broad geographic presence reduces our exposure to market factors in any single region. During 2011, we completed facility expansions of our operations in Delanco, New Jersey and Detroit, Michigan. In early 2012, we also completed facility expansions in Dallas, Texas and Greenland, New Hampshire.
Sales, Marketing and Distribution
We market our building materials primarily to retail lumberyards and home improvement centers that then sell the products to end customers, who are typically professional builders, independent contractors and homeowners engaged in residential construction projects. We also market our products to industrial converters, which use our products to assemble windows, doors, agricultural bins and other value-added products used in industrial and repair and remodeling applications. We believe that our national presence and long-standing relationships with many of our key suppliers allow us to obtain favorable price and term arrangements and offer excellent customer service on top brands in the building materials industry. We also have expertise in special-order sourcing and merchandising support, which is a key service for our home improvement center customers that choose not to stock certain items in inventory.
Each of our distribution centers implements its own distribution and logistics model using centralized information systems. We use internal and external trucking resources to deliver materials on a regularly scheduled basis. Our highly efficient logistics system allows us to deliver superior customer service and assist our customers in optimizing their working capital, which we believe has led to increased market share during the housing downturn.
We have a large, decentralized sales force to support our suppliers and customers. Our sales force and product managers have local product knowledge and decision-making authority, which we believe enables them to optimize stocking, pricing and product assortment decisions. Our sales force has access to centralized IT systems, an extensive vendor base and corporate-level working capital support, which we believe complements our localized sales model. Our sales force is compensated, in part, based on branch-level performance.
We regularly evaluate opportunities to introduce new products. Broadening our product offering helps us serve as a one-stop resource for building materials, which we believe improves our customers' purchasing and operating efficiencies. The introduction of new products is primarily driven by customer demand or product extensions originating from our vendors. We believe our long-standing customer relationships allow us to respond to customer feedback and introduce new products more rapidly. Broadening our product offering also helps us drive additional products through our distribution system, thereby increasing our scale and efficiency.
Corporate and Other
Our Corporate and Other segment includes corporate support staff services, related assets and liabilities and foreign exchange gains and losses. These support services include, but are not limited to, finance, accounting, legal, information technology and human resource functions. Since the sale of our Paper and Packaging & Newsprint assets in 2008, we have purchased many of these services from Boise Inc. under an Outsourcing Services Agreement, under which Boise Inc. provides a number of corporate staff services to us at cost. See Note 3, "Outsourcing Services Agreement," to our audited consolidated financial statements incorporated by reference in this prospectus for more information. Prior to the sale of our Paper and Packaging & Newsprint assets, this segment also included certain rail and truck transportation businesses and related assets.
79
Customers
We maintain relationships with a broad customer base across multiple market segments and various end markets. For the year ended December 31, 2012, our top ten customers represented approximately 29% of our sales, with one customer, Home Depot, accounting for approximately 11% of our sales. At December 31, 2012 and March 31, 2013, receivables from Home Depot accounted for approximately 14% and 12%, respectively, of total receivables. Sales to Home Depot were recorded in our Building Materials Distribution and Wood Products segments. No other customer accounted for 10% or more of total sales for the year ended December 31, 2012.
Wood Products. Our Building Materials Distribution segment is our Wood Products segment's largest customer, representing approximately 38% of our Wood Products segment's overall sales, including approximately 74% of its EWP sales, for the LTM period. Our third-party customers in this segment include wholesalers, home improvement centers and industrial converters primarily in North America.
Building Materials Distribution. A majority of our sales in this segment were to retail lumberyards and home improvement centers that then sell products to end customers, who are typically professional builders, independent contractors and homeowners engaged in residential construction projects. We also market our products to industrial converters. We believe our broad product line provides our customers with an efficient, one-stop resource for their building materials needs.
Competition
The competitive environment in the U.S. continues to be challenging as new residential and light commercial construction activity and repair and remodel spending remain substantially below average historical levels. Industry capacity in a number of product markets, including those in which we compete, far exceeds the current level of demand. Our products and services compete with similar products manufactured and distributed by others. Many factors influence our competitive position in the markets in which we operate. Those factors include price, service, quality, product selection and convenience of location.
Some of our competitors are larger than we are and have greater financial resources. These resources may afford those competitors greater purchasing power, increased financial flexibility and more capital resources for expansion and improvement.
Wood Products. The wood products manufacturing markets in which we operate are large and highly competitive. We compete against several major North American EWP producers, such as Weyerhaeuser Company and Louisiana-Pacific Corporation, as well as several other smaller, regional firms. Our EWP products also face competition from numerous dimension lumber producers, because EWP may be substituted by dimension lumber in many building applications. In plywood, we compete with Georgia-Pacific, the largest manufacturer in North America, other large producers such as Roseburg Forest Products and several smaller producers. We have leading market positions in the manufacture of EWP, plywood and ponderosa pine lumber. We hold much smaller market positions in our other manufactured products. In the wood products manufacturing markets, we compete primarily on the basis of price, quality, and particularly with respect to EWP, levels of customer service. Most of our competitors are located in the United States and Canada, although we also compete with manufacturers in other countries. Our competition includes not only manufacturers and distributors of similar building products but also manufacturers and distributors of products made from alternative materials, such as steel and plastic. Some of our competitors enjoy strong reputations for product quality and customer service, and these competitors may have strong relationships with certain distributors, making it more difficult for our products to gain additional market share. Some of our competitors in this segment are also vertically integrated and/or have access to internal sources of wood
80
fiber, which may allow them to subsidize their base manufacturing business in periods of rising fiber prices.
Building Materials Distribution. The building materials distribution markets in which we operate are highly fragmented, and we compete in each of our geographic and product markets with national, regional and local distributors. Our national wholesale distribution competitors include BlueLinx Holdings Inc. and Weyerhaeuser Company. Cedar Creek Inc. is one of our regional competitors in the southeastern United States. We also compete with wholesale brokers, such as Forest City Trading Group and certain buying cooperatives, such as Lumbermens Merchandising Corporation. We compete on the basis of delivered cost, product selection and availability, quality of service and compatibility with customers' needs. We also distribute products for some manufacturers that engage in direct sales. In recent years, there has been consolidation among retail lumberyards and home improvement centers. As the customer base consolidates, this dynamic could affect our ability to maintain margins. Proximity to customers is an important factor in minimizing shipping costs and facilitating quick order turnaround and on-time delivery. We believe our ability to obtain quality materials, from both internal and external sources, the scale and efficiency of our national footprint and our focus on customer service are our primary competitive advantages in this segment. Also, financial stability is important to suppliers and customers in choosing distributors and allows for more favorable terms on which we are able to obtain our products from our suppliers and sell our products to our customers.
Environmental
We are subject to a wide range of general and industry-specific environmental laws and regulations. In particular, we are affected by laws and regulations covering air emissions, wastewater discharges, solid and hazardous waste management and site remediation. Compliance with these laws and regulations is a significant factor in the operation of our businesses. We believe that we have created a corporate culture of strong compliance by taking a conservative approach to environmental issues in order to assure that we are operating well within the bounds of regulatory requirements. However, we cannot assure that we will be in full compliance with environmental requirements at all times and we cannot assure that we will not incur fines and penalties in the future. In 2012, we paid an insignificant amount of environmental fines and penalties across all of our segments.
We incur capital and operating expenditures to comply with federal, state and local environmental laws and regulations. Failure to comply with these laws and regulations could result in civil or criminal fines or penalties or in enforcement actions. Our failure to comply could also result in governmental or judicial orders that stop or interrupt our operations or require us to take corrective measures, install additional pollution control equipment, or take other remedial actions. During 2012, we spent approximately $1.3 million on capital expenditures to comply with environmental requirements. We expect to spend approximately $3.5 million in 2013 for this purpose.
As an owner and operator of real estate, we may be liable under environmental laws for the cleanup of past and present spills and releases of hazardous or toxic substances on or from our properties and operations. We can be found liable under these laws whether or not we knew of, or were responsible for, the presence of such substances. In some cases, this liability may exceed the value of the property itself.
In connection with the completion of the Forest Products Acquisition in 2004, OfficeMax generally indemnifies us for hazardous substance releases and other environmental violations that occurred prior to the Forest Products Acquisition. However, OfficeMax may not have sufficient funds to fully satisfy its indemnification obligations when required and in some cases, we may not be contractually entitled to indemnification by OfficeMax. See "Certain Relationships and Related Party Transactions—Office Max and the Forest Products Acquisition."
81
In connection with the sale of our Paper and Packaging & Newsprint assets in 2008, Boise Inc. and its affiliates assumed any and all environmental liabilities arising from our ownership or operation of the assets and businesses sold to them and we believe we are entitled to indemnification by them from third-party claims in the event they fail to fully discharge any such liabilities on the basis of common law rules of indemnification. However, Boise Inc. may not have sufficient funds to discharge its obligations when required or to indemnify us from third-party claims arising out of any such failure.
Climate Change Matters
Various legislative and regulatory proposals to restrict emissions of GHGs, such as CO2, are under consideration in Congress, state legislative bodies and the EPA. In particular, the EPA has promulgated its Tailoring Rule which directs states having authority to implement the Clean Air Act (which includes all states in which we have significant manufacturing operations) to treat GHG as regulated pollutants under their state implementation plans. The EPA's final rule and its November 2010 implementation guidance do not set specific standards to be utilized in air discharge permits and permits to construct significant new facilities. Generation of this detail has been left to the states. The key states in which our facilities are located (Louisiana, Oregon and Washington) are currently working through the process of incorporating GHG regulations into their state implementation plans. Most of our manufacturing facilities operate boilers or other process equipment that emits GHG. Such regulatory initiatives may require us to modify operating procedures or production levels, incur capital expenditures, change fuel sources, or take other actions that may adversely affect our financial results. However, given the high degree of uncertainty about the ultimate parameters of any such regulatory initiative, it is premature to make any prediction concerning such impacts.
A significant portion of our GHG emissions are from biomass-fired boilers and in July 2011, the EPA issued a final rule that defers, for three years, the applicability of federal New Source Review ("NSR") regulations to biogenic CO2 emissions. During the three-year deferral period, the EPA will evaluate whether or not to permanently exempt biogenic CO2 from NSR regulations. States are not required by this regulation to defer biogenic CO2 emissions from their NSR programs, but so far, states in which we operate have not indicated they will not follow the EPA's deferral. This action leaves considerable uncertainty as to the future regulatory treatment of biomass-generated GHG and the treatment of such GHG in the states in which we operate.
In addition, various government entities have adopted or are considering energy sourcing regulations which subsidize, or mandate consumption of specified percentages of, electrical power generated from nontraditional generating sources, including biomass fuels. These programs may increase our purchased electrical energy costs, create significant new competition for our fiber sources and provide opportunities for alternative uses of our residual fiber, such as sawdust, chips and shavings.
From time to time, legislative bodies and environmental regulatory agencies may promulgate new regulatory programs imposing significant incremental operating costs or capital costs on us. The EPA has recently promulgated a series of four regulations commonly referred to collectively as Boiler MACT, which are intended to regulate the emission of hazardous air pollutants from industrial boilers. At the time it announced the final promulgation of the regulations, the EPA also announced that it planned to reconsider portions of the regulations and has recently taken steps to initiate such reconsideration. In December 2012, the EPA finalized a revised series of four regulations commonly referred to collectively as Boiler MACT, which are intended to regulate the emission of hazardous air pollutants from industrial boilers. Facilities in our Wood Products segment will be subject to one or more of these regulations and must be in compliance with the applicable rules by early 2016. We are currently undertaking a complete review of the revised rules to assess how they will affect our operations. Even with the revised rules finalized, considerable uncertainty still exists, as there will likely be legal challenges to the final rules from industry and/or environmental organizations. Notwithstanding that uncertainty, we are proceeding with efforts to analyze the applicability and requirements of the
82
regulations, including the capital and operating costs required to comply. At this time, we cannot accurately forecast the capital or operating cost changes that may result from compliance with the regulations.
Capital Investment
Information concerning our capital expenditures is presented in "Management's Discussion and Analysis of Financial Condition and Results of Operations—Liquidity and Capital Resources—Investment Activities."
Seasonal and Inflationary Influences
We are exposed to fluctuations in quarterly sales volumes and expenses due to seasonal factors. These seasonal factors are common in the building products industry. For further information, see "Management's Discussion and Analysis of Financial Condition and Results of Operations—Seasonal and Inflationary Influences."
Properties
Our properties are well-maintained and are suitable for the operations for which they are used. The following is a list of our facilities by segment as of March 31, 2013. We lease office space for our corporate headquarters in Boise, Idaho.
Wood Products
We own all of our Wood Products manufacturing facilities. The following table summarizes our Wood Products facilities as of March 31, 2013:
Facility Type |
Number of Facilities |
Locations | |||
|---|---|---|---|---|---|
LVL/I-joist/Laminated beam plants |
4 | Louisiana, Oregon, Idaho and Canada | |||
Plywood and veneer plants |
7 | Louisiana (2), Oregon (4) and Washington | |||
Sawmills |
5 | Oregon (3) and Washington (2) | |||
Particleboard plant |
1 | Oregon | |||
Building Materials Distribution
We lease and own properties in our Building Materials Distribution business. All of our leases are non-cancellable and accounted for as operating leases. These leases are not subject to early termination except for standard non-performance clauses. In the next twelve months, the lease for our Vancouver, Washington facility is scheduled to terminate. We expect to renegotiate this lease on acceptable terms or to find similar property in the same geographic area. Additionally, we intend to exercise our option to renew two land leases eligible for renewal in the same period.
83
The following table summarizes our 32 Building Materials Distribution facilities as of March 31, 2013:
Location
|
Owned or Leased | Approximate Warehouse Square Footage |
||||
|---|---|---|---|---|---|---|
Phoenix, Arizona |
Owned | 33,000 | ||||
Lathrop, California |
Leased | 164,000 | ||||
Riverside, California |
Leased | 162,000 | ||||
Denver, Colorado |
Owned/Leased | 230,000 | ||||
Grand Junction, Colorado |
Owned/Leased | 97,000 | ||||
Milton, Florida |
Leased | 87,000 | ||||
Orlando, Florida |
Owned | 144,000 | ||||
Pompano Beach, Florida |
Leased | 68,000 | ||||
Atlanta, Georgia |
Leased | 155,000 | ||||
Boise, Idaho |
Owned/Leased | 108,000 | ||||
Idaho Falls, Idaho |
Owned/Leased | 69,000 | ||||
Chicago, Illinois |
Leased | 122,000 | ||||
Biddeford/Saco, Maine(a) |
Leased | 48,000 | ||||
Baltimore, Maryland |
Leased | 205,000 | ||||
Westfield, Massachusetts |
Leased | 134,000 | ||||
Detroit, Michigan |
Leased | 108,000 | ||||
Minneapolis, Minnesota |
Leased | 100,000 | ||||
Billings, Montana |
Owned | 81,000 | ||||
Greenland, New Hampshire |
Owned/Leased | 166,000 | ||||
Delanco, New Jersey |
Owned/Leased | 345,000 | ||||
Albuquerque, New Mexico |
Leased | 68,000 | ||||
Greensboro, North Carolina |
Owned/Leased | 88,000 | ||||
Marion, Ohio |
Leased | 95,000 | ||||
Tulsa, Oklahoma |
Owned | 129,000 | ||||
Memphis, Tennessee |
Owned | 78,000 | ||||
Dallas, Texas |
Owned/Leased | 233,000 | ||||
Houston, Texas |
Leased | 150,000 | ||||
Salt Lake City, Utah |
Leased | 126,000 | ||||
Spokane, Washington |
Owned/Leased | 58,000 | ||||
Vancouver, Washington |
Leased | 86,000 | ||||
Woodinville, Washington |
Owned/Leased | 110,000 | ||||
Yakima, Washington |
Owned/Leased | 44,000 | ||||
- (a)
- Truss manufacturing plant
Employees
As of June 30, 2013, we had approximately 4,760 employees. Approximately 30% of these employees work pursuant to collective bargaining agreements. As of June 30, 2013, we had nine collective bargaining agreements. Two agreements, covering 358 employees at our facility in Florien, Louisiana, and 278 employees at our facility in Oakdale, Louisiana, were scheduled to expire on July 15, 2013 but, pending further negotiations, have been indefinitely extended by the parties, subject to each party's right to terminate by providing a 10-day prior written notice. These two agreements are being negotiated together. If these agreements are terminated before definite negotiations conclude, we could experience a material labor disruption or significantly increased labor costs, which could prevent us from meeting customer demand or reduce our sales and profitability.
84
Trademarks
We maintain many trademarks for our manufactured wood products, particularly EWP. Our key registered trademarks include BOISE CASCADE® and the TREE-IN-A-CIRCLE® logo, which we believe to be of significant importance to our business.
Legal Proceedings
We are a party to routine legal proceedings that arise in the ordinary course of our business. We are not currently a party to any legal proceedings or environmental claims that we believe would, individually or in the aggregate, have a material adverse effect on our financial position, results of operations, or cash flows.
85
Directors and Executive Officers
Below is a list of names, ages and a brief account of the business experience of our executive officers and key members of management and directors, each as of July 15, 2013.
Name
|
Age | Position | |||
|---|---|---|---|---|---|
Executive Officers: |
|||||
Thomas E. Carlile |
62 | Chief Executive Officer and Director | |||
Wayne M. Rancourt |
50 | Senior Vice President, Chief Financial Officer, and Treasurer | |||
Stanley R. Bell |
66 | President, Building Materials Distribution | |||
Thomas A. Lovlien |
57 | President, Wood Products Manufacturing | |||
John T. Sahlberg |
60 | Senior Vice President, Human Resources and General Counsel | |||
Kelly E. Hibbs |
46 | Vice President and Controller | |||
Key Management: |
|||||
Thomas K. Corrick |
58 | Senior Vice President, Wood Products Manufacturing | |||
Nick Stokes |
56 | Senior Vice President, Building Materials Distribution | |||
Dennis R. Huston |
61 | Vice President of Sales and Marketing, Engineered Wood Products | |||
Daniel G. Hutchinson |
61 | Vice President of Operations, Wood Products Manufacturing | |||
Directors: |
|||||
Duane C. McDougall |
61 | Director and Chairman of the Board | |||
Richard H. Fleming |
65 | Director | |||
John W. Madigan |
76 | Director | |||
Christopher J. McGowan |
42 | Director | |||
Samuel M. Mencoff |
56 | Director | |||
Matthew W. Norton |
34 | Director | |||
Thomas S. Souleles |
44 | Director | |||
Thomas E. Carlile, Chief Executive Officer and Director
Mr. Carlile became our chief executive officer and a director of BC Holdings in August 2009. He became one of our directors in February 2013 in connection with our initial public offering. Mr. Carlile previously served as our executive vice president and chief financial officer from February 2008 to August 2009, following the divestiture of our paper and packaging businesses. From October 2004 to January 2008, he served as senior vice president and chief financial officer. Mr. Carlile received a bachelor's degree in accounting from Boise State University and completed the Stanford Executive Program. Mr. Carlile is a member of the board of directors of FPH. Mr. Carlile's position as our chief executive officer allows him to advise the board of directors on management's perspective over a full range of issues affecting the company.
Wayne M. Rancourt, Senior Vice President, Chief Financial Officer and Treasurer
Mr. Rancourt became our senior vice president and chief financial officer in August 2009. Mr. Rancourt previously served as our vice president, treasurer and investor relations from February 2008 to August 2009, following the divestiture of our paper and packaging businesses. From
86
October 2004 to January 2008, he served as vice president and treasurer. Mr. Rancourt received a B.S. degree in accounting from Central Washington University.
Stanley R. Bell, President, Building Materials Distribution
Mr. Bell became our president, Building Materials Distribution, in February 2008, following the divestiture of our paper and packaging businesses. From October 2004 to January 2008, he served as senior vice president, Building Materials Distribution. Mr. Bell received a B.A. in economics from the University of Utah and an M.B.A. from the University of Utah.
Thomas A. Lovlien, President, Wood Products Manufacturing
Mr. Lovlien became our president, Wood Products Manufacturing, in February 2008, following the divestiture of our paper and packaging businesses. From October 2004 to January 2008, he served as senior vice president, Wood Products. Mr. Lovlien received a bachelor's degree in accounting and a master's degree in wood technology from Oregon State University.
John T. Sahlberg, Senior Vice President, Human Resources and General Counsel
Mr. Sahlberg became our senior vice president, Human Resources and General Counsel, effective August 2012. Prior to his election as senior vice president, Human Resources and General Counsel, Mr. Sahlberg served as vice president, Human Resources and General Counsel, since January 2011. Prior to that, he served as vice president, Human Resources, from February 2008 to January 2011. Prior to that, he served as director of Human Resources from February 2006 to February 2008. From October 2004 through January 2006, he was the director of labor relations. Mr. Sahlberg received a bachelor's degree in economics from Harvard College and a J.D. from Georgetown University. He is a member of the Idaho State Bar.
Kelly E. Hibbs, Vice President and Controller
Mr. Hibbs became our vice president and controller in February 2011. Mr. Hibbs previously served as our director of strategic planning and internal audit from February 2008 to February 2011. From October 2004 to February 2008, he served as manager of financial forecasts and projects. Mr. Hibbs received a B.A. in accounting from Boise State University. He is a certified public accountant.
Thomas K. Corrick, Senior Vice President, Wood Products Manufacturing
Mr. Corrick became our senior vice president, Wood Products Manufacturing, effective August 2012. Prior to his election as senior vice president, Wood Products Manufacturing, Mr. Corrick served as senior vice president, Engineered Wood Products, since February 2011. Prior to that, Mr. Corrick served as vice president, Engineered Wood Products, from January 2005 to February 2011. From October 2004 to January 2005, he served as the general manager of Engineered Wood Products. Mr. Corrick received both his bachelor's and master's degrees in business administration from Texas Christian University.
Nick Stokes, Senior Vice President, Building Materials Distribution
Mr. Stokes became our senior vice president, Building Materials Distribution, in February 2011. Mr. Stokes previously served as vice president, Building Materials Distribution, from October 2004 to February 2011. Mr. Stokes received a B.S. in management and a B.S. in marketing from the University of Utah.
87
Dennis R. Huston, Vice President of Sales and Marketing, Engineered Wood Products
Mr. Huston became our vice president of sales and marketing, Engineered Wood Products, in August 2012. Mr. Huston previously served as sales manager of our Engineered Wood Products from 1994 until August 2012. Mr. Huston received a bachelor's degree in political science from the University of Dubuque.
Daniel G. Hutchinson, Vice President of Operations, Wood Products Manufacturing
Mr. Hutchinson became our vice president of operations for Wood Products Manufacturing in August 2012. He previously served as general manager of operations for our Engineered Wood Products business from 2008 to August 2012. From 2007 to 2008, he served as our Engineered Wood Products national accounts manager. Mr. Hutchinson received an M.B.A. from Washington State University and bachelor's degrees in accounting and finance from the University of Idaho.
Duane C. McDougall, Director and Chairman of the Board
Mr. McDougall has served as BC Holdings' board chairman since December 2008 and has been a director of BC Holdings since 2005. He became one of our directors and the chairman of our board of directors in February 2013 in connection with our initial public offering. Mr. McDougall also served as our chief executive officer from December 2008 to August 2009. Prior to joining our company, Mr. McDougall was president and chief executive officer of Willamette Industries, an international paper and forest products company, until its sale in 2002. During his 23-year career with Willamette, Mr. McDougall held numerous operating and finance positions before becoming president and chief executive officer of Willamette. Mr. McDougall received a B.S. in accounting from Oregon State University. Mr. McDougall is also a member of the boards of directors of FPH, The Greenbrier Companies and StanCorp Financial Group, Inc. Mr. McDougall was a member of the boards of directors of Cascade Corporation, InFocus Corporation and West Coast Bancorp; he no longer serves on these boards. Mr. McDougall's experience as the CEO of a major forest products company provides our board of directors with valuable insight on operational and industry issues.
Richard H. Fleming, Director
Mr. Fleming has served as one of our directors since our initial public offering in February 2013. Mr. Fleming was the executive vice president and chief financial officer of USG Corporation from 1999 until his retirement in 2012. USG is a leading manufacturer and distributor of high performance building systems for the construction and remodeling industries. Prior to joining USG, Mr. Fleming was employed by Masonite Corporation, which was acquired by USG in 1984. During his 39-year career with Masonite and USG, Mr. Fleming held various operating and finance positions and was USG's chief financial officer for approximately 18 years. Mr. Fleming received a B.S. in economics from the University of the Pacific in Stockton, California, and an MBA with finance specialization from the Tuck School of Business at Dartmouth College. Mr. Fleming is a member of the boards of directors of Columbus McKinnon Corporation, Optim Energy, LLC and in3media, inc. He is also an advisory board member of AlphaZeta Interactive. In June 2001, USG Corp. filed a voluntary petition for reorganization under Chapter 11 of the U.S. Bankruptcy Code in the U.S. Bankruptcy Court for the District of Delaware. USG Corp. emerged from its Chapter 11 reorganization proceedings as a result of the bankruptcy court's confirmation of a related plan of reorganization, which became effective on June 20, 2006. Mr. Fleming provides strong finance skills to our board of directors.
John W. Madigan, Director
Mr. Madigan has served as one of BC Holdings' directors since January 2005. He became one of our directors in February 2013 in connection with our initial public offering. In December 2003,
88
Mr. Madigan retired from Tribune Company, where he had served as chairman and chief executive officer since 1996. Tribune Company operates businesses in publishing, interactive media and broadcasting. Mr. Madigan currently serves as an advisor to Madison Dearborn. Mr. Madigan's experience in directing the operations of a major corporation provides our board of directors with perspective on operating issues. Mr. Madigan holds bachelor's and master's degrees in business administration from the University of Michigan. Mr. Madigan is a member of the board of directors of Gilead Sciences, Inc. Mr. Madigan was a member of the boards of directors of Morgan Stanley and AT&T Wireless; he no longer serves on these boards.
Christopher J. McGowan, Director
Mr. McGowan has served as one of BC Holdings' directors since October 2004. He became one of our directors in February 2013 in connection with our initial public offering. In September 2011, he became a general partner of CJM Ventures, L.L.C. and OPTO Holdings, L.P., and in July 2012 became a controlling member of Content Support Company, LLC. In the spring of 2012, Mr. McGowan served as a faculty advisor to The University of Chicago Booth School of Business and currently serves as Entrepreneur in Residence and Senior Advisor there. From 1999 until 2011, he was employed by Madison Dearborn and served as a managing director concentrating on investments in the basic industries sector. Prior to joining Madison Dearborn, Mr. McGowan was with AEA Investors, Inc. and Morgan Stanley & Co. Incorporated. Mr. McGowan received a B.A. from Columbia University and an M.B.A. from the Harvard Graduate School of Business Administration. Mr. McGowan currently serves on the boards of directors of OPTO International, Inc. and FPH. Mr. McGowan also serves on the board of directors of the University of Chicago Laboratory Schools. He is also a member of Hyde Park Angels and serves on their Portfolio Advisory Board as well as Chairman of the Limited Partner Advisory Committee for Hyde Park Venture Partners. Mr. McGowan was a member of the boards of directors of BWAY Holding Company in 2010-2011, the Illinois Venture Capital Association in 2009-2011, First Wind Partners in 2009 and Smurfit Kappa Group Ltd. (formerly known as Jefferson Smurfit Group); he no longer serves on these boards. Mr. McGowan provides strong finance skills to our board of directors.
Samuel M. Mencoff, Director
Samuel M. Mencoff has served as one of BC Holdings' directors since October 2004. He became one of our directors in February 2013 in connection with our initial public offering. Mr. Mencoff has been employed by Madison Dearborn since 1992 and currently serves as co-CEO. Prior to co-founding Madison Dearborn, Mr. Mencoff was employed by First Chicago Venture Capital for 11 years. Mr. Mencoff has approximately 30 years of experience in private equity investing with a particular focus on investments in the basic industries sector. Mr. Mencoff received an A.B. from Brown University and an M.B.A. from the Harvard Graduate School of Business Administration. Mr. Mencoff is a former member of the board of directors of Great Lakes Dredge & Dock Corporation, and he has served on the boards of directors of numerous other public and private companies. He is currently a member of the boards of directors of FPH, Packaging Corporation of America, Smurfit Kappa Group, Ltd. (formerly known as Jefferson Smurfit Group), and Nuveen Investments, Inc. Mr. Mencoff is also a member of the board of directors of World Business Chicago, a not-for-profit economic development organization based in Chicago, Illinois, the Watson Institute for International Studies, NorthShore University HealthSystem, and a member of the board of trustees of Brown University and the Art Institute of Chicago. Mr. Mencoff provides strong finance skills to our board of directors and valuable experience gained from previous board service.
89
Matthew W. Norton, Director
Mr. Norton has served as one of BC Holdings' directors since December 2008. He became one of our directors in February 2013 in connection with our initial public offering. Mr. Norton has been employed by Madison Dearborn since 2008 and currently serves as a director. From August 2006 to May 2008, Mr. Norton attended The Wharton School of the University of Pennsylvania. From 2004 to August 2006, he was employed by Madison Dearborn as an associate. From 2001 to 2004, he was employed by Merrill Lynch. Mr. Norton received a B.S. and an M.B.A. from The Wharton School of the University of Pennsylvania. Mr. Norton was also a member of the board of directors of Boise Inc. until January 2010, and he is a current member of the boards of directors of FPH, CoVant Technologies II, LLC, Fieldglass, Inc., Taupo Holding, Inc. and National Financial Partners Corp. Mr. Norton provides strong finance skills to our board of directors.
Thomas S. Souleles, Director
Mr. Souleles has served as one of BC Holdings' directors since October 2004. He became one of our directors in February 2013 in connection with our initial public offering. Mr. Souleles has been employed by Madison Dearborn since 1995 and currently serves as a managing director concentrating on investments in the basic industries sector. Prior to joining Madison Dearborn, Mr. Souleles was with Wasserstein Perella & Co., Inc. Mr. Souleles received an A.B. from Princeton University, a J.D. from Harvard Law School, and an M.B.A. from the Harvard Graduate School of Business Administration. Mr. Souleles is also a member of the boards of directors of FPH, Packaging Corporation of America, Schrader International, Inc. and Children's Hospital of Chicago Medical Center and of the board of trustees of the National Multiple Sclerosis Society, Greater Illinois Chapter. Mr. Souleles was a member of the boards of directors of Boise Inc., Magellan GP, LLC, Magellan Midstream Holdings GP, LLC, Great Lakes Dredge & Dock Corporation, US Power Generating Company and BWAY Holding Company; he no longer serves on these boards. Mr. Souleles provides strong finance skills to our board of directors.
Controlled Company
For purposes of the NYSE rules, we are a "controlled company." Controlled companies under those rules are companies of which more than 50% of the voting power for the election of directors is held by an individual, a group, or another company. BC Holdings, which is controlled by FPH, and ultimately, by a fund managed by Madison Dearborn, currently controls more than 50% of the combined voting power of our common stock and has the right to designate a majority of the members of our board of directors for nomination for election and the voting power to elect such directors following our initial public offering. Accordingly, we have been eligible to, and have taken advantage of certain exemptions from corporate governance requirements provided in the NYSE rules. Specifically, as a controlled company, we have not been required to have (i) a majority of independent directors, (ii) a Nominating/Corporate Governance Committee composed entirely of independent directors, (iii) a Compensation Committee composed entirely of independent directors, or (iv) an annual performance evaluation of the Nominating/Corporate Governance and Compensation Committees. Therefore, we do not have a majority of independent directors, our Nominating/Corporate Governance and Compensation Committees do not consist entirely of independent directors, and such committees are not subject to annual performance evaluations. Upon completion of this offering, we will cease to be a controlled company and we will have one year from the date we cease to be a controlled company to comply with all of NYSE's corporate governance requirements. Accordingly, you will not have the same protections afforded to stockholders of companies that are subject to all of the applicable NYSE rules until the phase-in period expires.
The controlled company exemption does not modify the independence requirements for the Audit Committee, and we are in compliance with the requirements of the Sarbanes-Oxley Act and the
90
NYSE rules, which require that our Audit Committee be composed of at least three members, one of whom is independent upon the listing of our common stock on the NYSE, a majority of whom are required to be independent within 90 days of the date of the effectiveness of the registration statement for our initial public offering, and each of whom are required to be independent within one year of the date of such registration statement.
Board Composition
Our board of directors consists of eight directors. The authorized number of directors may be changed by resolution of our board of directors. Vacancies on our board of directors can be filled by resolution of our board of directors. Our board of directors is divided into three classes, each serving staggered, three-year terms:
- •
- Our Class I directors are Thomas E. Carlile and Duane C. McDougall, and their terms will expire at the 2014 annual
meeting of stockholders;
- •
- Our Class II directors are Richard H. Fleming, Christopher J. McGowan and John W. Madigan, and their terms will
expire at the 2015 annual meeting of stockholders; and
- •
- Our Class III directors are Samuel M. Mencoff, Matthew W. Norton and Thomas S. Souleles, and their terms will expire at the 2016 annual meeting of stockholders.
As a result, only one class of directors are elected at each annual meeting of stockholders, with the other classes continuing for the remainder of their respective terms.
We entered into a Director Nomination Agreement with BC Holdings on February 11, 2013, that provides BC Holdings the right to designate nominees for election to our board of directors for so long as BC Holdings beneficially owns 10% or more of the total number of shares of our common stock then outstanding. MDCP IV may cause BC Holdings to assign its designation rights under the Director Nomination Agreement to MDCP IV or to an MDCP IV affiliate so long as MDCP IV and its affiliates are the beneficial owners of 50% or more of BC Holding's voting equity interests.
The number of nominees that BC Holdings is entitled to designate under this agreement will bear the same proportion to the total number of members of our board of directors as the number of shares of common stock beneficially owned by BC Holdings bears to the total number of shares of common stock outstanding, rounded up to the nearest whole number. In addition, BC Holdings shall be entitled to designate the replacement for any of its board designees whose board service terminates prior to the end of the director's term regardless of BC Holdings' beneficial ownership at such time. BC Holdings shall also have the right to have its designees participate on committees of our board of directors proportionate to its stock ownership, subject to compliance with applicable law and stock exchange rules. This agreement will terminate at such time as BC Holdings owns less than 10% of our outstanding common stock.
Messrs. Madigan, McGowan, Mencoff, Norton, Souleles and Fleming were appointed as the nominees of BC Holdings to our board of directors in accordance with the terms of the Director Nomination Agreement.
Committees of the Board of Directors
The standing committees of our board of directors consist of an Audit Committee, a Compensation Committee and a Corporate Governance and Nominating Committee. Each of the committees report to the board of directors as they deem appropriate and as the board may request. The composition, duties and responsibilities of these committees are set forth below.
91
Audit Committee
The Audit Committee is responsible for, among other matters: (1) appointing, retaining and evaluating our independent registered public accounting firm and approving all services to be performed by them; (2) overseeing our independent registered public accounting firm's qualifications, independence and performance; (3) overseeing the financial reporting process and discussing with management and our independent registered public accounting firm the interim and annual financial statements that we file with the SEC; (4) reviewing and monitoring our accounting principles, accounting policies, financial and accounting controls, and compliance with legal and regulatory requirements; (5) establishing procedures for the confidential anonymous submission of concerns regarding questionable accounting, internal controls or auditing matters; and (6) reviewing and approving related-person transactions.
Our Audit Committee consists of Messrs. Fleming, Madigan and McGowan. We believe that each member of our Audit Committee qualifies as an independent director according to the rules and regulations of the SEC with respect to audit committee membership. We also believe that Mr. McGowan qualifies as our "audit committee financial expert," as such term is defined in Item 401(h) of Regulation S-K. Our board of directors adopted a written charter for the Audit Committee, which is available on our corporate website at www.bc.com. Our website is not part of, and is not incorporated by reference to, this prospectus.
Compensation Committee
The Compensation Committee is responsible for, among other matters: (1) reviewing key employee compensation goals, policies, plans and programs; (2) reviewing and approving the compensation of our directors, chief executive officer and other executive officers; (3) reviewing and approving employment agreements and other similar arrangements between us and our executive officers; and (4) administering our stock plans and other incentive compensation plans.
Our Compensation Committee consists of Messrs. Madigan, McDougall, Mencoff and Souleles. Our board of directors adopted a written charter for the Compensation Committee, which is available on our corporate website at www.bc.com. Our website is not part of this prospectus.
Corporate Governance and Nominating Committee
Our Corporate Governance and Nominating Committee is responsible for, among other matters: (1) identifying individuals qualified to become members of our board of directors, consistent with criteria approved by our board of directors; (2) overseeing the organization of our board of directors to discharge the board's duties and responsibilities properly and efficiently; (3) identifying best practices and recommending corporate governance principles; and (4) developing and recommending to our board of directors a set of corporate governance guidelines and principles applicable to us.
Our Corporate Governance and Nominating Committee consists of Messrs. Carlile, McDougall, Norton and Souleles. Our board of directors adopted a written charter for the Corporate Governance and Nominating Committee, which is available on our corporate website at www.bc.com. Our website is not part of, and is not incorporated by reference to, this prospectus.
Compensation Committee Interlocks and Insider Participation
During 2012, no officer or employee served as a member of BC Holdings' Compensation Committee, except for Mr. McDougall, who was employed by the company to act as the chairman of its board of directors until his resignation from employment effective December 31, 2012. See "Executive Compensation—Director Compensation" for a description of Mr. McDougall's employment agreement. None of our executive officers currently serve, or in the past year has served, as a member of the
92
compensation committee of any entity that has one or more executive officers serving on our board of directors or Compensation Committee or as a director of any entity that has one or more executive officers serving on our Compensation Committee.
Other Committees
Our board of directors may establish other committees as it deems necessary or appropriate from time to time.
Risk Oversight
Our board of directors oversees the risk management activities designed and implemented by our management. The board of directors executes its oversight responsibility for risk management both directly and through its committees. The full board of directors also considers specific risk topics, including risks associated with our strategic plan, business operations and capital structure. In addition, the board of directors receives detailed regular reports from members of our senior management and other personnel that include assessments and potential mitigation of the risks and exposures involved with their respective areas of responsibility.
Our board of directors delegates to the Audit Committee oversight of our risk management process. Our other board committees also consider and address risk as they perform their respective committee responsibilities. All committees report to the full board of directors as appropriate, including when a matter rises to the level of a material or enterprise-level risk.
Family Relationships
There are no family relationships among any of our executive officers or any of our directors.
Code of Ethics
We have adopted a Code of Ethics that applies to all of our employees, including our chief executive officer, chief financial officer and principal accounting officer. Our Code of Ethics is available on our website at www.bc.com by clicking on About Boise Cascade and then Code of Ethics. Our website is not part of, and is not incorporated by reference to, this prospectus. If we amend or grant a waiver of one or more of the provisions of our Code of Ethics, we intend to satisfy the requirements under Item 5.05 of Item 8-K regarding the disclosure of amendments to or waivers from provisions of our Code of Ethics that apply to our principal executive officer and financial and accounting officers by posting the required information on our website at the above address.
93
Compensation Discussion and Analysis
Named Executive Officers
Our Named Executive Officers for 2012 and the positions they held with the company as of December 31, 2012, are:
Thomas E. Carlile—Chief Executive Officer
Wayne M. Rancourt—Senior Vice President, Chief Financial Officer and Treasurer
Stanley R. Bell—President, Building Materials Distribution
Thomas A. Lovlien—President, Wood Products Manufacturing
John T. Sahlberg—Senior Vice President, Human Resources and General Counsel
Throughout this section, the term "Named Executive Officer" is intended to refer to the individuals identified above. The term "Officer" is intended to refer to those executive officers holding the title of Vice President, Senior Vice President, President, or Chief Executive Officer, all of whom are identified in "Management."
Summary of Key Events
The major compensation events affecting our Named Executive Officers during 2012 were as follows:
1. In February 2012, the Compensation Committee confirmed the long-term incentive plan ("LTIP") awards for 2011 calculated under the terms of the plan and directed payment of the initial installment of the 2011 awards. In addition, in February 2012, Award Notices for the 2012 iteration of the plan were approved by the committee. In February 2013, the Compensation Committee confirmed the LTIP awards for 2012 calculated under the terms of the plan and directed payment of the initial installment of the 2012 awards.
2. In February 2012, the Compensation Committee approved award payments to our Named Executive Officers and other participants for amounts earned under our annual, short-term Incentive and Performance Plan ("STIP") for the 2011 plan year. The committee also approved issuance by the company of Award Notices under the plan, which established the criteria for 2012 awards for our Named Executive Officers and other participants in the plan. In February 2013, the committee approved award payments to our Named Executive Officers and other participants for amounts earned under the STIP for the 2012 plan year and approved issuance of Award Notices under the plan, which establish the criteria for 2013 awards to our Named Executive Officers and other participants in the plan.
3. Effective August 1, 2012, the Compensation Committee approved salary increases for existing officers and promoted Mr. Sahlberg to Senior Vice President, Human Resources and General Counsel.
4. Effective December 31, 2012, Mr. McDougall resigned as an employee of the company but remains nonemployee Chairman of the Board.
94
Executive Compensation Program Objective
Our Compensation Committee's overall objective for our Named Executive Officers' compensation is to establish a package that will:
- •
- Provide aggregate compensation that reflects the market compensation for executives with similar responsibilities with due
adjustment to reflect the experience, performance and other distinguishing characteristics of specific individuals.
- •
- Align compensation with the company's performance on both a short-term and long-term basis;
- •
- Link each Named Executive Officer's compensation to his performance and the areas for which he is responsible;
- •
- Attract, motivate, reward and retain the broad-based management talent critical to achieving the company's business goals;
and
- •
- Align the interests of our Named Executive Officers with those of our equity owners through their ownership of equity interests of the company.
What the Compensation Program Is Designed to Reward
The compensation program as a whole is designed to provide a base level of compensation that will attract and retain the broad-based management talent the Compensation Committee believes is essential to achieving the company's strategic objectives and to reward, with short-term and long-term compensation, performance by its Named Executive Officers that maintains and creates value for our equity investors. Although we anticipate that the specific details of our executive compensation and benefits may be altered from time to time to reflect our corporate structure, economic conditions, changes in the market for executive talent, our business strategies and regulatory changes, the overall objective of our compensation and benefits package will remain substantially the same over time.
Use of Market Data to Determine Amount and Allocation of Compensation
The compensation committee believes that an important criterion for the determination of the aggregate value of the company's compensation program and the allocation of such value among the various elements of its compensation plans is market data on the amounts, allocations and structures utilized by similarly situated companies for positions of comparable responsibility.
Management and the Compensation Committee have historically utilized compensation and benefits surveys to ascertain market levels of aggregate compensation and the allocation of that compensation among specific compensation elements for its Named Executive Officers. Aggregate compensation and each of the major elements (base salary, STIP compensation and LTIP compensation) for the company's Named Executive Officers had been targeted at the 50th percentile of the surveyed companies. However, the specific aggregate compensation (and the allocation thereof among the elements of such total compensation) paid to any of our Named Executive Officers may be below or above the 50th percentile target levels, depending on subjective judgments made by the Compensation Committee based on factors such as the specific Officer's tenure with the company and in his position, responsibilities that vary from the benchmark position and historical performance in the job.
In 2011, the committee retained the services of Frederic W. Cook & Co. ("Frederic Cook"), a compensation consultant, to prepare a comprehensive analysis of the company's compensation packages for its Named Executive Officers and to compare the specific elements of compensation and the aggregate value with a group of peer companies selected by the consultant. The peer companies consisted of Ainsworth Lumber Co.; Associated Materials Incorporated; Beacon Roofing Supply, Inc.;
95
BlueLinx, Inc.; Builders FirstSource, Inc.; Canfor Corporation; Eagle Materials, Inc.; International Forest Products Corporation; Louisiana-Pacific Corporation; Norbord Ltd.; Nortek, Inc.; Ply Gem Holdings, Inc.; Simpson Manufacturing Company, Inc.; Universal Forest Products, Inc.; and West Fraser Timber Co. Ltd. Based on revenues, EBITDA, market capitalization, enterprise value and one-year and three-year annualized shareholder return data of the company and the selected peer companies, Frederic Cook concluded that the company's enterprise value and estimated market capitalization were generally in the median range. In 2011, the aggregate compensation paid to each of Messrs. Bell and Lovlien was above the 50th percentile target levels in light of their respective years of experience in the positions in which they serve. The aggregate compensation paid to Messrs. Carlile, Sahlberg and Rancourt was at or beneath such 50th percentile target levels in light of their respective experience levels in the positions in which they serve, each of which was less than that of Messrs. Bell and Lovlien. The Compensation Committee used the results of this study, along with the continuing depressed conditions in our product markets, to guide it in determining not to make any changes in Named Executive Officer compensation in 2011. The committee used the 2011 Frederic Cook study as the basis for the salary increases approved in July 2012 given the company's improved business performance.
Executive Compensation Program Elements
The five elements of the company's executive compensation program are:
- •
- Base salary;
- •
- STIP;
- •
- Discretionary bonus awards;
- •
- LTIP; and
- •
- Other compensation and benefit plans.
Role of Management in Setting Executive and Director Compensation
As described above, the Compensation Committee increased the compensation of executives in 2012. Management did not participate in that decision. The company's Chief Executive Officer makes recommendations to the Compensation Committee with respect to performance targets for the company's STIP and LTIP. All decisions with respect to such targets are approved by the Compensation Committee. Management does not participate in setting director compensation.
Base Salary
The company provides a base salary to officers to attract and retain talented and experienced individuals to provide management and leadership services to the company.
The committee customarily reviews base salaries for Named Executive Officers annually and at the time of promotions or other changes in responsibilities. Because of the extreme adverse conditions in the company's product markets for the years prior to 2012 covered in this filing, the Compensation Committee had not approved a general wage increase for the Named Executive Officers until 2012. The Compensation Committee approved an increase to Mr. Rancourt's base salary in February 2013, effective as of March 1, 2013. In prior years, the committee had approved the following changes to reflect promotions: a promotional increase was granted to Mr. Rancourt when he became Senior Vice President, Chief Financial Officer and Treasurer in 2009, and one was granted to Mr. Carlile when he became Chief Executive Officer in 2009. The Compensation Committee arrived at the base salaries granted Mr. Carlile and Mr. Rancourt on the basis of a comparative analysis of the base salaries
96
accorded their predecessors, along with their relative levels of experience and the current structure of the company, rather than a comprehensive review of new market data.
STIP
The STIP is designed to recognize and reward the contributions that Named Executive Officers and other participants have made to the company's annual performance. The plan does this by linking a portion of the annual cash compensation of each participant to performance measures that are expected to positively affect the company's annual financial performance. We offer this plan to encourage and reward conduct that will lead to better performance of our businesses as measured by the criteria used for determining award amounts. Each individual's participation in the plan, along with the criteria for calculation of the payout to such participant, is established annually by action of our Compensation Committee and communicated to the participants in a STIP Award Notification ("Award Notice"). A determination of the amount payable under the plan on account of the year is made by the Compensation Committee, and the resulting payments ("Awards") are made to participants.
2012 STIP Compensation
For 2012, each of our Named Executive Officers participated in the STIP. The plan provided for Awards to be calculated as a percentage of base salary, based on the extent to which the financial goals and performance objectives were met during the year, and on the exercise of the Compensation Committee's discretion. The 2012 annual incentive Award targets for our Named Executive Officers were as follows:
Officer
|
Target Award as a Percentage of Base Salary |
|||
|---|---|---|---|---|
Thomas E. Carlile |
100 | % | ||
Wayne M. Rancourt |
55 | % | ||
Stanley R. Bell |
55 | % | ||
Thomas A. Lovlien |
55 | % | ||
John T. Sahlberg(1) |
49 | % | ||
- (1)
- The BC Holdings Compensation Committee increased Mr. Sahlberg's 2012 STIP target as a percentage of base compensation from 45% to 55% effective August 1, 2012, when he was promoted to a senior vice president. His target was prorated to determine his 2012 STIP Award.
The actual Awards may be less than or greater than the target incentive amounts depending on the achievement of predetermined financial goals and performance objectives and the exercise of the Compensation Committee's discretion. Awards for each Officer ranges from a threshold of 25% of the target Award through a maximum of 225% of the target Award, depending on financial goals achieved for 2012. The dollar amount of the threshold, target and maximum Award payable to each of our Named Executive Officers is set out in the table found under "—Grants of Plan-Based Awards."
97
The annual financial goals required for each of our Named Executive Officers under our 2012 STIP were as follows:
Officer
|
Financial Criteria | Requirement For Threshold Payment $ or % |
Requirement For Target Payment $ or % |
Requirement For Maximum Payment $ or % |
||||||||
|---|---|---|---|---|---|---|---|---|---|---|---|---|
| |
|
(in millions, except PRONWC) |
||||||||||
Thomas E. Carlile |
100% Corporate EBITDA | $ | 5 | $ | 50 | $ | 135 | |||||
Wayne M. Rancourt |
100% Corporate EBITDA | 5 | 50 | 135 | ||||||||
Stanley R. Bell |
25% Corporate EBITDA | 5 | 50 | 135 | ||||||||
|
37.5% BMD Division EBITDA | 10 | 30 | 70 | ||||||||
|
37.5% BMD Division PRONWC | 1.0 | % | 11.3 | % | 24.0 | % | |||||
Thomas A. Lovlien |
25% Corporate EBITDA | 5 | 50 | 135 | ||||||||
|
75% Wood Products Division | 10 | 40 | 90 | ||||||||
John T. Sahlberg |
100% Corporate EBITDA | 5 | 50 | 135 | ||||||||
EBITDA means earnings before interest (interest expense and interest income), income taxes and depreciation and amortization at the corporate or division level as indicated in the table above and adjusted in each case for special items. PRONWC means pretax return on net working capital. It is calculated by dividing Building Materials Distribution segment net operating income by the segment's average net working capital reported as of each month-end during a 13-month period running from December 2011 through December 2012, adjusted in each case for special items. The Compensation Committee believes that EBITDA adjusted for special items represents a financial measure that closely approximates the value delivered by management to the company's equity owners and is a key measure of performance frequently used by the company's debt holders. The Compensation Committee included PRONWC as a portion of Mr. Bell's performance criteria because it reflects his division's control of its working capital, which is a critical financial measure in our distribution business. In 2012, the Corporate EBITDA, Building Materials Distribution EBITDA and Wood Products EBITDA were $96.6 million, $32.9 million and $80.2 million, respectively, resulting in aggregate payments to each of our Named Executive Officers ranging from 1.26 to 1.93 times target under the STIP for 2012.
At the board meeting in February 2013, both our board of directors and our Compensation Committee confirmed the payment to each of our Named Executive Officers of an Award that was calculated in accordance with the plan's metrics. The amounts approved by the committee for payment to each of the Named Executive Officers pursuant to the 2012 plan are reported in the column titled "Non-Equity Incentive Plan Compensation" in the "Summary Compensation Table."
2013 STIP Compensation
At the board meeting in February 2013, both the board and the Compensation Committee approved the details of the company's 2013 STIP. At the time of adoption in February 2013, no changes were made to the plan document or the methods for calculating the financial criteria to be used in determining each Named Executive Officer's Award under the plan.
2012 Bonus Payments
From time to time, the company may elect to grant a discretionary bonus to one or more of the Officers or other employees to recognize and reward exemplary performance providing value to the company that is not recognized by the structure of the company's STIP. These bonus payments are not governed by any formal plan, and no Officer has any contractual entitlement or expectation of any such payment. The amount and timing of the grant of any such bonus to Named Executive Officers are
98
determined by the Compensation Committee at its sole discretion. No ad hoc bonuses were paid to any of our Named Executive Officers as compensation for 2012.
Long-Term Incentive Compensation (Management Equity Plan and LTIP)
We have two long-term incentive plans that are included in the compensation information for our Named Executive Officers: the Management Equity Plan ("MEP") and the 2010, 2011 and 2012 LTIP programs. The MEP ended on December 31, 2010, as discussed below. As a result, no Named Executive Officer received any compensation from the MEP plan in 2011 or 2012. The LTIP ended on December 31, 2012. The Boise Cascade board of directors approved an incentive compensation plan in connection with our initial public offering, which replaces the LTIP, as further discussed under "—2013 Incentive Plan."
MEP
In 2004, shortly after the completion of our acquisition of the forest products and paper assets of OfficeMax (the "Forest Products Acquisition"), FPH offered members of management ("Management Investor") an opportunity to purchase equity interests in FPH. In 2006 and 2009, FPH issued units to a limited group of individuals, including two of our directors. The terms of the FPH equity interests held by management are governed by a series of Management Equity Agreements between FPH, Madison Dearborn and each of the Management Investors, which collectively constitute the "MEP."
The MEP contains many of the features typical of an investor rights agreement for a closely held company. FPH may, but is not required to, purchase from the Management Investor his or her equity units upon termination of the Management Investor's employment with the company (or service on the board of directors) at a formula price intended to approximate the fair market value of the equity units being repurchased (with due allowance for the relevant participation threshold applicable to such equity units). A Management Investor may require FPH to exercise its option to repurchase his or her equity units upon termination of employment with the company (or service on its board of directors) only if such termination arises from either (i) the death or permanent disability of the Management Investor or (ii) the sale of a division of the company.
LTIP
In October 2009, our Compensation Committee adopted the LTIP that was in place for 2012, 2011 and 2010. The terms of the LTIP contemplated the annual grant to participants by the company of an opportunity to earn a cash Award conditioned upon achievement of specified financial goals established by the Compensation Committee. The plan provided that the identity of participants and the terms under which each year's Award were to be calculated and paid were to be set by the Compensation Committee and communicated to participants in an Award Notice, with the resulting payments calculated by the Compensation Committee once the company's performance against the relevant financial criteria was determined.
In February 2012, the Compensation Committee approved Award Notices under the LTIP for a group of the company's senior managers, including each of its Named Executive Officers. The Award Notices enabled each such Officer an opportunity to earn a cash Award determined on the basis of a target percentage of the Officer's base salary (as specified in the Award Notice) and the company's 2012 achievement against corporate EBITDA goals set forth in the Award Notice. The Award for each Officer ranges from a threshold of 50% of the target Award through a maximum of 200% of the target Award, depending on corporate EBITDA achieved for 2012. Although the amount of the Award was determined on the basis of the company's 2012 financial performance, the resulting Award will be paid in three equal installments, which will be payable no later than March 15, 2013, 2014 and 2015. To earn
99
each installment of the Award, a participant must remain an employee of the company through December 31 of the year preceding the due date of the payment, provided that participants who are retirement-eligible or who in fact retire prior to such vesting dates will nonetheless be treated as fully vested in all three installments. If, in any plan year, the company and its service providers are subject to the provisions of Internal Revenue Code Section 457A, participants who meet the plan's definition of "retirement eligible" will receive an accelerated distribution (the Section 457A Accelerated Payment) equal to 40% of the deferred installments of the Award for such plan year. The purpose of this accelerated payment of a portion of the deferred installments is to enable such participants to pay taxes on the imputed income for the deferred installments, which Internal Revenue Code Section 457A imposes on the deferred installments. Plan participants are retirement-eligible if they are: 1) age 62 or older and have ten years of service or 2) are age 65 or older.
In considering the LTIP and the 2012 Award Notices, the Compensation Committee recognized that management's ownership of FPH equity units under the Management Equity Plan will continue to provide an incentive that aligns management's interests with those of the company's equity owners. However, it also recognized that with the expiration of the vesting provisions of that structure, an additional long-term incentive component was required to maintain competitive compensation levels, provide a retention incentive and provide adequate alignment of management's and equityholders' interests.
The target Awards for 2012, expressed as a percentage of base salary, for each of our Named Executive Officers are disclosed in the table below:
Officer
|
Target Award as a Percentage of Base Salary |
|||
|---|---|---|---|---|
Thomas E. Carlile |
100 | % | ||
Wayne R. Rancourt |
50 | % | ||
Stanley R. Bell |
50 | % | ||
Thomas A. Lovlien |
50 | % | ||
John T. Sahlberg |
50 | % | ||
The annual financial goals required for each of our Named Executive Officers under our 2012 LTIP were as follows:
Officer
|
Financial Criteria | Requirement For Threshold Payment $ |
Requirement For Target Payment $ |
Requirement For Maximum Payment $ |
||||||||
|---|---|---|---|---|---|---|---|---|---|---|---|---|
| |
|
(in millions) |
||||||||||
Thomas E. Carlile |
100% Corporate EBITDA | $ | 10 | $ | 60 | $ | 150 | |||||
Wayne M. Rancourt |
100% Corporate EBITDA | 10 | 60 | 150 | ||||||||
Stanley R. Bell |
100% Corporate EBITDA | 10 | 60 | 150 | ||||||||
Thomas A. Lovlien |
100% Corporate EBITDA | 10 | 60 | 150 | ||||||||
John T. Sahlberg |
100% Corporate EBITDA | 10 | 60 | 150 | ||||||||
EBITDA means earnings before interest (interest expense and interest income), income taxes and depreciation and amortization as indicated in the table above and adjusted in each case for special items. The Compensation Committee believed that EBITDA adjusted for special items represented a financial measure that closely approximated the value delivered by management to the company's equity owners and was a key measure of performance frequently used by the company's debt holders. Corporate EBITDA was $96.6 million in 2012, resulting in aggregate payments to each of our Named Executive Officers equal to 141% of target under the LTIP for such year.
100
In February 2013, Awards, calculated in accordance with the metrics of the LTIP and the 2012 Award Notices and the company's 2012 financial performance, were confirmed by the board of directors and the Compensation Committee, and payments of initial installments of such 2012 Awards were authorized. In addition, payments of Section 457A Accelerated Payments to a Named Executive Officer who was retirement-eligible were authorized. The amount of such payment authorized for the Named Executive Officer is disclosed in the column titled "Non-Equity Incentive Plan Compensation" in the "Summary Compensation Table" and the explanatory footnote to such column.
Other Compensation and Benefit Plans
The company's Named Executive Officers receive additional compensation in the form of payments, allocations, or accruals under various other compensation and benefit plans. These plans and benefits, which are described below, are provided to ensure that we are providing an aggregate compensation and benefits package that is competitive in the marketplace, thereby ensuring that we can attract and retain the management talent needed to achieve the company's strategic objectives.
Defined Benefit Pension Benefits
We maintain a frozen defined benefit pension plan, referred to as the Salaried Pension Plan ("SPP"), as well as frozen supplemental pension plans for certain salaried employees, including each of the Named Executive Officers.
Our SPP entitles each vested employee to receive an annual pension benefit at normal retirement age equal to 1.25% of the average of the highest five consecutive years of compensation out of the last ten years of employment through December 31, 2009, multiplied by the participant's years of service through December 31, 2003, plus 1% of the average of such benchmark compensation level multiplied by the participant's years of service from December 31, 2003, through December 31, 2009. Under the SPP, "compensation" is defined as the employee's taxable base salary plus any taxable amounts earned under our annual variable incentive compensation programs. Benefits are computed on a straight-line annuity basis and are not offset by Social Security or other retirement-type benefits. An employee is 100% vested in his or her pension benefit after five years of unbroken service. Our Compensation Committee froze the company's salaried pension plans effective December 31, 2009. Accordingly, no further benefits have been earned under this plan since that date.
If prior to the freezing of the SPP, an employee earned income in excess of the limits provided under the Internal Revenue Code for qualified plans, or if income was deferred under the company's deferred compensation plan and not taxed (and therefore not counted for purposes of the benefit amount calculation under the qualified SPP), the excess benefits will be paid from the company's general assets under our unfunded, nonqualified Supplemental Pension Plan ("SUPP"). Because the benefit definition in the SUPP is derivative of that contained in the SPP described above, the benefit freeze adopted for the qualified plan at year end 2009 effected a similar freeze in further benefit accruals as of such date under the SUPP.
Under our unfunded, nonqualified Supplemental Early Retirement Plan ("SERP"), an Officer is eligible for benefits under the plan if he or she: (i) was an Officer of OfficeMax immediately prior to Madison Dearborn's acquisition of the forest products and paper assets from OfficeMax (the Forest Products Acquisition); (ii) is 55 years old or older (or 58 years old or older for Officers elected on or after June 1, 2004 and before October 29, 2004); (iii) has ten or more years of service; (iv) has served as an Officer for at least five full years; and (v) retires before the age of 65. Eligible Officers retiring prior to age 65 receive an early retirement benefit from the SERP which, in combination with their benefit under the SPP and the SUPP, equals the benefit calculated under the SPP and the SUPP without reduction due to the Officer's early retirement. Because the benefit definition in the SERP is derivative of that contained in the SPP described above, the benefit freeze adopted for the qualified
101
plan at year-end 2009 effected a similar freeze in further benefit accruals as of such date under the SERP. Benefits payable under the SERP are offset in part by benefits payable under a similar plan maintained by OfficeMax. Messrs. Carlile and Lovlien are currently eligible for early retirement under the SERP. Mr. Rancourt will become eligible for benefits under the SERP when he reaches age 58. Mr. Bell's age permits him to retire with unreduced benefits under our SPP and the SUPP, and accordingly, he does not participate in the SERP.
Changes in the aggregate defined benefit pension present values for each of our Named Executive Officers are disclosed in footnote 5 to the "Summary Compensation Table," and the present value of accumulated benefits at December 31, 2012, under each such plan is disclosed with respect to each Named Executive Officer in the table under the heading "—Compensation Discussion and Analysis—Pension Benefits."
401(k) Plan
The company maintains a 401(k) defined contribution savings plan for all of its U.S. salaried employees, including its Named Executive Officers. Under the plan, eligible employees electing to participate may contribute up to 50% of their pretax income, subject to Internal Revenue Service ("IRS") rules limiting an individual's total contributions and the application of IRS tests designed to ensure that the plan does not discriminate in favor of highly compensated employees.
Since March 1, 2010, the company has provided a contribution to each salaried employee's 401(k) account for each pay period in an amount equal to 4% of the employee's eligible wages (base salary and short-term incentive compensation) for such period. In years in which the company's EBITDA exceeds targets specified by the board of directors, the company may make additional discretionary contributions in an amount equal to 2%, 3%, or 4% of the employee's wages, depending on the affected employee's number of service years. Further, the plan allows for an additional discretionary contribution of 1% for achieving a second, higher EBITDA target, also determined by the board of directors. No discretionary contributions were made for the years 2010 and 2011. However, the company made discretionary contributions in January 2013 for 2012 based on achieving both EBITDA target levels set by the board of directors. Amounts in excess of IRS annual limitations on company contributions to qualified defined contribution retirement plans are paid to participants as taxable cash compensation. All of our Named Executive Officers participate in the plan.
Amounts deferred under this plan by Named Executive Officers are included in the salary disclosure in the "Summary Compensation Table," and amounts contributed to the account of a Named Executive Officer under the plan are included in the disclosure in the "—Summary Compensation Table—All Other Compensation."
Nonqualified Deferred Compensation
Our Deferred Compensation Plan is an unfunded nonqualified defined contribution plan that was closed to further participation on December 31, 2009, as discussed below. Under the plan, participating employees irrevocably elected each year to defer receipt of a portion of their base salary and incentive compensation. A participant's account is credited with imputed interest at a rate equal to 130% of Moody's Composite Average of Yields on Corporate Bonds. Participants may receive payment of their deferred compensation plan balance in a lump sum or in monthly installments over a specified period of years following the termination of their employment with the company. Each of our Named Executive Officers is a participant in our Deferred Compensation Plan.
During 2009, management determined that the Deferred Compensation Plan was affected by the company's status as a disqualified entity under Internal Revenue Code Section 457A. As a result, the committee voted to modify the Deferred Compensation Plan to provide that for so long as the company remains a disqualified entity under Section 457A, no further compensation deferrals will be
102
made under the plan. The company has determined that it remains a disqualified entity for 2012. As a result, no further compensation was credited by the company to participant accounts during 2012, except for earnings on account balances as they existed on January 1, 2012.
Amounts deferred under this plan by, or contributed to the account under the plan in years prior to the suspension of deferrals and contributions because of Internal Revenue Code Section 457A, any of our Named Executive Officers are disclosed in the "Summary Compensation Table."
Agreements With, and Potential Payments to, Named Executive Officers
The company does not have employment agreements with any of its Named Executive Officers other than the limited agreements described below:
Severance Agreements With Messrs. Carlile, Rancourt, Bell, Lovlien and Sahlberg
Boise Cascade entered into severance agreements with each of its Named Executive Officers in February 2008, including Messrs. Carlile, Rancourt, Bell, Lovlien and Sahlberg, to maintain operating continuity in the event of a change of control. The severance agreements are effective for three years, provided that on the second anniversary and each anniversary thereafter, the term of each severance agreement is automatically extended for an additional year unless the company gives 60 days' prior notice stating otherwise. Notice was not given prior to the anniversary date in February 2013. Accordingly, the term of such agreements has now been extended to February 22, 2015. Mr. Sahlberg entered into a new severance agreement in August 2012 in connection with his appointment as our senior vice president, Human Resources and General Counsel in the same month. The company entered into revised severance agreements with each of its Named Executive Officers in December 2012 solely to bring the agreements into technical compliance with Internal Revenue Code Section 409A.
The severance agreements provide that in the event of a "qualifying termination" (meaning any termination with the exception of (i) a termination by the company for cause or disability, (ii) a termination by the employee other than for good reason (as described in the severance agreement), or (iii) termination as a result of the employee's death), an employee will be entitled to receive (a) his or her full base salary through the date of termination, a short-term incentive plan payment for the year of termination based on the plan's actual payout for the year and prorated to reflect the portion of the year expired, and all other compensation to which he or she is then entitled; (b) a lump sum severance payment equal to one or two times the sum of such employee's annual base salary plus target annual incentive bonus for the year in which the termination occurs; and (c) a lump sum amount equal to the value of such employee's unused and accrued time off, less any advanced time off, in accordance with the applicable time off policy in effect on the termination date. Additionally, the severance agreements provide, in the event of a qualifying termination, for full maintenance of healthcare and insurance benefits for a period of 12 or 18 months following the termination date (subject to payment of required contributions), payment of the premium under the company's Supplemental Life Plan for 12 or 24 months following the termination date, and if applicable, receipt of the monthly benefit that such employee would have been entitled to receive under the SERP as if such employee had satisfied the age and service requirements under the SERP as of his or her termination date. The higher levels of severance benefits are generally reserved for those officers at the level of senior vice president and higher (Messrs. Carlile, Rancourt, Bell, Lovlien and Sahlberg).
The severance agreements provide that in the event of a termination that is not a qualifying termination, such employee will be entitled to receive his or her full base salary through the date of termination, plus all other compensation to which he is then entitled. In the event of a failure to perform duties as a result of incapacity due to physical or mental illness or injury, such employee will be entitled to continue to receive his full base salary until such time as his employment is terminated
103
due to disability. No severance payments or continuation of healthcare benefits beyond the date of termination are provided for under such circumstances.
In consideration of the severance payments described above, each severance agreement contains, with respect to each employee party thereto, confidentiality and nonsolicitation provisions, as well as a provision for general release of all claims against the company and its affiliates, as a condition of payment of benefits under the severance agreement.
Retention Agreements With Messrs. Bell, Lovlien and Carlile
In August 2009, Boise Cascade entered into Retention Award Agreements with Messrs. Bell and Lovlien to help maintain experienced management during the economic downturn. Each of these agreements provided that the officer might, by maintaining his employment with Boise Cascade through a specified vesting date, earn a cash award equal to his base salary at the time of vesting of the award. The vesting date specified in the agreements was October 31, 2011, for Mr. Bell and December 31, 2012, for Mr. Lovlien. Each agreement provided that if the individual's employment terminated prior to the vesting date due to death or permanent disability, a prorated award would vest on and be payable within 90 days after such termination and that if employment is terminated due to a sale, merger, reorganization, or restructuring of all or part of Boise Cascade or a reduction in force or the sale or closure of the division which such officer heads, or for reasons other than a disciplinary reason, the full amount of the award will vest upon such termination and be payable within 90 days thereafter. Mr. Bell's agreement expired on October 31, 2011, and he was paid under the terms of that agreement, as shown in the "Bonus" column in the "Summary Compensation Table." Mr. Lovlien's agreement expired on December 31, 2012, and he was paid under the terms of that agreement, as shown in the "Bonus" column in the "Summary Compensation Table."
In September 2011, Boise Cascade entered into a three-year Retention Award Agreement with Mr. Carlile to create an additional economic incentive for Mr. Carlile to remain our Chief Executive Officer and to help provide for an orderly leadership transition at a later date. The terms of Mr. Carlile's agreement were the same as the October 2009 retention agreements detailed above, with the exceptions that Mr. Carlile's agreement runs through September 30, 2014, and the agreement provides he receive an additional payment equal to his average STIP payouts over the three years prior to the vesting date of the agreement.
Salaried Employee Life Insurance Plan and Supplemental Life Plan
The company maintains two plans under which company-paid life insurance is made available to its Officers. Under its Salaried Employee Life Insurance Plan, the company provides, at its expense during each salaried employee's period of employment, life insurance in an amount equal to the employee's base salary. Messrs. Rancourt and Sahlberg participate in this plan.
Messrs. Carlile, Bell and Lovlien participate in our Officers' Supplemental Life Plan, under which a company-paid life insurance benefit during employment is provided in an amount equal to two times the Officer's base salary. The plan also provides a postretirement life insurance benefit for such Officers equal to one times their final base salary (less any amount payable under the company's paid group term life insurance program).
Amounts paid by the company for the coverage provided to each of our Named Executive Officers is reported in the column titled "All Other Compensation" in the "Summary Compensation Table."
104
2013 Incentive Plan
In connection with our initial public offering, we adopted the 2013 Incentive Plan. The 2013 Incentive Plan provides for grants of stock options, stock appreciation rights, restricted stock, other stock-based awards, other cash-based compensation and performance awards. Directors, officers, and other employees of us and our subsidiaries, as well as others performing consulting or advisory services for us, will be eligible for grants under the 2013 Incentive Plan. The purpose of the 2013 Incentive Plan is to provide incentives that will attract, retain, and motivate high-performing officers, directors, employees, and consultants by providing them a proprietary interest in our long-term success or compensation based on their performance in fulfilling their responsibilities to our company. This summary may not include all of the provisions of the 2013 Incentive Plan.
Administration. The 2013 Incentive Plan is administered by a committee designated by our board of directors. Among the committee's powers are to (i) determine the form, amount and other terms and conditions of awards; (ii) construe or interpret any provision of the 2013 Incentive Plan or any award agreement; (iii) amend the terms of outstanding awards; and (iv) adopt such rules, guidelines and practices for administering the 2013 Incentive Plan as it deems advisable. The committee has full authority to administer and interpret the 2013 Incentive Plan, to grant discretionary awards under the 2013 Incentive Plan, to determine the persons to whom awards will be granted, to determine the types of awards to be granted, to determine the terms and conditions of each award, to determine the number of shares of common stock to be covered by each award, to make all other determinations in connection with the 2013 Incentive Plan and the awards thereunder as the committee deems necessary or desirable, and to delegate authority under the 2013 Incentive Plan to our executive officers.
Available Shares. The aggregate number of shares of common stock which may be issued or used for reference purposes under the 2013 Incentive Plan or with respect to which awards may be granted may not exceed 3,100,000 shares. The maximum number of shares of our common stock with respect to which any stock option, stock appreciation right, shares of restricted stock, or other stock-based awards that are subject to the attainment of specified performance goals and intended to satisfy Section 162(m) of the Internal Revenue Code and may be granted under the 2013 Incentive Plan during any fiscal year to any eligible individual will be 500,000 shares (per type of award); provided that the total number of shares of our common stock with respect to all such awards that may be granted under the 2013 Incentive Plan during any fiscal year to any eligible individual will be 500,000 shares. There are no annual limits on the number of shares of our common stock with respect to an award of restricted stock that are not subject to the attainment of specified performance goals to eligible individuals. The maximum number of shares of our common stock subject to any performance award which may be granted under the 2013 Incentive Plan during any fiscal year to any eligible individual will be 500,000 shares. The maximum value of a cash payment made under a performance award which may be granted under the 2013 Incentive Plan during any fiscal year to any eligible individual is $5,000,000.
The number of shares available for issuance under the 2013 Incentive Plan may be subject to adjustment in the event of a reorganization, stock split, merger, or similar change in the corporate structure or the number of outstanding shares of our common stock. In the event of any of these occurrences, we will make any adjustments we consider appropriate to, among other things, the number and kind of shares, options, or other property available for issuance under the plan or covered by grants previously made under the plan. The shares available for issuance under the plan may be, in whole or in part, either authorized and unissued shares of our common stock or shares of common stock held in or acquired for our treasury. In general, if awards under the 2013 Incentive Plan are for any reason canceled, or expire or terminate unexercised, the shares covered by such awards may again be available for the grant of awards under the 2013 Incentive Plan.
105
Eligibility for Participation. Members of our board of directors, as well as employees of, and consultants to, us or any of our subsidiaries and affiliates are eligible to receive awards under the 2013 Incentive Plan.
Award Agreement. Awards granted under the 2013 Incentive Plan are evidenced by award agreements, which need not be identical, that provide additional terms, conditions, restrictions, or limitations covering the grant of the award, including, without limitation, additional terms providing for the acceleration of exercisability or vesting of awards in the event of a change of control or conditions regarding the participant's employment, as determined by the committee.
Stock Options. The committee may grant nonqualified stock options to any individuals eligible to participate in the 2013 Incentive Plan and incentive stock options to purchase shares of our common stock only to eligible employees. The committee determines the number of shares of our common stock subject to each option; the term of each option, which may not exceed ten years, or five years in the case of an incentive stock option granted to a 10% or greater stockholder; the exercise price; the vesting schedule, if any; and the other material terms of each option. No incentive stock option or nonqualified stock option may have an exercise price less than the fair market value of a share of our common stock at the time of grant or, in the case of an incentive stock option granted to a 10% or greater stockholder, 110% of such share's fair market value. Options are exercisable at such time or times and subject to such terms and conditions as determined by the committee at grant, and the exercisability of such options may be accelerated by the committee.
Stock Appreciation Rights. The committee may grant stock appreciation rights, or "SARs," either with a stock option, which may be exercised only at such times and to the extent the related option is exercisable, or "Tandem SAR," or independent of a stock option, or "Non-Tandem SAR." A SAR is a right to receive a payment in shares of our common stock or cash, as determined by the committee, equal in value to the excess of the fair market value of one share of our common stock on the date of exercise over the exercise price per share established in connection with the grant of the SAR. The term of each SAR may not exceed ten years. The exercise price per share covered by a SAR will be the exercise price per share of the related option in the case of a Tandem SAR and will be the fair market value of our common stock on the date of grant in the case of a Non-Tandem SAR. The committee may also grant limited SARs, either as Tandem SARs or Non-Tandem SARs, which may become exercisable only upon the occurrence of a change in control, as defined in the 2013 Incentive Plan, or such other event as the committee may designate at the time of grant or thereafter.
Restricted Stock. The committee may award shares of restricted stock. Except as otherwise provided by the committee upon the award of restricted stock, the recipient generally will have the rights of a stockholder with respect to the shares, including the right to receive dividends, the right to vote the shares of restricted stock, and conditioned upon full vesting of shares of restricted stock, the right to tender such shares, subject to the conditions and restrictions generally applicable to restricted stock or specifically set forth in the recipient's restricted stock agreement. The committee may determine at the time of award that the payment of dividends, if any, will be deferred until the expiration of the applicable restriction period. Recipients of restricted stock are required to enter into a restricted stock agreement with us that states the restrictions to which the shares are subject, which may include satisfaction of preestablished performance goals, and the criteria or date or dates on which such restrictions will lapse. If the grant of restricted stock or the lapse of the relevant restrictions is based on the attainment of performance goals, the committee will establish for each recipient the applicable performance goals, formulae or standards, and the applicable vesting percentages with reference to the attainment of such goals or satisfaction of such formulae or standards while the outcome of the performance goals are substantially uncertain. Such performance goals may incorporate provisions for disregarding, or adjusting for, changes in accounting methods; corporate transactions, including, without limitation, dispositions and acquisitions; and other similar events or circumstances.
106
Section 162(m) of the Internal Revenue Code requires that performance awards be based upon objective performance measures. The performance goals for performance-based restricted stock will be based on one or more of the objective criteria discussed in general below.
Other Stock-Based Awards. The committee may, subject to limitations under applicable law, make a grant of such other stock-based awards, including, without limitation, performance units, dividend equivalent units, stock equivalent units, restricted stock and deferred stock units under the 2013 Incentive Plan that are payable in cash or denominated or payable in or valued by shares of our common stock or factors that influence the value of such shares. The committee may determine the terms and conditions of any such other awards, which may include the achievement of certain minimum performance goals for purposes of compliance with Section 162(m) of the Code and a minimum vesting period. The performance goals for performance-based other stock-based awards will be based on one or more of the objective criteria discussed in general below.
Other Cash-Based Awards. The committee may grant awards payable in cash. Cash-based awards shall be in such form, and dependent on such conditions, as the committee shall determine, including, without limitation, being subject to the satisfaction of vesting conditions or awarded purely as a bonus and not subject to restrictions or conditions. If a cash-based award is subject to vesting conditions, the committee may accelerate the vesting of such award in its discretion.
Performance Awards. The committee may grant a performance award to a participant payable upon the attainment of specific performance goals. The committee may grant performance awards that are intended to qualify as performance-based compensation under Section 162(m) of the Code as well as performance awards that are not intended to qualify as performance-based compensation under Section 162(m) of the Code. If the performance award is payable in cash, it may be paid upon the attainment of the relevant performance goals either in cash or in shares of restricted stock, based on the then current fair market value of such shares, as determined by the committee. Based on service, performance, or other factors or criteria, the committee may, at or after grant, accelerate the vesting of all or any part of any performance award.
Performance Goals. The committee may grant awards of restricted stock, performance awards and other stock-based awards that are intended to qualify as performance-based compensation for purposes of Section 162(m) of the Code. These awards may be granted, vest, and paid based on attainment of specified performance goals established by the committee. These performance goals may be based on the attainment of a certain target level of, or a specified increase or decrease in, one or more of the following measures selected by the committee: (1) earnings per share; (2) operating income; (3) gross income; (4) net income, before or after taxes; (5) cash flow; (6) gross profit; (7) gross profit return on investment; (8) gross margin return on investment; (9) gross margin; (10) operating margin; (11) working capital; (12) earnings before interest and taxes; (13) earnings before interest, taxes, depreciation and amortization; (14) return on equity; (15) return on assets; (16) return on capital; (17) return on invested capital; (18) net revenues; (19) gross revenues; (20) revenue growth, as to either gross or net revenues; (21) annual recurring net or gross revenues; (22) recurring net or gross revenues; (23) license revenues; (24) sales or market share; (25) total shareholder return; (26) economic value added; (27) specified objectives with regard to limiting the level of increase in all or a portion of our bank debt or other long-term or short-term public or private debt or other similar financial obligations, which may be calculated net of cash balances and other offsets and adjustments as may be established by the committee; (28) the fair market value of the a share of common stock; (29) the growth in the value of an investment in the common stock assuming the reinvestment of dividends; (30) reduction in operating expenses; or (31) other objective criteria determined by the committee in accordance with the 2013 Incentive Plan.
107
To the extent permitted by law, the committee may also exclude the impact of an event or occurrence which the committee determines should be appropriately excluded, such as (1) restructurings, discontinued operations, extraordinary items and other unusual or nonrecurring charges; (2) an event either not directly related to our operations or not within the reasonable control of management; or (3) a change in tax law or accounting standards required by generally accepted accounting principles. Performance goals may also be based on an individual participant's performance goals, as determined by the committee. In addition, all performance goals may be based upon the attainment of specified levels of our performance, or the performance of a subsidiary, division, or other operational unit, under one or more of the measures described above relative to the performance of other corporations. The committee may designate additional business criteria on which the performance goals may be based or adjust, modify, or amend those criteria.
Change in Control. In connection with a change in control, as defined in the 2013 Incentive Plan, the committee may accelerate vesting of outstanding awards under the 2013 Incentive Plan. In addition, such awards may be, in the discretion of the committee, (1) assumed and continued or substituted in accordance with applicable law; (2) purchased by us for an amount equal to the excess of the price of a share of our common stock paid in a change in control over the exercise price of the awards; or (3) canceled if the price of a share of our common stock paid in a change in control is less than the exercise price of the award. The committee may also provide for accelerated vesting or lapse of restrictions of an award at any time.
Stockholder Rights. Except as otherwise provided in the applicable award agreement, and with respect to an award of restricted stock, a participant will have no rights as a stockholder with respect to shares of our common stock covered by any award until the participant becomes the record holder of such shares.
Amendment and Termination. Notwithstanding any other provision of the 2013 Incentive Plan, our board of directors may at any time amend any or all of the provisions of the 2013 Incentive Plan, or suspend or terminate it entirely, retroactively or otherwise; provided, however, that, unless otherwise required by law or specifically provided in the 2013 Incentive Plan, the rights of a participant with respect to awards granted prior to such amendment, suspension, or termination may not be adversely affected without the consent of such participant.
Transferability. Awards granted under the 2013 Incentive Plan are generally nontransferable, other than by will or the laws of descent and distribution, except that the committee may provide for the transferability of nonqualified stock options at the time of grant or thereafter to certain family members.
Recoupment of Awards. The 2013 Incentive Plan provides that awards granted under the 2013 Incentive Plan are subject to any recoupment policy we may have, including the clawback of "incentive-based compensation" under the Exchange Act of 1934, as amended (the "Exchange Act") or under any applicable rules and regulations promulgated by the SEC.
At the February 2013 board meeting, both the Compensation Committee and the board of directors approved equity grants under the 2013 Incentive Plan to our non-employee directors and certain of our officers, including our Named Executive Officers. The amount and structure of the grants were based on a study conducted by Frederic Cook and the recommendations Frederic Cook made as a result of the study. Employee participants under the plan received two types of grants: stock options and Performance Stock Units ("PSUs"). The grants made to our Named Executive Officers included the following: (i) 26,327 stock options and 14,711 PSUs to Mr. Carlile; (ii) 9,872 stock options and 5,517 PSUs to Mr. Rancourt; (iii) 7,240 stock options and 4,046 PSUs to Mr. Bell; (iv) 7,240 stock options and 4,046 PSUs to Mr. Lovlien; and (v) 6,582 stock options and 3,678 PSUs to Mr. Sahlberg. The stock options have a ten-year term from the February 26, 2013, grant date and are based on the
108
$27.19 closing price of the publicly traded stock on February 25, 2013. The options will be ratably vested over three years. The PSUs are earned based on a one-year EBITDA performance established in the same manner with a modified payout target as the one-year EBITDA performance for our 2010, 2011 and 2012 LTIP plans and, if earned, will vest in three equal tranches (as were the LTIP cash grants) on December 31, 2013, 2014, and 2015. Each of Messrs. McDougall, Madigan, McGowan, Fleming, Mencoff, Souleles and Norton, as a non-employee director, was awarded a grant of 2,023 time-vested restricted stock units ("RSUs"). Each RSU is equal in value to one share of the company's common stock. Vested shares will be delivered to the grantee 60 days following the grantee's Termination (as defined in the 2013 Incentive Plan).
Summary Compensation Table
The following table presents compensation information for Messrs. Carlile, Rancourt, Bell, Lovlien and Sahlberg for 2012, 2011 and 2010, to the extent each of them served as one of our Named Executive Officers during each of such years:
Name and Principal Position
|
Year | Salary ($)(1) |
Bonus ($)(2) |
Non-Equity Incentive Plan Compensation ($)(3) |
Change in Pension Value and Nonqualified Deferred Compensation Earnings ($)(4) |
All Other Compensation ($) |
Total ($) |
|||||||||||||||
|---|---|---|---|---|---|---|---|---|---|---|---|---|---|---|---|---|---|---|---|---|---|---|
Thomas E. Carlile |
2012 | $ | 741,667 | $ | — | $ | 2,003,500 | $ | 271,442 | $ | 114,532 | $ | 3,131,141 | |||||||||
Chief Executive Officer |
2011 | 700,000 | — | 577,500 | 325,949 | 88,676 | 1,692,125 | |||||||||||||||
|
2010 | 700,000 | — | 1,060,500 | 134,104 | 49,218 | 1,943,822 | |||||||||||||||
Wayne M. Rancourt |
2012 |
$ |
360,417 |
$ |
— |
$ |
505,500 |
$ |
134,208 |
$ |
41,897 |
$ |
1,042,022 |
|||||||||
Senior Vice |
2011 | 350,000 | — | 151,725 | 201,587 | 24,734 | 728,046 | |||||||||||||||
President,Chief Financial |
2010 | 350,000 | — | 287,700 | 97,789 | 13,464 | 748,953 | |||||||||||||||
Officer, and Treasurer |
||||||||||||||||||||||
Stanley R. Bell |
2012 |
$ |
428,333 |
$ |
— |
$ |
616,028 |
$ |
122,556 |
$ |
60,432 |
$ |
1,227,349 |
|||||||||
President, Building |
2011 | 420,000 | 420,000 | 194,828 | 173,524 | 37,199 | 1,245,551 | |||||||||||||||
Materials Distribution |
2010 | 420,000 | — | 326,954 | 53,570 | 29,462 | 829,986 | |||||||||||||||
Thomas A. Lovlien |
2012 |
$ |
428,333 |
$ |
440,000 |
$ |
654,905 |
$ |
196,683 |
$ |
61,885 |
$ |
1,781,806 |
|||||||||
President, Wood Products |
2011 | 420,000 | — | 182,070 | 260,721 | 46,156 | 908,947 | |||||||||||||||
Manufacturing |
2010 | 420,000 | — | 428,400 | 185,453 | 30,928 | 1,064,781 | |||||||||||||||
John T. Sahlberg |
2012 |
$ |
308,333 |
$ |
— |
$ |
388,120 |
$ |
146,975 |
$ |
34,759 |
$ |
878,187 |
|||||||||
Senior Vice President, |
2011 | 300,000 | — | 105,300 | 142,520 | 41,229 | 589,049 | |||||||||||||||
Human Resources and |
||||||||||||||||||||||
General Counsel |
||||||||||||||||||||||
- (1)
- Includes
amounts deferred under our savings plan. See "—Compensation Discussion and Analysis—Other Compensation and Benefit
Plans—401(k) Plan" for a description of this plan.
- (2)
- Represents
the payout of Retention Agreements.
- (3)
- Represents total of (i) payments of Awards under our STIP for each year reported on and (ii) payments of Awards under our 2010, 2011 and 2012 LTIPs. The specific financial goals and performance objectives at corporate and business unit levels of the STIP and the LTIP are described under "—Compensation Discussion and Analysis—STIP" and "—Long-Term Incentive Compensation (Management Equity Plan and LTIP)." The amounts reported in this column include amounts deferred under our savings plan. See "—Compensation Discussion
109
- and
Analysis—Other Compensation and Benefit Plans—401(k) Plan" for a description of this plan.
- Under the terms of the 2010, 2011 and 2012 LTIPs, participants are paid one-third of the current-year award when awards are determined, with the balance of the Award paid in two equal installments by March 15 of the following two years, but only if the Officer remains employed through December 31 of the preceding year. Amounts awarded to Mr. Bell were not subject to the delayed vesting requirement because he met the requirements for retirement-eligible status under the plan. Consequently, Mr. Bell's total LTIP, paid annually, is reflected in the table above. See the description of the plan under "—Compensation Discussion and Analysis—Long-Term Incentive Compensation (Management Equity Plan and LTIP)." The total non-equity incentive plan compensation for each Named Executive Officer for 2012, 2011 and 2010 is comprised of the following:
| |
2012 | |||||||||||||||
|---|---|---|---|---|---|---|---|---|---|---|---|---|---|---|---|---|
| |
1/3 2012 LTIP |
1/3 2011 LTIP |
1/3 2010 LTIP |
2012 STIP | Total | |||||||||||
Thomas E. Carlile |
$ | 376,000 | $ | 126,000 | $ | 157,500 | $ | 1,344,000 | $ | 2,003,500 | ||||||
Wayne M. Rancourt |
88,125 | 31,500 | 39,375 | 346,500 | 505,500 | |||||||||||
Thomas A. Lovlien |
103,400 | 37,800 | 47,250 | 466,455 | 654,905 | |||||||||||
John T. Sahlberg |
75,200 | 21,600 | 27,000 | 264,320 | 388,120 | |||||||||||
| |
2012 LTIP | 2012 STIP | Total | |||||||
|---|---|---|---|---|---|---|---|---|---|---|
Stanley R. Bell |
$ | 310,200 | $ | 305,828 | $ | 616,028 | ||||
| |
2011 | ||||||||||||
|---|---|---|---|---|---|---|---|---|---|---|---|---|---|
| |
1/3 2011 LTIP |
1/3 2010 LTIP |
2011 STIP | Total | |||||||||
Thomas E. Carlile |
$ | 126,000 | $ | 157,500 | $ | 294,000 | $ | 577,500 | |||||
Wayne M. Rancourt |
31,500 | 39,375 | 80,850 | 151,725 | |||||||||
Thomas A. Lovlien |
37,800 | 47,250 | 97,020 | 182,070 | |||||||||
John T. Sahlberg |
21,600 | 27,000 | 56,700 | 105,300 | |||||||||
| |
2011 LTIP | 2011 STIP | Total | |||||||
|---|---|---|---|---|---|---|---|---|---|---|
Stanley R. Bell |
$ | 113,400 | $ | 81,428 | $ | 194,828 | ||||
| |
2010 | |||||||||
|---|---|---|---|---|---|---|---|---|---|---|
| |
1/3 2010 LTIP |
2010 STIP | Total | |||||||
Thomas E. Carlile |
$ | 157,500 | $ | 903,000 | $ | 1,060,500 | ||||
Wayne M. Rancourt |
39,375 | 248,325 | 287,700 | |||||||
Thomas A. Lovlien |
47,250 | 381,150 | 428,400 | |||||||
| |
2010 LTIP | 2010 STIP | Total | |||||||
|---|---|---|---|---|---|---|---|---|---|---|
Stanley R. Bell |
$ | 141,750 | $ | 185,204 | $ | 326,954 | ||||
110
- (4)
- Amounts disclosed in this column include the following:
Name
|
Year | Change in Pension Value(a) |
Nonqualified Deferred Compensation Earnings(b) |
|||||||
|---|---|---|---|---|---|---|---|---|---|---|
Thomas E. Carlile |
2012 | $ | 262,240 | $ | 9,202 | |||||
|
2011 | 318,365 | 7,584 | |||||||
|
2010 | 126,683 | 7,421 | |||||||
Wayne M. Rancourt |
2012 |
$ |
129,247 |
$ |
4,961 |
|||||
|
2011 | 197,498 | 4,089 | |||||||
|
2010 | 93,788 | 4,001 | |||||||
Stanley R. Bell |
2012 |
$ |
102,502 |
$ |
20,054 |
|||||
|
2011 | 156,995 | 16,529 | |||||||
|
2010 | 37,396 | 16,174 | |||||||
Thomas A. Lovlien |
2012 |
$ |
186,055 |
$ |
10,628 |
|||||
|
2011 | 251,962 | 8,759 | |||||||
|
2010 | 176,882 | 8,571 | |||||||
John T. Sahlberg |
2012 |
$ |
139,912 |
$ |
7,063 |
|||||
|
2011 | 136,744 | 5,776 | |||||||
- (a)
- Pension
benefits for officers are frozen, and no additional benefits are being earned. The changes reported in this column reflect the changes in actuarial
assumptions that increase the present value of their benefits under all pension plans established by the company using interest rate and mortality rate assumptions consistent with those used in the
company's financial statements.
- (b)
- The
amounts reported in this column reflect the above-market portion of the interest earned on deferred compensation for our Named Executive Officers for
the years in which they were Named Executive Officers.
- For more information concerning the pension plans and deferred compensation plans in which our Named Executive Officers participate, see "—Compensation Discussion and Analysis—Other Compensation and Benefit Plans—Defined Benefit Pension Benefits" and "—Nonqualified Deferred Compensation."
- (5)
- Amounts disclosed in this column include the following:
Name
|
Year | Company Contributions to Savings Plans(a) |
Company-Paid Portion of Executive Officer Life Insurance(b) |
Reportable Perquisites |
Tax Reimbursements, Gross-Ups, and Other(c) |
|||||||||||
|---|---|---|---|---|---|---|---|---|---|---|---|---|---|---|---|---|
Thomas E. Carlile |
2012 | $ | 94,103 | $ | 19,026 | $ | — | $ | 1,403 | |||||||
Wayne M. Rancourt |
2012 | 40,207 | 1,002 | — | 688 | |||||||||||
Stanley R. Bell |
2012 | 45,842 | 13,634 | — | 956 | |||||||||||
Thomas A. Lovlien |
2012 | 47,891 | 12,668 | — | 1,326 | |||||||||||
John T. Sahlberg |
2012 | 33,277 | 1,482 | — | — | |||||||||||
- (a)
- See "—Compensation Discussion and Analysis—Other Compensation and Benefit Plans—401(k) Plan" for a description of this plan. Amounts included in the contributions reported in this column that exceeded IRS annual limitations on
111
- company
contributions to qualified defined contribution retirement plans were paid to the Named Executive Officer as taxable cash compensation.
- (b)
- See
"—Compensation Discussion and Analysis—Other Compensation and Benefit Plans—Salaried Employee Life Insurance Plan
and Supplemental Life Plan" for a description of the company-paid life insurance plans under which these costs were incurred.
- (c)
- The company provides a tax gross-up on the actual amount of the $5,000 annual allowance for tax advice and planning.
Grants of Plan-Based Awards
Equity Awards
None of our Named Executive Officers received a grant of equity interests during 2012.
Non-Equity Awards
| |
Estimated Future Payouts Under Non-Equity Incentive Awards | |||||||||||||||
|---|---|---|---|---|---|---|---|---|---|---|---|---|---|---|---|---|
Name
|
Board Approval Date |
Grant Date |
Threshold | Target | Maximum | |||||||||||
Thomas E. Carlile |
||||||||||||||||
STIP(1) |
2/23/2012 | 3/31/2012 | $ | 200,000 | $ | 800,000 | $ | 1,800,000 | ||||||||
2012 LTIP(2) |
2/23/2012 | 3/31/2012 | 400,000 | 800,000 | 1,600,000 | |||||||||||
Wayne M. Rancourt |
||||||||||||||||
STIP(1) |
2/23/2012 | 3/31/2012 | 51,563 | 206,250 | 464,063 | |||||||||||
2012 LTIP(2) |
2/23/2012 | 3/31/2012 | 93,750 | 187,500 | 375,000 | |||||||||||
Stanley R. Bell |
||||||||||||||||
STIP(1) |
2/23/2012 | 3/31/2012 | 60,500 | 242,000 | 544,500 | |||||||||||
2012 LTIP(2) |
2/23/2012 | 3/31/2012 | 110,000 | 220,000 | 440,000 | |||||||||||
Thomas A. Lovlien |
||||||||||||||||
STIP(1) |
2/23/2012 | 3/31/2012 | 60,500 | 242,000 | 544,500 | |||||||||||
2012 LTIP(2) |
2/23/2012 | 3/31/2012 | 110,000 | 220,000 | 440,000 | |||||||||||
John T. Sahlberg |
||||||||||||||||
STIP(1) |
2/23/2012 | 3/31/2012 | 39,333 | 157,333 | 354,000 | |||||||||||
2012 LTIP(2) |
2/23/2012 | 3/31/2012 | 80,000 | 160,000 | 320,000 | |||||||||||
- (1)
- Reflects
the potential threshold, target and maximum incentive Awards for the Named Executive Officers possible for 2012 under our STIP. For further
information on the terms of these incentive Awards, refer to "—Compensation Discussion and Analysis—STIP" and "—Long-Term Incentive Compensation (Management Equity
Plan and LTIP)." The Named Executive Officers' actual incentive Awards earned in 2012 are disclosed in footnote 3 to the "Non-equity Incentive Plan Compensation" column of the "Summary Compensation
Table." All Awards earned under this plan were paid in February 2013.
- (2)
- Reflects the potential threshold, target and maximum incentive Awards for the Named Executive Officers possible for 2012 under our 2012 LTIP. For further information on the terms of these incentive Awards, refer to "—Compensation Discussion and Analysis—Long-Term Incentive Compensation (Management Equity Plan and LTIP)." The Named Executive Officers' actual incentive Awards earned in 2012 under this Plan are disclosed in footnote 3 to the "Non-Equity Incentive Plan Compensation" column of the "Summary Compensation Table."
112
Outstanding Equity Awards at Fiscal Year-End
All outstanding equity awards held by our Named Executive Officers were fully vested as of year-end, and no further grants of equity awards were made during 2012. For further information concerning the operation of our Management Equity Plan, see "—Compensation Discussion and Analysis—Long-Term Incentive Compensation (Management Equity Plan and LTIP)—MEP."
Options Exercised and Stock Vested
No MEP shares vested in 2012.
Pension Benefits
Pension benefits for officers are frozen, and no additional benefits are being earned. The following table reflects the present value of accumulated benefits payable to Messrs. Carlile, Rancourt, Bell, Lovlien and Sahlberg, including the number of years of service credited to each of them under our defined benefit pension plans. No amounts were distributed to any of them during 2012 under the SPP, the SUPP and the SERP. Mr. Sahlberg and Mr. Bell do not participate in the SERP. For more information concerning our pension plans, see "—Compensation Discussion and Analysis—Other Compensation and Benefit Plans—Defined Benefit Pension Benefits."
Name
|
Plan Name | Number of Years Credited Service (#)(1) |
Present Value of Accumulated Benefit ($)(2) |
||||||
|---|---|---|---|---|---|---|---|---|---|
Thomas E. Carlile |
Salaried Pension Plan | 37 | $ | 1,682,280 | |||||
|
SUPP | 37 | 1,508,098 | ||||||
|
SERP | 37 | 409,913 | ||||||
Wayne M. Rancourt |
Salaried Pension Plan | 25 | 513,414 | ||||||
|
SUPP | 25 | 178,955 | ||||||
|
SERP | 25 | 288,143 | ||||||
Stanley R. Bell |
Salaried Pension Plan | 39 | 1,999,833 | ||||||
|
SUPP | 39 | 1,466,567 | ||||||
Thomas A. Lovlien |
Salaried Pension Plan | 31 | 960,576 | ||||||
|
SUPP | 31 | 774,614 | ||||||
|
SERP | 31 | 669,929 | ||||||
John T. Sahlberg |
Salaried Pension Plan | 27 | 935,325 | ||||||
|
SUPP | 27 | 188,172 | ||||||
- (1)
- Number
of years credited service for Messrs. Carlile, Rancourt, Bell, Lovlien and Sahlberg include amounts attributable to employment with OfficeMax
prior to the Forest Products Acquisition.
- (2)
- These values were calculated on the same basis and using the same assumptions used in the company's financial statements except that the assumed retirement age for Messrs. Carlile, Rancourt and Lovlien were the later of their current age or the earliest age at which they could qualify for retirement under the SERP. See Note 12, "Retirement and Benefit Plans," to our audited consolidated financial statements incorporated by reference in this prospectus.
Nonqualified Deferred Compensation
Due to the application of Internal Revenue Code Section 457A to the company during 2012, no deferrals were made under the plan, and no company contributions were made to the plan during
113
the year. Earnings on preexisting plan balances continued to accrue during 2012 in accordance with the terms of the plan. No withdrawals or distributions were made from the plan by any of our Named Executive Officers during 2012. Aggregate earnings and year-end plan balances for each of our Named Executive Officers are disclosed in the table below:
Name
|
Aggregate Earnings in Last FY($)(1) |
Aggregate Balance at FYE($) |
|||||
|---|---|---|---|---|---|---|---|
Thomas E. Carlile |
$ | 20,725 | $ | 395,639 | |||
Wayne M. Rancourt |
11,172 | 213,284 | |||||
Stanley R. Bell |
45,166 | 862,221 | |||||
Thomas A. Lovlien |
23,936 | 456,932 | |||||
John T. Sahlberg |
15,907 | 303,669 | |||||
- (1)
- The above-market portion of these amounts is included in the 2012 "Change in Pension Value and Nonqualified Deferred Compensation Earnings" column of the "Summary Compensation Table."
For more information concerning our nonqualified deferred compensation plan, see "Compensation Discussion and Analysis—Other Compensation and Benefit Plans—Nonqualified Deferred Compensation."
Potential Payments Upon Termination or Change in Control
The following tables reflect an estimate of the compensation the company would have been required to pay to each of its Named Executive Officers under the compensation plans, contracts, agreements and arrangements between each such individual and the company for:
- •
- Voluntary termination with good reason;
- •
- A change in control without adoption of a replacement plan;
- •
- Involuntary termination without cause;
- •
- For-cause termination or voluntary termination without good reason;
- •
- Termination as a result of sale of a division;
- •
- Death; or
- •
- Disability.
The amounts shown assume that such termination or change in control was effective as of December 31, 2012. The actual amounts the company would have been required to pay on other dates may be determined only at the time of separation from the company or the change in control and will accordingly vary from those disclosed here, which are based on a hypothetical December 31, 2012, termination. Our paid vacation is earned on a current basis ratably throughout each payroll year. Earned and unused amounts at year-end are forfeited to the extent they exceed a maximum permitted carry-over of 80 hours. The amounts disclosed here do not include amounts earned by the Named Executive Officer through that time as base salary, any bonuses approved by the Compensation Committee prior to that date and payments earned prior to that date as 2012 Awards earned pursuant to our STIP or current installments of 2012 Awards under our 2012 LTIP, because neither their amount nor the timing of their payment is affected by the fact or the nature of the termination of employment. In addition, the disclosure does not include amounts payable pursuant to the 401(k), deferred compensation, or pension plans, which are disclosed elsewhere in this section. Disclosure of amounts earned during 2012 as base salary, bonuses and Awards under the 2012 STIP may be found in the
114
"Summary Compensation Table." Pension benefits and deferred compensation arrangements are described under the headings "—Pension Benefits" and "—Nonqualified Deferred Compensation," respectively.
The availability of severance payments and continued healthcare and insurance benefits beyond termination of employment is contractually conditioned for each of our Named Executive Officers on their provision to the company of a release of claims arising from their employment and the termination thereof and their performance of contractual confidentiality, nonsolicitation and nondisparagement obligations contained in their employment or severance agreements with the company as well as payment of applicable contributions for healthcare and insurance benefits. The payments described in the tables and textual materials that follow are provided for, with respect to Mr. Carlile, by the terms of his Severance Agreement and Retention Award Agreement with the company; with respect to Messrs. Bell, Lovlien, Rancourt and Sahlberg, by their Severance Agreements with the company; and for all such Named Executive Officers, by the terms of the Management Equity Plan and the LTIP. For a description of these contractual arrangements, see "—Compensation Discussion and Analysis—Long-Term Incentive Compensation (Management Equity Plan and LTIP) and "—Agreements With, and Potential Payments to, Named Executive Officers." Management Equity Plan units were valued as of December 31, 2011, the most recent valuation available.
115
Benefit
|
Voluntary Termination With Good Reason |
Change in Control |
Involuntary Termination Without Cause |
For-Cause Termination or Voluntary Termination Without Good Reason |
Death or Disability |
|||||||||||
|---|---|---|---|---|---|---|---|---|---|---|---|---|---|---|---|---|
Base salary |
$ | 1,600,000 | $ | — | $ | 1,600,000 | $ | — | $ | — | ||||||
(2 × base salary of $800,000) |
||||||||||||||||
STIP |
1,600,000 | 800,000 | 1,600,000 | — | — | |||||||||||
|
(2 × target | ) | (1 × target | ) | (2 × target | ) | ||||||||||
LTIP |
— | 752,000 | — | — | 878,000 | |||||||||||
Retention agreement payment |
— | — | 1,199,000 | — | 501,678 | |||||||||||
(1 × base salary of $800,000 plus average of past 3 STIP payments) |
||||||||||||||||
Insurance premiums—term life |
37,873 | — | 37,873 | — | — | |||||||||||
(for 24 months) |
||||||||||||||||
Insurance—healthcare, disability, and accident |
11,915 | — | 11,915 | — | — | |||||||||||
(for 18 months) |
||||||||||||||||
Financial counseling |
10,000 | — | 10,000 | — | — | |||||||||||
(for 18 months) |
||||||||||||||||
Unused paid time off |
34,438 | — | 34,438 | 34,438 | 34,438 | |||||||||||
(80 hours) |
||||||||||||||||
Repurchase of management equity units |
— | — | — | — | 1,249,612 | |||||||||||
TOTAL |
$ | 3,294,226 | $ | 1,552,000 | $ | 4,493,226 | $ | 34,438 | $ | 2,663,728 | ||||||
116
Benefit
|
Voluntary Termination With Good Reason |
Change in Control |
Involuntary Termination Without Cause |
For-Cause Termination or Voluntary Termination Without Good Reason |
Death or Disability |
|||||||||||
|---|---|---|---|---|---|---|---|---|---|---|---|---|---|---|---|---|
Base salary |
$ | 750,000 | $ | — | $ | 750,000 | $ | — | $ | — | ||||||
(2 × base salary of $375,000) |
||||||||||||||||
STIP |
412,500 | 206,250 | 412,500 | — | — | |||||||||||
|
(2 × target | ) | (1 × target | ) | (2 × target | ) | ||||||||||
LTIP |
— | 176,250 | — | — | 207,750 | |||||||||||
Insurance—healthcare, disability, and accident |
17,405 | — | 17,405 | — | — | |||||||||||
(for 18 months) |
||||||||||||||||
Financial counseling |
15,000 | — | 15,000 | — | — | |||||||||||
(for 18 months) |
||||||||||||||||
Unused paid time off |
16,143 | — | 16,143 | 16,143 | 16,143 | |||||||||||
(80 hours) |
||||||||||||||||
Repurchase of management equity units |
— | — | — | — | 203,648 | |||||||||||
TOTAL |
$ | 1,211,048 | $ | 382,500 | $ | 1,211,048 | $ | 16,143 | $ | 427,541 | ||||||
117
Benefit
|
Voluntary Termination With Good Reason |
Change in Control |
Involuntary Termination Without Cause |
For-Cause Termination or Voluntary Termination Without Good Reason |
Involuntary Termination in Connection With Sale of a Division |
Retirement | Death or Disability |
|||||||||||||||
|---|---|---|---|---|---|---|---|---|---|---|---|---|---|---|---|---|---|---|---|---|---|---|
Base salary |
$ | 880,000 | $ | — | $ | 880,000 | $ | — | $ | 880,000 | $ | — | $ | — | ||||||||
(2 × base salary of $440,000) |
||||||||||||||||||||||
STIP |
484,000 | 242,000 | 484,000 | — | 484,000 | — | — | |||||||||||||||
|
(2 × target | ) | (1 × target | ) | (2 × target | ) | (2 × target | ) | ||||||||||||||
LTIP |
— | 124,080 | — | — | — | 146,760 | 146,760 | |||||||||||||||
Insurance premiums—term life |
27,088 | — | 27,088 | — | 27,088 | — | — | |||||||||||||||
(for 24 months) |
||||||||||||||||||||||
Insurance—healthcare, disability, and accident |
11,915 | — | 11,915 | — | 11,915 | — | — | |||||||||||||||
(for 18 months) |
||||||||||||||||||||||
Financial counseling |
15,000 | — | 15,000 | — | 15,000 | — | — | |||||||||||||||
(for 18 months) |
||||||||||||||||||||||
Unused paid time off |
18,941 | — | 18,941 | 18,941 | 18,941 | 18,941 | 18,941 | |||||||||||||||
(80 hours) |
||||||||||||||||||||||
Repurchase of management equity units |
— | — | — | — | 1,041,116 | — | 1,041,116 | |||||||||||||||
TOTAL |
$ | 1,436,944 | $ | 366,080 | $ | 1,436,944 | $ | 18,941 | $ | 2,478,060 | $ | 165,701 | $ | 1,206,817 | ||||||||
118
Benefit
|
Voluntary Termination With Good Reason |
Change in Control |
Involuntary Termination Without Cause |
For-Cause Termination or Voluntary Termination Without Good Reason |
Involuntary Termination in Connection With Sale of a Division |
Death or Disability |
|||||||||||||
|---|---|---|---|---|---|---|---|---|---|---|---|---|---|---|---|---|---|---|---|
Base salary |
$ | 880,000 | $ | — | $ | 880,000 | $ | — | $ | 880,000 | $ | — | |||||||
(2 × base salary of $440,000) |
|||||||||||||||||||
STIP |
484,000 | 242,000 | 484,000 | — | 484,000 | — | |||||||||||||
|
(2 × target | ) | (1 × target | ) | (2 × target | ) | (2 × target | ) | |||||||||||
LTIP |
— | 206,800 | — | — | — | 244,600 | |||||||||||||
Insurance premiums—term life |
25,155 | — | 25,155 | — | 25,155 | — | |||||||||||||
(for 24 months) |
|||||||||||||||||||
Insurance—healthcare, disability, and accident |
10,133 | — | 10,133 | — | 10,133 | — | |||||||||||||
(for 18 months) |
|||||||||||||||||||
Financial counseling |
15,000 | — | 15,000 | — | 15,000 | — | |||||||||||||
(for 18 months) |
|||||||||||||||||||
Unused paid time off |
18,941 | — | 18,941 | 18,941 | 18,941 | 18,941 | |||||||||||||
(80 hours) |
|||||||||||||||||||
Repurchase of management equity units |
— | — | — | — | 511,473 | 511,473 | |||||||||||||
TOTAL |
$ | 1,433,229 | $ | 448,800 | $ | 1,433,229 | $ | 18,941 | $ | 1,944,702 | $ | 775,014 | |||||||
119
Benefit
|
Voluntary Termination With Good Reason |
Change in Control |
Involuntary Termination Without Cause |
For-Cause Termination or Voluntary Termination Without Good Reason |
Death or Disability |
|||||||||||
|---|---|---|---|---|---|---|---|---|---|---|---|---|---|---|---|---|
Base salary |
$ | 640,000 | $ | — | $ | 640,000 | $ | — | $ | — | ||||||
(2 × base salary of $320,000) |
||||||||||||||||
STIP(1) |
314,667 | 157,333 | 314,667 | — | — | |||||||||||
|
(2 × target | ) | (1 × target | ) | (2 × target | ) | ||||||||||
LTIP |
— | 150,400 | — | — | 172,000 | |||||||||||
Insurance—healthcare, disability, and accident |
17,405 | — | 17,405 | — | — | |||||||||||
(for 18 months) |
||||||||||||||||
Financial counseling |
15,000 | — | 15,000 | — | — | |||||||||||
(for 18 months) |
||||||||||||||||
Unused paid time off |
13,775 | — | 13,775 | 13,775 | 13,775 | |||||||||||
(80 hours) |
||||||||||||||||
Repurchase of management equity units |
— | — | — | — | 122,155 | |||||||||||
TOTAL |
$ | 1,000,847 | $ | 307,733 | $ | 1,000,847 | $ | 13,775 | $ | 307,930 | ||||||
- (1)
- Target is 45% of base salary for seven months of 2012 and 55% for five months following Mr. Sahlberg's promotion, or 49.2%.
Director Compensation
Overview
Since shortly after the company's inception, the company has included one or more directors on its board who are not employees of the company; its major investor, Madison Dearborn; or its significant minority investor, OfficeMax, in an effort to ensure that the deliberations of its board reflect a broader range of perspective and experience than are available solely from the chief executive officer of the company and OfficeMax and Madison Dearborn employees. During 2012, we had one such director—Mr. Madigan. The compensation levels are believed by the Compensation Committee to be comparable to those paid by other companies of similar size for independent directors with comparable responsibilities.
Boise Cascade entered into an employment agreement with Mr. McDougall on November 20, 2008, pursuant to which he served as our chairman and chief executive officer. Mr. McDougall's employment agreement was amended in February 2009 and further amended upon his resignation from the position of chief executive officer in August 2009. Pursuant to the terms of his employment agreement, as amended, in 2012, Mr. McDougall received an annual base salary of $180,000 per year as compensation for serving as a director and chairman of BC Holdings' board of directors. Under the terms of such agreement, Mr. McDougall participated in dental and vision insurance plans that were the same as those available to other salaried employees, and he received a company contribution to his 401(k) account on the same terms as other employees. He did not participate in any of the company's incentive compensation plans. Mr. McDougall's employment agreement also provided that it could be terminated by either party on 30 days' notice. Mr. McDougall resigned as an employee effective
120
December 31, 2012, and began serving as the non-executive chairman of the board effective January 1, 2013. Mr. McDougall's compensation arrangement for 2013 is discussed below.
None of Messrs. Madigan, McDougall, McGowan or Fleming has an employment contract. During 2012, our nonemployee directors were compensated for acting as a member of our board in the amount of an annual fee of $50,000 per year and $1,500 in additional fees for each meeting of the board and each committee meeting attended. Based on a Frederic Cook study that the Compensation Committee commissioned to evaluate pay for directors of publicly traded companies, on February 26, 2013, the Compensation Committee and the board changed director compensation for 2013. In 2013, each nonemployee director will receive an annual cash retainer of $55,000 and will be issued 2,023 restricted stock units (with a grant date fair value of $54,000) that will vest on February 25, 2014. Mr. McDougall will receive an additional $90,000 as chairman of the board, Mr. McGowan will receive an additional $10,000 as Audit Committee chair and Mr. Mencoff will receive an additional $5,000 as Compensation Committee chair. Fees will no longer be paid for attending committee or board meetings. As described above in "—2013 Incentive Plan," each non-employee director received a grant of 2,023 time-vested RSUs in February 2013.
The compensation earned during 2012 by Messrs. McDougall and Madigan, for serving as a member of BC Holdings' board of directors, is set forth in the following table. Mr. Fleming was appointed to serve on Boise Cascade's board of directors in February 2013.
Name
|
Fees Earned or Paid in Cash(1) |
Stock Awards(2) |
Change in Pension Value and Nonqualified Deferred Compensation Earnings(3) |
All Other Compensation(4) |
Total | |||||||||||
|---|---|---|---|---|---|---|---|---|---|---|---|---|---|---|---|---|
Duane C. McDougall |
$ | 180,000 | — | — | $ | 18,060 | $ | 198,060 | ||||||||
John W. Madigan |
74,000 | — | 7,227 | — | $ | 81,227 | ||||||||||
- (1)
- In
addition to serving as a director, Mr. McDougall serves as the chairman of our board of directors. Mr. McDougall resigned as an employee
effective December 31, 2012, and began serving as the nonexecutive chairman of BC Holdings' board of directors effective January 1, 2013.
- (2)
- No
stock awards were made to any of our directors during 2012 for their service as directors of BC Holdings. All outstanding equity awards held by
Mr. Madigan and Mr. McDougall were fully vested at year-end.
- (3)
- We
do not provide any of our directors with pension benefits. The amount reported in this column reflects the above-market portion of the interest
Mr. Madigan earned during 2012 under our Directors Deferred Compensation Plan for service as a director of BC Holdings.
- (4)
- Company 401(k) contribution, company-provided life insurance and financial counseling allowance.
Directors Deferred Compensation Plan
We maintained a nonqualified Directors Deferred Compensation Plan, which allowed each director who received compensation for board service to defer all or a portion of such compensation in a calendar year. Amounts deferred are credited with imputed interest at a rate equal to 130% of Moody's Composite Average of Yields on Corporate Bonds. Participants may receive payment in cash
121
in a lump sum or in annual installments following their service on the board. Contributions were suspended as of December 31, 2009.
Director and Officer Indemnification and Limitation of Liability
Our bylaws provide that we will indemnify our directors and officers to the fullest extent permitted by the DGCL and that we will provide expense reimbursement to them in accordance with the DGCL. In addition, our certificate of incorporation provides that our directors will not be liable for monetary damages for breach of fiduciary duty to the fullest extent permitted by the DGCL.
In addition, we have entered into indemnification agreements with each of our executive officers and directors. The indemnification agreements provide the executive officers and directors with contractual rights to indemnification, expense advancement and reimbursement to the fullest extent permitted under the DGCL.
There is no pending litigation or proceeding naming any of our directors or officers to which indemnification is being sought and we are not aware of any pending or threatened litigation that may result in claims for indemnification by any director or officer.
122
PRINCIPAL AND SELLING STOCKHOLDER
The following table sets forth information regarding the beneficial ownership of our common stock as of July 15, 2013, and the beneficial ownership percentages of our common stock (1) immediately prior to and (2) as adjusted to give effect to this offering by:
- •
- each person or group who is known by us to beneficially own more than 5% of our outstanding shares of our common stock,
including BC Holdings, the selling stockholder;
- •
- each of our named executive officers;
- •
- each of our directors; and
- •
- all of our executive officers and directors as a group.
Each stockholder's percentage ownership is based on 43,229,412 shares of our common stock outstanding as of July 15, 2013.
Beneficial ownership for the purposes of the following table is determined in accordance with the rules and regulations of the SEC. These rules generally provide that a person is the beneficial owner of securities if such person has or shares the power to vote or direct the voting thereof, or to dispose or direct the disposition thereof, or has the right to acquire such powers within 60 days. Common stock subject to options that are currently exercisable or exercisable within 60 days of July 15, 2013, are deemed to be outstanding and beneficially owned by the person holding the options. These shares, however, are not deemed outstanding for the purposes of computing the percentage ownership of any other person. Percentage of beneficial ownership is based on 43,229,412 shares of common stock outstanding as of July 15, 2013. Except as disclosed in the footnotes to this table and subject to applicable community property laws, we believe that each stockholder identified in the table possesses sole voting and investment power over all shares of common stock shown as beneficially owned by the stockholder. We have not included in the following table the number of shares of common stock that certain of our executive officers and directors may be deemed to indirectly own as a result of being indirect investors in BC Holdings, because none of such officers or directors exercises indirect voting or investment power with respect to our common stock held by BC Holdings. Unless otherwise noted in the table or footnotes below, the address for each person listed below is c/o Boise Cascade Company, 1111 West Jefferson Street, Suite 300, Boise, Idaho 83702.
123
| |
Shares Beneficially Owned Prior to This Offering |
Shares to be Sold in This Offering Assuming no Exercise of Option |
Shares to be Sold in This Offering Assuming Full Exercise of Option |
Shares Beneficially Owned After This Offering Assuming no Exercise of Option |
Shares Beneficially Owned After This Offering Assuming Full Exercise of Option |
||||||||||||||||||||
|---|---|---|---|---|---|---|---|---|---|---|---|---|---|---|---|---|---|---|---|---|---|---|---|---|---|
Name
|
Number | Percent | Number | Number | Number | Percent | Number | Percent | |||||||||||||||||
5% Stockholder: |
|||||||||||||||||||||||||
Boise Cascade Holdings, L.L.C.(1) |
29,700,000 | 68.7 | % | 10,000,000 | 11,500,000 | 19,700,000 | 45.6 | % | 18,200,000 | 42.1 | % | ||||||||||||||
Named Executive Officers and Directors: |
|||||||||||||||||||||||||
Thomas E. Carlile(2) |
— | — | — | — | — | — | — | — | |||||||||||||||||
Stanley R. Bell(2) |
— | — | — | — | — | — | — | — | |||||||||||||||||
Thomas A. Lovlien(2) |
— | — | — | — | — | — | — | — | |||||||||||||||||
Wayne M. Rancourt(2) |
— | — | — | — | — | — | — | — | |||||||||||||||||
John T. Sahlberg(2) |
— | — | — | — | — | — | — | — | |||||||||||||||||
John W. Madigan(1)(3) |
— | — | — | — | — | — | — | — | |||||||||||||||||
Duane C. McDougall(2) |
— | — | — | — | — | — | — | — | |||||||||||||||||
Richard H. Fleming |
— | — | — | — | — | — | — | — | |||||||||||||||||
Christopher J. McGowan(1) |
— | — | — | — | — | — | — | — | |||||||||||||||||
Samuel M. Mencoff(1) |
29,700,000 | 68.7 | % | 10,000,000 | 11,500,000 | 19,700,000 | 45.6 | % | 18,200,000 | 42.1 | % | ||||||||||||||
Matthew W. Norton(1) |
— | — | — | — | — | — | — | — | |||||||||||||||||
Thomas S. Souleles(1) |
29,700,000 | 68.7 | % | 10,000,000 | 11,500,000 | 19,700,000 | 45.6 | % | 18,200,000 | 42.1 | % | ||||||||||||||
All Executive Officers and Directors as a Group (13 Persons) |
29,700,000 | 68.7 | % | 10,000,000 | 11,500,000 | 19,700,000 | 45.6 | % | 18,200,000 | 42.1 | % | ||||||||||||||
- (1)
- FPH
holds a majority of the voting common units of BC Holdings and has the right to appoint a majority of the members of the board of directors of BC
Holdings. As such, FPH may be deemed to share voting and dispositive power with respect to the shares of Boise Cascade common stock held of record by BC Holdings. MDCP IV is the controlling
equityholder of FPH. Madison Dearborn Partners IV, L.P. ("MDP IV") is the general partner of MDCP IV. Madison Dearborn is the general partner of MDP IV and Thomas S. Souleles is a
managing director of Madison Dearborn. Paul J. Finnegan and Samuel M. Mencoff are the sole members of a limited partner committee of MDP IV that has the power to vote or dispose of the equity units
held by MDCP IV. The address for FPH, MDCP IV, MDP IV, Madison Dearborn and Messrs. Mencoff, Norton and Souleles is c/o Madison Dearborn Partners, LLC, 70 W. Madison
Street, Suite 4600, Chicago, Illinois 60602. Each of MDCP IV, MDP IV, Madison Dearborn and Messrs. Finnegan, Mencoff and Souleles may be deemed to share voting and dispositive power with
respect to the shares of our common stock held of record by BC Holdings. Each of Messrs. McGowan, Madigan, Mencoff and Souleles has indirect pecuniary interests in the shares of our common
stock held of record by BC Holdings through their investments in MDP IV and/or MDCP IV. Each expressly disclaims beneficial ownership of the shares of our common stock held of record by
BC Holdings except to the extent of his pecuniary interest therein.
- (2)
- Messrs. Carlile,
McDougall, Rancourt, Bell, Lovlien and Sahlberg are investors in FPH. None of the foregoing persons has direct or indirect voting
or dispositive power with respect to the shares of our common stock held of record by BC Holdings.
- (3)
- Mr. Madigan is an investor in FPH but does not have direct or indirect voting or dispositive power with respect to the shares of Boise Cascade common stock held of record by BC Holdings.
124
CERTAIN RELATIONSHIPS AND RELATED PARTY TRANSACTIONS
Policy and Procedures Regarding Related-Party Transactions
Our policy regarding transactions with related persons requires that a "related person" (as defined in paragraph (a) of Item 404 of Regulation S-K) must promptly disclose to our general counsel any "related person transaction" (defined as any transaction that is reportable by us under Item 404(a) of Regulation S-K in which we are or will be a participant and the amount involved exceeds $120,000 and in which any related person has or will have a direct or indirect material interest) in which such related person has or will have a direct or indirect material interest and all material facts with respect thereto. The general counsel will promptly communicate such information to our Audit Committee or another independent body of our board of directors. No related-person transaction will be entered into without the approval or ratification of our Audit Committee or another independent body of our board of directors. It is our policy that directors interested in a related-person transaction will recuse themselves from any such vote. Our policy does not specify the standards to be applied by our Audit Committee or another independent body of our board of directors in determining whether or not to approve or ratify a related-person transaction, and we accordingly anticipate that these determinations will be made in accordance with Delaware law.
OfficeMax and the Forest Products Acquisition
In 2004, FPH acquired the forest products and paper assets of OfficeMax. A portion of the consideration paid to OfficeMax was 109 million shares of BC Holdings' Series B equity units, which represented at December 31, 2012, 20.4% of BC Holdings' equity securities, with the remainder held by FPH. In connection with the Forest Products Acquisition, FPH and/or its subsidiaries (including us) entered into a number of agreements, including an asset purchase agreement, a securityholders agreement and a registration rights agreement with OfficeMax and/or its subsidiaries. Under the asset purchase agreement, OfficeMax indemnifies Boise Cascade for specified preclosing liabilities, including environmental, asbestos, tax, benefits and other legacy liabilities.
Registration Rights Agreement
In connection with our initial public offering, we entered into a registration rights agreement with BC Holdings on February 8, 2013. BC Holdings is entitled to request that the company register its shares on a long-form or short-form registration statement on one or more occasions in the future, which registrations may be "shelf registrations." BC Holdings is also entitled to participate in certain registered offerings by the company, subject to the restrictions in the registration rights agreement. The company will pay BC Holdings' expenses in connection with BC Holdings' exercise of these rights. The registration rights described in this paragraph apply to (i) shares of our common stock held by BC Holdings as of February 11, 2013, (ii) any of our capital stock (or that of our subsidiaries) issued or issuable with respect to the common stock described in clause (i) with respect to any dividend, distribution, recapitalization, reorganization, or certain other corporate transactions, and (iii) any of our common stock held by MDCP IV and its affiliates (the "Registrable Securities"). These registration rights are also for the benefit of any subsequent holder of Registrable Securities; provided that any particular securities will cease to be Registrable Securities when they have been sold in a registered public offering, sold in compliance with Rule 144 of the Securities Act, or repurchased by us or our subsidiaries. In addition, with the consent of Boise Cascade and holders of a majority of Registrable Securities, any Registrable Securities held by a person other than MDCP IV and its affiliates will cease to be Registrable Securities if they can be sold without limitation under Rule 144 of the Securities Act.
125
Nomination of our Directors
In connection with our initial public offering, we entered into a Director Nomination Agreement with BC Holdings on February 11, 2013, that provides BC Holdings the right to designate nominees for election to our board of directors for so long as BC Holdings beneficially owns 10% or more of the total number of shares of our common stock then outstanding. MDCP IV may cause BC Holdings to assign its designation rights under the Director Nomination Agreement to MDCP IV or to an MDCP IV affiliate so long as MDCP IV and its affiliates are the beneficial owners of 50% or more of BC Holding's voting equity interests.
The number of nominees that BC Holdings is entitled to designate under this agreement bears the same proportion to the total number of members of our board of directors as the number of shares of common stock beneficially owned by BC Holdings bears to the total number of shares of common stock outstanding, rounded up to the nearest whole number. In addition, BC Holdings is entitled to designate the replacement for any of its board designees whose board service terminates prior to the end of the director's term regardless of BC Holdings' beneficial ownership at such time. BC Holdings also has the right to have its designees participate on committees of our board of directors proportionate to its stock ownership, subject to compliance with applicable law and stock exchange rules. This agreement will terminate at such time as BC Holdings owns less than 10% of our outstanding common stock.
Additional Transactions
During each of 2010, 2011 and 2012, we purchased $0.3 million of office supplies from OfficeMax.
Other
For a description of other relationships the company has with its directors and executive officers, refer to "Management" and "Executive Compensation" elsewhere in this prospectus.
126
DESCRIPTION OF CERTAIN INDEBTEDNESS
Asset-Based Revolving Credit Facility
On July 13, 2011, Boise Cascade and its principal operating subsidiaries, Boise Cascade Wood Products, L.L.C. and Boise Cascade Building Materials Distribution, L.L.C., as borrowers, and Boise Cascade Wood Products Holdings Corp., as guarantor, entered into our senior secured revolving credit facility. On September 7, 2012, we entered into a first amendment to the credit agreement governing the revolving credit facility, which increased the aggregate lending commitments under the revolving credit facility to $300 million. Other key terms of the credit agreement were unchanged by the amendment. On December 20, 2012, we entered into a Limited Consent and Amendment to Loan Documents with the lenders under our revolving credit facility. The consent and amendment provided consent to, among other things, the distributions of $225.0 million in aggregate to BC Holdings made in late December 2012 and our conversion to a corporation effected on February 4, 2013. On May 15, 2013, we entered into a third amendment to the credit agreement governing the credit facility, which reduced unused commitment fees as described below. The revolving credit facility has a maturity date of July 13, 2016.
At March 31, 2013, and December 31, 2012, we had no borrowings and $25.0 million outstanding, respectively, under the revolving credit facility and $9.8 million and $10.0 million, respectively, of letters of credit outstanding. These letters of credit and borrowings reduced our borrowing capacity under the revolving credit facility by an equivalent amount. The maximum borrowings under the revolving credit facility were $75.0 million during the three months ended March 31, 2013.
The revolving credit facility is secured by a first-priority security interest in substantially all of our assets constituting inventory, receivables, cash and other assets related to the foregoing. Such security interest does not include other property, plants and equipment. Borrowings under the revolving credit facility are constrained by a borrowing base formula dependent upon Availability.
Interest rates under the revolving credit facility are based, at the company's election, on either LIBOR or a base rate, as defined in the agreement, plus a spread over the index elected that ranges from 1.75% to 2.25% for loans based on LIBOR and from 0.75% to 1.25% for loans based on the base rate. The spread is determined on the basis of a pricing grid that results in a higher spread as average quarterly Availability declines. Letters of credit are subject to a 0.15% fronting fee payable to the issuing bank and a fee payable to the lenders equal to the LIBOR margin rate. In addition, effective with the third amendment, the company is required to pay an unused commitment fee at a rate of 0.375% per annum of the average unused portion of the lending commitments. If we have utilized more than 40% of the commitments, the unused commitment fee percentage reduces to 0.25%.
The revolving credit facility contains customary nonfinancial covenants, including restrictions on new indebtedness, issuance of liens, investments, distributions to equityholders, asset sales and affiliate transactions. The revolving credit facility also contains a requirement that we meet a 1:1 FCCR if Availability falls below the greater of $31.25 million or 12.5% of the aggregate lending commitments. Availability exceeded the minimum threshold amounts required for testing of the FCCR at all times since entering into the revolving credit facility, and Availability at December 31, 2012, was $195.6 million. At December 31, 2012, after giving effect to our conversion to a corporation and the completion of our initial public offering and the use of proceeds therefrom, our aggregate liquidity from unrestricted cash and cash equivalents and unused borrowing capacity (net of the Availability threshold amount for testing of the FCCR, as applicable) under the revolving credit facility totaled $488.1 million.
The revolving credit facility generally permits dividends only if certain conditions are met, including complying with the minimum Availability requirements and having a fixed charged coverage
127
ratio of 1:1 on a pro forma basis. On December 20, 2012, we entered into a Limited Consent and Amendment to Loan Documents with the lenders under the revolving credit facility. The consent and amendment provided consent to our initial public offering and certain transactions undertaken in connection with such offering, including the cash distributions of $225.0 million in aggregate to BC Holdings subsequently made in late December 2012, and our conversion to a corporation on February 4, 2013. As a condition to such consent and amendment and pursuant to a related General Continuing Guaranty, BC Holdings agreed to become a guarantor under the revolving credit facility until such time as we received net proceeds of at least $115 million from the sale of our common stock, including proceeds from our initial public offering, or we received at least $115 million in the form of an equity investment. Following consummation of our initial public offering, because the conditions set forth under such consent and amendment and the General Continuing Guaranty were satisfied, BC Holdings was released from its guaranty under the revolving credit facility and therefore is no longer subject to contractual restrictions on making dividends or otherwise.
Senior Notes
On October 22, 2012, Boise Cascade L.L.C. (as the predecessor to Boise Cascade Company) and its former wholly owned subsidiary, Boise Cascade Finance Corporation, issued $250.0 million of senior notes, through a private placement that is exempt from the registration requirements of the Securities Act. In accordance with the terms of the indenture governing the senior notes, on March 28, 2013, Boise Cascade Finance Corporation was merged with and into Boise Cascade, with Boise Cascade as the surviving entity. After such merger, Boise Cascade survived as the sole issuer of the senior notes. Interest on the senior notes is payable semiannually in arrears on May 1 and November 1, commencing on May 1, 2013. Net proceeds from such offering of senior notes were used to redeem $144.6 million of our then outstanding senior subordinated notes, including $1.0 million of interest through the related redemption date of November 21, 2012. The remaining net proceeds are available for general corporate purposes.
As a result of this refinancing, we extended the maturity of a portion of our long-term debt and lowered the related interest rate. The senior notes are guaranteed by each of our existing and future direct or indirect domestic subsidiaries that is a guarantor or co-borrower under the revolving credit facility. On the issue date of the senior notes, the senior notes were guaranteed by BC Holdings. However, pursuant to the indenture governing the notes, BC Holdings' guarantee was automatically released when Boise Cascade's common stock was registered under the Exchange Act and was listed on the NYSE. On March 28, 2013, Boise Cascade Finance Corporation was merged with and into Boise Cascade, with Boise Cascade as the surviving company and the sole issuer of the senior notes.
In connection with the issuance of the senior notes, we entered into a related registration rights agreement. Such registration rights agreement required us to register under the Securities Act the senior notes having substantially identical terms to those of the senior notes and to complete an exchange of the privately placed senior notes for the publicly registered notes on or prior to October 21, 2013 or, in certain circumstances, to file and keep effective a shelf registration statement for resale of the senior notes. To satisfy our obligations under the registration rights agreement, we registered the senior notes under the Securities Act pursuant to a registration statement declared effective on April 9, 2013, and completed the exchange of all of our outstanding senior notes for registered senior notes on May 8, 2013.
The senior notes are senior unsecured obligations and rank equally with all of our and the guarantors' existing and future senior indebtedness, senior to all of their existing and future subordinated indebtedness, effectively subordinated to all of their present and future senior secured indebtedness (including all borrowings with respect to our revolving credit facility to the extent of the value of the assets securing such indebtedness), and structurally subordinated to the indebtedness of any subsidiaries that do not guarantee the senior notes.
128
The terms of the indenture governing the senior notes, among other things, limit our ability and the ability of certain of our subsidiaries to: incur additional debt; declare or pay dividends; redeem stock or make other distributions to stockholders; make investments; create liens on assets; consolidate, merge, or transfer substantially all of their assets; enter into transactions with affiliates and sell or transfer certain assets.
The indenture governing the senior notes provides for customary events of default, which include (subject in certain cases to customary grace and cure periods and notification requirements), among others: nonpayment of principal or interest; breach of other agreements in the indenture governing the senior notes; defaults in failure to pay certain other indebtedness; the rendering of judgments to pay certain amounts of money against the issuer, the guarantors, or certain of our subsidiaries; the failure of certain guarantees to be enforceable and certain events of bankruptcy or insolvency.
129
The following is a summary of our capital stock and provisions of our certificate of incorporation, our bylaws and certain provisions of Delaware law. This summary does not purport to be complete and is qualified in its entirety by the provisions of our certificate of incorporation and bylaws, which are incorporated by reference herein. References in this section to the "Company," "we," "us" and "our" refer to Boise Cascade Company and not to any of its subsidiaries.
Authorized Capitalization
Our certificate of incorporation provides that our authorized capital stock consists of 300,000,000 shares of common stock, par value $0.01 per share and 50,000,000 shares of undesignated preferred stock, par value $0.01 per share. As of July 15, 2013, we had 43,229,412 shares of common stock outstanding and no shares of preferred stock outstanding and two registered stockholders of record, one of which was Cede & Co., which is the nominee of shares held through The Depository Trust Company.
Common Stock
Voting Rights
Each share of common stock entitles the holder to one vote with respect to each matter presented to our stockholders on which the holders of common stock are entitled to vote. Our common stock votes as a single class on all matters relating to the election of directors on our board of directors and as provided by law. Holders of our common stock will not have cumulative voting rights. Except in respect of matters relating to the election and removal of directors on our board of directors and as otherwise provided in our certificate of incorporation or required by law, all matters to be voted on by our stockholders must be approved by a majority of the shares present in person or by proxy at the meeting and entitled to vote on the subject matter. In the case of the election of directors, all matters to be voted on by our stockholders must be approved by a plurality of the votes entitled to be cast by all shares of common stock.
Dividend Rights
The holders of our outstanding shares of common stock are entitled to receive dividends, if any, as may be declared from time to time by our board of directors out of legally available funds. See "Dividend Policy." Because we are a holding company, our ability to pay dividends on our common stock is limited by restrictions on the ability of our subsidiaries to pay dividends or make distributions to us, including restrictions under the terms of the agreements governing our indebtedness.
Liquidation Rights
In the event of any voluntary or involuntary liquidation, dissolution or winding up of our affairs, holders of our common stock would be entitled to share ratably in our assets that are legally available for distribution to stockholders after payment of our debts and other liabilities. If we have any preferred stock outstanding at such time, holders of the preferred stock may be entitled to distribution and/or liquidation preferences. In either such case, we must pay the applicable distribution to the holders of our preferred stock before we may pay distributions to the holders of our common stock.
Other Rights
Our stockholders have no preemptive, conversion or other rights to subscribe for additional shares. All outstanding shares are validly issued, fully paid and nonassessable. The rights, preferences and privileges of the holders of our common stock are subject to and may be adversely affected by, the
130
rights of the holders of shares of any series of our preferred stock that we may designate and issue in the future.
Listing
Our common stock is listed on the NYSE under the symbol "BCC."
Transfer Agent and Registrar
The transfer agent and registrar for our common stock is Wells Fargo Bank, N.A.
Preferred Stock
Our certificate of incorporation authorizes our board of directors to provide for the issuance of shares of preferred stock in one or more series and to fix the preferences, powers and relative, participating, optional or other special rights and qualifications, limitations or restrictions thereof, including the dividend rate, conversion rights, voting rights, redemption rights and liquidation preference and to fix the number of shares to be included in any such series without any further vote or action by our stockholders. Any preferred stock so issued may rank senior to our common stock with respect to the payment of dividends or amounts upon liquidation, dissolution or winding up, or both. The issuance of preferred stock may have the effect of delaying, deferring or preventing a change in control of our company without further action by the stockholders and may adversely affect the voting and other rights of the holders of common stock. The issuance of preferred stock with voting and conversion rights may adversely affect the voting power of the holders of common stock, including the loss of voting control to others. At present, we have no plans to issue any preferred stock.
Board Composition
We have been deemed to be a "controlled company" under the rules of the NYSE because more than 50% of our outstanding voting power is held by BC Holdings. See "Principal and Selling Stockholder." We currently rely upon the "controlled company" exception to the NYSE board of directors and committee independence requirements. Pursuant to this exception, we are exempt from the rules that would otherwise require that our board of directors consist of a majority of independent directors and that our Compensation Committee and Governance and Nominating Committee be composed entirely of independent directors. Upon completion of this offering, we will cease to be a "controlled company" and we will have one year from the date we cease to be a controlled company to comply with all of NYSE's corporate governance requirements. The "controlled company" exception does not modify the independence requirements for the Audit Committee, and we are in compliance with the requirements of the Sarbanes-Oxley Act and the NYSE rules, which require that our Audit Committee consist exclusively of independent directors within one year of our initial public offering.
Our board of directors is divided into three classes, as nearly equal in number as possible, with each director serving a three-year term and one class being elected at each year's annual meeting of stockholders. Messrs. Carlile and McDougall are in the class of directors whose term expires at the first annual meeting of stockholders following the date of this prospectus. Messrs. Fleming, McGowan and Madigan are in the class of directors whose term expires at the second annual meeting of stockholders following the date of this prospectus. Messrs. Mencoff, Norton and Souleles are in the class of directors whose term expires at the third annual meeting of stockholders following the date of this prospectus. At each annual meeting of our stockholders, successors to the class of directors whose term expires at such meeting will be elected to serve for three-year terms or until their respective successors are elected and qualified.
131
Corporate Opportunity
Messrs. Mencoff, Norton and Soueleles, who are officers or employees of Madison Dearborn, serve on our board of directors. Madison Dearborn is the ultimate principal equityholder of BC Holdings, our current majority stockholder. Madison Dearborn and entities controlled by them may hold equity interests in entities that directly or indirectly compete with us, and companies in which they currently invest may begin competing with us. As a result of these relationships, when conflicts between the interests of Madison Dearborn, on the one hand, and of other stockholders, on the other hand, arise, these directors may not be disinterested. Although our directors and officers have a duty of loyalty to us under Delaware law and our certificate of incorporation, transactions that we enter into in which a director or officer has a conflict of interest are generally permissible so long as (1) the material facts relating to the director's or officer's relationship or interest as to the transaction are disclosed to our board of directors and a majority of our disinterested directors approves the transaction, (2) the material facts relating to the director's or officer's relationship or interest as to the transaction are disclosed to our stockholders and a majority of our disinterested stockholders approve the transaction or (3) the transaction is otherwise fair to us. Our certificate of incorporation also provides that any principal, officer, member, manager and/or employee of Madison Dearborn or any entity that controls, is controlled by or under common control with, Madison Dearborn (other than FPH, BC Holdings, the company or any company that is controlled by the company) or any investment funds managed by Madison Dearborn is not required to offer any transaction opportunity of which they become aware to us and could take any such opportunity for themselves or offer it to other companies in which they have an investment.
Anti-takeover Effects of Delaware Law and Our Certificate of Incorporation and Bylaws
Our certificate of incorporation and bylaws also contain provisions that may delay, defer or discourage another party from acquiring control of us. We believe that these provisions, which are summarized below, discourage coercive takeover practices or inadequate takeover bids. These provisions are also designed to encourage persons seeking to acquire control of us to first negotiate with our board of directors, which we believe may result in an improvement of the terms of any such acquisition in favor of our stockholders. However, they also give our board of directors the power to discourage acquisitions that some stockholders may favor.
Undesignated Preferred Stock
The ability to authorize undesignated preferred stock makes it possible for our board of directors to issue preferred stock with super voting, special approval, dividend or other rights or preferences on a discriminatory basis that could impede the success of any attempt to acquire us. These and other provisions may have the effect of deferring, delaying or discouraging hostile takeovers, or changes in control or management of our company.
Classified Board of Directors
Our certificate of incorporation provides that our board of directors is divided into three classes, with each class serving three-year staggered terms. In addition, under our certificate of incorporation, on and after the date that MDCP IV and its affiliates cease to beneficially own a majority of the voting power of our then outstanding capital stock entitled to vote generally in the election of directors (the "Trigger Date"), our directors may only be removed for cause and only upon the affirmative vote of the majority of our outstanding voting stock, at a meeting of our stockholders called for that purpose. These provisions may have the effect of deferring, delaying or discouraging hostile takeovers, or changes in control or management of our company.
132
Special Meetings of Stockholders
Our certificate of incorporation provides that special meetings of the stockholders may be called only upon a resolution approved by a majority of the total number of directors that we would have if there were no vacancies or, prior to the Trigger Date, at the request of the holders of a majority of the voting power of our then outstanding shares of voting capital stock.
Requirements for Nominations and Proposals at Stockholder Meetings
Our bylaws prohibit the conduct of any business at a special meeting other than as specified in the notice for such meeting. Our bylaws also provide that nominations of persons for election to our board of directors may be made at a special meeting of stockholders at which directors are to be elected pursuant to the notice of meeting (1) by or at the direction of our board of directors or (2) provided that our board of directors has determined that directors shall be elected at such meeting, by any stockholder who (i) is a stockholder of record both at the time the notice is delivered and on the record date for the determination of stockholders entitled to vote at the special meeting, (ii) is entitled to vote at the meeting and upon such election and (iii) complies with the notice procedures set forth in our bylaws. These provisions may have the effect of deferring, delaying or discouraging hostile takeovers, or changes in control or management of our company. These provisions do not apply to nominations by BC Holdings pursuant to the Director Nomination Agreement.
Stockholder Action by Written Consent
Pursuant to Section 228 of the DGCL, any action required to be taken at any annual or special meeting of the stockholders may be taken without a meeting, without prior notice and without a vote if a consent or consents in writing, setting forth the action so taken, is signed by the holders of outstanding stock having not less than the minimum number of votes that would be necessary to authorize or take such action at a meeting at which all shares of our stock entitled to vote thereon were present and voted, unless our company's certificate of incorporation provides otherwise. Our certificate of incorporation provides that, prior to the Trigger Date, any action required or permitted to be taken by our stockholders may be effected by written consent. From and after the Trigger Date, any action required or permitted to be taken by the stockholders may be effected only at a duly called annual or special meeting.
Business Combinations with Interested Stockholders
We have elected in our certificate of incorporation not to be subject to Section 203 of the DGCL, an anti-takeover law. In general, Section 203 prohibits a publicly held Delaware corporation from engaging in a business combination, such as a merger, with a person or group owning 15% or more of the corporation's voting stock for a period of three years following the date the person became an interested stockholder, unless (with certain exceptions) the business combination or the transaction in which the person became an interested stockholder is approved in a prescribed manner. Accordingly, we are not subject to any anti-takeover effects of Section 203. However, our certificate of incorporation contains provisions that have the same effect as Section 203, except that they provide that (i) Madison Dearborn and any of its affiliates or associates, including any investment funds managed by Madison Dearborn, (ii) any other person with whom any of the foregoing are acting as a group or in concert for the purpose of acquiring, holding, voting or disposing of shares of our stock and (iii) any person who would otherwise be an interested stockholder because of a transfer of 5% or more of our outstanding voting stock by any person described in clause (i) or (ii) to such person are excluded from the "interested stockholder" definition in our certificate of incorporation and are therefore not subject to the restrictions therein that have the same effect as Section 203.
133
Requirements for Amendments to our Certificate of Incorporation and Bylaws
Our certificate of incorporation provides that, prior to the Trigger Date, our bylaws may be adopted, amended, altered or repealed by the vote of a majority of the voting power of our then outstanding voting stock, voting together as a single class. After the Trigger Date, our bylaws may be adopted, amended, altered or repealed by either (i) a vote of a majority of the total number of directors that the company would have if there were no vacancies or (ii) in addition to any other vote otherwise required by law, the affirmative vote of the holders of at least 662/3% of the voting power of our then outstanding capital stock entitled to vote generally in the election of directors, voting together as a single class.
Following the Trigger Date, the provisions of our certificate of incorporation relating to the size and composition of our board of directors, limitation on liabilities of directors, stockholder action by written consent, the ability of stockholders to call special meetings, business combinations with interested persons, amendment of our bylaws or certificate of incorporation and the Court of Chancery as the exclusive forum for certain disputes, may only be amended, altered, changed or repealed by the affirmative vote of the holders of at least 662/3% of the voting power of all of our outstanding shares of capital stock entitled to vote generally in the election of directors, voting together as a single class. Our certificate of incorporation provides that, prior to the Trigger Date, such provisions may be amended, altered, changed or repealed by the affirmative vote of the holders of a majority of the voting power of our then outstanding capital stock entitled to vote generally in the election of directors, voting together as a single class. Our certificate of incorporation also provides that the provision of our certificate of incorporation that deals with corporate opportunity may only be amended, altered or repealed by a vote of 80% of the voting power of our then outstanding capital stock entitled to vote generally in the election of directors, voting together as a single class.
134
SHARES ELIGIBLE FOR FUTURE SALE
Future sales of substantial amounts of our common stock in the public market, or the perception that such sales may occur, could adversely affect the prevailing market price of our common stock. No prediction can be made as to the effect, if any, future sales of shares, or the availability of shares for future sales, will have on the market price of our common stock prevailing from time to time. The sale of substantial amounts of our common stock in the public market, or the perception that such sales could occur, could harm the prevailing market price of our common stock.
Rule 144
In general, under Rule 144 of the Securities Act as currently in effect, once we have been subject to public company reporting requirements for at least 90 days, a person who is not deemed to have been one of our affiliates for purposes of the Securities Act at any time during 90 days preceding a sale and who has beneficially owned the shares proposed to be sold for at least six months, including the holding period of any prior owner other than our affiliates, is entitled to sell such shares without complying with the manner of sale, volume limitation or notice provisions of Rule 144, subject to compliance with the public information requirements of Rule 144. If such a person has beneficially owned the shares proposed to be sold for at least one year, including the holding period of any prior owner other than our affiliates, then such person is entitled to sell such shares without complying with any of the requirements of Rule 144.
In general, under Rule 144, as currently in effect, our affiliates or persons selling shares on behalf of our affiliates are entitled to sell within any three-month period beginning 90 days after the date of this prospectus, a number of shares that does not exceed the greater of:
- •
- 1% of the number of shares of common stock then outstanding; or
- •
- the average weekly trading volume of the common stock during the four calendar weeks preceding the filing of a notice on Form 144 with respect to such sale.
Rule 144 also provides that a person who is not deemed to have been an affiliate of ours at any time during the three months preceding a sale and who has for at least six months beneficially owned shares of our common stock that are restricted securities, will be entitled to freely sell such shares of our common stock subject only to the availability of current public information regarding us. A person who is not deemed to have been an affiliate of ours at any time during the three months preceding a sale and who has beneficially owned for at least one year shares of our common stock that are restricted securities, will be entitled to freely sell such shares of our common stock under Rule 144 without regard to the current public information requirements of Rule 144.
Registration Rights
BC Holdings is entitled to various rights with respect to the registration of shares under the Securities Act. This offering of common stock by BC Holdings is the result of the exercise of such registration rights. Registration under the Securities Act of the shares offered hereby and the shares held BC Holdings following this offering will and would result in these shares becoming fully tradable under the Securities Act immediately upon the effectiveness of the registration, except for shares held by affiliates. Shares covered by a future registration statement will be eligible for sales in the public market upon the expiration or release from the terms of the lock-up agreements referred to below.
Rule 701
Rule 701 generally allows a stockholder who purchased shares of our common stock pursuant to a written compensatory plan or contract and who is not deemed to have been an affiliate of our company during the immediately preceding 90 days to sell these shares in reliance upon Rule 144, but
135
without being required to comply with the public information, holding period, volume limitation or notice provisions of Rule 144. Rule 701 also permits affiliates of our company to sell their Rule 701 shares under Rule 144 without complying with the holding period requirements of Rule 144.
Stock Plans
We have registered on a registration statement on Form S-8 under the Securities Act, 3,100,000 shares of our common stock reserved for issuance, under the 2013 Incentive Plan. Such shares are available for sale in the open market, subject to the Rule 144 limitations applicable to affiliates.
Lock-Up Agreements
In connection with this offering, we, our directors and executive officers and BC Holdings, the selling stockholder, have entered into 90-day lock-up agreements with the underwriters of this offering under which none of us, our directors or executive officers, or BC Holdings (other than with respect to the shares offered hereby) may, for a period of 90 days after the date of this prospectus, directly or indirectly sell, dispose of or hedge any shares of common stock or any securities convertible into or exchangeable or exercisable for shares of common stock without the prior written consent of Merrill Lynch, Pierce, Fenner & Smith Incorporated and Goldman, Sachs & Co. on behalf of the underwriters. We may, however, issue or sell (or agree to issue or sell) up to 4,000,000 shares of common stock in connection with an acquisition or business combination without the prior written consent of Merrill Lynch, Pierce, Fenner & Smith Incorporated and Goldman, Sachs & Co. as long as the acquirer of such common stock agrees in writing to be bound by the obligations and restrictions of our lock-up agreement.
136
CERTAIN U.S. FEDERAL INCOME TAX CONSIDERATIONS TO NON-U.S. HOLDERS
The following is a summary of certain U.S. federal income tax consequences of the purchase, ownership and disposition of our common stock to a non-U.S. holder that purchases shares of our common stock in this offering. This summary applies only to a non-U.S. holder that holds our common stock as a capital asset, within the meaning of Section 1221 of the U.S. Internal Revenue Code of 1986, as amended (the "Code"). For purposes of this summary, a "non-U.S. holder" means any beneficial owner of our common stock that is, for U.S. federal income tax purposes, an individual, corporation, estate or trust other than:
- •
- an individual citizen or resident of the United States, as defined for U.S. federal income tax purposes;
- •
- a corporation or other entity treated as a corporation for U.S. federal income tax purposes created or organized in the
United States or under the laws of the United States or any political subdivision thereof;
- •
- an estate whose income is subject to U.S. federal income tax regardless of its source; or
- •
- a trust if it (1) is subject to the primary supervision of a court within the United States and one or more United States persons have the authority to control all substantial decisions of the trust or (2) has a valid election in place to be treated as a U.S. person for U.S. federal income tax purposes.
In the case of a holder that is classified as a partnership for U.S. federal income tax purposes, the tax treatment of a partner in such partnership generally will depend upon the status of the partner and the activities of the partner and the partnership. If you are a partner in a partnership considering an investment in our common stock, then you should consult your own tax advisor.
This summary is based upon the provisions of the Code, the Treasury regulations promulgated thereunder and administrative and judicial interpretations thereof, all as of the date hereof. Those authorities may be changed, perhaps retroactively, so as to result in U.S. federal income tax consequences different from those summarized below. We cannot assure you that a change in law, possibly with retroactive application, will not alter significantly the tax considerations that we describe in this summary. We have not sought and do not plan to seek any ruling from the U.S. Internal Revenue Service, which we refer to as the IRS, with respect to statements made and the conclusions reached in the following summary, and there can be no assurance that the IRS or a court will agree with our statements and conclusions.
This summary does not address all aspects of U.S. federal income taxes that may be relevant to non-U.S. holders in light of their personal circumstances, and does not deal with federal taxes other than the U.S. federal income tax (such as U.S. federal estate and gift tax laws or the Medicare tax on certain investment income) or with non-U.S., state or local tax considerations. Special rules, not discussed here, may apply to certain non-U.S. holders, including:
- •
- former citizens or residents of the U.S.;
- •
- brokers, dealers or traders in securities, commodities or currencies;
- •
- persons who hold our common stock as a position in a "straddle," "conversion transaction" or other risk reduction
transaction;
- •
- controlled foreign corporations, passive foreign investment companies (or their shareholders), or corporations that
accumulate earnings to avoid U.S. federal income tax;
- •
- tax-exempt organizations;
- •
- non-U.S. holders subject to the alternative minimum tax;
137
- •
- banks, insurance companies, or other financial institutions; and
- •
- pass-through entities and investors in pass-through entities that are subject to special treatment under the Code.
Such non-U.S. holders should consult their own tax advisors to determine the U.S. federal, state, local and other tax and tax treaty consequences that may be relevant to them.
If you are considering the purchase of our common stock, you should consult your own tax advisor concerning the particular U.S. federal income tax consequences to you of the purchase, ownership and disposition of our common stock, as well as the consequences to you arising under U.S. tax laws other than the federal income tax law or under the laws of any other taxing jurisdiction.
Dividends
As discussed under the section entitled "Dividend Policy" above, we do not currently anticipate paying dividends. In the event that we do make a distribution of cash or property (other than certain stock distributions) with respect to our common stock (or certain redemptions that are treated as distributions with respect to common stock), any such distributions will be treated as a dividend for U.S. federal income tax purposes to the extent paid from our current or accumulated earnings and profits (as determined under U.S. federal income tax principles). Dividends paid to you generally will be subject to withholding of U.S. federal income tax at a 30% rate or such lower rate as may be specified by an applicable income tax treaty. However, dividends that are effectively connected with the conduct of a trade or business by you within the U.S. are not subject to the withholding tax, but instead are subject to U.S. federal income tax on a net income basis at applicable graduated individual or corporate rates, unless an applicable income tax treaty provides otherwise. Certain certification and disclosure requirements, including delivery of a properly executed IRS Form W-8ECI, must be satisfied for effectively connected income to be exempt from withholding. Any such effectively connected dividends received by a foreign corporation may be subject to an additional "branch profits tax" at a 30% rate or such lower rate as may be specified by an applicable income tax treaty.
If the amount of a distribution paid on our common stock exceeds our current and accumulated earnings and profits, such excess will be allocated ratably among each share of common stock with respect to which the distribution is paid and treated first as a tax-free return of capital to the extent of your adjusted tax basis in each such share, and thereafter as capital gain from a sale or other taxable disposition of such share of common stock that is taxed to you as described below under the heading "Gain on Disposition of Common Stock." Any such distribution would also be subject to the discussion below under "—Legislation Affecting Taxation of Common Stock Held By or Through Foreign Entity." Your adjusted tax basis in a share is generally the purchase price of such share, reduced by the amount of any such tax-free returns of capital
If you wish to claim the benefit of an applicable treaty rate to avoid or reduce withholding of U.S. federal income tax for dividends, then you must (a) provide the withholding agent with a properly completed IRS Form W-8BEN (or other applicable form) and certify under penalties of perjury that you are not a U.S. person and are eligible for treaty benefits, or (b) if our common stock is held through certain foreign intermediaries, satisfy the relevant certification requirements of applicable U.S. Treasury regulations. Special certification and other requirements apply to certain non-U.S. holders that act as intermediaries (including partnerships).
If you are eligible for a reduced rate of U.S. federal income tax pursuant to an income tax treaty, then you may obtain a refund or credit of any excess amounts withheld by filing timely an appropriate claim with the IRS.
138
Gain on Disposition of Common Stock
You generally will not be subject to U.S. federal income tax with respect to gain realized on the sale or other taxable disposition of our common stock, unless:
- •
- the gain is effectively connected with a trade or business you conduct in the U.S., and, where a tax treaty applies, is
attributable to a U.S. permanent establishment;
- •
- if you are an individual, you are present in the U.S. for 183 days or more in the taxable year of the sale or other
taxable disposition and certain other conditions are met; or
- •
- we are or have been during a specified testing period a "U.S. real property holding corporation" for U.S. federal income tax purposes, and certain other conditions are met.
We believe that we are not, and we do not anticipate becoming, a "U.S. real property holding corporation" for U.S. federal income tax purposes. Even if we are or become a U.S. real property holding corporation, a non-U.S. holder generally will not be subject to U.S. federal income tax on any gain in respect of our common stock as long as our common stock is traded on an established securities market and such non-U.S. holder actually or constructively owned no more than 5% of our common stock during the specified testing period. If we are or become a U.S. real property holding corporation and you actually or constructively owned more than 5% of our common stock at any time during the specified testing period, you will be subject to tax on the net gain derived from the sale under regular graduated U.S. federal income tax rates. If you are a person described in the first bullet point above, you will be subject to tax on the net gain derived from the sale under regular graduated U.S. federal income tax rates. In addition, a non-U.S. holder corporation may be subject to the branch profits tax equal to 30% of its effectively connected earnings and profits or at such lower rate as may be specified by an applicable income tax treaty. If you are an individual described in the second bullet point above, you will be subject to a flat 30% tax on the gain derived from the sale, which may be offset by U.S. source capital losses.
Information Reporting and Backup Withholding
We must report annually to the IRS and to you the amount of dividends paid to you and the amount of tax, if any, withheld with respect to such dividends. The IRS may make this information available to the tax authorities in the country in which you are resident.
In addition, you may be subject to information reporting requirements and backup withholding (currently at a rate of 28%) with respect to dividends paid on, and the proceeds of disposition of, shares of our common stock, unless, generally, you certify under penalties of perjury (usually on IRS Form W-8BEN) that you are not a U.S. person or you otherwise establish an exemption. Additional rules relating to information reporting requirements and backup withholding with respect to payments of the proceeds from the disposition of shares of our common stock include:
- •
- If the proceeds are paid to or through the U.S. office of a broker, the proceeds generally will be subject to backup
withholding and information reporting, unless you certify under penalties of perjury (usually on IRS Form W-8BEN) that you are not a U.S. person or you otherwise establish an exemption.
- •
- If the proceeds are paid to or through a non-U.S. office of a broker that is not a U.S. person and is not a foreign person
with certain specified U.S. connections (a "U.S.-related person"), information reporting and backup withholding generally will not apply.
- •
- If the proceeds are paid to or through a non-U.S. office of a broker that is a U.S. person or a U.S.-related person, the proceeds generally will be subject to information reporting (but not to backup withholding), unless you certify under penalties of perjury (usually on IRS Form W-8BEN) that you are not a U.S. person or you otherwise establish an exemption.
139
Any amounts withheld under the backup withholding rules may be allowed as a refund or a credit against your U.S. federal income tax liability, provided the required information is timely furnished by you to the IRS.
Legislation Affecting Taxation of Common Stock Held By or Through Foreign Entities
In addition to the withholding discussed above, legislation enacted in 2010 generally will impose a withholding tax of 30 percent on dividend income from our common stock and the gross proceeds of a disposition of our common stock paid to a "foreign financial institution" (as defined in the legislation), unless such institution enters into an agreement with the U.S. government to collect and provide to the U.S. tax authorities substantial information regarding U.S. account holders of such institution (which would include certain equity and debt holders of such institution, as well as certain account holders that are foreign entities with U.S. owners). Absent any applicable exception, this legislation also generally will impose a withholding tax of 30 percent on dividend income from our common stock and the gross proceeds of a disposition of our common stock paid to a foreign entity that is not a foreign financial institution unless such entity provides the withholding agent with a certification identifying the substantial U.S. owners of the entity, which generally includes any U.S. person who directly or indirectly own more than 10 percent of the entity. Under certain circumstances, a non-U.S. holder of our common stock might be eligible for refunds or credits of such taxes, and a non-U.S. holder might be required to file a U.S. federal income tax return to claim such refunds or credits. Recently finalized U.S. Treasury regulations and IRS Notice 2013-43 delayed the implementation of withholding (i) on dividend income until July 1, 2014 and (ii) on gross proceeds from the disposition of stock until January 1, 2017. Additional requirements and conditions may be imposed pursuant to an intergovernmental agreement (if and when entered into) between United States and a non-U.S. holder's home jurisdiction governing FATCA. Investors are encouraged to consult with their own tax advisors regarding the implications of this legislation on their investment in our common stock.
THE SUMMARY OF CERTAIN U.S. FEDERAL INCOME TAX CONSEQUENCES ABOVE IS INCLUDED FOR GENERAL INFORMATION PURPOSES ONLY. POTENTIAL PURCHASERS OF OUR COMMON STOCK ARE URGED TO CONSULT THEIR OWN TAX ADVISORS TO DETERMINE THE U.S. FEDERAL, STATE, LOCAL AND NON-U.S. TAX AND TAX TREATY CONSIDERATIONS OF PURCHASING, OWNING AND DISPOSING OF OUR COMMON STOCK.
140
Merrill Lynch, Pierce, Fenner & Smith Incorporated and Goldman, Sachs & Co. are acting as representatives of each of the underwriters named below. Subject to the terms and conditions set forth in an underwriting agreement among us, the selling stockholder and the underwriters, the selling stockholder has agreed to sell to the underwriters, and each of the underwriters has agreed, severally and not jointly, to purchase from the selling stockholder, the number of shares of common stock set forth opposite its name below.
| Underwriter |
Number of Shares |
|||
|---|---|---|---|---|
Merrill Lynch, Pierce, Fenner & Smith |
||||
Goldman, Sachs & Co. |
||||
Deutsche Bank Securities Inc. |
||||
J.P. Morgan Securities LLC |
||||
Wells Fargo Securities, LLC |
||||
Barclays Capital Inc. |
||||
Citigroup Global Markets Inc. |
||||
D.A. Davidson & Co. |
||||
Total |
||||
Subject to the terms and conditions set forth in the underwriting agreement, the underwriters have agreed, severally and not jointly, to purchase all of the shares sold under the underwriting agreement if any of these shares are purchased. If an underwriter defaults, the underwriting agreement provides that the purchase commitments of the nondefaulting underwriters may be increased or the underwriting agreement may be terminated.
We and the selling stockholder have agreed to indemnify the several underwriters against certain liabilities, including liabilities under the Securities Act, or to contribute to payments the underwriters may be required to make in respect of those liabilities.
The underwriters are offering the shares, subject to prior sale, when, as and if issued to and accepted by them, subject to approval of legal matters by their counsel, including the validity of the shares, and other conditions contained in the underwriting agreement, such as the receipt by the underwriters of officer's certificates and legal opinions. The underwriters reserve the right to withdraw, cancel or modify offers to the public and to reject orders in whole or in part.
Commissions and Discounts
The representatives have advised us and the selling stockholder that the underwriters propose initially to offer the shares to the public at the public offering price set forth on the cover of this prospectus and to dealers at that price less a concession not in excess of $ per share. After the initial offering, the public offering price, concession or any other term of the offering may be changed.
141
The following table shows the public offering price, underwriting discount and proceeds before expenses to us. The information assumes either no exercise or full exercise by the underwriters of their option to purchase additional shares.
| |
Per Share | Without Option | With Option | |||
|---|---|---|---|---|---|---|
Public offering price |
$ | $ | $ | |||
Underwriting discount |
$ | $ | $ | |||
Proceeds, before expenses, to the selling stockholder |
$ | $ | $ |
The expenses of the offering, not including the underwriting discount and certain offering expenses payable by the underwriters, are estimated at $ million and are payable by us and the selling stockholder. The underwriters have agreed to pay certain of the selling stockholder's offering expenses up to $ .
Option to Purchase Additional Shares
The selling stockholder has granted an option to the underwriters to purchase up to 1,500,000 additional shares at the public offering price, less the underwriting discount. The underwriters may exercise this option for 30 days from the date of this prospectus. If the underwriters exercise this option, each will be obligated, subject to conditions contained in the underwriting agreement, to purchase a number of additional shares proportionate to that underwriter's initial amount reflected in the above table
No Sales of Similar Securities
We, our directors and executive officers, and the selling stockholder, BC Holdings (other than with respect to the shares offered hereby), have agreed not to sell or transfer any common stock or securities convertible into, exchangeable for, exercisable for, or repayable with common stock, for 90 days after the date of this prospectus without first obtaining the written consent of Merrill Lynch, Pierce, Fenner & Smith Incorporated and Goldman, Sachs & Co. Specifically, we, our directors and executive officers, and BC Holdings have agreed, with certain limited exceptions, not to directly or indirectly:
- •
- offer, pledge, sell or contract to sell any common stock;
- •
- sell any option or contract to purchase any common stock;
- •
- purchase any option or contract to sell any common stock;
- •
- grant any option, right or warrant for the sale of any common stock;
- •
- otherwise dispose of or transfer any common stock; or
- •
- enter into any swap or other agreement or transaction that transfers, in whole or in part, directly or indirectly, the economic consequence of ownership of any common stock whether any such swap or transaction is to be settled by delivery of shares or other securities, in cash or otherwise.
We may, however, issue or sell (or agree to issue or sell) up to 4,000,000 shares of common stock in connection with an acquisition or business combination without the prior written consent of Merrill Lynch, Pierce, Fenner & Smith Incorporated and Goldman, Sachs & Co. as long as the acquirer of such common stock agrees in writing to be bound by the obligations and restrictions of our lock-up agreement.
142
This lock-up provision applies to common stock and to securities convertible into or exchangeable or exercisable for or repayable with common stock. It also applies to common stock owned now or acquired later by the person executing the agreement or for which the person executing the agreement later acquires the power of disposition. In the event that either (x) during the last 17 days of the lock-up period referred to above, we issue an earnings release or material news or a material event relating to us occurs or (y) prior to the expiration of the lock-up period, we announce that we will release earnings results or become aware that material news or a material event will occur during the 16-day period beginning on the last day of the lock-up period, the restrictions described above shall continue to apply until the expiration of the 18-day period beginning on the issuance of the earnings release or the occurrence of the material news or material event, unless Merrill Lynch, Pierce, Fenner & Smith Incorporated and Goldman, Sachs & Co. waive, in writing, such extension.
New York Stock Exchange
The shares of our common stock are listed on the NYSE under the symbol "BCC." The public offering price will be determined through negotiations between the selling stockholder and the representatives. In addition to prevailing market conditions, the factors to be considered in determining the public offering price are:
- •
- the valuation multiples of publicly traded companies that the representative believes to be comparable to us;
- •
- our financial information
- •
- the history of, and the prospects for, our company and the industry in which we compete;
- •
- an assessment of our management, its past and present operations, and the prospects for, and timing of, our future
revenues;
- •
- the present state of our development; and
- •
- the above factors in relation to market values and various valuation measures of other companies engaged in activities similar to ours.
An active trading market for the shares may not develop. It is also possible that after the offering the shares will not trade in the public market at or above the public offering price.
The underwriters do not expect to sell more than 5% of the shares in the aggregate to accounts over which they exercise discretionary authority.
Price Stabilization, Short Positions and Penalty Bids
Until the distribution of the shares is completed, SEC rules may limit underwriters and selling group members from bidding for and purchasing our common stock. However, the representatives may engage in transactions that stabilize the price of the common stock, such as bids or purchases to peg, fix or maintain that price.
In connection with the offering, the underwriters may purchase and sell our common stock in the open market. These transactions may include short sales, purchases on the open market to cover positions created by short sales and stabilizing transactions. Short sales involve the sale by the underwriters of a greater number of shares than they are required to purchase in the offering. "Covered" short sales are sales made in an amount not greater than the underwriters' option to purchase additional shares described above. The underwriters may close out any covered short position by either exercising their option to purchase additional shares or purchasing shares in the open market. In determining the source of shares to close out the covered short position, the underwriters will consider, among other things, the price of shares available for purchase in the open market as
143
compared to the price at which they may purchase shares through the option to purchase additional shares. "Naked" short sales are sales in excess of the option to purchase additional shares. The underwriters must close out any naked short position by purchasing shares in the open market. A naked short position is more likely to be created if the underwriters are concerned that there may be downward pressure on the price of our common stock in the open market after pricing that could adversely affect investors who purchase in the offering. Stabilizing transactions consist of various bids for or purchases of shares of common stock made by the underwriters in the open market prior to the completion of the offering.
The underwriters may also impose a penalty bid. This occurs when a particular underwriter repays to the underwriters a portion of the underwriting discount received by it because the representatives have repurchased shares sold by or for the account of such underwriter in stabilizing or short covering transactions.
Similar to other purchase transactions, the underwriters' purchases to cover the syndicate short sales may have the effect of raising or maintaining the market price of our common stock or preventing or retarding a decline in the market price of our common stock. As a result, the price of our common stock may be higher than the price that might otherwise exist in the open market. The underwriters may conduct these transactions on the NYSE, in the over-the-counter market or otherwise.
Neither we nor any of the underwriters make any representation or prediction as to the direction or magnitude of any effect that the transactions described above may have on the price of our common stock. In addition, neither we nor any of the underwriters make any representation that the representatives will engage in these transactions or that these transactions, once commenced, will not be discontinued without notice.
Electronic Distribution
In connection with the offering, certain of the underwriters or securities dealers may distribute prospectuses by electronic means, such as email.
Other Relationships
The underwriters and their respective affiliates are full service financial institutions engaged in various activities, which may include securities trading, commercial and investment banking, financial advisory, investment management, investment research, principal investment, hedging, financing and brokerage activities. Some of the underwriters and their affiliates have engaged in, and may in the future engage in, investment banking and other commercial dealings in the ordinary course of business with us or our affiliates, for which they received or will receive customary fees and expenses.
Merrill Lynch, Pierce, Fenner & Smith Incorporated, Goldman, Sachs & Co. and Wells Fargo Securities, LLC acted as initial purchasers in connection with the offering of our senior notes and may continue to hold a portion of such notes. In addition, affiliates of certain underwriters act in various capacities under our revolving credit facility. An affiliate of Wells Fargo Securities, LLC serves as an agent under our revolving credit facility and an affiliate of Merrill Lynch, Pierce, Fenner & Smith Incorporated serves as the syndication agent and lender under our revolving credit facility. An affiliate of J.P. Morgan Securities LLC is a lender under our revolving credit facility.
In addition, in the ordinary course of their business activities, the underwriters and their affiliates may make or hold a broad array of investments and actively trade debt and equity securities (or related derivative securities) and financial instruments (including bank loans) for their own account and for the accounts of their customers. Such investments and securities activities may involve securities and/or instruments of ours or our affiliates. The underwriters and their affiliates may also make investment recommendations and/or publish or express independent research views in respect of such
144
securities or financial instruments and may hold, or recommend to clients that they acquire, long and/or short positions in such securities and instruments.
Relationship with Solebury Capital LLC
BC Holdings has engaged Solebury Capital LLC, or Solebury, a FINRA member, to provide certain financial consulting services (which do not include underwriting services) in connection with this offering. BC Holdings has agreed to pay Solebury, only upon successful completion of this offering, a fee of $ , plus an incentive fee of up to $ payable at the sole discretion of BC Holdings. Pursuant to the terms of the engagement, BC Holdings has agreed to indemnify Solebury, subject to certain conditions. Solebury's services include advice with respect to deal structuring, fee and economics recommendations, and preparation of presentation materials. Solebury is not acting as an underwriter and has no contact with any public or institutional investor pursuant to this engagement. In addition, Solebury will not underwrite or purchase any of our common stock in this offering or otherwise participate in any such undertaking.
Notice to Prospective Investors in the European Economic Area
In relation to each Member State of the European Economic Area which has implemented the Prospectus Directive (each, a "Relevant Member State"), with effect from and including the date on which the Prospectus Directive is implemented in that Relevant Member State (the "Relevant Implementation Date"), no offer of shares may be made to the public in that Relevant Member State other than:
- A.
- to
any legal entity which is a qualified investor as defined in the Prospectus Directive;
- B.
- to
fewer than 100 or, if the Relevant Member State has implemented the relevant provision of the 2010 PD Amending Directive, 150, natural or legal persons
(other than qualified investors as defined in the Prospectus Directive), as permitted under the Prospectus Directive, subject to obtaining the prior consent of the representatives; or
- C.
- in any other circumstances falling within Article 3(2) of the Prospectus Directive,
provided that no such offer of shares shall require the company or the representatives to publish a prospectus pursuant to Article 3 of the Prospectus Directive or supplement a prospectus pursuant to Article 16 of the Prospectus Directive.
Each person in a Relevant Member State who initially acquires any shares or to whom any offer is made will be deemed to have represented, acknowledged and agreed that (A) it is a "qualified investor" within the meaning of the law in that Relevant Member State implementing Article 2(1)(e) of the Prospectus Directive, and (B) in the case of any shares acquired by it as a financial intermediary, as that term is used in Article 3(2) of the Prospectus Directive, the shares acquired by it in the offering have not been acquired on behalf of, nor have they been acquired with a view to their offer or resale to, persons in any Relevant Member State other than "qualified investors" as defined in the Prospectus Directive, or in circumstances in which the prior consent of the representatives has been given to the offer or resale. In the case of any shares being offered to a financial intermediary as that term is used in Article 3(2) of the Prospectus Directive, each such financial intermediary will be deemed to have represented, acknowledged and agreed that the shares acquired by it in the offer have not been acquired on a non-discretionary basis on behalf of, nor have they been acquired with a view to their offer or resale to, persons in circumstances which may give rise to an offer of any shares to the public other than their offer or resale in a Relevant Member State to qualified investors as so defined or in circumstances in which the prior consent of the representatives has been obtained to each such proposed offer or resale.
145
The company, the representatives and their affiliates will rely upon the truth and accuracy of the foregoing representation, acknowledgement and agreement.
This prospectus has been prepared on the basis that any offer of shares in any Relevant Member State will be made pursuant to an exemption under the Prospectus Directive from the requirement to publish a prospectus for offers of shares. Accordingly any person making or intending to make an offer in that Relevant Member State of shares which are the subject of the offering contemplated in this prospectus may only do so in circumstances in which no obligation arises for the company or any of the underwriters to publish a prospectus pursuant to Article 3 of the Prospectus Directive in relation to such offer. Neither the company nor the underwriters have authorized, nor do they authorize, the making of any offer of shares in circumstances in which an obligation arises for the company or the underwriters to publish a prospectus for such offer.
For the purpose of the above provisions, the expression "an offer to the public" in relation to any shares in any Relevant Member State means the communication in any form and by any means of sufficient information on the terms of the offer and the shares to be offered so as to enable an investor to decide to purchase or subscribe the shares, as the same may be varied in the Relevant Member State by any measure implementing the Prospectus Directive in the Relevant Member State and the expression "Prospectus Directive" means Directive 2003/71/EC (including the 2010 PD Amending Directive, to the extent implemented in the Relevant Member States) and includes any relevant implementing measure in the Relevant Member State and the expression "2010 PD Amending Directive" means Directive 2010/73/EU.
Notice to Prospective Investors in the United Kingdom
In addition, in the United Kingdom, this document is being distributed only to, and is directed only at, and any offer subsequently made may only be directed at persons who are "qualified investors" (as defined in the Prospectus Directive) (i) who have professional experience in matters relating to investments falling within Article 19(5) of the Financial Services and Markets Act 2000 (Financial Promotion) Order 2005, as amended (the "Order") and/or (ii) who are high net worth companies (or persons to whom it may otherwise be lawfully communicated) falling within Article 49(2)(a) to (d) of the Order (all such persons together being referred to as "relevant persons"). This document must not be acted on or relied on in the United Kingdom by persons who are not relevant persons. In the United Kingdom, any investment or investment activity to which this document relates is only available to, and will be engaged in with, relevant persons.
Notice to Prospective Investors in Hong Kong
The shares may not be offered or sold by means of any document other than (i) in circumstances which do not constitute an offer to the public within the meaning of the Companies Ordinance (Cap. 32, Laws of Hong Kong), or (ii) to "professional investors" within the meaning of the Securities and Futures Ordinance (Cap. 571, Laws of Hong Kong) and any rules made thereunder, or (iii) in other circumstances which do not result in the document being a "prospectus" within the meaning of the Companies Ordinance (Cap. 32, Laws of Hong Kong), and no advertisement, invitation or document relating to the shares may be issued or may be in the possession of any person for the purpose of issue (in each case whether in Hong Kong or elsewhere), which is directed at, or the contents of which are likely to be accessed or read by, the public in Hong Kong (except if permitted to do so under the laws of Hong Kong) other than with respect to shares which are or are intended to be disposed of only to persons outside Hong Kong or only to "professional investors" within the meaning of the Securities and Futures Ordinance (Cap. 571, Laws of Hong Kong) and any rules made thereunder.
146
Notice to Prospective Investors in Singapore
This prospectus has not been registered as a prospectus with the Monetary Authority of Singapore. Accordingly, this prospectus and any other document or material in connection with the offer or sale, or invitation for subscription or purchase, of the shares may not be circulated or distributed, nor may the shares be offered or sold, or be made the subject of an invitation for subscription or purchase, whether directly or indirectly, to persons in Singapore other than (i) to an institutional investor under Section 274 of the Securities and Futures Act, Chapter 289 of Singapore (the "SFA"), (ii) to a relevant person, or any person pursuant to Section 275(1A), and in accordance with the conditions, specified in Section 275 of the SFA or (iii) otherwise pursuant to, and in accordance with the conditions of, any other applicable provision of the SFA.
Where the shares are subscribed or purchased under Section 275 by a relevant person which is: (a) a corporation (which is not an accredited investor) the sole business of which is to hold investments and the entire share capital of which is owned by one or more individuals, each of whom is an accredited investor; or (b) a trust (where the trustee is not an accredited investor) whose sole purpose is to hold investments and each beneficiary is an accredited investor, shares, debentures and units of shares and debentures of that corporation or the beneficiaries' rights and interests in that trust shall not be transferable for six months after that corporation or that trust has acquired the shares under Section 275 except: (1) to an institutional investor under Section 274 of the SFA or to a relevant person, or any person pursuant to Section 275(1A), and in accordance with the conditions, specified in Section 275 of the SFA; (2) where no consideration is given for the transfer; or (3) by operation of law.
Notice to Prospective Investors in Japan
The securities have not been and will not be registered under the Financial Instruments and Exchange Law of Japan (the Financial Instruments and Exchange Law) and each underwriter has agreed that it will not offer or sell any securities, directly or indirectly, in Japan or to, or for the benefit of, any resident of Japan (which term as used herein means any person resident in Japan, including any corporation or other entity organized under the laws of Japan), or to others for re-offering or resale, directly or indirectly, in Japan or to a resident of Japan, except pursuant to an exemption from the registration requirements of, and otherwise in compliance with, the Financial Instruments and Exchange Law and any other applicable laws, regulations and ministerial guidelines of Japan.
Notice to Prospective Investors in Switzerland
We have not and will not register with the Swiss Financial Market Supervisory Authority ("FINMA") as a foreign collective investment scheme pursuant to Article 119 of the Federal Act on Collective Investment Scheme of 23 June 2006, as amended ("CISA"), and accordingly the securities being offered pursuant to this prospectus have not and will not be approved, and may not be licenseable, with FINMA. Therefore, the securities have not been authorized for distribution by FINMA as a foreign collective investment scheme pursuant to Article 119 CISA and the securities offered hereby may not be offered to the public (as this term is defined in Article 3 CISA) in or from Switzerland. The securities may solely be offered to "qualified investors," as this term is defined in Article 10 CISA, and in the circumstances set out in Article 3 of the Ordinance on Collective Investment Scheme of 22 November 2006, as amended ("CISO"), such that there is no public offer. Investors, however, do not benefit from protection under CISA or CISO or supervision by FINMA. This prospectus and any other materials relating to the securities are strictly personal and confidential to each offeree and do not constitute an offer to any other person. This prospectus may only be used by those qualified investors to whom it has been handed out in connection with the offer described herein and may neither directly or indirectly be distributed or made available to any person or entity other than its recipients. It may not be used in connection with any other offer and shall in particular not be copied and/or distributed to the public in Switzerland or from Switzerland. This prospectus does
147
not constitute an issue prospectus as that term is understood pursuant to Article 652a and/or 1156 of the Swiss Federal Code of Obligations. We have not applied for a listing of the securities on the SIX Swiss Exchange or any other regulated securities market in Switzerland, and consequently, the information presented in this prospectus does not necessarily comply with the information standards set out in the listing rules of the SIX Swiss Exchange and corresponding prospectus schemes annexed to the listing rules of the SIX Swiss Exchange.
Notice to Prospective Investors in the Dubai International Financial Centre
This document relates to an Exempt Offer in accordance with the Offered Securities Rules of the Dubai Financial Services Authority ("DFSA"). This document is intended for distribution only to persons of a type specified in the Offered Securities Rules of the DFSA. It must not be delivered to, or relied on by, any other person. The DFSA has no responsibility for reviewing or verifying any documents in connection with Exempt Offers. The DFSA has not approved this document nor taken steps to verify the information set forth in it and has no responsibility for it. The shares to which this document relates may be illiquid and/or subject to restrictions on their resale. Prospective purchasers of the shares offered should conduct their own due diligence on the shares. If you do not understand the contents of this document you should consult an authorized financial advisor.
Notice to Prospective Investors in Australia
No placement document, prospectus, product disclosure statement or other disclosure document has been lodged with the Australian Securities and Investments Commission ("ASIC"), in relation to the offering. This prospectus does not constitute a prospectus, product disclosure statement or other disclosure document under the Corporations Act 2001 (the "Corporations Act"), and does not purport to include the information required for a prospectus, product disclosure statement or other disclosure document under the Corporations Act.
Any offer in Australia of the shares may only be made to persons (the "Exempt Investors"), who are:
- (a)
- "sophisticated
investors" (within the meaning of section 708(8) of the Corporations Act), "professional investors" (within the meaning of
section 708(11) of the Corporations Act) or otherwise pursuant to one or more exemptions contained in section 708 of the Corporations Act; and
- (b)
- "wholesale clients" (within the meaning of section 761G of the Corporations Act),
so that it is lawful to offer the shares without disclosure to investors under Chapters 6D and 7 of the Corporations Act.
The shares applied for by Exempt Investors in Australia must not be offered for sale in Australia in the period of 12 months after the date of allotment under the offering, except in circumstances where disclosure to investors under Chapters 6D and 7 of the Corporations Act would not be required pursuant to an exemption under both section 708 and Subdivision B of Division 2 of Part 7.9 of the Corporations Act or otherwise or where the offer is pursuant to a disclosure document which complies with Chapters 6D and 7 of the Corporations Act. Any person acquiring shares must observe such Australian on-sale restrictions.
This prospectus contains general information only and does not take account of the investment objectives, financial situation or particular needs of any particular person. It does not contain any securities recommendations or financial product advice. Before making an investment decision, investors need to consider whether the information in this prospectus is appropriate to their needs, objectives and circumstances, and, if necessary, seek expert advice on those matters.
148
The validity of the common stock offered hereby has been passed upon for us by Kirkland & Ellis LLP (a partnership that includes professional corporations), Chicago, Illinois. The underwriters have been represented by Winston & Strawn LLP, Chicago, Illinois. Kirkland & Ellis LLP has from time to time represented and may continue to represent, Madison Dearborn and some of its affiliates in connection with various legal matters. Certain partners of Kirkland & Ellis LLP are members of a limited partnership that is an investor in one or more investment funds affiliated with Madison Dearborn.
The consolidated financial statements of Boise Cascade Company and its subsidiaries as of December 31, 2011 and 2012, and for each of the years in the three-year period ended December 31, 2012, have been incorporated by reference herein, in reliance upon the report of KPMG LLP, independent registered public accounting firm, appearing therein, and upon the authority of said firm as experts in accounting and auditing.
WHERE YOU CAN FIND MORE INFORMATION
We are subject to the reporting, proxy and information requirements of the Securities Exchange Act of 1934, as amended, and are required to file periodic reports, proxy statements and other information with the SEC. These periodic reports, proxy statements and other information are available for inspection and copying, at prescribed rates, at the Public Reference Room of the SEC, 100 F Street, N.E., Washington, D.C. 20549. Please call the SEC at 1-800-SEC-0330 for further information on the operation of the Public Reference Room. Our SEC filings are also available to you on the SEC's web site at http://www.sec.gov.
We have filed a Registration Statement on Form S-1 with the SEC with respect to the common stock offered hereby. This prospectus is a part of and does not contain all of the information set forth in, the Registration Statement and the exhibits and schedules to the Registration Statement. For further information with respect to us and our common stock, please refer to the Registration Statement, including its exhibits and schedules. Statements made in this prospectus relating to any contract or other document are not necessarily complete and you should refer to the exhibits attached to the Registration Statement for copies of the actual contract or document.
You may also request a copy of any of our filings with the SEC and of all documents referred to herein, at no cost, by writing or telephoning us at the following address:
Boise
Cascade Company
1111 West Jefferson Street
Suite 300
Boise, Idaho 83702-5389
We maintain an internet site at http://www.bc.com. Information contained on any website referenced in this prospectus does not and will not constitute a part of this prospectus or the Registration Statement on Form S-1 of which this prospectus is a part.
You should rely only on the information contained in this prospectus or to which we have referred you. We have not authorized any person to provide you with different information or to make any representation not contained in this prospectus.
149
INCORPORATION OF CERTAIN INFORMATION BY REFERENCE
The SEC allows us to "incorporate by reference" information we file with it into our registration statement on Form S-1 of which this prospectus is a part, which means that we can disclose important information to you by referring you to other documents. The information incorporated by reference is an important part of this prospectus.
We incorporate by reference the documents listed below:
- •
- our Annual Report on Form 10-K for the fiscal year ended December 31, 2012, filed on March 7, 2013;
- •
- our amended Annual Report on Form 10-K/A for the fiscal year ended December 31, 2012, filed on
April 30, 2013;
- •
- our Quarterly Report on Form 10-Q for the quarter ended March 31, 2013, filed on May 1, 2013;
- •
- our Current Reports on Form 8-K filed on February 13, 2013, March 4, 2013, April 16, 2013, May 9, 2013 and May 21, 2013 (other than portions furnished therewith, if any).
You may request a copy of these filings incorporated by reference in this prospectus, other than an exhibit to these filings unless we have specifically incorporated that exhibit by reference into this filing, without charge, by written or telephonic request directed to 1111 West Jefferson Street, Suite 300, Boise, Idaho 83702, Attention: Chief Financial Officer. Our telephone number at that address is (208) 384-6161.
Any statement contained in a document incorporated or deemed to be incorporated by reference in this prospectus will be deemed modified, superseded or replaced for purposes of this prospectus to the extent that a statement contained in this prospectus or in any subsequently filed document that also is or is deemed to be incorporated by reference in this prospectus modifies, supersedes or replaces such statement.
150

10,000,000 Shares
Boise Cascade
Common Stock
PROSPECTUS
BofA Merrill Lynch
Goldman, Sachs & Co.
Deutsche Bank Securities
J.P. Morgan
Wells Fargo Securities
Barclays
Citi
D.A. Davidson & Co.
, 2013
INFORMATION NOT REQUIRED IN PROSPECTUS
Item 13. Other Expenses of Issuance and Distribution
The following table sets forth all costs and expenses, other than the underwriting discounts and commissions payable by us, in connection with the offer and sale of the securities being registered. All amounts shown are estimates except for the SEC registration fee and the FINRA filing fee.
| |
Amount | |||
|---|---|---|---|---|
SEC registration fee |
$ | 42,384 | ||
FINRA filing fee |
47,110 | |||
Legal fees and expenses |
* | |||
Accounting fees and expenses |
* | |||
Printing expenses |
* | |||
Miscellaneous expenses |
* | |||
Total |
$ | * | ||
- *
- To be provided by amendment.
Item 14. Indemnification of Directors and Officers
Section 102(b)(7) of the DGCL allows a corporation to provide in its certificate of incorporation that a director of the corporation will not be personally liable to the corporation or its stockholders for monetary damages for breach of fiduciary duty as a director, except where the director breached the duty of loyalty, failed to act in good faith, engaged in intentional misconduct or knowingly violated a law, authorized the payment of a dividend or approved a stock repurchase in violation of Delaware corporate law or obtained an improper personal benefit. Our certificate of incorporation provides for this limitation of liability.
Section 145 of the DGCL ("Section 145"), provides that a Delaware corporation may indemnify any person who was, is or is threatened to be made, party to any threatened, pending or completed action, suit or proceeding, whether civil, criminal, administrative or investigative (other than an action by or in the right of such corporation), by reason of the fact that such person is or was an officer, director, employee or agent of such corporation or is or was serving at the request of such corporation as a director, officer, employee or agent of another corporation or enterprise. The indemnity may include expenses (including attorneys' fees), judgments, fines and amounts paid in settlement actually and reasonably incurred by such person in connection with such action, suit or proceeding, provided such person acted in good faith and in a manner he reasonably believed to be in or not opposed to the corporation's best interests and, with respect to any criminal action or proceeding, had no reasonable cause to believe that his or her conduct was illegal. A Delaware corporation may indemnify any persons who are, were or are threatened to be made a party to any threatened, pending or completed action or suit by or in the right of the corporation by reason of the fact that such person is or was a director, officer, employee or agent of another corporation or enterprise. The indemnity may include expenses (including attorneys' fees) actually and reasonably incurred by such person in connection with the defense or settlement of such action or suit, provided such person acted in good faith and in a manner he reasonably believed to be in or not opposed to the corporation's best interests, provided that no indemnification is permitted without judicial approval if the officer, director, employee or agent is adjudged to be liable to the corporation. Where an officer or director is successful on the merits or otherwise in the defense of any action referred to above, the corporation must indemnify him against the expenses which such officer or director has actually and reasonably incurred.
II-1
Section 145 further authorizes a corporation to purchase and maintain insurance on behalf of any person who is or was a director, officer, employee or agent of the corporation or is or was serving at the request of the corporation as a director, officer, employee or agent of another corporation or enterprise, against any liability asserted against him and incurred by him in any such capacity, or arising out of his or her status as such, whether or not the corporation would otherwise have the power to indemnify him under Section 145.
Our bylaws provide that we must indemnify our directors and officers to the fullest extent authorized by the DGCL and must also pay expenses incurred in defending any such proceeding in advance of its final disposition; provided, that if and to the extent required by the DGCL, such an advance shall be made only upon delivery of an undertaking, by or on behalf of an indemnified person, to repay all amounts so advanced if it should be determined ultimately by final judicial decision from which there is no further right to appeal that such person is not entitled to be indemnified under such section or otherwise.
We have entered into indemnification agreements with each of our current directors and officers. These agreements require us to indemnify these individuals to the fullest extent permitted under Delaware law against liabilities that may arise by reason of their service to us, and to advance expenses incurred as a result of any proceeding against them as to which they could be indemnified.
The indemnification rights set forth above shall not be exclusive of any other right which an indemnified person may have or hereafter acquire under any statute, provision of our certificate of incorporation, our bylaws, agreement, vote of stockholders or disinterested directors or otherwise.
We maintain standard policies of insurance that provide coverage (1) to our directors and officers against loss rising from claims made by reason of breach of duty or other wrongful act and (2) to us with respect to indemnification payments that we may make to such directors and officers.
The proposed form of Underwriting Agreement filed as Exhibit 1.1 to this Registration Statement provides for indemnification to our directors and officers by the underwriters against certain liabilities.
Item 15. Recent Sales of Unregistered Securities
On October 22, 2012, Boise Cascade completed the sale to Merrill Lynch, Pierce, Fenner & Smith Incorporated, Goldman, Sachs & Co., Barclays Capital Inc. and Wells Fargo Securities, LLC (the "Initial Purchasers") of $250.0 million in aggregate principal amount of 63/8% senior notes due 2020 (the "Senior Notes") of Boise Cascade and Boise Cascade Finance Corporation (collectively, the "Co-issuers"). The Initial Purchasers resold the Senior Notes to qualified institutional buyers pursuant to Rule 144A under the Securities Act of 1933, as amended, and to persons outside of the United States pursuant to Regulation S under the Securities Act of 1933, as amended. The Senior Notes were sold at par. The Co-issuers received approximately $244.5 million of net proceeds from the sale of the Senior Notes, a portion of which was used to fund the redemption of all of the Co-issuers' then outstanding 71/8% senior subordinated notes due 2014, including all interest thereon through November 21, 2012 (the related redemption date), and to pay the fees and expenses incurred in connection therewith. The remaining proceeds have been made available for general corporate purposes.
Item 16. Exhibits and Financial Statement Schedules
- (a)
- The list of exhibits is set forth under "Exhibit Index" at the end of this registration statement and is incorporated herein by reference.
II-2
Certain of the agreements included as exhibits to this prospectus contain representations and warranties by each of the parties to the applicable agreement. These representations and warranties have been made solely for the benefit of the other parties to the applicable agreement and:
- •
- should not in all instances be treated as categorical statements of fact, but rather as a way of allocating the risk to
one of the parties if those statements prove to be inaccurate;
- •
- have been qualified by disclosures that were made to the other party in connection with the negotiation of the applicable
agreement, which disclosures are not necessarily reflected in the agreement;
- •
- may apply standards of materiality in a way that is different from what may be viewed as material to you or other
investors; and
- •
- were made only as of the date of the applicable agreement or such other date or dates as may be specified in the agreement and are subject to more recent developments.
The registrant acknowledges that, notwithstanding the inclusion of the foregoing cautionary statements, it is responsible for considering whether additional specific disclosures of material information regarding material contractual provisions are required to make the statements in this registration statement not misleading.
The undersigned registrant hereby undertakes to provide to the underwriters at the closing specified in the underwriting agreement certificates in such denominations and registered in such names as required by the underwriters to permit prompt delivery to each purchaser.
Insofar as indemnification for liabilities arising under the Securities Act may be permitted to directors, officers and controlling persons of the registrant pursuant to the foregoing provisions, or otherwise, the registrant has been advised that in the opinion of the Securities and Exchange Commission, such indemnification is against public policy as expressed in the Securities Act, and is, therefore, unenforceable. In the event that a claim for indemnification against such liabilities (other than the payment by the registrant of expenses incurred or paid by a director, officer or controlling person of the registrant in the successful defense of any action, suit or proceeding) is asserted by such director, officer or controlling person in connection with the securities being registered, the registrant will, unless in the opinion of its counsel the matter has been settled by controlling precedent, submit to a court of appropriate jurisdiction the question of whether such indemnification is against public policy as expressed in the Securities Act and will be governed by the final adjudication of such issue.
The undersigned registrant hereby undertakes that:
(i) for purposes of determining any liability under the Securities Act, the information omitted from the form of prospectus filed as part of this registration statement in reliance upon Rule 430A and contained in a form of prospectus filed by the registrant pursuant to Rule 424(b)(1) or (4) or 497(h) under the Securities Act shall be deemed to be part of this registration statement as of the time it was declared effective; and
(ii) for the purpose of determining any liability under the Securities Act, each post-effective amendment that contains a form of prospectus shall be deemed to be a new registration statement relating to the securities offered therein, and the offering of such securities at that time shall be deemed to be the initial bona fide offering thereof.
The undersigned hereby undertakes to deliver or cause to be delivered with the prospectus, to each person to whom the prospectus is sent or given, the latest annual report, to security holders that is incorporated by reference in the prospectus and furnished pursuant to and meeting the requirements of Rule 14a-3 or Rule 14c-3 under the Securities Exchange Act of 1934; and, where interim financial information required to be presented by Article 3 of Regulation S-X is not set forth in the prospectus, to deliver, or cause to be delivered to each person to whom the prospectus is sent or given, the latest quarterly report that is specifically incorporated by reference in the prospectus to provide such interim financial information.
II-3
Pursuant to the requirements of the Securities Act of 1933, the registrant has duly caused this Registration Statement on Form S-1 to be signed on its behalf by the undersigned, thereunto duly authorized, in the City of Boise, State of Idaho, on July 15, 2013.
| BOISE CASCADE COMPANY | ||
/s/ THOMAS E. CARLILE Thomas E. Carlile Chief Executive Officer |
Each person whose signature appears below constitutes and appoints John T. Sahlberg, Thomas E. Carlile and Thomas S. Souleles, and each of them singly, his true and lawful attorneys-in-fact and agents, with full power of substitution and resubstitution, for him and in his name, place and stead, in any and all capacities, to sign any and all amendments (including post-effective amendments) to this Registration Statement and any and all additional Registration Statements pursuant to Rule 462(b) of the Securities Act, and to file the same, with all exhibits thereto, and all other documents in connection therewith, with the Securities and Exchange Commission, granting unto each said attorney-in-fact and agents full power and authority to do and perform each and every act in person, hereby ratifying and confirming all that said attorneys-in-fact and agents or either of them or their or his substitute or substitutes may lawfully do or cause to be done by virtue hereof.
Pursuant to the requirements of the Securities Act of 1933, this Registration Statement has been signed by the following persons in the capacities and on the dates indicated.
| /s/ THOMAS E. CARLILE Thomas E. Carlile |
Chief Executive Officer (principal executive officer) and Director | July 15, 2013 | ||
/s/ WAYNE M. RANCOURT Wayne M. Rancourt |
Sr. Vice President, Chief Financial Officer and Treasurer (principal financial officer) |
July 15, 2013 |
||
/s/ KELLY E. HIBBS Kelly E. Hibbs |
Vice President and Controller (principal accounting officer) |
July 15, 2013 |
||
/s/ DUANE C. MCDOUGALL Duane C. McDougall |
Chairman |
July 15, 2013 |
||
/s/ RICHARD H. FLEMING Richard H. Fleming |
Director |
July 15, 2013 |
II-4
| /s/ JOHN W. MADIGAN John W. Madigan |
Director | July 15, 2013 | ||
/s/ SAMUEL M. MENCOFF Samuel M. Mencoff |
Director |
July 15, 2013 |
||
/s/ CHRISTOPHER J. MCGOWAN Christopher J. McGowan |
Director |
July 15, 2013 |
||
/s/ MATTHEW W. NORTON Matthew W. Norton |
Director |
July 15, 2013 |
||
/s/ THOMAS S. SOULELES Thomas S. Souleles |
Director |
July 15, 2013 |
II-5
| |
|
Incorporated by Reference | |
|||||||||||||
|---|---|---|---|---|---|---|---|---|---|---|---|---|---|---|---|---|
| Exhibit Number |
Exhibit Description | Form | File Number | Exhibit Number |
Filing Date | Filed or Furnished Herewith |
||||||||||
1.1 |
** | Form of Underwriting Agreement | ||||||||||||||
2.1 |
Asset Purchase Agreement dated July 26, 2004, by and among Boise Cascade Corporation (now OfficeMax Incorporated), Boise Southern Company, Minidoka Paper Company, Forest Products Holdings, L.L.C., and Boise Land & Timber Corp., as amended by First Amendment to Asset Purchase Agreement dated October 23, 2004, and as further amended by Second Amendment to Asset Purchase Agreement dated October 28, 2004 |
S-1 |
333-122770 |
* |
2.1 |
* |
5/2/2005 |
* |
||||||||
2.2 |
Purchase and Sale Agreement dated September 7, 2007, by and among Boise Cascade, L.L.C., Boise Paper Holdings, L.L.C., Boise White Paper, L.L.C., Boise Packaging & Newsprint, L.L.C., Boise Cascade Transportation Holdings Corp., Aldabra 2 Acquisition Corp., and Aldabra Sub LLC |
8-K* |
333-122770 |
* |
2.1 |
* |
9/13/2007 |
* |
||||||||
2.3 |
Amendment No. 1 (dated October 18, 2007) to Purchase and Sale Agreement dated September 7, 2007, by and among Boise Cascade, L.L.C., Boise Paper Holdings, L.L.C., Boise White Paper, L.L.C., Boise Packaging & Newsprint, L.L.C., Boise Cascade Transportation Holdings Corp., Aldabra 2 Acquisition Corp., and Aldabra Sub LLC |
8-K* |
333-122770 |
* |
2.1 |
* |
10/24/2007 |
* |
||||||||
2.4 |
Amendment No. 2 to Purchase and Sale Agreement, dated February 22, 2008, by and among Boise Cascade, L.L.C., Boise Paper Holdings, L.L.C., Boise Packaging & Newsprint, L.L.C., Boise White Paper, L.L.C., Boise Cascade Transportation Holdings Corp., Aldabra 2 Acquisition Corp., and Aldabra Sub LLC |
8-K* |
333-122770 |
* |
10.5 |
* |
2/28/2008 |
* |
||||||||
3.1 |
Certificate of Incorporation of Boise Cascade Company |
S-8 |
333-186871 |
4.1 |
2/26/2013 |
|
||||||||||
| |
|
Incorporated by Reference | |
|||||||||||||
|---|---|---|---|---|---|---|---|---|---|---|---|---|---|---|---|---|
| Exhibit Number |
Exhibit Description | Form | File Number | Exhibit Number |
Filing Date | Filed or Furnished Herewith |
||||||||||
3.2 |
Bylaws of Boise Cascade Company |
S-8 |
333-186871 | 4.2 | 2/26/2013 | |||||||||||
3.3 |
Form of stock certificate of Boise Cascade Company |
S-1 |
333-184964 |
4.3 |
1/23/2013 |
|||||||||||
4.1 |
Indenture dated October 22, 2012, by and among Boise Cascade, L.L.C., Boise Cascade Finance Corporation, Boise Cascade Holdings, L.L.C., as Guarantor, the other Guarantors named therein and U.S. Bank National Association, as Trustee |
8-K* |
333-122770 |
* |
4.1 |
* |
10/23/2012 |
* |
||||||||
4.2 |
Registration Rights Agreement dated October 22, 2012, by and among Boise Cascade, L.L.C., Boise Cascade Finance Corporation, Boise Cascade Holdings, L.L.C., as Guarantor, the other Guarantors named therein and the initial purchasers named therein |
8-K* |
333-122770 |
* |
4.4 |
* |
10/23/2012 |
* |
||||||||
5.1 |
Form of Opinion of Kirkland & Ellis LLP |
X |
||||||||||||||
10.1 |
Registration Rights Agreement dated February 8, 2013, by and between Boise Cascade Company and Boise Cascade Holdings, L.L.C. |
8-K |
001-35805 |
10.1 |
2/13/2013 |
|||||||||||
10.2 |
Director Nomination Agreement dated February 11, 2013, by and among Boise Cascade Company and Boise Cascade Holdings, L.L.C., and Madison Dearborn Capital Partners IV, L.P. |
8-K |
001-35805 |
10.2 |
2/13/2013 |
|||||||||||
10.3 |
Credit Agreement, dated as of July 13, 2011, by and among Boise Cascade, L.L.C., Boise Cascade Building Materials Distribution, L.L.C., and Boise Cascade Wood Products, L.L.C., as borrowers, and Boise Cascade Wood Products Holdings Corp., as guarantor, the Lenders from time to time party thereto, and Wells Fargo Capital Finance, L.L.C., as Agent |
10-Q* |
333-122770 |
* |
10.1 |
* |
11/3/2011 |
* |
|
|||||||
| |
|
Incorporated by Reference | |
|||||||||||||
|---|---|---|---|---|---|---|---|---|---|---|---|---|---|---|---|---|
| Exhibit Number |
Exhibit Description | Form | File Number | Exhibit Number |
Filing Date | Filed or Furnished Herewith |
||||||||||
10.4 |
First Amendment to Credit Agreement, dated as of September 7, 2012, by and among Boise Cascade, L.L.C., Boise Cascade Building Materials Distribution, L.L.C., and Boise Cascade Wood Products, L.L.C., as borrowers, Boise Cascade Wood Products Holdings Corp., as guarantors, the Lenders identified therein, and Wells Fargo Capital Finance, LLC, as Agent |
8-K* |
333-122770 | * | 10.1 | * | 9/12/2012 | * | ||||||||
10.5 |
Limited Consent and Amendment to Loan Documents, dated as of December 20, 2012, by and among Boise Cascade, L.L.C., Boise Cascade Building Materials Distribution, L.L.C., and Boise Cascade Wood Products, L.L.C., as borrowers Boise Cascade Holdings, L.L.C., and Boise Cascade Wood Products Holdings Corp., as guarantors, the Lenders identified therein, and Wells Fargo Capital Finance, LLC, as Agent |
8-K* |
333-122770 |
* |
10.1 |
* |
12/21/2012 |
* |
||||||||
10.6 |
Third Amendment to Credit Agreement, dated as of May 15, 2013, by and among Boise Cascade Company and the subsidiaries identified therein, as borrowers, the Lenders identified therein, and Wells Fargo Capital Finance, LLC, as Agent |
8-K |
001-35805 |
10.1 |
05/21/2013 |
|||||||||||
10.7 |
General Continuing Guaranty, dated as of December 20, 2012, by Boise Cascade Holdings, L.L.C., in favor of Wells Fargo Capital Finance, LLC, as Agent |
8-K* |
333-122770 |
* |
10.2 |
* |
12/21/2012 |
* |
||||||||
10.8 |
Intellectual Property License Agreement, dated as of February 22, 2008, between Boise Cascade, L.L.C., and Boise Paper Holdings, L.L.C. |
8-K* |
333-122770 |
* |
10.3 |
* |
2/28/2008 |
* |
||||||||
10.9 |
Outsourcing Agreement, dated as of February 22, 2008, between Boise Cascade, L.L.C., and Boise Paper Holdings, L.L.C. |
8-K* |
333-122770 |
* |
10.4 |
* |
2/28/2008 |
* |
||||||||
|
||||||||||||||||
| |
|
Incorporated by Reference | |
|||||||||||||
|---|---|---|---|---|---|---|---|---|---|---|---|---|---|---|---|---|
| Exhibit Number |
Exhibit Description | Form | File Number | Exhibit Number |
Filing Date | Filed or Furnished Herewith |
||||||||||
10.10 |
+ | Employment Agreement dated November 20, 2008, between Duane C. McDougall and Boise Cascade, L.L.C. | 8-K* | 333-122770 | * | 10.2 | * | 11/25/2008 | * | |||||||
|
||||||||||||||||
10.11 |
+ | Amendment to Employment Agreement dated February 20, 2009, between Boise Cascade, L.L.C., and Duane McDougall | 8-K* | 333-122770 | * | 10.3 | * | 2/26/2009 | * | |||||||
|
||||||||||||||||
10.12 |
+ | Second Amendment to Employment Agreement effective August 16, 2009, between Boise Cascade, L.L.C., and Duane McDougall | 10-Q* | 333-122770 | * | 10.1 | * | 11/13/2009 | * | |||||||
|
||||||||||||||||
10.13 |
+ | Letter Agreement effective August 16, 2009, Amending Severance Agreement between Wayne Rancourt and Boise Cascade, L.L.C. | 10-Q* | 333-122770 | * | 10.3 | * | 11/13/2009 | * | |||||||
|
||||||||||||||||
10.14 |
+ | Executive Officer Severance Pay Policy, as amended through November 1, 2007 | 8-K* | 333-122770 | * | 99.1 | * | 11/2/2007 | * | |||||||
|
||||||||||||||||
10.15 |
+ | Boise Cascade, L.L.C., Supplemental Pension Plan, as amended through November 1, 2009 | 10-K* | 333-122770 | * | 10.26 | * | 3/1/2010 | * | |||||||
|
||||||||||||||||
10.16 |
+ | Boise Cascade, L.L.C., Supplemental Early Retirement Plan for Executive Officers, as amended through March 1, 2010 | 10-K* | 333-122770 | * | 10.27 | * | 3/1/2010 | ||||||||
|
||||||||||||||||
10.17 |
+ | Boise Cascade Supplemental Life Plan, as amended December 19, 2006 | 10-K* | 333-122770 | * | 10.20 | * | 3/1/2007 | * | |||||||
|
||||||||||||||||
10.18 |
+ | Boise Cascade Financial Counseling Program, as amended through December 12, 2007 | 8-K* | 333-122770 | * | 99.4 | * | 12/18/2007 | * | |||||||
|
||||||||||||||||
10.19 |
+ | Boise Incentive and Performance Plan, effective October 29, 2004 | S-1* | 333-122770 | * | 10.16 | * | 2/11/2005 | * | |||||||
|
||||||||||||||||
10.20 |
+ | 2008 Annual Incentive Award Notifications with respect to Boise Cascade, L.L.C., Incentive and Performance Plan | 10-Q* | 333-122770 | * | 10 | * | 5/8/2008 | * | |||||||
|
||||||||||||||||
10.21 |
+ | Boise Cascade, L.L.C., 2010 Cash Long-Term Incentive Plan adopted October 28, 2009, effective January 1, 2010 | 10-K* | 333-122770 | * | 10.32 | * | 3/1/2010 | * | |||||||
|
||||||||||||||||
| |
|
Incorporated by Reference | |
|||||||||||||
|---|---|---|---|---|---|---|---|---|---|---|---|---|---|---|---|---|
| Exhibit Number |
Exhibit Description | Form | File Number | Exhibit Number |
Filing Date | Filed or Furnished Herewith |
||||||||||
10.22 |
+ | Retention Award Agreement, dated as of September 30, 2011, by and between Thomas E. Carlile and Boise Cascade, L.L.C. | 8-K* | 333-122770 | * | 10.1 | * | 10/5/2011 | * | |||||||
|
||||||||||||||||
10.23 |
+ | Boise Cascade, L.L.C., 2004 Deferred Compensation Plan, as amended through November 1, 2009 | 10-K* | 333-122770 | * | 10.34 | * | 3/1/2010 | * | |||||||
|
||||||||||||||||
10.24 |
+ | Boise Cascade Holdings, L.L.C., Directors Deferred Compensation Plan, as amended through November 1, 2009 | 10-K* | 333-122770 | * | 10.35 | * | 3/1/2010 | * | |||||||
|
||||||||||||||||
10.25 |
+ | Management Equity Agreement dated November 29, 2004, by and among Forest Products Holdings, L.L.C., and each of the persons listed on the signature pages thereto | S-1 Amend. No. 3* |
333-122770 | * | 10.25 | * | 5/2/2005 | * | |||||||
|
||||||||||||||||
10.26 |
+ | Management Equity Agreement dated April 3, 2006, by and among Forest Products Holdings, L.L.C., and each of the persons listed on the signature pages thereto | 8-K* | 333-122770 | * | 99.1 | * | 4/6/2006 | * | |||||||
|
||||||||||||||||
10.27 |
+ | Amendment dated February 20, 2009, to Management Equity Agreement | 8-K* | 333-122770 | * | 10.2 | * | 2/26/2009 | * | |||||||
|
||||||||||||||||
10.28 |
+ | Form of Repurchase Agreement and Amendment No. 1 to Management Equity Agreement dated May 23, 2008, by and among Forest Products Holdings, L.L.C., and each of the persons named on the signature pages thereto | 8-K* | 333-122770 | * | 10.2 | * | 5/28/2008 | * | |||||||
|
||||||||||||||||
10.29 |
+ | Management Equity Agreement dated November 20, 2008, between Duane C. McDougall and Forest Products Holdings, L.L.C. | 8-K* | 333-122770 | * | 10.3 | * | 11/25/2008 | * | |||||||
|
||||||||||||||||
10.30 |
+ | Amendment No. 1, effective August 16, 2009, to Management Equity Agreement dated November 20, 2008, between Duane C. McDougall and Forest Products Holdings, L.L.C. | 10-Q* | 333-122770 | * | 10.2 | * | 11/13/2009 | * | |||||||
|
||||||||||||||||
10.31 |
+ | Director Equity Agreement dated April 3, 2006, by and among Forest Products Holdings, L.L.C., and each of the persons listed on the signature pages thereto | 8-K* | 333-122770 | * | 99.2 | * | 4/6/2006 | * | |||||||
|
||||||||||||||||
| |
|
Incorporated by Reference | |
|||||||||||||
|---|---|---|---|---|---|---|---|---|---|---|---|---|---|---|---|---|
| Exhibit Number |
Exhibit Description | Form | File Number | Exhibit Number |
Filing Date | Filed or Furnished Herewith |
||||||||||
10.32 |
+ | Amendment to Director Equity Agreement entered into February 20, 2009 | 8-K* | 333-122770 | * | 10.3 | * | 2/26/2009 | * | |||||||
|
||||||||||||||||
10.33 |
+ | Form of Officer Severance Agreement (between Boise Cascade, L.L.C., and all elected officers) | S-1 Amend. No. 2 |
333-184964 | 10.32 | 1/4/2013 | ||||||||||
|
||||||||||||||||
10.34 |
+ | Form of Indemnification Agreement (for directors and officers affiliated with Madison Dearborn Partners, L.L.C) | 8-K | 001-35805 | 10.3 | 2/13/2013 | ||||||||||
|
||||||||||||||||
10.35 |
+ | Form of Indemnification Agreement (for directors and officers not affiliated with Madison Dearborn Partners, L.L.C) | 8-K | 001-35805 | 10.4 | 2/13/2013 | ||||||||||
|
||||||||||||||||
10.36 |
+ | Boise Cascade Company 2013 Incentive Compensation Plan | 8-K | 001-35805 | 10.5 | 2/13/2013 | ||||||||||
|
||||||||||||||||
10.37 |
+ | Form of Restricted Stock Unit Agreement | 8-K | 001-35805 | 10.1 | 3/4/2013 | ||||||||||
|
||||||||||||||||
10.38 |
+ | Form of Stock Option Agreement | 8-K | 001-35805 | 10.2 | 3/4/2013 | ||||||||||
|
||||||||||||||||
10.39 |
+ | Form of Performance Stock Unit Agreement | 8-K | 001-35805 | 10.3 | 3/4/2013 | ||||||||||
21.1 |
List of subsidiaries of Boise Cascade Company |
S-4 |
333-187651 |
21.1 |
4/1/2013 |
|||||||||||
23.1 |
Consent of KPMG LLP, Independent Registered Public Accounting Firm |
X |
||||||||||||||
23.2 |
Consent of Kirkland & Ellis LLP (included in Exhibit 5.1 hereto) |
X |
||||||||||||||
24.1 |
Powers of Attorney (included on the signature pages to this Registration Statement) |
X |
||||||||||||||
99.1 |
Salt Lake City Property Contribution Agreement |
10-Q* |
333-122770 |
* |
99.1 |
* |
8/2/2012 |
* |
||||||||
99.2 |
Albuquerque Property Contribution Agreement |
10-Q* |
333-122770 |
* |
99.2 |
* |
8/2/2012 |
* |
||||||||
- +
- Indicates
exhibits that constitute management contracts or compensatory plans or arrangements.
- *
- Refers
to prior filings of Boise Cascade Holdings, L.L.C.
- **
- Indicates
to be filed by amendment.
- (a)
- Our Code of Ethics can be found on our website (www.bc.com) by clicking on About Boise Cascade and then Code of Ethics.