Attached files
| file | filename |
|---|---|
| EX-5.1 - EX-5.1 - Jones Energy, Inc. | a2215894zex-5_1.htm |
| EX-23.1 - EX-23.1 - Jones Energy, Inc. | a2215817zex-23_1.htm |
As filed with the Securities and Exchange Commission on July 11, 2013
Registration No. 333-188896
UNITED STATES
SECURITIES AND EXCHANGE COMMISSION
Washington, D.C. 20549
Amendment No. 4
to
Form S-1
REGISTRATION STATEMENT
UNDER
THE SECURITIES ACT OF 1933
Jones Energy, Inc.
(Exact Name of Registrant as Specified in its Charter)
| Delaware | 1311 | 80-0907968 | ||
| (State or other Jurisdiction of Incorporation or Organization) |
(Primary Standard Industrial Classification Code Number) |
(IRS Employer Identification Number) |
807 Las Cimas Parkway
Suite 350
Austin, TX 78746
(512) 328-2953
(Address, including Zip Code, and Telephone Number, including Area Code, of Registrant's Principal Executive Offices)
Mike S. McConnell
807 Las Cimas Parkway
Suite 350
Austin, TX 78746
(512) 328-2953
(Name, Address, including Zip Code, and Telephone Number, including Area Code, of Agent for Service)
Copies to:
| Michael L. Bengtson Paul F. Perea Baker Botts L.L.P. 98 San Jacinto Boulevard Suite 1500 Austin, Texas 78701 (512) 322-2500 |
James M. Prince Douglas E. McWilliams Vinson & Elkins L.L.P. First City Tower 1001 Fannin, Suite 2500 Houston, Texas 77002-6760 (713) 758-2222 |
Approximate date of commencement of proposed sale to the public: As soon as practicable after this Registration Statement becomes effective.
If any of the securities being registered on this form are to be offered on a delayed or continuous basis pursuant to Rule 415 under the Securities Act of 1933, check the following box. o
If this form is filed to register additional securities for an offering pursuant to Rule 462(b) under the Securities Act, check the following box and list the Securities Act registration statement number of the earlier effective registration statement for the same offering. o
If this form is a post-effective amendment filed pursuant to Rule 462(c) under the Securities Act, check the following box and list the Securities Act registration statement number of the earlier effective registration statement for the same offering. o
If this form is a post-effective amendment filed pursuant to Rule 462(d) under the Securities Act, check the following box and list the Securities Act registration statement number of the earlier effective registration statement for the same offering. o
Indicate by check mark whether the registrant is a large accelerated filer, an accelerated filer, a non-accelerated filer, or a smaller reporting company. See the definitions of "large accelerated filer," "accelerated filer" and "smaller reporting company" in Rule 12b-2 of the Exchange Act. (Check one):
| Large accelerated filer o | Accelerated filer o | Non-accelerated filer ý (Do not check if a smaller reporting company) |
Smaller reporting company o |
CALCULATION OF REGISTRATION FEE
|
||||
| Title of each class of securities to be registered |
Proposed maximum aggregate offering price(1)(2) |
Amount of registration fee(3) |
||
|---|---|---|---|---|
Class A common stock |
$305,900,000 | $41,725 | ||
|
||||
- (1)
- Includes
shares of Class A common stock issuable upon exercise of the underwriters' option to purchase additional shares.
- (2)
- Estimated
solely for the purpose of calculating the registration fee pursuant to Rule 457(o).
- (3)
- The total registration fee includes $34,100 that was previously paid for the registration of $250,000,000 of proposed maximum aggregate offering price in the filing of the Registration Statement (Registration No. 333-188896) on May 28, 2013 and $7,624.76 for the registration of an additional $55,900,000 of proposed maximum aggregate offering price registered hereby.
The Registrant hereby amends this Registration Statement on such date or dates as may be necessary to delay its effective date until the Registrant shall file a further amendment which specifically states that this Registration Statement shall thereafter become effective in accordance with Section 8(a) of the Securities Act of 1933 or until the Registration Statement shall become effective on such date as the Securities and Exchange Commission, acting pursuant to said Section 8(a), may determine.
Subject to completion, dated July 11, 2013
The information in this preliminary prospectus is not complete and may be changed. We may not sell these securities until the registration statement filed with the Securities and Exchange Commission is effective. This preliminary prospectus is not an offer to sell these securities and it is not soliciting an offer to buy these securities in any jurisdiction where the offer or sale is not permitted.
Prospectus
14,000,000 shares

Jones Energy, Inc.
Class A common stock
This is the initial public offering of shares of Class A common stock by Jones Energy, Inc. Jones Energy is selling 14,000,000 shares of Class A common stock. Certain entities directly or indirectly controlled by Jonny Jones, our chairman and chief executive officer, and/or his immediate family intend to purchase 1,000,000 shares of our Class A common stock at the public offering price. Prior to this offering, there has been no public market for our Class A common stock. We anticipate that the initial public offering price will be between $17.00 and $19.00 per share.
We have been approved to list our Class A common stock on the New York Stock Exchange under the symbol "JONE," subject to official notice of issuance.
We are an "emerging growth company" as defined under the federal securities laws and, as such, may elect to comply with certain reduced public company reporting requirements.
|
Per share | Total | |||||
Initial public offering price |
$ | $ | |||||
Underwriting discounts and commissions(1) |
$ |
$ |
|||||
Proceeds to Jones Energy, before expenses |
$ |
$ |
|||||
(1) We will also pay up to $15,000 of reasonable fees and expenses of counsel related to the review by the Financial Industry Regulatory Authority, Inc. of the terms of sale of the shares of Class A common stock offered hereby. See "Underwriting (conflicts of interest)."
We have granted the underwriters an option for a period of 30 days from the date of this prospectus to purchase up to 2,100,000 additional shares of our Class A common stock.
Investing in shares of our Class A common stock involves a high degree of risk. See "Risk factors" beginning on page 22.
Neither the Securities and Exchange Commission nor any state securities commission has approved or disapproved of these securities or passed on the adequacy or accuracy of this prospectus. Any representation to the contrary is a criminal offense.
The underwriters expect to deliver the shares on or about , 2013.
| J.P. Morgan | ||||
| Barclays | ||||
| Wells Fargo Securities |
| Jefferies | Tudor, Pickering, Holt & Co. | Citigroup |
| Capital One Southcoast | Credit Agricole CIB | Mitsubishi UFJ Securities | ||
| Morgan Stanley | Stifel | SunTrust Robinson Humphrey |
, 2013
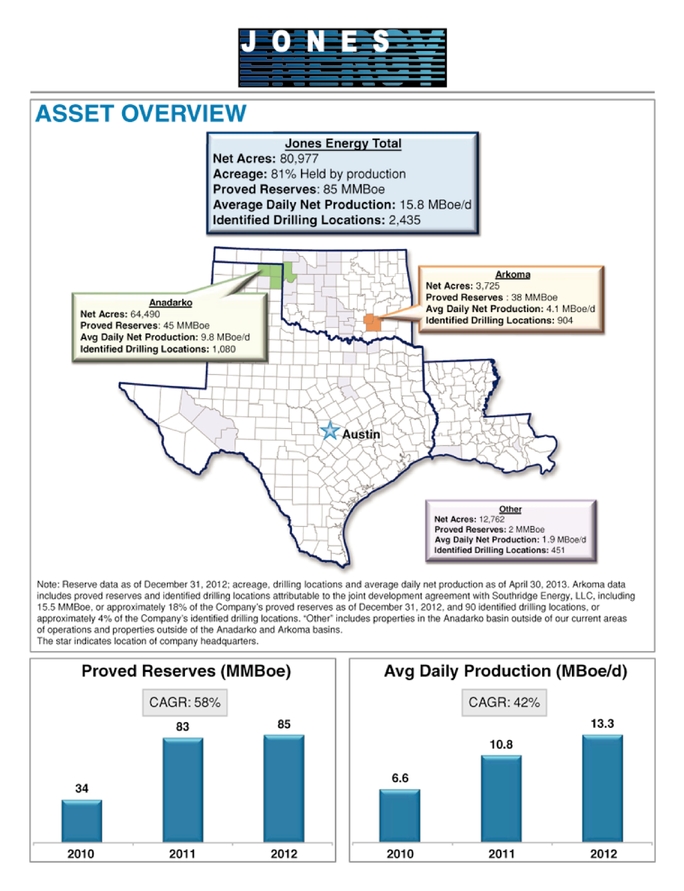
Table of contents
You should rely only on the information contained in this prospectus. We have not, and the underwriters have not, authorized anyone to provide you with different information. If anyone provides you with different or inconsistent information, you should not rely on it. We are not, and the underwriters are not, making an offer to sell these securities in any jurisdiction where an offer or sale is not permitted. You should assume that the information appearing in this prospectus is accurate as of the date on the front cover of this prospectus. Our business, financial condition, results of operations and prospects may have changed since that date.
Through and including , 2013 (the 25th day after the date of this prospectus), all dealers that effect transactions in our Class A common stock, whether or not participating in this offering, may be required to deliver a prospectus. This is in addition to the dealers' obligation to deliver a prospectus when acting as an underwriter and with respect to their unsold allotments or subscriptions.
This prospectus contains forward-looking statements that are subject to a number of risks and uncertainties, many of which are beyond our control. See "Risk factors" and "Cautionary note regarding forward-looking statements."
Industry and market data
The market data and certain other statistical information used throughout this prospectus are based on independent industry publications, government publications or other published independent sources. Although we believe these third-party sources are reliable as of their respective dates, neither we nor the underwriters have independently verified the accuracy or completeness of this information.
i
This summary highlights information contained elsewhere in this prospectus and is qualified in its entirety by the more detailed information and financial statements included elsewhere in this prospectus. It does not contain all of the information that you should consider before investing in our Class A common stock. You should read the entire prospectus carefully, including "Risk factors" and the historical and unaudited pro forma financial statements and the notes to those financial statements included elsewhere in this prospectus. Unless indicated otherwise, the information presented in this prospectus assumes (1) an initial public offering price of $18.00 per share (the midpoint of the price range set forth on the cover page of this prospectus) and (2) that the underwriters do not exercise their option to purchase additional shares. We include a glossary of some of the terms used in this prospectus as Appendix B. Unless the context otherwise requires, references in this prospectus to "Jones Energy," "we," "our," "us," the "company" or like terms when used in the context of the period (i) prior to the completion of the transactions described in "Organizational structure," refer to Jones Energy Holdings, LLC and its subsidiaries and (ii) after the completion of the transactions described in "Organizational structure," refer to Jones Energy, Inc. and its subsidiaries. References to "Metalmark Capital" are to Metalmark Capital Partners (C) II, L.P. and its affiliated investment funds. References to the "Jones family" or "Jones family entities" are to entities directly or indirectly controlled by Jonny Jones, our chairman and chief executive officer and/or his immediate family.
Jones Energy, Inc.
Overview
We are an independent oil and gas company engaged in the development, production and acquisition of oil and natural gas properties in the Anadarko and Arkoma basins of Texas and Oklahoma. Our CEO, Jonny Jones, founded our predecessor company in 1988 in continuation of his family's long history in the oil and gas business, which dates back to the 1920s. We have grown rapidly by leveraging our focus on low cost drilling and completions and our horizontal drilling expertise to develop our inventory and execute several strategic acquisitions. We have accumulated extensive knowledge and experience in developing the Anadarko and Arkoma basins, having concentrated our operations in the Anadarko basin for 25 years and applied our knowledge to the Arkoma basin since 2011. We have drilled over 580 total wells since our formation, including over 400 horizontal wells, and delivered compelling economic returns over various commodity price cycles. Our operations are focused on horizontal drilling and completions within two distinct basins in the Texas Panhandle and Oklahoma:
- •
- the Anadarko Basin—targeting the liquids-rich Cleveland, Granite Wash, Tonkawa and Marmaton
formations; and
- •
- the Arkoma Basin—targeting the liquids-rich fairway of the Woodford shale formation.
We optimize returns through a disciplined emphasis on controlling costs and promoting operational efficiencies, and we believe we are recognized as one of the lowest-cost drilling and completion operators in the Cleveland and Woodford shale formations.
The Anadarko and Arkoma basins are among the most prolific and largest onshore producing oil and natural gas basins in the United States, enjoying multiple producing horizons and extensive well control demonstrated over seven decades of development. The formations we target are generally characterized by oil and liquids-rich natural gas content, extensive production histories, long-lived reserves, high drilling success rates and attractive initial production rates. We focus on formations in our operating areas that we
1
believe offer significant development and acquisition opportunities and to which we can apply our technical experience and operational excellence to increase proved reserves and production to deliver compelling economic rates of return. Our goal is to build value through a disciplined balance between developing our current inventory of 2,435 gross identified drilling locations and actively pursuing joint venture agreements, farm-out agreements, joint operating agreements and similar partnering agreements (which we refer to as joint development agreements), organic leasing proximate to existing acreage and strategic acquisitions. In all of our joint development agreements, we control the drilling and completion of a well, which is the phase during which we can leverage our full operational expertise and cost discipline. Following completion, we in some cases may turn over operatorship to a partner during the production phase of a well. We believe the ceding to us of drilling and completion operatorship in our areas of operation by several large oil and gas companies, including ExxonMobil, BP and ConocoPhillips, reflects their acknowledgement of our low-cost, safe and efficient operations.
From December 31, 2010 through December 31, 2012, through our acquisitions and drilling program, we grew our proved reserves from approximately 34 MMBoe to 85 MMBoe, representing a compound annual growth rate of approximately 58%, while our average daily net production increased over the same period from approximately 6.6 MBoe/d to 13.3 MBoe/d, representing a compound annual growth rate of approximately 42%. For the month ended April 30, 2013 our average daily net production was 15.8 MBoe/d. In the context of our historical performance and business strategy execution, we believe we have the opportunities, experience and knowledge to continue growing both our reserves and production.
As of December 31, 2012, our total estimated proved reserves were approximately 85 MMBoe, of which approximately 46% were classified as proved developed reserves. Approximately 55% of our total estimated proved reserves as of December 31, 2012 consisted of oil and NGLs, and 45% consisted of natural gas. As of December 31, 2012, our properties included approximately 720 gross active producing wells. For the three years ended December 31, 2012, we drilled 154 wells, substantially all of which we drilled as operator. The following table presents summary acreage, reserve and production data for each of our core operating areas:
| |
As of December 31, 2012 | Month ended April 30, 2013 |
As of April 30, 2013 | ||||||||||||||||
|---|---|---|---|---|---|---|---|---|---|---|---|---|---|---|---|---|---|---|---|
| |
Estimated net proved reserves |
Average daily net production |
Acreage | ||||||||||||||||
| |
MMBoe |
% Oil and NGLs(1) |
MBoe/d |
% Oil and NGLs(1) |
Gross acreage |
Net acreage |
|||||||||||||
Anadarko basin: |
|||||||||||||||||||
Cleveland |
40.5 | 63.8% | 8.6 | 64.2% | 102,445 | 60,575 | |||||||||||||
Granite Wash |
4.7 | 40.2% | 1.2 | 44.3% | 10,011 | 3,915 | |||||||||||||
Arkoma basin: |
|||||||||||||||||||
Woodford(2) |
37.9 | 49.9% | 4.1 | 31.9% | 14,539 | 3,725 | |||||||||||||
Other |
2.2 | 29.4% | 1.9 | 63.3% | 37,917 | 12,762 | |||||||||||||
All properties |
85.3 | 55.4% | 15.8 | (3) | 54.2% | 164,912 | 80,977 | ||||||||||||
(1) Ethane is an NGL and is included in this percentage. Due to recent declines in ethane pricing and increases in natural gas prices, beginning in December 2012, purchasers of our Woodford production have been electing not to recover ethane from the natural gas stream and instead have been paying us based on the natural gas price for the ethane left in the gas stream. As a result of the increased energy content associated with the returned ethane and the absence of plant shrinkage, this ethane rejection has increased the incremental revenue and volumes that we receive for our natural gas product relative to what we would have received if the ethane was separately recovered, but has reduced physical barrels of liquid ethane that we are selling.
2
(2) Includes proved undeveloped reserves associated with our joint development agreement with Southridge Energy, LLC. Please see "Risk Factors—If we do not fulfill our obligation to drill the minimum number of wells specified in our joint development agreements, we will lose the right to develop the undeveloped acreage associated with the agreement and any proved undeveloped reserves attributable to such undeveloped acreage."
(3) Average daily net production increased from 13.3 MBoe/d for the year ended December 31, 2012, to 15.8 MBoe/d for the month ended April 30, 2013, primarily due to new wells added through our drilling activities and the acquisition of 36 gross productive wells in connection with the Chalker acquisition.
The following table presents summary well and drilling location data for each of our key formations for the dates indicated:
| |
As of December 31, 2012 | As of April 30, 2013 | |||||||||||
|---|---|---|---|---|---|---|---|---|---|---|---|---|---|
| |
Producing wells |
Identified drilling locations(1) |
|||||||||||
| |
Gross |
Net |
Gross |
Net |
|||||||||
Anadarko basin: |
|||||||||||||
Cleveland |
293 | 191 | 521 | 323 | |||||||||
Granite Wash |
23 | 16 | 14 | 5 | |||||||||
Tonkawa |
— | — | 194 | 111 | |||||||||
Marmaton |
— | — | 351 | 190 | |||||||||
Arkoma basin: |
|||||||||||||
Woodford |
122 | 47 | 904 | 127 | |||||||||
Other |
282 | 75 | 451 | 20 | |||||||||
All properties |
720 | 329 | 2,435 | 776 | |||||||||
(1) Our total identified drilling locations include 361 gross locations associated with proved undeveloped reserves as of December 31, 2012. We have estimated our drilling locations based on well spacing assumptions for the areas in which we operate and other criteria. See "Business—Development of proved undeveloped reserves" and "Business—Drilling locations" for more information regarding our proved undeveloped reserves and the processes and criteria through which these drilling locations were identified.
Our 2012 capital expenditures, excluding acquisitions, totaled $122.1 million, during which we drilled 48 gross wells. We expect our 2013 capital expenditure budget to be approximately $204.0 million, $180 million of which we expect to use to drill and complete 93 gross (54 net) wells. The remainder of the 2013 capital expenditure budget is expected to be devoted to seismic, leasing and other discretionary expenditures. Please see "Management's discussion and analysis of financial condition and results of operations—Liquidity and capital resources." Assuming current market conditions and drilling success rates comparable to our historical performance, we believe we will be able to fund substantially all of our 2013
3
budgeted capital expenditures with our cash flow from operations. We currently expect to allocate our 2013 capital expenditure budget as follows:
| |
2013 capital expenditure budget |
Wells |
|||||
|---|---|---|---|---|---|---|---|
| |
(in thousands) |
(gross/net) |
|||||
Drilling and completion: |
|||||||
Cleveland |
$ | 148,900 | 62/45 | ||||
Woodford |
22,700 | 20/8 | |||||
Other drilling |
8,100 | 11/1 | |||||
Other activities |
24,300 | — | |||||
All properties |
$ | 204,000 | 93/54 | ||||
Significant acquisitions
We utilize our cost and operating efficiencies to competitively pursue acquisitions and have completed three significant acquisitions as well as several bolt-on acquisitions in our operating areas over the last three years. The aggregate purchase price of our recent acquisitions is over $710 million.
In December 2009, we made our first significant acquisition by partnering with Metalmark Capital, a private equity fund, as the winning bidder in the bankruptcy auction of Crusader Energy Group, Inc. The acquisition included approximately 13.7 MMBoe of proved reserves estimated as of December 31, 2012 and strengthened our leading position in the Cleveland formation, where we have drilled over 255 gross horizontal wells since 2004, which is over 15% of all horizontal wells drilled in the formation over that period. Other significant drillers of the Cleveland formation include Apache, EOG Resources and BP.
In April 2011, we acquired estimated proved developed reserves in the Arkoma Woodford shale formation of approximately 31.1 MMBoe as of December 31, 2012, which we refer to as the Southridge acquisition. We serve as operator for these properties and have entered into a multi-year drilling joint development agreement with Southridge Energy, LLC. We have drilled 28 gross wells in the Woodford shale formation since the acquisition and, according to data received from Smith Bits, an affiliate of Schlumberger, as of March 5, 2013 we held the basin record for the lowest number of days drilling a horizontal well from spud to total depth in the formation.
In December 2012, we acquired approximately 22,000 net acres in the Anadarko basin, including 36 gross productive wells, in or proximate to our existing areas of operation in the Cleveland and Tonkawa formations, from a group of sellers including Chalker Energy Partners III, LLC, a private exploration and production company. We acquired approximately 18 MMBoe of estimated proved reserves as of December 31, 2012 in the transaction, comprised of approximately 66% oil and NGLs and approximately 30% proved developed reserves. The Cleveland formation remains our core area of activity, and this acquisition expanded our presence in the southern trend of the formation, which is characterized by higher oil production and reserves per well than our other acreage in the play, yielding better well economics. This acquisition, which we refer to as the Chalker acquisition, added 55 new 640-acre sections to our existing acreage base of 100 sections in the Cleveland formation.
Recent developments
On April 9, 2013 we entered into a new joint development agreement with an affiliate of Vanguard Natural Resources, LLC to drill and develop horizontal Woodford shale formation wells in an area of mutual
4
interest, or AMI, covering 360 sections (230,400 gross acres) in Hughes and Pittsburg counties, Oklahoma. Vanguard Natural Resources owns a working interest in approximately 100 of these sections within the AMI. Under the new agreement, we have agreed to drill and complete eight wells as contract operator, with working interests ranging from 25% to 60%, depending on elections, within three years. Upon completion of the commitment wells, we are entitled to commence a continuous development program with Vanguard Natural Resources in the other sections of the AMI, pursuant to which we are obligated to drill one well every 90 days for the agreement to remain in effect. The first commitment well is to spud on or before July 1, 2013. We have the potential to drill up to 360 locations under this joint development agreement in sections where Vanguard Natural Resources currently has an interest.
Since completing the Chalker acquisition in December 2012, we have increased our Cleveland rig count from two rigs to six rigs and plan to increase our total rig count to as many as eight rigs by January 2014.
Our business strategies
Our goal is to increase stockholder value by leveraging the operational expertise of our management and technical teams in our operating areas in order to achieve compelling economic returns and attractive reserve, production and cash flow growth. We seek to achieve this goal by executing the following strategies:
Grow production and reserves through development of our liquids-weighted, multi-year inventory. We intend to focus on liquids-weighted development activities in our operating areas, which we believe to be repeatable, low-risk and low-cost, in order to grow our current level of production and proved reserves. We have extensive experience in the Anadarko and Arkoma basins, having drilled over 580 wells in the area since 1988. We believe our historical drilling experience, together with the results of substantial industry activity within our operating areas, provide us with enhanced visibility that helps reduce the risk and uncertainty associated with drilling horizontal wells in these areas. As of April 30, 2013, we have identified 2,435 gross drilling locations, which we believe will enable us to drill and develop our resource base over many years. We expect 99% of our drilling capital expenditures in 2013 to be dedicated to horizontal drilling.
Leverage our extensive operational expertise to continually reduce costs and enhance returns. Decades of experience in the Midcontinent region and emphasis on operational execution and cost control have allowed us to drill and complete wells at significantly lower cost than most other operators and, as a result, to realize compelling economic returns. We seek to apply this expertise in other projects within our areas of operation to enhance their economic profile. For example, upon moving into the Arkoma basin and taking over operations from Southridge through a joint development agreement in April 2011, we succeeded in reducing average drilling days (spud to total depth) from 18 to 12.6, or 30%, by applying techniques we developed in the Anadarko basin. We currently hold the Coal County, Oklahoma record (based on 273 horizontal wells) for the lowest number of drilling days from spud to total depth of 11 days, as compared to the Arkoma basin average of 33 days, according to data received from Smith Bits, as of March 5, 2013. On this basis, we have also drilled the second fastest time of the 621 wells drilled in the Pittsburg and Hughes county areas. In the Arkoma basin, we have reduced our average cost to drill and complete a well from $4.1 million, for the first three wells we drilled in 2011, to $3.1 million, on the most recent 10 wells we drilled during 2012, all of which were of a similar length and scope. Meanwhile, overall well performance remained consistent with previous results.
Execute strategic acquisitions, joint development agreements, and organic leasing where our operating experience can be leveraged. We have successfully increased our production and reserves through selective acquisitions, targeted joint development agreements and organic leasing, and we intend to continue to evaluate acquisition, partnering and leasing opportunities in and around our areas of
5
operation. We focus our acquisition activity where we believe our operational expertise provides the opportunity for meaningful incremental value creation, where our operational methods are relevant and where we serve as operator following the acquisition. We believe that we have a competitive advantage in bidding for acquisitions in that our drilling and completion costs are often lower than those of other potential buyers. Further, we pursue joint development opportunities that complement our acquisition strategy by providing a capital efficient and risk-lowering approach to securing and developing acreage and drilling locations that allows us to apply our expertise in the drilling and completion phase. In this regard, we have established long-term agreements with several large exploration and production companies such as BP, ConocoPhillips, Devon Energy, ExxonMobil, Linn Energy, Vanguard Natural Resources and Samson, in which they have farmed-out portions of their basin operations to us. We have drilled over 265 wells in connection with these types of agreements, over 155 of which have been drilled in connection with an active 12-year drilling relationship with ExxonMobil. We also continue to seek new leasing opportunities to expand our acreage position and complement our existing drilling inventory, as we believe that targeted organic leasing around our existing acreage provides the ability for greater returns due to cost and operating synergies in overlapping areas of operation.
Focus on exploiting additional upside potential within our portfolio. We plan to continue exploiting our proved reserves to maximize production through various enhanced recovery methods, such as optimizing frack design and number of stages, reentering existing wellbores and drilling longer horizontal laterals. Furthermore, the stacked reservoirs within our asset base provide exposure to additional upside potential in several emerging resource plays. Recently, offset operators have been pursuing the exploration of two newly-identified resource opportunities, the Tonkawa and Marmaton formations in the Anadarko basin. As part of our development strategy, we monitor the nearby Tonkawa and Marmaton well results of these other operators. We have begun to assess the potential of these formations within our asset base and believe, based on these results, we have approximately 545 potential drilling locations in the Tonkawa and Marmaton formations that provide us with additional resource potential. Further, our current leasehold position provides longer term potential exposure to other prospective formations found in the Anadarko basin, including the Douglas, Cottage Grove, Cherokee Shale, Atoka Shale, Upper, Middle and Lower Morrow formations, and other prospective formations found in the Arkoma basin, including the Hartshorne, Spiro, Wapanuka, Cromwell and Caney Shale formations.
Maintain operational control over our drilling and completion operations. We operated substantially all of the wells that we drilled and completed during 2012, allowing us to effectively manage the timing and levels of our development spending, overall well costs and operating costs. In addition, we expect to operate the drilling and completion phase on approximately 69% of our 2,435 gross identified drilling locations. With over 81% of our acreage held by existing production, we also will not be required to expend significant capital to hold acreage in our portfolio. We believe that continuing to exercise a high degree of control over our acreage position will provide us with flexibility to manage our drilling program and optimize our returns and profitability.
Opportunistically allocate our resources and capital to enhance returns. Our drilling inventory comprises oil, natural gas and NGLs, which enables us to adjust our development approach based on prevailing commodity prices. Currently, we intend to capitalize on the more favorable liquids pricing environment by continuing to drill acreage with significant oil and NGL components, where 100% of our 2013 drilling capital budget is focused. Within our existing portfolio, oil and NGLs account for approximately 55% of our proved reserves as of December 31, 2012. In addition, we expect that continuing to operate the substantial majority of our drilling locations will allow us to reallocate our capital and resources opportunistically in response to market conditions. Our disciplined focus on well-level returns in allocating our capital and
6
resources has been a key component of our ability to deliver successful results through various commodity price cycles over the last 25 years.
Competitive strengths
We possess a number of competitive strengths that we believe will allow us to successfully execute our business strategy:
Geographic focus in the prolific Anadarko and Arkoma basins. Our operations are focused in the Midcontinent region, targeting liquids-rich opportunities in the Anadarko and Arkoma basins of Texas and Oklahoma. We generally focus on formations characterized by oil and liquids-rich natural gas content, extensive production histories, long-lived reserves, high drilling success rates, and attractive initial production rates. Furthermore, our areas of operation are proximate to well-developed natural gas and liquids midstream infrastructure and oilfield services providers, which we believe reduces the risk of production delays and facilitates adequate takeaway capacity. 95% of our 2013 drilling capital budget is devoted to the Anadarko and Arkoma basins.
Multi-year drilling inventory in existing and emerging resource plays. Our drilling inventory consists of approximately 2,435 gross identified drilling locations in the Anadarko and Arkoma basins, and our development plans target locations that we believe are low-cost, provide attractive economics, present a low risk and support a predictable production profile. As of April 30, 2013, we had identified 521 gross drilling locations in the Cleveland resource play, 14 gross drilling locations in the Granite Wash formation and 904 gross drilling locations in the Arkoma Woodford shale formation. Our concentrated leasehold position has been delineated largely through drilling on our Cleveland leasehold, which we expanded substantially through our recent Chalker acquisition. We have also expanded through joint development agreements with large independent producers and major oil and gas companies in the Cleveland and Granite Wash formations, as well as our strategic new basin entry into the Woodford shale formation of the Arkoma basin. Based on our initial 2013 development plans, we expect to drill 93 gross wells in 2013, as compared to 48 gross wells drilled in 2012, representing a 94% increase. Furthermore, we have identified additional locations in several emerging resource plays that we intend to explore and develop in the coming years, including 194 gross locations in the Tonkawa formation and 351 gross locations in the Marmaton formation.
Extensive operational expertise and low-cost operating structure. Drilling horizontal wells has been our primary drilling approach for the last nine years. Having drilled over 400 horizontal wells in nine formations in our areas of operation since 1996, we have established systematic protocols that we believe provide repeatable results. We also have established relationships with oilfield service providers, vendors and crews, allowing for continued cost efficiencies. As an example, we have consistently drilled horizontal Cleveland wells at a meaningfully lower cost than most of our competition in the same area. Through our focus on drilling, completion and operational efficiencies, we are able to effectively control costs and deliver compelling rates of returns and profitability.
Strong financial position and conservative policies. We are committed to maintaining a conservative financial profile in order to preserve operational flexibility and financial stability. Upon completion of this offering, we estimate that we will have cash on hand and availability under our revolving credit facility totaling approximately $304.1 million. We believe that our operating cash flow, together with availability under our credit facility and our second lien term loan facility, provide us with the financial flexibility to pursue acquisitions, joint development agreements and organic leasing opportunities. In addition, we intend to actively hedge our future production in order to reduce the impact of commodity price volatility on our cash flows. Within 30 days of completion of a well, we typically review the production results and begin entering into commodity price hedges of up to 100% of expected production from that well in order to
7
secure our rates of return for up to five years. As of December 31, 2012, we had over $800 million of notional value in existing hedges with the lenders under our credit facilities. Assuming current market conditions and drilling success rates comparable to our historical performance, we believe we will be able to fund substantially all of our 2013 budgeted capital expenditures with our cash flow from operations.
High caliber management team with deep operating experience and a proven track record. The top four executives of our management team average more than 25 years of industry experience. Furthermore, our management team averages over 20 years of industry experience and has worked together developing assets for many years, resulting in a high degree of continuity. We have assembled a strong technical staff of geoscientists, field operations managers and engineers with significant experience drilling horizontal wells and with fracture stimulation of unconventional formations, which has resulted in a successful track record of reserve and production growth. In addition, our management team has extensive expertise and operational experience in the oil and natural gas industry with a proven track record of successfully negotiating, executing and integrating acquisitions. Members of our management team have previously held positions with major and large independent oil and natural gas companies, including ExxonMobil, BP, Southwestern Energy, Samson, Marathon and Standard Oil.
Alignment of management team. Our predecessor was founded in 1988 by our CEO, Jonny Jones, in continuation of his family's history in the oil and gas business, which dates back to the 1920s. Following the completion of this offering, Jones family members and our management team will control 25.2% of our combined voting power and economic interest (regardless of whether the underwriters' option to purchase additional shares is exercised). See "Principal stockholders." We believe the equity interests of our officers and directors align their interests and provide substantial incentive to grow the value of our business for the benefit of our stockholders.
Risk factors
Investing in our Class A common stock involves risks that include the speculative nature of oil and natural gas exploration, competition, volatile oil and natural gas prices and other material factors. For a discussion of these risks and other considerations that could negatively affect us, including risks related to this offering and our Class A common stock, see "Risk factors" and "Cautionary note regarding forward-looking statements."
Organization
Jones Energy, Inc. was incorporated as a Delaware corporation in March 2013. Following this offering and the transactions related thereto, Jones Energy, Inc. will be a holding company whose sole material asset will consist of 14,000,000 units, which we refer to as JEH LLC Units, in Jones Energy Holdings, LLC, or JEH LLC (or 16,100,000 JEH LLC Units if the underwriters exercise in full their option to purchase additional shares of Class A common stock). As the sole managing member of JEH LLC, Jones Energy, Inc. will be responsible for all operational, management and administrative decisions relating to JEH LLC's business and will consolidate the financial results of JEH LLC and its subsidiaries.
JEH LLC acts as a holding company of operating subsidiaries that own and operate our assets that are used in the exploration, development, production and acquisition of oil and natural gas properties. Prior to this offering, the equity capital of JEH LLC consisted of several classes of limited liability company units with differing entitlements to distributions. In connection with this offering, (i) the Jones family, Metalmark Capital, Wells Fargo Central Pacific Holdings, Inc., or Wells Fargo, and certain members of our management team, or, collectively, the Existing Owners, will convert their existing membership interests in JEH LLC into JEH LLC Units, and (ii) the Second Amended and Restated Limited Liability Company Agreement of JEH LLC,
8
or the Existing Agreement, will be amended and restated as the Third Amended and Restated LLC Agreement, to, among other things, modify JEH LLC's equity capital to consist solely of the JEH LLC Units and admit Jones Energy, Inc. as the sole managing member of JEH LLC.
Jones Energy, Inc.'s certificate of incorporation authorizes two classes of common stock, Class A common stock and Class B common stock. See "Description of capital stock." Only Class A common stock will be sold to investors pursuant to this offering. In a transaction separate from this offering, Jones Energy, Inc. will issue to the Existing Owners, for nominal consideration, a number of shares of Class B common stock that is equal to the number of JEH LLC Units that each Existing Owner receives pursuant to the recapitalization described under "Organizational structure—Recapitalization of JEH LLC." Each share of Class B common stock has no economic rights but entitles its holder to one vote on all matters to be voted on by stockholders generally. Holders of Class A common stock and Class B common stock will vote together as a single class on all matters presented to our stockholders for their vote or approval, except as otherwise required by applicable law or by our amended and restated certificate of incorporation.
We do not intend to list Class B common stock on any stock exchange.
36,836,333 JEH LLC Units and the same number of shares of Class B common stock will be issued to the Existing Owners. The allocation of JEH LLC Units among the Existing Owners will be determined pursuant to the distribution provisions of the Existing Agreement based upon the liquidation value of JEH LLC, which will be implied by the initial public offering price of the shares of Class A common stock sold in this offering. The Existing Owners will have the exchange rights described under "Certain relationships and related party transactions—Exchange agreement."
Upon completion of this offering (based on an assumed initial public offering price of $18.00 per share and assuming no exercise of the underwriters' option to purchase additional shares), Metalmark Capital will beneficially own approximately 61.7% of our Class B common stock (44.7% of our combined economic interest and voting power) and Jones family entities will collectively beneficially own approximately 34.8% of our Class B common stock (25.2% of our combined economic interest and voting power). A $1.00 increase in the assumed initial public offering price of $18.00 per share would cause Metalmark Capital to beneficially own approximately 61.3% of our Class B common stock (44.4% of our combined economic interest and voting power) and Jones family entities to collectively beneficially own approximately 35.2% of our Class B common stock (25.5% of our combined economic interest and voting power). A $1.00 decrease in the assumed initial public offering price of $18.00 per share would cause Metalmark Capital to beneficially own approximately 62.2% of our Class B common stock (45.1% of our combined economic interest and voting power) and Jones family entities to collectively beneficially own approximately 34.3% of our Class B common stock (24.8% of our combined economic interest and voting power).
We will enter into the Tax Receivable Agreement with JEH LLC and the Existing Owners. This agreement generally provides for the payment by Jones Energy, Inc. of 85% of the amount of cash savings, if any, in U.S. federal, state and local income tax or franchise tax that it actually realizes (or is deemed to realize in certain circumstances) in periods after this offering as a result of (i) the tax basis increases resulting from the exchange of JEH LLC Units and shares of Class B common stock for shares of Class A common stock (or resulting from a sale of JEH LLC Units and shares of Class B common stock for cash) and (ii) imputed interest deemed to be paid by us as a result of, and additional tax basis arising from, any payments we make under the Tax Receivable Agreement. Jones Energy, Inc. will retain the benefit of the remaining 15% of these cash savings. See "Certain relationships and related party transactions—Tax receivable agreement."
9
The diagram below depicts our organizational structure immediately following this offering and the transactions related thereto (assuming that the underwriters' option to purchase additional shares is not exercised).
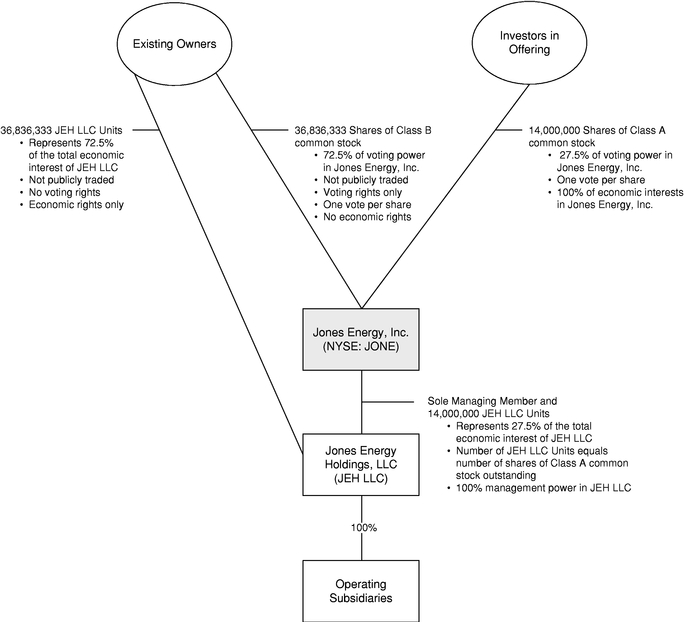
Jones Energy, Inc. will contribute the proceeds from this offering to JEH LLC in exchange for 14,000,000 JEH LLC Units. Following this offering, the Existing Owners will beneficially own 36,836,333 JEH LLC Units and 36,836,333 shares of Class B common stock of Jones Energy, Inc., which in the aggregate will represent approximately 72.5% of the voting power of Jones Energy, Inc. (approximately 68.3% if the underwriters' option to purchase additional shares is exercised in full and Metalmark Capital and Wells Fargo elect to exchange JEH LLC Units and a corresponding number of shares of Class B common stock for cash proceeds we receive from the underwriters' option to purchase additional shares of Class A common stock), based on an assumed initial offering price equal to the midpoint of the price range set forth on the cover of this prospectus.
10
Corporate information
Our principal executive offices are located at 807 Las Cimas Pkwy, Suite 350, Austin, Texas 78746, and our telephone number is (512) 328-2953. Our website address is www.jonesenergy.com. We expect to make available our periodic reports and other information filed with or furnished to the Securities and Exchange Commission, which we refer to as the SEC, free of charge through our website, as soon as reasonably practicable after those reports and other information are electronically filed with or furnished to the SEC. Information on our website or any other website is not incorporated by reference herein and does not constitute a part of this prospectus.
Implications of being an emerging growth company
As a company with less than $1.0 billion in revenue during its last fiscal year, we qualify as an "emerging growth company" as defined in the recently enacted Jumpstart Our Business Startups Act of 2012, or the "JOBS Act." An emerging growth company may take advantage of specified reduced reporting and other burdens that are otherwise applicable generally to public companies. These provisions include:
- •
- an ability to provide only two years of audited financial statements and related disclosures;
- •
- an exemption from the auditor attestation requirement in the assessment of the emerging growth company's internal control
over financial reporting;
- •
- reduced disclosure about the emerging growth company's executive compensation arrangements;
- •
- exemptions from the requirements of holding a non-binding advisory note on executive compensation and shareholder approval
of any golden parachute payments not previously approved; and
- •
- delayed adoption of certain accounting standards.
We may take advantage of these provisions for up to five years or through such earlier date that we are no longer an emerging growth company. We would cease to be an emerging growth company if we had more than $1.0 billion in annual revenues, had more than $700 million in market value of our common stock held by non-affiliates, or issued more than $1.0 billion of non-convertible debt over a three-year period. In this prospectus, we have taken advantage of the reduced disclosure obligations with respect to executive compensation disclosure. We may choose to take advantage of this and other reduced reporting requirements in future filings. As a result, the information that we provide you may be different than you might obtain from other public companies in which you hold equity interests. We have irrevocably elected to "opt out" of the exemption for the delayed adoption of certain accounting standards and, therefore, will be subject to the same new or revised accounting standards as other public companies that are not emerging growth companies.
11
The offering
| Class A common stock offered to the public | 14,000,000 shares (16,100,000 shares if the underwriters exercise their option to purchase additional shares in full). The Jones family entities, all of which are directly or indirectly controlled by Jonny Jones and/or his immediate family, intend to purchase 1,000,000 shares of our Class A common stock at the public offering price. The underwriters will receive no underwriting discount or commission on any sale of shares of Class A common stock to the Jones family entities. The Jones family entities are not obligated to purchase these shares. | |
Option to purchase additional shares |
We have granted the underwriters an option for a period of 30 days from the date of this prospectus to purchase up to 2,100,000 additional shares of Class A common stock. |
|
Class A common stock outstanding after this offering |
14,000,000 shares (16,100,000 shares if the underwriters exercise their option to purchase additional shares in full). If all outstanding JEH LLC Units held by the Existing Owners were exchanged (along with a corresponding number of shares of our Class B common stock) for newly-issued shares of Class A common stock on a one-for-one basis, 50,836,333 shares of Class A common stock would be outstanding (regardless of whether the underwriters' option to purchase additional shares is exercised). |
12
| Class B common stock outstanding after this offering | 36,836,333 shares (34,736,333 shares if the underwriters' option to purchase additional shares is exercised in full and Metalmark Capital and Wells Fargo elect to exchange JEH LLC Units and a corresponding number of shares of Class B common stock for cash proceeds we receive from the underwriters' option to purchase additional shares of Class A common stock), or one share for each JEH LLC Unit held by the Existing Owners immediately following this offering. Shares of our Class B common stock have voting rights, but no economic rights. When a JEH LLC Unit is exchanged for a share of Class A common stock, a share of Class B common stock held by the Existing Owners will be cancelled. | |
Voting power of Class A common stock after giving effect to this offering |
27.5% (or 100% if all outstanding JEH LLC Units held by the Existing Owners were exchanged, along with a corresponding number of shares of our Class B common stock, for newly-issued shares of Class A common stock on a one-for-one basis). |
|
Voting power of Class B common stock after giving effect to this offering |
72.5% (or 0% if all outstanding JEH LLC Units held by the Existing Owners were exchanged, along with a corresponding number of shares of our Class B common stock, for newly-issued shares of Class A common stock on a one-for-one basis). |
|
Use of proceeds |
We expect to receive approximately $232.3 million of net proceeds from the sale of the Class A common stock offered by us, based upon the assumed initial public offering price of $18.00 per share (the midpoint of the price range set forth on the cover page of this prospectus), after deducting underwriting discounts and commissions and estimated offering expenses payable by us. |
|
Jones Energy, Inc. will contribute the proceeds from this offering to JEH LLC in exchange for JEH LLC Units. JEH LLC intends to use those net proceeds to reduce the then outstanding borrowings under its senior secured revolving credit facility ($445 million outstanding at June 30, 2013, excluding outstanding letters of credit totaling $350,000). See "Use of proceeds." |
13
| If the underwriters exercise their option to purchase additional shares of our Class A common stock, we intend to use the proceeds from the sale of such shares to purchase up to 2,100,000 JEH LLC Units from Metalmark Capital and Wells Fargo at a purchase price equal to the public offering price of the Class A common stock offered hereby less underwriting discounts and commissions. In this case, an equivalent number of shares of Class B common stock will be cancelled. | ||
Voting rights |
Each share of our Class A common stock entitles its holder to one vote on all matters to be voted on by stockholders generally. Each share of our Class B common stock entitles its holder to one vote on all matters to be voted on by stockholders generally. Holders of our Class A common stock and Class B common stock vote together as a single class on all matters presented to our stockholders for their vote or approval, except as otherwise required by applicable law or by our amended and restated certificate of incorporation. See "Description of capital stock." |
|
Dividend policy |
We do not anticipate paying any cash dividends on our Class A common stock. In addition, our senior secured revolving credit facility and our second lien term loan facility prevent us from paying cash dividends. See "Dividend policy." |
|
Exchange rights of holders of JEH LLC Units |
Under the Exchange Agreement, holders of JEH LLC Units may exchange their JEH LLC Units (together with a corresponding number of shares of Class B common stock) for shares of Class A common stock (on a one-for-one basis, subject to customary conversion rate adjustments for stock splits, stock dividends and reclassification and other similar transactions). |
|
Risk factors |
You should carefully read and consider the information in this prospectus set forth under the heading "Risk factors" and all other information set forth in this prospectus before deciding to invest in our Class A common stock. |
|
Exchange listing |
We have been approved to list our Class A common stock on the NYSE under the symbol "JONE," subject to official notice of issuance. |
14
| Qualified independent underwriter | Affiliates of certain of the underwriters are lenders under our senior secured revolving credit facility and, accordingly, will receive a portion of the net proceeds of this offering. Because affiliates of certain of the underwriters will receive more than 5% of the net proceeds in this offering, certain of the underwriters will be deemed to have a "conflict of interest" under Rule 5121(f)(5) of the Financial Industry Regulatory Authority, Inc., or FINRA. In addition, two of our directors, Howard I. Hoffen and Gregory D. Myers, are employees of Metalmark Capital LLC. All directors and employees of Metalmark Capital LLC are also employees of an affiliate of Citigroup Global Markets Inc., or Citigroup, one of the underwriters in this offering, and, in such capacity, manage similar investment funds on behalf of Citigroup and its affiliates. As described on pages 145 and 146, affiliates of Citigroup will, through Metalmark Capital, indirectly own approximately 61.7% of our Class B common stock (44.7% of our combined economic interest and voting power) pursuant to the recapitalization described under "Organizational structure—Recapitalization of JEH LLC" upon the completion of this offering (assuming no exercise of the underwriters' option to purchase additional shares). As a result of the relationship of Messrs. Hoffen and Myers with us and Metalmark Capital and Metalmark Capital's ownership interest in us, Citigroup is deemed to have a "conflict of interest" under Rule 5121. Accordingly, this offering will be made in compliance with the applicable provisions of Rule 5121. Rule 5121 requires that a qualified independent underwriter, or QIU, participate in the preparation of this prospectus and exercise the usual standards of due diligence with respect thereto. Barclays has served in that capacity and performed due diligence investigations and reviewed and participated in the preparation of the registration statement of which this prospectus is a part. We have agreed, subject to certain terms and conditions, to indemnify Barclays against certain liabilities incurred in connection with it acting as QIU in this offering, including liabilities under the Securities Act of 1933, as amended, or the Securities Act. See "Use of proceeds" and "Underwriting (conflicts of interest)." |
15
Summary historical consolidated and unaudited pro forma financial data
Set forth below is our summary historical consolidated financial data for the years ended December 31, 2010, 2011 and 2012 and the three months ended March 31, 2012 and 2013, and summary unaudited pro forma financial information giving effect to the Chalker acquisition for the periods indicated. The summary historical financial data as of December 31, 2010, 2011 and 2012 is derived from our historical consolidated financial statements that are included elsewhere in this prospectus. The summary historical financial data as of March 31, 2012 and 2013 is derived from the unaudited financial statements of the company. The summary unaudited pro forma financial data as of and for the three months ended March 31, 2012 and 2013 and for the year ended December 31, 2012 is derived from the unaudited pro forma condensed consolidated financial statements included elsewhere in this prospectus and give effect to the Chalker acquisition as if it had occurred on January 1, 2012. There have been no pro forma adjustments made to the summary unaudited pro forma condensed consolidated financial data presented below to give effect to the reorganization and offering transactions described in "Organizational structure." The unaudited pro forma financial information, while helpful in illustrating the financial characteristics of the consolidated company under one set of assumptions, does not reflect the impact of possible revenue enhancements, expense efficiencies and asset dispositions, among other factors, that may result as a consequence of the acquisition and, accordingly, does not attempt to predict or suggest future results. It also does not necessarily reflect what the historical results of the consolidated company would have been had the acquisition occurred prior to these periods.
For further information that will help you better understand the summary financial data, you should read this financial data in conjunction with "Selected historical and unaudited pro forma consolidated financial data," "Management's discussion and analysis of financial condition and results of operations" and the historical consolidated financial statements and the unaudited pro forma financial statements and related notes and other financial information included elsewhere in this prospectus. Our historical results of operations are not necessarily indicative of results to be expected for any future periods.
16
| |
|
|
|
|
|
Pro forma | ||||||||||||||||
|---|---|---|---|---|---|---|---|---|---|---|---|---|---|---|---|---|---|---|---|---|---|---|
| |
|
|
|
Three months ended March 31, |
||||||||||||||||||
| |
Year ended December 31, | Year ended December 31, 2012 |
Three months ended March 31, 2013 |
|||||||||||||||||||
| |
2010 |
2011 |
2012 |
2012 |
2013 |
|||||||||||||||||
| |
|
|
|
(unaudited) |
(unaudited) |
|||||||||||||||||
Statement of operations data (dollars in thousands): |
||||||||||||||||||||||
Operating revenues: |
||||||||||||||||||||||
Oil and gas sales |
$ | 97,523 | $ | 167,261 | $ | 148,967 | $ | 42,517 | $ | 55,259 | $ | 193,838 | $ | 55,259 | ||||||||
Other revenues |
933 | 1,022 | 847 | 280 | 221 | 847 | 221 | |||||||||||||||
Total |
98,456 | 168,283 | 149,814 | 42,797 | 55,480 | 194,685 | 55,480 | |||||||||||||||
Operating costs and expenses: |
||||||||||||||||||||||
Lease operating expense |
16,296 | 21,548 | 23,097 | 5,528 | 5,345 | 24,672 | 5,345 | |||||||||||||||
Production tax expense |
2,206 | 5,333 | 5,583 | 1,593 | 2,452 | 7,913 | 2,452 | |||||||||||||||
Exploration costs |
4,208 | 780 | 356 | 74 | 126 | 356 | 126 | |||||||||||||||
Depreciation, depletion and amortization |
48,008 | 68,906 | 80,709 | 18,773 | 25,101 | 92,810 | 25,101 | |||||||||||||||
Impairment expense |
10,727 | 31,970 | 18,821 | 18 | — | 18,821 | — | |||||||||||||||
Accretion expense |
490 | 413 | 533 | 146 | 97 | 606 | 97 | |||||||||||||||
General and administrative expense |
11,423 | 16,679 | 15,875 | 3,676 | 4,312 | 15,576 | 4,203 | |||||||||||||||
Total costs and expenses |
93,358 | 145,629 | 144,974 | 29,808 | 37,433 | 160,754 | 37,324 | |||||||||||||||
Operating income |
5,098 | 22,654 | 4,840 | 12,989 | 18,047 | 33,931 | 18,156 | |||||||||||||||
Other income (expenses): |
||||||||||||||||||||||
Interest expense |
(12,575 | ) | (21,190 | ) | (24,714 | ) | (6,601 | ) | (7,980 | ) | (25,928 | ) | (6,518 | ) | ||||||||
Net gain (loss) on commodity derivatives |
23,758 | 34,490 | 16,684 | 7,737 | (11,383 | ) | 16,684 | (11,383 | ) | |||||||||||||
Gain on bargain purchase |
— | 26,208 | — | — | — | — | — | |||||||||||||||
Gain (loss) on sale of assets |
8,644 | (859 | ) | 1,162 | 1,429 | 70 | 1,162 | 70 | ||||||||||||||
Total other income (expense) |
19,827 | 38,649 | (6,868 | ) | 2,565 | (19,293 | ) | (8,082 | ) | (17,831 | ) | |||||||||||
Income before income taxes |
24,925 | 61,303 | (2,028 | ) | 15,554 | (1,246 | ) | 25,849 | 325 | |||||||||||||
Provision for income taxes |
145 | 173 | 473 | 111 | (1 | ) | 2,981 | 30 | ||||||||||||||
Net income (loss) |
$ | 24,780 | $ | 61,130 | $ | (2,501 | ) | $ | 15,443 | $ | (1,245 | ) | $ | 22,868 | $ | 295 | ||||||
Net income attributable to non-controlling interest |
17,325 | 223 | ||||||||||||||||||||
Net income attributable to Jones Energy, Inc. |
$ | 5,543 | $ | 72 | ||||||||||||||||||
Earnings per share |
$ | 0.34 | $ | 0.004 | ||||||||||||||||||
Other supplementary data: |
||||||||||||||||||||||
Adjusted EBITDAX(1) |
$ | 73,992 | $ | 127,657 | $ | 135,385 | $ | 37,284 | $ | 47,278 | $ | 176,650 | $ | 47,387 | ||||||||
(1) Adjusted EBITDAX is a non-GAAP financial measure. For a definition of Adjusted EBITDAX and a reconciliation of Adjusted EBITDAX to our net income, see "—Non-GAAP financial measure" below.
17
| |
Year ended December 31, | Three months ended March 31, |
||||||||||||||
|---|---|---|---|---|---|---|---|---|---|---|---|---|---|---|---|---|
| |
2010 |
2011 |
2012 |
2012 |
2013 |
|||||||||||
| |
|
|
|
(unaudited) |
||||||||||||
Statement of cash flow data (dollars in thousands) |
||||||||||||||||
Net cash flow provided by operating activities |
$ | 44,624 | $ | 120,217 | $ | 84,550 | $ | 26,961 | $ | 30,996 | ||||||
Net cash used in investing activities |
(90,785 | ) | (318,963 | ) | (337,636 | ) | (21,424 | ) | (32,893 | ) | ||||||
Net cash provided by financing activities |
49,200 | 186,322 | 270,676 | 3,000 | (5,025 | ) | ||||||||||
Net increase (decrease) in cash |
$ | 3,039 | $ | (12,424 | ) | $ | 17,590 | $ | 8,537 | $ | (6,922 | ) | ||||
| |
As of December 31, | As of March 31, | ||||||||||||||
|---|---|---|---|---|---|---|---|---|---|---|---|---|---|---|---|---|
| |
2010 |
2011 |
2012 |
2012 |
2013 |
|||||||||||
| |
|
|
|
(unaudited) |
||||||||||||
Balance sheet data (dollars in thousands): |
||||||||||||||||
Cash and cash equivalents |
$ | 18,560 | $ | 6,136 | $ | 23,726 | $ | 14,673 | $ | 16,804 | ||||||
Other current assets |
49,742 | 88,546 | 74,886 | 79,318 | 75,337 | |||||||||||
Total current assets |
68,302 | 94,682 | 98,612 | 93,991 | 92,141 | |||||||||||
Property and equipment, net |
495,613 | 743,575 | 1,010,742 | 745,411 | 1,029,501 | |||||||||||
Other long-term assets |
21,379 | 42,878 | 41,332 | 43,169 | 36,170 | |||||||||||
Total assets |
$ | 585,294 | $ | 881,135 | $ | 1,150,686 | $ | 882,571 | $ | 1,157,812 | ||||||
Current liabilities |
$ | 60,938 | $ | 107,689 | $ | 92,039 | $ | 87,267 | $ | 107,674 | ||||||
Long-term debt |
225,000 | 415,000 | 610,000 | 418,000 | 605,000 | |||||||||||
Other long-term liabilities |
14,907 | 11,733 | 18,865 | 15,007 | 16,481 | |||||||||||
Total members' capital |
284,449 | 346,713 | 429,782 | 362,297 | 428,657 | |||||||||||
Total liabilities and members' capital |
$ | 585,294 | $ | 881,135 | $ | 1,150,686 | $ | 882,571 | $ | 1,157,812 | ||||||
Non-GAAP financial measure
Adjusted EBITDAX is a supplemental non-GAAP financial measure that is used by management and external users of our consolidated financial statements, such as industry analysts, investors, lenders and rating agencies.
We define Adjusted EBITDAX as earnings before interest expense, income taxes, depreciation, depletion and amortization, exploration expense, gains and losses from derivatives less the current period settlements of matured derivative contracts and other items. Adjusted EBITDAX is not a measure of net income as determined by United States generally accepted accounting principles, or GAAP. Management believes Adjusted EBITDAX is useful because it allows them to more effectively evaluate our operating performance and compare the results of our operations from period to period and against our peers without regard to our financing methods or capital structure. We exclude the items listed above from net income in arriving at Adjusted EBITDAX because these amounts can vary substantially from company to company within our industry depending upon accounting methods and book values of assets, capital structures and the method by which the assets were acquired. Adjusted EBITDAX has limitations as an analytical tool and should not be considered as an alternative to, or more meaningful than, net income as determined in accordance with GAAP or as an indicator of our liquidity. Certain items excluded from Adjusted EBITDAX are significant components in understanding and assessing a company's financial performance, such as a company's cost of capital and tax structure, as well as the historical costs of depreciable assets. Our presentation of Adjusted EBITDAX should not be construed as an inference that our results will be unaffected by unusual or non-recurring items. Our computations of Adjusted EBITDAX may not be comparable to other similarly titled measures of other companies.
18
The following table sets forth a reconciliation of net income (loss) as determined in accordance with GAAP to Adjusted EBITDAX for the periods indicated:
| |
|
|
|
|
|
Pro forma | ||||||||||||||||
|---|---|---|---|---|---|---|---|---|---|---|---|---|---|---|---|---|---|---|---|---|---|---|
| |
|
|
|
Three months ended March 31, |
||||||||||||||||||
| |
Year ended December 31, | Year ended December 31, 2012 |
Three months ended March 31, 2013 |
|||||||||||||||||||
| |
2010 |
2011 |
2012 |
2012 |
2013 |
|||||||||||||||||
| |
|
|
|
(unaudited) |
(unaudited) |
|||||||||||||||||
| |
(dollars in thousands) |
|
|
|
||||||||||||||||||
Reconciliation of Adjusted EBITDAX to net income (loss) |
||||||||||||||||||||||
Net income (loss) |
$ | 24,780 | $ | 61,130 | $ | (2,501 | ) | $ | 15,443 | $ | (1,245 | ) | $ | 22,868 | $ | 295 | ||||||
Interest expense (excluding amortization of deferred financing costs) |
10,610 | 18,250 | 21,170 | 5,718 | 7,316 | 22,992 | 5,748 | |||||||||||||||
Exploration expense (excluding geological and geophysical) |
3,429 | 478 | — | — | — | — | — | |||||||||||||||
Deferred taxes |
145 | 173 | 473 | 111 | (1 | ) | 2,981 | 30 | ||||||||||||||
Amortization of deferred financing costs |
1,965 | 2,940 | 3,544 | 883 | 664 | 2,936 | 770 | |||||||||||||||
Depreciation and depletion |
48,008 | 68,906 | 80,709 | 18,773 | 25,101 | 92,810 | 25,101 | |||||||||||||||
Impairment of oil and natural gas properties |
10,727 | 31,970 | 18,821 | 18 | — | 18,821 | — | |||||||||||||||
Accretion expense |
490 | 413 | 533 | 146 | 97 | 606 | 97 | |||||||||||||||
Other non-cash charges |
390 | (59 | ) | 129 | (25 | ) | 165 | 129 | 165 | |||||||||||||
Compensation expense |
1,134 | 570 | 142 | 120 | 570 | 120 | ||||||||||||||||
Bargain purchase |
— | (26,208 | ) | — | — | — | — | — | ||||||||||||||
Net loss (gain) on derivative contracts |
(23,758 | ) | (34,490 | ) | (16,684 | ) | (7,737 | ) | 11,383 | (16,684 | ) | 11,383 | ||||||||||
Current period settlements of matured derivative contracts(1) |
5,850 | 2,161 | 29,783 | 5,241 | 3,748 | 29,783 | 3,748 | |||||||||||||||
Loss (gain) on sales of assets |
(8,644 | ) | 859 | (1,162 | ) | (1,429 | ) | (70 | ) | (1,162 | ) | (70 | ) | |||||||||
Adjusted EBITDAX |
$ | 73,992 | $ | 127,657 | $ | 135,385 | $ | 37,284 | $ | 47,278 | $ | 176,650 | $ | 47,387 | ||||||||
(1) Current period settlements of matured derivative contracts are limited to cumulative gains and losses that have been reported in prior periods in accordance with GAAP and reflect settlement activity for all commodity derivatives that were settled during the respective periods, whether received or paid, but they do not include any amount representing the recovery of costs. Adjusted EBITDAX includes only the settled portion of derivative gains and losses in order to reflect only that activity that has occurred and for which either the cash has been paid or received or can be accrued as due. Additionally, this calculation of Adjusted EBITDAX is consistent with the requirements for our debt covenant calculations.
19
Summary historical reserve and operating data
Proved reserves
The following table sets forth summary data with respect to our estimated net proved oil and natural gas reserves as of December 31, 2010, 2011 and 2012, which are based upon reserve reports of Cawley, Gillespie & Associates, Inc., or Cawley Gillespie, our independent reserve engineers. Cawley Gillespie's reports were prepared consistent with the rules and regulations of the SEC regarding oil and natural gas reserve reporting in effect during such period. Summary reports of our independent reserve engineers are included as exhibits to the registration statement of which this prospectus forms a part.
| |
At December 31, | |||||||||
|---|---|---|---|---|---|---|---|---|---|---|
| |
2010 |
2011 |
2012 |
|||||||
Reserve data: |
||||||||||
Estimated proved reserves: |
||||||||||
Oil (MBbls) |
5,991 | 7,440 | 12,540 | |||||||
Natural gas (MMcf) |
108,634 | 244,579 | 228,080 | |||||||
NGLs (MBbls) |
9,953 | 34,606 | 34,746 | |||||||
Total estimated proved reserves (MBoe)(1) |
34,050 | 82,809 | 85,299 | |||||||
Estimated proved developed reserves: |
||||||||||
Oil (MBbls) |
2,646 | 2,535 | 4,262 | |||||||
Natural gas (MMcf) |
50,469 | 110,433 | 110,956 | |||||||
NGLs (MBbls) |
4,017 | 14,020 | 16,320 | |||||||
Total estimated proved developed reserves (MBoe)(1) |
15,075 | 34,961 | 39,075 | |||||||
Estimated proved undeveloped reserves: |
||||||||||
Oil (MBbls) |
3,345 | 4,905 | 8,278 | |||||||
Natural gas (MMcf) |
58,165 | 134,146 | 117,124 | |||||||
NGLs (MBbls) |
5,936 | 20,586 | 18,426 | |||||||
Total estimated proved undeveloped reserves (MBoe)(1) |
18,975 | 47,849 | 46,225 | |||||||
Standardized measure (in millions)(2) |
$ | 355 | $ | 916 | $ | 782 | ||||
(1) One Boe is equal to six Mcf of natural gas or one Bbl of oil or NGLs based on an approximate energy equivalency. This is a physical correlation and does not reflect a value or price relationship between the commodities.
(2) Standardized measure is calculated in accordance with Statement of Financial Accounting Standards No. 69 Disclosures About Oil and Gas Producing Activities, as codified in ASC Topic 932, Extractive Activities—Oil and Gas. We were a limited liability company and were not subject to entity-level taxation during the periods presented except for the Texas margin tax. Accordingly, standardized measure for historical periods was not reduced for income taxes. However, upon consummation of this offering, we will be a corporation subject to entity-level taxation.
The following table sets forth the benchmark prices used to determine our estimated proved reserves from proved oil and natural gas reserves for the periods indicated.
| |
At December 31, | |||||||||
|---|---|---|---|---|---|---|---|---|---|---|
| |
2010 |
2011 |
2012 |
|||||||
Oil, natural gas and NGLs prices: |
||||||||||
Oil (per Bbl)(1) |
$ | 79.43 | $ | 96.19 | $ | 94.71 | ||||
Natural gas (per MMBtu)(3) |
4.37 | 4.12 | 2.76 | |||||||
NGLs (per Bbl)(2) |
38.72 | 47.26 | 31.27 | |||||||
(1) Benchmark prices for oil at December 31, 2010, 2011 and 2012 reflect the unweighted arithmetic average first-day-of-the-month prices for the prior 12 months, using WTI Cushing posted prices. These prices were utilized in the December 31 2010, 2011 and 2012 reserve reports prepared by Cawley Gillespie and are adjusted by well for content, quality, transportation fees, geographical differentials, marketing bonuses or
20
deductions and other factors affecting the price received at the wellhead. As of December 31, 2010, 2011 and 2012, the average realized prices for oil were $75.93, $92.04 and $90.74 per Bbl, respectively.
(2) Prices for NGLs at December 31, 2010, 2011 and 2012 in the table above reflect the average realized prices. Benchmark prices for NGLs vary depending on the composition of the NGL basket and current prices for the various components thereof, such as butane, ethane, propane, among others. Due to recent declines in ethane pricing and increase in natural gas prices, beginning in 2012, purchasers of our Woodford production have been electing not to recover ethane from the natural gas stream and instead are paying us based on the natural gas price for the ethane left in the gas stream. As a result of the increased energy content associated with the returned ethane and the absence of plant shrinkage, this ethane rejection has increased the incremental revenue and volumes that we receive for our natural gas product relative to what we would have received if the ethane was separately recovered, but has reduced physical barrels of liquid ethane that we are selling.
(3) Benchmark prices for natural gas at December 31, 2010, 2011 and 2012 reflect the unweighted arithmetic average first-day-of-the-month prices for the prior 12 months, using Henry Hub prices. These prices were utilized in the December 31 2010, 2011 and 2012 reserve reports prepared by Cawley Gillespie and are adjusted by well for content, quality, transportation fees, geographical differentials, marketing bonuses or deductions and other factors affecting the price received at the wellhead. As of December 31, 2010, 2011 and 2012, the average realized prices for natural gas were $4.56, $3.83 and $2.24 per MMBtu, respectively.
Operating data
The following table sets forth summary data regarding production volumes, average prices and average production costs associated with our sale of oil and natural gas for the periods indicated and on a pro forma basis to give effect to the Chalker acquisition as if it had occurred on January 1, 2012.
| |
|
|
|
|
|
Pro forma | ||||||||||||||||
|---|---|---|---|---|---|---|---|---|---|---|---|---|---|---|---|---|---|---|---|---|---|---|
| |
|
|
|
Three months ended March 31, |
||||||||||||||||||
| |
Year ended December 31, | Year ended December 31, 2012 |
Three months ended March 31, 2013 |
|||||||||||||||||||
| |
2010 |
2011 |
2012 |
2012 |
2013 |
|||||||||||||||||
| |
|
|
|
(unaudited) |
(unaudited) |
|||||||||||||||||
Production and operating data: |
||||||||||||||||||||||
Net production volumes(1): |
||||||||||||||||||||||
Oil (MBbls) |
593 | 811 | 746 | 194 | 312 | 1,146 | 312 | |||||||||||||||
Natural gas (MMcf) |
10,931 | 11,443 | 14,066 | 3,545 | 4,266 | 15,424 | 4,266 | |||||||||||||||
NGLs (MBbls)(2) |
— | 1,215 | 1,773 | 446 | 406 | 1,972 | 406 | |||||||||||||||
Total (MBoe) |
2,415 | 3,933 | 4,863 | 1,231 | 1,429 | 5,689 | 1,429 | |||||||||||||||
Average net production (Boe/d) |
6,616 | 10,776 | 13,288 | 13,527 | 15,878 | 15,543 | 15,878 | |||||||||||||||
Average sales price(3): |
||||||||||||||||||||||
Oil (per Bbl) |
$ | 73.79 | $ | 90.96 | $ | 89.71 | $ | 98.25 | $ | 88.38 | $ | 89.47 | $ | 88.38 | ||||||||
Natural gas (per Mcf) |
4.92 | 3.49 | 2.17 | 2.09 | 3.00 | 2.18 | 3.00 | |||||||||||||||
NGLs (per Bbl)(2) |
— | 44.04 | 29.07 | 36.00 | 36.69 | 29.27 | 36.69 | |||||||||||||||
Combined (per Boe) realized |
$ | 40.38 | $ | 42.53 | $ | 30.63 | $ | 34.54 | $ | 38.67 | $ | 34.07 | $ | 38.67 | ||||||||
Average unit costs per Boe: |
||||||||||||||||||||||
Lease operating expense |
$ | 6.44 | $ | 5.30 | $ | 4.56 | $ | 4.34 | $ | 3.15 | $ | 4.12 | $ | 3.15 | ||||||||
Production and ad valorem tax expense |
1.22 | 1.53 | 1.34 | 1.44 | 2.30 | 1.60 | 2.30 | |||||||||||||||
Depreciation, depletion and amortization |
19.88 | 17.52 | 16.60 | 15.25 | 17.57 | 16.31 | 17.57 | |||||||||||||||
General and administrative expense |
4.73 | 4.24 | 3.26 | 2.99 | 3.02 | 2.74 | 2.94 | |||||||||||||||
(1) The Coalgate Woodford field constituted approximately 41% of our estimated proved reserves as of December 31, 2012. Our production from the Coalgate Woodford field was 675 Mboe and 1,529 MBoe for the years ended December 31, 2011 and 2012, respectively. The 2011 production was comprised of 10 MBbls of oil, 2,029 MMcf of natural gas and 327 MBbls NGLs. The 2012 production was comprised of 33 MBbls of oil, 4,357 MMcf of natural gas and 770 MBbls of NGLs. The Coalgate Woodford field was acquired in April 2011, therefore we had no production from the field for the year ended December 31, 2010.
The Lipscomb SE field constituted approximately 21% of our estimated proved reserves as of December 31, 2012. Our production from the Lipscomb SE field was 36 MBoe for the year ended December 31, 2012. The 2012 production was comprised of 17 MBbls of oil, 61 MMcf of natural gas and 9 MBbls of NGLs. The Lipscomb SE field was acquired in December 2012, therefore we had no production from the field for the years ended December 31, 2010 and 2011.
(2) We did not track NGLs as a separate product category in 2010. The production of NGLs was included in total natural gas production for that year.
(3) Prices do not include the effects of derivative cash settlements.
21
Investing in our Class A common stock involves a high degree of risk. You should carefully consider the risks described below together with the other information set forth in this prospectus before making an investment decision. Our business, financial condition or results of operations could be materially adversely affected by any of these risks. The trading price of our Class A common stock could decline due to any of these risks, and you may lose all or part of your investment.
Risks related to our business
Drilling for and producing oil, natural gas and NGLs are high risk activities with many uncertainties that could adversely affect our business, financial condition or results of operations.
Our future financial condition and results of operations will depend on the success of our exploration, exploitation, development and production activities. Our oil, natural gas and NGLs exploitation, development and production activities are subject to numerous risks beyond our control, including the risk that drilling will not result in commercially viable oil and natural gas production. Our decisions to purchase, explore, develop or otherwise exploit locations or properties will depend in part on the evaluation of information obtained through geophysical and geological analyses, production data and engineering studies, the results of which are often inconclusive or subject to varying interpretations. In addition, our cost of drilling, completing and operating wells is often uncertain before drilling commences. Further, many factors may curtail, delay or cancel our scheduled drilling projects, including the following:
- •
- delays imposed by or resulting from compliance with regulatory and contractual requirements and related lawsuits, which
may include limitations on hydraulic fracturing or the discharge of greenhouse gases;
- •
- pressure or irregularities in geological formations;
- •
- shortages of or delays in obtaining equipment and qualified personnel;
- •
- equipment failures or accidents;
- •
- fires and blowouts;
- •
- adverse weather conditions, such as hurricanes, blizzards and ice storms;
- •
- declines in oil, natural gas and NGL prices;
- •
- limited availability of financing at acceptable rates;
- •
- title problems; and
- •
- limitations in the market for oil, natural gas and NGLs.
Part of our strategy involves using some of the latest available horizontal drilling and completion techniques, which involve risks and uncertainties in their application.
Our operations involve utilizing some of the latest drilling and completion techniques as developed by us and our service providers. Risks that we face while drilling include, but are not limited to, the following:
- •
- landing our wellbore in the desired drilling zone;
- •
- staying in the desired drilling zone while drilling horizontally through the formation;
- •
- running our casing the entire length of the wellbore; and
- •
- running tools and other equipment consistently through the horizontal wellbore.
22
Risks that we face while completing our wells include, but are not limited to, the following:
- •
- the ability to fracture stimulate the planned number of stages;
- •
- the ability to run tools the entire length of the wellbore during completion operations;
and
- •
- the ability to successfully clean out the wellbore after completion of the final fracture stimulation stage.
The results of our drilling in new or emerging formations are more uncertain initially than drilling results in areas that are more developed and have a longer history of established production. Newer or emerging formations and areas have limited or no production history and, consequently, we are more limited in assessing future drilling results in these areas.
The value of our undeveloped acreage could decline if drilling results are unsuccessful.
The success of our horizontal drilling and completion techniques can only be evaluated over time as more wells are drilled and production profiles are established over a sufficiently long time period. If our drilling results are less than anticipated or we are unable to execute our drilling program because of capital constraints, lease expirations, access to gathering systems, and/or declines in oil, natural gas and NGL prices, the return on our investment in these areas may not be as attractive as we anticipate. Further, as a result of any of these developments we could incur material write-downs of our oil and gas properties and the value of our undeveloped acreage could decline in the future.
Our business requires substantial capital expenditures, and we may be unable to obtain needed capital or financing on satisfactory terms or at all.
Our exploration, exploitation, development and acquisition activities require substantial capital expenditures. Our budgeted capital expenditures for 2013 are currently expected to be approximately $204.0 million. Historically, we have funded development and operating activities primarily through a combination of equity capital raised from a private equity partner, through borrowings under our bank credit facilities and through internal operating cash flows. We intend to finance our capital expenditures predominantly with cash flows from operations. If necessary, we may also access capital through proceeds from potential asset dispositions, borrowings under our credit facilities and the issuance of debt and equity securities. Our cash flow from operations and access to capital are subject to a number of variables, including:
- •
- the estimated quantities of our oil, natural gas and NGL reserves;
- •
- the amount of oil, natural gas and NGLs we produce from existing wells;
- •
- the prices at which we sell our production;
- •
- the costs of developing and producing our oil, natural gas and NGL reserves;
- •
- take-away capacity;
- •
- our ability to acquire, locate and produce new reserves;
- •
- the ability and willingness of banks to lend to us; and
- •
- our ability to access the equity and debt capital markets.
If our cash flow from operations is not sufficient to fund our capital expenditure budget, we may have limited ability to obtain the additional capital necessary to conduct our operations at expected levels. Our senior secured revolving credit facility and our second lien term loan facility may restrict our ability to obtain new debt financing. We may not be able to obtain debt or equity financing on terms favorable to us, or at all. The failure to obtain additional financing could result in a curtailment of our operations
23
relating to exploration and development of our prospects, which in turn could lead to a decline in our oil, natural gas and NGLs production or reserves, and in some areas a loss of properties.
External financing may be required in the future to fund our growth. We may not be able to obtain additional financing, and financing under our senior secured revolving credit facility and our second lien term loan facility may not be available in the future. Without additional capital resources, we may be unable to pursue and consummate acquisition opportunities as they become available, and we may be forced to limit or defer our planned oil, natural gas and NGLs development program, which will adversely affect the recoverability and ultimate value of our oil, natural gas and NGLs properties, in turn negatively affecting our business, financial condition and results of operations.
The development of our proved undeveloped reserves in our areas of operation may take longer and may require higher levels of capital expenditures than we currently anticipate. Therefore, our undeveloped reserves may not be ultimately developed or produced.
Approximately 54% of our total estimated proved reserves were classified as proved undeveloped as of December 31, 2012. Development of these reserves may take longer and require higher levels of capital expenditures than we currently anticipate. In addition, declines in commodity prices could cause us to reevaluate our development plans and delay or cancel development. Delays in the development of our reserves or increases in costs to drill and develop such reserves will reduce the future net revenues estimated for such reserves and may result in some projects becoming uneconomic. In addition, delays in the development of reserves could cause us to have to reclassify our proved reserves as unproved reserves.
A substantial or extended decline in oil, natural gas or NGL prices may adversely affect our business, financial condition or results of operations and our ability to meet our capital expenditure obligations and financial commitments.
The price we receive for our oil, natural gas and NGLs heavily influences our revenue, profitability, access to capital and future rate of growth. Oil and natural gas are commodities and, therefore, their prices are subject to wide fluctuations in response to relatively minor changes in supply and demand. The markets for oil, natural gas and NGLs historically have been volatile and will likely continue to be volatile in the future. The prices we receive for our production and the levels of our production depend on numerous factors beyond our control. These factors include the following:
- •
- regional and worldwide economic conditions impacting the supply and demand for oil, natural gas and NGLs;
- •
- the actions of the Organization of Petroleum Exporting Countries;
- •
- the price and quantity of imports of foreign oil, natural gas and NGLs;
- •
- political conditions regionally, domestically or in other oil and gas-producing regions;
- •
- the level of domestic and global oil and natural gas exploration and production;
- •
- the level of domestic and global oil and natural gas inventories;
- •
- localized supply and demand fundamentals and transportation availability;
- •
- weather conditions and natural disasters;
- •
- domestic, local and foreign governmental regulations and taxes;
- •
- speculation as to the future price of oil, natural gas and NGLs and the speculative trading of oil, natural gas and NGLs;
24
- •
- futures contracts;
- •
- price and availability of competitors' supplies of oil, natural gas and NGLs;
- •
- technological advances affecting energy consumption;
- •
- the price and availability of alternative fuels; and
- •
- the impact of energy conservation efforts.
NGLs are made up of ethane, propane, isobutane, butane and natural gasoline, all of which have different uses and different pricing characteristics. NGLs comprised 36% of our 2012 production at an average price of $29.07 per bbl, a 34% drop in average price from the prior year. Further, realized monthly NGL prices have recently approached five-year lows, principally due to significant supply, and it is unclear how long we will continue to experience these low prices. A further or extended decline in NGL prices could materially and adversely affect our future business, financial condition and results of operations. For further information about ethane rejection by certain of our producers, see "Management's discussion and analysis of financial condition and results of operations—Factors that significantly affect our results of operations."
Substantially all of our production is sold to purchasers under contracts with market-based prices. Lower oil, natural gas and NGL prices will reduce our cash flows and the present value of our reserves. If oil, natural gas and NGL prices deteriorate, we anticipate that the borrowing base under our senior secured revolving credit facility, which is revised periodically, may be reduced, which would negatively impact our borrowing ability. Additionally, prices could reduce our cash flows to a level that would require us to borrow to fund our 2013 capital budget. Lower oil, natural gas and NGL prices may also reduce the amount of oil, natural gas and NGLs that we can produce economically. Substantial decreases in oil, natural gas and NGL prices could render uneconomic a significant portion of our identified drilling locations. This may result in significant downward adjustments to our estimated proved reserves. As a result, a substantial or extended decline in oil, natural gas or NGL prices may materially and adversely affect our future business, financial condition, results of operations, liquidity or ability to finance planned capital expenditures.
Unless we replace our reserves, our reserves and production will naturally decline, which would adversely affect our business, financial condition and results of operations.
Unless we conduct successful development and acquisition activities or acquire properties containing proved reserves, our proved reserves will decline as those reserves are produced. Producing oil and natural gas reservoirs generally are characterized by declining production rates that vary depending upon reservoir characteristics and other factors. Our future oil, natural gas and NGL reserves and production, and therefore our cash flows and income, are highly dependent on our success in efficiently developing our current reserves and economically finding or acquiring additional recoverable reserves. We may not be able to develop, find or acquire additional reserves to replace our current and future production at acceptable costs. If we are unable to replace our current and future production, the value of our reserves will decrease, and our business, financial condition and results of operations will be adversely affected.
Our identified drilling locations are scheduled to be drilled over many years, making them susceptible to uncertainties that could materially alter the occurrence or timing of their drilling, which in certain instances could prevent or delay associated expected production. In addition, we may not be able to raise the amount of capital that would be necessary to drill a substantial portion of our identified drilling locations.
Our management team has identified and scheduled certain drilling locations as an estimation of our future multi-year drilling activities on our existing acreage. These drilling locations represent a significant part of our growth strategy. Our drilling locations are in various stages of evaluation, ranging from a location that
25
is ready to drill to a location that will require substantial additional interpretation. There is no way to predict in advance of drilling and testing whether any particular location will yield oil, natural gas or NGLs in sufficient quantities to recover drilling or completion costs or to be economically viable. Similarly, the use of technologies and the study of producing fields in the same area of producing wells will not enable us to know conclusively prior to drilling whether oil or natural gas will be present or, if present, whether oil or natural gas will be present in sufficient quantities to be economically viable. Even if sufficient quantities of oil or natural gas exist, we may damage the potentially productive hydrocarbon bearing formation or experience mechanical difficulties while drilling or completing the well, resulting in a reduction in production from or abandonment of the well. If we drill additional wells that we identify as dry holes in our current and future drilling locations, our drilling success rate may decline and materially harm our business. In addition, our ability to drill and develop these drilling locations depends on a number of uncertainties, including oil, natural gas and NGL prices, the availability and cost of capital, drilling and production costs, the availability of drilling services and equipment, drilling results, lease expirations, gathering systems, marketing and pipeline transportation constraints, regulatory approvals and other factors. In addition, a number of our identified drilling locations are associated with joint development agreements and if we do not meet our obligation to drill the minimum number of wells specified in an agreement, we will lose the right to continue to develop certain acreage covered by that agreement. Because of the uncertainty inherent in these factors, we do not know if the numerous drilling locations we have identified will ever be drilled or if we will be able to produce oil, natural gas or NGLs from these or any other drilling locations. In addition, unless production is established within the spacing units covering the undeveloped acres on which some of the potential locations are obtained, the leases for such acreage will expire. As such, our actual drilling activities may materially differ from those presently identified, and if our 2013 drilling results fall below our expectations, we may not generate sufficient cash flow from operations to fund our capital expenditure budget.
If commodity prices decrease, we may be required to take write-downs of the carrying values of our properties.
Accounting rules require that we periodically review the carrying value of our properties for possible impairment. Based on prevailing commodity prices and specific market factors and circumstances at the time of prospective impairment reviews, and the continuing evaluation of development plans, production data, economics and other factors, we may be required to write down the carrying value of our properties. A write-down constitutes a non-cash charge to earnings. We may incur impairment charges in the future, which could have a material adverse effect on our results of operations for the periods in which such charges are taken.
Our estimated oil, natural gas and NGLs reserve quantities and future production rates are based on many assumptions that may prove to be inaccurate. Any significant inaccuracies in these reserve estimates or the underlying assumptions will materially affect the quantities and present value of our reserves.
Numerous uncertainties are inherent in estimating quantities of oil, natural gas and NGL reserves. Our estimates of our proved reserve quantities are based upon our reserve report as of December 31, 2012. Reserve estimation is a subjective process of evaluating underground accumulations of oil, natural gas and NGLs that cannot be measured in an exact manner. Reserves that are "proved reserves" are those estimated quantities of oil, natural gas and NGLs that geological and engineering data demonstrate with reasonable certainty are recoverable in future years from known reservoirs under existing economic and operating conditions and that relate to projects for which the extraction of hydrocarbons must have commenced or the operator must be reasonably certain will commence within a reasonable time.
26
The process of estimating oil, natural gas and NGL reserves is complex, requiring significant decisions and assumptions in the evaluation of available geological, engineering and economic data for each reservoir, and these reports rely upon various assumptions, including assumptions regarding future oil, natural gas and NGL prices, production levels, and operating and development costs. As a result, estimated quantities of proved reserves and projections of future production rates and the timing of development expenditures may prove to be inaccurate. Quantities of proved reserves are estimated based on pricing conditions in existence during the period of assessment and costs at the end of the period of assessment. Changes to oil, natural gas and NGL prices in the markets for such commodities may have the impact of shortening the economic lives of certain fields, because it becomes uneconomic to produce all recoverable reserves on such fields, which reduces proved property reserve estimates.
Over time, we may make material changes to reserve estimates taking into account the results of actual drilling and production. Any significant variance in our assumptions and actual results could greatly affect our estimates of reserves, the economically recoverable quantities of oil, natural gas and NGLs attributable to any particular group of properties, the classifications of reserves based on risk of recovery, and estimates of the future net cash flows. In addition, changes in future production cost assumptions could have a significant effect on our proved reserve quantities.
If we do not fulfill our obligation to drill minimum numbers of wells specified in our joint development agreements, we will lose the right to develop the undeveloped acreage associated with the agreement and any proved undeveloped reserves attributable to such undeveloped acreage.
If we do not meet our obligation to drill the minimum number of wells specified in a joint development agreement, we will lose the right to continue to develop the undeveloped acreage covered by the agreement, which would result in the loss of any proved undeveloped reserves attributable to such undeveloped acreage. For example, pursuant to the terms of our existing joint development agreement with Southridge, we are obligated to drill 20 additional wells prior to October 31, 2013 in order to continue to earn an interest in future wells and acreage. We have not completed any wells under this agreement in 2013 and currently do not have any rigs running on this acreage. If we are unable to obtain an extension beyond October 31, 2013 or negotiate an alternative arrangement with Southridge, we would not expect to meet our obligation to drill the minimum number of wells within the deadline currently specified in the Southridge Agreement. We have been in discussions with Southridge for this purpose and proposed an extension and modified arrangement by which we would develop the subject properties within 12 to 18 months. We may be unable to reach a mutually acceptable extension or amendment before October 31, 2013, or at all. If we do not obtain an extension or amendment and the 20 well commitment is not timely satisfied, we would, as of October 31, 2013, lose the right to continue to develop approximately 11,517 gross (3,310 net) acres in the Woodford shale formation, including approximately 15.5 MMBoe of proved undeveloped reserves attributable to such acreage (representing approximately 18% of our proved reserves and approximately 7% of our standardized measure as of December 31, 2012) that were included in our estimated proved reserves as of December 31, 2012. We estimate that we would incur an impairment charge of approximately $15 million in connection with such a reduction in our proved reserves.
The standardized measure of discounted future net cash flows from our proved reserves will not necessarily be the same as the current market value of our estimated oil, natural gas and NGL reserves.
You should not assume that the standardized measure of discounted future net cash flows from our proved reserves is the current market value of our estimated oil, natural gas and NGL reserves. In accordance with SEC requirements in effect at December 31, 2010, 2011 and 2012, we based the discounted future net cash flows from our proved reserves on the 12-month unweighted arithmetic average of the first-day-of-the-month commodities prices for the preceding 12 months without giving effect to derivative
27
transactions. Actual future net cash flows from our oil and natural gas properties will be affected by factors such as:
- •
- actual prices we receive for oil, natural gas and NGLs;
- •
- actual cost of development and production expenditures;
- •
- the amount and timing of actual production; and
- •
- changes in governmental regulations or taxation.
The timing of both our production and our incurrence of expenses in connection with the development and production of oil and natural gas properties will affect the timing and amount of actual future net revenues from proved reserves, and thus their actual present value. In addition, the 10% discount factor we use when calculating standardized measure may not be the most appropriate discount factor based on interest rates in effect from time to time and risks associated with our company or the oil and natural gas industry in general. As a limited liability company, we have not historically been subject to entity level taxation. Accordingly, our standardized measure for historical periods does not provide for federal or state corporate income taxes, except for the Texas margin tax, because taxable income has been passed through to our equity holders. However, upon consummation of this offering, we will be a corporation subject to entity-level taxation. As a result, we will be treated as a taxable entity for federal income tax purposes, and our future income taxes will be dependent upon our future taxable income. Actual future prices and costs may differ materially from those used in the present value estimates included in this prospectus, which could have a material effect on the value of our reserves.
If oil prices decline by $10.00 per Bbl, then our standardized measure as of December 31, 2012 would decrease approximately $119 million. If natural gas prices decline by $1.00 per Mcf, then our standardized measure as of December 31, 2012 would decrease by approximately $100 million.
Over 97% of our producing properties are located in the Anadarko and Arkoma basins in the Texas Panhandle and Oklahoma, making us vulnerable to risks associated with operating in one geographic area.
Over 97% of our estimated proved reserves as of December 31, 2012 were located in the Anadarko and Arkoma basins in the Texas Panhandle and Oklahoma, approximately 48% of which are being produced from the Cleveland formation from properties located in four contiguous counties of Texas and Oklahoma. As a result of this concentration, we may be disproportionately exposed to the impact of regional supply and demand factors, delays or interruptions of production from wells in this area caused by governmental regulation, processing or transportation capacity constraints, availability of equipment, facilities, personnel or services market limitations or interruption of the processing or transportation of oil, natural gas or NGLs. In addition, the effect of fluctuations on supply and demand may become more pronounced within specific geographic oil and natural gas producing areas such as our properties producing from the Cleveland formation, which may cause these conditions to occur with greater frequency or magnify the effects of these conditions. Due to the concentrated nature of our portfolio of properties, a number of our properties could experience any of the same conditions at the same time, resulting in a relatively greater impact on our results of operations than they might have on other companies that have a more diversified portfolio of properties. Such delays or interruptions could have a material adverse effect on our financial condition and results of operations.
28
Our customer base is concentrated, and the loss of any one of our key customers could, therefore, adversely affect our financial condition and results of operations.
Historically, we have been dependent on a few customers for a significant portion of our revenue. For the year ended December 31, 2012 purchases by four of our customers accounted for approximately 24%, 18%, 18% and 15%, respectively, of our total oil, natural gas and NGL sales. This concentration of customers may increase our overall exposure to credit risk, and customers will likely be similarly affected by changes in economic and industry conditions. To the extent that any of our major purchasers reduces their purchases of oil, natural gas or NGLs or defaults on their obligations to us, our financial condition and results of operations could be adversely affected.
We may be unable to make attractive acquisitions or successfully integrate acquired businesses, and any inability to do so may disrupt our business and hinder our ability to grow.
In the future we may make acquisitions of businesses that complement or expand our current business. We may not be able to identify attractive acquisition opportunities. Even if we do identify attractive acquisition opportunities, we may not be able to complete the acquisition or do so on commercially acceptable terms.
In addition, our senior secured revolving credit facility and our second lien term loan facility impose certain limitations on our ability to enter into mergers or combination transactions. Our senior secured revolving credit facility and our second lien term loan facility also limit our ability to incur certain indebtedness, which could indirectly limit our ability to engage in acquisitions of businesses.
Any acquisition involves potential risks, including, among other things:
- •
- the validity of our assumptions about estimated proved reserves, future production, commodity prices, revenues, capital
expenditures, operating expenses and costs;
- •
- an inability to successfully integrate the assets we acquire;
- •
- an inability to obtain satisfactory title to the assets we acquire;
- •
- a decrease in our liquidity by using a significant portion of our available cash or borrowing capacity to finance
acquisitions;
- •
- a significant increase in our interest expense or financial leverage if we incur additional debt to finance acquisitions;
- •
- the assumption of unknown liabilities, losses or costs for which we obtain no or limited indemnity or other recourse;
- •
- the diversion of management's attention from other business concerns;
- •
- an inability to hire, train or retain qualified personnel to manage and operate our growing assets;
and
- •
- the occurrence of other significant changes, such as impairment of oil and natural gas properties, goodwill or other intangible assets, asset devaluation or restructuring charges.
Our decision to acquire a property will depend in part on the evaluation of data obtained from production reports and engineering studies, geophysical and geological analyses and seismic data and other information, the results of which are often inconclusive and subject to various interpretations.
The success of any completed acquisition, including the Chalker acquisition, will depend on our ability to integrate effectively the acquired assets into our existing operations. The process of integrating acquired
29
assets may involve unforeseen difficulties and may require a disproportionate amount of our managerial and financial resources. In addition, even if we successfully integrate an acquisition, it may not be possible to realize the full benefits we may expect in estimated proved reserves, production volume, cost savings from operating synergies or other benefits anticipated from an acquisition or realize these benefits within the expected time frame. Anticipated benefits of an acquisition may be offset by operating losses relating to changes in commodity prices in oil and natural gas industry conditions, risks and uncertainties relating to the exploratory prospects of the combined assets or operations, or an increase in operating or other costs or other difficulties. If we fail to realize the benefits we anticipate from an acquisition, our results of operations may be adversely affected.
Deficiencies of title to our leased interests could significantly affect our financial condition.
It is our practice, in acquiring oil and natural gas leases or undivided interests in oil and natural gas leases or other developed rights, not to incur the expense of retaining lawyers to examine the title to the mineral interest to be acquired. Rather, we rely upon the judgment of oil and natural gas lease brokers or landmen who perform the fieldwork in examining records in the appropriate governmental or county clerk's office to determine mineral ownership before we acquire an oil and gas lease or other developed rights in a specific mineral interest.
Prior to the drilling of an oil or gas well, it is the normal practice in our industry for the operator of the well to obtain a drilling title opinion from a qualified title attorney to ensure there are no obvious title defects on the property on which the well is to be located. The title attorney would typically research documents that are of record, including liens, taxes and all applicable contracts that burden the property. Frequently, as a result of such examinations, certain curative work must be undertaken to correct defects in the marketability of the title, and such curative work entails expense. Our failure to completely cure any title defects may invalidate our title to the subject property and adversely impact our ability in the future to increase production and reserves. Additionally, because a less strenuous title review is conducted on lands where a well has not yet been scheduled, undeveloped acreage has greater risk of title defects than developed acreage. Any title defects or defects in assignment of leasehold rights in properties in which we hold an interest may adversely impact our ability in the future to increase production and reserves, which could have a material adverse effect on our business, financial condition and results of operations.
We conduct a substantial portion of our operations through joint development agreements with third parties. Certain of our joint development agreements include drill-to-earn arrangements, whereby we are assigned title to properties from the third party after we complete wells and, in the case of certain counterparties, after completion reports relating to the wells have been approved by regulatory authorities whose approval may be delayed. Furthermore, certain of our joint development agreements specify that assignments are only to occur when the wells are capable of producing hydrocarbons in paying quantities. These additional conditions to assignment of title may from time to time apply to wells of substantial value. If one of our counterparties assigned title to a well in which we had earned an interest (according to our joint development agreement) to a third party, our title to such a well could be adversely impacted. In addition, if one of our counterparties becomes a debtor in a bankruptcy proceeding, or is placed into receivership, or enters into an assignment for the benefit of creditors, after we had earned ownership of, but before we had received title to, a well, certain creditors of the counterparty may have rights in that well that would rank prior to ours.
30
Our hedging strategy may be ineffective in reducing the impact of commodity price volatility from our cash flows, which could result in financial losses or could reduce our income.
To achieve more predictable cash flow and to reduce our exposure to adverse fluctuations in the prices of oil, natural gas and NGLs, we have entered into commodity derivative contracts for a significant portion of our oil, natural gas and NGLs production that could result in both realized and unrealized hedging losses. The extent of our commodity price exposure is related largely to the effectiveness and scope of our commodity derivative contracts. For example, some of the commodity derivative contracts we utilize are based on quoted market prices, which may differ significantly from the actual prices we realize in our operations for oil, natural gas and NGLs. In addition, our senior secured revolving credit facility and our second lien term loan facility limit the aggregate notional volume of commodities that can be covered under commodity derivative contracts we can enter into and, as a result, we will continue to have direct commodity price exposure on the unhedged portion of our production volumes. For the years ending December 31, 2013, 2014, 2015, 2016 and 2017, approximately 17%, 39%, 60%, 76% and 75%, respectively, of our estimated total oil, natural gas and NGL production, based on our reserve report as of December 31, 2012, will not be covered by commodity derivative contracts. Please read "Management's discussion and analysis of financial condition and results of operations—Quantitative and qualitative disclosure about market risk."
Our policy has been to hedge a significant portion of our estimated oil, natural gas and NGLs production. However, our price hedging strategy and future hedging transactions will be determined at our discretion. We are not under an obligation to hedge a specific portion of our production. The prices at which we hedge our production in the future will be dependent upon commodity prices at the time we enter into these transactions, which may be substantially higher or lower than current oil, natural gas and NGLs prices. Accordingly, our price hedging strategy may not protect us from significant declines in oil, natural gas and NGL prices received for our future production. Conversely, our hedging strategy may limit our ability to realize cash flows from commodity price increases. It is also possible that a larger percentage of our future production will not be hedged as compared with past years, which would result in our oil and natural gas revenues becoming more sensitive to commodity price changes.
In addition, our actual future production may be significantly higher or lower than we estimate at the time we enter into commodity derivative contracts for such period. If the actual amount is higher than we estimate, we will have greater commodity price exposure than we intended. If the actual amount is lower than the notional amount of our commodity derivative contracts, we might be forced to satisfy all or a portion of our commodity derivative contracts without the benefit of the cash flow from our sale or purchase of the underlying physical commodity, substantially diminishing our liquidity. There may be a change in the expected differential between the underlying commodity price in the commodity derivative contract and the actual price received, which may result in payments to our derivative counterparty that are not offset by our receipt of payments for our production in the field.
As a result of these factors, our commodity derivative activities may not be as effective as we intend in reducing the volatility of our cash flows, and in certain circumstances may actually increase the volatility of our cash flows.
Our hedging transactions expose us to counterparty credit risk.
Our hedging transactions expose us to risk of financial loss if a counterparty fails to perform under a derivative contract. Disruptions in the financial markets could lead to sudden changes in a counterparty's liquidity, which could impair their ability to perform under the terms of the derivative contract. We are unable to predict sudden changes in a counterparty's creditworthiness or ability to perform. Even if we do
31
accurately predict sudden changes, our ability to negate the risk may be limited depending upon market conditions. Currently our entire hedge portfolio is hedged directly with banks in our credit agreements, thus allowing hedging without any margin requirements.
During periods of falling commodity prices, our hedge receivable positions generally increase, which increases our counterparty credit exposure. If the creditworthiness of our counterparties deteriorates and results in their nonperformance, we could incur a significant loss.
The adoption of the Dodd-Frank Wall Street Reform and Consumer Protection Act, or the Dodd-Frank Act, could have an adverse effect on our ability to use derivatives to reduce the effect of commodity price risk, interest rate and other risks associated with our business.
We use commodity derivatives to manage our commodity price risk. The U.S. Congress adopted comprehensive financial reform legislation that, among other things, establishes comprehensive federal oversight and regulation of over-the-counter derivatives and many of the entities that participate in that market. Although the Dodd-Frank Act was enacted on July 21, 2010, the Commodity Futures Trading Commission, or the CFTC, and the SEC, along with certain other regulators, must promulgate final rules and regulations to implement many of its provisions relating to over-the-counter derivatives. While some of these rules have been finalized, some have not and, as a result, the final form and timing of the implementation of the new regulatory regime affecting commodity derivatives remains uncertain.
In particular, on October 18, 2011, the CFTC adopted final rules under the Dodd-Frank Act establishing position limits for certain energy commodity futures and options contracts and economically equivalent swaps, futures and options. The position limit levels set the maximum amount of covered contracts that a trader may own or control separately or in combination, net long or short. The final rules also contained limited exemptions from position limits which would be phased in over time for certain bona fide hedging transactions and positions. The position limits rules were vacated by a Federal court on September 28, 2012, and the CFTC has appealed that decision.
If these or similar position limits go into effect in the future, the timing of implementation of the final rules, their applicability to, and impact on, us and the ultimate success of any legal challenge to their validity remain uncertain, and they could have a material adverse impact on us by affecting the prices of or market for commodities relevant to our operations and/or by reducing the availability to us of commodity derivatives.
The Dodd-Frank Act also imposes a number of other new requirements on certain over-the-counter derivatives and subjects certain swap dealers and major swap participants to significant new regulatory requirements, which in certain cases may cause them to conduct their activities through new entities that may not be as creditworthy as our current counterparties, all of which may have a material adverse effect on us. The impact of this regulatory regime on the availability, pricing and terms and conditions of commodity derivatives remains uncertain, but the final requirements could have a materially adverse effect on our ability to hedge our exposure to commodity prices.
If we reduce our use of derivatives as a result of the Dodd-Frank Act, the regulations promulgated under it and the changes to the nature of the derivatives markets, our results of operations may become more volatile and our cash flows may be less predictable, which could adversely affect our ability to plan for and fund capital expenditures. In addition, the Dodd-Frank Act was intended, in part, to reduce the volatility of commodity prices, which some legislators attributed to speculative trading in derivatives and commodity contracts related to oil, natural gas and NGLs. Our revenue could, therefore, be adversely affected if commodity prices were to decrease.
32
Certain federal income tax deductions currently available with respect to oil and natural gas exploration and development may be eliminated as a result of future legislation.
The Obama administration's budget proposals for fiscal year 2014 contain numerous proposed tax changes, and from time to time, legislation has been introduced that would enact many of these proposed changes. The proposed budget and legislation would repeal many tax incentives and deductions that are currently used by U.S. oil and gas companies and impose new fees. Among others, the provisions include: elimination of the ability to fully deduct intangible drilling costs in the year incurred; repeal of the percentage depletion deduction for oil and gas properties; repeal of the domestic manufacturing tax deduction for oil and gas companies; increase in the geological and geophysical amortization period for independent producers; and implementation of a fee on non-producing federal oil and gas leases. The passage of legislation containing some or all of these provisions or any other similar change in U.S. federal income tax law could eliminate or postpone certain tax deductions that are currently available to us with respect to oil and natural gas exploration and development, and any such change could have a material adverse effect on our business, financial condition and results of operations.
We may be unable to compete effectively with larger companies, which may adversely affect our ability to generate sufficient revenues.
The oil and natural gas industry is intensely competitive, and we compete with other companies that have greater resources than us. Many of our larger competitors not only drill for and produce oil and natural gas, but also engage in refining operations and market petroleum and other products on a regional, national or worldwide basis. These companies may have a greater ability to continue drilling activities during periods of low oil, natural gas and NGL prices, to contract for drilling equipment, to secure trained personnel, and to absorb the burden of present and future federal, state, local and other laws and regulations. The oil and natural gas industry has periodically experienced shortages of drilling rigs, equipment, pipe and personnel, which has delayed development drilling and other exploitation activities and has caused significant price increases. Competition has been strong in hiring experienced personnel, particularly in the engineering and technical, accounting and financial reporting, tax and land departments. In addition, competition is strong for attractive oil and natural gas producing properties, oil and natural gas companies, and undeveloped leases and drilling rights. Any inability to compete effectively with larger companies could have a material adverse impact on our financial condition and results of operations.
The oil and natural gas industry is characterized by rapid and significant technological advancements and introductions of new products and services using new technologies. As others use or develop new technologies, we may be placed at a competitive disadvantage or competitive pressures may force us to implement those new technologies at substantial costs. In addition, other oil and natural gas companies may have greater financial, technical, and personnel resources that allow them to enjoy technological advantages and may in the future allow them to implement new technologies before we can. We may not be able to respond to these competitive pressures and implement new technologies on a timely basis or at an acceptable cost. If one or more of the technologies we use now or in the future were to become obsolete or if we are unable to use the most advanced commercially available technology, our business, financial condition and results of operations could be materially adversely affected.
We participate in oil and gas leases with third parties who may not be able to fulfill their commitments to our projects.
We frequently own less than 100% of the working interest in the oil and gas leases on which we conduct operations, and other parties will own the remaining portion of the working interest. Financial risks are inherent in any operation where the cost of drilling, equipping, completing and operating wells is shared by
33
more than one person. We could be held liable for joint activity obligations of other working interest owners, such as nonpayment of costs and liabilities arising from the actions of other working interest owners. In addition, declines in oil, natural gas and NGL prices may increase the likelihood that some of these working interest owners, particularly those that are smaller and less established, are not able to fulfill their joint activity obligations. A partner may be unable or unwilling to pay its share of project costs, and, in some cases, a partner may declare bankruptcy. In the event any of our project partners do not pay their share of such costs, we would likely have to pay those costs, and we may be unsuccessful in any efforts to recover these costs from our partners, which could materially adversely affect our financial position.
The unavailability or high cost of drilling rigs, equipment, supplies, personnel and oil field services as well as fees for the cancellation of such services could adversely affect our ability to execute development and exploitation plans on a timely basis and within budget, and consequently could adversely affect our anticipated cash flow.
We utilize third-party services to maximize the efficiency of our operation. The cost of oil field services typically fluctuates based on demand for those services. We may not be able to contract for such services on a timely basis, or the cost of such services may not remain at a satisfactory or affordable level. Shortages or the high cost of drilling rigs, equipment, supplies or personnel, including hydraulic fracturing equipment, supplies and personnel necessary for horizontal drilling, could delay or adversely affect our development and exploitation operations, which could have a material adverse effect on our financial condition and results of operations.
Our business depends in part on pipelines, transportation and gathering systems and processing facilities owned by others. Any limitation in the availability of those facilities could interfere with our ability to market our oil, natural gas and NGLs production and could harm our business.
The marketability of our oil, natural gas and NGLs production depends in part on the availability, proximity and capacity of pipelines and other transportation methods, such as trucks, gathering systems and processing facilities owned by third parties. The amount of oil, natural gas and NGLs that can be produced and sold is subject to curtailment in certain circumstances, such as pipeline interruptions due to scheduled and unscheduled maintenance, excessive pressure, physical damage or lack of contracted capacity on such systems. Also, the transfer of our oil, natural gas and NGLs on third-party pipelines may be curtailed or delayed if it does not meet the quality specifications of the pipeline owners. Our access to transportation options, including trucks owned by third parties, can also be affected by U.S. federal and state regulation of oil and gas production and transportation, general economic conditions and changes in supply and demand. The curtailments arising from these and similar circumstances may last from a few days to several months. In many cases, we are provided only with limited, if any, notice as to when these circumstances will arise and their duration. Any significant curtailment in gathering system or transportation or processing facility capacity could reduce our ability to market our oil, natural gas and NGLs production and harm our business.
34
We may incur substantial losses and be subject to substantial liability claims as a result of our oil and natural gas operations. Additionally, we may not be insured for, or our insurance may be inadequate to protect us against, these risks.
We are not insured against all risks. Losses and liabilities arising from uninsured and underinsured events could materially and adversely affect our business, financial condition or results of operations. We may elect not to obtain insurance if we believe that the cost of available insurance is excessive relative to the risks presented. In addition, pollution and environmental risks generally are not fully insurable. Our oil and natural gas exploration and production activities are subject to all of the operating risks associated with drilling for and producing oil and natural gas, including the possibility of:
- •
- environmental hazards, such as uncontrollable flows of oil, natural gas, brine, well fluids, toxic gas or other pollution
into the environment, including groundwater contamination;
- •
- adverse weather conditions and natural disasters;
- •
- abnormally pressured formations;
- •
- facility or equipment malfunctions;
- •
- mechanical difficulties, such as stuck oilfield drilling and service tools and casing collapse;
- •
- fires, explosions and ruptures of pipelines;
- •
- personal injuries and death; and
- •
- terrorist attacks targeting oil and natural gas related facilities and infrastructure.
Any of these risks could adversely affect our ability to conduct operations or result in substantial losses to us as a result of:
- •
- injury or loss of life;
- •
- damage to and destruction of property, natural resources and equipment;
- •
- pollution and other environmental damage and associated clean-up responsibilities;
- •
- regulatory investigations, penalties or other sanctions;
- •
- suspension of our operations; and
- •
- repair and remediation costs.
We are subject to complex federal, state, local and other laws and regulations that could adversely affect the cost, manner or feasibility of conducting our operations.
Our oil and natural gas exploration and production operations are subject to complex and stringent laws and regulations. In order to conduct our operations in compliance with these laws and regulations, we must obtain and maintain numerous permits, approvals and certificates from various federal, state and local governmental authorities. Failure or delay in obtaining regulatory approvals or drilling permits could have a material adverse effect on our ability to develop our properties, and receipt of drilling permits with onerous conditions could increase our compliance costs. In addition, regulations regarding conservation practices and the protection of correlative rights affect our operations by limiting the quantity of oil, natural gas and NGLs we may produce and sell.
We are subject to federal, state and local laws and regulations as interpreted and enforced by governmental authorities possessing jurisdiction over various aspects of the exploration, production and transportation of oil, natural gas and NGLs, as well as safety matters. Legal requirements are frequently
35
changed and subject to interpretation, and we are unable to predict the ultimate cost of compliance with these requirements or their effect on our operations. We may be required to make significant expenditures to comply with governmental laws and regulations. The discharge of oil, natural gas, NGLs or other pollutants into the air, soil or water may give rise to significant liabilities on our part to the government, and third parties and may require us to incur substantial costs of remediation.
See "Business—Regulation of the oil and natural gas industry" for a further description of the laws and regulations that affect us.
Our ability to pursue our business strategies may be adversely affected if we incur costs and liabilities due to a failure to comply with environmental regulations or a release of hazardous substances into the environment.
We may incur significant costs and liabilities as a result of environmental requirements applicable to the operation of our wells, gathering systems and other facilities. These costs and liabilities could arise under a wide range of federal, state and local environmental laws and regulations, including, for example:
- •
- the Clean Air Act, or CAA, and comparable state laws and regulations that impose obligations related to air emissions;
- •
- the Clean Water Act and Oil Pollution Act, or OPA, and comparable state laws and regulations that impose obligations
related to discharges of pollutants into regulated bodies of water;
- •
- the Resource Conservation and Recovery Act, or RCRA, and comparable state laws that impose requirements for the handling
and disposal of waste from our facilities;
- •
- the Comprehensive Environmental Response, Compensation, and Liability Act, or CERCLA, and comparable state laws that
regulate the cleanup of hazardous substances that may have been released at properties currently or previously owned or operated by us or at locations to which we have sent waste for disposal;
- •
- the Environmental Protection Agency, or EPA, community right to know regulations under the Title III of CERCLA and similar
state statutes require that we organize and/or disclose information about hazardous materials used or produced in our operations;
- •
- the Occupational Safety and Health Act, or OSHA, which establishes workplace standards for the protection of the health
and safety of employees, including the implementation of hazard communications programs designed to inform employees about hazardous substances in the workplace, potential harmful effects of these
substances, and appropriate control measures;
- •
- the National Environmental Policy Act, or NEPA, which requires federal agencies to evaluate major agency actions having
the potential to significantly impact the environment and which may require the preparation of Environmental Assessments and more detailed Environmental Impact Statements that may be made available
for public review and comment;
- •
- the Migratory Bird Treaty Act, which implements various treaties and conventions between the United States and certain
other nations for the protection of migratory birds and, pursuant to which the taking, killing, or possessing of migratory birds is unlawful without a permit, thereby potentially requiring the
implementation of operating restrictions or a temporary, seasonal, or permanent ban in affected areas; and
- •
- the Endangered Species Act, or ESA, and analogous state laws, which seek to ensure that activities do not jeopardize endangered or threatened animals, fish and plant species, nor destroy or modify the critical habitat of such species.
36
We may incur significant delays, costs and liabilities as a result of federal, state and local environmental, health and safety requirements applicable to exploration, development and production activities. These laws and regulations may require us to obtain a variety of permits or other authorizations governing our air emissions, water discharges, waste disposal or other environmental impacts associated with drilling, production and transporting product pipelines or other operations; regulate the sourcing and disposal of water used in the drilling, fracturing and completion processes; limit or prohibit drilling activities in certain areas and on certain lands lying within wilderness, wetlands, frontier and other protected areas; require remedial action to prevent or mitigate pollution from former operations such as plugging abandoned wells or closing earthen pits; and/or impose substantial liabilities for spills, pollution or failure to comply with regulatory filings. In addition, these laws and regulations are complex, change frequently and have tended to become increasingly stringent over time. Failure to comply with these laws and regulations may trigger a variety of administrative, civil and criminal enforcement measures, including the assessment of monetary penalties, the imposition of remedial requirements, and the issuance of orders enjoining future operations. Certain environmental statutes, including the RCRA, CERCLA, the federal OPA and analogous state laws and regulations, impose strict joint and several liability for costs required to clean up and restore sites where petroleum or hazardous substances or other waste products have been disposed of or otherwise released. More stringent laws and regulations, including any related to climate change and greenhouse gases, may be adopted in the future. The trend of more expensive and stringent environmental legislation and regulations applied to the oil and natural gas industry could continue, resulting in increased costs of doing business and consequently affecting profitability. Moreover, it is not uncommon for neighboring landowners and other third parties to file claims for personal injury and property damage allegedly caused by the release of hazardous substances or other waste products into the environment. We also are subject to many other environmental requirements delineated in "Business—Environmental matters and regulation."
Federal and state legislative and regulatory initiatives relating to hydraulic fracturing and other oil and gas production activities as well as governmental reviews of such activities could result in increased costs, additional operating restrictions or delays, which could adversely affect our production.
Hydraulic fracturing is an important and common practice that is used to stimulate production of natural gas and/or oil from dense subsurface rock formations. The process involves the injection of water, sand and chemicals under pressure into the formation to fracture the surrounding rock and stimulate production. We routinely utilize hydraulic fracturing techniques in many of our oil and natural gas drilling and completion programs. The process is typically regulated by state oil and natural gas commissions. However, the EPA recently asserted federal regulatory authority over certain hydraulic fracturing activities involving diesel under the federal Safe Drinking Water Act, or SDWA, and released draft guidance in May 2012 on regulatory requirements for companies that plan to conduct hydraulic fracturing using diesel. In addition, on November 23, 2011, the EPA announced that it was granting in part a petition to initial rulemaking under the Toxic Substances Control Act, relating to chemical substances and mixtures used in oil and gas exploration and production. Congress has also considered legislation to provide for federal regulation of hydraulic fracturing and to require disclosure of the chemicals used in the fracturing process.
Some states have adopted, and other states are considering adopting, regulations that could impose more stringent permitting, disclosure and well construction requirements on hydraulic fracturing operations under certain circumstances. For example, Texas adopted a law in June 2011 requiring disclosure to the Railroad Commission of Texas, or TRRC, and the public of certain information regarding the components used in the hydraulic fracturing process. On December 13, 2011, the TRRC finalized regulations requiring public disclosure of chemicals in fluids used in the hydraulic fracturing process for drilling permits issued after February 1, 2012. In addition, on October 20, 2011, Louisiana adopted new regulations for hydraulic fracturing operations in the state. These new regulations require hydraulic fracturing operators to publicly
37
disclose the volume of hydraulic fracturing fluid, the type, trade name, supplier and volume of additives, and a list of chemical compounds contained in the additive, along with its maximum concentration, subject to certain trade secret protections. However, even trade secret chemicals will have to be identified by their chemical family. A mandatory disclosure of information regarding the constituents of hydraulic fracturing fluids could make it easier for third parties opposing the hydraulic fracturing process to initiate legal proceedings based upon allegations that specific chemicals used in the fracturing process could adversely affect the environment. In addition, the Oklahoma Corporation Commission has adopted rules prohibiting water pollution resulting from hydraulic fracturing operations and requiring disclosure of chemicals used in hydraulic fracturing.
Texas has also authorized the Texas Commission on Environmental Quality to suspend water use rights for oil and gas users in the event of serious drought conditions and has imposed more stringent emissions, monitoring, inspection, maintenance, and repair requirements on Barnett Shale operators to minimize Volatile Organic Compound, or VOC, releases. Also, Louisiana requires operators to minimize releases of gases into the open air after hydraulic fracturing in certain urban areas.
In addition to state laws, local land use restrictions, such as city ordinances, may restrict or prohibit the performance of well drilling in general and/or hydraulic fracturing in particular. In the event state, local, or municipal legal restrictions are adopted in areas where we are currently conducting operations, or in the future plan to conduct operations, we may incur additional costs to comply with such requirements that may be significant in nature, experience delays or curtailment in the pursuit of exploration, development, or production activities, and perhaps even be precluded from drilling wells.
There are also certain governmental reviews either underway or being proposed that focus on environmental aspects of hydraulic fracturing practices. The White House Council on Environmental Quality is coordinating an administration-wide review of hydraulic fracturing practices, and a committee of the United States House of Representatives has conducted an investigation of hydraulic fracturing practices. Furthermore, a number of federal agencies are analyzing, or have been requested to review, a variety of environmental issues associated with hydraulic fracturing. The EPA is conducting a study of the potential environmental effects of hydraulic fracturing on drinking water and groundwater. The EPA released its first progress report on this study in December 2012 and expects to release a final draft report for public comment and peer review in 2014. Moreover, the EPA announced on October 20, 2011 that it is launching a study of wastewater resulting from hydraulic fracturing activities and currently plans to propose pretreatment standards by 2014. In addition, the U.S. Department of Energy's Natural Gas Subcommittee of the Secretary of Energy Advisory Board conducted a review of hydraulic fracturing issues and practices and made recommendations to better protect the environment from drilling using hydraulic fracturing completion methods. These ongoing or proposed studies, depending on their degree of pursuit and any meaningful results obtained, could spur initiatives to further regulate hydraulic fracturing under the Safe Drinking Water Act, the Toxic Substances Control Act, or other statutory and/or regulatory mechanisms. President Obama created the Interagency Working Group on Unconventional Natural Gas and Oil by Executive Order on April 13, 2012, which is charged with coordinating and aligning federal agency research and scientific studies on unconventional oil and natural gas resources.
Also, the U.S. Department of the Interior's Bureau of Land Management, or BLM, is considering proposing rules regarding well stimulation, chemical disclosures and other requirements for hydraulic fracturing on federal and Indian lands. BLM released a proposed rule requiring the disclosure of chemicals used during hydraulic fracturing and addressing drilling plans, water management and wastewater disposal, on federal and Indian lands in May 2012. However, BLM pulled back its proposal in January 2013 after reviewing comments and published an updated proposed rule on May 24, 2013 with comments due August 23, 2013.
38
Further, on April 17, 2012, the EPA released final rules that will subject all oil and gas operations (production, processing, transmission, storage and distribution) to regulation under the New Source Performance Standards, or NSPS, and National Emission Standards for Hazardous Air Pollutants, or NESHAPS, programs. These rules became effective on October 15, 2012. The EPA rules also include NSPS standards for completions of hydraulically-fractured gas wells. These standards include the reduced emission completion techniques developed in the EPA's Natural Gas STAR program along with pit flaring of gas not sent to the gathering line. The standards will be applicable to newly drilled and fractured wells as well as existing wells that are refractured. Further, the regulations under NESHAPS include maximum achievable control technology, or MACT, standards for those glycol dehydrators and storage vessels at major sources of hazardous air pollutants not currently subject to MACT standards. In October 2012, several challenges to the EPA's rules were filed by various parties, including environmental groups and industry associations. In a January 16, 2013 unopposed motion to hold this litigation in abeyance, the EPA indicated that it may reconsider some aspects of the rules. Depending on the outcome of such proceedings, the rules may be modified or rescinded or the EPA may issue new rules. We are currently evaluating the effect these rules will have on our business. Additionally, on December 11, 2012, seven states submitted a notice of intent to sue the EPA to compel the agency to make a determination as to whether standards of performance limiting methane emissions from oil and gas sources are appropriate, and, if so, to promulgate performance standards for methane emissions from the oil and gas sector, which was not addressed in the EPA rules that became effective on October 15, 2012. The notice of intent also requested the EPA issue emission guidelines for the control of methane emissions from existing oil and gas sources. Increased regulation and attention given to the hydraulic-fracturing process could lead to greater opposition, including litigation, to oil and gas production activities using hydraulic-fracturing techniques. Additional legislation or regulation could also lead to operational delays or increased operating costs in the production of oil and natural gas, including from the developing shale formations, or could make it more difficult to perform hydraulic fracturing. The adoption of any federal, state or local laws or the implementation of regulations regarding hydraulic fracturing could potentially cause a decrease in the completion of new oil and gas wells, increased compliance costs and time, which could adversely affect our financial position, results of operations and cash flows.
Climate change legislation or regulations restricting emissions of greenhouse gases could result in increased operating costs and reduced demand for the oil, natural gas and NGLs we produce.
In December 2009, the EPA officially published its findings that emissions of carbon dioxide, methane and other greenhouse gases, or GHGs, present an endangerment to public health and the environment because emissions of such gases are, according to the EPA, contributing to warming of the earth's atmosphere and other climatic changes. Based on its findings, the EPA has begun adopting and implementing regulations to restrict emissions of GHGs under existing provisions of the federal Clean Air Act, including one rule that requires a reduction in emissions of GHGs from motor vehicles and another that regulates emissions of GHGs from certain large stationary sources. Since January 2, 2011, the EPA has required new or modified stationary sources that emit GHGs at levels above regulatory and statutory thresholds to apply for a Prevention of Significant Deterioration, or PSD, permit under the Clean Air Act. The EPA set the current regulatory thresholds in its "Tailoring Rule," which was intended to avoid the need for large numbers of relatively small GHG-emitting sources to obtain a permit under the Clean Air Act. The EPA has also indicated that it may revise its Tailoring Rule carbon dioxide equivalent thresholds downward in a future rulemaking, which would likely subject additional stationary sources to GHG permitting requirements.
The EPA has also proposed GHG New Source Performance Standards under the Clean Air Act for certain electric utility generating units and may propose GHG NSPS for additional source categories in the future. In addition, on October 30, 2009, the EPA published a final rule requiring the reporting of GHG emissions
39
from specified large GHG emission sources in the United States beginning in 2011 for emissions occurring in 2010. On November 9, 2010, the EPA issued final rules to expand its existing GHG reporting rule to include onshore oil and natural gas production, processing, transmission, storage and distribution facilities with reporting of GHG emissions from such facilities required on an annual basis. The first reports were due in 2012 for emissions occurring in 2011.
In addition, the U.S. Congress has from time to time considered adopting legislation to reduce emissions of GHGs and almost one-half of the states have already taken legal measures to reduce emissions of GHGs primarily through the planned development of GHG emission inventories and/or regional GHG cap and trade programs. The adoption of legislation or regulatory programs to reduce emissions of GHGs could require us to incur increased operating costs, such as costs to purchase and operate emissions control systems, to acquire emissions allowances or comply with new regulatory or reporting requirements. Any such legislation or regulatory programs could also increase the cost of consuming, and thereby reduce demand for, the oil, natural gas and NGLs we produce. Consequently, legislation and regulatory programs to reduce emissions of GHGs could have an adverse effect on our business, financial condition and results of operations.
In addition, there has been public discussion that climate change may be associated with extreme weather conditions such as more intense hurricanes, thunderstorms, tornados and snow or ice storms, as well as rising sea levels. Another possible consequence of climate change is increased volatility in seasonal temperatures. Some studies indicate that climate change could cause some areas to experience temperatures substantially colder than their historical averages. Extreme weather conditions can interfere with our production and increase our costs and damage resulting from extreme weather may not be fully insured. However, at this time we are unable to determine the extent to which climate change may lead to increased storm or weather hazards affecting our operations.
We may face unanticipated water and other waste disposal costs.
We may be subject to regulation that restricts our ability to discharge water produced as part of our gas production operations. Productive zones frequently contain water that must be removed in order for the gas to produce, and our ability to remove and dispose of sufficient quantities of water from the various zones will determine whether we can produce gas in commercial quantities. The produced water currently is transported from the lease and injected into disposal wells. The availability of disposal wells with sufficient capacity to receive all of the water produced from our wells may affect our ability to produce our wells. Also, the EPA expects to issue new standards regarding the disposal of wastewater from hydraulic fracturing into publicly owned treatment facilities this year. Therefore, the cost to transport and dispose of that water, including the cost of complying with regulations concerning water disposal, may reduce our profitability.
Where water produced from our projects fails to meet the quality requirements of applicable regulatory agencies, our wells produce water in excess of the applicable volumetric permit limits, the disposal wells fail to meet the requirements of all applicable regulatory agencies, or we are unable to secure access to disposal wells with sufficient capacity to accept all of the produced water, we may have to shut in wells, reduce drilling activities, or upgrade facilities for water handling or treatment. The costs to dispose of this produced water may increase if any of the following occur:
- •
- we cannot obtain future permits from applicable regulatory agencies;
- •
- water of lesser quality or requiring additional treatment is produced;
- •
- our wells produce excess water;
40
- •
- new laws and regulations require water to be disposed in a different manner;
or
- •
- costs to transport the produced water to the disposal wells increase.
Our senior secured revolving credit facility and our second lien term loan facility contain covenants that restrict our ability to make investments, incur additional indebtedness and engage in certain other transactions, which could adversely affect our ability to meet our future goals.
Our senior secured revolving credit facility and our second lien term loan facility include certain covenants that, among other things, restrict:
- •
- our investments, loans and advances and the payment of dividends and other restricted payments;
- •
- our incurrence of additional indebtedness;
- •
- the granting of liens, other than liens created pursuant to the senior secured revolving credit facility and the second
lien term loan facility and certain other permitted liens;
- •
- mergers, consolidations and sales of all or substantially all of our properties;
- •
- the hedging, forward sale or swap of our production of oil, natural gas, NGLs or other commodities; and
- •
- the sale of assets (other than production sold in the ordinary course of business).
Our senior secured revolving credit facility and our second lien term loan facility require us to maintain specified financial ratios, such as leverage ratios. These restrictive covenants may restrict our ability to expand or pursue our business strategies. Our ability to comply with these and other provisions of our senior secured revolving credit facility and our second lien term loan facility may be impacted by changes in economic or business conditions, results of operations or events beyond our control. The breach of any of these covenants could result in a default under our senior secured revolving credit facility or our second lien term loan facility, in which case, the lenders holding a specified majority or supermajority under that credit facility could elect to declare all amounts borrowed under that credit facility, together with accrued interest, to be immediately due and payable. If we were unable to repay such borrowings or interest, our lenders could proceed against their collateral, which consists of, among other things, substantially all of our oil and gas properties. If the indebtedness under our senior secured revolving credit facility or our second lien term loan facility were to be accelerated, our assets may not be sufficient to repay in full such indebtedness.
In addition, our borrowing base under the senior secured revolving credit facility, which is derived by our lenders from our estimated proved reserves, is subject to periodic redeterminations by the lenders on a semi-annual basis on February 1 and August 1 of each year. We and the administrative agent (acting at the direction of lenders holding at least 662/3% of the outstanding loans and letter of credit obligations) may each request one unscheduled borrowing base redetermination between each scheduled redetermination. In addition, the lenders may elect to redetermine the borrowing base upon the occurrence of certain defaults under our material operating agreements or upon the cancellation or termination of certain of our farm-out agreements. Reductions in our proved reserves, including our proved undeveloped reserves, may result in a reduction by our lenders in our borrowing base and in the amounts we are able to borrow under the facility. The borrowing base will also be reduced in certain circumstances as a result of our issuance of unsecured notes, our termination of certain hedging positions and our consummation of certain asset sales. In the future we could be forced to repay a portion of our then outstanding borrowings under the senior secured revolving credit facility in the event that, due to future redeterminations or reductions of our borrowing base, the outstanding borrowings exceed the redetermined or reduced borrowing base. If we are forced to make any such repayment, we may not have sufficient funds to make such repayment. If we do not have sufficient funds and are otherwise unable to negotiate renewals of our borrowings or arrange new financing, we may
41
have to sell significant assets. Any such sale could have a material adverse effect on our business, financial condition and results of operations.
Our level of indebtedness may increase, which could reduce our financial flexibility.
Upon the completion of this offering, we expect to have $287.3 million available for borrowing based on the current borrowing base of $500 million, under our senior secured revolving credit facility. In the future, we may incur significant indebtedness in order to make future acquisitions or to develop our properties.
Our level of indebtedness could affect our operations in several ways, including the following:
- •
- a significant portion of our cash flows could be used to service our indebtedness;
- •
- a high level of debt would increase our vulnerability to general adverse economic and industry conditions;
- •
- the covenants contained in the agreements governing our outstanding indebtedness will limit our ability to borrow
additional funds, dispose of assets, pay dividends and make certain investments;
- •
- a high level of debt may place us at a competitive disadvantage compared to our competitors that are less leveraged and,
therefore, such competitors may be able to take advantage of opportunities that our indebtedness would prevent us from pursuing;
- •
- our debt covenants may also affect our flexibility in planning for, and reacting to, changes in the economy and in our
industry;
- •
- a high level of debt may make it more likely that a reduction in our borrowing base following a periodic redetermination
could require us to repay a portion of our then outstanding bank borrowings; and
- •
- a high level of debt may impair our ability to obtain additional financing in the future for working capital, capital expenditures, acquisitions, general corporate or other purposes.
A high level of indebtedness increases the risk that we may default on our debt obligations. Our ability to meet our debt obligations and to reduce our level of indebtedness depends on our future performance. General economic conditions, oil, natural gas and NGL prices and financial, business and other factors affect our operations and our future performance. Many of these factors are beyond our control. We may not be able to generate sufficient cash flows to pay the interest on our debt and future working capital, borrowings or equity financing may not be available to pay or refinance such debt. Factors that may affect our ability to raise cash through an offering of our capital stock or a refinancing of our debt include financial market conditions, the value of our assets and our performance at the time we need capital.
Increases in interest rates could adversely affect our business.
Our business and operating results can be harmed by factors such as the availability, terms of and cost of capital, increases in interest rates or a reduction in credit rating. These changes could cause our cost of doing business to increase, limit our ability to pursue acquisition opportunities, reduce our cash flow available for drilling and place us at a competitive disadvantage. For example, as of June 30, 2013, we had approximately $55 million of total available borrowing capacity under our revolving credit facility and our second lien term loan facility, subject to compliance with financial covenants. The impact of a 1.0% increase in interest rates on an assumed borrowing of the full $660 million available under our credit facilities would result in increased annual interest expense of approximately $5.0 million and a corresponding decrease in our net income. Recent and continuing disruptions and volatility in the global financial markets may lead to a contraction in credit availability impacting our ability to finance our
42
operations. A significant reduction in our cash flows from operations or the availability of credit could materially and adversely affect our ability to achieve our planned growth and operating results.
We conduct a substantial portion of our operations through farm-outs, areas of mutual interest and other joint development agreements. These agreements subject us to additional risks that could have a material adverse effect on the success of these operations, our financial position and our results of operations.
We conduct a substantial portion of our operations through joint development agreements with third parties, including ExxonMobil, Vanguard Natural Resources and Southridge. We may also enter into other joint development agreements in the future. These third parties may have obligations that are important to the success of the joint development agreement, such as the obligation to contribute capital or pay carried or other costs associated with the joint development agreement. The performance of these third party obligations, including the ability of the third parties to satisfy their obligations under these arrangements, is outside our control. If these parties do not satisfy their obligations under these arrangements, our business may be adversely affected.
Our joint development agreements may involve risks not otherwise present when exploring and developing properties directly, including, for example:
- •
- our joint development partners may share certain approval rights over major decisions;
- •
- our joint development partners may not pay their share of the joint development agreement obligations, leaving us liable
for their share of joint development liabilities;
- •
- we may incur liabilities as a result of an action taken by our joint development partners;
- •
- our joint development partners may be in a position to take actions contrary to our instructions or requests or contrary
to our policies or objectives; and
- •
- disputes between us and our joint development partners may result in delays, litigation or operational impasses.
The risks described above, the failure to continue our joint ventures or to resolve disagreements with our joint development partners could adversely affect our ability to transact the business of such joint development, which would in turn negatively affect our financial condition and results of operations.
The Jones family and Metalmark Capital, our primary private equity investor, control a significant percentage of our voting power and have the ability to take actions that may conflict with your interests.
Upon completion of this offering (assuming no exercise of the underwriters' option to purchase additional shares), Metalmark Capital will beneficially own approximately 61.7% of our Class B common stock and Jones family entities will collectively beneficially own approximately 34.8% of our Class B common stock. See "Principal stockholders." Holders of Class A common stock and Class B common stock will vote together as a single class on all matters presented to our stockholders for their vote or approval, except as otherwise required by applicable law or our amended and restated certificate of incorporation. Consequently, the Jones family and Metalmark Capital will continue to have significant influence over all matters that require approval by our stockholders, including the election and removal of directors, changes to our organizational documents and approval of significant corporate transactions. This concentration of ownership will limit your ability to influence corporate matters, and as a result, actions may be taken that you may not view as beneficial.
43
The loss of senior management or technical personnel could adversely affect our operations.
Our success will depend to a large extent upon the efforts and abilities of our executive officers and key operations personnel. The loss of the services of one or more of these key employees could have a material adverse effect on us. We do not maintain insurance against the loss of any of these individuals. Our business will also be dependent upon our ability to attract and retain qualified personnel. Acquiring and keeping these personnel could prove more difficult or cost substantially more than estimated. This could cause us to incur greater costs, or prevent us from pursuing our development and exploitation strategy as quickly as we would otherwise wish to do.
If we fail to develop or maintain an effective system of internal controls, we may not be able to report our financial results accurately or prevent fraud, which would likely have a negative impact on the market price of our Class A common stock.
We have had limited accounting personnel to execute our accounting processes and limited other supervisory resources with which to address our internal control over financial reporting. As such, we have not maintained an effective control environment to ensure that the design and execution of our controls has consistently resulted in effective review of our financial statements and supervision by appropriate individuals. As a result of these factors, certain material misstatements in our annual financial statements were discovered and brought to the attention of our management by our independent registered public accounting firm for correction. These material misstatements included certain errors in our annual financial statements for the years ended 2010, 2011 and 2012, including out-of-period adjustments and errors in the calculation of our depreciation, depletion and amortization expense and our asset retirement obligations. We and our independent registered public accounting firm concluded that these control deficiencies constituted a material weakness in our control environment. A material weakness is a control deficiency, or a combination of control deficiencies, in internal control over financial reporting, such that there is a reasonable possibility that a material misstatement of our annual or interim financial statements will not be prevented or detected on a timely basis. The control deficiencies described above, at varying degrees of severity, contributed to the material weakness in the control environment as further described below.
In 2010 and 2011, we did not maintain effective controls to ensure that correct inputs and formulas in spreadsheets were used in our calculation of depreciation, depletion and amortization, or DD&A, expense. In 2012, the lack of effective controls over last-minute journal entries and use of final adjusted production data resulted in the misstatement of DD&A. For each of these periods, effective controls were not adequately designed or consistently operating to ensure that key computations were properly reviewed before the amounts were recorded in our accounting records. The above identified control deficiencies resulted in audit adjustments to our consolidated financial statements during 2010, 2011, and 2012.
In December 2012, we were notified by the Oklahoma Tax Commission that sales tax had not been remitted on tangible property conveyed as part of the sale of a number of oil and gas properties. Due to the lack of state tax expertise on our staff, we were unaware of the requirement to remit such a tax and had failed to file, albeit unintentionally. Consequently, tax expense for periods prior to 2012 was understated. Management is reviewing the internal control weakness related to this omission to determine the proper organizational structure in response.
Effective internal controls are necessary for us to provide reliable financial reports, prevent fraud and to operate successfully as a publicly traded company. To comply with the requirements of being a publicly traded company, we may need to implement additional financial and management controls, reporting systems and procedures and hire additional accounting, finance and legal staff. Our efforts to develop and maintain our internal controls may not be successful, and we may be unable to maintain effective controls over our financial processes and reporting in the future or to comply with our obligations under
44
Section 404 of the Sarbanes-Oxley Act of 2002, which we refer to as Section 404. For example, Section 404 will require us, among other things, to annually review and report on, and our independent registered public accounting firm to attest to, the effectiveness of our internal controls over financial reporting. We must comply with Section 404 (except for the requirement for an auditor's attestation report) beginning with our fiscal year ending December 31, 2014. Any failure to develop, implement or maintain effective internal controls or to improve our internal controls could harm our operating results or cause us to fail to meet our reporting obligations. Given the difficulties inherent in the design and operation of internal controls over financial reporting, we can provide no assurance as to our conclusions about the effectiveness of our internal controls, and we may incur significant costs in our efforts to comply with Section 404. If one or more material weaknesses persist or if we fail to establish and maintain effective internal control over financial reporting, our ability to accurately report our financial results could be adversely affected. Ineffective internal controls could also subject us to regulatory scrutiny and a loss of confidence in our reported financial information, which could have an adverse effect on our business and would likely have a negative effect on the trading price of our Class A common stock.
For as long as we are an emerging growth company, we will not be required to comply with certain disclosure requirements that apply to other public companies.
In April 2012, President Obama signed into law the Jumpstart Our Business Startups Act, or the JOBS Act. For as long as we remain an "emerging growth company" as defined in the JOBS Act, we may take advantage of certain exemptions from various reporting requirements that are applicable to other public companies that are not emerging growth companies, including not being required to provide an auditor's attestation report on management's assessment of the effectiveness of our system of internal control over financial reporting pursuant to Section 404 of the Sarbanes-Oxley Act and reduced disclosure obligations regarding executive compensation in our periodic reports. We will remain an emerging growth company for up to five years, although we will lose that status sooner if we have more than $1.0 billion of revenues in a fiscal year, have more than $700 million in market value of our Class A common stock held by non-affiliates, or issue more than $1.0 billion of non-convertible debt over a three-year period.
In addition, the JOBS Act provides that an emerging growth company can delay adopting new or revised accounting standards until such time as those standards apply to private companies. We have irrevocably elected to "opt out" of this exemption and, therefore, will be subject to the same new or revised accounting standards as other public companies that are not emerging growth companies.
To the extent that we rely on any of the exemptions available to emerging growth companies, you will receive less information about our executive compensation and internal control over financial reporting than issuers that are not emerging growth companies. If some investors find our Class A common stock to be less attractive as a result, there may be a less active trading market for our Class A common stock and our trading price may be more volatile.
Loss of our information and computer systems could adversely affect our business.
We are heavily dependent on our information systems and computer based programs, including our well operations information, seismic data, electronic data processing and accounting data. If any of such programs or systems were to fail or create erroneous information in our hardware or software network infrastructure, possible consequences include our loss of communication links, inability to find, produce, process and sell oil, natural gas and NGLs and inability to automatically process commercial transactions or engage in similar automated or computerized business activities. Any such consequence could have a material adverse effect on our business.
45
Risks relating to this offering and our Class A common stock
The initial public offering price of our Class A common stock may not be indicative of the market price of our Class A common stock after this offering. In addition, an active, liquid and orderly trading market for our Class A common stock may not develop or be maintained, and our stock price may be volatile.
Prior to this offering, our Class A common stock was not traded on any market. An active, liquid and orderly trading market for our Class A common stock may not develop or be maintained after this offering. Active, liquid and orderly trading markets usually result in less price volatility and more efficiency in carrying out investors' purchase and sale orders. The market price of our Class A common stock could vary significantly as a result of a number of factors, some of which are beyond our control. In the event of a drop in the market price of our Class A common stock, you could lose a substantial part or all of your investment in our Class A common stock. The initial public offering price will be negotiated between us and representatives of the underwriters, based on numerous factors which we discuss in the "Underwriting (conflicts of interest)" section of this prospectus, and may not be indicative of the market price of our Class A common stock after this offering. Consequently, you may not be able to sell shares of our Class A common stock at prices equal to or greater than the price paid by you in this offering.
The following factors could affect our stock price:
- •
- our operating and financial performance, including reserve estimates;
- •
- quarterly variations in our financial indicators, such as net income per share, net income and revenues;
- •
- strategic actions by our competitors;
- •
- changes in revenue or earnings estimates, or changes in recommendations or withdrawal of research coverage, by equity
research analysts;
- •
- speculation in the press or investment community;
- •
- issuance of Class A common stock by us or substantial sales of our stock by stockholders, or the perception that
such sales may occur;
- •
- changes in accounting principles;
- •
- additions or departures of key management personnel;
- •
- actions by our stockholders;
- •
- general market conditions, including fluctuations in commodity prices; and
- •
- domestic and international economic, legal and regulatory factors unrelated to our performance.
The stock markets in general have experienced extreme volatility that has often been unrelated to the operating performance of particular companies. These broad market fluctuations may adversely affect the trading price of our Class A common stock. Securities class action litigation has often been instituted against companies following periods of volatility in the overall market and in the market price of a company's securities. Such litigation, if instituted against us, could result in very substantial costs, divert our management's attention and resources and harm our business, operating results and financial condition.
46
Investors in this offering will experience immediate and substantial dilution of $4.98 per share.
Based on an assumed initial public offering price of $18.00 per share, purchasers of our Class A common stock in this offering will experience an immediate and substantial dilution of $4.98 per share in the as adjusted net tangible book value per share of Class A common stock from the initial public offering price, and our as adjusted net tangible book value as of March 31, 2013 after giving effect to this offering would be $13.02 per share. This dilution is due in large part to earlier investors having paid substantially less than the initial public offering price when they purchased their shares. See "Dilution" for additional information.
Because we are a relatively small company, the requirements of being a public company, including compliance with the reporting requirements of the Exchange Act and the requirements of the Sarbanes-Oxley Act of 2002, may strain our resources, increase our costs and distract management, and we may be unable to comply with these requirements in a timely or cost-effective manner.
As a public company with listed equity securities, we will need to comply with new laws, regulations and requirements, certain corporate governance provisions of the Sarbanes-Oxley Act of 2002, related regulations of the SEC, including compliance with the reporting requirements of the Securities Exchange Act of 1934, as amended, or the Exchange Act, and the requirements of the New York Stock Exchange, or the NYSE, with which we are not required to comply as a private company. Complying with these statutes, regulations and requirements will occupy a significant amount of time of our board of directors and management and will significantly increase our costs and expenses. We will need to:
- •
- institute a more comprehensive compliance function;
- •
- design, establish, evaluate and maintain a system of internal controls over financial reporting in compliance with the
requirements of Section 404 of the Sarbanes-Oxley Act of 2002 and the related rules and regulations of the SEC and the Public Company Accounting Oversight Board;
- •
- comply with listing standards promulgated by the NYSE;
- •
- prepare and distribute periodic public reports in compliance with our obligations under the federal securities laws;
- •
- establish new internal policies, such as those relating to disclosure controls and procedures and insider trading;
- •
- involve and retain to a greater degree outside counsel and accountants in the above activities; and
- •
- establish an investor relations function.
In addition, we expect that being a public company subject to these rules and regulations may make it more difficult and more expensive for us to obtain director and officer liability insurance and we may be required to accept reduced policy limits and coverage or incur substantially higher costs to obtain the same or similar coverage. As a result, it may be more difficult for us to attract and retain qualified individuals to serve on our board of directors or as executive officers. We are currently evaluating these rules, and we cannot predict or estimate the amount of additional costs we may incur or the timing of such costs.
47
We do not intend to pay, and our credit facilities currently prohibit us from paying, cash dividends on our Class A common stock and, consequently, your only opportunity to achieve a return on your investment is if the price of our Class A common stock appreciates.
We do not plan to declare dividends on shares of our Class A common stock in the foreseeable future. Additionally, we are currently prohibited from making any cash dividends pursuant to the terms of our senior secured revolving credit facility and our second lien term loan facility. Consequently, your only opportunity to achieve a return on your investment in us will be if you sell your Class A common stock at a price greater than you paid for it. There is no guarantee that the price of our Class A common stock that will prevail in the market will ever exceed the price that you pay in this offering.
Future sales of our Class A common stock in the public market could reduce our stock price, and any additional capital raised by us through the sale of equity or convertible securities may dilute your ownership in us.
Subject to certain limitations and exceptions, holders of JEH LLC Units may exchange their JEH LLC Units (together with a corresponding number of shares of Class B common stock) for shares of Class A common stock (on a one-for-one basis, subject to customary conversion rate adjustments for stock splits, stock dividends and reclassification and other similar transactions) and then sell those shares of Class A common stock. Additionally, we may issue additional shares of Class A common stock or convertible securities in subsequent public offerings. After the completion of this offering, we will have 14,000,000 outstanding shares of Class A common stock and 36,836,333 outstanding shares of Class B common stock. This number of outstanding shares of Class A common stock includes 14,000,000 shares that we are issuing in this offering, which may be resold immediately in the public market. Following the completion of this offering (assuming no exercise of the underwriters' option to purchase additional shares), Metalmark Capital will own 22,745,752 shares of Class B common stock (or 20,757,620 shares of Class B common stock assuming full exercise of the underwriters' option to purchase additional shares and that Metalmark Capital elects to exchange JEH LLC Units and a corresponding number of shares of Class B common stock for cash proceeds we receive from the underwriters' option to purchase additional shares of Class A common stock) and certain Jones family entities will own 12,810,720 shares of Class B common stock (regardless of whether the underwriters' option to purchase additional shares is exercised), all of which are restricted from immediate resale under the federal securities laws and are subject to the lock-up agreements between such parties and the underwriters described in "Underwriting (conflicts of interest)," but may be sold into the market in the future. We expect that the Jones family entities and Metalmark Capital will be parties to a stockholders' agreement with us which will require us to effect the registration of their shares in certain circumstances no earlier than the expiration of the lock-up period contained in the underwriting agreement entered into in connection with this offering. Employees will be subject to certain restrictions on the sale of their shares for 180 days after the date of this prospectus; however, after such period, and subject to compliance with the Securities Act or exemptions therefrom, these employees may sell such shares into the public market. See "Shares eligible for future sale" and "Certain relationships and related party transactions—Registration rights and stockholders agreement."
Prior to the completion of this offering, we intend to file a registration statement with the SEC on Form S-8 providing for the registration of 3,850,000 shares of our Class A common stock issued or reserved for issuance under our equity incentive plan. Subject to the satisfaction of vesting conditions and the expiration of lock-up agreements, shares registered under the registration statement on Form S-8 will be available for resale immediately in the public market without restriction.
We cannot predict the size of future issuances of our Class A common stock or securities convertible into Class A common stock or the effect, if any, that future issuances and sales of shares of our Class A
48
common stock will have on the market price of our Class A common stock. Sales of substantial amounts of our Class A common stock (including shares issued in connection with an acquisition), or the perception that such sales could occur, may adversely affect prevailing market prices of our Class A common stock.
The underwriters of this offering may waive or release parties to the lock-up agreements entered into in connection with this offering, which could adversely affect the price of our Class A common stock.
Certain of our stockholders, directors, members of our senior management team and certain affiliates of Metalmark Capital and Wells Fargo have entered into lock-up agreements with respect to their Class A common stock, pursuant to which they are subject to certain resale restrictions for a period of 180 days following the effective date of the registration statement of which this prospectus forms a part. Certain representatives of the underwriters to this offering, at any time and without notice, may release all or any portion of the Class A common stock subject to the foregoing lock-up agreements. If the restrictions under the lock-up agreements are waived, then the related Class A common stock will be available for sale into the public markets, which could cause the market price of our Class A common stock to decline and impair our ability to raise capital.
A significant reduction by Metalmark Capital of its ownership interest in us could adversely affect us.
Metalmark Capital is our largest stockholder and two members of our board of directors are affiliated with Metalmark Capital. We believe that Metalmark Capital's substantial ownership interest in us provides them with an economic incentive to assist us to be successful. Following the 180th day after the closing of this offering, however, Metalmark Capital will not be subject to any obligation to maintain their ownership interest in us and may elect at any time thereafter to sell all or a substantial portion of or otherwise reduce its ownership interest in us. If Metalmark Capital sells all or a substantial portion of its ownership interest in us, Metalmark Capital would have less incentive to assist in our success, and its affiliates that are members of our board of directors may resign. Such actions could adversely affect our ability to successfully implement our business strategies, which could adversely affect our cash flows or results of operations.
We are subject to anti-takeover provisions that could delay or prevent an acquisition of our company, even if the acquisition would be beneficial to our stockholders.
Provisions in our amended and restated certificate of incorporation and amended and restated bylaws may delay or prevent an acquisition of us. These provisions may also frustrate or prevent any attempts by our stockholders to replace or remove our current management by making it more difficult for stockholders to replace members of our board of directors, who are responsible for appointing the members of our management team. Furthermore, because we are incorporated in Delaware, we are governed by the provisions of Section 203 of the Delaware General Corporation Law, or the DGCL, which prohibits, with some exceptions, stockholders owning in excess of 15% of our outstanding voting stock from merging or combining with us. Additionally, our amended and restated bylaws establish advance notice requirements for nominations for election to our board of directors and for proposing matters that can be acted upon at stockholder meetings. Although we believe these provisions together provide an opportunity to receive higher bids by requiring potential acquirers to negotiate with our board of directors, they would apply even if an offer to acquire us may be considered beneficial by some stockholders. See "Description of capital stock—Anti-takeover effects of provisions of our amended and restated certificate of incorporation, our amended and restated bylaws and Delaware law."
In addition, certain change of control events have the effect of accelerating the payment due under our Tax Receivable Agreement, which could be substantial and accordingly serve as a disincentive to a
49
potential acquirer of our company. Please see "—In certain cases, payments under the Tax Receivable Agreement may be accelerated and/or significantly exceed the actual benefits, if any, we realize in respect of the tax attributes subject to the Tax Receivable Agreement."
The NYSE does not require publicly listed companies like us to immediately comply with certain of its corporate governance requirements.
We have been approved to list our Class A common stock on the NYSE, subject to official notice of issuance. We will rely on the phase-in rules of the SEC and the NYSE with respect to the independence of our nomination, compensation and audit committees. These rules permit us to have an audit committee that has one member that is independent by the date that our Class A common stock first trades on the NYSE, a majority of members that are independent within 90 days of the effectiveness of the registration statement of which this prospectus forms a part and all members that are independent within one year of the effective date. Similarly, the rules permit us to have nominating and compensation committees that have one member that is independent by the date that our Class A common stock first trades on the NYSE, a majority of members that are independent within 90 days of the listing date and all members that are independent within one year of the listing date. Additionally, we have 12 months from the date of listing to satisfy the requirement that a majority of the board of directors be independent. Accordingly, you may not have the same protections afforded to stockholders of companies that are subject to all of the corporate governance requirements of the NYSE.
We are a holding company. Our sole material asset after completion of this offering will be our equity interest in JEH LLC, and we are accordingly dependent upon distributions from JEH LLC to pay taxes, make payments under the Tax Receivable Agreement and cover our corporate and other overhead expenses.
We are a holding company and will have no material assets other than our equity interest in JEH LLC. See "Organizational structure." We have no independent means of generating revenue. To the extent JEH LLC has available cash, we intend to cause JEH LLC to make distributions to its unitholders, including us, in an amount sufficient to cover all applicable taxes at assumed tax rates and payments under the Tax Receivable Agreement we will enter into with JEH LLC and the Existing Owners, and to reimburse us for our corporate and other overhead expenses. We are limited, however, in our ability to cause JEH LLC and its subsidiaries to make these and other distributions to us due to the restrictions under our credit facilities. To the extent that we need funds and JEH LLC or its subsidiaries are restricted from making such distributions under applicable law or regulation or under the terms of their financing arrangements, or are otherwise unable to provide such funds, it could materially adversely affect our liquidity and financial condition.
The Jones family and Metalmark Capital hold a majority of the combined voting power of our Class A and Class B common stock.
Immediately following this offering, the Jones family and Metalmark Capital will hold approximately 69.9% of the combined voting power of our Class A and Class B common stock (or 66.0% if the underwriters exercise their option to purchase additional shares in full and Metalmark Capital elects to exchange JEH LLC Units and a corresponding number of shares of Class B common stock for cash proceeds we receive from the underwriters' option to purchase additional shares of Class A common stock). Although the Jones family and Metalmark Capital are entitled to act separately in their own respective interests with respect to their stock in us, the Jones family and Metalmark Capital will have the ability to elect all of the members of our board of directors, and thereby to control our management and affairs. In addition, they will be able to determine the outcome of all matters requiring stockholder approval, including mergers and
50
other material transactions, and will be able to cause or prevent a change in the composition of our board of directors or a change in control of our company that could deprive our stockholders of an opportunity to receive a premium for their Class A common stock as part of a sale of our company. So long as the Jones family and Metalmark Capital continue to own a significant amount of the outstanding shares of our common stock, even if such amount is less than 50%, they will continue to be able to strongly influence all matters requiring stockholder approval, regardless of whether or not other stockholders believe that the transaction is in their own best interests.
We will be required to make payments under the Tax Receivable Agreement for certain tax benefits we may claim, and the amounts of such payments could be significant.
We will enter into the Tax Receivable Agreement with JEH LLC and the Existing Owners. This agreement generally provides for the payment by us of 85% of the amount of cash savings, if any, in U.S. federal, state and local income tax or franchise tax that we actually realize (or are deemed to realize in certain circumstances) in periods after this offering as a result of (i) the tax basis increases resulting from the exchange of JEH LLC Units for shares of Class A common stock (or resulting from a sale of JEH LLC Units for cash) and (ii) imputed interest deemed to be paid by us as a result of, and additional tax basis arising from, any payments we make under the Tax Receivable Agreement. In addition, payments we make under the Tax Receivable Agreement will be increased by any interest accrued from the due date (without extensions) of the corresponding tax return.
The payment obligations under the Tax Receivable Agreement are our obligations and not obligations of JEH LLC. For purposes of the Tax Receivable Agreement, cash savings in tax generally are calculated by comparing our actual tax liability to the amount we would have been required to pay had we not been able to utilize any of the tax benefits subject to the Tax Receivable Agreement. The term of the Tax Receivable Agreement will commence upon the completion of this offering and will continue until all such tax benefits have been utilized or expired, unless we exercise our right to terminate the Tax Receivable Agreement by making the termination payment specified in the agreement.
The actual increase in tax basis, as well as the amount and timing of any payments under the Tax Receivable Agreement, will vary depending upon a number of factors, including the timing of the exchanges of JEH LLC Units, the price of Class A common stock at the time of each exchange, the extent to which such exchanges are taxable, the amount and timing of the taxable income we generate in the future and the tax rate then applicable, and the portion of our payments under the Tax Receivable Agreement constituting imputed interest or depletable, depreciable or amortizable basis. We expect that the payments that we will be required to make under the Tax Receivable Agreement could be substantial.
The payments under the Tax Receivable Agreement will not be conditioned upon a holder of rights under the Tax Receivable Agreement having a continued ownership interest in either JEH LLC or us. See "Certain relationships and related party transactions—Tax receivable agreement."
In certain cases, payments under the Tax Receivable Agreement may be accelerated and/or significantly exceed the actual benefits, if any, we realize in respect of the tax attributes subject to the Tax Receivable Agreement.
If we elect to terminate the Tax Receivable Agreement early or it is terminated early due to certain mergers or other changes of control we would be required to make an immediate payment equal to the present value of the anticipated future tax benefits subject to the Tax Receivable Agreement, which calculation of anticipated future tax benefits will be based upon certain assumptions and deemed events set forth in the Tax Receivable Agreement, including the assumption that we have sufficient taxable income
51
to fully utilize such benefits and that any JEH LLC Units that the Existing Owners or their permitted transferees own on the termination date are deemed to be exchanged on the termination date. Any early termination payment may be made significantly in advance of the actual realization, if any, of such future benefits.
In these situations, our obligations under the Tax Receivable Agreement could have a substantial negative impact on our liquidity and could have the effect of delaying, deferring or preventing certain mergers, asset sales, other forms of business combinations or other changes of control due to the additional transaction cost a potential acquirer may attribute to satisfying such obligations. For example, if the Tax Receivable Agreement were terminated immediately after this offering, the estimated termination payment would be approximately $202.0 million (calculated using a discount rate equal to the London interbank offering rate, plus 100 basis points, applied against an undiscounted liability of $313.2 million). The foregoing number is merely an estimate and the actual payment could differ materially. There can be no assurance that we will be able to finance our obligations under the Tax Receivable Agreement.
Payments under the Tax Receivable Agreement will be based on the tax reporting positions that we will determine. The holders of rights under the Tax Receivable Agreement will not reimburse us for any payments previously made under the Tax Receivable Agreement if such basis increases or other benefits are subsequently disallowed, except that excess payments made to any Existing Owner will be netted against payments otherwise to be made, if any, to such Existing Owner after our determination of such excess. As a result, in such circumstances, we could make payments that are greater than our actual cash tax savings, if any, and may not be able to recoup those payments, which could adversely affect our liquidity.
The Existing Owners may have interests that conflict with holders of shares of our Class A common stock.
Immediately following this offering (assuming that the underwriters do not exercise their option to purchase additional shares), the Existing Owners will own 72.5% of the JEH LLC Units. Because they hold a portion of their ownership interest in our business through JEH LLC, rather than through us, the Existing Owners may have conflicting interests with holders of shares of Class A common stock. For example, the Existing Owners may have different tax positions from us which could influence their decisions regarding whether and when to cause us to dispose of assets and whether and when to cause us to incur new or refinance existing indebtedness, especially in light of the existence of the Tax Receivable Agreements that we will enter into in connection with this offering. See "Certain relationships and related person transactions—Tax receivable agreement."
Furthermore, conflicts of interest could arise in the future between us, on the one hand, and the Existing Owners, on the other hand, concerning among other things, potential competitive business activities or business opportunities. These conflicts of interest may not be resolved in our favor.
52
Cautionary note regarding forward-looking statements
This prospectus, including the sections entitled "Prospectus summary," "Risk factors," "Use of proceeds," "Management's discussion and analysis of financial condition and results of operations" and "Business," contains forward-looking statements that are subject to a number of risks and uncertainties, many of which are beyond our control. When used in this prospectus, the words "could," "plan," "seek," "good," "strategy," "forecast," "future," "likely," "should," "aim," "continue," "objective," "prospective," "believe," "anticipate," "intend," "estimate," "expect," "may," "continue," "predict," "potential," "project" and similar expressions are intended to identify forward-looking statements, including statements about our:
- •
- business strategy;
- •
- reserves;
- •
- technology;
- •
- cash flows and liquidity;
- •
- financial strategy, budget, projections and operating results;
- •
- oil, natural gas and NGLs realized prices;
- •
- customers' elections to reject ethane and include it as part of the natural gas stream for the remainder of 2013;
- •
- timing and amount of future production of oil and natural gas;
- •
- availability of drilling and production equipment;
- •
- availability of oilfield labor;
- •
- the amount, nature and timing of capital expenditures, including future development costs;
- •
- ability to fund substantially all of our 2013 capital expenditure budget with cash flow from operations;
- •
- availability and terms of capital;
- •
- drilling of wells including our identified drilling locations;
- •
- successful results from our identified drilling locations;
- •
- ability to generate returns and pursue opportunities;
- •
- marketing of oil, natural gas and NGLs;
- •
- property acquisitions;
- •
- costs of developing our properties and conducting other operations;
- •
- general economic conditions and the commodity price environment;
- •
- effectiveness of our risk management activities;
- •
- estimates of future potential impairments;
53
- •
- environmental liabilities;
- •
- counterparty credit risk;
- •
- governmental regulation and taxation of the oil and natural gas industry;
- •
- developments in oil-producing and natural gas-producing countries;
- •
- uncertainty regarding our future operating results;
- •
- estimated future net reserves and present value thereof; and
- •
- plans, objectives, expectations and intentions contained in this prospectus that are not historical.
All forward-looking statements speak only as of the date of this prospectus. You should not place undue reliance on these forward-looking statements. These forward-looking statements are subject to a number of risks, uncertainties and assumptions. Moreover, we operate in a very competitive and rapidly changing environment. New risks emerge from time to time. It is not possible for our management to predict all risks, nor can we assess the impact of all factors on our business or the extent to which any factor, or combination of factors, may cause actual results to differ materially from those contained in any forward-looking statements we may make. Although we believe that our plans, expectations and estimates reflected in or suggested by the forward-looking statements we make in this prospectus are reasonable, we can give no assurance that these plans, expectations or estimates will be achieved or occur, and actual results could differ materially and adversely from those anticipated or implied in the forward-looking statements. We disclose important factors that could cause our actual results to differ materially from our expectations under "Risk factors" and "Management's discussion and analysis of financial condition and results of operations" and elsewhere in this prospectus. These factors include:
- •
- instability and uncertainty in the U.S. and international financial and consumer markets that may adversely affect the
liquidity available to us and our customers and could adversely affect the demand for commodities, including oil and natural gas;
- •
- competition in the oil and gas industry;
- •
- availability and costs of drilling and production equipment, labor and oil and gas processing and other services;
- •
- the availability of sufficient pipeline and transportation facilities;
- •
- variations in the global and domestic demand for, and prices of, oil and natural gas;
- •
- uncertainties about our estimated quantities of oil and natural gas reserves;
- •
- the adequacy of our capital resources and liquidity including, but not limited to, access to additional borrowing capacity
under our senior secured revolving credit facility;
- •
- restrictions contained in our debt agreements, including our senior secured credit facility and second lien term loan
facility, as well as debt that could be incurred in the future;
- •
- access to capital and general economic and business conditions;
- •
- our ability to recruit and retain the qualified personnel necessary to operate our business;
54
- •
- discovery, estimation, development and replacement of oil and gas reserves, including our expectations that estimates of
our proved reserves will increase;
- •
- risks related to the concentration of our operations in Texas and Oklahoma;
- •
- drilling results;
- •
- the potential adoption of regulations that prohibit or restrict our ability to apply hydraulic fracturing to our oil and
natural gas wells;
- •
- changes in the regulatory environment and changes in international, legal, political, administrative or economic
conditions;
- •
- our ability to execute our strategies;
- •
- evolving industry standards and adverse changes in global economic, political and other conditions;
- •
- our ability to comply with federal, state and local regulatory requirements;
- •
- our ability to satisfy future cash obligations and environmental costs and to generate future profits; and
- •
- other factors discussed in the prospectus, including in the section entitled "Risk factors."
These cautionary statements qualify all forward-looking statements attributable to us or persons acting on our behalf.
Reserve engineering is a process of estimating underground accumulations of oil and natural gas that cannot be measured in an exact way. The accuracy of any reserve estimate depends on the quality of available data, the interpretation of such data and price and cost assumptions made by our reserve engineers. In addition, the results of drilling, testing and production activities may justify revisions of estimates that were made previously. If significant, such revisions would change the schedule of any further production and development drilling. Accordingly, reserve estimates may differ from the quantities of oil and natural gas that are ultimately recovered.
55
The diagram below depicts our organizational structure immediately following this offering and the transactions related thereto (assuming that the underwriters' option to purchase additional shares is not exercised):
Incorporation of Jones Energy, Inc.
Jones Energy, Inc. was incorporated as a Delaware corporation in March 2013. Following this offering and the transactions related thereto, we will be a holding company whose sole material asset will consist of 14,000,000 JEH LLC Units (or 16,100,000 JEH LLC Units if the underwriters exercise in full their option to purchase additional shares of Class A common stock). As the sole managing member of JEH LLC, Jones Energy, Inc. will be responsible for all operational, management and administrative decisions relating to JEH LLC's business and will consolidate the financial results of JEH LLC and its subsidiaries.
56
Our certificate of incorporation authorizes two classes of common stock, Class A common stock and Class B common stock. See "—Description of capital stock." Only Class A common stock will be sold to investors pursuant to this offering. In a transaction separate from this offering, we will issue to each Existing Owner for nominal consideration a number of shares of Class B common stock that is equal to the number of JEH LLC Units that such Existing Owner receives pursuant to the recapitalization described below under "—Recapitalization of JEH LLC." Each share of Class B common stock has no economic rights but entitles its holder to one vote on all matters to be voted on by stockholders generally. Holders of Class A common stock and Class B common stock will vote together as a single class on all matters presented to our stockholders for their vote or approval, except as otherwise required by applicable law or by our amended and restated certificate of incorporation.
We do not intend to list Class B common stock on any stock exchange.
Recapitalization of JEH LLC
JEH LLC acts as a holding company of operating subsidiaries that own and operate our assets that are used in the exploration, development, production and acquisition of oil and natural gas properties. Prior to this offering, the equity capital of JEH LLC consisted of several classes of limited liability company units with differing entitlements to distributions. In connection with this offering, (i) the Existing Owners will convert their existing membership interests in JEH LLC into JEH LLC Units and (ii) the Second Amended and Restated Limited Liability Company Agreement of JEH LLC will be amended and restated to, among other things, modify JEH LLC's equity capital to consist solely of JEH LLC Units. Jones Energy, Inc. will be the sole managing member of JEH LLC and the holders of JEH LLC Units and Class B common stock will have the exchange rights described under "Certain relationships and related party transactions—Exchange agreement."
The allocation of JEH LLC Units among the Existing Owners will be determined based upon the liquidation value of JEH LLC, which will be implied by the initial public offering price of the shares of Class A common stock sold in this offering. Upon completion of this offering (based on an assumed initial public offering price of $18.00 per share and assuming no exercise of the underwriters' option to purchase additional shares), Metalmark Capital will beneficially own approximately 61.7% of our Class B common stock (44.7% of our combined economic interest and voting power) and Jones family entities will collectively beneficially own approximately 34.8% of our Class B common stock (25.2% of our combined economic interest and voting power). A $1.00 increase in the assumed initial public offering price of $18.00 per share would cause Metalmark Capital to beneficially own approximately 61.3% of our Class B common stock (44.4% of our combined economic interest and voting power) and Jones family entities to collectively beneficially own approximately 35.2% of our Class B common stock (25.5% of our combined economic interest and voting power). A $1.00 decrease in the assumed initial public offering price of $18.00 per share would cause Metalmark Capital to beneficially own approximately 62.2% of our Class B common stock (45.1% of our combined economic interest and voting power) and Jones family entities to collectively beneficially own approximately 34.3% of our Class B common stock (24.8% of our combined economic interest and voting power).
Offering
Only Class A common stock will be sold to investors pursuant to this offering. Immediately following this offering, there will be 14,000,000 shares of Class A common stock issued and outstanding (or 16,100,000 shares of Class A common stock if the underwriters exercise in full their option to purchase additional shares of Class A common stock) and 36,836,333 shares of Class A common stock reserved for exchanges of JEH LLC Units and shares of Class B common stock pursuant to the Exchange Agreement. We
57
estimate that our net proceeds from this offering, after deducting estimated underwriting discounts and commissions and other offering related expenses, will be approximately $232.3 million. The proceeds from this offering will be used to purchase newly-issued JEH LLC Units from JEH LLC. If the underwriters exercise their option to purchase additional shares of our Class A common stock, we intend to use the proceeds from the sale of such shares to purchase up to 2,100,000 JEH LLC Units from Metalmark Capital and Wells Fargo at a purchase price equal to the public offering price of the Class A common stock offered hereby less underwriting discounts and commissions. In this case, an equivalent number of shares of Class B common stock will be cancelled. Jones Energy, Inc. will be the sole managing member of JEH LLC.
As a result of the recapitalization of JEH LLC and the offering described above (and prior to any exchanges of JEH LLC Units):
- •
- the investors in this offering will collectively own 14,000,000 shares of Class A common stock (or
16,100,000 shares of Class A common stock if the underwriters exercise in full their option to purchase additional shares of Class A common stock), and we will hold a
corresponding number of JEH LLC Units;
- •
- the Existing Owners will hold 36,836,333 shares of Class B common stock and a corresponding number of
JEH LLC Units (or 34,736,333 shares of Class B common stock if the underwriters exercise in full their option to purchase additional shares of Class A common stock and
Metalmark Capital and Wells Fargo elect to exchange JEH LLC Units and a corresponding number of shares of Class B common stock for cash proceeds we receive from the underwriters' option
to purchase additional shares of Class A common stock);
- •
- the investors in this offering will collectively hold 27.5% (or 31.7% if the underwriters exercise in full their option to
purchase additional shares of Class A common stock and Metalmark Capital and Wells Fargo elect to exchange JEH LLC Units and a corresponding number of shares of Class B common
stock for cash proceeds we receive from the underwriters' option to purchase additional shares of Class A common stock) of the voting power in us; and
- •
- the Existing Owners will hold 72.5% (or 68.3% if the underwriters exercise in full their option to purchase additional shares of Class A common stock and Metalmark Capital and Wells Fargo elect to exchange JEH LLC Units and a corresponding number of shares of Class B common stock for cash proceeds we receive from the underwriters' option to purchase additional shares of Class A common stock) of the voting power in us.
Holding company structure
Following this offering and the transactions related thereto, we will be a holding company and our sole material asset will be an equity interest in JEH LLC. We also will be the sole managing member of JEH LLC and, thus, will be responsible for all operational, management and administrative decisions relating to JEH LLC's business and will consolidate the financial results of JEH LLC and its subsidiaries.
Our post-offering organizational structure will allow the Existing Owners to retain their equity ownership in JEH LLC, an entity that is classified as a partnership for U.S. federal income tax purposes. Investors in this offering will, by contrast, hold their equity ownership in the form of shares of Class A common stock in us, and we are classified as a domestic corporation for U.S. federal income tax purposes. We believe that the Existing Owners generally find it advantageous to hold their equity interests in an entity that is not taxable as a corporation for U.S. federal income tax purposes. The Existing Owners, like us, will generally incur U.S. federal, state and local income taxes on their proportionate share of any taxable income of JEH LLC.
58
In addition, pursuant to our certificate of incorporation and the Third Amended and Restated LLC Agreement, our capital structure and the capital structure of JEH LLC will generally replicate one another and will provide for customary antidilution mechanisms in order to maintain the one-for-one exchange ratio between the JEH LLC Units and our Class A common stock, among other things.
The holders of JEH LLC Units, including us, will generally incur U.S. federal, state and local income taxes on their proportionate share of any taxable income of JEH LLC and will be allocated their proportionate share of any taxable loss of JEH LLC. The Third Amended and Restated LLC Agreement provides, to the extent cash is available, for distributions pro rata to the holders of JEH LLC Units if we, as the managing member of JEH LLC, determine that the taxable income of JEH LLC will give rise to taxable income for a unitholder. Generally, these tax distributions will be computed based on our estimate of the taxable income of JEH LLC that is allocable to a holder of JEH LLC Units, multiplied by an assumed tax rate equal to the highest effective marginal combined U.S. federal, state and local income tax rate prescribed for an individual resident in New York, New York (taking into account the nondeductibility of certain expenses and the character of our income).
We may accumulate cash balances in future years resulting from distributions from JEH LLC exceeding our tax liabilities and our obligations to make payments under the Tax Receivable Agreement. To the extent we do not distribute such cash balances as a dividend on our Class A common stock and instead decide to hold or recontribute such cash balances to JEH LLC for use in our operations, holders of JEH LLC Units who exchange for Class A common stock in the future could also benefit from any value attributable to any such accumulated cash balances.
See "Certain relationships and related person transactions—Organizational structure."
We will enter into the Tax Receivable Agreement with JEH LLC and the Existing Owners. This agreement generally provides for the payment by Jones Energy, Inc. of 85% of the amount of cash savings, if any, in U.S. federal, state and local income tax or franchise tax that it actually realizes (or is deemed to realize in certain circumstances) in periods after this offering as a result of (i) the tax basis increases resulting from the exchange of JEH LLC Units and shares of Class B common stock for shares of Class A common stock (or resulting from a sale of JEH LLC Units and shares of Class B common stock for cash) and (ii) imputed interest deemed to be paid by us as a result of, and additional tax basis arising from, any payments we make under the Tax Receivable Agreement. Jones Energy, Inc. will retain the benefit of the remaining 15% of these cash savings. See "Certain relationships and related party transactions—Tax receivable agreement."
59
We expect to receive approximately $232.3 million of net proceeds from the sale of the Class A common stock offered by us, based upon the assumed initial public offering price of $18.00 per share (the midpoint of the price range set forth on the cover page of this prospectus), after deducting underwriting discounts and commissions and estimated offering expenses payable by us.
Jones Energy, Inc. will contribute the proceeds from this offering to JEH LLC in exchange for JEH LLC Units. JEH LLC intends to use those net proceeds to repay outstanding borrowings under its senior secured revolving credit facility ($445 million outstanding at June 30, 2013, excluding outstanding letters of credit totaling $350,000). No material amounts of other funds will be used to pay down any of JEH LLC's indebtedness. Our senior secured revolving credit facility matures on November 5, 2017 and bears interest at a variable rate, which was approximately 3.32% per annum as of December 31, 2012. Approximately $130 million of the outstanding borrowings under our senior secured revolving credit facility was incurred to fund a portion of the purchase price of the Chalker acquisition. While we do not currently have any plans to borrow additional amounts under our senior secured credit facility to repay other borrowings, we may at any time reborrow amounts repaid thereunder.
Affiliates of certain of the underwriters are lenders under our senior secured revolving credit facility and, accordingly, will receive a portion of the net proceeds of this offering. See "Underwriting (conflicts of interest)."
If the underwriters exercise their option to purchase additional shares of our Class A common stock, we intend to use the proceeds from the sale of such shares to purchase up to 2,100,000 JEH LLC Units from Metalmark Capital and Wells Fargo at a purchase price equal to the public offering price of the Class A common stock offered hereby less underwriting discounts and commissions. In this case, an equivalent number of shares of Class B common stock will be cancelled. To the extent the underwriters exercise their option to purchase additional shares of our Class A common stock, and Metalmark Capital or Wells Fargo elect not to exercise their right to exchange a corresponding number of JEH LLC Units, we intend to use any remaining proceeds for general corporate purposes.
A $1.00 increase or decrease in the assumed initial public offering price of $18.00 per share would cause the net proceeds from this offering, after deducting the underwriting discounts and commissions and estimated offering expenses payable by us, to increase or decrease, respectively, by approximately $13.1 million. If the proceeds increase due to a higher initial public offering price, we would use the additional net proceeds to pay down additional indebtedness under our senior secured revolving credit facility. If the proceeds decrease due to a lower initial public offering price, then we would reduce by a corresponding amount the net proceeds directed to the repayment of outstanding indebtedness under our senior secured revolving credit facility.
60
We do not anticipate declaring or paying, any cash dividends to holders of our Class A common stock in the foreseeable future. We currently intend to retain future earnings, if any, to finance the growth of our business. Our future dividend policy is within the discretion of our board of directors and will depend upon then existing conditions, including our results of operations, financial condition, capital requirements, investment opportunities statutory restrictions on our ability to pay dividends and other factors our board of directors may deem relevant. In addition, our senior secured revolving credit facility and our second lien term loan facility prohibit us from paying dividends.
61
The following table sets forth our cash and cash equivalents and capitalization as of March 31, 2013:
- •
- on an actual basis; and
- •
- on an as adjusted basis to give effect to the transactions under "Corporate reorganization" that will occur simultaneously with the closing of this offering, and the application of the net proceeds from this offering as set forth under "Use of proceeds," assuming an initial public offering price of $18.00 per share (the midpoint of the range set forth on the cover of this prospectus).
This table is derived from, should be read in conjunction with and is qualified in its entirety by reference to, our historical financial statements and the accompanying notes included elsewhere in this prospectus. You should also read this table in conjunction with "Management's discussion and analysis of financial condition and results of operations."
| |
As of March 31, 2013 | ||||||
|---|---|---|---|---|---|---|---|
| |
Actual |
As adjusted |
|||||
| |
(in thousands) |
||||||
Cash and cash equivalents |
$ | 16,804 | $ | 16,804 | |||
Long-term debt(1) |
$ | 605,000 | $ | 372,750 | |||
Members' equity/stockholders' equity: |
|||||||
Members' equity |
|||||||
Class A preferred units; 14,250,000 units authorized, issued and outstanding |
205,468 | ||||||
Class B preferred units; 1,500,000 units authorized, issued and outstanding |
21,628 | ||||||
Class C preferred units; 8,500,000 units authorized, issued and outstanding |
122,561 | ||||||
Common units; 4,500,000 units authorized, issued and outstanding |
64,885 | ||||||
Management units; 3,194,444 units authorized, issued and outstanding |
14,115 | ||||||
Stockholders' equity |
|||||||
Class A common stock, $0.001 par value; no shares authorized, issued and outstanding (actual); 600,000,000 shares authorized (as adjusted); 14,000,000 shares issued and outstanding (as adjusted) |
14 | ||||||
Class B common stock, $0.001 par value; no shares authorized, issued and outstanding (actual); 150,000,000 shares authorized (as adjusted); 36,836,333 shares issued and outstanding (as adjusted) |
37 | ||||||
Additional paid-in capital |
660,856 | ||||||
Retained earnings |
0 | ||||||
Total members' / stockholders' equity |
428,657 | 660,907 | |||||
Total capitalization |
$ | 1,033,657 | $ | 1,033,657 | |||
(1) As of June 30, 2013, we had $445 million of indebtedness outstanding under our senior secured revolving credit facility and $160 million of indebtedness outstanding under our second lien term loan facility. After the application of the net proceeds from this offering, we expect to have $212.7 million outstanding under our senior secured revolving credit facility. See "Unaudited pro forma condensed consolidated financial statements."
62
Purchasers of the Class A common stock in this offering will experience immediate and substantial dilution in the net tangible book value per share of the Class A common stock for accounting purposes. Our net tangible book value as of March 31, 2013, after giving pro forma effect to the transactions described under "Corporate reorganization," was approximately $428.7 million, or $11.64 per share of Class B common stock. Pro forma net tangible book value per share is determined by dividing our pro forma tangible net worth (tangible assets less total liabilities) by the total number of outstanding shares of Class B common stock that will be outstanding immediately prior to the closing of this offering including giving effect to our corporate reorganization. After giving effect to the sale of the shares in this offering and further assuming the receipt of the estimated net proceeds (after deducting estimated discounts and expenses of this offering), our adjusted pro forma net tangible book value as of March 31, 2013 would have been approximately $661.9 million, or $13.02 per share. This represents an immediate increase in the net tangible book value of $1.38 per share to our existing stockholders and an immediate dilution (i.e., the difference between the offering price and the adjusted pro forma net tangible book value after this offering) to new investors purchasing shares in this offering of $4.98 per share. The following table illustrates the per share dilution to new investors purchasing shares in this offering:
Assumed initial public offering price per share |
$ | 18.00 | |||||
Pro forma net tangible book value per share as of March 31, 2013 (after giving effect to our corporate reorganization) |
$ | 11.64 | |||||
Increase per share attributable to new investors in this offering |
1.38 | ||||||
As adjusted pro forma net tangible book value per share after giving effect to our corporate reorganization and this offering |
13.02 | ||||||
Dilution in pro forma net tangible book value per share to new investors in this offering |
$ | 4.98 | |||||
The following table summarizes, on an adjusted pro forma basis as of March 31, 2013, the total number of shares of Class A and Class B common stock owned by existing stockholders and to be owned by new investors, the total consideration paid, and the average price per share paid by our existing stockholders and to be paid by new investors in this offering at $18.00, the midpoint of the range of the initial public offering prices set forth on the cover page of this prospectus, calculated before deduction of estimated underwriting discounts and commissions:
| |
Shares acquired | Total consideration | Average price per share |
|||||||||||||
|---|---|---|---|---|---|---|---|---|---|---|---|---|---|---|---|---|
| |
Number |
Percent |
Amount |
Percent |
||||||||||||
Existing stockholders |
36,836 | 72.5% | $ | 287,500 | 53.3% | $ | 7.80 | |||||||||
New investors |
14,000 | 27.5% | 252,000 | 46.7% | 18.00 | |||||||||||
Total |
50,836 | 100.0% | $ | 539,500 | 100.0% | $ | 10.61 | |||||||||
63
Selected historical and unaudited pro forma consolidated financial data
Set forth below is our selected historical consolidated financial data for the years ended December 31, 2010, 2011 and 2012 and the three months ended March 31, 2012 and 2013, and unaudited pro forma financial information giving effect to the Chalker acquisition for the period indicated. The selected historical financial data as of December 31, 2010, 2011 and 2012 is derived from our historical consolidated financial statements that are included elsewhere in this prospectus. The summary historical financial data as of March 31, 2012 and 2013 is derived from the unaudited financial statements of the company. The selected unaudited pro forma financial data as of and for the three months ended March 31, 2012 and 2013 and for the year ended December 31, 2012 is derived from the unaudited pro forma condensed consolidated financial statements included elsewhere in this prospectus and gives effect to the Chalker acquisition as if it had occurred on January 1, 2012. There have been no pro forma adjustments made to the summary unaudited pro forma condensed consolidated financial data presented below to give effect to the reorganization and offering transactions described in "Organizational structure." The unaudited pro forma financial information, while helpful in illustrating the financial characteristics of the consolidated company under one set of assumptions, does not reflect the impact of possible revenue enhancements, expense efficiencies and asset dispositions, among other factors, that may result as a consequence of the acquisition and, accordingly, does not attempt to predict or suggest future results. It also does not necessarily reflect what the historical results of the consolidated company would have been had the acquisition occurred prior to these periods.
For further information that will help you better understand the summary financial data, you should read this financial data in conjunction with "Management's discussion and analysis of financial condition and results of operations," and the historical consolidated financial statements and the unaudited pro forma financial statements and related notes included elsewhere in this prospectus. Our historical results of operations are not necessarily indicative of results to be expected for any future periods.
64
| |
|
|
|
|
|
Pro forma | |||||||||||||||
|---|---|---|---|---|---|---|---|---|---|---|---|---|---|---|---|---|---|---|---|---|---|
| |
|
|
|
Three months ended March 31, |
|||||||||||||||||
| |
Year ended December 31, | Year ended December 31, 2012 |
Three months ended March 31, 2013 |
||||||||||||||||||
| |
2010 |
2011 |
2012 |
2012 |
2013 |
||||||||||||||||
| |
|
|
|
(unaudited) |
(unaudited) |
||||||||||||||||
Statement of operations data (dollars in thousands): |
|||||||||||||||||||||
Operating revenues: |
|||||||||||||||||||||
Oil and gas sales |
$ | 97,523 | $ | 167,261 | $ | 148,967 | $ | 42,517 | $ | 55,259 | $ | 193,838 | $ | 55,259 | |||||||
Other revenues |
933 | 1,022 | 847 | 280 | 221 | 847 | 221 | ||||||||||||||
Total |
98,456 | 168,283 | 149,814 | 42,797 | 55,480 | 194,685 | 55,480 | ||||||||||||||
Operating costs and expenses: |
|||||||||||||||||||||
Lease operating expense |
16,296 | 21,548 | 23,097 | 5,528 | 5,345 | 24,672 | 5,345 | ||||||||||||||
Production tax expense |
2,206 | 5,333 | 5,583 | 1,593 | 2,452 | 7,913 | 2,452 | ||||||||||||||
Exploration costs |
4,208 | 780 | 356 | 74 | 126 | 356 | 126 | ||||||||||||||
Depreciation, depletion and amortization |
48,008 | 68,906 | 80,709 | 18,773 | 25,101 | 92,810 | 25,101 | ||||||||||||||
Impairment expense |
10,727 | 31,970 | 18,821 | 18 | — | 18,821 | — | ||||||||||||||
Accretion expense |
490 | 413 | 533 | 146 | 97 | 606 | 97 | ||||||||||||||
General and administrative expense |
11,423 | 16,679 | 15,875 | 3,676 | 4,312 | 15,576 | 4,203 | ||||||||||||||
Total costs and expenses |
93,358 | 145,629 | 144,974 | 29,808 | 37,433 | 160,754 | 37,324 | ||||||||||||||
Operating income |
5,098 | 22,654 | 4,840 | 12,989 | 18,047 | 33,931 | 18,156 | ||||||||||||||
Other income (expenses): |
|||||||||||||||||||||
Interest expense |
(12,575) | (21,190) | (24,714) | (6,601) | (7,980) | (25,928) | (6,518) | ||||||||||||||
Net gain (loss) on commodity derivatives |
23,758 | 34,490 | 16,684 | 7,737 | (11,383) | 16,684 | (11,383) | ||||||||||||||
Gain on bargain purchase |
— | 26,208 | — | — | — | — | — | ||||||||||||||
Gain (loss) on sale of assets |
8,644 | (859) | 1,162 | 1,429 | 70 | 1,162 | 70 | ||||||||||||||
Total other income (expense) |
19,827 | 38,649 | (6,868) | 2,565 | (19,293) | (8,082) | (17,831) | ||||||||||||||
Income before income taxes |
24,925 | 61,303 | (2,028) | 15,554 | (1,246) | 25,849 | 325 | ||||||||||||||
Provision for income taxes |
145 | 173 | 473 | 111 | (1) | 2,981 | 30 | ||||||||||||||
Net income (loss) |
$ | 24,780 | $ | 61,130 | $ | (2,501) | $ | 15,443 | $ | (1,245) | $ | 22,868 | $ | 295 | |||||||
Net income attributable to non-controlling interest |
17,325 | 223 | |||||||||||||||||||
Net income attributable to Jones Energy, Inc. |
$ | 5,543 | $ | 72 | |||||||||||||||||
Earnings per share |
$ | 0.34 | $ | 0.004 | |||||||||||||||||
Other supplementary data: |
|||||||||||||||||||||
Adjusted EBITDAX(1) |
$ | 73,992 | $ | 127,657 | $ | 135,385 | $ | 37,284 | $ | 47,278 | $ | 176,650 | $ | 47,387 | |||||||
(1) Adjusted EBITDAX is a non-GAAP financial measure. For a definition of Adjusted EBITDAX and a reconciliation of Adjusted EBITDAX to our net income, see "—Non-GAAP financial measure" below.
| |
Year ended December 31, | Three months ended March 31, | ||||||||||||||
|---|---|---|---|---|---|---|---|---|---|---|---|---|---|---|---|---|
| |
2010 |
2011 |
2012 |
2012 |
2013 |
|||||||||||
| |
|
|
|
(unaudited) |
||||||||||||
Statement of cash flow data (dollars in thousands) |
||||||||||||||||
Net cash flow provided by operating activities |
$ | 44,624 | $ | 120,217 | $ | 84,550 | $ | 26,961 | $ | 30,996 | ||||||
Net cash used in investing activities |
(90,785 | ) | (318,963 | ) | (337,636 | ) | (21,424 | ) | (32,893 | ) | ||||||
Net cash provided by financing activities |
49,200 | 186,322 | 270,676 | 3,000 | (5,025 | ) | ||||||||||
Net increase (decrease) in cash |
$ | 3,039 | $ | (12,424 | ) | $ | 17,590 | $ | 8,537 | $ | (6,922 | ) | ||||
65
| |
As of December 31, | As of March 31, | ||||||||||||||
|---|---|---|---|---|---|---|---|---|---|---|---|---|---|---|---|---|
| |
2010 |
2011 |
2012 |
2012 |
2013 |
|||||||||||
| |
|
|
|
(unaudited) |
||||||||||||
Balance sheet data (dollars in thousands): |
||||||||||||||||
Cash and cash equivalents |
$ | 18,560 | $ | 6,136 | $ | 23,726 | $ | 14,673 | $ | 16,804 | ||||||
Other current assets |
49,742 | 88,546 | 74,886 | 79,318 | 75,337 | |||||||||||
Total current assets |
68,302 | 94,682 | 98,612 | 93,991 | 92,141 | |||||||||||
Property and equipment, net |
495,613 | 743,575 | 1,010,742 | 745,411 | 1,029,501 | |||||||||||
Other long-term assets |
21,379 | 42,878 | 41,332 | 43,169 | 36,170 | |||||||||||
Total assets |
$ | 585,294 | $ | 881,135 | $ | 1,150,686 | $ | 882,571 | $ | 1,157,812 | ||||||
Current liabilities |
$ | 60,938 | $ | 107,689 | $ | 92,039 | $ | 87,267 | $ | 107,674 | ||||||
Long-term debt |
225,000 | 415,000 | 610,000 | 418,000 | 605,000 | |||||||||||
Other long-term liabilities |
14,907 | 11,733 | 18,865 | 15,007 | 16,481 | |||||||||||
Total members' capital |
284,449 | 346,713 | 429,782 | 362,297 | 428,657 | |||||||||||
Total liabilities and members' capital |
$ | 585,294 | $ | 881,135 | $ | 1,150,686 | $ | 882,571 | $ | 1,157,812 | ||||||
Non-GAAP financial measure
Adjusted EBITDAX is a supplemental non-GAAP financial measure that is used by management and external users of our consolidated financial statements, such as industry analysts, investors, lenders and rating agencies.
We define Adjusted EBITDAX as earnings before interest expense, income taxes, depreciation, depletion and amortization, exploration expense, gains and losses from derivatives less the current period settlements of matured derivative contracts and the other items described below. Adjusted EBITDAX is not a measure of net income as determined by United States generally accepted accounting principles, or GAAP. Management believes Adjusted EBITDAX is useful because it allows them to more effectively evaluate our operating performance and compare the results of our operations from period to period and against our peers without regard to our financing methods or capital structure. We exclude the items listed above from net income in arriving at Adjusted EBITDAX because these amounts can vary substantially from company to company within our industry depending upon accounting methods and book values of assets, capital structures and the method by which the assets were acquired. Adjusted EBITDAX has limitations as an analytical tool and should not be considered as an alternative to, or more meaningful than, net income as determined in accordance with GAAP or as an indicator of our liquidity. Certain items excluded from Adjusted EBITDAX are significant components in understanding and assessing a company's financial performance, such as a company's cost of capital and tax structure, as well as the historical costs of depreciable assets. Our presentation of Adjusted EBITDAX should not be construed as an inference that our results will be unaffected by unusual or non-recurring items. Our computations of Adjusted EBITDAX may not be comparable to other similarly titled measures of other companies.
66
The following table sets forth a reconciliation of net income (loss) as determined in accordance with GAAP to Adjusted EBITDAX for the periods indicated:
| |
|
|
|
|
|
Pro forma | |||||||||||||||
|---|---|---|---|---|---|---|---|---|---|---|---|---|---|---|---|---|---|---|---|---|---|
| |
|
|
|
Three months ended March 31, |
|||||||||||||||||
| |
Year ended December 31, | Year ended December 31, 2012 |
Three months ended March 31, 2013 |
||||||||||||||||||
| |
2010 |
2011 |
2012 |
2012 |
2013 |
||||||||||||||||
| |
|
|
|
(unaudited) |
(unaudited) |
||||||||||||||||
Net income (loss) |
$ | 24,780 | $ | 61,130 | $ | (2,501) | $ | 15,443 | $ | (1,245) | $ | 22,868 | $ | 295 | |||||||
Interest expense (excluding amortization of deferred financing costs) |
10,610 | 18,250 | 21,170 | 5,718 | 7,316 | 22,992 | 5,748 | ||||||||||||||
Exploration expense (excluding geological and geophysical) |
3,429 | 478 | — | — | — | — | — | ||||||||||||||
Deferred taxes |
145 | 173 | 473 | 111 | (1) | 2,981 | 30 | ||||||||||||||
Amortization of deferred financing costs |
1,965 | 2,940 | 3,544 | 883 | 664 | 2,936 | 770 | ||||||||||||||
Depreciation and depletion |
48,008 | 68,906 | 80,709 | 18,773 | 25,101 | 92,810 | 25,101 | ||||||||||||||
Impairment of oil and natural gas properties |
10,727 | 31,970 | 18,821 | 18 | — | 18,821 | — | ||||||||||||||
Accretion expense |
490 | 413 | 533 | 146 | 97 | 606 | 97 | ||||||||||||||
Other non-cash charge |
390 | (59) | 129 | (25) | 165 | 129 | 165 | ||||||||||||||
Compensation expense |
— | 1,134 | 570 | 142 | 120 | 570 | 120 | ||||||||||||||
Bargain purchase |
— | (26,208) | — | — | — | — | — | ||||||||||||||
Net loss (gain) on derivative contracts |
(23,758) | (34,490) | (16,684) | (7,737) | 11,383 | (16,684) | 11,383 | ||||||||||||||
Current period settlements of matured derivative contracts(1) |
5,850 | 2,161 | 29,783 | 5,241 | 3,748 | 29,783 | 3,748 | ||||||||||||||
Loss (gain) on sales of assets |
(8,644) | 859 | (1,162) | (1,429) | (70) | (1,162) | (70) | ||||||||||||||
Adjusted EBITDAX |
$ | 73,992 | $ | 127,657 | $ | 135,385 | $ | 37,284 | $ | 47,278 | $ | 176,650 | $ | 47,387 | |||||||
(1) Current period settlements of matured derivative contracts are limited to cumulative gains and losses that have been reported in prior periods in accordance with GAAP and reflect settlement activity for all commodity derivatives that were settled during the respective periods, whether received or paid, but they do not include any amount representing the recovery of costs. Adjusted EBITDAX includes only the settled portion of derivative gains and losses in order to reflect only that activity that has occurred and for which either the cash has been paid or received or can be accrued as due. Additionally, this calculation of Adjusted EBITDAX is consistent with the requirements for our debt covenant calculations.
67
Selected historical reserve and operating data
Proved reserves
The following table sets forth summary data with respect to our estimated net proved oil and natural gas reserves as of December 31, 2010, 2011 and 2012, which are based upon independent reserve reports of Cawley, Gillespie & Associates, Inc., or Cawley Gillespie, our independent reserve engineers. Cawley Gillespie's reports were prepared consistent with the rules and regulations of the SEC regarding oil and natural gas reserve reporting in effect during such period. Summary reports of our independent reserve engineers are included as exhibits to the registration statement of which this prospectus forms a part.
| |
At December 31, | |||||||||
|---|---|---|---|---|---|---|---|---|---|---|
| |
2010 |
2011 |
2012 |
|||||||
Reserve data: |
||||||||||
Estimated proved reserves: |
||||||||||
Oil (MBbls) |
5,991 | 7,440 | 12,540 | |||||||
Natural gas (MMcf) |
108,634 | 244,579 | 228,080 | |||||||
NGLs (MBbls) |
9,953 | 34,606 | 34,746 | |||||||
Total estimated proved reserves (MBoe)(1) |
34,050 | 82,809 | 85,299 | |||||||
Estimated proved developed reserves: |
||||||||||
Oil (MBbls) |
2,646 | 2,535 | 4,262 | |||||||
Natural gas (MMcf) |
50,469 | 110,433 | 110,956 | |||||||
NGLs (MBbls) |
4,017 | 14,020 | 16,320 | |||||||
Total estimated proved developed reserves (MBoe)(1) |
15,075 | 34,961 | 39,075 | |||||||
Estimated proved undeveloped reserves: |
||||||||||
Oil (MBbls) |
3,345 | 4,905 | 8,278 | |||||||
Natural gas (MMcf) |
58,165 | 134,146 | 117,124 | |||||||
NGLs (MBbls) |
5,936 | 20,586 | 18,426 | |||||||
Total estimated proved undeveloped reserves (MBoe)(1) |
18,975 | 47,849 | 46,225 | |||||||
Standardized measure (in millions)(2) |
$ | 355 | $ | 916 | $ | 782 | ||||
(1) One Boe is equal to six Mcf of natural gas or one Bbl of oil or NGLs based on an approximate energy equivalency. This is a physical correlation and does not reflect a value or price relationship between the commodities.
(2) Standardized measure is calculated in accordance with Statement of Financial Accounting Standards No. 69 Disclosures About Oil and Gas Producing Activities, as codified in ASC Topic 932, Extractive Activities—Oil and Gas. We were a limited liability company and were not subject to entity-level taxation during the periods presented except for the Texas margin tax. Accordingly, standardized measure for historical periods was not reduced for income taxes. However, upon consummation of this offering, we will be a corporation subject to entity-level taxation.
The following table sets forth the benchmark prices used to determine our estimated proved reserves from proved oil and natural gas reserves for the periods indicated.
| |
At December 31, | |||||||||
|---|---|---|---|---|---|---|---|---|---|---|
| |
2010 |
2011 |
2012 |
|||||||
Oil, natural gas and NGLs prices: |
||||||||||
Oil (per Bbl)(1) |
$ | 79.43 | $ | 96.19 | $ | 94.71 | ||||
Natural gas (per MMBtu)(3) |
4.37 | 4.12 | 2.76 | |||||||
NGLs (per Bbl)(2) |
38.72 | 47.26 | 31.27 | |||||||
(1) Benchmark prices for oil at December 31, 2010, 2011 and 2012 reflect the unweighted arithmetic average first-day-of-the-month prices for the prior 12 months, using WTI Cushing posted prices. These prices were utilized in the December 31 2010, 2011 and 2012 reserve reports prepared by Cawley Gillespie and are adjusted by well for content, quality, transportation fees, geographical differentials, marketing bonuses or
68
deductions and other factors affecting the price received at the wellhead. As of December 31, 2010, 2011 and 2012, the average realized prices for oil were $75.93, $92.04 and $90.74 per Bbl, respectively.
(2) Prices for NGLs at December 31, 2010, 2011 and 2012 in the table above reflect the average realized prices. Benchmark prices for NGLs vary depending on the composition of the NGL basket and current prices for the various components thereof, such as butane, ethane, propane, among others. Due to recent declines in ethane pricing and increases in natural gas prices, beginning in December 2012, purchasers of our Woodford production have been electing not to recover ethane from the natural gas stream and instead have been paying us based on the natural gas price for the ethane left in the gas stream. As a result of the increased energy content associated with the returned ethane and the absence of plant shrinkage, this ethane rejection has increased the incremental revenue and volumes that we receive for our natural gas product relative to what we would have received if the ethane was separately recovered, but has reduced physical barrels of liquid ethane that we are selling.
(3) Benchmark prices for natural gas at December 31, 2010, 2011 and 2012 reflect the unweighted arithmetic average first-day-of-the-month prices for the prior 12 months, using Henry Hub prices. These prices were utilized in the December 31 2010, 2011 and 2012 reserve reports prepared by Cawley Gillespie and are adjusted by well for content, quality, transportation fees, geographical differentials, marketing bonuses or deductions and other factors affecting the price received at the wellhead.
Operating data
The following table sets forth summary data regarding production volumes, average prices and average production costs associated with our sale of oil and natural gas for the periods indicated and on a pro forma basis to give effect to the Chalker acquisition as if it had occurred on January 1, 2012.
| |
|
|
|
|
|
Pro forma | |||||||||||||||
|---|---|---|---|---|---|---|---|---|---|---|---|---|---|---|---|---|---|---|---|---|---|
| |
|
|
|
Three months ended March 31, |
|||||||||||||||||
| |
Year ended December 31, | Year ended December 31, 2012 |
Three months ended March 31, 2013 |
||||||||||||||||||
| |
2010 |
2011 |
2012 |
2012 |
2013 |
||||||||||||||||
| |
|
|
|
(unaudited) |
(unaudited) |
||||||||||||||||
Production and operating data: |
|||||||||||||||||||||
Net production volumes(1): |
|||||||||||||||||||||
Oil (MBbls) |
593 | 811 | 746 | 194 | 312 | 1,146 | 312 | ||||||||||||||
Natural gas (MMcf) |
10,931 | 11,443 | 14,066 | 3,545 | 4,266 | 15,424 | 4,266 | ||||||||||||||
NGLs (MBbls)(2) |
— | 1,215 | 1,773 | 446 | 406 | 1,972 | 406 | ||||||||||||||
Total (MBoe) |
2,415 | 3,933 | 4,863 | 1,231 | 1,429 | 5,689 | 1,429 | ||||||||||||||
Average net production (Boe/d) |
6,616 | 10,776 | 13,288 | 13,527 | 15,878 | 15,543 | 15,878 | ||||||||||||||
Average sales price(3): |
|||||||||||||||||||||
Oil (per Bbl) |
$ | 73.79 | $ | 90.96 | $ | 89.71 | $ | 98.25 | $ | 88.38 | $ | 89.47 | $ | 88.38 | |||||||
Natural gas (per Mcf) |
4.92 | 3.49 | 2.17 | 2.09 | 3.00 | 2.18 | 3.00 | ||||||||||||||
NGLs (per Bbl)(2) |
— | 44.04 | 29.07 | 36.00 | 36.69 | 29.27 | 36.69 | ||||||||||||||
Combined (per Boe) realized |
$ | 40.38 | $ | 42.53 | $ | 30.63 | $ | 34.54 | $ | 38.67 | $ | 34.07 | $ | 38.67 | |||||||
Average unit costs per Boe: |
|||||||||||||||||||||
Lease operating expense |
$ | 6.44 | $ | 5.30 | $ | 4.56 | $ | 4.34 | $ | 3.15 | $ | 4.12 | $ | 3.15 | |||||||
Production and ad valorem tax expense |
1.22 | 1.53 | 1.34 | 1.44 | 2.30 | 1.60 | 2.30 | ||||||||||||||
Depreciation, depletion and amortization |
19.88 | 17.52 | 16.60 | 15.25 | 17.57 | 16.31 | 17.57 | ||||||||||||||
General and administrative expense |
4.73 | 4.24 | 3.26 | 2.99 | 3.02 | 2.74 | 2.94 | ||||||||||||||
(1) The
Coalgate Woodford field constituted approximately 41% of our estimated proved reserves as of December 31, 2012. Our production from the Coalgate Woodford field was 675 Mboe
and 1,529 MBoe for the years ended December 31, 2011 and 2012, respectively. The 2011 production was comprised of 10 MBbls of oil, 2,029 MMcf of natural gas and
327 MBbls NGLs. The 2012 production was comprised of 33 MBbls of oil, 4,357 MMcf of natural gas and 770 MBbls of NGLs. The Coalgate Woodford field was acquired in April 2011,
therefore we had no production from the field for the year ended December 31, 2010.
The Lipscomb SE field constituted approximately 21% of our estimated proved reserves as of December 31, 2012. Our production from the Lipscomb SE field was 36 MBoe for the year ended
December 31, 2012. The 2012 production was comprised of 17 MBbls of oil, 61 MMcf of natural gas and 9 MBbls of NGLs. The Lipscomb SE field was acquired in December 2012,
therefore we had no production from the field for the years ended December 31, 2010 and 2011.
(2) We did not track NGLs as a separate product category in 2010. The production of NGLs was included in total natural gas production for that year.
(3) Prices do not include the effects of derivative cash settlements.
69
Management's discussion and analysis of
financial condition and results of operations
The following discussion and analysis of our financial condition and results of operations should be read in conjunction with our consolidated financial statements and related notes appearing elsewhere in this prospectus. The following discussion contains "forward-looking statements" that are based on management's current expectations, estimates and projections about our business and operations, and that involve risks and uncertainties. Our actual results may differ materially from those currently anticipated and expressed in such forward-looking statements as a result of a number of factors, including those we discuss under "Risk factors," "Cautionary note regarding forward-looking statements" and elsewhere in this prospectus.
Overview
We are an independent oil and gas company engaged in the development, production and acquisition of oil and natural gas properties in the Anadarko and Arkoma basins of Texas and Oklahoma. Our CEO, Jonny Jones, founded our predecessor company in 1988 in continuation of his family's long history in the oil and gas business, which dates back to the 1920s. We have grown rapidly by leveraging our focus on low cost drilling and completions and our horizontal drilling expertise to develop our inventory and execute several strategic acquisitions. We have accumulated extensive knowledge and experience in developing the Anadarko and Arkoma basins, having concentrated our operations in the Anadarko basin for 25 years and applied our knowledge to the Arkoma basin since 2011. We have drilled over 580 total wells, including over 400 horizontal wells, since our formation and delivered compelling economic returns over various commodity price cycles. We optimize returns through a disciplined emphasis on controlling costs and promoting operational efficiencies, and we believe we are recognized as one of the lowest-cost drilling and completion operators in the Cleveland and Woodford shale formations.
As of December 31, 2012, our total estimated proved reserves were approximately 85 MMBoe, of which approximately 46% were classified as proved developed reserves. Approximately 55% of our total estimated proved reserves as of December 31, 2012 consisted of oil and NGLs, and 45% consisted of natural gas.
Factors that significantly affect our results of operations
Our profitability and ability to grow depend principally on the prices we obtain for our hydrocarbons, the volumes we produce and our ability to drill and complete wells at lower costs than other operators in our areas. Oil, natural gas and NGL prices historically have been volatile, may fluctuate widely in the future and are dependent on factors beyond our control, such as economic, political and regulatory developments, as well as competition from other sources of energy. Development of unconventional oil and gas in the U.S. continues to change the landscape of the onshore resource as well as pricing for the commodities. Henry Hub natural gas spot price decreased from an average of $8.86 MMBtu in 2008 to an average of $2.75 MMBtu in 2012 (and approximately $3.49 MMBtu for the first quarter of 2013) as the local domestic supply of natural gas increased substantially and the commodity became decoupled from the price of oil. Over the same time period, as the global economic environment improved, West Texas Intermediate spot prices for oil ranged from less than $40 per barrel to greater than $140 per barrel. In light of price volatility, we continually evaluate and adjust our drilling program to allocate capital to wells that we believe will provide the most attractive returns. Additionally, we hedge a substantial portion of our expected future oil and gas production to reduce our exposure to fluctuations in commodity price. See
70
"—Basis of presentation—Hedging" and "Quantitative and qualitative disclosures about market risk—Commodity price risk and hedges" below for discussion of our hedging and hedge positions.
NGLs are made up of ethane, propane, isobutane, butane and natural gasoline, all of which have different uses and different pricing characteristics. Realized monthly pricing for NGLs, which comprised 36% of our 2012 production and 28% of our production for the first quarter of 2013, has recently approached five-year lows, principally due to over supply in the market. Under our sale contracts in the Anadarko basin, we are generally paid market rates for the NGLs we produce, so the lower pricing has resulted in lower NGL revenues. However, under our sale contracts in the Arkoma Woodford, purchasers of NGLs have the ability to bypass the separate purchase of ethane below specified price thresholds and to purchase the ethane as part of a wet gas stream. Beginning in December 2012, purchasers have made this election and are paying wet natural gas prices for the gas stream produced from our Arkoma Woodford properties, which has resulted in increased natural gas production volumes and higher revenue from the ethane as an incremental energy component of net natural gas than we would receive were it sold separately at current prices. Although these elections can be made on a monthly basis and are entirely outside of our control, we anticipate, based on current forward price curves, that these purchasers will continue their elections to reject ethane and include it as part of the natural gas stream for the remainder of 2013, which would have the effect of increasing our natural gas production volumes and decreasing NGL production volumes, in each case, by the amount of ethane rejected. Ethane constituted approximately 50% and 12% of our Woodford NGL production as of December 31, 2012 and March 31, 2013, respectively, and approximately 39% of our NGL production outside of the Woodford shale formation as of those dates. A further or extended decline in NGL prices, or in oil or natural gas prices, could materially and adversely affect our financial position, our results of operations, the quantities of hydrocarbon reserves that we can economically produce and our access to capital.
Like other businesses engaged in the development and production of hydrocarbons, we face the challenge of natural production declines. As initial reservoir pressures are depleted, oil and natural gas production from any given well is expected to decline, and the unconventional formations we target, like other unconventional assets, experience relatively steep initial production declines. As a result, oil and natural gas exploration and production companies deplete their asset base with each unit of oil or natural gas they produce. Our future oil, natural gas and NGL reserves and production, and therefore our cash flows and income, are highly dependent on our success in efficiently developing our current reserves and economically finding or acquiring additional recoverable reserves. Our ability to develop and produce our current reserves and add additional reserves is driven by several factors, including:
- •
- success in the drilling of new wells;
- •
- the availability of attractive acquisition opportunities and our ability to execute them;
- •
- the activities and elections of third parties under our joint development agreements;
- •
- the availability of capital and the amount we invest in the leasing and development of properties and the drilling of
wells;
- •
- facility or equipment availability and unexpected delays or downtime, including delays imposed by or resulting from
compliance with regulatory requirements; and
- •
- the rate at which production volumes naturally decline.
We will maintain our focus on the capital investments necessary to produce our reserves as well as to add to our reserves through drilling, acquisition and joint development agreements. Our ability to make the
71
necessary capital expenditures is dependent on cash flow from operations, as well as our ability to obtain additional debt and equity financing. That ability can be limited by many factors, including the cost of such capital and operational considerations.
We conduct a substantial portion of our operations through joint development agreements with third parties. If we do not meet our obligation to drill the minimum number of wells specified in a joint development agreement, we will lose the right to continue to develop the undeveloped acreage covered by the agreement, which would result in the loss of any proved undeveloped reserves attributable to such undeveloped acreage. For example, pursuant to the terms of our existing joint development agreement with Southridge, we are obligated to drill 20 additional wells prior to October 31, 2013 in order to continue to earn an interest in future wells and acreage. We currently do not have any rigs running on this acreage and intend to focus our drilling capital budget on drilling locations in the Cleveland formation and elsewhere in the Woodford shale formation where we believe opportunities for better well-level economics are present, based, among other factors, on type curve analysis we performed this year on recently-completed Southridge wells. As a result, if we are unable to obtain an extension beyond October 31, 2013 or negotiate an alternative arrangement with Southridge, we would not expect to meet our obligation to drill the minimum number of wells within the deadline currently specified in the Southridge agreement. We have been in discussions with Southridge for this purpose and proposed an extension and modified arrangement by which we would develop the subject properties within 12 to 18 months. We cannot predict whether a mutually acceptable extension or amendment can be reached before October 31, 2013, or at all. If we do not obtain an extension or amendment and the 20 well commitment is not timely satisfied, we would, as of October 31, 2013, lose the right to continue to develop approximately 11,517 gross (3,310 net) acres in the Woodford shale formation, including approximately 15.5 MMBoe of proved undeveloped reserves attributable to such acreage (representing approximately 18% of our proved reserves and approximately 7% of our standardized measure as of December 31, 2012) that were included in our estimated proved reserves as of December 31, 2012. We estimate that we would incur an impairment charge of approximately $15 million in connection with such a reduction in our proved reserves. Please see "Risk Factors—If we do not fulfill our obligation to drill the minimum number of wells specified in our joint development agreements, we will lose the right to develop the undeveloped acreage associated with the agreement and any proved undeveloped reserves attributable to such undeveloped acreage."
Drilling and completing wells efficiently and at lower costs than other operators in our areas are key to our ability to deliver attractive economic returns from our operations, particularly in a challenging commodity price environment. A substantial portion of our cost efficiencies derive from our area-specific operational expertise and experience; relationships with vendors; focus on optimization of each part of the drilling and completion process; and geographic concentration, providing us with economies of scale and enabling us to drive cost savings and operational efficiencies. However, various factors that can impact the cost to drill and complete a well are beyond our control, including rig and service crew availability and pricing, mechanical difficulties and delays due to adverse weather conditions or other factors. Any delays in drilling, completing or connecting our new wells to gathering lines will negatively affect our production, which will have an adverse effect on our revenues and, as a result, cash flow from operations.
Activity of other oil and gas companies in or near our areas of operation is also a key driver of our business and profitability. A substantial portion of our operations are conducted under joint development agreements with third parties who farm out portions of their basin operations to us. Additionally, our strategy with new or prospective opportunities is to study the results of other operators and not to be a "first mover." Accordingly, our drilling inventory, profitability and growth depend on the activity levels and interest of other companies in our areas of operation.
72
Outlook
We intend to drill 93 gross wells in 2013, a 94% increase from the 48 gross wells we drilled in 2012. We have identified 2,372 additional gross drilling locations in our areas of operation for 2014 and beyond, which we believe will enable us to drill and develop our resource base for many years. We believe that the commodity pricing environment will remain challenging for 2013, particularly for natural gas and NGLs. However, we believe that our drilling and completion cost efficiencies and our existing drilling inventory position us well to continue generating attractive economic rates of return and to seek complementary acquisition and joint development opportunities.
Our 2012 capital expenditures, excluding acquisitions, totaled $122.1 million, during which we drilled 48 gross wells. We expect our total 2013 capital expenditure budget to be approximately $204.0 million, $180 million of which we expect to use to drill and complete 93 gross (54 net) wells. The remainder of the 2013 capital expenditure budget is expected to be devoted to seismic, leasing and other discretionary expenditures. The ultimate amount of capital we will expend may fluctuate materially based on market conditions, the economic returns being realized and the success of our drilling results as the year progresses. Please see "—Liquidity and capital resources." Assuming current market conditions and drilling success rates comparable to our historical performance, we believe we will be able to fund substantially all of our 2013 budgeted capital expenditures with our cash flow from operations. We currently expect to allocate our 2013 capital expenditure budget as follows:
| |
2013 capital expenditure budget |
Wells |
|||||
|---|---|---|---|---|---|---|---|
| |
(in thousands) |
(gross/net) |
|||||
Drilling and completion: |
|||||||
Cleveland |
$ | 148,900 | 62/45 | ||||
Woodford |
22,700 | 20/8 | |||||
Other drilling |
8,100 | 11/1 | |||||
Other activities |
24,300 | — | |||||
Total |
$ | 204,000 | 93/54 | ||||
Basis of presentation
We consider and report all of our operations as one segment.
Sources of our revenues
We derive our revenue from the production and sale of oil, natural gas and NGLs. Our revenues are a function of oil, natural gas, and NGL production volumes sold and average sales prices received for those volumes. We recognize revenues when the product is delivered at a fixed or determinable price, title has transferred and collectability is reasonably assured and evidenced by a contract. Our revenues do not include the effects of our hedging activities and may vary substantially from period to period as a result of changes in production volumes or commodity prices.
Hedging
Due to the inherent volatility in oil and gas prices, we use commodity derivative instruments, such as collars, swaps and puts to hedge price risk associated with a significant portion of our anticipated oil,
73
natural gas and NGL production. These instruments allow us to reduce, but not eliminate, the potential effects of variability in cash flow from operations due to fluctuations in commodity prices. The instruments provide only partial price protection against declines in oil and gas prices, and may partially limit our potential gains from future increases in prices. None of these instruments are used for trading purposes. We do not speculate on commodity prices but rather attempt to hedge physical production by individual hydrocarbon product in order to protect returns. The only counterparties to our derivatives are current or former lenders under our senior secured revolving credit facility and potential hedge positions are reviewed on a monthly basis. This eliminates potential margin calls in execution and limits our credit exposure to these particular lenders. We have not designated any of our derivative contracts as fair value or cash flow hedges. The unrealized changes in fair value of the contracts are included in net income. We record such derivative instruments as assets or liabilities in the statements of financial position. During the years ended December 31, 2012, 2011 and 2010, we recognized unrealized gains on commodity derivatives. During the year ended December 31, 2012, approximately 67% of our total production for oil, natural gas and NGLs was hedged. As of December 31, 2012, approximately 47% of our total forecasted production from proved reserves through 2017 was hedged, and the notional value of our hedge position was approximately $800 million. We do not anticipate any substantial changes in our hedging policy.
Our open positions as of December 31, 2012 were as follows:
| |
Year ended December 31, | |||||||||||||||
|---|---|---|---|---|---|---|---|---|---|---|---|---|---|---|---|---|
| |
Year 2013 |
Year 2014 |
Year 2015 |
Year 2016 |
Year 2017 |
|||||||||||
Oil positions(1): |
||||||||||||||||
Swaps: |
||||||||||||||||
Hedged volume (MBbl) |
1,186 | 1,601 | 1,158 | 859 | 555 | |||||||||||
Weighted average price ($/Bbl) |
$ | 91.24 | $ | 90.94 | $ | 89.43 | $ | 87.84 | $ | 85.31 | ||||||
Natural gas positions(2): |
||||||||||||||||
Swaps: |
||||||||||||||||
Hedged volume (MMcf) |
12,270 | 11,610 | 9,073 | 7,220 | 5,850 | |||||||||||
Weighted average price ($/Mcf) |
$ | 4.89 | $ | 5.07 | $ | 5.04 | $ | 5.15 | $ | 4.55 | ||||||
NGL positions(3): |
||||||||||||||||
Swaps: |
||||||||||||||||
Hedged volume (MBbl) |
1,691 | 1,005 | 502 | 97 | 42 | |||||||||||
Weighted average price ($/Bbl) |
$ | 35.15 | $ | 27.47 | $ | 31.39 | $ | 75.35 | $ | 64.39 | ||||||
Basis positions(4): |
||||||||||||||||
Swaps: |
||||||||||||||||
Hedged volume (MMcf) |
8,620 | 4,930 | 4,350 | 1,000 | — | |||||||||||
Weighted average price ($/Mcf) |
$ | (0.28 | ) | $ | (0.34 | ) | $ | (0.33 | ) | $ | (0.28 | ) | — | |||
(1) The oil derivatives are settled based on the month's average daily NYMEX price of West Texas Intermediate Light Sweet Crude.
(2) The natural gas derivatives are settled based on the NYMEX gas futures price for the calculation period.
(3) The NGL derivatives are settled based on the month's average daily price of Mont Belvieu and Conway ethane, propane, isobutane, butane and natural gasoline.
(4) The basis swap derivatives are settled based on the differential between the NYMEX gas futures price and the ANR Pipeline Co. Oklahoma price, the CenterPoint Energy Gas Transmission Co. east price, the Natural Gas Pipeline Co. of America Texok zone price, the Northern Natural Gas Co. demarcation price or the Panhandle Eastern Pipe Line Co. Texas/Oklahoma price.
Principal components of our cost structure
Lease operating expenses. These are daily costs incurred to bring oil and natural gas out of the ground and to the market, together with the daily costs incurred to maintain our producing properties. Such costs
74
also include maintenance, repairs and workover expenses related to our oil and gas properties. Lease operating expenses include both a portion of costs that are fixed in nature, such as infrastructure costs, as well as variable costs resulting from additional well maintenance and production enhancements. As production increases, our average lease operating expense per barrel of oil equivalent is typically reduced because fixed costs do not increase proportionately with production.
Exploration. Exploration expense consists of geological and geophysical costs, seismic costs, amortization and impairment of unproved leasehold costs, and the costs to drill exploratory wells that do not find proved reserves.
Depreciation, depletion and amortization. Under the successful efforts accounting method that we employ, we capitalize all costs associated with our acquisition, successful exploration, and all development efforts within cost centers classified by producing field. We then systematically expense the costs in each field on a units-of-production basis based on proved oil and natural gas reserve quantities. We calculate depletion on (i) all capitalized costs, other than the cost of investments in unproved properties and major development projects for which proved reserves cannot yet be assigned, less accumulated amortization; and (ii) the estimated plugging and abandonment costs, net of estimated salvage values. We calculate depreciation on the cost of fixed assets related to our pipelines and other fixed assets over the estimated useful lives.
Impairment of oil and gas properties. This is the cost to reduce the carrying value of each field of proved oil and gas properties to no more than the fair value of the particular field.
Accretion of discount. Accretion of discounts are related to our obligation for retirement of oil and gas wells and facilities. We record these liabilities when we place the assets in service, using discounted present values of the estimated future obligation. We then record accretion of the liabilities as they approach maturity.
General and administrative. These are costs incurred for overhead, including payroll and benefits for our corporate staff, costs of maintaining our headquarters, costs of managing our production and development operations, audit and other fees for professional services and legal compliance.
Interest and other. The primary component of this line item is the interest paid to lenders. We finance a portion of our working capital requirements and capital expenditures with borrowings under our senior secured revolving credit facility and our second lien term loan facility. As a result, we incur interest expense that is affected by both fluctuations in interest rates and our financing decisions. This classification also includes the amortization of capitalized loan acquisition costs and bank fees associated with the debt and commitment fees on undrawn portions of our revolving credit facilities.
75
Results of operations
| |
|
|
|
Three months ended March 31, |
||||||||||||
|---|---|---|---|---|---|---|---|---|---|---|---|---|---|---|---|---|
| (in thousands except for production data, average sales prices and percentages) |
Year ended December 31, | |||||||||||||||
| 2010 |
2011 |
2012 |
2012 |
2013 |
||||||||||||
| |
|
|
|
(unaudited) |
||||||||||||
Summary financial information: |
||||||||||||||||
Revenues: |
||||||||||||||||
Oil |
$ | 43,759 | $ | 73,769 | $ | 66,922 | $ | 19,060 | $ | 27,575 | ||||||
Natural gas |
53,764 | 39,983 | 30,502 | 7,400 | 12,788 | |||||||||||
NGLs(1) |
— | 53,509 | 51,543 | 16,057 | 14,896 | |||||||||||
Other revenues |
933 | 1,022 | 847 | 280 | 221 | |||||||||||
Total operating revenues |
98,456 | 168,283 | 149,814 | 42,797 | 55,480 | |||||||||||
Costs and expenses: |
||||||||||||||||
Lease operating expense |
16,296 | 21,548 | 23,097 | 5,528 | 5,345 | |||||||||||
Production expense |
2,206 | 5,333 | 5,583 | 1,593 | 2,452 | |||||||||||
Exploration costs |
4,208 | 780 | 356 | 74 | 126 | |||||||||||
Depreciation, depletion and amortization |
48,008 | 68,906 | 80,709 | 18,773 | 25,101 | |||||||||||
Impairment expense |
10,727 | 31,970 | 18,821 | 18 | — | |||||||||||
Accretion expense |
490 | 413 | 533 | 146 | 97 | |||||||||||
General and administrative expense |
11,423 | 16,679 | 15,875 | 3,676 | 4,312 | |||||||||||
Total costs and expenses |
93,358 | 145,629 | 144,974 | 29,808 | 37,433 | |||||||||||
Operating income |
5,098 | 22,654 | 4,840 | 12,989 | 18,047 | |||||||||||
Other income (expenses): |
||||||||||||||||
Interest expense |
(12,575 | ) | (21,190 | ) | (24,714 | ) | (6,601 | ) | (7,980 | ) | ||||||
Net gain (loss) on commodity derivatives |
23,758 | 34,490 | 16,684 | 7,737 | (11,383 | ) | ||||||||||
Gain on bargain purchase |
— | 26,208 | — | — | — | |||||||||||
Gain (loss) on sale of assets |
8,644 | (859 | ) | 1,162 | 1,429 | 70 | ||||||||||
Total other income (expense) |
19,827 | 38,649 | (6,868 | ) | 2,565 | (19,293 | ) | |||||||||
Income before income taxes |
24,925 | 61,303 | (2,028 | ) | 15,554 | (1,246 | ) | |||||||||
Provision for income taxes |
145 | 173 | 473 | 111 | (1 | ) | ||||||||||
Net income (loss) |
$ | 24,780 | $ | 61,130 | $ | (2,501 | ) | $ | 15,443 | (1,245 | ) | |||||
Net production volumes(2): |
||||||||||||||||
Oil (MBbls) |
593 | 811 | 746 | 194 | 312 | |||||||||||
Natural gas (MMcf) |
10,931 | 11,443 | 14,066 | 3,545 | 4,266 | |||||||||||
NGLs (MBbls)(1) |
— | 1,215 | 1,773 | 446 | 406 | |||||||||||
Total (MBoe) |
2,415 | 3,933 | 4,863 | 1,231 | 1,429 | |||||||||||
Average net (Boe/d) |
6,616 | 10,776 | 13,288 | 13,527 | 15,878 | |||||||||||
Average sales price(3): |
||||||||||||||||
Oil (per Bbl) |
$ | 73.79 | $ | 90.96 | $ | 89.71 | $ | 98.25 | $ | 88.38 | ||||||
Natural gas (per Mcf) |
4.92 | 3.49 | 2.17 | 2.09 | 3.00 | |||||||||||
NGLs (per Bbl)(1) |
— | 44.04 | 29.07 | 36.00 | 36.69 | |||||||||||
Combined (per Boe) realized |
$ | 40.38 | $ | 42.53 | $ | 30.63 | $ | 34.54 | $ | 38.67 | ||||||
Average costs (per BOE): |
||||||||||||||||
Lease operating expense |
$ | 6.44 | $ | 5.30 | $ | 4.56 | $ | 4.34 | $ | 3.15 | ||||||
Production and ad valorem tax expense |
1.22 | 1.53 | 1.34 | 1.44 | 2.30 | |||||||||||
Depreciation, depletion and amortization |
19.88 | 17.52 | 16.60 | 15.25 | 17.57 | |||||||||||
General and administrative expense |
4.73 | 4.24 | 3.26 | 2.99 | 3.02 | |||||||||||
(1) We did not track NGLs as a separate product category in 2010. The production of NGLs was included in total natural gas production for that year.
(2) The Coalgate Woodford field constituted approximately 41% of our estimated proved reserves as of December 31, 2012. Our production from the Coalgate Woodford field was 675 Mboe and 1,529 MBoe for the years ended December 31, 2011 and 2012, respectively. The 2011
76
production was comprised of 10 MBbls of oil, 2,029 MMcf of natural gas and 327 MBbls NGLs. The 2012 production was comprised of 33 MBbls of oil, 4,357 MMcf of natural gas and 770 MBbls of NGLs. The Coalgate Woodford field was acquired in April 2011, therefore we had no production from the field for the year ended December 31, 2010.
The Lipscomb SE field constituted approximately 21% of our estimated proved reserves as of December 31, 2012. Our production from the Lipscomb SE field was 36 MBoe for the year ended December 31, 2012. The 2012 production was comprised of 17 MBbls of oil, 61 MMcf of natural gas and 9 MBbls of NGLs. The Lipscomb SE field was acquired in December 2012, therefore we had no production from the field for the years ended December 31, 2010 and 2011.
(3) Prices do not include the effects of derivative cash settlements.
Three months ended March 31, 2013 compared to the three months ended March 31, 2012
Operating revenues
Oil and gas sales. Our oil and gas sales increased by $12.8 million (30.0%) to $55.3 million for the three months ended March 31, 2013, as compared to $42.5 million for the three months ended March 31, 2012. The revenue increase was primarily due to higher oil production volumes and higher natural gas volumes and prices. Crude oil production increased to 312 MBbls in the first quarter of 2013 from 194 MBbls in the first quarter of 2012, an increase of 60.8%, primarily resulting from wells acquired in the Chalker acquisition, which are characterized by higher oil content than our other acreage in the Cleveland formation. Natural gas production increased to 4,266 MMcf in the first quarter of 2013 from 3,545 MMcf in the first quarter of 2012, an increase of 20.3%, primarily attributable to new wells added through drilling and the Chalker acquisition. Realized average natural gas prices, excluding the effects of commodity derivative instruments, increased 43.5% in the first quarter of 2013 over the first quarter of 2012, increasing to $3.00 per Mcf from $2.09 per Mcf. NGL revenues decreased on higher pricing and a 9% decrease in volumes, which decrease was primarily caused by ethane produced in the Woodford shale formation being sold as natural gas due to rejection. See "—Factors that significantly affect our results of operations."
Costs and expenses
Lease operating. Our lease operating expense decreased by $0.2 million (3.6%) to $5.3 million for the three months ended March 31, 2013, as compared to $5.5 million for the three months ended March 31, 2012, despite an increase in activity, due to a decrease in workover expenses. Recurring operating expenses increased $0.6 million (14.6%) to $4.7 million for the three months ended March 31, 2013, as compared to $4.1 million for the three months ended March 31, 2012. This was offset by a decrease in workover expenses of $0.8 million to $0.6 million for the three months ended March 31, 2013, as compared to $1.4 million for the three months ended March 31, 2012. The increase in recurring lease operating expense was primarily due to an increase in the number of operated wells due to continued drilling activity and the Chalker acquisition. Workover expense was higher in the first quarter of 2012 due to work performed to get wells back on line after being shut in as a result of completion operations on adjacent wells. On a per unit basis, lease operating expense decreased $1.19 per Boe to $3.15 per Boe in the first quarter of 2013 from $4.34 per Boe in the first quarter of 2012, due to the acquisition of the Chalker wells, which increased the overall productivity of our properties, particularly related to barrels of oil produced. Lease operating expenses represented approximately 3.5% of oil and gas sales for the properties acquired in the Chalker acquisition as compared to approximately 15.5% for our historical properties. The difference is due to the fact that the wells acquired in the Chalker acquisition, most of which were drilled in 2011 and 2012, did not have significant workover expenses. Additionally, the Chalker properties are significantly more oil-rich than our other properties, and therefore generate a higher average revenue per well (and correspondingly lower lease operating expenses as a percentage thereof). We expect lease operating expenses as a percentage of oil and gas sales for the Chalker properties to increase in the future as workover expenses increase over the life of the wells.
77
Production taxes. Our production taxes increased by $0.9 million to $2.5 million for the three months ended March 31, 2013, as compared to $1.6 million for the three months ended March 31, 2012. Overall production taxes increased in conjunction with the increase in revenue; however, the average effective rate increased from 3.7% for the three months ended March 31, 2012 to 4.4% for the three months ended March 31, 2013. Production taxes were at a lower rate during the three months ended March 31, 2012 based on the expectation of receiving refunds from the State of Texas related to certain gas wells which qualified for a lower rate. As we began drilling wells acquired in the Chalker acquisition in the first quarter of 2013, which are typically classified as oil wells and as a result do not qualify for a reduced rate, the level of production tax refunds expected to be received related to our first quarter 2013 production decreased as compared to the production tax refunds accrued related to our first quarter 2012 production.
Depreciation, depletion and amortization. Depreciation, depletion and amortization increased by $6.3 million (33.5%) to $25.1 million for the three months ended March 31, 2013 as compared to $18.8 million for the three months ended March 31, 2012. This was primarily a result of continued drilling activity and the addition of the Chalker properties at the end of 2012, which increased our total proved reserve base in the Cleveland formation. On a per unit basis, depletion expense increased to $17.57 per Boe for the quarter ended March 31, 2013, compared to $15.25 per Boe for the quarter ended March 31, 2012.
General and administrative. Our general and administrative expenses increased $0.6 million (16.2%) to $4.3 million for the three months ended March 31, 2013, as compared to $3.7 million for the three months ended March 31, 2012. The increase was attributable to an increase in salaries and benefits due to an increase in headcount and accrued severance pay. On a per unit basis, general and administrative expense increased from $2.99 per Boe for the quarter ended March 31, 2012 to $3.02 per Boe for the quarter ended March 31, 2013.
Interest and other. Our interest and other financing expenses increased $1.4 million (21.2%) to $8.0 million for the three months ended March 31, 2013, as compared to $6.6 million for the three months ended March 31, 2012, primarily due to an increase of $189.7 million in average outstanding debt. The increase in average outstanding debt was used to finance the Chalker acquisition at the end of 2012 and to support continued drilling activity.
Gain (loss) on commodity derivatives. Our net gain (loss) on commodity derivatives decreased by $19.1 million to a loss of $11.4 million for the three months ended March 31, 2013, as compared to a gain of $7.7 million for the three months ended March 31, 2012. The 2013 net loss was primarily attributable to increases in both natural gas prices and crude oil prices. The 12-month forward prices at March 31, 2013 for natural gas averaged $4.17 per MMBtu, while the 12-month forward prices at December 31, 2012 averaged $3.54 per MMBtu. The 12-month forward prices at March 31, 2013 for crude oil averaged $96.21 per Bbl, while the 12-month forward prices at December 31, 2012 averaged $93.22 per Bbl. The 2012 net gain was principally due to a decrease in natural gas prices. The 12-month forward prices at March 31, 2012 for natural gas averaged $2.70 per MMBtu, while the 12-month forward prices at December 31, 2011 averaged $3.25 per MMBtu.
Gain on sales of assets. Our gain on sales of assets decreased from $1.4 million for the three months ended March 31, 2012 to $0.1 million for the three months ended March 31, 2013, due to the sale of properties in the North Barnett Shale during the first quarter of 2012 with no significant sales of properties in the first quarter of 2013.
78
Year ended December 31, 2012 compared to December 31, 2011
Operating revenues
Oil and gas sales. Our oil and gas sales decreased by $18.3 million (10.9%) to $149.0 million during the year ended December 31, 2012, as compared to $167.3 million for the year ended December 31, 2011. The revenue decrease was primarily due to lower commodity prices for natural gas and NGLs and lower oil production volumes. Realized average natural gas prices, without derivatives, decreased 37.9% during the year, falling to $2.17 per Mcf in 2012 from $3.49 per Mcf in 2011. Realized average NGL prices, without derivatives, decreased 34%, falling to $29.07 per Bbl in 2012 from $44.04 per Bbl in 2011. Oil production declined to 746 MBbls in 2012 from 811 MBbls, a decrease of 8%, as we pursued more wet gas prospects in 2012, increasing natural gas and NGL production by 22.9% and 45.9%, respectively.
Costs and expenses
Lease operating. Our lease operating expense increased by approximately $1.6 million (7.2%) to $23.1 million during the year ended December 31, 2012, as compared to $21.5 million for the year ended December 31, 2011. This increase was primarily due to an increase in the number of operated wells due to continued drilling activity. On a per unit basis, lease operating expense decreased $0.74 per Boe to $4.56 per Boe in 2012 from $5.30 per Boe in 2011, due to the emphasis on drilling liquids-rich prospects, which increased the overall productivity of our properties, as the increase in the production of natural gas and NGLs offset the decline in oil production.
Production taxes. Our production taxes increased by $0.3 million to $5.6 million during the year ended December 31, 2012, as compared to $5.3 million during the year ended December 31, 2011. Although total revenues decreased, the increase in production tax expense was primarily due to an increase in the backlog of wells at the Railroad Commission of Texas, or TRRC, waiting for approval of tax rate reductions. We currently estimate that we have approximately $1.9 million in pending tax reductions with the TRRC.
Exploration. Exploration expenses decreased by $0.4 million to $0.4 million during the year ended December 31, 2012, as compared to the $0.8 million during the year ended December 31, 2011. The decrease was primarily due to no dry hole cost charged to expense in 2012.
Depreciation, depletion and amortization. Depreciation, depletion and amortization increased by $11.8 million to $80.7 million for the year ended December 31, 2012, as compared to $68.9 million for the year ended December 31, 2011. This was primarily a result of an increase in production and continued drilling activity. On a per unit basis, depletion expense decreased to $16.60 per Boe for 2012, compared to $17.52 per Boe for 2011 as overall production increased.
Impairment of oil and gas properties. Our impairment of oil and gas properties decreased by $13.2 million to $18.8 million for the year ended December 31, 2012, as compared to $32.0 million for the year ended December 31, 2011. Our impairment charges relate to inactive fields and minor plays, which we are not currently developing. None of these charges were in the Cleveland or Woodford shale formations. In 2011, impairment charges related to these fields, along with a number of sales of minor properties, significantly reduced the remaining carrying values of these fields, thereby reducing further impairment.
General and administrative. Our general and administrative expenses decreased by $0.8 million to $15.9 million during the year ended December 31, 2012, as compared to $16.7 million during the year ended December 31, 2011. The decrease was attributable to decreases in stock compensation expenses and legal expenses in 2012 versus 2011, partially offset by an increase in staff. On a per unit basis, general and administrative expense decreased in 2012 to $3.26 per Boe from $4.24 per Boe, due to an increase in production without a commensurate rise in expense.
79
Interest and other. Our interest and other financing expenses increased by $3.5 million to $24.7 million during the year ended December 31, 2012, as compared to $21.2 million during the year ended December 31, 2011, primarily due to an $81.9 million increase in average outstanding debt for 2012 as compared to the prior year. The increase in average outstanding debt was primarily used to finance the Chalker acquisition and continued drilling activity.
Gain on commodity derivatives. Our net gain on commodity derivatives decreased by $17.8 million to $16.7 million during the year ended December 31, 2012, as compared to $34.5 million during the year ended December 31, 2011. The 2012 results include gains attributable to a drop in crude oil prices, compounded by an increase in oil production volumes hedged. The 12-month forward prices at December 31, 2012 for crude oil averaged $93.22 per Bbl, while the 12-month forward prices at December 31, 2011 averaged $98.77 per Bbl. These gains were reduced by higher gas prices, year over year. The 12-month forward prices at December 31, 2012 for natural gas averaged $3.54 per MMBtu, while the 12-month forward prices at December 31, 2011 averaged $3.25 per MMBtu. The 2011 net gain was primarily attributable to a decrease in natural gas prices. The 12-month forward prices at December 31, 2011 for natural gas averaged $3.25 per MMBtu, while the 12-month forward prices at December 31, 2010 averaged $4.55 per MMBtu.
Gain (loss) on sales of assets. Our gain (loss) on sales of assets increased from a loss of ($0.9 million) during the year ended December 31, 2011 to a gain of $1.2 million during the year ended December 31, 2012, primarily due to the sale in 2012 of properties in the North Barnett Shale at a gain compared to less significant sales of properties in 2011.
Year ended December 31, 2011 compared to December 31, 2010
Operating revenues
Oil and gas sales. Our oil and gas sales increased by approximately $69.8 million (71.5%) to $167.3 million during the year ended December 31, 2011, as compared to $97.5 million for the year ended December 31, 2010. The revenue increase was primarily due to the increase in production of oil, natural gas and NGLs to 3,933 MBoe in 2011 from 2,415 MBoe in 2010, an increase of 62.9%. This increase was attributable to continued drilling activity and the Southridge acquisition, as well as higher average oil prices, which rose to $90.96 per Bbl during the year ended December 31, 2011, from $73.79 per Bbl in the year ended December 31, 2010.
Operating costs and expenses
Lease operating. Our lease operating expense increased by $5.3 million (32.2%) to $21.5 million during the year ended December 31, 2011, as compared to $16.3 million for the year ended December 31, 2010. This increase was primarily due to the increase in production associated with continued drilling activity and the Southridge acquisition. On a per unit basis, lease operating expense decreased $1.14 per Boe to $5.30 per Boe in 2011 from $6.44 per Boe in 2010, due to increased productivity from new wells drilled.
Production taxes. Our production taxes increased by $3.1 million to $5.3 million during the year ended December 31, 2011, as compared to $2.2 million during the year ended December 31, 2010. This increase was primarily due to a large rebate received from the State of Texas in 2010 for previous years' retroactive tax rate reductions.
Exploration. Exploration expenses decreased by $3.4 million to $0.8 million during the year ended December 31, 2011, as compared to $4.2 million during the year ended December 31, 2010. The decrease was primarily due to the absence of any new exploratory drilling in 2011 versus the drilling of two unsuccessful exploratory wells in 2010. Exploration expense for 2011 includes expenses of $0.4 million related to our 2010 exploration drilling.
80
Depreciation, depletion and amortization. Depreciation, depletion and amortization increased by $20.9 million to $68.9 million for the year ended December 31, 2011, as compared to $48 million for the year ended December 31, 2010. This increase was primarily a result of an increase in production and capital expenditures associated with continued drilling activity. On a per unit basis, depletion expense decreased to $17.52 per Boe for 2011, compared to $19.88 per Boe for 2010, as the total proved developed reserve base increased 132% to 35.0 MBoe at December 31, 2011, from 15.1 MBoe at December 31, 2010.
Impairment of oil and gas properties. Our impairment of oil and gas properties expense increased by $21.2 million to $32.0 million for the year ended December 31, 2011, as compared to $10.7 million for the year ended December 31, 2010. This was primarily a result of the drop in market prices for natural gas, reducing our recoverable reserves. The impairment charges that resulted from the price drop in 2011 stemmed solely from our inactive fields outside our core operations in the Anadarko and Arkoma basins, principally the Atoka Lime, Biscuit Hill, and South Barnett Shale in which 84% of the 2011 impairment was recorded.
General and administrative. Our general and administrative expenses increased by $5.3 million to $16.7 million during the year ended December 31, 2011, as compared to $11.4 million during the year ended December 31, 2010, primarily due to an increase in staff and legal expenses in 2011. The increase in legal expenses was primarily attributable to a payment in connection with our early termination of a joint development agreement. On a per unit basis, general and administrative expense decreased in 2011 to $4.24 per Boe from $4.73 per Boe, due to increased production.
Interest and other. Our interest and other financing expenses increased by $8.6 million to $21.2 million during the year ended December 31, 2011, as compared to $12.6 million during the year ended December 31, 2010. This increase was primarily due to a $190 million increase in the year-end debt level to $415 million in 2011 from $225 million in 2010, primarily used to finance the Southridge acquisition and continued drilling activity.
Gain on commodity derivatives. Our net gain on commodity derivatives increased by $10.7 million to $34.5 million during the year ended December 31, 2011, as compared to $23.8 million during the year ended December 31, 2010. The 2011 net gain was primarily attributable to a decrease in natural gas prices. The 12-month forward prices at December 31, 2011 for natural gas averaged $3.25 per MMBtu, while the 12-month forward prices at December 31, 2010 averaged $4.55 per MMBtu. The 2010 net gain was principally due to a decrease in natural gas prices as well. The 12-month forward prices at December 31, 2010 for natural gas averaged $4.55 per MMBtu, while the 12-month forward prices at December 31, 2009 averaged $6.34 per MMBtu. The gain in 2011 was greater than in 2010 due to an increase in 2011 in natural gas production volumes hedged.
Gain on bargain purchase. Our gain on bargain purchase was $26.2 million during the year ended December 31, 2011. This gain was due to the fair market valuation of the Southridge acquisition, which included an allocation of $26.2 million to undeveloped properties that are earnable through future drilling under the joint development agreement with Southridge that we entered into in connection with the acquisition.
Gain (loss) on sales of assets. Our gain (loss) on sales of assets decreased from a gain of $8.6 million during the year ended December 31, 2010 to a loss of $0.9 million during the year ended December 31, 2011. Following the Crusader acquisition of more than 550 producing wells, we sold several fields of considerable value from the Crusader portfolio to large buyers in 2010 for total proceeds of $31.4 million for a gain of $8.7 million. In 2011, we sold several additional properties of smaller value from the Crusader acquisition to smaller operators for total proceeds of $4.3 million for a loss of $0.9 million.
81
Liquidity and capital resources
Historically, our primary sources of liquidity have been capital contributions from our members, borrowings under bank credit facilities and cash flows from operations. Our primary use of capital has been for the exploration, development and acquisition of oil and gas properties. As we pursue reserves and production growth, we continually consider which capital resources, including equity and debt financings, are available to meet our future financial obligations, planned capital expenditure activities and liquidity requirements. Our future ability to grow proved reserves and production will be highly dependent on the capital resources available to us. We continually monitor market conditions and consider taking on additional debt, equity or other sources of financing. We strive to maintain financial flexibility in order to maintain substantial borrowing capacity under our senior secured revolving credit facility, facilitate drilling on our undeveloped acreage positions and permit us to selectively expand our acreage positions. Depending on the timing and concentration of the development of our non-proved locations, we may be required to generate or raise significant amounts of capital to develop all of our potential drilling locations should we endeavor to do so. In the event our cash flows are materially less than anticipated and other sources of capital we historically have utilized are not available on acceptable terms, we may curtail our capital spending.
Our 2013 capital budget is primarily focused on the development of existing core areas through exploitation and development. Currently, we anticipate a capital budget of approximately $204.0 million for 2013, 95% of which we expect to be focused in our core Cleveland and Arkoma Woodford plays. However, the ultimate amount of capital we will expend may fluctuate materially based on market conditions, the economic returns being realized and the success of our drilling results as the year progresses. We expect to fund our 2013 capital budget predominantly with cash flows from operations. If necessary, we may also access capital through proceeds from potential asset dispositions, borrowings under our senior secured revolving credit facility and the future issuance of debt and/or equity securities.
The amount, timing and allocation of capital expenditures are largely discretionary and within management's control. If oil and gas prices decline to levels below our acceptable levels, or costs increase to levels above our acceptable levels, we may choose to defer a portion of our budgeted capital expenditures until later periods in order to achieve the desired balance between sources and uses of liquidity and prioritize capital projects that we believe have the highest expected returns and potential to generate near-term cash flow. We may also increase our capital expenditures significantly to take advantage of opportunities we consider to be attractive. Because leases covering less than 4% of our core property acreage are set to expire through December 31, 2013, and all but 58 PUD locations are held by production, we have the ability to materially decrease our drilling and recompletion budget in response to market conditions with low risk of losing significant acreage. We consistently monitor and adjust our projected capital expenditures in response to success or lack of success in drilling activities, changes in prices, availability of financing, drilling and acquisition costs, industry conditions, the timing of regulatory approvals, the availability of rigs, contractual obligations, internally generated cash flow and other factors both within and outside our control. With respect to obligations under our Tax Receivable Agreement, we have the ability to elect to defer payments (which would accrue interest) to the extent we have not received sufficient cash distributions from JEH LLC to satisfy our obligations thereunder, except in the case of an acceleration of payments thereunder occurring in connection with an early termination of the Tax Receivable Agreement or a change in control of our company. For further discussion regarding such an acceleration and its potential impact, please read "Risk factors—Risks relating to this offering and our Class A common stock—In certain cases, payments under the Tax Receivable Agreement may be accelerated and/or significantly exceed the actual benefits, if any, we realize in respect of the tax attributes subject to the Tax Receivable Agreement." If we were to defer substantial payment obligations on an ongoing basis
82
under the Tax Receivable Agreement, the accrual of those obligations would reduce the availability of cash for other purposes.
The following table summarizes our cash flows for the years ended December 31, 2010, 2011 and 2012 and for the three months ended March 31, 2012 and 2013:
| |
Year ended December 31, | Three months ended March 31, |
||||||||||||||
|---|---|---|---|---|---|---|---|---|---|---|---|---|---|---|---|---|
| |
2010 |
2011 |
2012 |
2012 |
2013 |
|||||||||||
| |
(in thousands) |
(unaudited) |
||||||||||||||
Net cash provided by operating activities |
$ | 44,624 | $ | 120,217 | $ | 84,550 | $ | 26,961 | $ | 30,996 | ||||||
Net cash used in investing activities |
(90,785 | ) | (318,963 | ) | (337,636 | ) | (21,424 | ) | (32,893 | ) | ||||||
Net cash provided by financing activities |
49,200 | 186,322 | 270,676 | 3,000 | (5,025 | ) | ||||||||||
Net increase (decrease) in cash |
$ | 3,039 | $ | (12,424 | ) | $ | 17,590 | $ | 8,537 | $ | (6,922 | ) | ||||
Cash flow provided by operating activities
Net cash provided by operating activities was $31.0 million during the three months ended March 31, 2013 as compared to cash provided by operations of $27.0 million during the three months ended March 31, 2012. The increase in operating cash flows in the first quarter of 2013 compared to the first quarter of 2012 was primarily due to a $12.7 million increase in revenues, partially offset by a $5.7 million reduction in working capital. The increase in revenue was primarily driven by a 61% increase in oil production volumes as a result of the Chalker acquisition in the fourth quarter of 2012 as well as higher natural gas volumes and prices. The reduction in net cash attributable to working capital changes stemmed from an increase in accounts payable due to a greater number of wells drilled in the first quarter of 2013 compared to the first quarter of 2012. Accounts payable increased at a greater rate than receivables from oil and gas sales, as completion of some of the wells that were drilled in the first quarter of 2013 was postponed until the second quarter.
Net cash provided by operating activities was $84.6 million during the year ended December 31, 2012 as compared to cash provided by operations of $120.2 million during the year ended December 31, 2011. The decrease in operating cash flows in 2012 compared to 2011 was primarily due to the decrease of $18.5 million in revenues year over year on relatively flat operating expenses. While production increased, the 37.9% drop in realized average natural gas prices and the 34.0% decline in realized average NGL prices primarily drove the decrease in revenues. The reduction in net cash provided by operating activities also stemmed from changes in working capital. Receivables from joint interest owners declined $13.1 million due to the Company retaining a higher working interest ownership in wells being drilled and a reduction in the number of active drilling rigs. In addition, oil and gas sales payable decreased $8.4 million.
Net cash provided by operating activities was $120.2 million during the year ended December 31, 2011 as compared to cash provided by operations of $44.6 million during the year ended December 31, 2010. The increase in operating cash flows in 2011 compared to 2010 was principally the increase in revenues of $69.8 million, partially offset by increased operating expenses of $8.4 million. The improvement in revenues is attributable to the increase in production associated with continued drilling activity and the Southridge acquisition, as well as a 23.3% increase in oil prices. The increase in net cash provided by operating activities was also due to changes in 2011 working capital. Oil and gas sales payable increased $39.3 million, while the associated receivables increased $15.8 million, reducing working capital by $23.5 million, due to higher revenues. Conversely, receivables from joint interest owners increased
83
$18.3 million, while trade accounts payable increased only $7.5 million, increasing working capital by $10.8 million, due to changes in average working interest ownership and the timing of owner payments.
Our operating cash flows are sensitive to a number of variables, the most significant of which is the volatility of oil and gas prices. For additional information on the impact of changing prices on our financial position, see "—Quantitative and qualitative disclosures about market risk".
Cash flow used in investing activities
We had net cash used in investing activities of $32.9 million during the three months ended March 31, 2013 as compared to cash used in investing of $21.4 million during the three months ended March 31, 2012. The increase in the first quarter of 2013 was primarily due to receipt of cash proceeds from the sale of North Barnett properties in the first quarter of 2012, with no meaningful sales of properties occurring in the first quarter of 2013. Additionally, capital expenditures increased from the first quarter of 2012 to the first quarter of 2013 due to an increase in drilling activity.
We had net cash used in investing activities of $337.6 million during the year ended December 31, 2012 as compared to cash used in investing of $319.0 million during the year ended December 31, 2011. The increase in cash used in investing activities was primarily related to the Chalker acquisition in 2012 which was larger than the Southridge acquisition in 2011. This incremental acquisition investment was partially offset by a decline in net drilling and equipment expenditures and an increase in gains realized through commodity derivatives in 2012.
We had net cash used in investing activities of $319.0 million during the year ended December 31, 2011 as compared to $90.8 million during the year ended December 31, 2010. The increase in cash used in investing activities was primarily related to the Southridge acquisition in 2011, an increase in net drilling and equipment expenditures, and a decline in the cash proceeds from sales of miscellaneous oil and gas properties. The investing activities in 2010 consisted of drilling and equipment expenditures and the purchase of additional mineral interests in certain of the Crusader properties, net of sales of oil and gas properties.
We expect our 2013 capital expenditure budget to be approximately $204.0 million, which is a 67% increase over the $122.1 million incurred for 2012. Expenditures for development and exploration of oil and gas properties are the primary use of our capital resources. Our capital budget may be adjusted as business conditions warrant. The amount, timing and allocation of capital expenditures is largely discretionary and within our control. If oil and natural gas prices decline or costs increase significantly, we could defer a significant portion of our budgeted capital expenditures until later periods to prioritize capital projects that we believe have the highest expected returns and potential to generate near-term cash flows. We routinely monitor and adjust our capital expenditures in response to changes in prices, availability of financing, drilling and acquisition costs, industry conditions, the timing of regulatory approvals, the availability of rigs, the degree of success in drilling activities, contractual obligations, internally generated cash flows and other factors both within and outside our control.
Cash flow provided by financing activities
Net cash used in financing activities was $5.0 million during the three months ended March 31, 2013 as compared to cash provided by financing of $3.0 million during the three months ended March 31, 2012. The decrease in cash flows provided by financing activities was primarily due to a $5.0 million repayment of debt in the first quarter of 2013 compared to net borrowings of $3.0 million in the first quarter of 2012.
Net cash provided by financing activities was $270.7 million during the year ended December 31, 2012 as compared to cash provided by financing of $186.3 million during the year ended December 31, 2011. The
84
increase in cash flows provided by financing activities was primarily due to an $85.0 million contribution of new equity capital by our existing owners for preferred units. Borrowings under our credit facility, net of repayments, remained relatively unchanged at $185.7 million in 2012 and $186.3 million in 2011.
Net cash provided by financing activities was $186.3 million during the year ended December 31, 2011 compared to cash provided by financing of $49.2 million during the year ended December 31, 2010. The increase in cash flows provided in financing activities was primarily due to the incremental debt incurred to purchase the Southridge properties.
Credit facilities
Senior secured revolving credit facility. JEH LLC has a $1 billion senior secured revolving credit with Wells Fargo Bank, N.A. as the administrative agent, and a syndicate of lenders. Availability under the senior secured revolving credit facility is subject to a borrowing base, which is currently $500 million. The senior secured revolving credit facility matures in November 2017. As of June 30, 2013 JEH LLC had borrowings of $445 million outstanding under the senior secured revolving credit facility.
The borrowing base under our senior secured revolving credit facility was redetermined by the lenders on June 12, 2013, which was deemed to be the scheduled redetermination scheduled for May 1, 2013, and will be redetermined semi-annually thereafter on February 1 and August 1 of each year. JEH LLC and the administrative agent (acting at the direction of lenders holding at least 662/3% of the outstanding loans and letter of credit obligations) may each request one unscheduled borrowing base redetermination between each scheduled redetermination. In addition, the lenders may elect to redetermine the borrowing base upon the occurrence of certain defaults under our material operating agreements or upon the cancellation or termination of certain of our joint development agreements. The borrowing base will also be reduced in certain circumstances as a result of our issuance of unsecured notes, our termination of certain hedging positions and our consummation of certain asset sales.
Interest on our senior secured revolving credit facility is calculated at a base rate (being at JEH LLC's option, either (i) the per annum rate appearing on Reuters Screen LIBOR01 Page, or the LIBO Rate, for the applicable interest period or (ii) the greatest of (x) the prime rate announced by Wells Fargo Bank, N.A., (y) the federal funds rate plus 0.50% and (z) the one-month adjusted LIBO Rate plus 1.00%, plus a margin ranging from 0.75% to 2.75% based on the actual amount borrowed compared to the borrowing amount and the base rate selected. JEH LLC is also required to pay a quarterly commitment fee on the unused portion of the aggregate commitments of the lenders, at a rate per annum of either 0.375% or 0.50%, depending on our utilization of the borrowing base.
Our senior secured revolving credit facility contains various covenants that, among other things, limit our ability to:
- •
- incur indebtedness;
- •
- grant liens on our assets;
- •
- pay dividends or distributions or redeem any of our equity interests, or prepay any of the second lien term loans;
- •
- make certain investments, loans and advances;
- •
- merge into or with or consolidate with any other person, or dispose of all or substantially all of its property to any
other person;
- •
- engage in certain asset dispositions;
85
- •
- enter into transactions with affiliates;
- •
- grant negative pledges or agree to restrict dividends or distributions from subsidiaries;
- •
- allow gas imbalances, take-or-pay or certain other prepayments with respect to oil and gas
properties; and
- •
- enter into certain derivative arrangements.
We are also required under our senior secured revolving credit facility to maintain the following financial ratios:
- •
- a total leverage ratio, consisting of consolidated debt to EBITDAX, of not greater than 4.00 to 1.00 as of the last day of
any fiscal quarter; and
- •
- a current ratio, consisting of consolidated current assets, including the unused amounts of the total commitments, to consolidated current liabilities, of not less than 1.0 to 1.0 as of the last day of any fiscal quarter.
We believe that we are in compliance with the terms of our senior secured revolving credit facility. If an event of default exists under the credit agreement, the lenders will be able to accelerate the obligations outstanding under the credit agreement and exercise other rights and remedies. Our senior secured revolving credit facility contains customary events of default, including a change of control, as defined in our senior secured revolving credit facility.
Second lien term loan facility. In addition, JEH LLC has a $160 million second lien term loan facility with Wells Fargo Energy Capital, Inc., as the administrative agent, and a syndicate of lenders. The second lien term loan facility matures in May 2018. JEH LLC currently has $160 million in loans outstanding under the second lien facility. An intercreditor agreement governs the relationship between the lenders under the senior secured revolving credit facility and the lenders under the second lien term loan facility.
The principal amount of the loans borrowed under the second lien term loan facility is due in full on the maturity date. Interest on our second lien term loan facility is calculated at a base rate (being, at JEH LLC's option, either (i) the LIBO Rate for the applicable interest period (but in any event not less than 2.00%) or (ii) the greatest of (x) the prime rate announced by Wells Fargo Bank, N.A., (y) the federal funds rate plus 0.50% and (z) the one-month adjusted LIBO Rate plus 1.00%, plus a margin of either 6.0% or 7.0% based on the base rate selected.
We are also required under our second lien term loan facility to maintain the following financial ratios:
- •
- a total leverage ratio, consisting of consolidated debt to EBITDAX, of not greater than 4.50 to 1.00 as of the last day of
any fiscal quarter;
- •
- a current ratio, consisting of consolidated current assets to consolidated current liabilities, of not less than 1.0 to
1.0 as of the last day of any fiscal quarter; and
- •
- a ratio, consisting of (i) the net present value, discounted at ten percent (10%) per annum, of the future net revenues expected to accrue from proved reserves during the remaining expected economic lives of such reserves to (ii) consolidated debt, of not less than 1.50 to 1.00, as of certain test dates.
Our second lien term loan facility contains various restrictive covenants that are similar to those in our senior secured revolving credit facility. We believe that we are in compliance with the terms of our second lien term loan facility. If an event of default exists under the second lien credit agreement, the lenders will
86
be able to accelerate the obligations outstanding under the second lien credit agreement and exercise other rights and remedies. Our second lien term loan facility contains events of default similar to those in our senior secured revolving credit facility together with certain cross-defaults with respect to our senior secured revolving credit facility.
Contractual obligations
The following table summarizes our contractual obligations as of December 31, 2012:
| |
Payments due by period | |||||||||||||||
|---|---|---|---|---|---|---|---|---|---|---|---|---|---|---|---|---|
| |
Total |
Less than 1 year |
1-3 years |
4-5 years |
Thereafter |
|||||||||||
| |
(dollars in thousands) |
|||||||||||||||
Long-term debt obligations |
$ | 610,000 | $ | — | $ | — | $ | 450,000 | $ | 160,000 | ||||||
Interest expense |
144,382 | 28,325 | 56,650 | 54,502 | 4,905 | |||||||||||
Drilling rig commitments |
3,505 | 3,505 | — | — | — | |||||||||||
Commodity derivative obligations |
11,692 | 4,035 | 5,285 | 2,372 | — | |||||||||||
Operating lease obligations |
2,111 | 558 | 969 | 584 | — | |||||||||||
Asset retirement obligations, discounted |
9,473 | 174 | 2,869 | 383 | 6,047 | |||||||||||
Total |
$ | 781,163 | $ | 36,597 | $ | 65,773 | $ | 507,841 | $ | 170,952 | ||||||
Contractual obligations excludes interest on our second lien term loan facility as the applicable interest rate is variable. See the description of this loan facility above.
Internal controls and procedures
In connection with past audits of our financial statements, our independent registered public accounting firm identified and reported adjustments to management. Certain of these adjustments were deemed to be the result of internal control deficiencies that constitute material weaknesses in our internal control over financial reporting. If one or more material weaknesses persist or if we fail to establish and maintain effective internal control over financial reporting, our ability to accurately report our financial results could be adversely affected.
We have not maintained an effective control environment in that the design and execution of our controls has not consistently resulted in effective review of our financial statements and supervision by appropriate individuals. The lack of adequate staffing levels resulted in insufficient time spent on review and approval of certain information used to prepare our financial statements. These control deficiencies, although varying in severity, contributed to the material weaknesses in the control environment noted by our independent registered public accounting firm.
In 2010 and 2011, we did not maintain effective controls to ensure that correct inputs and formulas in spreadsheets were used in our calculation of depreciation, depletion and amortization, or DD&A, expense. In 2012, the lack of effective controls over last-minute journal entries and use of final adjusted production data resulted in the misstatement of our DD&A. For each of these periods, effective controls were not adequately designed or consistently operating to ensure that key computations were properly reviewed before the amounts were recorded in our accounting records. The above identified control deficiencies resulted in audit adjustments to our consolidated financial statements during 2010, 2011, and 2012.
In December 2012, we were notified by the Oklahoma Tax Commission that sales tax had not been remitted on tangible property conveyed as part of the sale of a number of oil and gas properties. Due to the lack of
87
state tax expertise on our staff, we were unaware of the requirement to remit such a tax and had failed to file, albeit unintentionally. Consequently, tax expense for periods prior to 2012 was understated. Management is reviewing the internal control weakness related to this omission to determine the proper organizational structure in response.
Although remediation efforts are still in progress, management is taking steps to address the causes of our audit adjustments and to improve our internal control over financial reporting, including the implementation of new accounting processes and control procedures and the identification of gaps in our skills base and expertise of the staff required to meet the financial reporting requirements of a public company. Since July 2010, we have hired three accounting managers along with a number of degreed staff accountants. This team has enabled us to expedite our month-end close process, thereby facilitating the timely preparation of financial reports. Likewise, we strengthened our internal control environment through the addition of skilled accounting personnel. During 2013, we may hire incremental qualified staff as part of a comprehensive review of our internal controls and formalization of our review and approval processes.
We may identify additional control deficiencies, which could give rise to significant deficiencies and other material weaknesses in addition to the material weaknesses previously identified.
Upon becoming a public company, we will be required to comply with the SEC's rules implementing Section 302 of the Sarbanes-Oxley Act of 2002, which will require our management to certify financial and other information in our quarterly and annual reports and provide an annual management report on the effectiveness of our internal control over financial reporting. Beginning with our fiscal year ending December 31, 2014, we will be required to annually review and report on the effectiveness of our internal controls over financial reporting. To comply with the requirements of being a public company, we may need to upgrade our systems, including information technology, implement additional financial and management controls, enhance reporting systems and procedures, and hire additional accounting, finance, operations, IT and legal staff.
Further, our independent registered public accounting firm is not yet required to formally attest to the effectiveness of our internal controls over financial reporting. For as long as we remain an "emerging growth company" as defined in the JOBS Act, we are not required to provide an auditor's attestation report on management's assessment of the effectiveness of our system of internal control over financial reporting pursuant to Section 404 of the Sarbanes-Oxley Act. Once it is required to do so, our independent registered public accounting firm may issue a report that is adverse in the event it is not satisfied with the level at which our controls are documented, designed, operated or reviewed. Our remediation efforts may not enable us to remedy or avoid material weaknesses or significant deficiencies in the future.
Our efforts to develop and maintain our internal controls may not be successful, and we may be unable to maintain effective controls over our financial processes and reporting in the future and comply with the certification and reporting obligations under Sections 302 and 404 of the Sarbanes-Oxley Act. Further, our remediation efforts may not enable us to remedy or avoid material weaknesses or significant deficiencies in the future. Any failure to remediate deficiencies and to develop or maintain effective controls, or any difficulties encountered in our implementation or improvement of our internal controls over financial reporting could result in material misstatements that are not prevented or detected on a timely basis, which could potentially subject us to sanctions or investigations by the SEC, the NYSE or other regulatory authorities. Ineffective internal controls could also cause investors to lose confidence in our reported financial information.
Off-balance sheet arrangements
Currently, we do not have any off-balance sheet arrangements.
88
Inflation
General inflation in the United States has been relatively low in recent years, but the costs of oilfield services and equipment may increase with an increase in drilling activity or a scarcity of resources in the areas in which we operate. With the majority of drilling activity in the United States occurring on plays other than those that we operate in, we have not experienced a material impact on our results of operations for the periods presented above in this discussion and analysis. If service company capacity shifts to other plays, the lack of sufficient service capacity in our basins could also drive prices higher. The industry inflation factor published by the Council of Petroleum Accountants Societies each year was relatively stable for 2010 and 2011, but showed an increase of 6.1% in 2012 and an increase of 7.4% in the first quarter of 2013. This demonstrates the volatility of costs in our business and the ongoing exposure we have to cost increases.
Quantitative and qualitative disclosures about market risk
We are exposed to certain market risks that are inherent in our financial statements that arise in the normal course of business. We may enter into derivative instruments to manage or reduce market risk, but do not enter into derivative agreements for speculative purposes.
We do not designate these or future derivative instruments as hedges for accounting purposes. Accordingly, the changes in the fair value of these instruments are recognized currently in earnings.
Commodity price risk and hedges
Our principal market risk exposure is to prices for oil, natural gas and NGLs, which are inherently volatile. As such, future earnings are subject to change due to changes in these prices. Realized prices are primarily driven by the prevailing prices for oil and regional spot prices for natural gas and NGLs. We have used, and expect to continue to use, oil, natural gas and NGL derivative contracts to reduce our risk of changes in the prices of these commodities. Pursuant to our risk management policy, we engage in these activities as a hedging mechanism against price volatility associated with projected production levels.
The fair value of our oil, natural gas and NGL derivative contracts at December 31, 2012 was a net asset of $31.2 million.
As of December 31, 2012, we have hedged approximately 47% of our total forecasted production from proved reserves through 2017. For information regarding the terms of these hedges, please see "—Basis of presentation—Hedging" above. The production hedged thereby is consistent with the anticipated monthly production levels in the December 31, 2012 reserve report prepared by Cawley Gillespie, which is based on prices, costs and other assumptions required by SEC rules. Our actual production will vary from the amounts estimated in this reserve report, perhaps materially. Please read "Risk factors—Our estimated oil and natural gas reserve quantities and future production rates are based on many assumptions that may prove to be inaccurate. Any material inaccuracies in these reserve estimates or the underlying assumptions will materially affect the quantities and present value of our reserves."
Counterparty and customer credit risk
Joint interest receivables arise from billings to entities that own partial interests in the wells we operate. These entities participate in our wells primarily based on their ownership in leases on which we drill. We have limited ability to control participation in our wells. We are also subject to credit risk due to concentration of our oil and natural gas receivables with several significant customers. See "Business—Marketing and major customers" for further detail. The inability or failure of our significant customers to
89
meet their obligations to us or their insolvency or liquidation may adversely affect our financial results. In addition, our oil and natural gas derivative arrangements expose us to credit risk in the event of nonperformance by counterparties.
While we do not typically require our partners, customers and counterparties to post collateral and we do not have a formal process in place to evaluate and assess the credit standing of our partners or customers for oil and gas receivables and the counterparties on our derivative instruments, we do evaluate the credit standing of such parties as we deem appropriate under the circumstances. This evaluation may include reviewing a party's credit rating, latest financial information and, in the case of a customer with which we have receivables, their historical payment record, and undertaking the due diligence necessary to determine creditworthiness. The counterparties on our derivative instruments currently in place are lenders under our revolving credit facility with investment grade ratings. We are not permitted under the terms of our revolving credit facility to enter into derivative instruments with counterparties outside of the banks who are lenders under our revolving credit facility. As a result, any future derivative instruments we enter into will be with these or other lenders under our revolving credit facility who will also likely carry investment grade ratings.
Interest rate risk
We are subject to market risk exposure related to changes in interest rates on our indebtedness. The terms of our senior secured revolving credit facility and our second lien term loan provide for interest on borrowings at a floating rate equal to prime, LIBOR or federal funds rate plus margins ranging from 0.75% to 2.75% on the revolver and 6.0-7.0% on the term loan depending on the base rate used and the amount of the loan outstanding in relation to the borrowing base. During the year ended December 31, 2012, borrowings under our senior secured revolving credit facility and second lien term loan bore interest at a weighted average rate of 3.32% and 9.16%, respectively. An increase or decrease of 1% in the interest rate would have a corresponding decrease or increase in our net income (loss) of approximately $4.5 million annually, based on the $610 million outstanding in the aggregate under our revolving credit facility and second lien term loan as of December 31, 2012, and assuming no interest is capitalized. We intend to repay a portion of the outstanding borrowings under our revolving credit facility with the net proceeds from this offering.
Critical accounting policies and estimates
The discussion and analysis of our financial condition and results of operations are based upon our consolidated financial statements, which have been prepared in accordance with accounting principles generally accepted in the United States, or GAAP. As used herein, the following acronyms have the following meanings: "FASB" means the Financial Accounting Standards Board; the "Codification" refers to the Accounting Standards Codification, the collected accounting and reporting guidance maintained by the FASB; "ASC" means Accounting Standards Codification and is generally followed by a number indicating a particular section of the Codification; and "ASU" means Accounting Standards Update, followed by an identification number, which are the periodic updates made to the Codification by the FASB.
The preparation of our consolidated financial statements requires us to make estimates and assumptions that affect our reported results of operations and the amount of reported assets, liabilities and proved oil and natural gas reserves. Some accounting policies involve judgments and uncertainties to such an extent that there is reasonable likelihood that materially different amounts could have been reported under different conditions or if different assumptions had been used. Actual results may differ from the estimates and assumptions used in the preparation of our consolidated financial statements. Described below are the
90
most significant policies we apply in preparing our consolidated financial statements, some of which are subject to alternative treatments under GAAP. We also describe the most significant estimates and assumptions we make in applying these policies.
Use of estimates. The preparation of consolidated financial statements in conformity with GAAP requires management to make estimates and assumptions that affect the reported amounts of assets and liabilities and disclosure of contingent assets and liabilities at the date of the consolidated financial statements and the amounts of revenues and expenses reported for the period then ended.
Reserves. Reserve estimates significantly impact depreciation and depletion expense and the calculation of potential impairments of oil and gas properties. Under the SEC rules, proved reserves are those quantities of oil and gas, which, by analysis of geoscience and engineering data, can be estimated with reasonable certainty to be economically producible from a given date forward, from known reservoirs, and under existing economic conditions, operating methods, and government regulations. The term "reasonable certainty" implies a high degree of confidence that the quantities of oil and natural gas actually recovered will equal or exceed the estimate. Reasonable certainty can be established using techniques that have been proven effective by actual production from projects in the same reservoir or an analogous reservoir or by other evidence using reliable technology that establishes reasonable certainty. Reliable technology is a grouping of one or more technologies (including computational methods) that has been field tested and has been demonstrated to provide reasonably certain results with consistency and repeatability in the formation being evaluated or in an analogous formation.
Probable reserves are those additional reserves that are less certain to be recovered than proved reserves but which, together with proved reserves, are as likely as not to be recovered. When deterministic methods are used, it is as likely as not that actual remaining quantities recovered will exceed the sum of estimated proved plus probable reserves. When probabilistic methods are used, there should be at least a 50% probability that the actual quantities recovered will equal or exceed the proved plus probable reserves estimates.
Possible reserves are those additional reserves that are less certain to be recovered than probable reserves. When deterministic methods are used, the total quantities ultimately recovered from a project have a low probability of exceeding proved plus probable plus possible reserves. When probabilistic methods are used, there should be at least a 10% probability that the total quantities ultimately recovered will equal or exceed the proved plus probable plus possible reserves estimates.
While the SEC rules allow us to disclose proved, probable and possible reserves, we have elected to disclose only proved reserves in this prospectus and the registration statement of which it forms a part.
Reserves were calculated using an unweighted arithmetic average of commodity prices in effect on the first day of each month within the twelve-month period ending on the date as of which the applicable estimate is presented. These prices were adjusted for quality, transportation fees, geographical differentials, marketing bonuses or deductions and other factors affecting the price received at the wellhead.
Periodic revisions to the estimated reserves and related future cash flows may be necessary as a result of a number of factors, including reservoir performance, new drilling, oil and natural gas prices, cost changes, technological advances, new geological or geophysical data or other economic factors. Accordingly, reserve estimates are generally different from the quantities of oil and natural gas that are ultimately recovered. We cannot predict the amounts or timing of future reserve revisions. If such revisions are significant, they could significantly affect future amortization of capitalized costs and result in impairment of assets that may be material.
91
Property and equipment. Oil and gas producing activities are accounted for using the successful efforts method of accounting. Under the successful efforts method, lease acquisition costs and all development costs, including unsuccessful development wells, are capitalized.
Unproved properties—Acquisition costs associated with the acquisition of non-producing leaseholds are recorded as unproved leasehold costs and capitalized as incurred. These consist of costs incurred in obtaining a mineral interest or right in a property, such as a lease in addition to options to lease, broker fees, recording fees and other similar costs related to activities in acquiring properties. Leasehold costs are classified as unproved until proved reserves are discovered, at which time related costs are transferred to proved oil and gas properties.
Exploration costs—Exploration costs, other than exploration drilling costs, are charged to expense as incurred. These costs include seismic expenditures and other geological and geophysical costs, amortization and impairment of unproved leasehold costs, and lease rentals. The costs of drilling exploratory wells and exploratory-type stratigraphic wells are initially capitalized pending determination of whether the well has discovered proved commercial reserves. If the exploratory well is determined to be unsuccessful, the cost of the well is transferred to expense.
Proved oil and gas properties—Costs incurred to obtain access to proved reserves and to provide facilities for extracting, treating, gathering, and storing oil, gas and NGLs are capitalized. All costs incurred to drill and equip successful exploratory wells, development wells, development-type stratigraphic test wells, and service wells, including unsuccessful development wells, are capitalized.
Impairment—The capitalized costs of proved oil and gas properties are reviewed at least annually for impairment, whenever events or changes in circumstances indicate that the carrying amount of a long-lived asset or asset group exceeds its fair market value and is not recoverable. The determination of recoverability is based on comparing the estimated undiscounted future net cash flows from a producing field to the carrying value of the assets. If the future undiscounted cash flows, based on estimates of anticipated production and future oil and natural gas prices and operating costs, are lower than the carrying cost, the carrying cost of the field assets is reduced to fair value. For our proved oil and gas properties, we estimate fair value by discounting the projected future cash flows at an appropriate risk-adjusted discount rate.
Unproved leasehold costs are assessed at least annually to determine whether they have been impaired. Individually significant properties are assessed for impairment on a property-by-property basis, while individually insignificant unproved leasehold costs may be assessed in the aggregate. If unproved leasehold costs are found to be impaired, an impairment allowance is provided and a loss is recognized in the statement of operations.
Depreciation, depletion and amortization—Depreciation, depletion and amortization, or DD&A, of capitalized costs of proved oil and gas properties is computed using the unit-of-production method based upon estimated proved reserves. Assets are grouped for DD&A purposes on the basis of a reasonable aggregation of properties producing from or expected to be developed in a basin or formation. The reserve base used to calculate DD&A for leasehold acquisition costs and the cost to acquire proved properties is the sum of proved developed reserves and proved undeveloped reserves. The reserve base used to calculate DD&A for drilling, completion and well equipment costs, which include development costs and successful exploration drilling costs, includes only proved developed reserves.
Sales—Sales of significant portions of a proved field are charged to income as incurred. Gain or loss on the sale is recognized to the extent of the difference between the net proceeds received and the remaining
92
carrying value of the properties sold. Proceeds from the sale of insignificant portions of a larger proved field are accounted for as a recovery of costs, thereby reducing the carrying value of the field until such value reaches zero. For sales of entire working interests in unproved properties, gain or loss is recognized to the extent of the difference between the proceeds received and the net carrying value of the property. Proceeds from sales of partial interests in unproved properties are accounted for as a recovery of costs unless the proceeds exceed the entire cost of the property.
Revenue recognition. We recognize oil, gas and NGL revenues when products are delivered at a fixed or determinable price, title has transferred and collectability is reasonably assured (sales method). Oil and natural gas sold is not significantly different from our share of production.
Derivative financial instruments. We use derivative contracts to hedge the effects of fluctuations in the prices of oil, natural gas and NGLs. We record such derivative instruments as assets or liabilities in the statements of financial position (see Note 4 of the accompanying Notes to Consolidated Financial Statements for further information on fair value). Estimating the fair value of derivative financial instruments requires management to make estimates and judgments regarding volatility and counterparty credit risk. We use net presentation of derivative assets and liabilities when such assets and liabilities are with the same counterparty and allowed under the ISDA trading agreement with such counterparty.
We have not designated any of our derivative contracts as fair value or cash flow hedges. The changes in fair value of the contracts are included in net income in the period of the change as "Gain (loss)—oil and gas derivative contracts".
Share-based compensation. We measure and record compensation expense for all share-based payment awards to employees and directors based on estimated grant-date fair values. Compensation costs for share-based awards are recognized over the requisite service period based on the grant-date fair value. Since, for the periods prescribed, we were not publicly traded we do not have a listed price with which to calculate fair value. We have historically and consistently calculated fair value using combined valuation models including an enterprise valuation approach; an income approach, utilizing future discounted and undiscounted cash flows; and a market approach, taking into consideration peer group analysis of publicly traded companies, and when available, actual cash transactions in our common stock.
Acquisitions. Acquisitions are accounted for as purchases and, accordingly, the results of operations are included in our statement of operations from the closing date of the acquisition. Purchase prices are allocated to acquired assets and assumed liabilities, if any, based on their estimated fair value at the time of the acquisition. We have historically and consistently calculated fair value using combined valuation models including an enterprise valuation approach; an income approach, utilizing future discounted and undiscounted cash flows; and a market approach, taking into consideration peer group analysis of publicly traded companies.
Asset retirement obligations. We recognize as a liability an asset retirement obligation, or ARO, associated with the retirement of a tangible long-lived asset in the period in which it is incurred or becomes determinable (as defined by the standard), with an associated increase in the carrying amount of the related long-lived asset. The cost of the tangible asset, including the initially recognized asset retirement cost, is depreciated over the useful life of the asset and accretion expense is recognized over time as the discounted liability is accreted to its expected settlement value. We measure the fair value of the ARO using expected future cash outflows for abandonment discounted generally at our cost of capital at the time of recognition.
93
Estimating the future ARO requires management to make estimates and judgments regarding timing and existence of a liability, as well as what constitutes adequate restoration. Inherent in the fair value calculation are numerous assumptions and judgments including the ultimate costs, inflation factors, credit adjusted discount rates, timing of settlement and changes in the legal, regulatory, environmental and political environments. To the extent future revisions to these assumptions impact the fair value of the existing ARO liability, a corresponding adjustment is made to the related asset.
Recent accounting pronouncements
In December 2011, the Financial Accounting Standards Board, or the FASB, issued an Accounting Standards Update, or ASU, that requires an entity to disclose information about offsetting and related arrangements to enable users of its financial statements to understand the effect of those arrangements on its financial position. The ASU requires disclosure of both gross information and net information about both instruments and transactions eligible for offset in the statement of financial position and instruments and transactions subject to an agreement similar to a master netting arrangement. The ASU will be applied retrospectively and is effective for periods beginning on or after January 1, 2013. We do not expect the adoption of this ASU to have a material effect on our financial statements.
94
Overview
We are an independent oil and gas company engaged in the development, production and acquisition of oil and natural gas properties in the Anadarko and Arkoma basins of Texas and Oklahoma. Our CEO, Jonny Jones, founded our predecessor company in 1988 in continuation of his family's long history in the oil and gas business, which dates back to the 1920s. We have grown rapidly by leveraging our focus on low cost drilling and completions and our horizontal drilling expertise to develop our inventory and execute several strategic acquisitions. We have accumulated extensive knowledge and experience in developing the Anadarko and Arkoma basins, having concentrated our operations in the Anadarko basin for 25 years and applied our knowledge to the Arkoma basin since 2011. We have drilled over 580 total wells since our formation, including over 400 horizontal wells, and delivered compelling economic returns over various commodity price cycles. Our operations are focused on horizontal drilling and completions within two distinct basins in the Texas Panhandle and Oklahoma:
- •
- the Anadarko Basin—targeting the liquids-rich Cleveland, Granite Wash, Tonkawa and Marmaton
formations; and
- •
- the Arkoma Basin—targeting the liquids-rich fairway of the Woodford shale formation.
We optimize returns through a disciplined emphasis on controlling costs and promoting operational efficiencies, and we believe we are recognized as one of the lowest-cost drilling and completion operators in the Cleveland and Woodford shale formations.
The Anadarko and Arkoma basins are among the most prolific and largest onshore producing oil and natural gas basins in the United States, enjoying multiple producing horizons and extensive well control demonstrated over seven decades of development. The formations we target are generally characterized by oil and liquids-rich natural gas content, extensive production histories, long-lived reserves, high drilling success rates and attractive initial production rates. We focus on formations in our operating areas that we believe offer significant development and acquisition opportunities and to which we can apply our technical experience and operational excellence to increase proved reserves and production to deliver compelling economic rates of return. Our goal is to build value through a disciplined balance between developing our current inventory of 2,435 gross identified drilling locations and actively pursuing joint venture agreements, farm-out agreements, joint operating agreements and similar partnering agreements, which we refer to as joint development agreements, organic leasing proximate to existing acreage and strategic acquisitions. In all of our joint development agreements, we control the drilling and completion of a well, which is the phase during which we can leverage our full operational expertise and cost discipline. Following completion, we in some cases may turn over operatorship to a partner during the production phase of a well. We believe the ceding to us of drilling and completion operatorship in our areas of operation by several large oil and gas companies, including ExxonMobil, BP and ConocoPhillips, reflects their acknowledgement of our low-cost, safe and efficient operations.
From December 31, 2010 through December 31, 2012, through our acquisitions and drilling program, we grew our proved reserves from approximately 34 MMBoe to 85 MMBoe, representing a compound annual growth rate of approximately 58%, while our average daily net production increased over the same period from approximately 6.6 MBoe/d to 13.3 MBoe/d, representing a compound annual growth rate of approximately 42%. For the month ended April 30, 2013, our average daily net production was
95
15.8 MBoe/d. In the context of our historical performance and business strategy execution, we believe we have the opportunities, experience and knowledge to continue growing both our reserves and production.
As of December 31, 2012, our total estimated proved reserves were approximately 85 MMBoe, of which approximately 46% were classified as proved developed reserves. Approximately 55% of our total estimated proved reserves as of December 31, 2012 consisted of oil and NGLs, and 45% consisted of natural gas. As of December 31, 2012, our properties included approximately 720 gross active producing wells. For the three years ended December 31, 2012, we drilled 154 wells, substantially all of which we drilled as operator. The following table presents summary acreage, reserve and production data for each of our core operating areas:
| |
As of December 31, 2012 |
Month ended April 30, 2013 |
As of April 30, 2013 |
||||||||||||||||
|---|---|---|---|---|---|---|---|---|---|---|---|---|---|---|---|---|---|---|---|
| |
Estimated net proved reserves |
Average daily net production |
Acreage | ||||||||||||||||
| |
MMBoe |
% Oil and NGLs(1) |
MBoe/d |
% Oil and NGLs(1) |
Gross acreage |
Net acreage |
|||||||||||||
Anadarko basin: |
|||||||||||||||||||
Cleveland |
40.5 | 63.8% | 8.6 | 64.2% | 102,445 | 60,575 | |||||||||||||
Granite Wash |
4.7 | 40.2% | 1.2 | 44.3% | 10,011 | 3,915 | |||||||||||||
Arkoma basin: |
|||||||||||||||||||
Woodford(2) |
37.9 | 49.9% | 4.1 | 31.9% | 14,539 | 3,725 | |||||||||||||
Other |
2.2 | 29.4% | 1.9 | 63.3% | 37,917 | 12,762 | |||||||||||||
All properties |
85.3 | 55.4% | 15.8 | (3) | 54.2% | 164,912 | 80,977 | ||||||||||||
(1) Ethane is an NGL and is included in this percentage. Due to recent declines in ethane pricing and increases in natural gas prices, beginning in December 2012, purchasers of our Woodford production have been electing not to recover ethane from the natural gas stream and instead have been paying us based on the natural gas price for the ethane left in the gas stream. As a result of the increased energy content associated with the returned ethane and the absence of plant shrinkage, this ethane rejection has increased the incremental revenue and volumes that we receive for our natural gas product relative to what we would have received if the ethane was separately recovered, but has reduced physical barrels of liquid ethane that we are selling.
(2) Includes proved undeveloped reserves associated with our joint development agreement with Southridge. Please see "Risk Factors—If we do not fulfill our obligation to drill the minimum number of wells specified in our joint development agreements, we will lose the right to develop the undeveloped acreage associated with the agreement and any proved undeveloped reserves attributable to such undeveloped acreage."
(3) Average daily net production increased from 13.3 MBoe/d for the year ended December 31, 2012, to 15.8 MBoe/d for the month ended April 30, 2013, primarily due to new wells added through our drilling activities and the acquisition of 36 gross productive wells in connection with the Chalker acquisition.
96
The following table presents summary well and drilling location data for each of our key formations for the dates indicated:
| |
As of December 31, 2012 |
As of April 30, 2013 |
|||||||||||
|---|---|---|---|---|---|---|---|---|---|---|---|---|---|
| |
Producing wells | Identified drilling locations(1) |
|||||||||||
| |
Gross |
Net |
Gross |
Net |
|||||||||
Anadarko basin: |
|||||||||||||
Cleveland |
293 | 191 | 521 | 323 | |||||||||
Granite Wash |
23 | 16 | 14 | 5 | |||||||||
Tonkawa |
— | — | 194 | 111 | |||||||||
Marmaton |
— | — | 351 | 190 | |||||||||
Arkoma basin: |
|||||||||||||
Woodford |
122 | 47 | 904 | 127 | |||||||||
Other |
282 | 75 | 451 | 20 | |||||||||
All properties |
720 | 329 | 2,435 | 776 | |||||||||
(1) Our total identified drilling locations include 361 gross locations associated with proved undeveloped reserves as of December 31, 2012. We have estimated our drilling locations based on well spacing assumptions for the areas in which we operate and other criteria. See "—Development of proved undeveloped reserves" and "—Drilling locations" for more information regarding our proved undeveloped reserves and the processes and criteria through which these drilling locations were identified.
Our 2012 capital expenditures, excluding acquisitions, totaled $122.1 million, during which we drilled 48 gross wells. Of the $122.1 million 2012 capital expenditures, $85.1 million was used for drilling and completion of the 48 gross (23 net) wells. The remaining capital expenditures were used for (i) 13 wells that were spud in 2011 and completed in 2012, (ii) maintenance and leasehold activity, (iii) a purchase price adjustment in connection with the Chalker acquisition for four wells drilled by Chalker Energy Partners, and (iv) certain well-related fees pursuant to the Southridge joint development agreement. We expect our 2013 capital expenditure budget to be approximately $204.0 million, $180 million of which we expect to use to drill and complete 93 gross (54 net) wells. The remainder of the 2013 capital expenditure budget is expected to be devoted to seismic, leasing and other discretionary expenditures. Please see "Management's discussion and analysis of financial condition and results of operations—Liquidity and capital resources." Assuming current market conditions and drilling success rates comparable to our historical performance, we believe we will be able to fund substantially all of our 2013 budgeted capital expenditures with our cash flow from operations. We currently expect to allocate our 2013 capital expenditure budget as follows:
| |
2013 capital expenditure budget |
Wells |
|||||
|---|---|---|---|---|---|---|---|
| |
(in thousands) |
(gross/net) |
|||||
Drilling and completion: |
|||||||
Cleveland |
$ | 148,900 | 62/45 | ||||
Woodford |
22,700 | 20/8 | |||||
Other drilling |
8,100 | 11/1 | |||||
Other activities |
24,300 | — | |||||
All properties |
$ | 204,000 | 93/54 | ||||
97
We utilize our cost and operating efficiencies to competitively pursue acquisitions and have completed three significant acquisitions as well as several bolt-on acquisitions in our operating areas over the last three years. The aggregate purchase price of our recent acquisitions is over $710 million.
In December 2009, we made our first significant acquisition by partnering with Metalmark Capital as the winning bidder in the bankruptcy auction of Crusader Energy Group, Inc. The acquisition included approximately 13.7 MMBoe of proved reserves estimated as of December 31, 2012 and strengthened our leading position in the Cleveland formation, where we have drilled over 255 gross horizontal wells since 2004, which is over 15% of all horizontal wells drilled in the formation over that period. Other significant drillers of the Cleveland formation include Apache, EOG Resources and BP.
In April 2011, we acquired estimated proved developed reserves in the Arkoma Woodford shale formation of approximately 31.1 MMBoe as of December 31, 2012, which we refer to as the Southridge acquisition. We serve as operator for these properties and have entered into a multi-year drilling joint development agreement with Southridge Energy, LLC. We have drilled 28 gross wells in the Woodford shale formation since the acquisition and, according to data received from Smith Bits, as of March 5, 2013 we held the basin record for the lowest number of days drilling a horizontal well from spud to total depth in the formation.
In December 2012, we acquired approximately 22,000 net acres in the Anadarko basin, including 36 gross productive wells, in or proximate to our existing areas of operation in the Cleveland and Tonkawa formations, from a group of sellers including Chalker Energy Partners III, LLC, a private exploration and production company. We acquired approximately 18 MMBoe of estimated proved reserves as of December 31, 2012 in the transaction, comprised of approximately 66% oil and NGLs and approximately 30% proved developed reserves. The Cleveland formation remains our core area of activity, and this acquisition expanded our presence in the southern trend of the formation, which is characterized by higher oil production and reserves per well than our other acreage in the play, yielding better well economics. This acquisition, which we refer to as the Chalker acquisition, added 55 new 640-acre sections to our existing acreage base of over 100 sections in the Cleveland formation.
Our business strategies
Our goal is to increase stockholder value by leveraging the operational expertise of our management and technical teams in our operating areas in order to achieve compelling economic returns and attractive reserve, production and cash flow growth. We seek to achieve this goal by executing the following strategies:
Grow production and reserves through development of our liquids-weighted, multi-year inventory. We intend to focus on liquids-weighted development activities in our operating areas, which we believe to be repeatable, low-risk and low-cost, in order to grow our current level of production and proved reserves. We have extensive experience in the Anadarko and Arkoma basins, having drilled over 580 wells in the area since 1988. We believe our historical drilling experience, together with the results of substantial industry activity within our operating areas, provide us with enhanced visibility that helps reduce the risk and uncertainty associated with drilling horizontal wells in these areas. As of April 30, 2013, we have identified 2,435 gross drilling locations, which we believe will enable us to drill and develop our resource base over many years. We expect 99% of our drilling capital expenditures in 2013 to be dedicated to horizontal drilling.
Leverage our extensive operational expertise to continually reduce costs and enhance returns. Decades of experience in the Midcontinent region and emphasis on operational execution and cost control have
98
allowed us to drill and complete wells at significantly lower cost than most other operators and, as a result, to realize compelling economic returns. We seek to apply this expertise in other projects within our areas of operation to enhance their economic profile. For example, upon moving into the Arkoma basin and taking over operations from Southridge through a joint development agreement in April 2011, we succeeded in reducing average drilling days (spud to total depth) from 18 to 12.6, or 30%, by applying techniques we developed in the Anadarko basin. We currently hold the Coal County, Oklahoma record (based on 273 horizontal wells) for the lowest number of drilling days from spud to total depth of 11 days, as compared to the Arkoma basin average of 33 days, according to data received from Smith Bits, as of March 5, 2013. On this basis, we have also drilled the second fastest time of the 621 wells drilled in the Pittsburg and Hughes county areas. In the Arkoma basin, we have reduced our average cost to drill and complete a well from $4.1 million, for the first three wells we drilled in 2011, to $3.1 million, on the most recent 10 wells we drilled during 2012, all of which were of a similar length and scope. Meanwhile, overall well performance remained consistent with previous results.
Execute strategic acquisitions, joint development agreements, and organic leasing where our operating experience can be leveraged. We have successfully increased our production and reserves through selective acquisitions, targeted joint development agreements and organic leasing, and we intend to continue to evaluate acquisition, partnering and leasing opportunities in and around our areas of operation. We focus our acquisition activity where we believe our operational expertise provides the opportunity for meaningful incremental value creation, where our operational methods are relevant and where we serve as operator following the acquisition. We believe that we have a competitive advantage in bidding for acquisitions in that our drilling and completion costs are often lower than those of other potential buyers. Further, we pursue joint development opportunities that complement our acquisition strategy by providing a capital efficient and risk-lowering approach to securing and developing acreage and drilling locations that allows us to apply our expertise in the drilling and completion phase. In this regard, we have established long-term agreements with several large exploration and production companies such as BP, ConocoPhillips, Devon Energy, ExxonMobil, Linn Energy, Vanguard Natural Resources and Samson, in which they have farmed-out portions of their basin operations to us. We have drilled over 265 wells in connection with these types of agreements, over 155 of which have been drilled in connection with an active 12-year drilling relationship with ExxonMobil. We also continue to seek new leasing opportunities to expand our acreage position and complement our existing drilling inventory, as we believe that targeted organic leasing around our existing acreage provides the ability for greater returns due to cost and operating synergies in overlapping areas of operation.
Focus on exploiting additional upside potential within our portfolio. We plan to continue exploiting our proved reserves to maximize production through various enhanced recovery methods, such as optimizing frack design and number of stages, reentering existing wellbores and drilling longer horizontal laterals. Furthermore, the stacked reservoirs within our asset base provide exposure to additional upside potential in several emerging resource plays. Recently, offset operators have been pursuing the exploration of two newly-identified resource opportunities, the Tonkawa and Marmaton formations in the Anadarko basin. As part of our development strategy, we monitor the nearby Tonkawa and Marmaton well results of these other operators. We have begun to assess the potential of these formations within our asset base and believe, based on these results, we have approximately 545 potential drilling locations in the Tonkawa and Marmaton formations that provide us with additional resource potential. Further, our current leasehold position provides longer term potential exposure to other prospective formations found in the Anadarko basin, including the Douglas, Cottage Grove, Cherokee Shale, Atoka Shale, Upper, Middle and Lower Morrow formations, and other prospective formations found in the Arkoma basin, including the Hartshorne, Spiro, Wapanuka, Cromwell and Caney Shale formations.
99
Maintain operational control over our drilling and completion operations. We operated substantially all of the wells that we drilled and completed during 2012, allowing us to effectively manage the timing and levels of our development spending, overall well costs and operating costs. In addition, we expect to operate the drilling and completion phase on approximately 69% of our 2,435 gross identified drilling locations. With over 81% of our acreage held by existing production, we also will not be required to expend significant capital to hold acreage in our portfolio. We believe that continuing to exercise a high degree of control over our acreage position will provide us with flexibility to manage our drilling program and optimize our returns and profitability.
Opportunistically allocate our resources and capital to enhance returns. Our drilling inventory comprises oil, natural gas and NGLs, which enables us to adjust our development approach based on prevailing commodity prices. Currently, we intend to capitalize on the more favorable liquids pricing environment by continuing to drill acreage with significant oil and NGL components. Within our existing portfolio, oil and NGLs account for approximately 55% of our proved reserves as of December 31, 2012. In addition, we expect that continuing to operate the substantial majority of our drilling locations will allow us to reallocate our capital and resources opportunistically in response to market conditions. Our disciplined focus on well-level returns in allocating our capital and resources has been a key component of our ability to deliver successful results through various commodity price cycles over the last 25 years.
Competitive strengths
We possess a number of competitive strengths that we believe will allow us to successfully execute our business strategy:
Geographic focus in the prolific Anadarko and Arkoma basins. Our operations are focused in the Midcontinent region, targeting liquids-rich opportunities in the Anadarko and Arkoma basins of Texas and Oklahoma. We generally focus on formations characterized by oil and liquids-rich natural gas content, extensive production histories, long-lived reserves, high drilling success rates, and attractive initial production rates. Furthermore, our areas of operation are proximate to well-developed natural gas and liquids midstream infrastructure and oilfield services providers, which we believe reduces the risk of production delays and facilitates adequate takeaway capacity. 95% of our 2013 drilling capital budget is devoted to the Anadarko and Arkoma basins.
Multi-year drilling inventory in existing and emerging resource plays. Our drilling inventory consists of approximately 2,435 gross identified drilling locations in the Anadarko and Arkoma basins, and our development plans target locations that we believe are low-cost, provide attractive economics, present a low risk and support a predictable production profile. As of April 30, 2013, we had identified 521 gross drilling locations in the Cleveland resource play, 14 gross drilling locations in the Granite Wash formation and 904 gross drilling locations in the Arkoma Woodford shale formation. Our concentrated leasehold position has been delineated largely through drilling on our Cleveland leasehold, which we expanded substantially through our recent Chalker acquisition. We have also expanded through joint development agreements with large independent producers and major oil and gas companies in the Cleveland and Granite Wash formations, as well as our strategic new basin entry into the Woodford shale formation of the Arkoma basin. Based on our initial 2013 development plans, we expect to drill 93 gross wells in 2013, as compared to 48 gross wells drilled in 2012, representing a 94% increase. Furthermore, we have identified additional locations in several emerging resource plays that we intend to explore and develop in the coming years, including 194 gross locations in the Tonkawa formation and 351 gross locations in the Marmaton formation.
100
Extensive operational expertise and low-cost operating structure. Drilling horizontal wells has been our primary drilling approach for the last nine years. Having drilled over 400 horizontal wells in nine formations in our areas of operation since 1996, we have established systematic protocols that we believe provide repeatable results. We also have established relationships with oilfield service providers, vendors and crews, allowing for continued cost efficiencies. As an example, we have consistently drilled horizontal Cleveland wells at a meaningfully lower cost than most of our competition in the same area. Through our focus on drilling, completion and operational efficiencies, we are able to effectively control costs and deliver compelling rates of returns and profitability.
Strong financial position and conservative policies. We are committed to maintaining a conservative financial profile in order to preserve operational flexibility and financial stability. Upon completion of this offering, we estimate that we will have cash on hand and availability under our revolving credit facility totaling approximately $304.1 million. We believe that our operating cash flow, together with availability under our credit facility and our second lien term loan facility, provide us with the financial flexibility to pursue acquisitions, joint development agreements and organic leasing opportunities. In addition, we intend to actively hedge our future production in order to reduce the impact of commodity price volatility on our cash flows. Within 30 days of completion of a well, we typically review the production results and begin entering into commodity price hedges of up to 100% of expected production from that well in order to secure our rates of return for up to five years. As of December 31, 2012, we had over $800 million of notional value in existing hedges with the lenders under our credit facilities. Assuming current market conditions and drilling success rates comparable to our historical performance, we believe we will be able to fund substantially all of our 2013 budgeted capital expenditures with our cash flow from operations.
High caliber management team with deep operating experience and a proven track record. The top four executives of our management team average more than 25 years of industry experience. Furthermore, our management team averages over 20 years of industry experience and has worked together developing assets for many years, resulting in a high degree of continuity. We have assembled a strong technical staff of geoscientists, field operations managers and engineers with significant experience drilling horizontal wells and with fracture stimulation of unconventional formations, which has resulted in a successful track record of reserve and production growth. In addition, our management team has extensive expertise and operational experience in the oil and natural gas industry with a proven track record of successfully negotiating, executing and integrating acquisitions. Members of our management team have previously held positions with major and large independent oil and natural gas companies, including ExxonMobil, BP, Southwestern Energy, Samson, Marathon and Standard Oil.
Alignment of management team. Our predecessor was founded in 1988 by our CEO, Jonny Jones, in continuation of his family's history in the oil and gas business, which dates back to the 1920s. Following the completion of this offering, Jones family members and our management team will control 25.2% of our combined voting power and economic interest (regardless of whether the underwriters' option to purchase additional shares is exercised). See "Principal stockholders." We believe the equity interests of our officers and directors align their interests and provide substantial incentive to grow the value of our business for the benefit of our stockholders.
Our operations
Our areas of operations
We own leasehold interests in oil and natural gas producing properties, as well as in undeveloped acreage, substantially all of which are located in the Anadarko and Arkoma basins in Texas and Oklahoma. The
101
majority of our interests are in producing properties located in fields characterized by what we believe to be long-lived, predictable production profiles and repeatable development opportunities. Specifically, our properties and wells are located in fields that generally have been developed over a long period of time, typically decades. Given the long productive history of these fields, there is substantial midstream and service infrastructure in place, including natural gas and NGLs pipelines and natural gas processing plants. Observing the performance of these fields over many years allows for greater understanding of production and reservoir characteristics, making future performance more predictable. In other words, the production and corresponding decline rates attributable to properties of this type can be forecasted with a higher degree of accuracy than less active fields.
For a discussion of the risks inherent in oil and natural gas production, please read "Risk factors—Risks related to our business—Drilling for and producing oil and natural gas are high risk activities with many uncertainties that could adversely affect our business, financial condition or results of operations."
Anadarko basin
Approximately 53% of our estimated proved reserves as of December 31, 2012 and approximately 56% of our average daily net production for the 12 months then-ended were located in the Anadarko basin. The Anadarko basin is one of the most prolific oil and natural gas producing basins in the United States, covering approximately 50,000 square miles primarily in Oklahoma, but including the upper Texas Panhandle, southwestern Kansas, and southeastern Colorado. According to the U.S. Geological Survey, this basin has been continuously active since its discovery in 1908, producing over 2.3 billion barrels of oil and 65.5 trillion cubic feet of natural gas from over 200,000 wells drilled in its various formations. The Anadarko basin is characterized by oil and natural gas fields with long production histories, multiple producing formations and modest and predictable rates of production decline depending on the specific formation. As shown in the table below, the basin contains over 25 stacked formations throughout its depths, and we believe that the Anadarko basin provides an appealing inventory of horizontal drilling opportunities as new horizontal targets continue to emerge. In addition, we believe that the low finding, development and operating costs generally experienced in the basin relative to many other basins provide for attractive well economics.
102
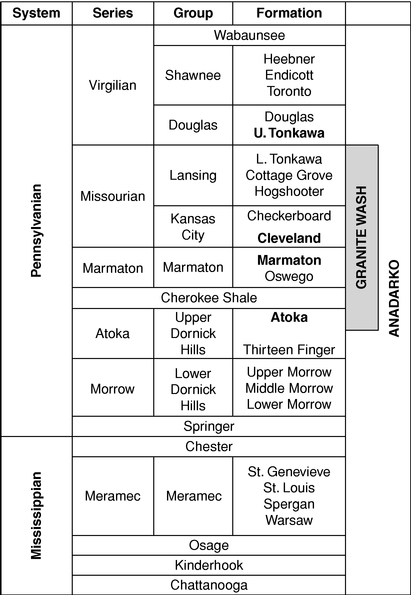
Our wells in this area produce oil, natural gas and NGLs from various formations at depths from approximately 7,000 feet to 12,000 feet. We plan to drill 62 gross (45 net) wells in the Anadarko basin in 2013 at an estimated cost to us of approximately $149 million. Our operations in the Anadarko basin are primarily focused on the Cleveland formation where we have producing wells. We also have acreage in the Granite Wash, Tonkawa, Marmaton, Atoka shale and Cherokee shale formations located in the eastern portion of the Texas Panhandle and western Oklahoma. We intend to explore and develop the Tonkawa and Marmaton emerging resource plays beginning in 2014, and believe that the Atoka shale and Cherokee shale formations provide longer-term potential in the Anadarko basin.
Producing formations. Our operations in the Anadarko basin are currently focused on the following formations, where we have 316 gross (207 net) producing wells and where we have identified 535 gross (328 net) drilling locations in the Cleveland and Granite Wash formations as of April 30, 2013, of which 217 have proved undeveloped reserves attributed to them as of December 31, 2012. See "—Drilling locations" for more information regarding the processes and criteria through which these drilling locations were identified.
103
- •
- Cleveland
formation. Our Cleveland acreage is located in Ochiltree, Lipscomb and Hemphill counties in Texas and Ellis county in Oklahoma. The
Cleveland formation ranges from depths of approximately 7,000 feet to 8,800 feet and is characterized by a tight, shaly sand with reduced permeability that lends itself to improved
recovery through enhanced drilling and completion techniques. Recognizing this potential, we began drilling horizontal wells in the Cleveland formation in November 2004 under our joint development
agreement with ExxonMobil. Since then, we have drilled over 255 gross horizontal wells in the Cleveland formation, representing approximately 20% of all horizontal wells drilled in the formation.
As of December 31, 2012, we operated 228 gross (165 net) producing wells with working interests ranging from approximately 25% to 100% for our leasehold in the Cleveland formation. Our Cleveland properties contained 40.5 MMBoe of estimated net proved reserves as of December 31, 2012, approximately 64% of which are oil and NGLs, and generated an average daily net production of 8.6 MBoe/d for the month ended April 30, 2013. Our Cleveland properties account for approximately 65% of the standardized measure of our total estimated proved reserves and approximately 83% of our 2013 drilling budget. We have identified 521 gross (323 net) drilling locations in the Cleveland formation as of April 30, 2013. Of these 521 locations, 414 locations are attributable to acreage that is currently held by production and approximately 38% are attributable to proved undeveloped reserves as of December 31, 2012. We plan to drill 62 gross (45 net) additional wells in the Cleveland formation in 2013 at an estimated cost to us of approximately $149 million.
- •
- Granite Wash
formation. Our Granite Wash acreage is located in Roberts, Hemphill and Wheeler counties in Texas and Roger Mills, Beckham, Custer and
Washita counties in Oklahoma. The Granite Wash spans multiple zones from depths of approximately 9,000 feet to 12,000 feet and is composed of tight, complex, quartz rich alluvial
liquids-rich wash. The formation is both under- and over-pressured, and sediments are spread laterally and stacked vertically to create a submarine fan complex. These
characteristics result in reduced permeability and therefore improved recovery through horizontal drilling and completion techniques. There is over 3,000 feet of gross thickness in the Granite
Wash formation, with the ability to drill and develop multiple zones with four to five horizontal laterals per section. We entered the Granite Wash in 2007 under a joint development agreement with
Devon Energy. Utilizing protocols we developed in the Cleveland formation, we drilled our first horizontal Granite Wash well in 2008 and have since drilled 28 horizontal wells in the formation. We
have participated in development opportunities in the Granite Wash through farm-out arrangements with Devon Energy, Linn Energy and Samson.
As of December 31, 2012, we operated 22 gross (15 net) producing wells in the formation with an average working interest of 70%. Our Granite Wash properties contained 4.7 MMBoe of estimated net proved reserves as of December 31, 2012, approximately 40% of which are oil and NGLs, and generated an average daily net production of 1.2 MBoe/d for the month ended April 30, 2013. Our properties in this formation account for approximately 3.4% of the standardized measure of our total estimated proved reserves. We do not plan to allocate capital expenditures to the Granite Wash formation in our 2013 drilling budget. We have identified 14 gross (5 net) drilling locations in the Granite Wash formation as of April 30, 2013.
Additional targeted formations. We also own properties in the following formations of the Anadarko basin, where we have identified 545 gross (301 net) drilling locations as of April 30, 2013, none of which have proved reserves attributed to them. See "—Drilling locations" for more information regarding the processes and criteria through which these drilling locations were identified.
104
- •
- Tonkawa
formation. As of April 30, 2013, we have identified 194 gross (111 net) drilling locations in the Tonkawa formation in Lipscomb
and Hemphill counties in Texas. In addition, we have other properties in the Tonkawa formation located in Ellis and Roger Mills counties in Oklahoma. The Tonkawa is a newly-targeted horizontal oil
formation at depths of approximately 6,000 feet to 8,000 feet and is characterized by fine to very fine-grained sandstone, ranging in thickness from 20 feet to
40 feet. We drilled our first horizontal Tonkawa well in May of 2010 and drilled two additional horizontal wells in the formation under a farm-out with Samson that is not part of
our current leasehold.
- •
- Marmaton formation. As of April 30, 2013, we have identified 351 gross (190 net) drilling locations in the Marmaton formation. Our properties in the Marmaton formation are all undeveloped and span three sub-formations: properties located in Ellis County, Oklahoma characterized by fluvio-deltaic sands, properties located in Northeast Ochiltree and Northwest Lipscomb counties, Texas characterized by shallow marine sands, and Ochiltree county, Texas characterized by algal reef complex. The Marmaton sand is a tight, shaly sand with similar reservoir characteristics to the Cleveland. The Marmaton sand ranges in thickness from 40 feet to 80 feet while the reef ranges from 80 feet to 150 feet. This formation has been developed with conventional vertical drilling for many decades. Operators began developing this reservoir horizontally in Lipscomb and Ochiltree Counties in 2006. Ellis County horizontal Marmaton development began in late 2009. Horizontal drilling and stimulation techniques are enhancing recoveries in mature areas in the Marmaton formation.
Future potential opportunities. Our current leasehold position provides longer term potential exposure to other prospective formations in the Anadarko basin, including the Atoka, Cherokee, Douglas, Cottage Grove, Upper, Middle and Lower Morrow formations. The acreage associated with these opportunities is approximately 86% held by production. The Atoka and Cherokee formations, in particular, have attractive geologic properties, and we may elect to pursue their development when activity of other industry participants has provided us sufficient data and visibility regarding these prospective formations.
- •
- Atoka shale
formation. Our properties in the Atoka shale formation are located in Ochiltree, Lipscomb, and Hemphill counties in Texas and Ellis and
Woodward counties in Oklahoma. Production from the Atoka shale formation was established in the Texas panhandle region in late 2006, and over 50 horizontals wells have been completed by other
operators as of 2012. Depths of the Atoka formation range from 8,000 feet to 11,000 feet. The formation is characterized by a 150 feet to 200 feet zone of interbedded carbonates and organic rich
shales. Vertical production from this formation has been documented since the early 1950s.
- •
- Cherokee shale formation. Our properties in the Cherokee shale formation are located in Ochiltree, Lipscomb, and Hemphill counties in Texas and Ellis County in Oklahoma. Production from the Cherokee shale formation was first discovered in 1957. The formation is 400 feet to 700 feet thick on our properties and found at depths of 7,500 feet to 9,600 feet true vertical depth. The Cherokee shale produces predominantly natural gas from interbedded organic rich shales and carbonate siltstones.
Arkoma basin
Approximately 44% of our estimated proved reserves as of December 31, 2012, and approximately 36% of our average daily net production for the year then-ended were located in the Arkoma basin. The Arkoma basin is a historically prolific, largely gas-prone basin extending from eastern Oklahoma into western Arkansas. As shown in the table below, the basin produces natural gas from multiple horizons, which range in depth from 500 to 21,000 feet. Operators had historically developed the basin using vertical wells. In 2005, operators began drilling horizontal wells and using hydraulic fracture stimulation in the Woodford
105
shale formation, which has become common practice. The Woodford shale formation is regarded as one of the more mature onshore shale natural gas formations in the United States.
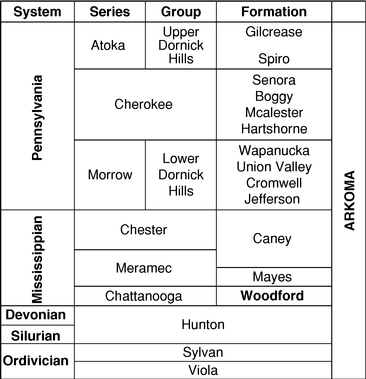
As of December 31, 2012, we operated approximately 64% of our properties in the Arkoma basin. Our wells in this area produce natural gas and NGLs from the Woodford shale formation at depths from approximately 8,000 feet to 11,000 feet. We plan to drill 20 gross (8 net) additional wells in 2013 at an estimated cost to us of approximately $23 million. Our Arkoma basin properties are located in the Woodford shale formation in eastern Oklahoma. Further, our current leasehold position provides longer term potential exposure to other prospective formations in the Arkoma basin, including the Hartshorne, Spiro, Wapanuka, Cromwell and Caney formations.
- •
- Woodford shale
formation. Our properties in the Woodford shale formation are located in Atoka, Coal, Pittsburg and Hughes counties in eastern Oklahoma.
The Woodford shale formation ranges from depths of approximately 5,000 feet to 12,700 feet and is composed of 75 to 220 foot thick black siliceous shale in our operating
area. The Woodford shale in this area is prospective for natural gas with a high concentration of associated NGLs. We entered the Woodford shale formation in April 2011 through the acquisition of
proved developed reserves of approximately 15.2 MMBoe from Southridge and a farm-out arrangement that entitles us to earn a 50% interest in Southridge's development locations in the
northern area of Southridge's acreage in the Woodford shale formation consisting of 11,517 gross acres (3,310 net acres). For additional information regarding our joint development
agreement with Southridge, please see "Management's discussion and analysis of financial condition and results of operations—Factors that significantly affect our results of operations."
As of December 31, 2012, we operated 78 gross (41 net) producing wells in the formation with an average working interest of approximately 53%. Our Woodford shale formation properties contained 37.9 MMBoe of estimated net proved reserves as of December 31, 2012, approximately 50% of which are NGLs, and generated an average daily net production of 4.1 MBoe/d for the month ended April 30, 2013. Our properties in this formation account for approximately 30% of the standardized measure of our
106
total estimated proved reserves and approximately 13% of our 2013 drilling budget. We have identified 904 gross (127 net) drilling locations in the Woodford shale formation as of April 30, 2013, of which approximately 119 have proved undeveloped reserves attributed to them as of December 31, 2012. We plan to drill 20 gross (8 net) additional wells in the Woodford shale formation in 2013 at an estimated cost to us of approximately $22.7 million.
Joint development agreements
We conduct a substantial portion of our operations through joint development agreements with third parties, including the companies listed in the table below. We have drilled over 265 wells in connection with these arrangements. If we do not meet our obligation to drill the minimum number of wells specified in a joint development agreement, we will lose the right to continue to develop certain of the acreage covered by the agreement. The following table summarizes our principal active joint development agreements as of June 15, 2013:
| Company |
Basin (formation) |
Principal terms of agreement |
||
|---|---|---|---|---|
| ExxonMobil | Anadarko (Atoka, Brown Dolomite, Cleveland, Des Moines, Douglas and Morrow) |
• Joint development partner since 2000 • We earn 50-100% of ExxonMobil's working interest in each well we drill • ExxonMobil may participate for up to 50% of its interest in each well • 155 wells drilled since inception in 2000 agreement • AMI in Sherman, Hansford and Lipscomb counties in Texas • We are obligated to drill one well every 90 days for the agreement to remain in effect • Failure to drill only results in our loss of the future opportunity to continue to develop |
||
Southridge |
Arkoma (Woodford) |
• Joint development partner since 2011 • We earn a 50% working interest in Southridge's development locations in the northern area of Southridge's acreage in the Arkoma Woodford shale formation • We are obligated to complete 20 wells by October 31st of each year until 60 wells are drilled for the agreement to remain in effect • We carry Southridge for a proportionate share of the well costs based on our working interest for the first 100 wells • 28 wells drilled since 2011 inception of agreement • Once 60 qualifying wells have been drilled, Southridge will assign to us a 50% interest in the leases |
||
107
| Company |
Basin (formation) |
Principal terms of agreement |
||
|---|---|---|---|---|
Vanguard Natural |
||||
| Resources | Arkoma (Woodford) | • Joint development partner since December 2012 • We earn 25-60% of the working interest in eight commitment wells • AMI for 360 sections in Hughes and Pittsburg counties in Oklahoma • We are obligated to drill a minimum of eight wells over three years • Failure to drill eight wells over three years results in our loss of the opportunity to continue drilling • After three years, we maintain our rights to continue drilling under this agreement by drilling at least one well every 90 days • Potential to drill up to 360 locations |
||
Drilling locations
We have identified a total of 2,435 gross (776 net) drilling locations, all of which are horizontal drilling locations. Of these 2,435 locations, 1,950 locations are attributable to acreage that is currently held by production and approximately 15% are attributable to proved undeveloped reserves as of December 31, 2012. In order to identify drilling locations, we apply a geologic screening criterion based on presence of a minimum threshold of gross pay sand thickness in a section and then consider the number of sections and the appropriate well density to develop the applicable field. In making these assessments, we include properties in which we hold operated and non-operated interests, as well as redevelopment opportunities. Once we have identified acreage that is prospective for the targeted formations, well placement is determined primarily by the regulatory spacing rules prescribed by the governing body in each of our operating areas. Wells drilled in the Cleveland formation adhere to 128-acre spacing while wells in the Woodford shale formation are developed on 80-acre and 120-acre spacing. Wells drilled in the Granite Wash formation are being developed on 128-acre and 213-acre spacing. Wells drilled in the Tonkawa and Marmaton formations adhere to 160-acre spacing. We view the risk profiles for the Tonkawa and Marmaton formations as being higher than for our other drilling locations due to relatively less available production data and drilling history.
Our identified drilling locations are scheduled to be drilled over many years. The ultimate timing of the drilling of these locations will be influenced by multiple factors, including oil, natural gas and NGL prices, the availability and cost of capital, drilling and production costs, the availability of drilling services and equipment, drilling results, lease expirations, gathering systems, processing, marketing and pipeline transportation constraints, regulatory approvals and other factors. In addition, a number of our identified drilling locations are associated with joint development agreements, and if we do not meet our obligation to drill the minimum number of wells specified in an agreement, we will lose the right to continue to develop certain acreage covered by that agreement. For a discussion of the risks associated with our drilling program, see "Risk factors—Risks related to our business—Our identified drilling locations are scheduled to be drilled over many years, making them susceptible to uncertainties that could materially alter the occurrence or timing of their drilling, which in certain instances could prevent or delay associated expected production. In addition, we may not be able to raise the amount of capital that would be necessary to drill a substantial portion of our identified drilling locations."
108
Estimated proved reserves
The following table presents our estimated net proved oil and natural gas reserves and the standardized measure amounts associated with our estimated proved reserves as of December 31, 2010, 2011 and 2012, based on reserve reports prepared by Cawley Gillespie. The standardized measure amounts shown in the table are not intended to represent the current market value of our estimated oil and natural gas reserves.
| |
At December 31, | |||||||||
|---|---|---|---|---|---|---|---|---|---|---|
| |
2010 |
2011 |
2012 |
|||||||
Estimated proved reserves: |
||||||||||
Oil (MBbls) |
5,991 | 7,440 | 12,540 | |||||||
Natural gas (MMcf) |
108,634 | 244,579 | 228,080 | |||||||
NGLs (MBbls) |
9,953 | 34,606 | 34,746 | |||||||
Total estimated proved reserves (MBoe)(1) |
34,050 | 82,809 | 85,299 | (3) | ||||||
Estimated proved developed reserves: |
||||||||||
Oil (MBbls) |
2,646 | 2,535 | 4,262 | |||||||
Natural gas (MMcf) |
50,469 | 110,433 | 110,956 | |||||||
NGLs (MBbls) |
4,017 | 14,020 | 16,320 | |||||||
Total estimated proved developed reserves (MBoe)(1) |
15,075 | 34,961 | 39,075 | |||||||
Estimated proved undeveloped reserves: |
||||||||||
Oil (MBbls) |
3,345 | 4,905 | 8,278 | |||||||
Natural gas (MMcf) |
58,165 | 134,146 | 117,124 | |||||||
NGLs (MBbls) |
5,936 | 20,586 | 18,426 | |||||||
Total estimated proved undeveloped reserves (MBoe)(1) |
18,975 | 47,849 | 46,225 | (3) | ||||||
Standardized measure (in millions)(2) |
$ | 355 | $ | 916 | $ | 782 | ||||
(1) One Boe is equal to six Mcf of natural gas or one Bbl of oil or NGLs based on an approximate energy equivalency. This is a physical correlation and does not reflect a value or price relationship between the commodities.
(2) Standardized measure is calculated in accordance with Statement of Financial Accounting Standards No. 69 Disclosures About Oil and Gas Producing Activities, as codified in ASC Topic 932, Extractive Activities—Oil and Gas. For a description of our commodity derivative contracts, please read "Management's discussion and analysis of financial condition and results of operations—Basis of presentation."
(3) If we do not meet our obligation to drill the minimum number of wells specified in the Southridge joint development agreement, or are unable to obtain an extension under or negotiate an amendment to this agreement prior to October 31, 2013, we will lose the right to develop approximately 15.5 MMBoe of proved undeveloped reserves that were included in our estimated proved reserves as of December 31, 2012, representing approximately 18% of our proved reserves as of December 31, 2012. We estimate that we would incur an impairment charge of approximately $15 million in connection with such a reduction in our proved reserves.
The following table sets forth the benchmark prices used to determine our estimated proved reserves from proved oil and natural gas reserves for the periods indicated.
| |
At December 31, | |||||||||
|---|---|---|---|---|---|---|---|---|---|---|
| |
2010 |
2011 |
2012 |
|||||||
Oil, natural gas and NGLs prices: |
||||||||||
Oil (per Bbl)(1) |
$ | 79.43 | $ | 96.19 | $ | 94.71 | ||||
Natural gas (per MMBtu)(3) |
4.37 | 4.12 | 2.76 | |||||||
NGLs (per Bbl)(2) |
38.72 | 47.26 | 31.27 | |||||||
(1) Benchmark prices for oil at December 31, 2010, 2011 and 2012 reflect the unweighted arithmetic average first-day-of-the-month prices for the prior 12 months, using WTI Cushing posted prices. These prices were utilized in the December 31 2010, 2011 and 2012 reserve reports prepared by Cawley Gillespie and are adjusted by well for content, quality, transportation fees, geographical differentials, marketing bonuses or deductions and other factors affecting the price received at the wellhead. As of December 31, 2010, 2011 and 2012, the average realized prices for oil were $75.93, $92.04 and $90.74 per Bbl, respectively.
(2) Prices for NGLs at December 31, 2010, 2011 and 2012 in the table above reflect the average realized prices. Benchmark prices for NGLs vary depending on the composition of the NGL basket and current prices for the various components thereof, such as butane, ethane, propane, among others. Due to recent declines in ethane pricing and increases in natural gas prices, beginning in December 2012, purchasers of our
109
Woodford production have been electing not to recover ethane from the natural gas stream and instead have been paying us based on the natural gas price for the ethane left in the gas stream. As a result of the increased energy content associated with the returned ethane and the absence of plant shrinkage, this ethane rejection has increased the incremental revenue and volumes that we receive for our natural gas product relative to what we would have received if the ethane was separately recovered, but has reduced physical barrels of liquid ethane that we are selling.
(3) Benchmark prices for natural gas at December 31, 2010, 2011 and 2012 reflect the unweighted arithmetic average first-day-of-the-month prices for the prior 12 months, using Henry Hub prices. These prices were utilized in the December 31 2010, 2011 and 2012 reserve reports prepared by Cawley Gillespie and are adjusted by well for content, quality, transportation fees, geographical differentials, marketing bonuses or deductions and other factors affecting the price received at the wellhead. As of December 31, 2010, 2011 and 2012, the average realized prices for natural gas were $4.56, $3.83 and $2.24 per MMBtu, respectively.
Internal controls
Our proved reserves are estimated at the well or unit level and compiled for reporting purposes by our corporate reservoir engineering staff, all of whom are independent from our operating teams. We maintain internal evaluations of our reserves in a secure reserve engineering database. The corporate reservoir engineering staff interacts with our internal petroleum engineers and geoscience professionals in each of our operating areas and with operating, accounting and marketing employees to obtain the necessary data for the reserves estimation process. Reserves are reviewed and approved internally by our senior management team on a semi-annual basis. Following the consummation of this offering, we anticipate that the audit committee of our board of directors will conduct a similar review on a semi-annual basis. We expect to have our reserve estimates evaluated by Cawley Gillespie, our independent third-party reserve engineers, or another independent reserve engineering firm, at least annually.
Our internal professional staff works closely with Cawley Gillespie, to ensure the integrity, accuracy and timeliness of data that is furnished to them for their reserve estimation process. We provide all of the reserve information maintained in our secure reserve engineering database to the external engineers, as well as other pertinent data, such as geologic maps, well logs, production tests, material balance calculations, well performance data, operating procedures and relevant economic criteria. We make all requested information, as well as our pertinent personnel, available to the external engineers as part of their evaluation of our reserves. Various procedures are used to ensure the accuracy of the data provided to our independent petroleum engineers, including review processes. Changes in reserves from the previous report are closely monitored. Reconciliation of reserves from the previous report, which includes an explanation of all significant changes, is reviewed by both the engineering department and upper management, including our chief operating officer. Our independent petroleum engineers prepare our annual reserves estimates, whereas interim estimates are internally prepared.
Technology used to establish proved reserves
Under SEC rules, proved reserves are those quantities of oil and natural gas that by analysis of geoscience and engineering data can be estimated with reasonable certainty to be economically producible from a given date forward from known reservoirs, and under existing economic conditions, operating methods and government regulations. The term "reasonable certainty" implies a high degree of confidence that the quantities of oil and natural gas actually recovered will equal or exceed the estimate. Reasonable certainty can be established using techniques that have been proven effective by actual production from projects in the same reservoir or an analogous reservoir or by other evidence using reliable technology that establishes reasonable certainty. Reliable technology is a grouping of one or more technologies (including computational methods) that has been field tested and has been demonstrated to provide reasonably certain results with consistency and repeatability in the formation being evaluated or in an analogous formation.
To establish reasonable certainty with respect to our estimated proved reserves, our internal reserve engineers and Cawley Gillespie employed technologies that have been demonstrated to yield results with
110
consistency and repeatability. The technologies and economic data used in the estimation of our proved reserves include, but are not limited to, electrical logs, radioactivity logs, core analyses, geologic maps and available downhole and production data, seismic data and well test data. Reserves attributable to producing wells with sufficient production history were estimated using appropriate decline curves or other performance relationships. Reserves attributable to producing wells with limited production history and for undeveloped locations were estimated using performance from analogous wells in the surrounding area and geologic data to assess the reservoir continuity. These wells were considered to be analogous based on production performance from the same formation and completion using similar techniques.
Qualifications of responsible technical persons
Internal engineer. Eric Niccum, our Executive Vice President and Chief Operating Officer, is the technical person primarily responsible for overseeing the preparation of our reserves estimates. Mr. Niccum is also responsible for liaising with and oversight of our third-party reserve engineer. Mr. Niccum is a graduate of Purdue University with a Bachelor of Science degree in Mechanical Engineering. He has 20 years of energy experience.
Cawley Gillespie. Cawley, Gillespie & Associates, Inc. is a Texas Registered Engineering Firm (F-693), made up of independent registered professional engineers and geologists. The firm has provided petroleum consulting services to the oil and gas industry for over 50 years. No director, officer, or key employee of Cawley Gillespie has any financial ownership in us or any of our affiliates. Cawley Gillespie's compensation for the required investigations and preparation of its report is not contingent upon the results obtained and reported, and Cawley Gillespie has not performed other work for us that would affect its objectivity. The engineering audit presented in the Cawley Gillespie report was supervised by W. Todd Brooker, Senior Vice President at Cawley Gillespie. Mr. Brooker is an experienced reservoir engineer having been a practicing petroleum engineer since 1989. He has more than 23 years of experience in reserves evaluation and joined Cawley Gillespie as a reserve engineer in 1992. He has a Bachelors of Science Degree in Petroleum Engineering from the University of Texas at Austin and is a Registered Professional Engineer in the State of Texas (License No. 83462).
Development of proved undeveloped reserves
As of December 31, 2012, none of our proved undeveloped reserves at December 31, 2012 were scheduled to be developed on a date more than five years from the date the reserves were initially booked as proved undeveloped. However, certain of our proved undeveloped reserves are associated with joint development agreements with third parties that include obligations to drill a specified minimum number of wells in a time frame that is shorter than five years. If we do not meet our obligation to drill the minimum number of wells specified in a joint development agreement, we will lose the right to continue to develop the undeveloped acreage covered by the agreement, which in some cases would result in a reduction in our proved undeveloped reserves. Historically, our drilling and development programs were substantially funded from our cash flow from operations. Our expectation is to continue to fund our drilling and development programs primarily from our cash flow from operations. Based on our current expectations of our cash flows and drilling and development programs, which include drilling of proved undeveloped locations, we believe that we can fund the drilling of our current inventory of proved undeveloped locations and our expansion activities in the next five years from our cash flow from operations and, if needed, borrowings under our senior secured revolving credit facility. For a more detailed discussion of our liquidity position, please read "Management's discussion and analysis of financial condition and results of operations—Liquidity and capital resources."
111
Our proved undeveloped reserves have decreased from 47.8 MBoe at December 31, 2011 to 46.2 MBoe at December 31, 2012 due to (i) the conversion of 5.4 MBoe of proved undeveloped reserves to proved developed reserves; (ii) negative revisions of 9.8 MBoe, primarily due to production performance in the southern part of the Woodford shale formation; (iii) additions of 1.0 MBoe from extensions and discoveries; and (iv) additions of 12.6 MBoe for purchases of minerals in place. Proved undeveloped reserves declined as a percentage of total reserves from 58% for the year ending December 31, 2011 to 54% for the year ending December 31, 2012. For the year ended December 31, 2012, we converted 5.4 MBoe of proved undeveloped reserves to proved developed reserves or 11% of total proved undeveloped reserves booked at December 31, 2011. We incurred approximately $58 million in capital to convert proved undeveloped reserves to proved developed reserves during the year ended December 31, 2012. Our 2012 capital expenditures, excluding acquisitions, totaled $122.1 million, during which we drilled 48 gross wells. We expect our 2013 capital expenditure budget to be approximately $204.0 million, $180 million of which we expect to use to drill and complete 93 gross (54 net) wells, which represents a 94% increase from 2012. Costs of proved undeveloped reserve development in 2012 do not represent the total costs of these conversions, as additional costs may have been recorded in previous years. Estimated future development costs relating to the development of 2012 year-end proved undeveloped reserves is $521 million.
Production, revenues and price history
The following table sets forth information regarding production volumes, average prices and average production costs associated with our sale of oil and natural gas for the periods indicated.
| |
Year ended December 31, | Three months ended March 31, |
||||||||||||||
|---|---|---|---|---|---|---|---|---|---|---|---|---|---|---|---|---|
| |
2010 |
2011 |
2012 |
2012 |
2013 |
|||||||||||
Production and operating data: |
||||||||||||||||
Net production volumes(1): |
||||||||||||||||
Oil (MBbls) |
593 | 811 | 746 | 194 | 312 | |||||||||||
Natural gas (MMcf) |
10,931 | 11,443 | 14,066 | 3,545 | 4,266 | |||||||||||
NGLs (MBbls)(2) |
— | 1,215 | 1,773 | 446 | 406 | |||||||||||
Total (MBoe) |
2,415 | 3,933 | 4,863 | 1,231 | 1,429 | |||||||||||
Average net production (Boe/d) |
6,616 | 10,776 | 13,288 | 13,527 | 15,878 | |||||||||||
Average sales price(3): |
||||||||||||||||
Oil (per Bbl) |
$ | 73.79 | $ | 90.96 | $ | 89.71 | $ | 98.25 | $ | 88.38 | ||||||
Natural gas (per Mcf) |
4.92 | 3.49 | 2.17 | 2.09 | 3.00 | |||||||||||
NGLs (per Bbl)(2) |
— | 44.04 | 29.07 | 36.00 | 36.69 | |||||||||||
Combined (per Boe) realized |
$ | 40.38 | $ | 42.53 | $ | 34.07 | $ | 34.54 | $ | 38.67 | ||||||
Average unit costs per Boe: |
||||||||||||||||
Lease operating expense |
$ | 6.44 | $ | 5.30 | $ | 4.56 | $ | 4.34 | $ | 3.15 | ||||||
Production and ad valorem tax expense |
1.22 | 1.53 | 1.34 | 1.44 | 2.30 | |||||||||||
Depreciation, depletion and amortization |
19.88 | 17.52 | 16.60 | 15.25 | 17.57 | |||||||||||
General and administrative |
4.73 | 4.24 | 3.26 | 2.99 | 2.94 | |||||||||||
(1) The
Coalgate Woodford field constituted approximately 41% of our estimated proved reserves as of December 31, 2012. Our production from the Coalgate Woodford field was 675 Mboe
and 1,529 MBoe for the years ended December 31, 2011 and 2012, respectively. The 2011 production was comprised of 10 MBbls of oil, 2,029 MMcf of natural gas and
327 MBbls NGLs. The 2012 production was comprised of 33 MBbls of oil, 4,357 MMcf of natural gas and 770 MBbls of NGLs. The Coalgate Woodford field was acquired in April 2011,
therefore we had no production from the field for the year ended December 31, 2010.
The Lipscomb SE field constituted approximately 21% of our estimated proved reserves as of December 31, 2012. Our production from the Lipscomb SE field was 36 MBoe for the year ended
December 31, 2012. The 2012 production was comprised of 17 MBbls of oil, 61 MMcf of
112
natural gas and 9 MBbls of NGLs. The Lipscomb SE field was acquired in December 2012, therefore we had no production from the field for the years ended December 31, 2010 and 2011.
(2) We did not track NGLs as a separate product category in 2010. The production of NGLs was included in total natural gas production for that year.
(3) Prices do not include the effects of derivative cash settlements.
Productive wells
The following table sets forth our total gross and net productive wells by oil or natural gas completion as of December 31, 2012.
| |
Oil | Natural gas | |||||||||||
|---|---|---|---|---|---|---|---|---|---|---|---|---|---|
| |
Gross |
Net |
Gross |
Net |
|||||||||
Operated(1) |
95 | 74 | 300 | 200 | |||||||||
Non-operated |
25 | 4 | 300 | 52 | |||||||||
Total |
120 | 78 | 600 | 252 | |||||||||
(1) Includes wells on which we act as contract operator.
Gross wells are the total number of producing wells in which we own an interest, and net wells are the sum of our fractional working interests owned in gross wells.
Acreage summary
The following table sets forth certain information regarding the developed and undeveloped acreage in which we have an interest as of April 30, 2013 for each of our operating areas. Acreage related to royalty, overriding royalty and other similar interests is excluded from this summary. As of April 30, 2013, over 81% of our leasehold acreage was held by existing production.
| |
Developed acres | Undeveloped acres | Total | ||||||||||||||||
|---|---|---|---|---|---|---|---|---|---|---|---|---|---|---|---|---|---|---|---|
| |
Gross |
Net |
Gross |
Net |
Gross |
Net |
|||||||||||||
Cleveland |
88,745 | 51,539 | 13,700 | 9,036 | 102,445 | 60,575 | |||||||||||||
Woodford(1) |
8,889 | 2,533 | 5,650 | 1,192 | 14,539 | 3,725 | |||||||||||||
Granite Wash |
10,011 | 3,915 | — | — | 10,011 | 3,915 | |||||||||||||
Other |
21,335 | 7,401 | 16,582 | 5,361 | 37,917 | 12,762 | |||||||||||||
All properties(2) |
128,980 | 65,388 | 35,932 | 15,589 | 164,912 | 80,977 | |||||||||||||
(1) Excludes gross and net acreage associated with the joint development agreements with Vanguard and Southridge. Acreage associated with the Vanguard joint development agreement is assigned to us at the time the first well in each unit is pooled and/or drilled. Acreage associated with the Southridge joint development agreement is assigned to us upon the completion of the Company's sixtieth development well. As of April 30, 2013, the Company had drilled 28 of the 60 Southridge development wells.
(2) Includes proved undeveloped reserves associated with joint development agreements with third parties. If we do not meet our obligation to drill the minimum number of wells specified in a joint development agreement, we will lose the right to continue to develop the undeveloped acreage covered by the agreement, which would result in the loss of any proved undeveloped reserves attributable to such undeveloped acreage. Please see "Risk Factors—If we do not fulfill our obligation to drill the minimum number of wells specified in our joint development agreements, we will lose the right to develop the undeveloped acreage associated with the agreement and any proved undeveloped reserves attributable to such undeveloped acreage.
Undeveloped acreage expirations
The following table sets forth the number of gross and net undeveloped acres as of April 30, 2013 that will expire over the next three years by operating area unless production is established within the spacing
113
units covering the acreage prior to the expiration dates or unless the existing leases are renewed prior to expiration.
| |
Expiring 2013 | Expiring 2014 | Expiring 2015 | ||||||||||||||||
|---|---|---|---|---|---|---|---|---|---|---|---|---|---|---|---|---|---|---|---|
| |
Gross |
Net |
Gross |
Net |
Gross |
Net |
|||||||||||||
Cleveland |
2,829 | 1,869 | 6,048 | 2,766 | 5,545 | 4,232 | |||||||||||||
Woodford |
297 | 229 | 2,517 | 299 | 3,506 | 662 | |||||||||||||
Granite Wash |
— | — | — | — | — | — | |||||||||||||
Other |
3,860 | 511 | 142 | 27 | — | — | |||||||||||||
All properties |
6,986 | 2,609 | 8,707 | 3,092 | 9,051 | 4,894 | |||||||||||||
A majority of the leases comprising the acreage set forth in the table above will expire at the end of their respective primary terms unless production from the acreage has been established prior to such date, in which event the lease will remain in effect until the cessation of production in commercial quantities. We also have options to extend some of our leases through payment of additional lease bonus payments prior to the expiration of the primary term of the leases. In addition, we may attempt to secure a new lease upon the expiration of certain of our acreage; however, there may be third party leases that become effective immediately if our leases expire at the end of their respective terms and production has not been established prior to such date. Approximately 0.8 MMBoe of our proved undeveloped reserves, or 0.9% of our total proved reserves as of December 31, 2012, are attributable to acreage whose lease expiration date precedes the scheduled initial drilling date for such proved undeveloped reserves. Our leases are mainly fee leases with primary terms of three to five years. We believe that our lease terms are similar to our competitors' fee lease terms as they relate to both primary term and royalty interests.
Drilling activity
The following table sets forth information with respect to wells drilled and completed during the periods indicated. The information should not be considered indicative of future performance, nor should a correlation be assumed between the number of productive wells drilled, quantities of reserves found or economic value.
| |
Year ended December 31, | ||||||||||||||||||
|---|---|---|---|---|---|---|---|---|---|---|---|---|---|---|---|---|---|---|---|
| |
2010 | 2011 | 2012 | ||||||||||||||||
| |
Gross |
Net |
Gross |
Net |
Gross |
Net |
|||||||||||||
Development wells: |
|||||||||||||||||||
Productive |
47 | 32 | 71 | 34 | 44 | 22 | |||||||||||||
Mechanical failure |
2 | 1 | — | — | 2 | 1 | |||||||||||||
Dry |
— | — | — | — | — | — | |||||||||||||
Exploratory wells: |
|||||||||||||||||||
Productive |
1 | 1 | — | — | — | — | |||||||||||||
Dry |
2 | 2 | 2 | 1 | 2 | 1 | |||||||||||||
Total wells: |
|||||||||||||||||||
Productive |
48 | 33 | 71 | 34 | 44 | 22 | |||||||||||||
Mechanical failure |
2 | 1 | — | — | 2 | 1 | |||||||||||||
Dry |
2 | 2 | 2 | 1 | 2 | 1 | |||||||||||||
Total |
52 | 36 | 73 | 34 | 48 | 24 | |||||||||||||
114
For the three years ended December 31, 2012, we had no developmental wells that were deemed dry wells and 6 gross (3 net) exploratory wells deemed dry wells. In this same period, we experienced a total of 4 mechanical failures that were not reservoir related. As of December 31, 2012, there were 6 gross (3 net) development wells in the process of drilling or completion. For the three years ended December 31, 2012, we drilled 154 gross (91 net) wells as operator with over a 95% success rate.
From January 1, 2012 through December 31, 2012, we successfully drilled 26 proved undeveloped wells and completed 24 proved undeveloped wells. The 2 remaining drilled proved undeveloped wells are waiting on completions.
Since December 31, 2012, we have drilled 23 gross (14 net) wells, 17 of which were completed as producing wells and 6 of which are in various stages of completion.
Oil and natural gas leases
The typical oil and natural gas lease agreement covering our properties provides for the payment of royalties to the mineral owner for all oil and natural gas produced from any wells drilled on the leased premises. The lessor royalties and other leasehold burdens on our properties generally range from 20% to 25%, resulting in a net revenue interest to us ranging from 25% to 65%, or 35% on average for most of our leases.
Over 81% of our leases are held by production and do not require lease rental payments.
Marketing and major customers
Our oil is generally sold under short-term, extendable and cancellable agreements with unaffiliated purchasers based on published price bulletins reflecting an established field posting price. As a consequence, the prices we receive for oil and liquids move up and down in direct correlation with the oil market as it reacts to supply and demand factors. We do not own any oil or liquids pipelines or other assets for the transportation of those commodities, and transportation costs related to moving oil are deducted from the price received for oil.
Our natural gas is sold under both long-term and short-term natural gas purchase agreements. Natural gas produced by us is sold at various delivery points at or near producing wells to natural gas gathering and marketing companies. We receive proceeds from prices that are based on various pipeline indices less any associated fees. For approximately 98% of our natural gas production, we are paid for the extracted NGLs based on a negotiated percentage of the proceeds that are generated from the customer's sale of the liquids, or based on other negotiated pricing arrangements. We do not own any natural gas pipelines or other assets for the transportation of natural gas.
Recently, changes in NGL prices have altered market conditions. Due primarily to the large supply of ethane on the market, the price of ethane has dropped significantly over the last year. For a discussion of the effect of recent changes in NGL prices, see "Managements discussion and analysis of financial condition and results of operations—Factors that significantly affect our results of operations."
A majority of those agreements have terms that renew on a month-to-month or an annual basis until either party gives advance written notice of non-renewal.
During the year ended December 31, 2012, four of our largest purchasers, Unimark LLC, Mercuria, PVR Midstream, and Plains Marketing, accounted for approximately 24%, 18%, 18% and 15% of our consolidated oil and gas sales, respectively. If we were to lose any one of our customers, the loss could temporarily delay production and sale of our oil and natural gas in the related producing region. If we were to lose any single customer, we believe we could identify a substitute customer to purchase the impacted production volumes. However, if one or more of our larger customers ceased purchasing oil or natural gas altogether, the loss of such customer could have a detrimental effect on our production volumes in general and on our ability to find substitute customers to purchase our production volumes. For a discussion of the risks associated with the loss of key customers, please read "Risk factors—Risks related to our business—Our customer base is concentrated, and the loss of any one of our key customers could, therefore, adversely affect our financial condition and results of operations."
115
Competition
The oil and natural gas industry is highly competitive. We compete with numerous entities, including major domestic and foreign oil companies, other independent oil and natural gas concerns and individual producers and operators. Many of these competitors are large, well-established companies and have financial and other resources substantially greater than ours. As a result, our competitors may be able to pay more for productive oil and natural gas properties and exploratory prospects, as well as evaluate, bid for and purchase a greater number of properties and prospects than our financial or personnel resources permit. Our ability to acquire additional properties and to find and develop reserves will depend on our ability to evaluate and select suitable properties and to consummate transactions in a highly competitive environment. Please read "Risk factors—Risks related to our business—We may be unable to compete effectively with larger companies, which may adversely affect our ability to generate sufficient revenues."
We are also affected by competition for drilling rigs, equipment, services, supplies and qualified personnel. In recent years, the United States onshore oil and natural gas industry has experienced shortages of drilling and completion rigs, equipment, pipe and personnel, which have delayed development drilling and other exploration activities and caused significant increases in the prices for this equipment and personnel. We are unable to predict when, or if, such shortages may occur or how they would affect our development and exploitation programs.
Title to properties
Prior to completing an acquisition of producing oil and natural gas properties, we perform title reviews on significant leases, and depending on the materiality of properties, we may obtain a title opinion or review previously obtained title opinions. As a result, title examinations have been obtained on a significant portion of our properties. After an acquisition, we review the assignments from the seller for scrivener's and other errors and execute and record corrective assignments as necessary.
As is customary in the oil and natural gas industry, we initially conduct only a cursory review of the titles to our properties on which we do not have proved reserves. Prior to the commencement of drilling operations on those properties, we conduct a thorough title examination and perform curative work with respect to significant defects. To the extent title opinions or other investigations reflect title defects on those properties, we are typically responsible for curing any title defects at our expense. We generally will not commence drilling operations on a property until we have cured any material title defects on such property.
We conduct a substantial portion of our operations through joint development agreements with third parties. Certain of our joint development agreements include drill-to-earn arrangements, whereby we are assigned title to properties from the third party after we complete wells and, in the case of certain counterparties, after completion reports relating to the wells have been approved by regulatory authorities, whose approval may be delayed. Furthermore, certain of our joint development agreements specify that assignments are only to occur when the wells are capable of producing hydrocarbons in paying quantities. These additional conditions to assignment of title may from time to time apply to wells of substantial value.
We believe that we have satisfactory title to all of our material assets. Although title to these properties is subject to encumbrances in some cases, such as customary interests generally retained in connection with the acquisition of real property, customary royalty interests and contract terms and restrictions, liens under operating agreements, liens related to environmental liabilities associated with historical operations,
116
liens for current taxes and other burdens, easements, restrictions and minor encumbrances customary in the oil and natural gas industry, we believe that none of these liens, restrictions, easements, burdens and encumbrances will materially detract from the value of these properties or from our interest in these properties or materially interfere with our use of these properties in the operation of our business. In addition, we believe that we have obtained sufficient rights-of-way grants and permits from public authorities and private parties for us to operate our business in all material respects as described in this prospectus.
Seasonality
Generally, but not always, the demand for natural gas decreases during the summer months and increases during the winter months, resulting in seasonal fluctuations in the price we receive for our natural gas production. Seasonal anomalies such as mild winters or hot summers sometimes lessen this fluctuation.
Regulation of the oil and natural gas industry
Our operations are substantially affected by federal, state and local laws and regulations. In particular, natural gas production and related operations are, or have been, subject to price controls, taxes and numerous other laws and regulations. All of the jurisdictions in which we own or operate producing oil and natural gas properties have statutory provisions regulating the exploration for and production of oil and natural gas, including provisions related to permits for the drilling of wells, bonding requirements to drill or operate wells, the location of wells, the method of drilling and casing wells, the surface use and restoration of properties upon which wells are drilled, sourcing and disposal of water used in the drilling and completion process, and the abandonment of wells. Our operations are also subject to various conservation laws and regulations. These include the regulation of the size of drilling and spacing units or proration units, the number of wells which may be drilled in an area, and the unitization or pooling of wells, as well as regulations that generally prohibit the venting or flaring of natural gas, and impose certain requirements regarding the ratability or fair apportionment of production from fields and individual wells. The effect of these regulations is to limit the amount of oil and natural gas that we can produce from our wells and limit the number of wells or locations at which we can drill, although we can apply for exceptions to such regulations or to have reductions in well spacing. Moreover, each state generally imposes a production or severance tax with respect to the production and sale of oil, natural gas and NGLs within its jurisdiction.
Failure to comply with applicable laws and regulations can result in substantial penalties. The regulatory burden on the industry increases the cost of doing business and affects profitability. Although we believe we are in substantial compliance with all applicable laws and regulations, such laws and regulations are frequently amended or reinterpreted. Therefore, we are unable to predict the future costs or impact of compliance. Additional proposals and proceedings that affect the oil and natural gas industry are regularly considered by Congress and federal agencies, the states, and the courts. We cannot predict when or whether any such proposals may become effective. Our competitors in the oil and natural gas industry are subject to the same regulatory requirements and restrictions that affect our operations.
117
Environmental matters and regulation
Our operations are subject to stringent and complex federal, state and local laws and regulations that govern the protection of the environment, as well as the discharge of materials into the environment. These laws and regulations may, among other things:
- •
- require the acquisition of various permits before drilling commences;
- •
- require the installation of pollution control equipment in connection with operations;
- •
- place restrictions or regulations upon the use of the material based on our operations;
- •
- restrict the types, quantities and concentrations of various substances that can be released into the environment or used
in connection with drilling, production and transportation activities;
- •
- limit or prohibit drilling activities on lands lying within wilderness, wetlands and other protected areas;
and
- •
- require remedial measures to mitigate pollution from former and ongoing operations, such as site restoration, pit closure and plugging of abandoned wells.
These laws, rules and regulations may also restrict the rate of oil and natural gas production below the rate that would otherwise be possible. The regulatory burden on the oil and natural gas industry increases the cost of doing business in the industry and consequently affects profitability. Additionally, federal, state and local lawmakers and agencies frequently revise environmental laws and regulations, and such changes could result in increased costs for environmental compliance, such as waste handling, permitting, or cleanup for the oil and natural gas industry and could have a significant impact on our operating costs.
The following is a summary of some of the existing laws, rules and regulations to which our business operations are subject.
Solid and hazardous waste handling and releases
The federal Resource Conservation and Recovery Act, or RCRA, and comparable state statutes regulate the generation, transportation, treatment, storage, disposal and cleanup of hazardous and non-hazardous waste. Drilling fluids, produced waters, and most of the other wastes associated with the exploration, development, production and transportation of oil and gas are currently excluded from regulation as hazardous wastes under RCRA. In the course of our operations, however, we generate some industrial wastes, such as paint wastes, waste solvents, and waste oils, which may be regulated as hazardous wastes. Although a substantial amount of the waste generated in our operations are regulated as non- hazardous solid waste rather than hazardous waste, there is no guarantee that the EPA or individual states will not adopt more stringent requirements for the handling of non- hazardous waste. Moreover, it is possible that certain oil and gas exploration and production wastes now classified as non-hazardous could be classified as hazardous wastes in the future. Any such change could result in an increase in our costs to manage and dispose of waste, which could have a material adverse effect on our results of operations and financial position.
The Comprehensive Environmental Response, Compensation and Liability Act, or CERCLA, also known as "Superfund," and comparable state laws and regulations impose liability without regard to fault or legality of the original conduct, on certain classes of persons with respect to the release into the environment of substances designated under CERCLA as hazardous substances. These classes of persons, or so-called potentially responsible parties, or PRPs, include the current and past owners or operators of a site where
118
the release occurred and anyone who disposed or arranged for the disposal of a hazardous substance released at the site. Under CERCLA, such persons may be subject to joint and several, strict liability for the costs of cleaning up the hazardous substances that have been released into the environment, for damages to natural resources and for the costs of certain health studies. CERCLA also authorizes the U.S. Environmental Protection Agency, or the EPA, and, in some instances, third parties to take actions in response to threats to public health or the environment and to seek to recover from the PRPs the costs of such action. Many states have adopted comparable or more stringent state statutes. In addition, it is not uncommon for neighboring landowners and other third parties to file claims for personal injury and property damage allegedly caused by the hazardous substances released into the environment.
Although CERCLA generally exempts "petroleum" from the definition of hazardous substance, in the course of our operations, we have generated and will generate wastes that may fall within CERCLA's definition of hazardous substances and may have disposed of these wastes at disposal sites owned and operated by others. We may also be the owner or operator of sites on which hazardous substances have been released. To our knowledge, neither we nor our predecessors have been designated as a PRP by the EPA under CERCLA; we also do not know of any prior owners or operators of our properties that are named as PRPs related to their ownership or operation of such properties. In the event contamination is discovered at a site on which we are or have been an owner or operator or to which we sent hazardous substances, we could be liable for the costs of investigation and remediation and natural resources damages.
We currently own, lease, or operate numerous properties that have been used for oil and natural gas exploration and production for many years. Although we believe we have utilized operating and waste disposal practices that were standard in the industry at the time, hazardous substances, wastes or hydrocarbons may have been released on or under the properties owned or leased by us, or on or under other locations, including offsite locations, where such substances have been taken for disposal. In addition, some of these properties have been operated by third parties or by previous owners or operators whose treatment and disposal of hazardous substances, wastes, or hydrocarbons were not under our control. These properties and the substances disposed or released on them may be subject to the RCRA, CERCLA, and analogous state laws. Spills or other contamination required to be remediated has not required material capital expenditures to date. In the future, we could be required to remediate property, including groundwater, containing or impacted by previously disposed wastes (including wastes disposed or released by prior owners or operators, or property contamination, including groundwater contamination by prior owners or operators) or to perform remedial plugging operations to prevent future or mitigate existing contamination.
Clean Water Act
The Federal Water Pollution Control Act, or the Clean Water Act, and analogous state laws impose restrictions and strict controls with respect to the discharge of pollutants, including spills and leaks of produced water and other oil and natural gas wastes, into waters of the United States, a term broadly defined. The discharge of pollutants into regulated waters is prohibited, except in accordance with the terms of a permit issued by EPA or an analogous state agency. The Clean Water Act also prohibits the discharge of dredge and fill material in regulated waters, including wetlands, unless authorized by a permit issued by the U.S. Army Corps of Engineers. Federal and state regulatory agencies can impose administrative, civil and criminal penalties, as well as require remedial or mitigation measures, for non- compliance with discharge permits or other requirements of the Clean Water Act and analogous state laws and regulations. In the event of an unauthorized discharge of wastes, we may be liable for penalties and costs. The EPA has announced its intention to propose regulations by 2014 under the Clean Water Act to
119
develop standards for wastewater discharges from hydraulic fracturing and other natural gas production activities.
Safe Drinking Water Act
The SDWA regulates, among other things, underground injection operations. Recent legislative activity has occurred which, if successful, would impose additional regulation under the SDWA upon the use of hydraulic fracturing fluids. Congress has considered, but not acted upon, two companion bills entitled the FRAC Act. If enacted, the legislation would impose on our hydraulic fracturing operations permit and financial assurance requirements, requirements that we adhere to construction specifications, fulfill monitoring, reporting and recordkeeping obligations, and meet plugging and abandonment requirements. In addition to subjecting the injection of hydraulic fracturing to the SDWA regulatory and permitting requirements, the proposed legislation would require the disclosure of the chemicals within the hydraulic fluids, which could make it easier for third parties opposing hydraulic fracturing to initiate legal proceedings based on allegations that specific chemicals used in the process could adversely affect ground water. Neither piece of legislation has been passed. In addition, the EPA has taken the position that hydraulic fracturing with fluids containing diesel fuel is subject to the Underground Injection Control program and has released draft permitting guidance on the use of diesel fuel as an additive in hydraulic fracturing fluids. The EPA has also commenced a study of the potential adverse effects that hydraulic fracturing may have on water quality and public health, and a committee of the U.S. House of Representatives has commenced its own investigation into hydraulic fracturing practices. The Department of Energy, at the direction of the President, also studied hydraulic fracturing and provided broad recommendations regarding best practices and other steps to enhance companies' safety and environmental performance of hydraulic fracturing. If the pending or similar legislation is enacted or other new requirements or restrictions regarding hydraulic fracturing are adopted as a result of these studies, we could incur substantial compliance costs and the requirements could negatively impact our ability to conduct fracturing activities on our assets.
Other regulation of hydraulic fracturing
On November 23, 2011, the EPA announced that it was granting in part a petition to initiate rulemaking under the Toxic Substances Control Act, relating to chemical substances and mixtures used in oil and gas exploration and production. Also, BLM is considering proposed rules regarding well stimulation, chemical disclosures, and other requirements for hydraulic fracturing on federal and Indian lands. BLM released a proposed rule requiring the disclosure of chemicals used during hydraulic fracturing and addressing drilling plans, water management, and wastewater disposal on federal and Indian lands in May 2012. However, BLM pulled back its proposal in January 2013 after reviewing comments and published an updated proposed rule on May 24, 2013 with comments due August 23, 2013. President Obama created the Interagency Working Group on Unconventional Natural Gas and Oil by Executive Order on April 13, 2012, which is charged with coordinating and aligning federal agency research and scientific studies on unconventional natural gas and oil resources.
Hydraulic fracturing is also subject to regulation at the state and local levels. Several states have proposed or adopted legislative or administrative rules regulating hydraulic fracturing operations. For example, the Railroad Commission of Texas, implementing a state law passed in June 2011, adopted the Hydraulic Fracturing Chemical Disclosure Rule on December 13, 2011. The rule requires public disclosure of chemicals in fluids used in the hydraulic fracturing process for drilling permits issued after February 1, 2012. Additionally, Texas has authorized the Texas Commission on Environmental Quality to suspend water use rights for oil and gas users in the event of serious drought conditions and has imposed more stringent
120
emissions, monitoring, inspection, maintenance, and repair requirements on Barnett Shale operators to minimize Volatile Organic Compound, or VOC, releases. Other states that we operate in, including Louisiana and Oklahoma, have adopted similar chemical disclosure measures. Please see "Risk factors—Risks related to our business—Federal and state legislative and regulatory initiatives relating to hydraulic fracturing and other oil and gas production activities as well as governmental reviews of such activities could result in increased costs, additional operating restrictions or delays, which could adversely affect our production" for a further discussion of state hydraulic fracturing regulation. In addition to state laws, local land use restrictions, such as city ordinances, may restrict or prohibit the performance of well drilling in general and/or hydraulic fracturing in particular.
Oil Pollution Act
The primary federal law related to oil spill liability is the Oil Pollution Act, or the OPA, which amends and augments oil spill provisions of the Clean Water Act and imposes certain duties and liabilities on certain "responsible parties" related to the prevention of oil spills and damages resulting from such spills in or threatening United States waters or adjoining shorelines. For example, operators of certain oil and gas facilities must develop, implement and maintain facility response plans, conduct annual spill training for certain employees and provide varying degrees of financial assurance. A liable "responsible party" includes the owner or operator of a facility, vessel or pipeline that is a source of an oil discharge or that poses the substantial threat of discharge, or in the case of offshore facilities, the lessee or permittee of the area in which a discharging facility is located. OPA assigns strict joint and several liability, without regard to fault, to each liable party for oil removal costs and a variety of public and private damages. Although defenses exist to the liability imposed by OPA, they are limited. In the event of an oil discharge or substantial threat of discharge, we may be liable for costs and damages.
Air emissions
Our operations may be subject to the Clean Air Act, or CAA, and comparable state and local requirements for the control of emissions from sources of air pollution. Federal and state laws require new and modified sources of air pollutants to obtain permits prior to commencing construction. Major sources of air pollutants are subject to more stringent, federally imposed requirements including additional permits. Federal and state laws designed to control hazardous (toxic) air pollutants, might require installation of additional controls. Administrative enforcement actions for failure to comply strictly with air pollution regulations or permits are generally resolved by payment of monetary fines and correction of any identified deficiencies. Alternatively, regulatory agencies could bring lawsuits for civil penalties or injunctions or require us to forego construction, modification or operation of certain air emission sources.
We may incur expenditures in the future for air pollution control equipment in connection with obtaining or maintaining operating permits and approvals for air emissions. For instance, on April 17, 2012, the EPA released final rules that will establish new air emission controls for oil and natural gas production and natural gas processing operations. The rules became effective on October 15, 2012. Specifically, the EPA's rule package includes New Source Performance Standards to address emissions of sulfur dioxide and volatile organic compounds, and a separate set of emission standards to address hazardous air pollutants frequently associated with oil and natural gas production and processing activities. The rules establish specific requirements regarding emissions from compressors, dehydrators, storage tanks and other production equipment in addition to leak detection requirements for natural gas processing plants. In October 2012, several challenges to the EPA's rules were filed by various parties, including environmental groups and industry associations. In a January 16, 2013 unopposed motion to hold this litigation in abeyance, the EPA indicated that it may reconsider some aspects of the rules. Depending on the outcome
121
of such proceedings, the rules may be modified or rescinded or the EPA may issue new rules. Additionally, on December 11, 2012, seven states submitted a notice of intent to sue the EPA to compel the agency to make a determination as to whether standards of performance limiting methane emissions from oil and gas sources are appropriate, and, if so, to promulgate performance standards for methane emissions from the oil and gas sector, which was not addressed in the EPA rules that became effective on October 15, 2012. The notice of intent also requested the EPA issue emission guidelines for the control of methane emissions from existing oil and gas sources. These rules that became effective on October 15, 2012, as well as any modifications to these rules or additional rules, could require a number of modifications to our operations including the installation of new equipment.
Endangered species and migratory birds
The Endangered Species Act, or ESA, restricts activities that may affect endangered or threatened species or their habitats. Pursuant to the ESA, if a species is listed as threatened or endangered, restrictions may be imposed on activities adversely affecting that species or its habitat. Similar protections are offered to migratory birds under the Migratory Bird Treaty Act. Criminal liability can attach for even an incidental taking of migratory birds, and the federal government recently issued indictments under the Migratory Bird Treaty Act to several oil and gas companies after dead migratory birds were found near reserve pits associated with drilling activities.
We conduct operations in areas where certain species that are listed as threatened or endangered under the ESA exist. For example, our operations in Oklahoma overlap with the range of the American Burying Beetle, which is listed as endangered. The presence of endangered or threatened species may force us to modify or terminate our operations in certain areas. Additionally, the designation of previously unidentified endangered or threatened species could cause us to incur additional costs or become subject to operating restrictions or bans or limit future development activity in the affected areas. For example, the U.S. Fish and Wildlife Service proposed on December 11, 2012, to list the lesser prairie chicken as a threatened species under the Endangered Species Act. The period for the public to submit comments on this proposal was set to expire on March 11, 2013 but, in response to requests submitted by federal congressmen, the Fish and Wildlife Service reopened the comment period on May 6, 2013. A final decision regarding whether to finalize the proposal is expected by September 30, 2013. The listing of the lesser prairie chicken, or any other species in areas that we operate, could force us to incur additional costs and delay or otherwise limit our operations.
National Environmental Policy Act
Oil and natural gas exploration and production activities on federal lands may be subject to the National Environmental Policy Act, or NEPA, which requires federal agencies, including the Department of Interior, to evaluate major agency actions having the potential to significantly impact the environment. In the course of such evaluations, an agency will prepare an Environmental Assessment that assesses the potential direct, indirect and cumulative impacts of a proposed project and, if necessary, will prepare a more detailed Environmental Impact Statement that may be made available for public review and comment. All of our current exploration and production activities, as well as proposed exploration and development plans, on federal lands require governmental permits that are subject to the requirements of NEPA. This process has the potential to delay or impose additional conditions upon the development of oil and natural gas projects.
122
Climate change
More stringent laws and regulations relating to climate change and greenhouse gases, or GHGs, may be adopted in the future and could cause us to incur material expenses in complying with them. Both houses of Congress have actively considered legislation to reduce emissions of GHGs, but no legislation has yet passed. In the absence of comprehensive federal legislation on GHG emission control, the EPA has begun to regulate GHGs as pollutants under the CAA. The EPA has adopted regulations affecting emissions of GHGs from motor vehicles and is also requiring permit review for GHGs from certain stationary sources. In June 2010, the EPA adopted the Prevention of Significant Deterioration and Title V Greenhouse Gas Tailoring Rule, which sets regulatory emissions thresholds for stationary sources of GHGs under the Prevention of Significant Deterioration (PSD) and Title V programs. PSD permitting has been applicable to new and modified stationary sources that emit GHGs above statutory and regulatory thresholds since January 2, 2011. The EPA has announced its intent to consider lowering the Tailoring Rule regulatory thresholds, which would likely subject additional stationary sources to GHG permitting requirements under the PSD and Title V programs. We do not believe our operations are currently subject to these permitting requirements, but if our operations become subject to these or other similar requirements, we could incur significant costs to control our emissions and comply with regulatory requirements.
In addition, the EPA has adopted a mandatory GHG emissions reporting program that imposes reporting and monitoring requirements on various types of facilities and industries. On November 9, 2010, the EPA issued final rules to expand its existing GHG reporting rule to include onshore oil and natural gas production, processing, transmission, storage, and distribution facilities. Reporting was first required in 2012 for emissions occurring in 2011. Our operations are not currently subject to this program, but there is no guarantee that the EPA will not expand the program to additional sources and facilities. Should we be required to report GHG emissions, it could require us to incur costs to monitor, keep records of, and report emissions of GHGs.
The EPA has also proposed the first New Source Performance Standards (NSPS) for GHG emissions. The proposed GHG NSPS applies to carbon dioxide emissions from certain electric utility generating units. This proposed NSPS does not regulate our operations, but if EPA were to promulgate a GHG NSPS applicable to our operations we could incur significant costs to control our emissions and comply with regulatory requirements.
Because of the lack of any comprehensive legislative program addressing GHGs, there is continuing uncertainty regarding the further development of federal regulation of GHG-emitting sources. Additionally, more than 20 states, either individually or as part of regional initiatives, have begun taking actions to control and/or reduce GHG emissions primarily through the planned development of GHG emission inventories and/or regional GHG cap and trade programs. Most of these cap and trade programs work by requiring major sources of emissions to acquire and surrender emission allowances. The federal, regional and local regulatory initiatives also could adversely affect the marketability of the oil and natural gas we produce. The impact of such future programs cannot be predicted, but we do not expect our operations to be affected any differently than other similarly situated domestic competitors.
In addition to legislative and regulatory developments, plaintiffs have brought judicial actions under common law theories against greenhouse gas emitting companies in recent years. For example, municipal plaintiffs in Kivalina v. ExxonMobil Corporation, et al, alleged that the defendant corporations' contributions to global warming caused property damage associated with rising sea levels. Although the plaintiffs in Kivalina were ultimately unsuccessful, there is a continuing litigation risk associated with greenhouse gas-emitting activities.
123
OSHA and other laws and regulation
We are subject to the requirements of the federal Occupational Safety and Health Act, or OSHA, and comparable state statutes. These laws and the implementing regulations strictly govern the protection of the health and safety of employees. The OSHA hazard communication standard, the EPA community right- to- know regulations under the Title III of CERCLA and similar state statutes require that we organize and/or disclose information about hazardous materials used or produced in our operations and that this information be provided to employees, state and local government authorities and citizens. We believe that we are in substantial compliance with these applicable requirements and with other OSHA and comparable requirements.
We believe that we are in substantial compliance with all existing environmental laws and regulations applicable to our current operations and that our continued compliance with existing requirements will not have a material adverse impact on our financial condition and results of operations. We did not incur any material capital expenditures for remediation or pollution control activities for the years ended December 31, 2012 or 2011. Additionally, we are not aware of any environmental issues or claims that will require material capital expenditures during 2013 or that will otherwise have a material impact on our financial position or results of operations in the future. However, we cannot assure you that the passage of more stringent laws and regulations in the future will not have a negative impact our business activities, financial condition or results of operations.
Employees
As of March 31, 2013, we had 73 employees, including 19 technical (geosciences, engineering, land), 18 field operations, 27 corporate (finance, accounting, planning, business development, legal, office management) and 9 management. None of these employees are represented by labor unions or covered by any collective bargaining agreement. We consider our relations with our employees to be satisfactory. From time to time we utilize the services of independent contractors to perform various field and other services as needed.
Offices
We currently lease approximately 30,976 square feet of office space in Austin, Texas at 807 Las Cimas Parkway, Austin, Texas 78746, where our principal offices are located. The primary lease expires in April 2017. We also lease field offices in Canadian, Texas and Coalgate, Oklahoma.
Legal proceedings
We are from time to time subject to, and are presently involved in, litigation or other legal proceedings arising out of the ordinary course of business. None of these legal proceedings are expected to have a material adverse effect on our financial condition, results of operations or cash flow. With respect to these proceedings, our management believes that we will either prevail, have adequate insurance coverage or have established appropriate reserves to cover potential liabilities. Any costs that management estimates may be paid related to these proceedings or claims are accrued when the liability is considered probable and the amount can be reasonably estimated. There can be no assurance, however, as to the ultimate outcome of any of these matters, and if all or substantially all of these legal proceedings were to be determined adversely to us, there could be a material adverse effect on our financial condition, results of operations and cash flow.
124
Directors and executive officers
The following table sets forth information regarding our directors and executive officers as of June 15, 2013.
| Name |
Age |
Title |
||
|---|---|---|---|---|
Jonny Jones |
53 | Chairman of the Board of Directors and Chief Executive Officer | ||
Howard I. Hoffen |
49 | Director | ||
Gregory D. Myers |
42 | Director | ||
Alan D. Bell(1) |
67 | Director | ||
Mike S. McConnell |
53 | Director and President | ||
Eric Niccum |
42 | Executive Vice President and Chief Operating Officer | ||
Robert J. Brooks |
50 | Executive Vice President and Chief Financial Officer | ||
(1) Mr. Bell will join our board of directors upon the consummation of this offering and is expected to become chair of the audit committee.
Set forth below is a description of the backgrounds of our directors and executive officers. There are no immediate family relationships between any of our directors or executive officers.
Jonny Jones has served as Chairman of our board of directors since 2009 and as the principle executive officer of the company since 1988. Prior to founding the company in 1988, Mr. Jones worked for subsidiaries and affiliates of BP plc as a geologist. Mr. Jones is a third generation explorationist with over 25 years of experience in the oil and gas industry focusing on the U.S. mid-continent. Mr. Jones is currently Chairman of the Texas Oil and Gas Association and serves on the executive committee of the US Oil & Gas Association. He received the Ernst & Young Entrepreneur of the Year 2012 Award for Central Texas. He has previously served on the Advisory Council of the University of Oklahoma School of Geology and Geophysics and has been actively involved in fund raising efforts at the school. Mr. Jones is also a member of the American Association of Petroleum Geologists, Independent Petroleum Association of America and Texas Independent Producers and Royalty Owners Association. Mr. Jones holds a B.S. in Geology from the University of Oklahoma and an M.A. in Geology from the University of Texas at Austin. Because of his extensive knowledge of the oil and gas industry and our operations developed through his role as our founder, as well as his substantial business, leadership and management experience, we believe that Mr. Jones is a valuable member of our board of directors.
Howard I. Hoffen has served on our board of directors since December 2009. Mr. Hoffen is currently the Chairman, Chief Executive Officer, and a Managing Director of Metalmark Capital LLC, an investment center of Citi Alternative Investments that is focused on private equity. Mr. Hoffen was a founding member of Metalmark Capital in 2004, and served as Chairman and Chief Executive Officer of Morgan Stanley Capital Partners from 2001 to 2004, after having performed various roles in the private equity group since he joined Morgan Stanley in 1985. He also serves as a Director of EnerSys, Pacific Coast Energy Holdings LLC (the General Partner of Pacific Coast Oil Trust) and several private companies. Mr. Hoffen received an M.B.A. degree from Harvard Business School and a B.S. degree from Columbia University. We believe that Mr. Hoffen's many years of investing experience, as well as his in-depth knowledge of the oil and gas industry generally, and Jones Energy in particular, provide him with the necessary skills to be a member of the board of directors of Jones Energy.
Gregory D. Myers has served on our board of directors since December 2009. Mr. Myers is a Managing Director of Metalmark Capital LLC, a private equity firm which he joined as a founding member in 2004.
125
Prior to that, Mr. Myers was a senior investment professional at Morgan Stanley Capital Partners from 1998 until 2004. Mr. Myers also serves as a director of Pacific Coast Energy Holdings LLC (the general partner of Pacific Coast Oil Trust, NYSE: ROYT) and several private companies in the energy industry. Previously, Mr. Myers served as a Director and Chairman of the Compensation Committee for Union Drilling (NASDAQ: UDRL). He has a B.A. and B.S. from the University of Pennsylvania and an M.B.A. from the Harvard Business School. We believe that Mr. Myers' extensive investing experience and knowledge of the oil and gas industry and our operations provide him with the necessary skills to be a member of the board of directors of Jones Energy.
Robert J. Brooks joined the company as our Executive Vice President and Chief Financial Officer in 2013. He has over 21 years of corporate finance experience in the oil and gas industry. Mr. Brooks' prior experience includes investment banking leadership of M&A advisory and capital markets transactions and private equity investments, primarily in the upstream energy sector. Most recently, Mr. Brooks led the energy investment banking efforts at Whiteface Capital LLC from 2012 until 2013 and Focus Capital Group, Inc. from 2010 until 2012. From 2004 until 2010, Mr. Brooks served as the Senior Managing Director and Head of Macquarie Capital's U.S. Natural Resources investment banking practice, which he founded in 2004. Mr. Brooks also served as President and Board Member of Macquarie Longview Holdings, an E&P company owned and controlled by Macquarie. Prior to Macquarie, Mr. Brooks was a Principal in the Energy Group at Banc of America Securities, and began his investment banking career in the Energy Investment Banking Group at Salomon Brothers. Mr. Brooks holds a B.S. in Mechanical Engineering from the Massachusetts Institute of Technology, or MIT, an M.S. in Mechanical Engineering from Stanford University, and an M.S. in Management from the Sloan School of Management at MIT.
Mike S. McConnell has served as the President of the company since 2004 and as director since 2009. Mr. McConnell has over 30 years of domestic and international energy experience. Prior to joining the company in 2004, he served in senior management positions in a wide variety of areas in the energy business, including as the Chief Executive Officer of the Generation and Production Group for Enron Corp during the bankruptcy from 2002 until 2003. He was the Chief Executive Officer of Enron Global Markets, LLC from 2000 until 2001. Prior to these assignments, Mr. McConnell served in the technology area for the company as Vice Chairman and Chief Operating Officer for Enron NetWorks and Chief Executive Officer of Global Technology from 1999 to 2000 and as President of Houston Pipe Line and Louisiana Resources Company from 1997 until 1999. He served as the chairman of the Price Business School Board of Advisors for the University of Oklahoma from 2010 until 2012 and is currently Vice Chairman of the Natural Gas Committee of the Independent Petroleum Association of America. Mr. McConnell graduated from the University of Oklahoma in 1982 with a B.B.A. in Petroleum Land Management with an emphasis on Law. Because of his wide-ranging experience in the oil and gas industry, including his financial management expertise, we believe Mr. McConnell is a valuable member of our board of directors.
Alan D. Bell will join our board of directors upon the consummation of this offering. Mr. Bell is a retired senior audit partner in the energy industry. Prior to his retirement in 2006, Mr. Bell served as the Director of the Southwest Area Energy Practice at Ernst & Young LLP since 1998, after having performed various roles in the firm since joining in 1973. Mr. Bell began his career as a petroleum engineer at Chevron Oil Company from 1969 to 1972. Mr. Bell currently serves as a director of Approach Resources Inc. where he chairs the audit committee and is a director of the National Association of Corporate Directors—North Texas Chapter. Mr. Bell is a NACD Board Leadership Fellow. Mr. Bell previously served as a director of Dune Energy, Inc. from May 2007 until January 2012 and of Toreador Resources Corporation from August 2006 until June 2009. Mr. Bell also served as the Chief Restructuring Officer of Energy Partners Ltd. (now known as EPL Oil & Gas, Inc.) from March to September 2009. Mr. Bell is a member of the American
126
Institute of Certified Public Accountants, the Texas Society of Certified Public Accountants and the Society of Petroleum Engineers. Mr. Bell earned a Petroleum Engineering degree from the Colorado School of Mines and an M.B.A. from Tulane University.
Eric Niccum has served as our Executive Vice President and Chief Operating Officer since joining the company in 2011. He has 20 years of energy and petroleum experience. He started his career with Amoco and served in a variety of engineering roles. Following the BP/Amoco merger, he started working in Deep Water Gulf of Mexico in 2001, returning to the Mid-Continent region as a Resource Manager and New Well Delivery Manager for BP from 2005 to 2011, overseeing activities in the Anadarko and Arkoma basins. Mr. Niccum is a graduate of Purdue University and holds a B.S. in Mechanical Engineering.
Board of directors
Our board of directors currently consists of four members, including our Chief Executive Officer and our President, and two members designated by Metalmark Capital.
In evaluating director candidates, we will assess whether a candidate possesses the integrity, judgment, knowledge, experience, skills and expertise that are likely to enhance the board's ability to manage and direct our affairs and business, including, when applicable, to enhance the ability of committees of the board to fulfill their duties.
Following the completion of this offering, our directors will be divided into three classes serving staggered three-year terms. Class I, Class II and Class III directors will serve until our annual meetings of stockholders in 2014, 2015 and 2016, respectively. We anticipate that Jonny Jones and Howard I. Hoffen will be assigned to Class I, Mike S. McConnell will be assigned to Class II and Gregory D. Myers and Alan D. Bell will be assigned to Class III. At each annual meeting of stockholders held after the initial classification, directors will be elected to succeed the class of directors whose terms have expired. This classification of our board of directors could have the effect of increasing the length of time necessary to change the composition of a majority of the board of directors. In general, at least two annual meetings of stockholders will be necessary for stockholders to effect a change in a majority of the members of the board of directors.
Director independence
Our board of directors currently consists of four members, including our Chief Executive Officer and our President. The board of directors reviewed the independence of our directors, as well as Alan D. Bell (who will join the board upon consummation of the offering), using the independence standards of the NYSE and, based on this review, determined that Alan D. Bell, Howard I. Hoffen and Gregory D. Myers are independent within the meaning of the NYSE listing standards currently in effect.
Committees of our board of directors
Our board of directors will have an audit committee, compensation committee and nominating and governance committee, and may have such other committees as the board of directors shall determine from time to time. Each of the standing committees of the board of directors has the composition and responsibilities described below.
Audit committee. In connection with the completion of this offering, our board of directors will establish an audit committee. Mr. Bell will be the initial member of our audit committee. Our board of directors has determined that Mr. Bell is an audit committee financial expert. We will rely on the phase-in rules of the SEC and NYSE with respect to the independence of our audit committee. These rules permit us to have an
127
audit committee that has one member that is independent under applicable standards by the date our Class A common stock is first traded on the NYSE, a majority of members that are independent within 90 days of the effectiveness of the registration statement of which this prospectus forms a part and all members that are independent within one year thereafter. The audit committee will have the authority to, among other things:
- •
- approve and retain the independent registered public accounting firm to conduct the annual audit of our books and records
and approve the audit fees to be paid;
- •
- review the independence and performance of the independent registered public accounting firm;
- •
- review the proposed scope and results of the audit;
- •
- review and pre-approve the independent registered public accounting firm's audit and non-audit
services rendered;
- •
- review and approve transactions between us and our directors, officers and affiliates;
- •
- oversee internal audit functions and our compliance with legal and regulatory requirements; and
- •
- prepare the report of the audit committee that SEC rules require to be included in our annual meeting proxy statement.
Upon formation of the audit committee, we expect to adopt an audit committee charter defining the committee's primary duties in a manner consistent with the rules of the SEC and NYSE or market standards.
Compensation committee. We will establish a compensation committee prior to completion of this offering. We will rely on the phase-in rules of the SEC and NYSE with respect to the independence of our compensation committee. These rules require us to have a compensation committee that has one member that is independent by the earlier of the closing date of this offering or five business days from the listing date, a majority of members that are independent within 90 days of the listing date and all members that are independent within one year of the listing date. The compensation committee will have the authority to, among other things:
- •
- review and recommend the compensation arrangements for officers and other employees;
- •
- establish and review general compensation policies with the objective to attract and retain superior talent, to reward
individual performance and to achieve our financial goals;
- •
- administer our incentive compensation and benefits plans, including our stock incentive plan; and
- •
- prepare the report of the compensation committee that SEC rules require to be included in our annual meeting proxy statement.
Upon formation of the compensation committee, we expect to adopt a compensation committee charter defining the committee's primary duties in a manner consistent with the rules of the SEC and NYSE or market standards.
Nominating and corporate governance committee. We will establish a nominating and corporate governance committee prior to completion of this offering. We will rely on the phase-in rules of the SEC and NYSE with respect to the independence of our nominating and corporate governance committee. These rules require us to have a nominating and corporate governance committee that has one member that is
128
independent by the earlier of the closing date of this offering or five business days from the listing date, a majority of members that are independent within 90 days of the listing date and all members that are independent within one year of the listing date. This committee will be authorized to, among other things:
- •
- identify, evaluate and recommend qualified nominees for election to the board of directors;
- •
- develop, recommend to the board of directors and oversee a set of corporate governance principles applicable to our
company;
- •
- oversee the evaluation of the board of directors and management; and
- •
- develop and maintain a management succession plan.
Upon formation of the nominating and corporate governance committee, we expect to adopt a nominating and corporate governance committee charter defining the committee's primary duties in a manner consistent with the rules of the SEC and NYSE or market standards.
Compensation committee interlocks and insider participation
None of our officers or employees will be members of the compensation committee. None of our executive officers serve on the board of directors or compensation committee of a company that has an executive officer that serves on our board or compensation committee. No member of our board is an executive officer of a company in which one of our executive officers serves as a member of the board of directors or compensation committee of that company.
To the extent any members of our compensation committee and affiliates of theirs have participated in transactions with us, a description of those transactions is described in "Certain relationships and related party transactions."
Code of business conduct and ethics
Our board of directors will adopt a code of business conduct and ethics applicable to our employees, directors and officers, in accordance with applicable U.S. federal securities laws and the corporate governance rules of the NYSE. Any waiver of this code may be made only by our board of directors and will be promptly disclosed as required by applicable U.S. federal securities laws and the corporate governance rules of the NYSE.
Corporate governance guidelines
Our board of directors will adopt corporate governance guidelines in accordance with the corporate governance rules of the NYSE.
129
The following discussion of compensation arrangements of our named executive officers for 2012 (as set forth in the Summary Compensation Table and defined below) should be read together with the compensation tables and related disclosures set forth below. Actual compensation programs that we adopt may differ materially from the currently planned programs summarized in this discussion.
| Name and principal position |
Year |
Salary ($) |
Bonus ($)(1) |
Stock awards ($) |
All other Compensation ($)(2) |
Total ($) |
||||||||||||
|---|---|---|---|---|---|---|---|---|---|---|---|---|---|---|---|---|---|---|
Jonny Jones |
2012 | 321,851 | 334,688 | 113,400 | 61,979 | 831,918 | ||||||||||||
Chairman of the board and Chief Executive Officer |
||||||||||||||||||
Mike S. McConnell |
2012 |
295,030 |
306,797 |
113,400 |
44,673 |
759,900 |
||||||||||||
Director and President |
||||||||||||||||||
Craig Fleming(3) |
2012 |
268,209 |
278,906 |
113,400 |
16,252 |
676,767 |
||||||||||||
Former Executive Vice President, Chief Financial Officer and Secretary |
||||||||||||||||||
(1) The amounts in this column represent a discretionary bonus to each of Mr. Jones, Mr. McConnell and Mr. Fleming, based on 2012 performance.
(2) The amounts in this column include the following: matching contributions under the 401(k) savings plan for Mr. Jones, Mr. McConnell and Mr. Fleming; country club association dues for Mr. Jones and Mr. McConnell; payments associated with company vehicles for Mr. Jones and Mr. McConnell; and payments associated with spousal travel for Mr. Jones, Mr. McConnell and Mr. Fleming. We own partial interests in two aircraft used for business purposes. From time to time, spouses or family members of our named executive officers have traveled with them on the aircraft, in each case at no additional incremental cost to us due to the flat monthly rate paid for specified availability of the aircraft.
(3) Mr. Fleming's employment with us commenced in November 2008, and he resigned effective January 18, 2013.
Our named executive officers do not have contractual rights to employment by us and may be terminated with or without cause at any time. Each of our named executive officers entered into agreements with us containing confidentiality, non-competition, non-solicitation and non-disparagement obligations with respect to us that survive beyond their employment with us.
Mr. Fleming resigned effective January 18, 2013. In connection with Mr. Fleming's resignation, we entered into a separation agreement, pursuant to which he agreed to a general release and waiver of all claims and compliance with certain specified covenants in favor of us, in exchange for certain payments and benefits, including severance payments totaling approximately $270,000 as well as insurance premium payments. There were no disagreements between Mr. Fleming and us on any matter of accounting, principles or practices, financial statement disclosure, internal controls or audit, scope or procedures in connection with his resignation.
130
Outstanding equity awards at 2012 fiscal year-end
The following table provides information regarding outstanding management incentive unit awards of JEH LLC as of December 31, 2012, which will be converted into indirectly held JEH LLC Units and shares of Class B common stock upon the consummation of the offering.
| |
Stock awards | |||||||||
|---|---|---|---|---|---|---|---|---|---|---|
| Name |
Grant date |
Number of units or shares of stock that have not vested (#) |
Market value of units or shares of stock that have not vested ($)(1) |
|||||||
Jonny Jones |
9/30/10 | 288,000 | (2) | 604,800 | ||||||
Mike S. McConnell |
9/30/10 | 288,000 | (2) | 604,800 | ||||||
Craig Fleming(3) |
9/30/10 | 288,000 | 604,800 | |||||||
(1) The amounts in this column reflect the full grant date fair value of the management incentive unit awards computed in accordance with FASB ASC Topic 718.
(2) Unless they are forfeited, these 288,000 management incentive units will convert into 194,694 indirectly held JEH LLC Units and shares of Class B common stock in connection with this offering.
(3) Mr. Fleming resigned effective January 18, 2013. All unvested management incentive units were forfeited at the time of his resignation.
Director compensation
During 2012, we did not pay any compensation to non-employee members of our board of directors.
Long-term incentive plan
Prior to the effective date of this offering, our board of directors plans to adopt and have approved by our stockholders a long-term incentive plan for the benefit of the employees, directors and consultants who perform services for us. The long-term incentive plan may consist of the following components: restricted stock, stock options, performance awards, restricted stock units, bonus stock awards, stock appreciation rights, cash awards, dividend equivalents, and other share-based awards. The long-term incentive plan will limit the number of shares that may be delivered pursuant to awards to 3,850,000 shares of our Class A common stock. Shares subject to an award under the long-term incentive plan that are canceled, forfeited, exchanged, settled in cash or otherwise terminated, including withheld to satisfy exercise prices or tax withholding obligations, are available for delivery pursuant to other awards. The shares of our Class A common stock to be delivered under the long-term incentive plan will be made available from authorized but unissued shares of stock, shares held in treasury, or previously issued shares reacquired by us, including by purchase on the open market. The plan will be administered by our board of directors or a committee thereof, which we refer to as the plan administrator.
Administration
The long-term incentive plan is administered by the plan administrator. The plan administrator selects the participants and determines the type or types of awards and the number of shares to be optioned or granted to each participant under the long-term incentive plan. The plan administrator has the power to amend or modify the terms of an award in any manner that is (i) not materially adverse to the award recipient, (ii) consented to by the award recipient, or (iii) an adjustment resulting from certain corporate transactions.
131
The plan administrator supervises the long-term incentive plan's administration and enforcement according to its terms and provisions and has all powers necessary to accomplish these purposes, including, for example, the power to: (i) engage or authorize the engagement of third-party administrators to carry out administrative functions under the long-term incentive plan; (ii) construe or interpret the long-term incentive plan with full and final authority; (iii) determine questions of eligibility; (iv) make determinations related to long-term incentive plan benefits; (v) delegate to the board of directors or any other committee of the board of directors its authority to grant awards to certain employees; and (vi) from time to time, adopt rules and regulations in order to carry out the terms of the long-term incentive plan. Members of the board of directors, the plan administrator and other officers who assume duties under the long-term incentive plan will not be held liable for their actions in connection with administration of the long-term incentive plan except for willful misconduct or as expressly provided by law.
The plan administrator may terminate or amend the long-term incentive plan at any time with respect to any shares of our Class A common stock for which a grant has not yet been made. The plan administrator also has the right to alter or amend the long-term incentive plan or any part of the plan from time to time, including increasing the number of shares of our Class A common stock that may be granted, subject to stockholder approval as required by the exchange upon which our Class A common stock is listed at that time or other legal requirements. However, no change in any outstanding grant may be made that would materially reduce the benefits of the participant without the consent of the participant. Repricing of options and stock appreciation rights is prohibited under the long-term incentive plan without the approval of our stockholders; options and stock appreciation rights may not be cancelled in exchange for cash or other awards. In the event of corporate recapitalizations, subdivisions, consolidations, or other corporate events, the plan administrator has the authority to adjust outstanding awards as well as the total number of shares available for grant under the plan in accordance with the terms of the long-term incentive plan. No awards may be granted under the long-term incentive plan on or after the date that is the ten year anniversary of the effective date of the plan.
Participation and eligibility
Our employees, consultants, employees of our subsidiaries, consultants of our subsidiaries and our non-employee directors are eligible for awards under the long-term incentive plan. The plan administrator will select the participants in the long-term incentive plan. Any participant may receive more than one award under the long-term incentive plan.
Restricted stock
A restricted stock grant is an award of Class A common stock that vests over a period of time and that during such time is subject to forfeiture. The plan administrator may determine to make grants of restricted stock under the plan to participants containing such terms as the plan administrator shall determine. The plan administrator will determine the period over which restricted stock granted to participants will vest. The plan administrator, in its discretion, may base its determination upon the achievement of specified financial objectives. Dividends made on restricted stock may or may not be subjected to the same vesting provisions as the restricted stock and will be subject to achievement of any performance goals that apply to the restricted stock.
We intend the restricted stock under the plan to serve as a means of incentive compensation for performance and not primarily as an opportunity to participate in the equity appreciation of our Class A common stock. Therefore, plan participants will not pay any consideration for our Class A common stock they receive, and we will receive no remuneration for the restricted stock.
132
Stock options
A stock option is a right to purchase stock at a specified price during specified time periods. The long-term incentive plan will permit the grant of options covering our Class A common stock. The plan administrator may make grants under the plan to participants containing such terms as the plan administrator shall determine. Stock options will have an exercise price that may not be less than the fair market value of our Class A common stock on the date of grant. Stock options granted under the long-term incentive plan can be either incentive stock options (within the meaning of section 422 of the Code), which have certain tax advantages for recipients, or non-qualified stock options. Stock options granted will become exercisable over a period determined by the plan administrator. No stock option will have a term that exceeds ten years. The availability of stock options is intended to furnish additional compensation to plan participants and to align their economic interests with those of common stockholders.
Performance award
A performance award is a right to receive all or part of an award granted under the long-term incentive plan based upon performance criteria specified by the plan administrator. The plan administrator will determine the period over which certain specified company or individual goals or objectives must be met. The performance award may be paid in cash, shares of our Class A common stock or other awards or property, in the discretion of the plan administrator.
Performance awards may be structured as "qualified performance-based compensation" under Section 162(m) of the Code, which we refer to as Qualified Awards. For Qualified Awards, performance goals must be established by the plan administrator prior to the earlier of (i) 90 days after the commencement of the period of service to which the performance goals relate or (ii) the lapse of 25% of the period of service. A performance goal may be based upon one or more business criteria that apply to the participant or the performance of one or more of our business units or the company as a whole, and must be based on one or more of the criteria set forth under the long-term incentive plan.
Restricted stock unit
A restricted stock unit is a notional share of our Class A common stock that entitles the grantee to receive a share of our Class A common stock upon the vesting of the restricted stock unit or, in the discretion of the plan administrator, cash equivalent to the value of a share of our Class A common stock. The plan administrator may determine to make grants of restricted stock units under the plan to participants containing such terms as the plan administrator shall determine. The plan administrator will determine the period over which restricted stock units granted to participants will vest.
The plan administrator, in its discretion, may grant tandem dividend equivalent rights with respect to restricted stock units that entitle the holder to receive cash equal to any cash dividends made on Class A common stock while the restricted stock units are outstanding. Dividend equivalents on restricted stock units will be subject to achievement of any performance goals that apply to the restricted stock units.
We intend the issuance of any shares of our Class A common stock upon vesting of the restricted stock units under the plan to serve as a means of incentive compensation for performance and not primarily as an opportunity to participate in the equity appreciation of our Class A common stock. Therefore, plan participants will not pay any consideration for the Class A common stock they receive, and thus we will receive no remuneration for the shares.
133
Bonus stock
The plan administrator, in its discretion, may also grant to participants Class A common stock that is not subject to forfeiture. The plan administrator can grant bonus stock without requiring that the recipient pay any remuneration for the shares.
Stock appreciation rights
The long-term incentive plan will permit the grant of stock appreciation rights. A stock appreciation right is an award that, upon exercise, entitles participants to receive the excess of the fair market value of our Class A common stock on the exercise date over the grant price established for the stock appreciation right on the date of grant. Such excess will be paid in cash or shares of our Class A common stock. The maximum term of a stock appreciation right is ten years. The plan administrator may determine to make grants of stock appreciation rights under the plan to participants containing such terms as the plan administrator shall determine. Stock appreciation rights will have a grant price that may not be less than the fair market value of our Class A common stock on the date of grant. In general, stock appreciation rights granted will become exercisable over a period determined by the plan administrator.
The availability of stock appreciation rights is intended to furnish additional compensation to plan participants and to align their economic interests with those of common stockholders. Plan participants will not pay any consideration for the Class A common stock they receive, and thus we will receive no remuneration for the shares.
Other share-based awards
The plan administrator, in its discretion, may also grant to participants an award denominated or payable in, referenced to, or otherwise based on or related to the value of our Class A common stock.
Termination of employment and non-competition agreements
The treatment of an award under the long-term incentive plan upon a termination of employment or service to us will be specified in the agreement controlling such award. Additionally, each participant to whom an award is granted under the long-term incentive plan may be required to agree in writing as a condition of the granting of such award not to engage in conduct in competition with us or our affiliates after the termination of such participant's employment or service with us.
Certain limitations
With respect to employee awards made under the long-term incentive plan, no employee may be granted during a single calendar year (i) stock options or stock appreciation rights that are exercisable for more than 1,000,000 shares of Class A common stock; (ii) Qualified Awards that are in the form of Class A common stock covering or relating to more than 1,000,000 shares of Class A common stock and (iii) Qualified Awards in the form of awards that may be settled solely in cash having a grant date value in excess of $5,000,000. No non-employee director may be granted during a single calendar year awards having a value determined on the grant date in excess of $500,000.
Assignment of interests prohibited
Unless otherwise determined by the plan administrator and provided in the applicable award agreement, no award may be assigned or otherwise transferred except by will or the laws of descent and distribution or pursuant to a domestic relations order in a form acceptable to the plan administrator. Any attempted assignment of an award in violation of the long-term incentive plan will be null and void.
134
Change in control
The treatment of awards on the occurrence of a change in control (as defined in the long-term incentive plan) will be determined in the sole discretion of the plan administrator and will be described in the applicable award agreement. Such treatment may include the acceleration of vesting or the lapse of restrictions on the occurrence of a change in control or upon termination of employment following a change in control.
Restrictions
No payment or delivery of shares of Class A common stock may be made unless we are satisfied that payment or delivery will comply with applicable laws and regulations. Certificates evidencing shares of Class A common stock delivered under the long-term incentive plan may be subject to stop transfer orders and other restrictions that the plan administrator deems advisable. The plan administrator may cause a legend or legends to be placed upon the certificates (if any) to make appropriate reference to these restrictions.
Clawback
Any award under the long-term incentive plan will be subject to recovery or clawback by us under any clawback policy adopted by us.
Tax withholding
We have the right to deduct taxes at the applicable rate from any award payment and withhold, at the time of delivery or vesting of an award, an appropriate amount of cash or number of shares of Class A common stock for the payment of taxes. The plan administrator may also permit withholding to be satisfied by the transfer of shares of our Class A common stock previously owned by the holder of the award.
Unfunded plan
The long-term incentive plan is unfunded. Bookkeeping accounts that may be established for purposes of the Plan are used merely as a bookkeeping convenience. We are not required to segregate any assets for purposes of the long-term incentive plan, and neither us, our board of directors nor the plan administrator will be deemed to be a trustee of any benefit granted under the long-term incentive plan. Our obligations under the long-term incentive plan will be based solely on any contractual obligations that may be created by the long-term incentive plan and the award agreements, and no such obligation will be deemed to be secured by any pledge or other encumbrance on our property. None of us, our board of directors or the plan administrator will be required to give any security or bond for the performance of any obligation that may be created by the long-term incentive plan.
Short term incentive plan
Our board of directors plans to adopt a short term incentive plan, or STIP, and have the STIP approved by our stockholders, prior to the effective date of this offering for the benefit of the employees who perform services for us.
Plan Administration and Eligibility
The compensation committee of our board of directors administers the STIP.
The compensation committee may generally delegate any of its authority (i) to select participants, (ii) grant awards and (iii) determine the value of awards granted to participants to any other committee of the
135
board of directors or to our Chief Executive Officer. However, the compensation committee may not delegate its authority with respect to awards granted to a participant who is subject to Section 162(m) of the Internal Revenue Code of 1986, as amended (the "Code"). Unless otherwise determined by the compensation committee, employees of the company or any of its subsidiaries who (a) are employed on the last day of the calendar year, which is referred to as the "plan year" and (b) are employed on the payment date of an award under the STIP are eligible for the payment of an award under the STIP.
Awards
The compensation committee determines the terms and conditions of awards and designates the recipients. Generally, awards are based on a percentage of actual base salary or gross wages paid to the participant during the plan year, including vacation, holiday and sick time. All or part of an award may be subject to conditions established by the compensation committee, which may include continuous service, achievement of specific individual and/or business objectives and other measures of performance.
Performance goals
Under the STIP, with respect to awards based on the achievement of business objectives, the compensation committee shall establish objective goals within the first 90 days of the performance period or within the first 25% of the performance period, whichever is earlier, and in any event, while the outcome is substantially uncertain. A performance goal is objective if a third party having knowledge of the relevant facts could determine whether the goal has been met. A performance goal may be based on one or more business criteria that apply to the individual, one or more of our business units, or the company as a whole. Performance goals are based on one or more of the financial or operational factors, as applied to the company or a business unit, as applicable, set forth in the STIP.
Performance goals need not be based on an increased or positive result under a particular business criterion and could include, for example, maintaining the status quo or limiting economic losses. The compensation committee may decrease the amount payable pursuant to a performance award, but in no event may the compensation committee increase the amount payable pursuant to a performance award to a "covered employee" (as defined under Section 162(m) of the Code) other than as provided in Section 162(m) of the Code. The Committee may increase the amount of a performance award to any participant who is not a covered employee. No participant may be granted performance awards that would result in the payment of more than $5,000,000 per plan year.
Clawback
Any award which is subject to recovery under any law, government regulation, or stock exchange listing requirement will be subject to the deductions and clawback that are required to be made pursuant to such law, government regulation, stock exchange listing requirement or any policy adopted by the Company pursuant to any such law, government regulation or stock exchange listing requirement.
Amendment and termination of plan
The STIP may be amended, modified, suspended, or terminated by our board of directors in order to address any changes in legal requirements or for any other purpose permitted by law, except that no amendment that would materially and adversely affect the rights of any participant under any award previously granted may be made without the consent of the participant, and no amendment may be effective prior to its approval by our stockholders, if such approval is required by law or an exchange.
136
Monarch equity plan
Our board of directors plans to adopt an incentive plan, which we refer to as the Monarch Plan, prior to the effective date of this offering to provide for grants of phantom units, or Phantom Units, representing Class A Units of Monarch Natural Resources, LLC, or the Monarch Units, for the benefit of certain officers who perform services for us. For additional information regarding the Company's relationship with Monarch Natural Resources, please see "Certain relationships and related party transactions—Transactions with our executive officers, directors and 5% stockholders."
Pursuant to the Monarch Plan, 26,192 Phantom Units are available for grant, and we intend to grant certain of the Phantom Units to our executive officers as follows: 11,723 Phantom Units will be granted to Mike McConnell, 3,710 Phantom Units will be granted to Eric Niccum and 1,072 Phantom Units will be granted to Robert J. Brooks.
The Phantom Units will vest 20% per year on each of the first, second, third, fourth and fifth anniversary of the grant date, provided that the participant remains in continuous employment with the company through each applicable vesting date. Within 30 days of a vesting date, a participant will receive an assignment of the number of Monarch Units corresponding to the Phantom Units vesting on such date. If a participant's employment with us terminates for any reason, (i) all unvested Phantom Units will be immediately forfeited by the participant, and the Monarch Units underlying such forfeited Phantom Units will be assigned to Jonny Jones within 30 days following the forfeiture date and (ii) Jonny Jones shall have a call option to purchase any or all of the Monarch Units issued to such participant in respect of vested Phantom Units at the fair market value determined by the Board for Monarch Units as of the most recent valuation date coincident with or immediately preceding the date such call option is exercised.
137
Certain relationships and related party transactions
Organizational structure
In connection with our corporate reorganization, we will engage in certain transactions with certain affiliates and our Existing Owners. Please see "Organizational structure" for a description of these transactions.
In connection with the recapitalization of JEH LLC, which is described in "Organizational Structure—Recapitalization of JEH LLC" above, the Existing Agreement will be amended and restated as the Third Amended and Restated LLC Agreement. The Third Amended and Restated LLC Agreement is filed as an exhibit to the registration statement of which this prospectus forms a part, and the following description of the Third Amended and Restated LLC Agreement is qualified in its entirety by reference thereto.
Pursuant to the Third Amended and Restated LLC Agreement and the recapitalization described in "Organizational structure—Recapitalization of JEH LLC" above, (i) the various classes of units in JEH LLC which were outstanding immediately prior to the recapitalization were cancelled and 36,836,333 JEH LLC Units were issued in exchange therefor and (ii) 14,000,000 JEH LLC Units (or 16,100,000 JEH LLC Units if the underwriters exercise in full their option to purchase additional shares of Class A common stock) will be issued to us in connection with the offering.
Under the Third Amended and Restated LLC Agreement, we have the right to determine when distributions will be made to the holders of JEH LLC Units and the amount of any such distributions. Following this offering, if we authorize a distribution, such distribution will be made to the holders of JEH LLC Units on a pro rata basis in accordance with their respective percentage ownership of JEH LLC Units.
The holders of JEH LLC Units, including us, will generally incur U.S. federal, state and local income taxes on their proportionate share of any taxable income of JEH LLC and will be allocated their proportionate share of any taxable loss of JEH LLC. Net profits and net losses of JEH LLC generally will be allocated to holders of JEH LLC Units on a pro rata basis in accordance with their respective percentage ownership of JEH LLC Units, except that certain non-pro rata adjustments will be required to be made to reflect built-in gains and losses and tax depletion, depreciation and amortization with respect to such built-in gains and losses. The Third Amended and Restated LLC Agreement provides, to the extent cash is available, for distributions to the holders of JEH LLC Units if we, as the managing member of JEH LLC, determine that the taxable income of JEH LLC will give rise to taxable income for a unitholder. Generally, these tax distributions will be computed based on our estimate of the taxable income of JEH LLC that is allocable to a holder of JEH LLC Units, multiplied by an assumed tax rate equal to the highest effective marginal combined U.S. federal, state and local income tax rate prescribed for an individual resident in New York, New York (taking into account the nondeductibility of certain expenses and the character of our income). In addition, if the cumulative amount of federal, state and local taxes payable by us exceeds the amount of the tax distribution to us, JEH LLC will make advances to us in an amount necessary to enable us to fully pay these tax liabilities. Such advances will be repayable, without interest, solely from (i.e., by offset against) future distributions by JEH LLC to us.
The Third Amended and Restated LLC Agreement will provide that, except as otherwise determined by us, at any time we issue a share of our Class A common stock or any other equity security, the net proceeds received by us with respect to such issuance, if any, shall be concurrently invested in JEH LLC, and JEH LLC shall issue to us one JEH LLC Unit or other economically equivalent equity interest. Conversely, if at any time, any shares of our Class A common stock are redeemed, repurchased or otherwise acquired, JEH LLC shall redeem, repurchase or otherwise acquire an equal number of JEH LLC Units held by us, upon the
138
same terms and for the same price, as the shares of our Class A common stock are redeemed, repurchased or otherwise acquired.
Under the Third Amended and Restated LLC Agreement, the members have agreed that certain Existing Owners and/or one or more of their respective affiliates are permitted to engage in business activities or invest in or acquire businesses which may compete with our business or do business with any client of ours.
JEH LLC will be dissolved only upon the first to occur of (i) the sale of substantially all of its assets or (ii) an election by us to dissolve the company. Upon dissolution, JEH LLC will be liquidated and the proceeds from any liquidation will be applied and distributed in the following manner: (a) first, to creditors (including to the extent permitted by law, creditors who are members) in satisfaction of the liabilities of JEH LLC, (b) second, to establish cash reserves for contingent or unforeseen liabilities and (c) third, to the members in proportion to the number of JEH LLC Units owned by each of them.
Exchange agreement
In connection with this offering, we will enter into the Exchange Agreement with JEH LLC and the Existing Owners. Pursuant to the Exchange Agreement, the Existing Owners and their permitted transferees will have the right, subject to the terms of the Exchange Agreement, to exchange their JEH LLC Units (together with a corresponding number of shares of Class B common stock) with JEH LLC for shares of Class A common stock on a one-for-one basis, subject to customary conversion rate adjustments for stock splits, stock dividends and reclassifications and other similar transactions.
To the extent necessary to ensure that the number of outstanding shares of Class A common stock remains equal to the number of outstanding JEH LLC Units held by us following an exchange, we will cause JEH LLC to issue to us additional JEH LLC Units. We will cancel each share of Class B common stock that is exchanged pursuant to the Exchange Agreement.
Tax receivable agreement
As described in "—Exchange Agreement" above, in the future, Existing Owners (and their permitted transferees) may exchange their JEH LLC Units (together with a corresponding number of shares of Class B common stock) for shares of Class A common stock (on a one-for-one basis, subject to customary conversion rate adjustments for stock splits, stock dividends and reclassification and other similar transactions). JEH LLC intends to make an election under Section 754 of the Code that will be effective for each taxable year in which an exchange of JEH LLC Units for shares of Class A common stock (or a purchase of JEH LLC Units) occurs. Pursuant to the Section 754 election, each future exchange of JEH LLC Units for Class A common stock (as well as any purchase of JEH LLC Units for cash) is expected to result in an adjustment to the tax basis of the tangible and intangible assets of JEH LLC, and these adjustments will be allocated to us. Adjustments to the tax basis of the tangible and intangible assets of JEH LLC described above would not have been available absent these exchanges (or purchases) of JEH LLC Units. The anticipated basis adjustments are expected to increase (for tax purposes) our depreciation, depletion and amortization deductions and may also decrease our gains (or increase our losses) on future dispositions of certain capital assets to the extent tax basis is allocated to those capital assets. Such increased deductions and losses and reduced gains may reduce the amount of tax that we would otherwise be required to pay in the future.
We will enter into the Tax Receivable Agreement with JEH LLC and the Existing Owners. This agreement generally provides for the payment by us of 85% of the amount of cash savings, if any, in U.S. federal,
139
state and local income tax or franchise tax that we actually realize (or are deemed to realize in certain circumstances) in periods after this offering as a result of (i) the tax basis increases resulting from the exchange of JEH LLC Units for shares of Class A common stock (or resulting from a sale of JEH LLC Units for cash) and (ii) imputed interest deemed to be paid by us as a result of, and additional tax basis arising from, any payments we make under the Tax Receivable Agreement.
The payment obligations under the Tax Receivable Agreement are our obligations and not obligations of JEH LLC. For purposes of the Tax Receivable Agreement, cash savings in tax generally are calculated by comparing our actual tax liability to the amount we would have been required to pay had we not been able to utilize any of the tax benefits subject to the Tax Receivable Agreement. The term of the Tax Receivable Agreement will commence upon the completion of this offering and will continue until all such tax benefits have been utilized or have expired, unless JEH LLC exercises its right to terminate the Tax Receivable Agreement.
Estimating the amount of payments that may be made under the Tax Receivable Agreement is by its nature imprecise, insofar as the calculation of amounts payable depends on a variety of factors. The actual increase in tax basis, as well as the amount and timing of any payments under the Tax Receivable Agreement, will vary depending upon a number of factors, including the timing of the exchanges, the price of Class A common stock at the time of each exchange, the extent to which such exchanges are taxable, the amount and timing of the taxable income we generate in the future and the tax rate then applicable, and the portion of our payments under the Tax Receivable Agreement constituting imputed interest or depreciable or amortizable basis. We expect that the payments that we will be required to make under the Tax Receivable Agreement could be substantial. Assuming no material changes in the relevant tax law, we expect that (i) if the underwriters exercise their option to purchase additional shares of Class A common stock in full, and Metalmark and Wells Fargo exchange an aggregate of 2,100,000 JEH LLC Units for cash in connection with this offering and no other exchanges were to occur, the future payments under the Tax Receivable Agreement resulting from the tax basis increases associated with such exchange would aggregate approximately $5.7 million and (ii) if the Tax Receivable Agreement were terminated immediately after this offering, the estimated termination payment would be approximately $202.0 million (calculated using a discount rate equal to the London interbank offering rate, plus 100 basis points, applied against an undiscounted liability of $313.2 million). The foregoing amounts are merely estimates and the actual payments could differ materially. Furthermore, these amounts reflect only the cash savings attributable to current tax attributes resulting from the two exchange scenarios described above. It is possible that future transactions or events could increase or decrease the actual tax benefits realized and the corresponding Tax Receivable Agreement payments as compared to these estimates. Moreover, there may be a negative impact on our liquidity if, as a result of timing discrepancies or otherwise, (i) the payments under the Tax Receivable Agreement exceed the actual benefits we realize in respect of the tax attributes subject to the Tax Receivable Agreement and/or (ii) distributions to us by JEH LLC are not sufficient to permit us to make payments under the Tax Receivable Agreement after we have paid our taxes and other obligations. Please see "Risk factors—Risks relating to this offering and our Class A common stock—In some cases, payments under the Tax Receivable Agreement may be accelerated and/or significantly exceed the actual benefits, if any, we realize in respect of the tax attributes subject to the Tax Receivable Agreement." The payments under the Tax Receivable Agreement will not be conditioned upon a holder of rights under the Tax Receivable Agreement having a continued ownership interest in either JEH LLC or us.
In addition, although we are not aware of any issue that would cause the Internal Revenue Service, or the IRS, to challenge potential tax basis increases or other tax benefits covered under the Tax Receivable Agreement, the holders of rights under the Tax Receivable Agreement will not reimburse us for any
140
payments previously made under the Tax Receivable Agreement if such basis increases or other benefits are subsequently disallowed, except that excess payments made to any Existing Owner will be netted against payments otherwise to be made, if any, to such Existing Owner after our determination of such excess. As a result, in such circumstances, we could make payments that are greater than our actual cash tax savings, if any, and may not be able to recoup those payments, which could adversely affect our liquidity.
The Tax Receivable Agreement provides that in the event that we breach any of our material obligations under it, whether as a result of our failure to make any payment when due (including in cases where we elect to terminate the Tax Receivable Agreement early, the Tax Receivable Agreement is terminated early due to certain mergers or other changes of control or we have available cash but fail to make payments when due under circumstances where we do not have the right to elect to defer the payment, as described below), failure to honor any other material obligation under it or by operation of law as a result of the rejection of the Tax Receivable Agreement in a case commenced under the United States Bankruptcy Code or otherwise, then all our payment and other obligations under the Tax Receivable Agreement will be accelerated and will become due and payable applying the same assumptions described above. Such payments could be substantial and could exceed our actual cash tax savings under the Tax Receivable Agreement.
Additionally, we have the right to terminate the Tax Receivable Agreement. If we elect to terminate the Tax Receivable Agreement early or it is terminated early due to certain mergers or other changes of control, we would be required to make an immediate payment equal to the present value of the anticipated future tax benefits subject to the Tax Receivable Agreement, which calculation of anticipated future tax benefits will be based upon certain assumptions and deemed events set forth in the Tax Receivable Agreement, including the assumption that we have sufficient taxable income to fully utilize such benefits and that any JEH LLC Units that the Existing Owners or their permitted transferees own on the termination date are deemed to be exchanged on the termination date. Any early termination payment may be made significantly in advance of the actual realization, if any, of such future benefits and significantly exceed our realized tax savings.
Decisions we make in the course of running our business, such as with respect to mergers, asset sales, other forms of business combinations or other changes in control, may influence the timing and amount of payments that are received by an exchanging or selling Existing Owner under the Tax Receivable Agreement. For example, the earlier disposition of assets following an exchange of JEH LLC Units may accelerate payments under the Tax Receivable Agreement and increase the present value of such payments, and the disposition of assets before an exchange of JEH LLC Units may increase an Existing Owner's tax liability without giving rise to any rights of an Existing Owner to receive payments under the Tax Receivable Agreement.
Payments are generally due under the Tax Receivable Agreement within 30 days following the finalization of the schedule with respect to which the payment obligation is calculated, although interest on such payments will begin to accrue from the due date (without extensions) of such tax return until such payment due date at a rate equal to the London Interbank offering rate (LIBOR), plus 200 basis points. Except in cases where we elect to terminate the Tax Receivable Agreement early, the Tax Receivable Agreement is terminated early due to certain mergers or other changes of control or we have available cash but fail to make payments when due, generally we may elect to defer payments due under the Tax Receivable Agreement if we do not have available cash to satisfy our payment obligations under the Tax Receivable Agreement or if our contractual obligations limit our ability to make these payments. Any such deferred payments under the Tax Receivable Agreement generally will accrue interest at a rate of LIBOR
141
plus 500 basis points; provided, however, that interest will accrue at a rate of LIBOR plus 200 basis points if we are unable to make such payment as a result of limitations imposed by existing credit agreements. We have no present intention to defer payments under the Tax Receivable Agreement.
Because we are a holding company with no operations of our own, our ability to make payments under the Tax Receivable Agreement is dependent on the ability of JEH LLC to make distributions to us in an amount sufficient to cover our obligations under the Tax Receivable Agreement; this ability, in turn, may depend on the ability of JEH LLC's subsidiaries to make distributions to it. The ability of JEH LLC and its subsidiaries to make such distributions will be subject to, among other things, the applicable provisions of Delaware law that may limit the amount of funds available for distribution and restrictions in relevant debt instruments issued by JEH LLC and/or its subsidiaries. To the extent that we are unable to make payments under the Tax Receivable Agreement for any reason, such payments will be deferred and will accrue interest until paid.
The form of the Tax Receivable Agreement is filed as an exhibit to the registration statement of which this prospectus forms a part, and the foregoing description of the Tax Receivable Agreement is qualified by reference thereto.
Registration rights and stockholders agreement
In connection with the closing of this offering, we will enter into a registration rights and stockholders agreement with Metalmark Capital and the Jones family entities. We expect the registration rights and stockholders agreement will grant each of Metalmark Capital and the Jones family entities (collectively) the right to nominate two members of our board of directors so long as Metalmark Capital or the Jones family entities, as applicable, holds not less than 50% of the common stock that they hold immediately following this offering and the right to nominate one member of our board of directors so long as they hold not less than 20% of the common stock that they hold immediately following this offering. The agreement will also require the stockholders party thereto to take all necessary actions, including voting their shares of common stock, for the election of these nominees.
In addition, the agreement will contain provisions by which we agree to register under the federal securities laws the sale of shares of our Class A common stock by Metalmark Capital or the Jones family entities. At any time after 180 days after the consummation of this offering, each of Metalmark Capital and the Jones family entities (collectively) will have the right to require us by written notice to register the sale of any number of their shares of common stock and will have the right to cause up to an aggregate of three such required or "demand" registrations. We are not obligated to effect any demand registration in which the anticipated aggregate offering price included in such offering is equal to or less than $50,000,000 ($25,000,000 where the registration is on a Form S-3). If, at any time, we propose to register an offering of Class A common stock (subject to certain exceptions) for our own account, then we must give prompt notice to Metalmark Capital and the Jones family entities to allow them to include a specified number of their shares in that registration statement. These registration rights are subject to certain conditions and limitations, including the right of the underwriters to limit the number of shares to be included in a registration and our right to delay or withdraw a registration statement under certain circumstances. We will generally be obligated to pay all registration expenses in connection with these registration obligations, regardless of whether a registration statement is filed or becomes effective.
Transactions with our executive officers, directors and 5% stockholders
We pay Metalmark Capital an annual monitoring fee of $675,000 pursuant to a Transaction Fee and Monitoring Fee Agreement, dated as of December 31, 2009. Under this agreement, Metalmark Capital
142
provides us with advisory and consulting services, including advice regarding the structure and terms of debt and equity offerings, our relationships with lenders, our business strategy and potential disposition and acquisition opportunities. Metalmark Capital beneficially owns in excess of five percent of our outstanding equity interests and two of our directors, Howard I. Hoffen and Gregory D. Myers, are managing directors of Metalmark Capital. This agreement will terminate upon the closing of this offering.
On May 7, 2013, we entered into a natural gas sale and purchase agreement with Monarch Natural Gas, LLC, or Monarch, under which Monarch has the first right to gather the natural gas we produce from the Chalker properties, process the NGLs from this natural gas production and market the processed natural gas and extracted NGLs. Under the Monarch agreement, we will be paid a specified percentage of the value of the NGLs extracted and sold by Monarch, based on a set liquids recovery percentage, and the amount received from the sale of the residue gas, after deducting a fixed volume for fuel, lost and unaccounted for gas. For the three months ended March 31, 2013, we produced approximately 0.2 MMBoe of natural gas and NGLs from the Chalker properties that became subject to the Monarch agreement. The initial term of the agreement runs for 10 years from the effective date of September 1, 2013. At the time we entered into the agreement, Metalmark Capital owned approximately 81% of the outstanding equity interests of Monarch. In addition, Metalmark Capital beneficially owns in excess of five percent of our outstanding equity interests and two of our directors, Howard I. Hoffen and Gregory D. Myers, are managing directors of Metalmark Capital. In connection with our entering into the Monarch agreement, Monarch issued to JEH LLC equity interests in Monarch having a deemed value of $15 million. JEH LLC assigned $2.5 million of the Monarch equity interests to Jonny Jones, our chief executive officer and chairman of the board, and reserved $2.5 million of the Monarch equity interests to a benefit plan established for certain of our officers, including Mike McConnell, Robert Brooks and Eric Niccum. For more information regarding the benefit plan, plase read "Executive compensation—Monarch equity plan." The remaining $10 million of Monarch equity will be distributed to the Existing Owners, other than the holders of the Management Units, which include Metalmark Capital, Wells Fargo, the Jones family entities, and certain of our officers and directors, including Jonny Jones, Mike McConnell, Robert Brooks and Eric Niccum, prior to this offering.
We currently sublease approximately 1,619 square feet of our office space in Austin, Texas to JRJ Management Company, LLC, an entity controlled by Jonny Jones, our chief executive officer, for $4,333 per month.
Certain entities directly or indirectly controlled by Jonny Jones, our chairman and chief executive officer, and/or his immediate family intend to purchase 1,000,000 shares of our Class A common stock at the public offering price. The underwriters will receive no underwriting discount or commission on any sale of these shares of Class A common stock. The Jones family entities are not currently obligated to purchase these shares.
Procedures for approval of related party transactions
A "Related Party Transaction" is a transaction, arrangement or relationship in which we or any of our subsidiaries was, is or will be a participant, the amount of which involved exceeds $120,000, and in which any related person had, has or will have a direct or indirect material interest. A "Related Person" means:
- •
- any person who is, or at any time during the applicable period was, one of our executive officers or one of our directors;
- •
- any person who is known by us to be the beneficial owner of more than 5.0% of our Class A common stock;
143
- •
- any immediate family member of any of the foregoing persons, which means any child, stepchild, parent, stepparent, spouse,
sibling, mother-in-law, father-in-law, son-in-law, daughter-in-law,
brother-in-law or sister-in-law of a director, executive officer or a beneficial owner of more than 5.0% of our Class A common stock, and any
person (other than a tenant or employee) sharing the household of such director, executive officer or beneficial owner of more than 5.0% of our Class A common stock; and
- •
- any firm, corporation or other entity in which any of the foregoing persons is a partner or principal or in a similar position or in which such person has a 10.0% or greater beneficial ownership interest.
Our board of directors will adopt a written related party transactions policy prior to the completion of this offering. Pursuant to this policy, our audit committee will review all material facts of all Related Party Transactions and either approve or disapprove entry into the Related Party Transaction, subject to certain limited exceptions. In determining whether to approve or disapprove entry into a Related Party Transaction, our audit committee shall take into account, among other factors, the following: (1) whether the Related Party Transaction is on terms no less favorable than terms generally available to an unaffiliated third-party under the same or similar circumstances and (2) the extent of the Related Person's interest in the transaction. Further, the policy requires that all Related Party Transactions required to be disclosed in our filings with the SEC be so disclosed in accordance with applicable laws, rules and regulations.
144
The following table sets forth information with respect to the beneficial ownership of our Class A common stock and Class B common stock as of June 15, 2013 after giving effect to our corporate reorganization by:
- •
- each person known by us to be a beneficial owner of more than 5% of the stock;
- •
- each of our named executive officers;
- •
- each of our directors; and
- •
- all of our current directors and executive officers as a group.
The number of shares of our capital stock and of JEH LLC Units outstanding and the percentage of beneficial ownership before and after the consummation of the offering set forth below is presented after giving effect to the reorganization transactions described under "Organizational structure."
Beneficial ownership is determined in accordance with the rules of the SEC. These rules generally attribute beneficial ownership of securities to persons who possess sole or shared voting power or investments power with respect to such securities. Except as otherwise indicated, we believe that all persons listed below have sole voting and investment power with respect to the shares beneficially owned by them, except to the extent this power may be shared with a spouse, based on information provided to us by such persons. Unless otherwise indicated, the address of each person or entity named in the table below is 807 Las Cimas Parkway, Suite 350, Austin, Texas 78746.
| |
Class A common stock beneficially owned(1) |
Class B common stock beneficially owned(1) |
|
|
||||||||||||
|---|---|---|---|---|---|---|---|---|---|---|---|---|---|---|---|---|
| |
|
Percentage of shares of Class A Common Stock Outstanding |
|
Percentage of shares of Class B Common Stock Outstanding |
Combined voting power(2) | |||||||||||
| Name of beneficial owner |
Number of shares |
Prior to the offering |
After the offering |
Number of shares |
Prior to the offering |
After the offering |
Prior to the offering |
After the offering |
||||||||
Five percent stockholders: |
||||||||||||||||
Metalmark Capital Partners(3) |
— | — | — | 22,745,752 | 61.7% | 61.7% | 61.7% | 44.7% | ||||||||
Jones family entities(4) |
— | — | — | 12,810,720 | 34.8% | 34.8% | 34.8% | 25.2% | ||||||||
Directors and named executive officers: |
||||||||||||||||
Jonny Jones(5) |
— | — | — | 12,810,720 | 34.8% | 34.8% | 34.8% | 25.2% | ||||||||
Howard I. Hoffen(6) |
— | — | — | 22,745,752 | 61.7% | 61.7% | 61.7% | 44.7% | ||||||||
Gregory D. Myers(6) |
— | — | — | 22,745,752 | 61.7% | 61.7% | 61.7% | 44.7% | ||||||||
Mike S. McConnell(7) |
— | — | — | 1,421,889 | 3.9% | 3.9% | 3.9% | 2.8% | ||||||||
Craig Fleming(8) |
— | — | — | 109,515 | * | * | * | * | ||||||||
Directors and current executive officers as a group (six total) |
— |
— |
— |
35,556,472 |
96.5% |
96.5% |
96.5% |
69.9% |
||||||||
* Less than one percent
(1) Pursuant to Rule 13d-3 under the Exchange Act, a person has beneficial ownership of a security as to which that person, directly or indirectly, through any contract, arrangement, understanding, relationship, or otherwise has or shares voting power and/or investment power of such security and as to which that person has the right to acquire beneficial ownership of such security within 60 days. Subject to the terms of the Exchange Agreement, the JEH LLC Units (together with a corresponding number of shares of our Class B common stock) are exchangeable at any time and from time to time for shares of our Class A common stock on a one-for-one basis, subject to customary conversion rate adjustments for stock splits, stock dividends and reclassifications and other similar transactions. See "Certain relationships and related party transactions—Exchange agreement." Except in connection with the exercise of the underwriters' option to purchase additional shares of Class A common stock, shares of Class B common stock cannot be exchanged prior to the expiration or waiver of the 180 day lock-up period, as described in "Underwriting (conflicts of interest)."
(2) Represents percentage of voting power of the Class A common stock and Class B common stock of Jones Energy voting together as a single class. See "Description of capital stock."
(3) Metalmark Capital Partners' address is 1177 Avenue of the Americas, 40th Floor; New York, NY 10036; Attention: Gregory D. Myers. If the underwriters' option to purchase additional shares is exercised in full and Metalmark Capital Partners elects to exchange its Class B common stock for cash proceeds we receive from the underwriters' option to purchase additional shares of Class A common stock, Metalmark Capital Partners would beneficially own 20,757,620 shares of Class B common stock (59.8% of the Class B common stock), representing 40.8% of the combined voting power of both classes.
(4) These shares are held by various entities of which Jones Energy Management, LLC or JET 3 GP, LLC is the general partner. Jonny Jones has voting power over all such shares in his capacity as Manager of Jones Energy Management, LLC and Managing Member of JET 3 GP, LLC. Jonny Jones and his father, Jon Rex Jones, each indirectly own 50% of Jones Energy Management, LLC. Jonny Jones indirectly owns 100% of JET 3 GP, LLC. Various family members of Jonny Jones and Jon Rex Jones and current and former officers and employees of Jones Energy
145
directly or indirectly hold limited partnership interests in the Jones family entities that hold these shares. If all shares of Class B common stock held by the Jones family entities were distributed to the individuals or entities that hold direct or indirect ownership interests in them, Jonny Jones would beneficially own 5,545,230 shares of Class B common stock (15.1% of the Class B common stock) representing a 10.9% combined voting power and Jon Rex Jones would beneficially own 3,433,517 shares of Class B common stock (9.3% of the Class B common stock), representing a 6.8% combined voting power. 1,642,003 of these shares of Class B common stock would be deemed to be beneficially owned by both Jonny Jones and Jon Rex Jones. Indirect ownership of 2,770,246 of these shares have been pledged from one Jones family entity to another for estate planning purposes. Each of the Jones family entities party to those pledges is ultimately owned by Jonny Jones. If the Jones family entities purchase 1,000,000 shares of Class A common stock in the offering, the Jones family entities will collectively beneficially own approximately 7.1% of our Class A common stock (27.2% of our combined economic interest and voting power). The information set forth in the table above does not reflect this potential purchase. The number of shares beneficially owned by the Jones family entities would not change if the underwriters' option to purchase additional shares is exercised. The address for the Jones family entities is JRJ Management Company, LLC, 807 Las Cimas Parkway, Suite 370, Austin, TX 78746.
(5) These shares are held by various entities of which Jones Energy Management, LLC or JET 3 GP, LLC is the general partner. Jonny Jones has voting power over all such shares in his capacity as Manager of Jones Energy Management, LLC and Managing Member of JET 3 GP, LLC. Jonny Jones and Jon Rex Jones each indirectly own 50% of Jones Energy Management, LLC. Jonny Jones indirectly owns 100% of JET 3 GP, LLC. The number of shares beneficially owned by Jonny Jones would not change if the underwriters' option to purchase additional shares is exercised. Family members or other current or former officers or employees of Jones Energy have direct or indirect ownership interests in the Jones family entities and have the right to cause their pro rata portion of the shares of Class B common stock held by the Jones family entities to be exchanged for shares of Class A common stock and distributed to them. Jonny Jones disclaims beneficial ownership of the shares of Class B common stock held by the Jones family entities except to the extent of his pecuniary interest therein. If all shares of Class B common stock held by the Jones family entities were distributed to the individuals or entities that hold direct or indirect ownership interests in them, Jonny Jones would beneficially own 5,545,230 shares of Class B common stock (15.1% of the Class B common stock) representing a 10.9% combined voting power. Indirect ownership of 2,770,246 of these shares have been pledged from one Jones family entity to another for estate planning purposes. Each of the Jones family entities party to those pledges is ultimately owned by Jonny Jones.
(6) Messrs. Hoffen and Myers are each managing directors of Metalmark and may be deemed to share beneficial ownership of any shares held by Metalmark. Each of Messrs. Hoffen and Myers disclaim beneficial ownership of these shares as a result of his employment arrangements with Metalmark, except to the extent that his pecuniary interest therein is ultimately realized. The address of each of Messrs. Hoffen and Myers is c/o Metalmark Capital Partners; 1177 Avenue of the Americas, 40th Floor; New York, NY 10036.
(7) These shares are currently held by the Jones family entities, but Mr. McConnell has the right to cause them to be exchanged for shares of Class A common stock and distributed to himself or entities that he controls.
(8) Mr. Fleming's employment with us commenced in November 2008, and he resigned effective January 18, 2013. These shares are currently held by the Jones family entities, but Mr. Fleming has the right to cause them to be exchanged for shares of Class A common stock and distributed to himself or entities that he controls. Mr. Fleming's address is 1604 Churchwood Cove, Austin, Texas 78746.
146
Upon completion of this offering (assuming no exercise of the underwriters' option to purchase additional shares), the authorized capital stock of Jones Energy, Inc. will consist of 600,000,000 shares of Class A common stock, $0.001 par value per share, of which 14,000,000 shares will be issued and outstanding, 150,000,000 shares of Class B common stock, $0.001 par value per share, of which 36,836,333 shares will be issued and outstanding and 100,000,000 shares of preferred stock, $0.001 par value per share, of which no shares will be issued and outstanding.
We will adopt an amended and restated certificate of incorporation and amended and restated bylaws concurrently with the completion of this offering. The following summary of the capital stock and certificate of incorporation and bylaws of Jones Energy, Inc. does not purport to be complete and is qualified in its entirety by reference to the provisions of applicable law and to our amended and restated certificate of incorporation and amended and restated bylaws, which are filed as exhibits to the registration statement of which this prospectus is a part.
Class A common stock
Voting Rights. Holders of shares of Class A common stock are entitled to one vote per share held of record on all matters to be voted upon by the stockholders, except that, to the fullest extent permitted by law, holders of shares of Class A common stock will have no voting power with respect to amendments to the amended and restated certificate of incorporation that relate solely to the terms of preferred stock if the holders of the affected series are entitled to vote thereon. Holders of shares of our Class A common stock and Class B common stock vote together as a single class on all matters, except as otherwise required by the amended and restated certificate of incorporation or by applicable law. The holders of Class A common stock do not have cumulative voting rights in the election of directors.
Dividend Rights. Holders of shares of our Class A common stock are entitled to ratably receive dividends when and if declared by our board of directors out of funds legally available for that purpose, subject to any statutory or contractual restrictions on the payment of dividends and to any prior rights and preferences that may be applicable to any outstanding preferred stock. Shares of Class A common stock may not be split or combined unless the outstanding shares of Class B common stock are proportionately split or combined. Dividends on Class A common stock in the form of common stock (or securities convertible into or exercisable or exchangeable for common stock) may be paid only in the form of Class A common stock (or securities convertible or exchangeable for Class A common stock) and on a proportionate basis with a corresponding stock dividend on Class B common stock.
Liquidation Rights. Upon our liquidation, dissolution, distribution of assets or other winding up, the holders of Class A common stock are entitled to receive ratably the assets available for distribution to the stockholders after payment of liabilities and the liquidation preference of any of our outstanding shares of preferred stock.
Other Matters. The shares of Class A common stock have no preemptive or conversion rights and are not subject to further calls or assessment by us. There are no redemption or sinking fund provisions applicable to the Class A common stock. All outstanding shares of our Class A common stock, including the Class A common stock offered in this offering, are fully paid and non-assessable.
147
Class B common stock
Generally. In connection with the reorganization and this offering, each of the Existing Owners will be issued one share of Class B common stock for each JEH LLC Unit that it holds. Accordingly, the Existing Owners collectively have a number of votes in Jones Energy, Inc. equal to the aggregate number of JEH LLC Units that they hold.
Voting Rights. Holders of shares of our Class B common stock are entitled to one vote per share held of record on all matters to be voted upon by the stockholders, except that, to the fullest extent permitted by law, holders of shares of Class B common stock will have no voting power with respect to amendments to the amended and restated certificate of incorporation that relate solely to the terms of preferred stock if the holders of the affected series are entitled to vote thereon. Holders of shares of our Class A common stock and Class B common stock vote together as a single class on all matters, except as otherwise required by the amended and restated certificate of incorporation or by applicable law.
Dividend and Liquidation Rights. Holders of our Class B common stock do not have any right to receive dividends, unless (i) the dividend consists of shares of our Class B common stock or of rights, options, warrants or other securities convertible or exercisable into or exchangeable for shares of Class B common stock paid proportionally with respect to each outstanding share of our Class B common stock and (ii) a dividend consisting of shares of Class A common stock or of rights, options, warrants or other securities convertible or exercisable into or exchangeable for shares of Class A common stock on equivalent terms is simultaneously paid to the holders of Class A common stock. Shares of Class B common stock may not be split or combined unless the outstanding shares of Class A common stock are proportionately split or combined. Holders of our Class B common stock do not have any right to receive a distribution upon a liquidation or winding up of Jones Energy, Inc.
Preferred stock
Our amended and restated certificate of incorporation authorizes our board of directors, subject to any limitations prescribed by law, without further stockholder approval, to issue from time to time one or more series of preferred stock, par value $0.001 per share, out of the unissued shares of preferred stock, and, with respect to each such series, to fix the number of shares constituting such series and the powers, preferences, rights, qualifications, limitations and restrictions of such series which may include, among others, dividend rights, liquidation preferences, voting rights, conversion rights, preemptive rights and redemption rights. Except as provided by law or in a preferred stock designation, the holders of preferred stock will not be entitled to vote at or receive notice of any meeting of stockholders.
Anti-takeover effects of provisions of our amended and restated certificate of incorporation, our amended and restated bylaws and Delaware law
Some provisions of Delaware law, and our amended and restated certificate of incorporation and our amended and restated bylaws described below, will contain provisions that could make more difficult acquisitions of us or control of us by means of a tender offer, proxy contest or otherwise, or removal of our incumbent directors and officers. These provisions may also have the effect of preventing changes in our management. It is possible that these provisions could make it more difficult to accomplish or could deter transactions that stockholders may consider to be in their best interest or in our best interests, including transactions that might result in a premium over the market price for our shares.
148
These provisions, summarized below, are expected to discourage coercive takeover practices and inadequate takeover bids. They are also designed to encourage persons seeking to acquire control of our company to first negotiate with us. We believe that the benefits of increased protection and our potential ability to negotiate with the proponent of an unfriendly or unsolicited proposal to acquire or restructure us outweigh the disadvantages of discouraging these proposals because, among other things, negotiation of these proposals could result in an improvement of their terms.
Delaware law. We are subject to the provisions of Section 203 of the DGCL regulating corporate takeovers. In general, those provisions prohibit a Delaware corporation, including those whose securities are listed for trading on the NYSE, from engaging in any business combination with any interested stockholder for a period of three years following the date that the stockholder became an interested stockholder, unless:
- •
- the transaction is approved by the board of directors before the date the interested stockholder attained that status;
- •
- upon consummation of the transaction that resulted in the stockholder becoming an interested stockholder, the interested
stockholder owned at least 85% of the voting stock of the corporation outstanding at the time the transaction commenced; or
- •
- on or after such time the business combination is approved by the board of directors and authorized at a meeting of stockholders by at least two-thirds of the outstanding voting stock that is not owned by the interested stockholder.
Section 203 defines "business combination" to include the following:
- •
- any merger or consolidation involving the corporation and the interested stockholder;
- •
- any sale, transfer, pledge or other disposition of 10% or more of the assets of the corporation involving the interested
stockholder;
- •
- subject to certain exceptions, any transaction that results in the issuance or transfer by the corporation of any stock of
the corporation to the interested stockholder;
- •
- any transaction involving the corporation that has the effect of increasing the proportionate share of the stock of any
class or series of the corporation beneficially owned by the interested stockholder; or
- •
- the receipt by the interested stockholder of the benefit of any loans, advances, guarantees, pledges or other financial benefits provided by or through the corporation.
In general, Section 203 defines an interested stockholder as any entity or person beneficially owning 15% or more of the outstanding voting stock of the corporation and any entity or person affiliated with or controlling or controlled by any of these entities or persons.
A Delaware corporation may "opt out" of Section 203 with an express provision in its original certificate of incorporation or an express provision in its certificate of incorporation or bylaws resulting from amendments approved by the holders of at least a majority of the corporation's outstanding voting shares. We do not intend to "opt out" of the provisions of Section 203. The statute could prohibit or delay mergers or other takeover or change in control attempts and, accordingly, may discourage attempts to acquire us.
149
Amended and restated certificate of incorporation and amended and restricted bylaws. Among other things, our amended and restated certificate of incorporation and amended and restated bylaws will:
- •
- permit our board of directors to issue up to 100,000,000 shares of preferred stock, with any rights, preferences
and privileges as they may designate;
- •
- provide for a maximum of 11 directors and provide that the authorized number of directors at any given time may be fixed
only by resolution of the board of directors with the approval of a majority of the total number of directors;
- •
- provide that any action required or permitted to be taken by the stockholders must be effected at a duly called annual or
special meeting of stockholders and may not be effected by any consent in writing in lieu of a meeting of such stockholders, subject to the rights of the holders of Class B common stock with
respect to the Class B common stock or the holders of any series of preferred stock with respect to such series;
- •
- provide that all vacancies, including newly created directorships, may be filled solely by the affirmative vote of a
majority of directors then in office, even if less than a quorum;
- •
- provide that our amended and restated bylaws and certain provisions of our amended and restated certificate of
incorporation may only be amended by the affirmative vote of the holders of at least 75% of the voting power of our then-outstanding capital stock, voting together as a single class;
- •
- provide that special meetings of our stockholders may only be called by the board of directors, the chief executive
officer or the chairman of the board of directors and not by stockholders (subject to the rights of holders of preferred stock); and
- •
- provide that directors may be removed only for cause (as defined in the amended and restated certificate of incorporation)
and only by the affirmative vote of holders of at least 75% of the voting power of our then-outstanding capital stock, voting together as a single class;
- •
- provide for our board of directors to be divided into three classes of directors, serving staggered three year terms,
other than directors which may be elected by holders of preferred stock, if any. For more information on the classified board of directors and the rights of certain holders of our common stock to
designate directors, please read "Management" and "Certain relationships and related party transactions—Registration rights and stockholders agreement." This system of electing and
removing directors may tend to discourage a third party from making a tender offer or otherwise attempting to obtain control of us, because it could have the effect of increasing the length of time
necessary to change the composition of a majority of the board of directors. In general, at least two annual meetings of stockholders will be necessary for stockholders to effect a change in a
majority of the members of the board of directors; and
- •
- provide that stockholders seeking to present proposals before a meeting of stockholders or to nominate candidates for election as directors at a meeting of stockholders must provide notice in writing in a timely manner, which notice must satisfy various requirements as to form and content.
Choice of forum
Our amended and restated certificate of incorporation provides that unless we consent in writing to the selection of an alternative forum, the Court of Chancery of the State of Delaware will, subject to specified exceptions for subject matter jurisdiction for other Delaware courts, be the sole and exclusive forum for:
150
(i) any derivative action or proceeding brought on our behalf; (ii) any action asserting a claim of breach of a fiduciary duty owed by any of our directors, officers or other employee or agent to us, our stockholders, creditors or other constituents; (iii) any action asserting a claim against us or any of our directors and officers arising pursuant to any provision of the DGCL or our amended and restated certificate of incorporation or amended and restated bylaws; (iv) any action to interpret, apply, enforce or determine the validity of our amended and restated certificate of incorporation or amended and restated bylaws; or (v) any action asserting a claim against us or any of our directors or officers governed by the internal affairs doctrine. Our amended and restated certificate of incorporation also provides that any person or entity purchasing or otherwise acquiring any interest in shares of our capital stock will be deemed to have notice of and to have consented to this choice of forum provision. It is possible that a court of law could rule that the choice of forum provision contained in our amended and restated certificate of incorporation is inapplicable or unenforceable if it is challenged in a proceeding or otherwise.
Limitation of liability and indemnification matters
Our amended and restated certificate of incorporation limits the liability of our directors for monetary damages for breach of their fiduciary duty as directors, except for liability that cannot be eliminated under the DGCL. Delaware law provides that directors of a corporation will not be personally liable for monetary damages for breach of their fiduciary duty as directors, except for liabilities:
- •
- for any breach of their duty of loyalty to us or our stockholders;
- •
- for acts or omissions not in good faith or which involve intentional misconduct or a knowing violation of law;
- •
- for unlawful payment of dividend or unlawful stock repurchase or redemption, as provided under Section 174 of the
DGCL; or
- •
- for any transaction from which the director derived an improper personal benefit.
Any amendment, repeal or modification of these provisions will be prospective only and would not affect any limitation on liability of a director for acts or omissions that occurred prior to any such amendment, repeal or modification.
Our amended and restated bylaws also provide that we will indemnify our directors and executive officers to the fullest extent permitted by Delaware law. Our amended and restated bylaws also permit us to purchase insurance on behalf of any officer, director, employee or other agent for any liability arising out of that person's actions as our officer, director, employee or agent, regardless of whether Delaware law would permit indemnification. We intend to enter into indemnification agreements with each of our current and future directors and executive officers. These agreements will require us to indemnify these individuals to the fullest extent permitted under Delaware law against liability that may arise by reason of their service to us, and to advance expenses incurred as a result of any proceeding against them as to which they could be indemnified. We believe that the limitation of liability provision in our amended and restated certificate of incorporation and the indemnification agreements will facilitate our ability to continue to attract and retain qualified individuals to serve as directors and officers.
Corporate opportunity
Our amended and restated certificate of incorporation provides that, to the fullest extent permitted by applicable law, the doctrine of corporate opportunity, or any analogous doctrine, shall not apply to
151
Metalmark Capital and any of its respective officers, directors, agents, shareholders, members and partners (other than us and our subsidiaries) (each a "specified party"). Additionally, our amended and restated certificate of incorporation provides that, to the fullest extent permitted by applicable law, we renounce any interest or expectancy in any business opportunity, transaction or other matter in which a specified party (other than us and our subsidiaries) participates or desires or seeks to participate in, unless any such business opportunity, transaction or matter is offered in writing solely to a specified party who is one of our directors or officers and is offered such opportunity solely in his or her capacity as one of our directors or officers.
Transfer agent and registrar
The transfer agent and registrar for our Class A common stock is American Stock Transfer & Trust Company, LLC.
Listing
We have been approved to list our Class A common stock on the NYSE under the symbol "JONE," subject to official notice of issuance.
152
Shares eligible for future sale
Prior to this offering, there has been no public market for our Class A common stock. Future sales of our Class A common stock in the public market, or the availability of such shares for sale in the public market, could adversely affect the market price of our Class A common stock prevailing from time to time. As described below, only a limited number of shares will be available for sale shortly after this offering due to contractual and legal restrictions on resale. Nevertheless, sales of a substantial number of shares of our Class A common stock in the public market after such restrictions lapse, or the perception that those sales may occur, could adversely affect the prevailing market price of our Class A common stock at such time and our ability to raise equity-related capital at a time and price we deem appropriate.
Upon the closing of this offering, we will have outstanding an aggregate of 14,000,000 shares of Class A common stock. All 14,000,000 shares of our Class A common stock sold in this offering (or 16,100,000 shares of Class A common stock if the underwriters exercise in full their option to purchase additional shares of Class A common stock) will be freely tradable without restriction or further registration under the Securities Act by persons other than our "affiliates" as defined in Rule 144 under the Securities Act, which would be subject to the limitations and restrictions described below under "—Rule 144."
In addition, subject to certain limitations and exceptions, pursuant to the terms of the Exchange Agreement, holders of JEH LLC Units and Class B common stock may (subject to the terms of the Exchange Agreement) exchange JEH LLC Units (together with a corresponding number of shares of our Class B common stock) for shares of our Class A common stock on a one-for-one basis, subject to customary conversion rate adjustments for stock splits, stock dividends and reclassifications. Upon consummation of this offering, the Existing Owners will hold 36,836,333 JEH LLC Units (or 34,736,333 JEH LLC Units if the underwriters exercise in full their option to purchase additional shares of Class A common stock and Metalmark Capital and Wells Fargo elect to exchange JEH LLC Units and a corresponding number of shares of Class B common stock for cash proceeds we receive from the underwriters' option to purchase additional shares of Class A common stock), all of which (together with a corresponding number of shares of our Class B common stock) will be exchangeable for shares of our Class A common stock. See "Certain relationships and related party transactions—Exchange agreement." The shares of Class A common stock we issue upon such exchanges would be "restricted securities" as defined in Rule 144 described below. However, upon the closing of this offering, we intend to enter into a registration rights and stockholders agreement with certain of our existing equity owners that will require us to register under the Securities Act these shares of Class A common stock. See "Certain relationships and related party transactions—Registration rights and stockholders agreement."
Lock-up agreements
We, all of our directors and officers and certain of our principal stockholders have agreed not to sell any Class A common stock for a period of 180 days from the date of this prospectus, subject to certain exceptions and extensions. See "Underwriting (conflicts of interest)" for a description of these lock-up provisions.
Rule 144
In general, under Rule 144 under the Securities Act as currently in effect, a person (or persons whose shares are aggregated) who is not deemed to have been an affiliate of ours at any time during the three months preceding a sale, and who has beneficially owned restricted securities within the meaning of
153
Rule 144 for a least sixth months (including any period of consecutive ownership of preceding non-affiliated holders) would be entitled to sell those shares, subject only to the availability of current public information about us. A non-affiliated person (who has been unaffiliated for at least the past three months) who has beneficially owned restricted securities within the meaning of Rule 144 for at least one year would be entitled to sell those shares without regard to the provisions of Rule 144.
A person (or persons whose shares are aggregated) who is deemed to be an affiliate of ours and who has beneficially owned restricted securities within the meaning of Rule 144 for at least nine months would be entitled to sell, within any three-month period, a number of shares that does not exceed the greater of one percent of the then outstanding shares of our Class A common stock or the average weekly trading volume of our Class A common stock reported through the NYSE during the four calendar weeks preceding the filing of notice of the sale. Such sales are also subject to certain manner of sale provisions, notice requirements and the availability of current public information about us.
Rule 701
In general, under Rule 701 under the Securities Act, any of our employees, directors, officers, consultants or advisors who purchases shares from us in connection with a compensatory stock or option plan or other written agreement before the effective date of this offering is entitled to sell such shares 90 days after the effective date of this offering in reliance on Rule 144, without having to comply with the holding period requirement of Rule 144 and, in the case of non-affiliates, without having to comply with the public information, volume limitation or notice filing provisions of Rule 144. The SEC has indicated that Rule 701 will apply to typical stock options granted by an issuer before it becomes subject to the reporting requirements of the Exchange Act, along with the shares acquired upon exercise of such options, including exercises after the date of this prospectus.
Stock issued under employee plans
We intend to file a registration statement on Form S-8 under the Securities Act to register stock issuable under our long-term incentive plan. This registration statement on Form S-8 is expected to be filed following the effective date of the registration statement of which this prospectus is a part and will be effective upon filing. Accordingly, shares registered under such registration statement will be available for sale in the open market following the effective date, unless such shares are subject to vesting restrictions with us, Rule 144 restrictions applicable to our affiliates or the lock-up restrictions described above.
Registration rights and stockholders agreement
In connection with the closing of this offering, we expect to enter into a registration rights and stockholders agreement with certain of our existing equity owners. Please read "Certain relationships and related party transactions—Registration rights and stockholders agreement."
154
Material U.S. federal income and estate tax considerations
for non-U.S. holders
The following is a general discussion of the material U.S. federal income and estate tax consequences of the acquisition, ownership and disposition of our Class A common stock to a non-U.S. holder. Except as specifically provided below (see "—Estate tax"), for the purpose of this discussion, a non-U.S. holder is any beneficial owner of our Class A common stock that, for U.S. federal income tax purposes is an individual, corporation, estate or trust and is not any of the following:
- •
- an individual citizen or resident of the U.S.;
- •
- a corporation (or other entity treated as a corporation for U.S. federal income tax purposes) created or organized
in the U.S. or under the laws of the U.S. or any state or the District of Columbia;
- •
- an estate whose income is subject to U.S. federal income tax regardless of its source; or
- •
- a trust (x) whose administration is subject to the primary supervision of a U.S. court and which has one or more U.S. persons who have the authority to control all substantial decisions of the trust or (y) which has made a valid election to be treated as a U.S. person.
If a partnership (or an entity treated as a partnership for U.S. federal income tax purposes) holds our Class A common stock, the tax treatment of a partner in the partnership will generally depend on the status of the partner and upon the activities of the partnership. Accordingly, we urge partnerships that hold our Class A common stock and partners in such partnerships to consult their tax advisors.
This discussion assumes that non-U.S. holders will hold our Class A common stock issued pursuant to the offering as a capital asset (generally, property held for investment). This discussion does not address all aspects of U.S. federal income taxation (e.g., alternative minimum tax) or any aspects of U.S. federal gift taxation or state, local or non-U.S. taxation, nor does it consider any U.S. federal income tax considerations that may be relevant to non-U.S. holders that may be subject to special treatment under U.S. federal income tax laws, including, without limitation, U.S. expatriates, insurance companies, tax-exempt or governmental organizations, dealers in securities or currency, banks or other financial institutions, investors whose functional currency is other than the U.S. dollar, "controlled foreign corporations," "passive foreign investment companies," common trust funds, certain trusts, and hybrid entities, and investors that hold our Class A common stock as part of a hedge, straddle or conversion transaction. Furthermore, the following discussion is based on current provisions of the Internal Revenue Code of 1986, as amended, and Treasury Regulations and administrative and judicial interpretations thereof, all as in effect on the date hereof, and all of which are subject to change, possibly with retroactive effect.
We urge each prospective investor to consult a tax advisor regarding the U.S. federal, state, local and non-U.S. income and other tax consequences of acquiring, holding and disposing of shares of our Class A common stock.
Dividends
We have not made any distributions on our Class A common stock, and we do not plan to make any distributions for the foreseeable future. However, if we do make distributions on our Class A common stock, those distributions will constitute dividends for U.S. tax purposes to the extent paid from our current or accumulated earnings and profits, as determined under U.S. federal income tax principles. To the extent those distributions exceed our current and accumulated earnings and profits, such excess will constitute a
155
return of capital and will first reduce a holder's adjusted tax basis in its Class A common stock, but not below zero, and then will be treated as gain from the sale of Class A common stock (see "—Gain on disposition of Class A common stock" below).
Any dividend (i.e., a distribution paid out of earnings and profits) paid to a non-U.S. holder of our Class A common stock generally will be subject to U.S. federal income tax withholding either at a rate of 30% of the gross amount of the dividend or such lower rate as may be specified by an applicable tax treaty. To receive the benefit of a reduced treaty rate, a non-U.S. holder must provide us with an IRS Form W-8BEN or other appropriate version of IRS Form W-8 certifying qualification for the reduced rate. If the non-U.S. holder holds the stock through a financial institution or other agent acting on the holder's behalf, the holder will be required to provide appropriate documentation to the agent. The holder's agent will then be required to provide certification to us or our paying agent, either directly or through other intermediaries. Special certification and other requirements apply to certain non-U.S. holders that are pass-through entities rather than corporations or individuals.
Dividends received by a non-U.S. holder that are effectively connected with a trade or business conducted by the non-U.S. holder in the United States (and, if required by an applicable income tax treaty, are attributable to a United States permanent establishment or fixed base maintained by the non-U.S. holder of the United States) are exempt from such withholding tax. To obtain this exemption, the non-U.S. holder must provide us with an IRS Form W-8ECI (or other appropriate version of IRS Form W-8) properly certifying such exemption. Such effectively connected dividends, although not subject to U.S. federal income tax withholding, will be subject to U.S. federal income tax on a net income basis at the same graduated rates generally applicable to U.S. persons, net of certain deductions and credits, subject to any applicable tax treaty providing otherwise. In addition to the income tax described above, dividends received by corporate non-U.S. holders that are effectively connected with a trade or business conducted by the corporate non-U.S. holder in the United States (and, if required by an applicable income tax treaty, are attributable to a United States permanent establishment or fixed base maintained by the non-U.S. holder in the United States) may be subject to a branch profits tax at a rate of 30% or such lower rate as may be specified by an applicable tax treaty.
A non-U.S. holder of our Class A common stock may obtain a refund of any excess amounts withheld under these rules if the non-U.S. holder is eligible for a reduced rate of United States withholding tax and an appropriate claim for refund is timely filed with the IRS.
Gain on disposition of Class A common stock
Subject to the discussion under "—Backup withholding and informational reporting" and "—Foreign account tax compliance," a non-U.S. holder generally will not be subject to U.S. federal income tax on any gain realized upon the sale or other disposition of our Class A common stock unless:
- •
- the gain is effectively connected with a trade or business conducted by a non-U.S. holder in the United
States and, if required by an applicable tax treaty, is attributable to a permanent establishment or fixed base maintained by such non-U.S. holder in the United States;
- •
- the non-U.S. holder is an individual who is present in the United States for a period or periods
aggregating 183 days or more during the calendar year in which the sale or disposition occurs and certain other conditions are met; or
- •
- we are or have been a "United States real property holding corporation" for U.S. federal income tax purposes at any time during the five-year period ending on the date of disposition or, if shorter, the
156
non-U.S. holder's holding period for its shares of our Class A common stock, and either (i) shares of our Class A common stock are not "regularly traded on an established securities market" or (ii) if shares of our Class A common stock are "regularly traded on an established securities market," the non-U.S. holder held, directly or indirectly, at any time during such period, more than 5% of our issued and outstanding Class A common stock. In this regard, we are, and expect to continue to be for the foreseeable future, a "United States real property holding corporation."
Gain described in the first and third bullet points above will be subject to U.S. federal income tax at the same graduated rates generally applicable to U.S. persons. If such non-U.S. holder is a foreign corporation, such gain may also be subject to a branch profits tax (at a 30% rate or such lower rate as specified by an applicable income tax treaty) on its effectively connected earnings and profits attributable to such gain, as adjusted for certain items.
A non-U.S. holder described in the second bullet point above will be subject to a 30% U.S. federal income tax (or such lower rate as may be specified by an applicable tax treaty) on the gain derived from the sale, which may be offset by certain U.S. source capital losses.
Non-U.S. holders should consult any applicable income tax treaties that may provide for different rules.
Backup withholding and information reporting
Generally, we must report annually to the IRS the amount of dividends paid to each non-U.S. holder, the name and address of the recipient, and the amount, if any, of tax withheld with respect to those dividends. A similar report is sent to each non-U.S. holder. These information reporting requirements apply even if withholding was not required. Pursuant to tax treaties or other agreements, the IRS may make its reports available to tax authorities in the recipient's country of residence.
Payments of dividends to a non-U.S. holder may be subject to backup withholding (at the applicable rate) unless the non-U.S. holder establishes an exemption, for example, by properly certifying its non-U.S. status on an IRS Form W-8BEN (or other suitable substitute or successor form). Notwithstanding the foregoing, backup withholding may apply if either we or our paying agent has actual knowledge, or reason to know, that the beneficial owner is a U.S. person that is not an exempt recipient.
Payments of the proceeds from sale or other disposition by a non-U.S. holder of our Class A common stock effected outside the U.S. by or through a foreign office of a broker generally will not be subject to information reporting or backup withholding. However, information reporting will apply to those payments if the broker does not have documentary evidence that the holder is a non-U.S. holder, an exemption is not otherwise established, and the broker has certain relationships with the United States.
Payments of the proceeds from a sale or other disposition by a non-U.S. holder of our Class A common stock effected by or through a U.S. office of a broker generally will be subject to information reporting and backup withholding (at the applicable rate) unless the non-U.S. holder establishes an exemption, for example, by properly certifying its non-U.S. status on an IRS Form W-8BEN (or other suitable substitute or successor form). Notwithstanding the foregoing, information reporting and backup withholding may apply if the broker has actual knowledge, or reason to know, that the holder is a U.S. person that is not an exempt recipient.
Backup withholding is not an additional tax. Rather, the U.S. income tax liability of persons subject to backup withholding will be reduced by the amount of tax withheld. If backup withholding results in an
157
overpayment of taxes, a refund may be obtained, provided that the required information is timely furnished to the IRS.
Estate tax
Our Class A common stock owned or treated as owned by an individual who is not a citizen or resident of the U.S. (as specifically defined for U.S. federal estate tax purposes) at the time of death will be includible in the individual's gross estate for U.S. federal estate tax purposes and may be subject to U.S. federal estate tax unless an applicable estate tax treaty provides otherwise.
Foreign account tax compliance
The Hiring and Incentives to Restore Employment Act, which contains provisions regarding foreign account tax compliance, or FATCA, was enacted on March 18, 2010, and once effective, will impose a 30% U.S. withholding tax on certain "withholdable payments." "Withholdable payments" include payments of dividends and the gross proceeds from a disposition of property (such as our Class A common stock). In general, if you are a "foreign financial institution" (which includes investment entities such as hedge funds and private equity funds), the 30% withholding tax will apply to withholdable payments made to you, unless you enter into an agreement with the U.S. Department of Treasury (the "Treasury") to collect and provide substantial information regarding your U.S. account holders, including certain account holders that are foreign entities with U.S. owners, and to withhold 30% on certain "passthru payments." If you are a "non-financial foreign entity," FATCA also generally will impose a withholding tax of 30% on withholdable payments made to you unless you provide the withholding agent with a certification that you do not have any substantial U.S. owners or a certification identifying your direct or indirect substantial U.S. owners. Treaties between the United States and your resident country may modify some of the foregoing requirements.
The Treasury has issued final Treasury Regulations, which provide that the withholding provisions are effective for payments made after December 31, 2013 (in the case of dividends on our Class A common stock) and December 31, 2016 (in the case of gross proceeds from the sale or other disposition of our Class A common stock). Investors should consult a tax advisor concerning the consequences under FATCA of ownership of our Class A common stock.
158
Underwriting (conflicts of interest)
We are offering the shares of Class A common stock described in this prospectus through a number of underwriters. J.P. Morgan Securities LLC, Barclays Capital Inc. and Wells Fargo Securities, LLC are acting as book-running managers of the offering and as representatives of the underwriters. We have entered into an underwriting agreement with the underwriters. Subject to the terms and conditions of the underwriting agreement, we have agreed to sell to the underwriters, and each underwriter has severally agreed to purchase, at the public offering price less the underwriting discount set forth on the cover page of this prospectus, the number of shares of Class A common stock listed next to its name in the following table:
| Name |
Number of shares |
|||
|---|---|---|---|---|
J.P. Morgan Securities LLC |
||||
Barclays Capital Inc. |
||||
Wells Fargo Securities, LLC |
||||
Jefferies LLC |
||||
Tudor, Pickering, Holt & Co. Securities, Inc. |
||||
Citigroup Global Markets Inc. |
||||
Capital One Southcoast, Inc. |
||||
Credit Agricole Securities (USA) Inc. |
||||
Mitsubishi UFJ Securities (USA), Inc. |
||||
Morgan Stanley & Co. LLC |
||||
Stifel, Nicolaus & Company, Incorporated |
||||
SunTrust Robinson Humphrey, Inc. |
||||
Total |
14,000,000 | |||
The underwriters are committed to purchase all the Class A common stock offered by us if they purchase any shares. The underwriting agreement also provides that if an underwriter defaults, the purchase commitments of non-defaulting underwriters may also be increased or the offering may be terminated.
The underwriters propose to offer the Class A common stock directly to the public at the initial public offering price set forth on the cover page of this prospectus and to certain dealers at that price less a concession not in excess of $ per share. The Jones family entities, all of which are directly or indirectly controlled by Jonny Jones and/or his immediate family, intend to purchase 1,000,000 shares of our Class A common stock at the public offering price. The underwriters will receive no underwriting discount or commission on any sale of shares of Class A common stock to the Jones family entities. The Jones family entities are not currently obligated to purchase these shares. After the initial public offering of the shares, the offering price and other selling terms may be changed by the underwriters. Sales of shares made outside of the United States may be made by affiliates of the underwriters. The representatives have advised us that the underwriters do not intend to confirm discretionary sales in excess of 5% of the Class A common stock offered in this offering. The offering of the shares by the underwriters is subject to receipt and acceptance and subject to the underwriters right to reject any order in whole or in part.
The underwriters have an option to buy up to 2,100,000 additional shares of Class A common stock from us to cover sales of shares by the underwriters which exceed the number of shares specified in the table above. The underwriters have 30 days from the date of this prospectus to exercise this option to acquire additional shares of Class A common stock. If any shares are purchased with option to acquire additional
159
shares of Class A common stock, the underwriters will purchase shares in approximately the same proportion as shown in the table above. If any additional shares of Class A common stock are purchased, the underwriters will offer the additional shares on the same terms as those on which the shares are being offered.
The underwriting fee is equal to the public offering price per share of Class A common stock less the amount paid by the underwriters to us per share of Class A common stock. The underwriting fee is $ per share. The following table shows the per share and total underwriting discount to be paid to the underwriters assuming both no exercise and full exercise of the underwriters' option to purchase additional shares of Class A common stock.
| |
Underwriting discounts and commissions |
||||||
|---|---|---|---|---|---|---|---|
| Paid by Jones Energy, Inc. |
Without option to purchase additional shares |
With option to purchase additional shares |
|||||
Per share |
$ | $ | |||||
Total |
$ | $ | |||||
We also have agreed to reimburse the underwriters for up to $15,000 of reasonable fees and expenses of counsel related to the review by the FINRA of the terms of sale of the shares of Class A common stock offered hereby.
We estimate that the total expenses of this offering to us, including registration, filing and listing fees, printing fees, and legal and accounting expenses, but excluding the underwriting discount, will be approximately $4,000,000.
A prospectus in electronic format may be made available on the web sites maintained by one or more underwriters, or selling group members, if any, participating in the offering. The underwriters may agree to allocate a number of shares to underwriters and selling group members for sale to their online brokerage account holders. Internet distributions will be allocated by the representative to underwriters and selling group members that may make Internet distributions on the same basis as other allocations.
We have agreed that we will not (1) offer, pledge, announce the intention to sell, sell, contract to sell, sell any option or contract to purchase, purchase any option or contract to sell, grant any option, right or warrant to purchase, or otherwise dispose of, directly or indirectly, or file with the Securities and Exchange Commission a registration statement under the Securities Act relating to, any shares of our Class A common stock or securities convertible into or exchangeable or exercisable for any shares of our Class A common stock, or publicly disclose the intention to make any offer, sale, pledge, disposition, or filing, or (2) enter into any swap or other arrangement that transfers all or a portion of the economic consequences associated with the ownership of any shares of Class A common stock or any such other securities (regardless of whether any of these transactions are to be settled by the delivery of shares of Class A common stock or such other securities, in cash or otherwise), in each case without the prior written consent of J.P. Morgan Securities LLC, for a period of 180 days after the date of this prospectus, other than the shares of our Class A common stock to be sold hereunder, any shares of our Class A common stock issued for awards or upon the exercise of options granted under our management incentive plans, and any purchase by us of JEH LLC Units from Metalmark Capital or Wells Fargo with the proceeds of any
160
exercise of the underwriters' option to purchase additional shares of Class A common stock. Please see "Use of proceeds." There are no agreements or other intentions, either tacit or explicit, regarding the possible early release of any Class A common stock subject to the lock-up provisions.
Notwithstanding the foregoing, if (A) during the last 17 days of the 180-day restricted period, we issue an earnings release or material news or a material event relating to Jones Energy occurs; or (B) prior to the expiration of the 180-day restricted period, we announce that we will release earnings results during the 16-day period beginning on the last day of the 16-day period, the restrictions described above shall continue to apply until the expiration of the 18-day period beginning on the issuance of the earnings release, announcement of the material news or occurrence of the material event.
Certain affiliates of Metalmark Capital, Wells Fargo and each of our directors and executive officers have entered into lock-up agreements with the underwriters prior to the commencement of this offering pursuant to which each of these persons or entities, with limited exceptions, for a period of 180 days after the date of this prospectus, may not, without the prior written consent of J.P. Morgan Securities LLC (1) offer, pledge, announce the intention to sell, sell, contract to sell, sell any option or contract to purchase, purchase any option or contract to sell, grant any option, right or warrant to purchase, or otherwise transfer or dispose of, directly or indirectly, any shares of our Class A common stock or any securities convertible into or exercisable or exchangeable for our Class A common stock (including, without limitation, Class A common stock or such other securities which may be deemed to be beneficially owned by such directors, executive officers, managers, and members in accordance with the rules and regulations of the SEC and securities which may be issued upon exercise of a stock option or warrant) or (2) enter into any swap or other agreement that transfers, in whole or in part, any of the economic consequences of ownership of the Class A common stock or such other securities, whether any such transaction described in clause (1) or (2) above is to be settled by delivery of Class A common stock or such other securities, in cash or otherwise, or (3) make any demand for or exercise any right with respect to the registration of any shares of our Class A common stock or any security convertible into or exercisable or exchangeable for our Class A common stock. In addition, the lock-up agreements will not restrict the transfer of Class A common stock as bona fide gifts, transfer by will or the laws of intestacy, transfers to family members (including to vehicles of which they are beneficial owners), transfers pursuant to domestic relations or court orders, or (in the case of corporations or other entities) transfers to affiliates, in each case so long as the transferee agrees to be bound by the restrictions in the lock-up agreements. Notwithstanding the foregoing, if (A) during the last 17 days of the 180-day restricted period, we issue an earnings release or material news or a material event relating to our company occurs; or (B) prior to the expiration of the 180-day restricted period, we announce that we will release earnings results during the 16-day period beginning on the last day of the 180-day period, the restrictions described above shall continue to apply until the expiration of the 18-day period beginning on the issuance of the earnings release, announcement of the material news or the occurrence of the material event.
We have agreed to indemnify the several underwriters against certain liabilities, including liabilities under the Securities Act.
We have been approved to list our shares of Class A common stock on the New York Stock Exchange under the symbol "JONE," subject to official notice of issuance.
The underwriters have informed us that they do not intend to confirm discretionary accounts without the prior specific written approval of the customer.
161
In connection with this offering, the underwriters may engage in stabilizing transactions, which involves making bids for, purchasing and selling shares of Class A common stock in the open market for the purpose of preventing or retarding a decline in the market price of the Class A common stock while this offering is in progress. These stabilizing transactions may include making short sales of the Class A common stock, which involves the sale by the underwriters of a greater number of shares of Class A common stock than they are required to purchase in this offering, and purchasing shares of Class A common stock on the open market to cover positions created by short sales. Short sales may be "covered" shorts, which are short positions in an amount not greater than the underwriters' option to acquire additional shares of Class A common stock referred to above, or may be "naked" shorts, which are short positions in excess of that amount. The underwriters may close out any covered short position either by exercising their option to acquire additional shares of Class A common stock, in whole or in part, or by purchasing shares in the open market. In making this determination, the underwriters will consider, among other things, the price of shares available for purchase in the open market compared to the price at which the underwriters may purchase shares through the option to acquire additional shares of Class A common stock. A naked short position is more likely to be created if the underwriters are concerned that there may be downward pressure on the price of the Class A common stock in the open market that could adversely affect investors who purchase in this offering. To the extent that the underwriters create a naked short position, they will purchase shares in the open market to cover the position.
The underwriters have advised us that, pursuant to Regulation M of the Securities Act, they may also engage in other activities that stabilize, maintain or otherwise affect the price of the Class A common stock, including the imposition of penalty bids. This means that if the representative of the underwriters purchases Class A common stock in the open market in stabilizing transactions or to cover short sales, the representative can require the underwriters that sold those shares as part of this offering to repay the underwriting discount received by them.
These activities may have the effect of raising or maintaining the market price of the Class A common stock or preventing or retarding a decline in the market price of the Class A common stock, and, as a result, the price of the Class A common stock may be higher than the price that otherwise might exist in the open market. If the underwriters commence these activities, they may discontinue them at any time. The underwriters may carry out these transactions on the New York Stock Exchange, in the over-the-counter market or otherwise.
Prior to this offering, there has been no public market for our Class A common stock. The initial public offering price will be determined by negotiations between us and the representative of the underwriters. In determining the initial public offering price, we and the representative of the underwriters expect to consider a number of factors including:
- •
- the information set forth in this prospectus and otherwise available to the representative;
- •
- our prospects and the history and prospects for the industry in which we compete;
- •
- an assessment of our management;
- •
- our prospects for future earnings;
- •
- the general condition of the securities markets at the time of this offering;
- •
- the recent market prices of, and demand for, publicly traded Class A common stock of generally comparable companies; and
162
- •
- other factors deemed relevant by the underwriters and us.
Neither we nor the underwriters can assure investors that an active trading market will develop for our Class A common stock, or that the shares will trade in the public market at or above the initial public offering price.
Other than in the United States, no action has been taken by us or the underwriters that would permit a public offering of the securities offered by this prospectus in any jurisdiction where action for that purpose is required. The securities offered by this prospectus may not be offered or sold, directly or indirectly, nor may this prospectus or any other offering material or advertisements in connection with the offer and sale of any such securities be distributed or published in any jurisdiction, except under circumstances that will result in compliance with the applicable rules and regulations of that jurisdiction. Persons into whose possession this prospectus comes are advised to inform themselves about and to observe any restrictions relating to the offering and the distribution of this prospectus. This prospectus does not constitute an offer to sell or a solicitation of an offer to buy any securities offered by this prospectus in any jurisdiction in which such an offer or a solicitation is unlawful.
This document is only being distributed to and is only directed at (1) persons who are outside the United Kingdom or (2) to investment professionals falling within Article 19(5) of the Financial Services and Markets Act 2000 (Financial Promotion) Order 2005, which we refer to as the Order, or (3) high net worth entities, and other persons to whom it may lawfully be communicated, falling within Article 49(2)(a) to (d) of the Order, all such persons together we refer to as relevant persons. The securities are only available to, and any invitation, offer or agreement to subscribe, purchase or otherwise acquire such securities will be engaged in only with, relevant persons. Any person who is not a relevant person should not act or rely on this document or any of its contents.
In relation to each Member State of the European Economic Area which has implemented the Prospectus Directive, which we refer to as a Relevant Member State, from and including the date on which the European Union Prospectus Directive, or the EU Prospectus Directive, is implemented in that Relevant Member State, which we refer to this date as the Relevant Implementation Date, an offer of securities described in this prospectus may not be made to the public in that Relevant Member State prior to the publication of a prospectus in relation to the shares which has been approved by the competent authority in that Relevant Member State or, where appropriate, approved in another Relevant Member State and notified to the competent authority in that Relevant Member State, all in accordance with the EU Prospectus Directive, except that it may, with effect from and including the Relevant Implementation Date, make an offer of shares to the public in that Relevant Member State at any time:
- •
- to legal entities which are authorized or regulated to operate in the financial markets or, if not so authorized or
regulated, whose corporate purpose is solely to invest in securities;
- •
- to any legal entity which has two or more of (1) an average of at least 250 employees during the last financial
year; (2) a total balance sheet of more than €43,000,000 and (3) an annual net turnover of more than €50,000,000, as shown in its last annual or
consolidated accounts;
- •
- to fewer than 100 natural or legal persons (other than qualified investors as defined in the EU Prospectus
Directive) subject to obtaining the prior consent of the book-running managers for any such offer; or
- •
- in any other circumstances which do not require the publication by the issuer of a prospectus pursuant to Article 3 of the Prospectus Directive.
163
For the purposes of this provision, the expression an "offer of securities to the public" in relation to any securities in any Relevant Member State means the communication in any form and by any means of sufficient information on the terms of the offer and the securities to be offered so as to enable an investor to decide to purchase or subscribe for the securities, as the same may be varied in that Member State by any measure implementing the EU Prospectus Directive in that Member State and the expression EU Prospectus Directive means Directive 2003/71/EC and includes any relevant implementing measure in each Relevant Member State.
The shares may not be offered or sold by means of any document other than (i) in circumstances which do not constitute an offer to the public within the meaning of the Companies Ordinance (Cap. 32, Laws of Hong Kong), or (ii) to "professional investors" within the meaning of the Securities and Futures Ordinance (Cap. 571, Laws of Hong Kong) and any rules made thereunder, or (iii) in other circumstances which do not result in the document being a "prospectus" within the meaning of the Companies Ordinance (Cap. 32, Laws of Hong Kong), and no advertisement, invitation or document relating to the shares may be issued or may be in the possession of any person for the purpose of issue (in each case whether in Hong Kong or elsewhere), which is directed at, or the contents of which are likely to be accessed or read by, the public in Hong Kong (except if permitted to do so under the laws of Hong Kong) other than with respect to shares which are or are intended to be disposed of only to persons outside Hong Kong or only to "professional investors" within the meaning of the Securities and Futures Ordinance (Cap. 571, Laws of Hong Kong) and any rules made thereunder.
This prospectus has not been registered as a prospectus with the Monetary Authority of Singapore. Accordingly, this prospectus and any other document or material in connection with the offer or sale, or invitation for subscription or purchase, of the shares may not be circulated or distributed, nor may the shares be offered or sold, or be made the subject of an invitation for subscription or purchase, whether directly or indirectly, to persons in Singapore other than (i) to an institutional investor under Section 274 of the Securities and Futures Act, Chapter 289 of Singapore, the SFA, (ii) to a relevant person, or any person pursuant to Section 275(1A), and in accordance with the conditions, specified in Section 275 of the SFA or (iii) otherwise pursuant to, and in accordance with the conditions of, any other applicable provision of the SFA.
Where the shares are subscribed or purchased under Section 275 by a relevant person which is: (a) a corporation (which is not an accredited investor) the sole business of which is to hold investments and the entire share capital of which is owned by one or more individuals, each of whom is an accredited investor; or (b) a trust (where the trustee is not an accredited investor) whose sole purpose is to hold investments and each beneficiary is an accredited investor, shares, debentures and units of shares and debentures of that corporation or the beneficiaries' rights and interest in that trust shall not be transferable for six months after that corporation or that trust has acquired the shares under Section 275 except: (1) to an institutional investor under Section 274 of the SFA or to a relevant person, or any person pursuant to Section 275(1A), and in accordance with the conditions, specified in Section 275 of the SFA; (2) where no consideration is given for the transfer; or (3) by operation of law.
The securities have not been and will not be registered under the Financial Instruments and Exchange Law of Japan (the Financial Instruments and Exchange Law) and each underwriter has agreed that it will not offer or sell any securities, directly or indirectly, in Japan or to, or for the benefit of, any resident of Japan (which term as used herein means any person resident in Japan, including any corporation or other entity organized under the laws of Japan), or to others for re-offering or resale, directly or indirectly, in Japan or to a resident of Japan, except pursuant to an exemption from the registration requirements of, and
164
otherwise in compliance with, the Financial Instruments and Exchange Law and any other applicable laws, regulations and ministerial guidelines of Japan.
The shares may not be publicly offered in Switzerland and will not be listed on the SIX Swiss Exchange, or the SIX or on any other stock exchange or regulated trading facility in Switzerland. This document has been prepared without regard to the disclosure standards for issuance prospectuses under art. 652a or art. 1156 of the Swiss Code of Obligations or the disclosure standards for listing prospectuses under art. 27 ff. of the SIX Listing Rules or the listing rules of any other stock exchange or regulated trading facility in Switzerland. Neither this document nor any other offering or marketing material relating to the shares or the offering may be publicly distributed or otherwise made publicly available in Switzerland.
Neither this document nor any other offering or marketing material relating to the offering, Jones Energy or the shares have been or will be filed with or approved by any Swiss regulatory authority. In particular, this document will not be filed with, and the offer of shares will not be supervised by, the Swiss Financial Market Supervisory Authority FINMA, and the offer of shares has not been and will not be authorized under the Swiss Federal Act on Collective Investment Schemes or the CISA. The investor protection afforded to acquirers of interests in collective investment schemes under the CISA does not extend to acquirers of shares.
This prospectus relates to an Exempt Offer in accordance with the Offered Securities Rules of the Dubai Financial Services Authority or the DFSA. This prospectus is intended for distribution only to persons of a type specified in the Offered Securities Rules of the DFSA. It must not be delivered to, or relied on by, any other person. The DFSA has no responsibility for reviewing or verifying any documents in connection with Exempt Offers. The DFSA has not approved this prospectus nor taken steps to verify the information set forth herein and has no responsibility for the prospectus. The shares to which this prospectus relates may be illiquid and/or subject to restrictions on their resale. Prospective purchasers of the shares offered should conduct their own due diligence on the shares. If you do not understand the contents of this prospectus you should consult an authorized financial advisor.
Conflicts of interest
We intend to use at least five percent of the net proceeds of this offering to repay indebtedness owed by us to certain affiliates of the underwriters who are lenders under our senior secured revolving credit facility. See "Use of proceeds." An affiliate of each of J.P. Morgan Securities LLC, Wells Fargo Securities, LLC, Capital One Southcoast, Inc., Credit Agricole Securities (USA) Inc., Mitsubishi UFJ Securities (USA) Inc. and SunTrust Robinson Humphrey, Inc. are lenders under our senior secured revolving credit facility, and will receive its pro rata portion of the proceeds from this offering used to repay amounts outstanding under our senior secured revolving credit facility. Affiliates of J.P. Morgan Securities LLC, Wells Fargo Securities, LLC, Capital One Southcoast, Inc., Credit Agricole Securities (USA) Inc., Mitsubishi UFJ Securities (USA), Inc. and SunTrust Robinson Humphrey, Inc. will each receive at least 5% of the net proceeds from this offering and, as a result, has a "conflict of interest" within the meaning of FINRA Rule 5121, or Rule 5121. In addition, two of our directors, Howard I. Hoffen and Gregory D. Myers, are employees of Metalmark Capital LLC. All directors and employees of Metalmark Capital LLC are also employees of an affiliate of Citigroup Global Markets Inc., one of the underwriters in this offering, and, in such capacity, manage similar investment funds on behalf of Citigroup and its affiliates. As described on pages 145 and 146, affiliates of Citigroup will, through Metalmark Capital, indirectly own approximately 61.7% of our Class B common stock (44.7% of our combined economic interest and voting power) pursuant to the recapitalization described under "Organizational structure—Recapitalization of JEH LLC" upon the completion of this offering (assuming no exercise of the underwriters' option to purchase additional
165
shares). As a result of the relationship of Messrs. Hoffen and Myers with us and Metalmark Capital and Metalmark Capital's ownership interest in us, Citigroup is deemed to have a "conflict of interest" under Rule 5121. Accordingly, this offering will be made in compliance with the applicable provisions of Rule 5121. Rule 5121 provides that a qualified independent underwriter, or QIU, meeting certain standards must participate in the preparation of the registration statement and the prospectus and exercise the usual standards of due diligence with respect thereto. Barclays has served in that capacity and performed due diligence investigations and reviewed and participated in the preparation of the registration statement of which this prospectus forms a part. We have agreed to indemnify Barclays against certain liabilities incurred in connection with it acting as a QIU for this offering, including liabilities under the Securities Act.
The underwriters and their respective affiliates are full service financial institutions engaged in various activities, which may include securities trading, commercial and investment banking, financial advisory, investment management, investment research, principal investment, hedging, financing and brokerage activities. Certain of the underwriters and their affiliates have provided in the past to us and our affiliates and may provide from time to time in the future certain commercial banking, financial advisory, investment banking and other services for us and such affiliates for which they have received and may continue to receive customary fees and commissions.
Certain of our directors are directors and/or employees of Metalmark Capital LLC. All directors and employees of Metalmark Capital LLC are also employees of an affiliate of Citigroup. Affiliates of Citigroup hold various general and limited partnership interests in certain of the Metalmark Capital entities, and interests in funds owned and controlled by Metalmark Capital LLC, and therefore will indirectly own approximately 61.7% of our Class B common stock (44.7% of our combined economic interest and voting power) pursuant to the recapitalization described under "Organizational structure—Recapitalization of JEH LLC" upon the completion of this offering (assuming no exercise of the underwriters' option to purchase additional shares). Additionally, Wells Fargo Central Pacific Holdings, Inc., an affiliate of Wells Fargo Securities, LLC, will beneficially own approximately 3.5% of our Class B common stock (2.5% of our combined economic interest and voting power) pursuant to the recapitalization described under "Organizational structure—Recapitalization of JEH LLC" upon completion of this offering (assuming no exercise of the underwriters' option to purchase additional shares).
In the ordinary course of their various business activities, the underwriters and their respective affiliates may make or hold a broad array of investments and actively trade debt and equity securities (or related derivative securities) and financial instruments (including bank loans) for their own account and for the accounts of their customers, and such investment and securities activities may involve securities and/or instruments of the issuer. The underwriters and their respective affiliates may also make investment recommendations and/or publish or express independent research views in respect of such securities or instruments and may at any time hold, or recommend to clients that they acquire, long and/or short positions in such securities and instruments.
166
The validity of our Class A common stock offered by this prospectus will be passed upon for us by Baker Botts L.L.P., Austin, Texas. Certain legal matters in connection with this offering will be passed upon for the underwriters by Vinson & Elkins L.L.P., Houston, Texas.
The consolidated financial statements of Jones Energy Holdings, LLC as of December 31, 2012 and 2011 and for each of the three years in the period ended December 31, 2012, included in this prospectus, have been so included in reliance on the report of PricewaterhouseCoopers LLP, an independent registered public accounting firm, given on the authority of said firm as experts in auditing and accounting.
The statement of revenues and direct operating expenses of the oil and gas properties purchased by Jones Energy Holdings, LLC from Chalker Energy Partners III, LLC and participating owners for the period from January 1, 2012 to December 19, 2012, included in this prospectus, has been so included in reliance on the report of PricewaterhouseCoopers LLP, an independent registered public accounting firm, given on the authority of said firm as experts in auditing and accounting.
The balance sheet of Jones Energy, Inc. as of March 29, 2013 included in this prospectus, has been so included in reliance on the report of PricewaterhouseCoopers LLP, an independent registered public accounting firm, given on the authority of said firm as experts in auditing and accounting.
The information included in this prospectus regarding estimated quantities of proved reserves, the future net revenues from those reserves and their present value is based, in part, on estimates of the proved reserves and present values of proved reserves as of December 31, 2010, 2011 and 2012. The reserve estimates are based on reports prepared by Cawley Gillespie & Associates, Inc., independent reserve engineers. These estimates are included in this prospectus in reliance upon the authority of each such firm as an expert in these matters.
Where you can find more information
We have filed with the Securities and Exchange Commission a registration statement on Form S-l with respect to the shares of our Class A common stock offered hereby. This prospectus does not contain all of the information found in the registration statement. For further information regarding us and the Class A common stock offered by this prospectus, you may desire to review the full registration statement, including its exhibits and schedules, filed under the Securities Act. The registration statement of which this prospectus forms a part, including its exhibits and schedules, may be inspected and copied at the public reference room maintained by the SEC at 100 F Street, N.E., Room 1580, Washington, D.C. 20549. Copies of the materials may also be obtained from the SEC at prescribed rates by writing to the public reference room maintained by the SEC at 100 F Street, N.E., Room 1580, Washington, D.C. 20549. You may obtain information on the operation of the public reference room by calling the SEC at 1-800-SEC-0330.
The SEC maintains a web site on the Internet at http://www.sec.gov. Our registration statement, of which this prospectus constitutes a part, can be downloaded from the SEC's web site and can also be inspected and copied at the offices of the New York Stock Exchange, Inc., 20 Broad Street, New York, New York 10005.
167
You should rely only on the information contained in this prospectus or in any free writing prospectus we may authorize to be delivered to you. We have not, and the underwriters have not, authorized any other person to provide you with different information. If anyone provides you with different or inconsistent information, you should not rely on it. We are not, and the underwriters are not, making an offer to sell these securities in any jurisdiction where an offer or sale is not permitted. You should assume that the information appearing in this prospectus is accurate as of the date on the front cover of this prospectus only. Our business, financial condition, results of operations and prospects may have changed since that date.
Upon completion of this offering, we will file with or furnish to the SEC periodic reports and other information. These reports and other information may be inspected and copied at the public reference facilities maintained by the SEC or obtained from the SEC's website as provided above. Our website is located at www.jonesenergy.com and we make our periodic reports and other information filed with or furnished to the SEC available, free of charge, through our website, as soon as reasonably practicable after those reports and other information are electronically filed with or furnished to the SEC. Information on our website or any other website is not incorporated by reference into this prospectus and does not constitute a part of this prospectus.
We intend to furnish or make available to our unitholders annual reports containing our audited financial statements and furnish or make available to our unitholders quarterly reports containing our unaudited interim financial information, including the information required by Form 10-Q, for the first three fiscal quarters of each fiscal year.
168
F-1
Jones Energy, Inc.
Unaudited pro forma condensed consolidated
financial statements
Introduction
The following unaudited pro forma condensed consolidated financial statements of Jones Energy, Inc. as of March 31, 2013, for the year ended December 31, 2012, and for the three-month periods ended March 31, 2012 and March 31, 2013, are derived from the historical financial statements of Jones Energy Holdings, LLC set forth elsewhere in this prospectus and are qualified in their entirety by reference to such historical financial statements and related notes contained therein. These unaudited pro forma condensed consolidated financial statements have been prepared to reflect our formation, initial public offering and related transactions.
These unaudited pro forma condensed consolidated financial statements include the following adjustments: (a) changes to equity and cash accounts as a result of the offering of Class A common stock to the public, the contribution of net offering proceeds to our predecessor in exchange for JEH LLC Units, the issuance of JEH LLC Units to the Existing Owners and an estimate of the effects associated with the Tax Receivable Agreement we will enter into as part of the reorganization (calculated assuming the underwriters exercise their option to purchase additional shares of Class A common stock and there are no future exchanges) (the exchange will be recorded at historical cost as it is considered to be a reorganization of entities under common control), (b) use of the net proceeds from the offering to reduce debt, (c) adjustments associated with the change in tax status to a corporation, and (d) the purchase accounting adjustments in connection with the acquisition of 32 producing oil & gas properties and associated acreage from Chalker Energy Partners III, LLC and others by our predecessor (the "Chalker Acquisition"), which was completed during the fourth quarter of 2012. The Chalker Acquisition was accounted for as a business combination using the acquisition method of accounting. Accordingly, the preliminary purchase price (as adjusted at closing) was allocated to the assets acquired based upon management's preliminary estimates of fair value. The determination of fair value is dependent upon valuations as of the acquisition date and the final adjustments to the purchase price, which when they occur may result in an adjustment to the value of the acquired properties reflected in the pro forma condensed consolidated financial statements. Any such adjustment may be material.
The unaudited pro forma condensed consolidated balance sheet and the unaudited pro forma condensed consolidated statement of operations were derived by adjusting the historical audited financial statements of our predecessor. The adjustments are based upon currently available information and certain estimates and assumptions. Actual effects of the transactions may differ from the pro forma adjustments. Management believes, however, that the assumptions provide a reasonable basis for presenting the significant effects of the transactions as contemplated and that the pro forma adjustments are factually supportable and give appropriate effect to those assumptions and are properly applied in the unaudited pro forma financial data.
The pro forma adjustments have been prepared as if the offering and the related transactions had taken place on March 31, 2013, in the case of the unaudited pro forma condensed consolidated balance sheet, and as if the offering and the related transactions along with the Chalker Acquisition had taken place as of January 1, 2012, in the case of the unaudited pro forma condensed consolidated statements of operations for the year ended December 31, 2012 and for the three-month periods ended March 31, 2012 and March 31, 2013. The unaudited pro forma condensed consolidated financial statements have been prepared
F-2
on the assumption that the Company will be treated as a corporation for federal income tax purposes. The unaudited pro forma condensed consolidated financial statements should be read in conjunction with the notes accompanying such unaudited pro forma financial statements and with the historical audited financial statements and related notes, as well as "Use of proceeds" and "Management's discussion and analysis of financial condition and results of operations," each included elsewhere in this prospectus.
The unaudited pro forma condensed consolidated financial statements give pro forma effect to the following adjustments, among others:
- •
- the issuance of 14,000,000 shares of Class A common stock to the public in this offering;
- •
- the issuance of 36,836,333 shares of Class B common stock to the Existing Owners;
- •
- the adjustments associated with the change in tax status to a corporation;
- •
- the contribution by us of net proceeds of the offering in exchange for JEH LLC Units and the issuance of
JEH LLC Units to the Existing Owners;
- •
- an estimate of the liability associated with the Tax Receivable Agreement we will enter into as part of the reorganization
and the corresponding deferred tax asset (assuming the underwriters exercise their option to purchase additional shares of Class A common stock and there are no future exchanges);
- •
- the repayment by our predecessor of $232.3 million of first-lien debt owed by our predecessor;
- •
- the recognition of a non-controlling interest in JEH LLC held by the Existing Owners;
- •
- the elimination of certain transaction costs related to the Chalker Acquisition;
- •
- changes in depreciation, depletion, and amortization related to the Chalker Acquisition;
- •
- changes in accretion related to the Chalker Acquisition; and
- •
- changes in interest expense resulting from the repayment of a portion of the existing long term debt in connection with this offering.
The unaudited pro forma condensed consolidated financial information presented assumes the underwriters exercise their option to purchase up to an additional 2,100,000 shares of Class A common stock from us and that the shares of Class A common stock to be sold in this offering are sold at $18.00 per share of Class A common stock, which is the midpoint of the price range indicated on the front cover of this prospectus. See "Use of proceeds" to see how certain aspects of the offering would be affected by an initial public offering price per share of Class A common stock at higher or lower prices than indicated on the front cover of this prospectus.
The unaudited pro forma condensed consolidated statement of operations excludes certain transaction costs, such as costs associated with this offering that are not capitalized as part of this offering. The unaudited pro forma condensed consolidated financial data are presented for illustrative purposes only and do not purport to indicate the financial condition or results of operations of future periods or the financial condition or results of operations that actually would have been realized had the Chalker Acquisition been consummated on the dates or for the periods presented.
The unaudited pro forma condensed consolidated financial statements constitute forward-looking information and are subject to certain risks and uncertainties that could cause actual results to differ materially from those anticipated. See "Risk factors" and "Cautionary note regarding forward-looking statements."
F-3
Jones Energy, Inc.
Unaudited pro forma condensed consolidated balance sheet
As of March 31, 2013
| (In thousands) |
Historical Jones Energy Holdings, LLC |
Pro forma adjustments |
Pro forma Jones Energy, Inc. |
|||||||
|---|---|---|---|---|---|---|---|---|---|---|
Assets |
||||||||||
Current assets |
||||||||||
Cash |
$ | 16,804 | $ | — | $ | 16,804 | ||||
Accounts receivable, net |
||||||||||
Oil and gas sales |
40,178 | — | 40,178 | |||||||
Joint interest owners |
20,168 | — | 20,168 | |||||||
Other |
3,195 | — | 3,195 | |||||||
Other current assets |
3,961 | — | 3,961 | |||||||
Commodity derivative assets |
7,834 | — | 7,834 | |||||||
Total current assets |
92,140 | — | 92,140 | |||||||
Oil and gas properties, net, at cost under the successful efforts method |
1,026,272 | — | 1,026,272 | |||||||
Other property, plant and equipment, net |
3,229 | — | 3,229 | |||||||
Commodity derivative assets |
20,782 | — | 20,782 | |||||||
Deferred tax assets |
— | 6,740 | (b) | 6,740 | ||||||
Other assets |
15,389 | — | 15,389 | |||||||
Total assets |
$ | 1,157,812 | $ | 6,740 | $ | 1,164,552 | ||||
Liabilities and Members' / Stockholders' Equity |
||||||||||
Current liabilities |
||||||||||
Trade accounts payable |
$ | 40,849 | $ | — | $ | 40,849 | ||||
Oil and gas sales payable |
55,076 | — | 55,076 | |||||||
Accrued liabilities |
3,886 | — | 3,886 | |||||||
Deferred tax liabilities |
1 | — | 1 | |||||||
Asset retirement obligations |
174 | — | 174 | |||||||
Commodity derivative liabilities |
7,688 | — | 7,688 | |||||||
Total current liabilities |
107,674 | — | 107,674 | |||||||
Tax receivable agreement liability |
— | 5,729 | (b) | 5,729 | ||||||
Long-term debt |
605,000 | (232,250) | (a) | 372,750 | ||||||
Commodity derivative liabilities |
4,904 | — | 4,904 | |||||||
Asset retirement obligations |
9,663 | — | 9,663 | |||||||
Deferred tax liabilities |
1,914 | — | 1,914 | |||||||
Total liabilities |
729,155 | (226,521 | ) | 502,634 | ||||||
Members' / Stockholders' equity |
428,657 | 232,250 | (a) | |||||||
|
1,011 | (b) | ||||||||
|
(404,220 | )(c) | ||||||||
|
428,657 | (170,959 | ) | 257,698 | ||||||
Non-controlling interest |
404,220 | (c) | 404,220 | |||||||
Total members' / stockholders' equity |
428,657 | 233,261 | 661,918 | |||||||
Total liabilities and members' / stockholders' equity |
$ | 1,157,812 | $ | 6,740 | $ | 1,164,552 | ||||
The accompanying notes are an integral part of these unaudited condensed consolidated financial statements.
F-4
Jones Energy, Inc.
Unaudited pro forma condensed
consolidated statement of operations
Year ended December 31, 2012
| (In thousands) |
Historical Jones Energy Holdings, LLC |
Historical Chalker properties |
Pro forma Acquisition adjustments |
Pro forma Jones Energy Holdings, LLC |
Pro forma adjustments |
Pro forma Jones Energy, Inc. |
|||||||||||||
|---|---|---|---|---|---|---|---|---|---|---|---|---|---|---|---|---|---|---|---|
Operating revenues |
|||||||||||||||||||
Oil and gas sales |
$ | 148,967 | $ | 44,871 | $ | — | $ | 193,838 | $ | — | $ | 193,838 | |||||||
Other revenues |
847 | — | — | 847 | — | 847 | |||||||||||||
Total operating revenues |
149,814 | 44,871 | — | 194,685 | — | 194,685 | |||||||||||||
Operating costs and expenses |
|||||||||||||||||||
Lease operating |
23,097 | 1,575 | (a) | — | 24,672 | — | 24,672 | ||||||||||||
Production taxes |
5,583 | 2,330 | — | 7,913 | — | 7,913 | |||||||||||||
Exploration |
356 | — | — | 356 | — | 356 | |||||||||||||
Depletion, depreciation and amortization |
80,709 | — | 12,101 | (b) | 92,810 | — | 92,810 | ||||||||||||
Impairment of oil and gas properties |
18,821 | — | — | 18,821 | — | 18,821 | |||||||||||||
Accretion of discount |
533 | — | 73 | (c) | 606 | — | 606 | ||||||||||||
General and administrative |
15,875 | — | (299 | )(g) | 15,576 | — | 15,576 | ||||||||||||
Total operating expenses |
144,974 | 3,905 | 11,875 | 160,754 | — | 160,754 | |||||||||||||
Operating income (loss) |
4,840 | 40,966 | (11,875 | ) | 33,931 | — | 33,931 | ||||||||||||
Other income (expense) |
|||||||||||||||||||
Interest expense |
(24,714 | ) | — | — | (24,714 | ) | (1,214) | (d) | (25,928 | ) | |||||||||
Net gain on commodity derivatives |
16,684 | — | — | 16,684 | — | 16,684 | |||||||||||||
Gain on sales of assets |
1,162 | — | — | 1,162 | — | 1,162 | |||||||||||||
Other income (expense), net |
(6,868 | ) | — | — | (6,868 | ) | (1,214 | ) | (8,082 | ) | |||||||||
Income (loss) before income tax |
(2,028 | ) | 40,966 | (11,875 | ) | 27,063 | (1,214 | ) | 25,849 | ||||||||||
Income tax provision |
473 | — | — | 473 | 2,508 | (e) | 2,981 | ||||||||||||
Net income (loss) |
$ | (2,501 | ) | $ | 40,966 | $ | (11,875 | ) | $ | 26,590 | $ | (3,722 | ) | $ | 22,868 | ||||
Net income attributable to non-controlling interest |
— | — | — | — | 17,325 | (f) | 17,325 | ||||||||||||
Net income attributable to Jones Energy, Inc. |
— | — | — | — | — | $ | 5,543 | ||||||||||||
Earnings per share |
$ | 0.34 | |||||||||||||||||
The accompanying notes are an integral part of these unaudited condensed consolidated financial statements.
F-5
Jones Energy, Inc.
Unaudited pro forma condensed
consolidated statement of operations
Three month period ended March 31, 2012
| (In thousands) |
Historical Jones Energy Holdings, LLC |
Historical Chalker properties |
Pro forma Acquisition adjustments |
Pro forma Jones Energy Holdings, LLC |
Pro forma adjustments |
Pro forma Jones Energy, Inc. |
|||||||||||||
|---|---|---|---|---|---|---|---|---|---|---|---|---|---|---|---|---|---|---|---|
Operating revenues |
|||||||||||||||||||
Oil and gas sales |
$ | 42,517 | $ | 8,586 | $ | — | $ | 51,103 | $ | — | $ | 51,103 | |||||||
Other revenues |
280 | — | — | 280 | — | 280 | |||||||||||||
Total operating revenues |
42,797 | 8,586 | — | 51,383 | — | 51,383 | |||||||||||||
Operating costs and expenses |
|||||||||||||||||||
Lease operating |
5,528 | 298 | (a) | — | 5,826 | — | 5,826 | ||||||||||||
Production taxes |
1,593 | 466 | — | 2,059 | — | 2,059 | |||||||||||||
Exploration |
74 | — | — | 74 | — | 74 | |||||||||||||
Depletion, depreciation and amortization |
18,773 | — | 2,792 | (b) | 21,565 | — | 21,565 | ||||||||||||
Impairment of oil and gas properties |
18 | — | — | 18 | — | 18 | |||||||||||||
Accretion of discount |
146 | — | 6 | (c) | 152 | — | 152 | ||||||||||||
General and administrative |
3,676 | — | — | 3,676 | — | 3,676 | |||||||||||||
Total operating expenses |
29,808 | 764 | 2,798 | 33,370 | — | 33,370 | |||||||||||||
Operating income (loss) |
12,989 | 7,822 | (2,798 | ) | 18,013 | — | 18,013 | ||||||||||||
Other income (expense) |
|||||||||||||||||||
Interest expense |
(6,601 | ) | — | — | (6,601 | ) | 119 | (d) | (6,482 | ) | |||||||||
Net gain on commodity derivatives |
7,737 | — | — | 7,737 | — | 7,737 | |||||||||||||
Gain on sales of assets |
1,429 | — | — | 1,429 | — | 1,429 | |||||||||||||
Other income (expense), net |
2,565 | — | — | 2,565 | 119 | 2,684 | |||||||||||||
Income (loss) before income tax |
15,554 | 7,822 | (2,798 | ) | 20,578 | 119 | 20,697 | ||||||||||||
Income tax provision |
111 | — | — | 111 | 2,018 | (e) | 2,129 | ||||||||||||
Net income (loss) |
$ | 15,443 | $ | 7,822 | $ | (2,798 | ) | $ | 20,467 | $ | (1,899 | ) | $ | 18,568 | |||||
Net income attributable to non-controlling interest |
— | — | — | — | $ | 14,059 | (f) | $ | 14,059 | ||||||||||
Net income attributable to Jones Energy, Inc. |
— | — | — | — | — | $ | 4,509 | ||||||||||||
Earnings per share |
$ | 0.28 | |||||||||||||||||
The accompanying notes are an integral part of these unaudited condensed consolidated financial statements.
F-6
Jones Energy, Inc.
Unaudited pro forma condensed
consolidated statement of operations
Three month period ended March 31, 2013
| (In thousands) |
Historical Jones Energy Holdings, LLC |
Pro forma adjustments |
Pro forma Jones Energy, Inc. |
|||||||
|---|---|---|---|---|---|---|---|---|---|---|
Operating revenues |
||||||||||
Oil and gas sales |
$ |
55,259 |
$ |
— |
$ |
55,259 |
||||
Other revenues |
221 |
— |
221 |
|||||||
Total operating revenues |
55,480 |
— |
55,480 |
|||||||
Operating costs and expenses |
||||||||||
Lease operating |
5,345 |
— |
5,345 |
|||||||
Production taxes |
2,452 |
— |
2,452 |
|||||||
Exploration |
126 |
— |
126 |
|||||||
Depletion, depreciation and amortization |
25,101 |
— |
25,101 |
|||||||
Impairment of oil and gas properties |
— |
— |
— |
|||||||
Accretion of discount |
97 |
— |
97 |
|||||||
General and administrative |
4,312 |
(109 |
)(g) |
4,203 |
||||||
Total operating expenses |
37,433 |
(109 |
) |
37,324 |
||||||
Operating income (loss) |
18,047 |
109 |
18,156 |
|||||||
Other income (expense) |
||||||||||
Interest expense |
(7,980 |
) |
1,462(d |
) |
(6,518 |
) |
||||
Net gain on commodity derivatives |
(11,383 |
) |
— |
(11,383 |
) |
|||||
Gain on sales of assets |
70 |
— |
70 |
|||||||
Other income (expense), net |
(19,293 |
) |
1,462 |
(17,831 |
) |
|||||
Income (loss) before income tax |
(1,246 |
) |
1,571 |
325 |
||||||
Income tax provision |
(1 |
) |
31 |
(e) |
30 |
|||||
Net income (loss) |
$ |
(1,245 |
) |
$ |
1,540 |
$ |
295 |
|||
Net income attributable to non-controlling interest |
— |
223 |
(f) |
223 |
||||||
Net income attributable to Jones Energy, Inc. |
— |
— |
$ |
72 |
||||||
Earnings per share |
$ |
.004 |
||||||||
The accompanying notes are an integral part of these unaudited condensed consolidated financial statements.
F-7
Notes to unaudited pro forma financial data
1. Basis of presentation, transactions and this offering
The historical financial information is derived from the historical financial statements of our predecessor. The pro forma adjustments have been prepared as if this offering and the related transactions described in this prospectus and the Chalker Acquisition had taken place on March 31, 2013, in the case of the unaudited pro forma condensed consolidated balance sheet, and as if the offering and the related transactions along with the Chalker Acquisition had taken place as of January 1, 2012, in the case of the unaudited pro forma condensed combined statement of operations for the year ended December 31, 2012, and for the three month periods ended March 31, 2013 and March 31, 2012. The adjustments are based on currently available information and certain estimates and assumptions and therefore the actual effects of these transactions will differ from the pro forma adjustments.
2. Unaudited pro forma condensed consolidated balance sheet adjustments and assumptions
The adjustments are based on currently available information and certain estimates and assumptions and therefore the actual effects of these transactions will differ from the pro forma adjustments. A description of these transactions and adjustments is provided as follows:
- (a)
- Represents the net adjustment to cash related to the sources and uses of proceeds of the offering, calculated as follows (in thousands):
Proceeds from the offering |
$ | 252,000 | ||
Long-term debt repayment |
232,250 | |||
Transaction expenses and fees |
19,750 | |||
Pro forma net adjustment to cash |
$ | — | ||
- (b)
- As
part of the reorganization, Jones Energy, Inc. will enter into the Tax Receivable Agreement with JEH LLC and the Existing Owners, pursuant
to which Jones Energy, Inc. will pay to the Existing Owners 85% of the amount of cash savings, if any, in U.S. federal, state and local income tax or franchise tax that it actually realizes (or
is deemed to realize in certain circumstances) in periods after this offering as a result of (i) the tax basis increases resulting from the exchange of JEH LLC Units for shares of
Class A common stock and (ii) imputed interest deemed to be paid by us as a result of, and additional tax basis arising from, any payments we make under the Tax Receivable Agreement. The
unaudited pro forma condensed consolidated balance sheet as of March 31, 2013 reflects adjustments to recognize (i) a deferred tax asset totaling $6.7 million, (ii) a
liability totaling $5.7 million, based on our estimate of the aggregate amount that we would pay to the Existing Owners under the Tax Receivable Agreement, and (iii) an adjustment to
stockholders' equity totaling $1.0 million, respectively, if the underwriters exercise their option to purchase additional shares of Class A common stock in full, and Metalmark and
Wells Fargo exchange an aggregate of 2,100,000 JEH LLC Units for cash in connection with this offering.
Other than any exchanges of JEH LLC Units by Metalmark and Wells Fargo in connection with any exercise by the underwriters of their option to purchase additional shares of Class A common stock, no exchanges of JEH LLC Units are contemplated nor permitted for a period of 180 days subsequent to this offering (unless a waiver of the lock-up provisions applicable to an Existing Owner is approved by J.P. Morgan Securities LLC). If no JEH LLC Units are exchanged for Class A common stock in connection
F-8
with this offering, the adjustments to the deferred tax asset, noncurrent tax receivable agreement liability, and stockholders' equity each would be $0. If all JEH LLC Units were exchanged in connection with this offering (which would require a waiver of the lock-up provisions with respect to the Existing Owners) and the Tax Receivable Agreement were terminated immediately after this offering, the estimated deferred tax asset, noncurrent tax receivable agreement liability, and stockholders' equity would be approximately $368.5 million, $313.2 million, and $55.3 million, respectively. (The estimated termination payment would be approximately $202.0 million discounted at the London Interbank offering rate, plus 100 basis points.)
The foregoing amounts are merely estimates based on the assumptions set forth above. The actual amount and timing of any payments under the Tax Receivable Agreement will vary depending upon a number of factors, including the timing of the exchanges of JEH LLC Units, the price of Class A common stock at the time of each exchange, the extent to which such exchanges are taxable, the amount and timing of the taxable income we generate in the future and the tax rate then applicable, and the portion of our payments under the Tax Receivable Agreement constituting imputed interest or depletable, depreciable or amortizable basis. Thus, it is likely that future transactions or events could increase or decrease the actual tax benefits realized and the corresponding Tax Receivable Agreement payments as compared to the estimates set forth above.
Further, it is important to note that the foregoing estimated amounts were not prepared in accordance with GAAP. The actual liability that will be reflected on the balance sheet of Jones Energy, Inc. will be determined at the time of an exchange, and will be determined based on a number of factors, including the items described above. The estimates reflected herein are provided for illustrative purposes only.
- (c)
- Reflects the execution of the offering and the transactions related therto, pursuant to which Jones Energy, Inc. will contribute $232.3 million (based on the midpoint of the range set forth on the cover page of this prospectus, net of underwriter discounts) to JEH LLC in exchange for 14,000,000 JEH LLC Units. In addition, these unaudited pro forma condensed consolidated financial statements assume the underwriters exercise their option to purchase an additional 2,100,000 shares of Class A common stock from the Existing Owners. As a result of this agreement and contribution, (i) Jones Energy, Inc. will become the sole managing member of JEH LLC and obtain control of JEH LLC, resulting in consolidation of JEH LLC by Jones Energy, Inc. and (ii) the Existing Owners will hold a non-controlling interest comprised of 36,836,333 JEH LLC Units and 34,736,333 shares of Class B common stock of Jones Energy, Inc. The transfer of JEH LLC Units to Jones Energy, Inc. will be a transfer of assets between entities under common control and will not result in any adjustments to the historical financial reporting carrying amounts of assets and liabilities held by JEH LLC. Based on such carrying amounts, together with the effects of other pro forma adjustments to such carrying amounts described herein, the carrying amount of JEH LLC's net assets in an exchange as of March 31, 2013, would have been $428.7 million, and the Existing Owners' share of such net assets would have been $428.7 million. The unaudited pro forma condensed consolidated balance sheet as of March 31, 2013 includes adjustments to (i) reflect the $232.3 million contribution with a corresponding charge to shareholders' equity, representing the consideration received from Jones Energy, Inc. for the controlling interest in JEH LLC, and (ii) reflect the Existing Owners' $404.2 million non-controlling interest in JEH LLC with a corresponding charge to shareholders' equity, representing the Existing Owners' share of the carrying amount of JEH LLC's net assets.
F-9
3. Unaudited pro forma condensed consolidated statements of operations adjustments and assumptions
The adjustments are based on currently available information and certain estimates and assumptions and therefore the actual effects of these transactions will differ from the pro forma adjustments. A description of these transactions and adjustments is provided as follows:
- (a)
- Lease
operating expenses represent approximately 3.5% of oil and gas sales for the properties acquired in the Chalker acquisition as compared to
approximately 15.5% for historical Jones Energy Holdings, LLC properties. The difference is due to the fact that the wells acquired in the Chalker acquisition, most of which were drilled in
2011 and 2012, did not have significant workover expenses. Additionally, the Chalker properties are significantly more oil-rich than the JEH LLC properties, and therefore generate a
higher average revenue per well (and correspondingly lower lease operating expenses as a percentage thereof). The Company expects lease operating expenses as a percentage of oil and gas sales for the
Chalker properties to increase in the future as workover expenses increase over the life of the wells.
- (b)
- Reflects the estimated pro forma adjustment to depreciation, depletion and amortization due to the fair value adjustments to the property, plant and equipment acquired in the Chalker Acquisition (in thousands, except volume and rate):
| |
Year Ended December 31, 2012 |
Three Months ended March 31, 2012 |
|||||
|---|---|---|---|---|---|---|---|
Historical production volume (Mcfe) |
34,106 | 8,216 | |||||
Pro forma depreciation, depletion and amortization rate per Mcfe |
$ | 2.70 | $ | 2.60 | |||
Total pro forma depreciation, depletion and amortization of oil and gas properties |
92,008 | 21,402 | |||||
Less: Historical depreciation, depletion and amortization of oil and gas properties |
(79,907 | ) | (18,610 | ) | |||
Pro forma net adjustment to depreciation, depletion and amortization |
$ | 12,101 | $ | 2,792 | |||
- (c)
- Reflects the estimated pro forma adjustment to accretion expense due to the fair value adjustment to the asset retirement obligation (ARO) assumed in the Chalker Acquisition (in thousands):
| |
Year Ended December 31, 2012 |
Three Months ended March 31, 2012 |
|||||
|---|---|---|---|---|---|---|---|
Pro forma accretion of asset retirement obligation |
$ | 606 | $ | 152 | |||
Less: Historical accretion of ARO |
(533 | ) | (146 | ) | |||
Pro forma adjustment to accretion of ARO |
$ | 73 | $ | 6 | |||
F-10
- (d)
- Reflects the pro forma adjustment to interest expense, assuming no capitalized interest, resulting from the repayment of a portion of our long-term debt pursuant to the completion of this offering (in thousands):
| |
Year Ended December 31, 2012 |
Three Months ended March 31, 2012 |
Three Months ended March 31, 2013 |
|||||||
|---|---|---|---|---|---|---|---|---|---|---|
Interest on Revolving Facility |
$ | 6,807 | $ | 1,702 | $ | 1,702 | ||||
Interest on Second Lien Term Loan |
14,800 | 3,700 | 3,700 | |||||||
Commitment fees |
1,385 | 346 | 346 | |||||||
Pro forma interest expense |
22,992 | 5,748 | 5,748 | |||||||
Amortization of capitalized debt issuance costs |
2,936 | 734 | 770 | |||||||
Total pro forma interest expense |
25,928 | 6,482 | 6,518 | |||||||
Less: historical interest expense |
(24,714 | ) | (6,601 | ) | (7,980 | ) | ||||
Pro forma adjustment to interest expense |
$ | 1,214 | $ | (119 | ) | $ | (1,462 | ) | ||
A 0.125% change in interest rates would impact interest expense by $466 for the year ended December 31, 2012.
- (e)
- Reflects the net adjustment to income tax (provision) benefit, calculated as follows (in thousands):
| |
Year Ended December 31, 2012 |
Three Months ended March 31, 2012 |
Three Months ended March 31, 2013 |
|||||||
|---|---|---|---|---|---|---|---|---|---|---|
Tax impact of pro forma adjustments (i) |
$ | (18 | ) | $ | (4 | ) | $ | 0 | ||
Tax impact of conversion to C corporation (ii) |
2,526 | 2,022 | 31 | |||||||
Net pro forma adjustment to income tax provision |
$ | 2,508 | $ | 2,018 | $ | 31 | ||||
- (i)
- Adjustment
for the tax impact of the above noted pro forma adjustments.
- (ii)
- Adjustment
related to the reorganization transactions described in "Organizational structure—Reorganization transactions", whereby we will
become a tax paying corporation.
- (f)
- Reflects
the effect of the elimination of the Existing Owners' interest in JEH LLC as a result of an assumed offering of the shares covered by this
registration statement and the exercise by the underwriters of their option to purchase additional shares.
- (g)
- Reflects the effect of the elimination of transaction costs related to the acquisition of the Chalker Properties.
F-11
Report of Independent Registered Public Accounting Firm
To the Board of Directors and Members of Jones Energy Holdings, LLC:
In our opinion, the accompanying consolidated balance sheets and the related consolidated statements of operations, changes in members' equity and cash flows present fairly, in all material respects, the financial position of Jones Energy Holdings, LLC and its subsidiaries at December 31, 2012 and 2011, and the results of their operations and their cash flows for each of the three years in the period ended December 31, 2012 in conformity with accounting principles generally accepted in the United States of America. These financial statements are the responsibility of the Company's management. Our responsibility is to express an opinion on these financial statements based on our audits. We conducted our audits of these statements in accordance with the standards of the Public Company Accounting Oversight Board (United States). Those standards require that we plan and perform the audit to obtain reasonable assurance about whether the financial statements are free of material misstatement. An audit includes examining, on a test basis, evidence supporting the amounts and disclosures in the financial statements, assessing the accounting principles used and significant estimates made by management, and evaluating the overall financial statement presentation. We believe that our audits provide a reasonable basis for our opinion.
/s/ PricewaterhouseCoopers LLP
Houston,
Texas
March 19, 2013
F-12
Jones Energy Holdings, LLC and Subsidiaries
(A Delaware limited liability company)
Consolidated balance sheets
December 31, 2011 and 2012
| (in thousands of dollars) |
2011 |
2012 |
|||||
|---|---|---|---|---|---|---|---|
Assets |
|||||||
Current assets |
|||||||
Cash |
$ | 6,136 | $ | 23,726 | |||
Accounts receivable, net |
|||||||
Oil and gas sales |
31,290 | 29,684 | |||||
Joint interest owners |
35,003 | 21,876 | |||||
Other |
2,104 | 4,590 | |||||
Other current assets |
1,593 | 1,088 | |||||
Commodity derivative assets |
18,556 | 17,648 | |||||
Total current assets |
94,682 | 98,612 | |||||
Oil and gas properties, net, at cost under the successful efforts method |
740,385 | 1,007,344 | |||||
Other property, plant and equipment, net |
3,190 | 3,398 | |||||
Commodity derivative assets |
31,025 | 25,199 | |||||
Other assets |
11,853 | 16,133 | |||||
Total assets |
$ | 881,135 | $ | 1,150,686 | |||
Liabilities and members' equity |
|||||||
Current liabilities |
|||||||
Trade accounts payable |
$ | 43,048 | $ | 38,036 | |||
Oil and gas sales payable |
54,285 | 45,860 | |||||
Accrued liabilities |
5,735 | 3,873 | |||||
Deferred tax liabilities |
54 | 61 | |||||
Asset retirement obligations |
— | 174 | |||||
Commodity derivative liabilities |
4,567 | 4,035 | |||||
Total current liabilities |
107,689 | 92,039 | |||||
Long-term debt |
415,000 | 610,000 | |||||
Commodity derivative liabilities |
760 | 7,657 | |||||
Asset retirement obligations |
9,563 | 9,332 | |||||
Deferred tax liabilities |
1,410 | 1,876 | |||||
Total liabilities |
534,422 | 720,904 | |||||
Commitments and contingencies (Note 7) |
|||||||
Members' equity |
|||||||
Class A preferred units; 14,250,000 authorized and issued |
233,835 | 205,970 | |||||
Class B preferred units; 1,500,000 authorized and issued |
24,614 | 21,681 | |||||
Class C preferred units; 8,500,000 authorized and issued |
— | 122,860 | |||||
Common units; 4,500,000 authorized and issued |
73,843 | 65,043 | |||||
Management units; 3,194,444 authorized and issued |
14,421 | 14,228 | |||||
Total members' equity |
346,713 | 429,782 | |||||
Total liabilities and members' equity |
$ | 881,135 | $ | 1,150,686 | |||
The accompanying notes are an integral part of these consolidated financial statements.
F-13
Jones Energy Holdings, LLC and Subsidiaries
(A Delaware limited liability company)
Consolidated statements of operations
Years ended December 31, 2010, 2011 and 2012
| (in thousands of dollars) |
2010 |
2011 |
2012 |
|||||||
|---|---|---|---|---|---|---|---|---|---|---|
Operating revenues |
||||||||||
Oil and gas sales |
$ | 97,523 | $ | 167,261 | $ | 148,967 | ||||
Other revenues |
933 | 1,022 | 847 | |||||||
Total operating revenues |
98,456 | 168,283 | 149,814 | |||||||
Operating costs and expenses |
||||||||||
Lease operating |
16,296 | 21,548 | 23,097 | |||||||
Production taxes |
2,206 | 5,333 | 5,583 | |||||||
Exploration |
4,208 | 780 | 356 | |||||||
Depletion, depreciation and amortization |
48,008 | 68,906 | 80,709 | |||||||
Impairment of oil and gas properties |
10,727 | 31,970 | 18,821 | |||||||
Accretion of discount |
490 | 413 | 533 | |||||||
General and administrative |
11,423 | 16,679 | 15,875 | |||||||
Total operating expenses |
93,358 | 145,629 | 144,974 | |||||||
Operating income |
5,098 | 22,654 | 4,840 | |||||||
Other income (expense) |
||||||||||
Interest expense |
(12,575 | ) | (21,190 | ) | (24,714 | ) | ||||
Net gain on commodity derivatives |
23,758 | 34,490 | 16,684 | |||||||
Gain on bargain purchase |
— | 26,208 | — | |||||||
Gain (loss) on sales of assets |
8,644 | (859 | ) | 1,162 | ||||||
Other income (expense), net |
19,827 | 38,649 | (6,868 | ) | ||||||
Income (loss) before income tax |
24,925 | 61,303 | (2,028 | ) | ||||||
Income tax provision |
145 | 173 | 473 | |||||||
Net income (loss) |
$ | 24,780 | $ | 61,130 | $ | (2,501 | ) | |||
The accompanying notes are an integral part of these consolidated financial statements.
F-14
Jones Energy Holdings, LLC and Subsidiaries
(A Delaware limited liability company)
Statements of changes in members' equity
Years ended December 31, 2010, 2011 and 2012
| |
Preferred units | |
|
|
|
|
||||||||||||||||||||||||||||
|---|---|---|---|---|---|---|---|---|---|---|---|---|---|---|---|---|---|---|---|---|---|---|---|---|---|---|---|---|---|---|---|---|---|---|
| |
Class A | Class B | Class C | Common units | Management units | Total Members' Equity |
||||||||||||||||||||||||||||
| (amounts in thousands) |
Units |
Value |
Units |
Value |
Units |
Value |
Units |
Value |
Units |
Value |
||||||||||||||||||||||||
Balance at December 31, 2009 |
14,250 | $ | 182,730 | 1,500 | $ | 19,235 | — | $ | — | 4,500 | $ | 57,704 | — | $ | — | $ | 259,669 | |||||||||||||||||
Net income |
— | 17,438 | — | 1,835 | — | — | — | 5,507 | — | — | 24,780 | |||||||||||||||||||||||
Balance at December 31, 2010 |
14,250 | $ | 200,168 | 1,500 | $ | 21,070 | — | $ | — | 4,500 | $ | 63,211 | — | $ | — | $ | 284,449 | |||||||||||||||||
Issuance of management units |
— | — | — | — | — | — | — | — | 2,250 | — | — | |||||||||||||||||||||||
Stock-compensation expense |
— | 718 | — | 76 | — | — | — | 227 | — | 113 | 1,134 | |||||||||||||||||||||||
Net income |
— | 32,949 | — | 3,468 | — | — | — | 10,405 | — | 14,308 | 61,130 | |||||||||||||||||||||||
Balance at December 31, 2011 |
14,250 | $ | 233,835 | 1,500 | $ | 24,614 | — | $ | — | 4,500 | $ | 73,843 | 2,250 | $ | 14,421 | $ | 346,713 | |||||||||||||||||
Issuance of Class C preferred units |
— | — | — | — | 8,500 | 85,000 | — | — | — | — | 85,000 | |||||||||||||||||||||||
Issuance of management units |
— | — | — | — | — | — | — | — | 944 | — | — | |||||||||||||||||||||||
Stock-compensation expense |
— | 254 | — | 27 | — | 152 | — | 80 | — | 57 | 570 | |||||||||||||||||||||||
Net income (loss) |
— | (28,119 | ) | — | (2,960 | ) | — | 37,708 | — | (8,880 | ) | — | (250 | ) | (2,501 | ) | ||||||||||||||||||
Balance at December 31, 2012 |
14,250 | $ | 205,970 | 1,500 | $ | 21,681 | 8,500 | $ | 122,860 | 4,500 | $ | 65,043 | 3,194 | $ | 14,228 | $ | 429,782 | |||||||||||||||||
The accompanying notes are an integral part of these consolidated financial statements.
F-15
Jones Energy Holdings, LLC and Subsidiaries
(A Delaware limited liability company)
Consolidated statements of cash flows
Years ended December 31, 2010, 2011 and 2012
| (in thousands of dollars) |
2010 |
2011 |
2012 |
|||||||
|---|---|---|---|---|---|---|---|---|---|---|
Cash flows from operating activities |
||||||||||
Net income (loss) |
$ | 24,780 | $ | 61,130 | $ | (2,501 | ) | |||
Adjustments to reconcile net income to net cash provided by operating activities |
||||||||||
Exploration expense |
3,429 | 478 | — | |||||||
Depletion, depreciation, and amortization |
48,008 | 68,906 | 80,709 | |||||||
Impairment of oil and gas properties |
10,727 | 31,970 | 18,821 | |||||||
Accretion of discount |
490 | 413 | 533 | |||||||
Amortization of debt issuance costs |
1,965 | 2,940 | 3,544 | |||||||
Stock compensation expense |
— | 1,134 | 570 | |||||||
Gain on bargain purchase price |
— | (26,208 | ) | — | ||||||
Gain on commodity derivatives |
(23,758 | ) | (34,490 | ) | (16,684 | ) | ||||
(Gain) loss on sales of assets |
(8,644 | ) | 859 | (1,162 | ) | |||||
Deferred income tax provision |
145 | 173 | 473 | |||||||
Other—net |
390 | (59 | ) | 129 | ||||||
Changes in assets and liabilities |
||||||||||
Accounts receivable |
(27,281 | ) | (32,593 | ) | 11,568 | |||||
Other assets |
(1,897 | ) | (3,360 | ) | 1,873 | |||||
Accounts payable and accrued liabilities |
16,270 | 48,924 | (13,323 | ) | ||||||
Net cash provided by operations |
44,624 | 120,217 | 84,550 | |||||||
Cash flows from investing activities |
||||||||||
Additions to oil and gas properties |
(104,518 | ) | (157,046 | ) | (125,493 | ) | ||||
Acquisition of properties |
(32,597 | ) | (168,480 | ) | (249,007 | ) | ||||
Proceeds from sales of assets |
41,071 | 6,747 | 9,158 | |||||||
Acquisition of other property, plant and equipment |
(591 | ) | (1,735 | ) | (969 | ) | ||||
Current period settlements of matured derivative contracts |
5,850 | 1,551 | 28,675 | |||||||
Net cash used in investing |
(90,785 | ) | (318,963 | ) | (337,636 | ) | ||||
Cash flows from financing activities |
||||||||||
Proceeds from issuance of long-term debt |
118,000 | 316,500 | 233,243 | |||||||
Repayment under long-term debt |
(68,000 | ) | (126,500 | ) | (38,243 | ) | ||||
Issuance of preferred units |
— | — | 85,000 | |||||||
Payment of debt issuance costs |
(800 | ) | (3,678 | ) | (9,324 | ) | ||||
Net cash provided by financing |
49,200 | 186,322 | 270,676 | |||||||
Net increase (decrease) in cash |
3,039 | (12,424 | ) | 17,590 | ||||||
Cash |
||||||||||
Beginning of year |
15,521 | 18,560 | 6,136 | |||||||
End of year |
$ | 18,560 | $ | 6,136 | $ | 23,726 | ||||
Supplemental disclosure of cash flow information |
||||||||||
Cash paid for interest |
$ | 10,334 | $ | 18,151 | $ | 20,759 | ||||
Cash paid for income taxes |
344 | — | — | |||||||
Noncash oil and gas property additions |
22,362 | 26,774 | 3,355 | |||||||
Noncash acquisition of oil and gas properties |
— | — | 2,918 | |||||||
Current additions to ARO |
731 | 4,077 | 662 | |||||||
The accompanying notes are an integral part of these consolidated financial statements.
F-16
Jones Energy Holdings, LLC and Subsidiaries
(A Delaware limited liability company)
Notes to consolidated financial statements
December 31, 2010, 2011 and 2012
1. Organization and description of business
Jones Energy Holdings, LLC (the "Company") was organized December 16, 2009 as a Delaware limited liability company and began operations effective December 31, 2009. On December 31, 2009, a series of transactions was undertaken by the Company as follows:
- •
- The owners of Nosley Properties, LLC ("Nosley") and Jones Energy, Ltd. ("JEL") contributed
all their ownership interests in Nosley and JEL for Common Units plus $15.0 million for Preferred Class B Units
- •
- Metalmark Capital contributed $135.0 million for Preferred Class A Units
- •
- Wells Fargo Central Pacific Holdings, Inc. contributed $7.5 million for Preferred Class A Units
In addition to these capital contributions, the Company borrowed $175.0 million from Wells Fargo Bank, N.A., used partially to repay the debt of Nosley and JEL. The Company used the cash contributions and the balance of the Wells Fargo debt funding to acquire 100% of the equity interest of Crusader Energy Group, Inc., out of bankruptcy. The previous owners of Nosley and JEL hold two board of director seats and Metalmark Capital holds two board of director seats; however, Metalmark Capital holds the majority equity interest, which gives it effective control of the Company.
On December 20, 2012 the owners of Class A Preferred, Class B Preferred and Common Units contributed $56.7 million, $25.2 million and $3.1 million, respectively, for Preferred Class C Units. The Company used the capital contributions, along with $170 million borrowed from Wells Fargo Bank, N.A., to fund the acquisition of certain oil and gas properties in the Texas Panhandle (see Note 3, "Acquisition of Properties").
The Company is engaged in the acquisition, exploration, and production of oil and natural gas properties in the mid-continent U.S. through undivided ownership interests or through its wholly owned subsidiaries. The Company is headquartered in Austin, Texas.
2. Significant accounting policies
Basis of presentation
The accompanying financial statements have been prepared in accordance with accounting principles generally accepted in the United States of America (GAAP). All significant intercompany transactions and balances have been eliminated in consolidation. The financial statements reported for December 31, 2012, 2011 and 2010, and the years then ended include the Company and all of its subsidiaries.
Segment information
The Company operates in one industry segment, which is the exploration, development and production of oil and natural gas, and all of its operations are conducted in one geographic area of the United States.
F-17
Use of estimates
In preparing the accompanying financial statements, management has made certain estimates and assumptions that affect the reported amounts of assets and liabilities, disclosure of contingent liabilities, and the reported amounts of revenue and expenses during the reporting period. Actual results could differ from these estimates. Changes in estimates are recorded prospectively.
Significant assumptions are required in the valuation of proved oil and natural gas reserves, which affect the Company's estimates of depletion expense, impairment, and the allocation of value in our business combinations. Significant assumptions are also required in the Company's estimates of the unrealized gain or loss on commodity derivative assets and liabilities and asset retirement obligations (ARO).
Financial instruments
Cash, accounts receivable and accounts payable are recorded at cost. The fair value of accounts receivable and accounts payable are not materially different from their carrying amounts because of the short-term nature of these instruments. The carrying values of outstanding balances under the Company's credit agreements represent fair value because the agreements have variable interest rates, which are reflective of the Company's credit risk. Derivative instruments are recorded at fair value, as discussed below.
Cash
Cash and cash equivalents include highly liquid investments with a maturity of three months of less. At times, the amount of cash on deposit in financial institutions exceeds federally insured limits. Management monitors the soundness of the financial institutions and believes the Company's risk is negligible.
Accounts receivable
Accounts receivable—Oil and gas sales consist of uncollateralized accrued revenues due under normal trade terms, generally requiring payment within 30 to 60 days of production. Accounts receivable—Joint interest owners consist of uncollateralized joint interest owner obligations due within 30 days of the invoice date. Accounts receivable—Other consist primarily of severance tax refunds due from state agencies and realized gains on commodity derivatives, typically due within 30 to 60 days of settlement. No interest is charged on past-due balances. The Company routinely assesses the recoverability of all material trade, joint interest and other receivables to determine their collectability, and reduces the carrying amounts by a valuation allowance that reflects management's best estimate of the amounts that may not be collected. As of December 31, 2012, 2011 and 2010, the Company did not have significant allowances for doubtful accounts.
Concentration of risk
Substantially all of the Company's accounts receivable are related to the oil and gas industry. This concentration of entities may affect the Company's overall credit risk in that these entities may similarly be affected by changes in economic and other conditions. As of December 31, 2012, 92% of Accounts receivable—Oil and gas sales are due from 8 purchasers and 72% of Accounts receivable—Joint interest owners are due from 5 working interest owners. As of December 31, 2011, 94% of Accounts receivable—Oil and gas sales are due from 8 purchasers, and 71% of 2011 Accounts receivable—Joint interest owners are due from 5 working interest owners. If any or all of these significant counterparties were to fail to pay amounts due to the Company, the Company's financial position and results of operations could be materially and adversely affected.
F-18
Dependence on major customers
The Company maintains a portfolio of crude oil and natural gas marketing contracts with large, established refiners and utilities. During the year ended December 31, 2012, the largest purchasers were Unimark LLC, Mercuria, PVR Midstream, and Plains Marketing, which accounted for approximately 24%, 18%, 18% and 15% of consolidated oil and gas sales, respectively. During the year ended December 31, 2011, the largest purchasers were Plains Marketing, PVR Midstream, Unimark LLC, and Valero Marketing, which accounted for approximately 27%, 22%, 13% and 9% of consolidated oil and gas sales, respectively. During the year ended December 31, 2010, the largest purchasers were Plains Marketing, PVR Midstream, Valero Marketing, and DCP Midstream, which accounted for approximately 21%, 26%, 13% and 10% of consolidated oil and gas sales, respectively.
Management believes that there are potential alternative purchasers and that it may be necessary to establish relationships with new purchasers. However, there can be no assurance that the Company can establish such relationships and that those relationships will result in an increased number of purchasers. Although the Company is exposed to a concentration of credit risk, management believes that all of the Company's purchasers are credit worthy.
Dependence on suppliers
The Company's industry is cyclical, and from time to time, there is a shortage of drilling rigs, equipment, services, supplies and qualified personnel. During these periods, the costs and delivery times of rigs, equipment, services and supplies are substantially greater. If the unavailability or high cost of drilling rigs, equipment, services, supplies or qualified personnel were particularly severe in the areas of operation, the Company could be materially and adversely affected. Management believes that there are potential alternative providers of drilling and completion services and that it may be necessary to establish relationships with new contractors. However, there can be no assurance that the Company can establish such relationships and that those relationships will result in increased availability of drilling rigs or other services, or that they could be obtained on the same terms.
Oil and gas properties
The Company accounts for its oil and natural gas exploration and production activities under the successful efforts method of accounting. Oil and gas properties consisted of the following at December 31, 2012 and 2011:
| (in thousands of dollars) |
2011 |
2012 |
|||||
|---|---|---|---|---|---|---|---|
Mineral interests in properties |
|||||||
Unproved |
$ | 81,490 | $ | 137,254 | |||
Proved |
557,703 | 754,657 | |||||
Wells and equipment and related facilities |
259,659 | 372,628 | |||||
|
898,852 | 1,264,539 | |||||
Less: Accumulated depletion and impairment |
(158,467 | ) | (257,195 | ) | |||
Net oil and gas properties |
$ | 740,385 | $ | 1,007,344 | |||
F-19
Costs to acquire mineral interests in oil and natural gas properties are capitalized. Costs to drill and equip development wells and the related asset retirement costs are capitalized. The costs to drill and equip exploratory wells are capitalized pending determination of whether the Company has discovered proved commercial reserves. If proved commercial reserves are not discovered, such drilling costs are charged to expense. In some circumstances, it may be uncertain whether proved commercial reserves have been found when drilling has been completed. Such exploratory well drilling costs may continue to be capitalized if the anticipated reserve quantity is sufficient to justify its completion as a producing well and sufficient progress in assessing the reserves and the economic and operating viability of the project is being made. As of December 31, 2012 and 2011, there were no costs capitalized in connection with exploratory wells in progress.
The Company capitalizes interest on expenditures for significant exploration and development projects that last more than six months while activities are in progress to bring the assets to their intended use. Through December 31, 2012 the Company capitalized $0.1 million in interest. The Company did not capitalize any interest in 2011 as no projects lasted more than six months. Costs incurred to maintain wells and related equipment are charged to expense as incurred.
On the sale or retirement of a proved field, the cost and related accumulated depletion, depreciation and amortization are eliminated from the field accounts, and the resultant gain or loss is recognized.
Capitalized amounts attributable to proved oil and gas properties are depleted by the unit-of-production method over proved reserves, using the unit conversion ratio of six thousand cubic feet of gas to one barrel of oil equivalent. Depletion of the costs of wells and related equipment and facilities, including capitalized asset retirement costs, net of salvage values, is computed using proved developed reserves. The reserve base used to calculate depreciation, depletion, and amortization for leasehold acquisition costs and the cost to acquire proved properties is the sum of proved developed reserves and proved undeveloped reserves. Depletion of oil and gas properties amounted to $79.9 million, $68.1 million and $47.6 million for the years ended December 31, 2012, 2011 and 2010, respectively.
The Company reviews its proved oil and natural gas properties, including related wells and equipment, for impairment by comparing expected undiscounted future cash flows at a producing field level to the net capitalized cost of the asset. If the future undiscounted cash flows, based on the Company's estimate of future commodity prices, operating costs, and production, are lower than the net capitalized cost, the capitalized cost is reduced to fair value. Fair value is calculated by discounting the future cash flows at an appropriate risk-adjusted discount rate. The Company incurred $18.8 million and $19.8 million impairment charges related to its proved oil and natural gas properties and wells and equipment in 2012 and 2011, respectively, due to production declines in minor fields. The Company incurred a $10.7 million impairment charge related to its proved oil and natural gas properties in 2010, due to underperformance experienced at several new exploratory wells drilled during 2010.
The Company evaluates its unproved properties for impairment on a property-by-property basis. The Company's unproved property consists of acquisition costs related to its undeveloped acreage. The Company reviews the unproved property for indicators of impairment based on the Company's current exploration plans with consideration given to results of any drilling and seismic activity during the period and known information regarding exploration activity by other companies on adjacent blocks. The Company incurred no impairment charges related to its unproved properties in 2012. The Company incurred a $12.2 million impairment charge related to its unproven properties in 2011, principally in those fields which are not expected to produce natural gas with a sufficiently high liquid content. In the current framework of relatively low natural gas prices, the lack of natural gas liquids reduces the economic return of those
F-20
fields. As a result, the Company has no current plans to continue development of those fields. The Company incurred no impairment charges related to its unproved properties in 2010.
On the sale of an entire interest in an unproved property for cash, gain or loss on the sale is recognized, taking into consideration the amount of any recorded impairment if the property had been assessed individually. If a partial interest in an unproved property is sold, the amount received is treated as a reduction of the cost of the interest retained.
Other property, plant and equipment
Other property, plant and equipment consisted of the following at December 31, 2012 and 2011:
| (in thousands of dollars) |
2011 |
2012 |
|||||
|---|---|---|---|---|---|---|---|
Leasehold improvements |
$ | 954 | $ | 983 | |||
Furniture, fixtures, computers and software |
1,514 | 2,204 | |||||
Vehicles |
498 | 719 | |||||
Aircraft |
1,295 | 1,295 | |||||
Land |
62 | 62 | |||||
Production equipment |
— | 72 | |||||
|
4,323 | 5,335 | |||||
Less: Accumulated depreciation and amortization |
(1,133 | ) | (1,937 | ) | |||
Net other property, plant and equipment |
$ | 3,190 | $ | 3,398 | |||
Other property, plant and equipment is depreciated on a straight-line basis over the estimated useful lives of the property, plant, and equipment, which range from three years to ten years. Depreciation and amortization of other property, plant and equipment amounted to $0.8 million, $0.7 million and $0.5 million during the years ended December 31, 2012, 2011 and 2010, respectively.
Oil and gas sales payable
Oil and gas sales payable represents amounts collected from purchasers for oil and gas sales, which are due to other revenue interest owners. Generally, the Company is required to remit amounts due under these liabilities within 60 days of receipt.
Commodity derivatives
The Company records its commodity derivative instruments on the consolidated balance sheet as either an asset or liability measured at its fair value. Changes in the derivative's fair value are recognized currently in earnings, unless specific hedge accounting criteria are met. During the years ended December 31, 2012, 2011 and 2010, the Company elected not to designate any of its commodity price risk management activities as cash flow or fair value hedges. The changes in the fair values of outstanding financial instruments are recognized as gains or losses in the period of change.
F-21
Although the Company does not designate its commodity derivative instruments as cash-flow hedges, management uses those instruments to reduce the Company's exposure to fluctuations in commodity prices related to its natural gas and oil production. Unrealized gains and losses, at fair value, are included on the consolidated balance sheet as current or noncurrent assets or liabilities based on the anticipated timing of cash settlements under the related contracts. Changes in the fair value of commodity derivative contracts are recorded in earnings as they occur and are included in other income (expense) on the statement of operations whether they are realized or unrealized. See Note 4, "Fair Value Measurement" for disclosure about the fair values of commodity derivative instruments.
Asset retirement obligations
The Company's asset retirement obligations ("ARO") consist of future plugging and abandonment expenses on oil and natural gas properties. The Company estimates an ARO for each well in the period in which it is incurred based on estimated present value of plugging and abandonment costs, increased by an inflation factor to the estimated date that the well would be plugged. The resulting liability is recorded by increasing the carrying amount of the related long-lived asset. The liability is then accreted to its then-present value each period and the capitalized cost is depleted over the useful life of the related asset. In 2011, the Company incurred a change in estimate based on experience with actual plugging and abandonment costs incurred. If the liability is settled for an amount other than the recorded amount, a gain or loss is recognized. Based on the expected timing of payments, the full asset retirement obligation is classified as noncurrent. A summary of the Company's ARO for the years ended December 31, 2012 and 2011 is as follows:
| (in thousands of dollars) |
2011 |
2012 |
|||||
|---|---|---|---|---|---|---|---|
ARO liability at beginning of year |
$ | 8,677 | $ | 9,563 | |||
Liabilities incurred |
418 | 662 | |||||
Accretion of discount |
413 | 596 | |||||
Liabilities settled due to sale of related properties |
(3,420 | ) | (927 | ) | |||
Liabilities settled due to plugging and abandonment |
(184 | ) | (388 | ) | |||
Change in estimate |
3,659 | — | |||||
ARO liability at end of year |
9,563 | 9,506 | |||||
Less: Current portion of ARO at end of year |
— | (174 | ) | ||||
Total long-term ARO at end of year |
$ | 9,563 | $ | 9,332 | |||
Revenue recognition
Revenues from the sale of crude oil, natural gas, and natural gas liquids are recognized when the product is delivered at a fixed or determinable price, title has transferred, collectability is reasonably assured and evidenced by a contract. The Company follows the "sales method" of accounting for its oil and natural gas revenue, so it recognizes revenue on all crude oil, natural gas, and natural gas liquids sold to purchasers, regardless of whether the sales are proportionate to its ownership in the property. A receivable or liability is recognized only to the extent that the Company has an imbalance on a specific property greater than the expected remaining proved reserves.
F-22
Production costs
Production costs, including compressor rental, pumpers' salaries, saltwater disposal, ad valorem taxes, insurance, repairs and maintenance, expensed workovers and other operating expenses are expensed as incurred and included in lease operating expense on the statement of operations.
Exploration expenses
Exploration expenses include dry hole costs, lease extensions, delay rentals and geological and geophysical costs.
Income taxes
No provision for federal income taxes is recorded because the taxable income or loss is includable in the income tax returns of the individual partners and members.
The State of Texas includes in its tax system a gross margin tax that is applicable to the Company. The Company includes an accrual for gross margin taxes in the financial statements when appropriate.
Based on management's analysis, the Company did not have any uncertain tax positions as of December 31, 2012, 2011 and 2010. The Company's income tax returns are subject to examination by the relevant taxing authorities as follows: U.S. Federal income tax return for tax years 2012, 2011 and 2010, and Texas income and margin tax return for tax years 2012, 2011 and 2010. In the event the Company is assessed interest or penalties on income tax, such amounts are included in income tax provision on the statement of operations. As of December 31, 2012, no penalties or interest have been imposed.
Deferred tax assets and liabilities are recognized for the estimated future tax consequences attributable to the differences between the financial statement carrying amounts of existing assets and liabilities and their respective tax bases. Deferred tax assets and liabilities are measured using the tax rate in effect for the year in which those temporary differences are expected to be recovered or settled. The effect of a change in tax rates on deferred tax assets and liabilities is recognized in income in the year of the enacted tax rate change.
Comprehensive income
The Company has no elements of comprehensive income other than net income.
Statement of cash flows
Jones Energy presents its cash flows using the indirect method.
Members' equity
The operations of Jones Energy are governed by the provisions of a limited liability company agreement executed by and among its members. The Company is authorized to issue four classes of units, consisting of 14,250,000 units designated as Class A Preferred Units, 1,500,000 units designated as Class B Preferred Units, 4,500,000 units designated as Common Units, and 2,250,000 units designated as Management Units. In accordance with an amendment to the LLC agreement, an additional 8,500,000 units were issued and designated as Class C Preferred Units on December 20, 2012. The units are not represented by certificates. All Preferred and Common Units are issued at a price equal to $10.00 per unit. The Company has issued 14,250,000 Class A Preferred Units, 1,500,000 Class B Preferred Units, 4,500,000 Common Units, and 8,500,000 Class C Preferred Units. The Company issued 2,250,000 Management Units in April 2011 at a
F-23
fair value equal to $2.10 per unit with 60 percent of these shares earned prior to liquidation over a five year vesting period, 2010 to 2014, and 40 percent earned upon liquidation. On December 20, 2012, the Company issued an additional 944,444 Management Units, which also have a five year vesting period, at a fair value of $0.38 per unit. Compensation expense of $1.3 million will be recognized as the units vest ratably over the next two years and $2.0 million upon a liquidation event. Members holding Preferred Units and Common Units vote together as a single class. A member is entitled to one vote for each Preferred Unit and Common Unit held by such member in connection with the election of directors and on all matters to be voted upon by the members of the Company. Management Units have no voting power.
Members holding Class C Preferred Units have rights to all distributions, including those resulting from a liquidation, until their capital is returned. Members holding Class A and B Preferred Units then receive all distributions until their capital is returned. Members holding Common Units then receive all distributions until their capital is returned. Any additional distributions are distributed among all unit holders, including Management Units, ratably based upon number of units held.
As an LLC, the liability of the members is limited to their contributed capital. Allocation of net income is based on a hypothetical distribution at book value.
Related party transactions
The Company pays an annual administration fee to Metalmark Capital of $0.7 million. This amount is charged to expense.
Stock compensation
Employee stock compensation granted by the Company is recognized at fair value at the date of the grant, and is determined based upon the fair value of the Company using the income approach as of that date. Key inputs and assumptions in the analysis of the fair value of the Company include: 1) the fair value of the Company's assets and liabilities, including oil and natural gas reserves, 2) the discount rate, 3) the volatility of the value of the Company in the future based upon similarly situated companies, and 4) the lack of marketability of the management units. For stock awards that have service conditions, the Company recognizes compensation expense on a straight-line basis over the total requisite service period. The Company recognizes compensation expense on awards that have performance conditions, such as liquidation of the Company, at the time the Company concludes it is probable that the performance condition will be achieved.
Business combinations
For acquisitions of working interests that are accounted for as business combinations, the results of operations are included in the statement of operations from the date of acquisition. Purchase prices are allocated to assets acquired based on their estimated fair values at the time of acquisition. Fair value is the price that would be received to sell an asset or would be paid to transfer a liability in an orderly transaction between market participants at the measurement date. The fair value measurement is based on the assumptions of market participants and not those of the reporting entity. Therefore, entity-specific intentions do not impact the measurement of fair value. The fair value of oil and natural gas properties is determined using a risk-adjusted after-tax discounted cash flow analysis based upon significant inputs including: 1) oil and gas prices, 2) projections of estimated quantities of oil and natural gas reserves, including those classified as proved, probable and possible, 3) projections of future rates of production, 4) timing and amount of future development and operating costs, 5) projected reserve recovery factors, and 6) weighted average cost of capital.
F-24
Recent accounting developments
The following recently issued accounting pronouncements have or will be adopted by the Company:
Offsetting assets and liabilities
In December 2011, the Financial Accounting Standards Board ("FASB"), issued authoritative guidance requiring entities to disclose both gross and net information about instruments and transactions eligible for offset arrangement. The additional disclosures will enable users of the financial statements to evaluate the effect or potential effect of netting arrangements on an entity's financial position. These disclosure requirements are effective for interim and annual periods beginning after January 1, 2013, and are not expected to affect the Company's operating results, financial position, or cash flows.
3. Acquisition of properties
On December 20, 2012, Jones Energy acquired certain oil and natural gas properties located in Texas for a purchase price of $251.9 million. The acquired assets represented a strategic fit with the Company's existing Texas Panhandle properties and included both producing properties and undeveloped acreage. The purchase was financed with additional capital and long-term debt. The purchase price was allocated as follows:
| (in thousands of dollars) |
|
|||
|---|---|---|---|---|
Oil and gas properties |
||||
Unproved |
$ | 69,725 | ||
Proved |
182,493 | |||
Asset retirement obligations |
(293 | ) | ||
Total purchase price |
$ | 251,925 | ||
This acquisition qualified as a business combination under ASC 805. The valuation to determine the fair value was principally based on the discounted cash flows of both the producing and undeveloped properties, including projected drilling and equipment costs, recoverable reserves, production streams, future prices and operating costs, and risk-adjusted discount rates reflective of the current market.
The following income statement line items present the post acquisition results included in the consolidated statement of operations and the pro forma results as if these properties had been purchased at the beginning of the period:
| |
|
Year ended December 31, | ||||||||
|---|---|---|---|---|---|---|---|---|---|---|
| (in thousands of dollars) |
Post acquisition(1) |
2011 |
2012 |
|||||||
| |
|
Pro forma (unaudited) |
Pro forma (unaudited) |
|||||||
Total operating revenue |
$ | 1,986 | $ | 187,321 | $ | 194,685 | ||||
Total operating expenses |
168 | 147,211 | 148,879 | |||||||
Operating income |
1,818 | 40,110 | 45,806 | |||||||
Net income |
1,818 | 78,586 | 38,465 | |||||||
(1) Represents results for the post acquisition period of December 20, 2012 to December 31, 2012 included in the consolidated statement of operations.
F-25
On April 14, 2011, Jones Energy acquired certain oil and natural gas properties located in Oklahoma for a purchase price of $154.1 million. The acquisition was viewed as a strategic addition to the Company's holdings of mid-continent oil and gas properties and included both producing properties and a large number of immediately available drilling opportunities. The purchase was financed with additional long-term debt. The purchase price was allocated as follows:
| (in thousands of dollars) |
|
|||
|---|---|---|---|---|
Oil and gas properties |
$ | 154,225 | ||
Asset retirement obligations |
(167 | ) | ||
Total purchase price |
$ | 154,058 | ||
This acquisition qualified as a business combination under ASC 805. The Company recorded a total fair value of $180.3 million ($154.1 million for producing properties and $26.2 million for undeveloped property). The total resulted in a bargain purchase gain of $26.2 million, which was recorded in the current period's statement of operations. The valuation to determine the fair value was principally based on the discounted cash flows of the both the producing and undeveloped properties, including projected drilling and equipment costs, recoverable reserves, production streams, future prices and operating costs, and risk-adjusted discount rates reflective of the current market. The recognized gain was the difference between the net fair value and the consideration paid the seller.
Management believes the bargain purchase gain resulted from the fact that the seller, who retained a 50% ownership interest in the undeveloped properties, benefitted from the Company's available liquidity that will enable accelerated development of the prospect.
The following income statement line items present the pro forma results as if these properties had been purchased at the beginning of the periods:
| |
Year ended December 31, | ||||||
|---|---|---|---|---|---|---|---|
| (in thousands of dollars) |
2010 |
2011 |
|||||
| |
Pro forma (unaudited) |
Pro forma (unaudited) |
|||||
Total operating revenue |
$ | 138,995 | $ | 176,884 | |||
Total operating expenses |
118,496 | 150,197 | |||||
Operating income |
20,499 | 26,687 | |||||
Net income |
31,415 | 63,212 | |||||
On September 15, 2010, the Company acquired certain oil and natural gas properties located primarily in Oklahoma for a purchase price of approximately $33.0 million. This purchase was financed with additional long-term debt.
4. Fair value measurement
Fair value of financial instruments
The Company determines fair value amounts using available market information and appropriate valuation methodologies. Fair value is the price that would be received to sell an asset or would be paid to transfer a liability in an orderly transaction between market participants at the measurement date. Considerable judgment is required in interpreting market data to develop the estimates of fair value. The use of
F-26
different market assumptions and/or estimation methods may have a material effect on the estimated fair value amounts.
The Company enters into a variety of derivative financial instruments, which may include over-the-counter instruments, such as natural gas, crude oil, and natural gas liquid contracts. The Company utilizes valuation techniques that maximize the use of observable inputs, where available. If listed market prices or quotes are not published, fair value is determined based upon a market quote, adjusted by other market-based or independently sourced market data, such as trading volume, historical commodity volatility, and counterparty-specific considerations. These adjustments may include amounts to reflect counterparty credit quality, the time value of money, and the liquidity of the market.
Counterparty credit valuation adjustments are necessary when the market price of an instrument is not indicative of the fair value as a result of the credit quality of the counterparty. Generally, market quotes assume that all counterparties have low default rates and equal credit quality. Therefore, an adjustment may be necessary to reflect the quality of a specific counterparty to determine the fair value of the instrument. The Company currently has all derivative positions placed and held by members of its lending group, which have strong credit quality.
Liquidity valuation adjustments are necessary when the Company is not able to observe a recent market price for financial instruments that trade in less active markets. Exchange traded contracts are valued at market value without making any additional valuation adjustments; therefore, no liquidity reserve is applied.
Valuation hierarchy
Fair value measurements are grouped into a three-level valuation hierarchy. The valuation hierarchy is based upon the transparency of inputs to the valuation of an asset or liability as of the measurement date. A financial instrument's categorization within the hierarchy is based upon the input that requires the highest degree of judgment in the determination of the instrument's fair value. The three levels are defined as follows:
| Level 1 | Pricing inputs are based on published prices in active markets for identical assets or liabilities as of the reporting date. The Company does not classify any of its financial instruments in Level 1. | |
Level 2 |
Pricing inputs include quoted prices for similar assets and liabilities in active markets, and inputs that are observable for the asset or liability, either directly or indirectly, as of the reporting date. Contracts that are not traded on a recognized exchange or are tied to pricing transactions for which forward curve pricing is readily available are classified as Level 2 instruments. These include natural gas, crude oil and natural gas liquids price swaps, and natural gas basis swaps that settle within one year. |
|
Level 3 |
Pricing inputs include significant inputs that are generally unobservable from objective sources. The Company classifies natural gas liquid swaps for which future pricing is not readily available as Level 3. The Company obtains estimates from independent third parties for its open positions and subjects those to the credit adjustment criteria described above. In previous years, the Company classified its natural gas basis swaps that extended beyond one year as Level 3 due to the lack of information that was available for pricing these instruments. As the market for natural gas basis swaps has become more liquid and pricing information has become available, the Company transferred all of its long-term natural gas basis swaps to Level 2 in 2012. |
F-27
The financial instruments carried at fair value as of December 31, 2012 and 2011, by consolidated balance sheet caption and by valuation hierarchy, as described above are as follows:
| (in thousands of dollars) |
December 31, 2011 | ||||||||||||
|---|---|---|---|---|---|---|---|---|---|---|---|---|---|
| |
Fair value measurements using | ||||||||||||
| Commodity price hedges |
Quoted prices in active markets (Level 1) |
Significant other observable inputs (Level 2) |
Significant unobservable inputs (Level 3) |
Total |
|||||||||
Current assets |
$ | — | $ | 18,556 | $ | — | $ | 18,556 | |||||
Long-term assets |
— | 33,108 | (2,083 | ) | 31,025 | ||||||||
Current liabilities |
— | 4,567 | — | 4,567 | |||||||||
Long-term liabilities |
— | 760 | — | 760 | |||||||||
The following table represents quantitative information about Level 3 inputs used in the fair value measurement of the Company's commodity derivative contracts as of December 31, 2012.
| (in thousands of dollars) |
December 31, 2012 | ||||||||||||
|---|---|---|---|---|---|---|---|---|---|---|---|---|---|
| |
Fair value measurements using | ||||||||||||
| Commodity price hedges |
Quoted prices in active markets (Level 1) |
Significant other observable inputs (Level 2) |
Significant unobservable inputs (Level 3) |
Total |
|||||||||
Current assets |
$ | — | $ | 17,648 | $ | — | $ | 17,648 | |||||
Long-term assets |
— | 24,756 | 443 | 25,199 | |||||||||
Current liabilities |
— | 2,992 | 1,043 | 4,035 | |||||||||
Long-term liabilities |
— | 6,739 | 918 | 7,657 | |||||||||
| |
Quantitative information about level 3 fair value measurements | ||||||||
|---|---|---|---|---|---|---|---|---|---|
| (in thousands of dollars) |
Fair value |
Valuation technique |
Unobservable input |
Range |
|||||
Natural gas liquid swaps |
$ | (1,519 | ) | Use a discounted cash flow approach using inputs including forward price statements from counterparties | Natural gas liquid futures | $7.72-$83.74 per barrel | |||
Significant increases (decreases) in natural gas liquid futures in isolation would result in a significantly higher (lower) fair value measurement. The following table presents the changes in the Level 3 financial instruments for the years ended December 31, 2012 and 2011. Changes in fair value of Level 3 instruments represent changes in unrealized gains and losses for the periods that are reported in other income (expense). New contracts entered into during the year are generally entered into at no cost with changes in fair value from the date of agreement representing the entire fair value of the instrument. Transfers between levels are evaluated at the end of the reporting period.
F-28
| (in thousands of dollars) |
|
|||
|---|---|---|---|---|
Balance at January 1, 2011, net |
$ | (1,344 | ) | |
Purchases |
— | |||
Settlements |
— | |||
Transfers to Level 2 |
1,603 | |||
Changes in fair value |
(2,342 | ) | ||
Balance at December 31, 2011, net |
(2,083 | ) | ||
Purchases |
(2,352 | ) | ||
Settlements |
— | |||
Transfers to Level 2 |
2,370 | |||
Transfers to Level 3 |
834 | |||
Changes in fair value |
(288 | ) | ||
Balance at December 31, 2012, net |
$ | (1,519 | ) | |
Transfers from Level 3 to Level 2 represent all of the Company's natural gas basis swaps for which observable forward curve pricing information has become readily available. Transfers to Level 3 represent natural gas liquid swaps that were classified as Level 2 in the prior year but are considered Level 3 in 2012 based on the policies defined in the valuation hierarchy above. The purchases represent natural gas liquid swaps that the Company entered into in 2012 that do not have observable forward curve pricing information.
Nonfinancial assets and liabilities
Assets and liabilities acquired in business combinations are recorded at their fair value on the date of acquisition. Significant Level 3 assumptions associated with the calculation of future cash flows used in the analysis of fair value of the oil and gas property acquired include the Company's estimate of future commodity prices, production costs, development expenditures, production, risk-adjusted discount rates, and other relevant data. Additionally, fair value is used to determine the inception value of the Company's AROs. The inputs used to determine such fair value are primarily based upon costs incurred historically for similar work, as well as estimates from independent third parties for costs that would be incurred to restore leased property to the contractually stipulated condition. Additions to the Company's ARO represent a nonrecurring Level 3 measurement.
The Company reviews its proved oil and gas properties for impairment purposes by comparing the expected undiscounted future cash flows at a producing field level to the unamortized capitalized cost of the asset. During 2012, 2011 and 2010, such reviews indicated that unamortized capitalized costs of certain properties were higher than their expected undiscounted future cash flows due primarily to downward reserve revisions, drilling of marginal or uneconomic wells, or development dry holes in certain producing fields. As a result, the Company recorded charges of $18.8 million, $32.0 million and $10.7 million on December 31, 2012, 2011 and 2010 respectively. These charges are included in Impairment of oil and gas properties on the statement of operations. Significant assumptions associated with the calculation of future cash flows used in the impairment analysis include the Company's estimate of future commodity prices, production costs, development expenditures, production, risk-adjusted discount rates, and other relevant data. As such, the fair value of oil and gas properties used in estimating impairment represents a nonrecurring Level 3 measurement.
F-29
5. Derivative instruments and hedging activities
The Company had various commodity derivatives in place to offset uncertain price fluctuations that could affect its future operations as of December 31, 2012 and 2011, as follows:
Hedging positions
| |
December 31, 2011 | ||||||||||||
|---|---|---|---|---|---|---|---|---|---|---|---|---|---|
| |
|
Low |
High |
Weighted average |
Final expiration |
||||||||
Oil swaps |
Exercise price | $ | 79.50 | $ | 103.77 | $ | 92.70 | ||||||
|
Barrels per month | 10,000 | 39,112 | 22,778 | December 2016 | ||||||||
Natural gas swaps |
Exercise price |
$ |
3.57 |
$ |
6.90 |
$ |
5.81 |
||||||
|
mmbtu per month | 320,000 | 852,673 | 487,491 | December 2016 | ||||||||
Basis swaps |
Contract differential |
$ |
0.03 |
$ |
0.67 |
$ |
0.33 |
||||||
|
mmbtu per month | 320,000 | 697,500 | 466,471 | March 2016 | ||||||||
Natural gas liquids swaps |
Exercise price |
$ |
13.44 |
$ |
101.33 |
$ |
54.80 |
||||||
|
Barrels per month | 3,000 | 76,024 | 19,339 | December 2016 | ||||||||
Oil put spreads |
Exercise price |
$ |
65.00 |
$ |
85.00 |
$ |
— |
||||||
|
Barrels per month | 3,501 | 7,164 | 4,915 | December 2012 | ||||||||
Natural gas calls sold |
Exercise price |
$ |
6.57 |
$ |
6.57 |
$ |
6.57 |
||||||
|
mmbtu per month | 19,476 | 27,673 | 23,024 | December 2012 | ||||||||
Natural gas liquids collars |
Exercise price |
$ |
35.20 |
$ |
42.84 |
$ |
— |
||||||
|
Barrels per month | 2,583 | 2,583 | 2,583 | December 2012 | ||||||||
| |
December 31, 2012 | ||||||||||||
|---|---|---|---|---|---|---|---|---|---|---|---|---|---|
| |
|
Low |
High |
Weighted average |
Final expiration |
||||||||
Oil swaps |
Exercise price | $ | 81.00 | $ | 104.45 | $ | 89.60 | ||||||
|
Barrels per month | 24,000 | 143,116 | 89,323 | December 2017 | ||||||||
Natural gas swaps |
Exercise price |
$ |
3.52 |
$ |
6.90 |
$ |
4.96 |
||||||
|
mmbtu per month | 430,000 | 1,110,000 | 767,053 | December 2017 | ||||||||
Basis swaps |
Contract differential |
$ |
(0.65 |
) |
$ |
(0.03 |
) |
$ |
(0.31 |
) |
|||
|
mmbtu per month | 320,000 | 850,000 | 484,615 | March 2016 | ||||||||
Natural gas liquids swaps |
Exercise price |
$ |
6.72 |
$ |
97.13 |
$ |
33.81 |
||||||
|
Barrels per month | 2,000 | 144,973 | 55,616 | December 2017 | ||||||||
Oil put spreads are sell (put) and buy (call) options that are entered into together to result in a specific range of prices (spread) that will be realized by the Company. Proceeds from selling a call option offset the price of buying a put option, resulting in no initial cost to the Company. If the market price falls below the low price of the range, the Company exercises its put option to sell at the floor price, and if the price exceeds the high price of the range, the counterparty exercises its call option to buy at the ceiling price.
F-30
The Company recognized net gains on derivative instruments of $16.7 million, $34.5 million, and $23.8 million in 2012, 2011 and 2010, respectively. Net gains and losses on derivative instruments are reported in other income (expense) on the statements of operations.
6. Long-term debt
Jones Energy entered into a Senior Secured Revolving Credit Facility (the "Revolver"), dated December 31, 2009, with Wells Fargo Bank, N.A. The Revolver had a first lien, maximum available credit amount of $360.0 million and a borrowing base of $150.0 million. Jones Energy entered into a Second Lien Term Loan (the "Term Loan") with Wells Fargo Energy Capital, Inc. The Term Loan had a face amount of $40.0 million. The Company's oil and gas properties are pledged as collateral against these credit agreements. The maturity date of the Revolver is December 31, 2013, and the maturity date of the Term Loan is June 30, 2014.
On September 15, 2010, these credit agreements were amended in order to finance the purchase of additional oil and gas properties. The borrowing base on the Revolver was increased to $170.0 million and the funded amount of the Term Loan was increased to $55.0 million.
On April 14, 2011, these credit agreements were further amended in order to finance the purchase of additional oil and gas properties. The borrowing base on the Revolver was increased to $340.0 million and the funded amount of the Term Loan was increased to $90.0 million.
Effective November 18, 2011, the borrowing base of the Revolver was increased to $400.0 million, and $30.0 million of borrowing was transferred from the Revolver to the Term Loan, increasing the funded amount of the Term Loan to $120.0 million.
On November 5, 2012, the credit agreements were amended extending the maturity date of the Revolver to November 5, 2017 and the maturity date of the Term loan to May 5, 2018. The borrowing base was decreased to $360.0 million.
On December 20, 2012 the credit agreements were further amended to finance an acquisition of certain oil and gas properties. The borrowing base on the Revolver was increased to $490.0 million and the funded amount of the Term Loan was increased to $160.0 million.
Terms of the Revolver require the Company to pay interest on the loan on the earlier of the London InterBank Offered Rate (LIBOR) tranche maturity date or three months, with all of the principal and interest due on the loan maturity date. Borrowings may be drawn on the principal amount up to the maximum available credit amount. Prepayment of the principal balance is allowed in whole or in part at any time without penalty and amounts may be reborrowed at any time.
Interest on the Revolver is calculated at a base rate (LIBOR or prime), plus a margin of 0.75% to 2.75% based on the actual amount borrowed compared to the borrowing base amount and the base rate selected. As of December 31, 2012, the average interest rate was 3.32% on the outstanding balance of $450.0 million and as of December 31, 2011, the average interest rate was 3.04% on the outstanding balance of $295.0 million.
The borrowing base of the Revolver is subject to scheduled redeterminations on May 1 and November 1 of each year by the lenders and may be redetermined in interim periods at the request of the Company in certain situations. In conjunction with the December 20, 2012 amendment, the scheduled redeterminations changed to February 1 and August 1 of each year.
F-31
The Revolver requires a quarterly payment of commitment fees equal to 0.5% on the daily unused amount of the commitment.
Terms of the Term Loan require the Company to pay interest on the loan every three months with the principal and interest due on the loan maturity date of May 5, 2018. Prepayment of the principal balance is allowed in whole or in part at any time with a premium payment due in certain conditions. Any amounts prepaid may not be re-borrowed.
Interest on the Term Loan is calculated at a base rate (LIBOR, prime, or federal funds), plus a margin of 6% to 7% based on the base rate selected. As of December 31, 2012, the interest rate was 9.25% on the outstanding balance of $160.0 million. As of December 31, 2011, the interest rate was 10.5% on the outstanding balance of $120.0 million.
The Revolver and Term Loans are categorized as Level 3 in the valuation hierarchy as the debt is not publicly traded and no observable market exists to determine the fair value; however, the carrying value of the Revolver and Term Loans approximate fair value, as they are subject to short-term floating interest rates that approximate the rates available to the Company for those periods.
The Revolver and Term Loans include covenants that require, among other things, restrictions on asset sales, distributions to members, and additional indebtedness, and the maintenance of certain financial ratios, including leverage, proven reserves to debt, and current ratio. The Company was in compliance with these covenants as of December 31, 2012.
7. Commitments and contingencies
The Company leases approximately 31,000 square feet of office space under an operating lease arrangement as of December 31, 2012.
Future minimum payments for noncancellable operating leases extending beyond one year at December 31, 2012 are as follows:
| (in thousands of dollars) |
|
|||
|---|---|---|---|---|
Years ending December 31, |
||||
2013 |
$ | 558 | ||
2014 |
534 | |||
2015 |
435 | |||
2016 |
438 | |||
2017 |
146 | |||
Thereafter |
— | |||
|
$ | 2,111 | ||
Rent expense under operating leases was $0.8 million, $0.7 million and $0.5 million for the years ended December 31, 2012, 2011 and 2010, respectively.
The Company is subject to legal proceedings and claims that arise in the ordinary course of its business. The Company believes that the final disposition of such matters will not have a material adverse effect on its financial position, results of operations, or liquidity.
F-32
8. Benefit plans
The Company established a 401(k) tax-deferred savings plan (the "Plan") for the benefit of employees. The Plan is a defined contribution plan and the Company may match a portion of employee contributions. For the years ended December 31, 2012 and 2011, $0.2 million and $0.2 million were contributed, respectively, to the Plan.
9. Income taxes
The provision for income taxes relates solely to the Texas Margin Tax, and consists of the following for the years ended December 31, 2012 and 2011:
| (in thousands of dollars) |
2011 |
2012 |
|||||
|---|---|---|---|---|---|---|---|
Current |
$ | — | $ | — | |||
Deferred |
173 | 473 | |||||
|
$ | 173 | $ | 473 | |||
Deferred tax assets and liabilities are the result of temporary differences between the financial statement carrying values and tax bases of assets and liabilities. The tax effects of significant components of the Company's net deferred tax liabilities as of December 31, 2012 and 2011 were as follows:
| (in thousands of dollars) |
2011 |
2012 |
|||||
|---|---|---|---|---|---|---|---|
Unrealized gain on commodity derivatives |
$ | (55 | ) | $ | (61 | ) | |
Other |
1 | 1 | |||||
Net current deferred tax liability |
$ | (54 | ) | $ | (60 | ) | |
Unrealized gain on commodity derivatives |
$ | (117 | ) | $ | (79 | ) | |
Differences in book and tax bases of oil and gas properties |
(1,293 | ) | (1,797 | ) | |||
Net noncurrent deferred tax liability |
$ | (1,410 | ) | $ | (1,876 | ) | |
10. Subsequent events
The Company has evaluated subsequent events through March 19, 2013, the date on which these financial statements were available for issuance.
F-33
Supplemental information on oil and gas producing activities
(unaudited)
Costs incurred
Costs incurred for oil and gas property acquisitions, exploration and development for the last three years are as follows:
| (in thousands) |
2010 |
2011 |
2012 |
|||||||
|---|---|---|---|---|---|---|---|---|---|---|
Property acquisitions: |
||||||||||
Unproved |
$ | — | $ | — | $ | 69,725 | ||||
Proved |
32,597 | 168,480 | 182,200 | |||||||
Exploration |
4,208 | 780 | 356 | |||||||
Development |
104,518 | 157,046 | 126,155 | |||||||
Total costs incurred |
$ | 141,323 | $ | 326,306 | $ | 378,436 | ||||
Capitalized costs
Capitalized costs for our oil and gas properties consisted of the following at the end of each of the following years:
| (in thousands) |
2011 |
2012 |
|||||
|---|---|---|---|---|---|---|---|
Unproved properties |
$ | 81,490 | $ | 137,254 | |||
Proved properties |
817,362 | 1,127,285 | |||||
|
898,852 | 1,264,539 | |||||
Accumulated depletion and impairment |
(158,467 |
) |
(257,195 |
) |
|||
Net capitalized costs |
$ | 740,385 | $ | 1,007,344 | |||
Reserves
Users of this information should be aware that the process of estimating quantities of proved and proved developed oil and gas reserves (including natural gas liquids) is very complex, requiring significant subjective decisions in the evaluation of all available geological, engineering and economic data for each reservoir. The data for a given reservoir also may change substantially over time as a result of numerous factors, including additional development activity, evolving production history and continual reassessment of the viability of production under varying economic conditions. Consequently, material revisions to existing reserve estimates may occur from time to time.
The following tables set forth the Company's total proved reserves and the changes in the Company's total proved reserves. These reserve estimates are based in part on reports prepared by Cawley, Gillespie & Associates, Inc. ("CG&A"), independent petroleum engineers, utilizing data compiled by us. In preparing its reports, CG&A evaluated properties representing all of the Company's proved reserves at December 31, 2012, 2011 and 2010. The Company's proved reserves are located onshore in the United States. There are many uncertainties inherent in estimating proved reserve quantities, and projecting future production rates and the timing of future development expenditures. In addition, reserve estimates of new discoveries are more imprecise than those of properties with production history. Accordingly, these estimates are subject
F-34
to change as additional information becomes available. Proved reserves are the estimated quantities of natural gas, natural gas liquids and oil that geoscience and engineering data demonstrate with reasonable certainty to be economically producible in future years from known oil and natural gas reservoirs under existing economic conditions, operating methods and government regulations at the end of the respective years. Proved developed reserves are those reserves expected to be recovered through existing wells with existing equipment and operating methods.
| Estimated proved reserves |
Crude oil (MBbls) |
NGL (MBbls) |
Natural gas (MMcf) |
Total in MMcfe(1) |
|||||||||
|---|---|---|---|---|---|---|---|---|---|---|---|---|---|
December 31, 2009 |
3,603 | 5,355 | 77,396 | 131,144 | |||||||||
Extensions and discoveries |
1,020 | 964 | 8,690 | 20,594 | |||||||||
Production |
(455 | ) | — | (8,324 | ) | (11,054 | ) | ||||||
Purchases of minerals in place |
992 | 1,201 | 8,125 | 21,283 | |||||||||
Sales of minerals in place |
(151 | ) | (220 | ) | (4,582 | ) | (6,808 | ) | |||||
Revisions of previous estimates |
982 | 2,653 | 27,329 | 49,139 | |||||||||
December 31, 2010 |
5,991 | 9,953 | 108,634 | 204,298 | |||||||||
Extensions and discoveries |
2,419 | 7,881 | 50,310 | 112,110 | |||||||||
Production |
(811 | ) | (1,215 | ) | (11,438 | ) | (23,594 | ) | |||||
Purchases of minerals in place |
378 | 18,182 | 117,489 | 228,849 | |||||||||
Sales of minerals in place |
(114 | ) | (201 | ) | (2,688 | ) | (4,578 | ) | |||||
Revisions of previous estimates |
(423 | ) | 6 | (17,728 | ) | (20,230 | ) | ||||||
December 31, 2011 |
7,440 | 34,606 | 244,579 | 496,855 | |||||||||
Extensions and discoveries |
286 | 1,766 | 11,727 | 24,039 | |||||||||
Production |
(742 | ) | (1,770 | ) | (13,980 | ) | (29,052 | ) | |||||
Purchases of minerals in place |
6,056 | 5,799 | 36,842 | 107,972 | |||||||||
Sales of minerals in place |
(8 | ) | (53 | ) | (309 | ) | (675 | ) | |||||
Revisions of previous estimates |
(492 | ) | (5,602 | ) | (50,779 | ) | (87,343 | ) | |||||
December 31, 2012 |
12,540 | 34,746 | 228,080 | 511,796 | |||||||||
(1) Millions of cubic feet equivalent determined using the ratio of six Mcf of natural gas to one Bbl of crude oil or natural gas liquids.
Revision of previous estimates
In 2012, the Company experienced net negative revisions of 87,343 MMcfe primarily due to the removal of certain proved undeveloped reserves in the Atoka formation, production performance in the Woodford formation and the decrease in gas prices in the Cleveland formation.
In 2011, the Company experienced net negative revisions of 20,230 MMcfe due to the removal of certain proved undeveloped reserves in the Granite Wash, Cleveland, and Atoka formations due to decreased gas prices, partially offset by the addition of certain proved undeveloped reserves in the more liquid-rich area of the Cleveland formation due to increased oil prices.
F-35
| Estimated proved reserves |
|
|
|
|
|||||||||
|---|---|---|---|---|---|---|---|---|---|---|---|---|---|
December 31, 2010 |
|||||||||||||
Proved developed |
2,646 | 4,017 | 50,469 | 90,447 | |||||||||
Proved undeveloped |
3,345 | 5,936 | 58,165 | 113,851 | |||||||||
|
5,991 | 9,953 | 108,634 | 204,298 | |||||||||
December 31, 2011 |
|||||||||||||
Proved developed |
2,535 | 14,020 | 110,433 | 209,763 | |||||||||
Proved undeveloped |
4,905 | 20,586 | 134,146 | 287,092 | |||||||||
|
7,440 | 34,606 | 244,579 | 496,855 | |||||||||
December 31, 2012 |
|||||||||||||
Proved developed |
4,262 | 16,320 | 110,956 | 234,448 | |||||||||
Proved undeveloped |
8,278 | 18,426 | 117,124 | 277,348 | |||||||||
|
12,540 | 34,746 | 228,080 | 511,796 | |||||||||
Standardized measure of discounted future net cash flows relating to proved oil and gas reserves
The following information was developed utilizing procedures prescribed by FASB Accounting Standards Codification Topic 932, Extractive Industries—Oil and Gas (Topic 932). The "standardized measure of discounted future net cash flows" should not be viewed as representative of the current value of our proved oil and gas reserves. It and the other information contained in the following tables may be useful for certain comparative purposes, but should not be solely relied upon in evaluating the Company or its performance.
In reviewing the information that follows, the following factors should be taken into account:
- •
- future costs and sales prices will probably differ from those required to be used in these calculations;
- •
- actual production rates for future periods may vary significantly from the rates assumed in the calculations;
- •
- a 10% discount rate may not be reasonable relative to risk inherent in realizing future net oil and natural gas revenues.
Under the standardized measure, future cash inflows were estimated by using the average of the historical unweighted first-day-of-the-month prices of oil and natural gas for the prior twelve month periods ended December 31, 2012, 2011 and 2010. Future cash inflows do not reflect the impact of open hedge positions. Future cash inflows were reduced by estimated future development and production costs based on year-end costs in order to arrive at net cash flows. Use of a 10% discount rate and year-end prices and costs are required by ASC 932.
In general, management does not rely on the following information in making investment and operating decisions. Such decisions are based upon a wide range of factors, including estimates of probable as well as proved reserves and varying price and cost assumptions considered more representative of a range of possible outcomes.
F-36
The standardized measure of discounted future net cash flows from the Company's estimated proved oil and natural gas reserves follows:
| (in thousands) |
2010 |
2011 |
2012 |
|||||||
|---|---|---|---|---|---|---|---|---|---|---|
Future cash inflows |
$ | 1,359,028 | $ | 3,279,260 | $ | 2,746,767 | ||||
Less related future: |
||||||||||
Production costs |
(390,405 | ) | (648,035 | ) | (612,054 | ) | ||||
Development costs |
(266,741 | ) | (556,302 | ) | (529,692 | ) | ||||
Future net cash flows |
701,882 | 2,074,923 | 1,605,021 | |||||||
10% annual discount for estimated timing of cash flows |
(347,375 | ) | (1,159,116 | ) | (823,001 | ) | ||||
Standardized measure of discounted future net cash flows |
$ | 354,507 | $ | 915,807 | $ | 782,020 | ||||
A summary of the changes in the standardized measure of discounted future net cash flows applicable to proved natural gas and crude oil reserves follows:
| (in thousands) |
2010 |
2011 |
2012 |
|||||||
|---|---|---|---|---|---|---|---|---|---|---|
Balance, beginning of period |
$ | 174,973 | $ | 354,507 | $ | 915,807 | ||||
Net change in sales and transfer prices, net of production expenses |
97,806 | 133,740 | (336,855 | ) | ||||||
Changes in estimated future development costs |
(118,924 | ) | 3,391 | 67,495 | ||||||
Sales and transfers of oil and gas produced during the period |
(74,813 | ) | (139,600 | ) | (119,931 | ) | ||||
Net change due to extensions and discoveries |
55,743 | 298,299 | 37,723 | |||||||
Net change due to purchases of minerals in place |
48,906 | 230,687 | 197,740 | |||||||
Net change due to sales of minerals in place |
(12,007 | ) | (10,969 | ) | (1,578 | ) | ||||
Net change due to revisions in quantity estimates |
112,917 | (48,425 | ) | (144,901 | ) | |||||
Previously estimated development costs incurred during the period |
42,549 | 83,287 | 99,513 | |||||||
Net change in income taxes |
— | — | — | |||||||
Accretion of discount |
17,497 | 35,451 | 91,581 | |||||||
Other |
9,860 | (24,561 | ) | (24,574 | ) | |||||
Balance, end of period |
$ | 354,507 | $ | 915,807 | $ | 782,020 | ||||
F-37
Jones Energy Holdings, LLC and Subsidiaries
(A Delaware limited liability company)
Consolidated Balance Sheets (Unaudited)
| (in thousands of dollars) |
December 31, 2012 |
March 31, 2013 |
|||||
|---|---|---|---|---|---|---|---|
Assets |
|||||||
Current assets |
|||||||
Cash |
$ | 23,726 | $ | 16,804 | |||
Accounts receivable, net |
|||||||
Oil and gas sales |
29,684 | 40,179 | |||||
Joint interest owners |
21,876 | 20,168 | |||||
Other |
4,590 | 3,195 | |||||
Other current assets |
1,088 | 3,961 | |||||
Commodity derivative assets |
17,648 | 7,834 | |||||
Total current assets |
98,612 | 92,141 | |||||
Oil and gas properties, net, at cost under the successful efforts method |
1,007,344 | 1,026,272 | |||||
Other property, plant and equipment, net |
3,398 | 3,229 | |||||
Commodity derivative assets |
25,199 | 20,781 | |||||
Other assets |
16,133 | 15,389 | |||||
Total assets |
$ | 1,150,686 | $ | 1,157,812 | |||
Liabilities and Members' Equity |
|||||||
Current liabilities |
|||||||
Trade accounts payable |
$ | 38,036 | $ | 40,849 | |||
Oil and gas sales payable |
45,860 | 55,076 | |||||
Accrued liabilities |
3,873 | 3,886 | |||||
Deferred tax liabilities |
61 | 1 | |||||
Asset retirement obligations |
174 | 174 | |||||
Commodity derivative liabilities |
4,035 | 7,688 | |||||
Total current liabilities |
92,039 | 107,674 | |||||
Long-term debt |
610,000 | 605,000 | |||||
Commodity derivative liabilities |
7,657 | 4,904 | |||||
Asset retirement obligations |
9,332 | 9,663 | |||||
Deferred tax liabilities |
1,876 | 1,914 | |||||
Total liabilities |
720,904 | 729,155 | |||||
Commitments and contingencies (Note 7) |
|||||||
Members' equity |
|||||||
Class A preferred units; 14,250,000 authorized and issued |
205,970 | 205,468 | |||||
Class B preferred units; 1,500,000 authorized and issued |
21,681 | 21,628 | |||||
Class C preferred units; 8,500,000 authorized and issued |
122,860 | 122,561 | |||||
Common units; 4,500,000 authorized and issued |
65,043 | 64,885 | |||||
Management units; 3,194,444 authorized and issued |
14,228 | 14,115 | |||||
Total members' equity |
429,782 | 428,657 | |||||
Total liabilities and members' equity |
$ | 1,150,686 | $ | 1,157,812 | |||
The accompanying notes are an integral part of these consolidated financial statements.
F-38
Jones Energy Holdings, LLC and Subsidiaries
(A Delaware limited liability company)
Consolidated Statements of Operations (Unaudited)
| |
Three Months Ended March 31, |
||||||
|---|---|---|---|---|---|---|---|
| (in thousands of dollars) |
2012 |
2013 |
|||||
Operating revenues |
|||||||
Oil and gas sales |
$ | 42,517 | $ | 55,259 | |||
Other revenues |
280 | 221 | |||||
Total operating revenues |
42,797 | 55,480 | |||||
Operating costs and expenses |
|||||||
Lease operating |
5,528 | 5,345 | |||||
Production taxes |
1,593 | 2,452 | |||||
Exploration |
74 | 126 | |||||
Depletion, depreciation and amortization |
18,773 | 25,101 | |||||
Impairment of oil and gas properties |
18 | — | |||||
Accretion of discount |
146 | 97 | |||||
General and administrative |
3,676 | 4,312 | |||||
Total operating expenses |
29,808 | 37,433 | |||||
Operating income |
12,989 | 18,047 | |||||
Other income (expense) |
|||||||
Interest expense |
(6,601 | ) | (7,980 | ) | |||
Net gain (loss) on commodity derivatives |
7,737 | (11,383 | ) | ||||
Gain on sales of assets |
1,429 | 70 | |||||
Other income (expense), net |
2,565 | (19,293 | ) | ||||
Income (loss) before income tax |
15,554 | (1,246 | ) | ||||
Income tax provision |
|||||||
Current |
— | 22 | |||||
Deferred |
111 | (23 | ) | ||||
Total income tax provision |
111 | (1 | ) | ||||
Net income (loss) |
$ | 15,443 | $ | (1,245 | ) | ||
The accompanying notes are an integral part of these consolidated financial statements.
F-39
Jones Energy Holdings, LLC and Subsidiaries
(A Delaware limited liability company)
Statements of Changes In Members' Equity (Unaudited)
| |
Preferred units | |
|
|
|
|
||||||||||||||||||||||||||||
|---|---|---|---|---|---|---|---|---|---|---|---|---|---|---|---|---|---|---|---|---|---|---|---|---|---|---|---|---|---|---|---|---|---|---|
| |
|
|
Management units |
|
||||||||||||||||||||||||||||||
| |
Class A | Class B | Class C | Common units | Total members' equity |
|||||||||||||||||||||||||||||
| (amounts in thousands) |
||||||||||||||||||||||||||||||||||
| Units |
Value |
Units |
Value |
Units |
Value |
Units |
Value |
Units |
Value |
|||||||||||||||||||||||||
Balance at December 31, 2012 |
14,250 | $ | 205,970 | 1,500 | $ | 21,681 | 8,500 | $ | 122,860 | 4,500 | $ | 65,043 | 3,194 | $ | 14,228 | $ | 429,782 | |||||||||||||||||
Stock-compensation expense |
— | 54 | — | 5 | — | 32 | — | 17 | — | 12 | 120 | |||||||||||||||||||||||
Net income (loss) |
— | (556 | ) | — | (58 | ) | — | (331 | ) | — | (175 | ) | — | (125 | ) | (1,245 | ) | |||||||||||||||||
Balance at March 31, 2013 |
14,250 | $ | 205,468 | 1,500 | $ | 21,628 | 8,500 | $ | 122,561 | 4,500 | $ | 64,885 | 3,194 | $ | 14,115 | $ | 428,657 | |||||||||||||||||
The accompanying notes are an integral part of these consolidated financial statements.
F-40
Jones Energy Holdings, LLC and Subsidiaries
(A Delaware limited liability company)
Consolidated Statements of Cash Flows (Unaudited)
| |
Three Months Ended March 31, | ||||||
|---|---|---|---|---|---|---|---|
| (in thousands of dollars) |
2012 |
2013 |
|||||
Cash flows from operating activities |
|||||||
Net income (loss) |
$ | 15,443 | $ | (1,245 | ) | ||
Adjustments to reconcile net income to net cash provided by operating activities |
|||||||
Depletion, depreciation, and amortization |
18,773 | 25,101 | |||||
Impairment of oil and gas properties |
18 | — | |||||
Accretion of discount |
146 | 97 | |||||
Amortization of debt issuance costs |
883 | 664 | |||||
Stock compensation expense |
142 | 120 | |||||
(Gain) loss on commodity derivatives |
(7,737 | ) | 11,383 | ||||
(Gain) loss on sales of assets |
(1,429 | ) | (70 | ) | |||
Deferred income tax provision |
111 | (23 | ) | ||||
Other—net |
(25 | ) | 165 | ||||
Changes in assets and liabilities |
|||||||
Accounts receivable |
17,222 | (7,846 | ) | ||||
Other assets |
(1,606 | ) | (2,768 | ) | |||
Accounts payable and accrued liabilities |
(14,980 | ) | 5,418 | ||||
Net cash provided by operations |
26,961 | 30,996 | |||||
Cash flows from investing activities |
|||||||
Additions to oil and gas properties |
(35,068 | ) | (36,883 | ) | |||
Proceeds from sales of assets |
9,358 | 2 | |||||
Acquisition of other property, plant and equipment |
(154 | ) | (51 | ) | |||
Current period settlements of matured derivative contracts |
4,440 | 4,039 | |||||
Net cash used in investing |
(21,424 | ) | (32,893 | ) | |||
Cash flows from financing activities |
|||||||
Proceeds from issuance of long-term debt |
17,243 | — | |||||
Repayment under long-term debt |
(14,243 | ) | (5,000 | ) | |||
Payment of debt issuance costs |
— | (25 | ) | ||||
Net cash (used in) provided by financing |
3,000 | (5,025 | ) | ||||
Net increase (decrease) in cash |
8,537 | (6,922 | ) | ||||
Cash |
|||||||
Beginning of period |
6,136 | 23,726 | |||||
End of period |
$ | 14,673 | $ | 16,804 | |||
Supplemental disclosure of cash flow information |
|||||||
Cash paid for interest |
$ | 5,470 | $ | 6,325 | |||
Noncash oil and gas property additions |
5,871 | 6,625 | |||||
Current additions to ARO |
117 | 69 | |||||
Deferred offering costs |
— | 1,534 | |||||
The accompanying notes are an integral part of these consolidated financial statements.
F-41
Jones Energy Holdings, LLC and Subsidiaries
(A Delaware limited liability company)
Notes to Consolidated Financial Statements (Unaudited)
1. Organization and Description of Business
Jones Energy Holdings, LLC (the "Company") was organized December 16, 2009 as a Delaware limited liability company and began operations effective December 31, 2009. On December 31, 2009, a series of transactions was undertaken by the Company as follows:
- •
- The owners of Nosley Properties, LLC ("Nosley") and Jones Energy, Ltd. ("JEL") contributed
all their ownership interests in Nosley and JEL for Common Units plus $15.0 million for Preferred Class B Units
- •
- Metalmark Capital contributed $135.0 million for Preferred Class A Units
- •
- Wells Fargo Central Pacific Holdings, Inc. contributed $7.5 million for Preferred Class A Units
In addition to these capital contributions, the Company borrowed $175.0 million from Wells Fargo Bank, N.A., used partially to repay the debt of Nosley and JEL. The Company used the cash contributions and the balance of the Wells Fargo debt funding to acquire 100% of the equity interest of Crusader Energy Group, Inc., out of bankruptcy. The previous owners of Nosley and JEL hold two board of director seats and Metalmark holds two board of director seats; however, Metalmark holds the majority equity interest, which gives it effective control of the Company.
On December 20, 2012 the owners of Class A Preferred, Class B Preferred and Common Units contributed $56.7 million, $25.2 million and $3.1 million, respectively, for Preferred Class C Units. The Company used the capital contributions, along with $170 million borrowed from Wells Fargo Bank, N.A., to fund the acquisition of certain oil and gas properties in the Texas Panhandle (see Note 3, "Acquisition of Properties").
The Company is engaged in the acquisition, exploration, and production of oil and natural gas properties in the mid-continent U.S. through undivided ownership interests or through its wholly owned subsidiaries. The Company operates in one industry segment and all of its operations are conducted in one geographic area of the United States. The Company is headquartered in Austin, Texas.
2. Significant Accounting Policies
Basis of Presentation
The accompanying financial statements have been prepared in accordance with accounting principles generally accepted in the United States of America (GAAP). The accompanying consolidated financial statements include the Company and all of its subsidiaries. All significant intercompany transactions and balances have been eliminated in consolidation.
These interim financial statements have not been audited. However, in the opinion of management, all adjustments consisting of only normal and recurring adjustments necessary for a fair statement of the financial statements have been included. As these are interim financial statements, they do not include all disclosures required for financial statements prepared in conformity with GAAP. Interim period results are not necessarily indicative of results of operations or cash flows for a full year.
F-42
These financial statements and notes should be read in conjunction with our audited consolidated financial statements and the notes thereto for the year ended December 31, 2012 included elsewhere in this prospectus.
Use of Estimates
In preparing the accompanying financial statements, management has made certain estimates and assumptions that affect the reported amounts of assets and liabilities, disclosure of contingent liabilities, and the reported amounts of revenue and expenses during the reporting period. Actual results could differ from these estimates. Changes in estimates are recorded prospectively.
Significant assumptions are required in the valuation of proved oil and natural gas reserves, which affect the Company's estimates of depletion expense, impairment, and the allocation of value in our business combinations. Significant assumptions are also required in the Company's estimates of the unrealized gain or loss on commodity derivative assets and liabilities and asset retirement obligations (ARO).
Oil and Gas Properties
The Company accounts for its oil and natural gas exploration and production activities under the successful efforts method of accounting. Oil and gas properties consisted of the following at March 31, 2013 and December 31, 2012:
| (in thousands of dollars) |
December 31, 2012 |
March 31, 2013 |
|||||
|---|---|---|---|---|---|---|---|
Mineral interests in properties |
|||||||
Unproved |
$ | 137,254 | $ | 143,576 | |||
Proved |
754,657 | 755,709 | |||||
Wells and equipment and related facilities |
372,628 | 409,064 | |||||
|
1,264,539 | 1,308,349 | |||||
Less: Accumulated depletion and impairment |
(257,195 | ) | (282,077 | ) | |||
Net oil and gas properties |
$ | 1,007,344 | $ | 1,026,272 | |||
As of March 31, 2013 and December 31, 2012, there were no costs capitalized in connection with exploratory wells in progress.
The Company capitalizes interest on expenditures for significant exploration and development projects that last more than six months while activities are in progress to bring the assets to their intended use. The Company did not capitalize any interest during the period ended March 31, 2013 as no projects lasted more than six months. Depletion of oil and gas properties amounted to $24.9 million and $18.6 million for the periods ended March 31, 2013 and March 31, 2012, respectively.
F-43
Other Property, Plant and Equipment
Other property, plant and equipment consisted of the following at March 31, 2013 and December 31, 2012:
| (in thousands of dollars) |
December 31, 2012 |
March 31, 2013 |
|||||
|---|---|---|---|---|---|---|---|
Leasehold improvements |
$ | 983 | $ | 983 | |||
Furniture, fixtures, computers and software |
2,204 | 2,254 | |||||
Vehicles |
719 | 719 | |||||
Aircraft |
1,295 | 1,295 | |||||
Land |
62 | 62 | |||||
Production Equipment |
72 | 72 | |||||
|
5,335 | 5,385 | |||||
Less: Accumulated depreciation and amortization |
(1,937) | (2,156) | |||||
Net other property, plant and equipment |
$ | 3,398 | $ | 3,229 | |||
Other property, plant and equipment is depreciated on a straight-line basis over the estimated useful lives of the property, plant, and equipment, which range from three years to ten years. Depreciation and amortization of other property, plant and equipment amounted to $0.2 million and $0.2 million during the three months ended March 31, 2013 and 2012, respectively.
Commodity Derivatives
The Company records its commodity derivative instruments on the consolidated balance sheet as either an asset or liability measured at its fair value. Changes in the derivatives' fair value are recognized currently in earnings, unless specific hedge accounting criteria are met. During the three month period ended March 31, 2013, the Company elected not to designate any of its commodity price risk management activities as cash flow or fair value hedges. The changes in the fair values of outstanding financial instruments are recognized as gains or losses in the period of change.
Although the Company does not designate its commodity derivative instruments as cash-flow hedges, management uses those instruments to reduce the Company's exposure to fluctuations in commodity prices related to its natural gas and oil production. Unrealized gains and losses, at fair value, are included on the consolidated balance sheet as current or noncurrent assets or liabilities based on the anticipated timing of cash settlements under the related contracts. Changes in the fair value of commodity derivative contracts are recorded in earnings as they occur and are included in other income (expense) on the statement of operations whether they are realized or unrealized. See Note 4, "Fair Value Measurement" for disclosure about the fair values of commodity derivative instruments.
F-44
Asset Retirement Obligations
A summary of the Company's ARO for the three months ended March 31, 2013 is as follows:
| |
|
|||
|---|---|---|---|---|
| (in thousands of dollars) |
|
|||
Balance at December 31, 2012 |
$ | 9,506 | ||
Liabilities incurred |
69 | |||
Accretion of discount |
97 | |||
Liabilities settled due to sale of related properties |
(4 | ) | ||
Liabilities settled due to plugging and abandonment |
(32 | ) | ||
Change in estimate |
201 | |||
Balance at March 31, 2013 |
9,837 | |||
Less: Current portion of ARO |
(174 | ) | ||
Total long-term ARO at March 31, 2013 |
$ | 9,663 | ||
Income Taxes
No provision for federal income taxes is recorded because the taxable income or loss is includable in the income tax returns of the individual partners and members.
Based on management's analysis, the Company did not have any uncertain tax positions as of March 31, 2013 and December 31, 2012.
Members' Equity
The operations of Jones Energy are governed by the provisions of a limited liability company agreement executed by and among its members. The Company is authorized to issue four classes of units, consisting of 14,250,000 units designated as Class A Preferred Units, 1,500,000 units designated as Class B Preferred Units, 4,500,000 units designated as Common Units, and 2,250,000 units designated as Management Units. In accordance with an amendment to the LLC agreement, an additional 8,500,000 units were issued and designated as Class C Preferred Units on December 20, 2012. The units are not represented by certificates. All Preferred and Common Units are issued at a price equal to $10.00 per unit. The Company has issued 14,250,000 Class A Preferred Units, 1,500,000 Class B Preferred Units, 4,500,000 Common Units, and 8,500,000 Class C Preferred Units. The Company issued 2,250,000 Management Units in April 2011 at a fair value equal to $2.10 per unit with 60 percent of these shares earned prior to liquidation over a five year vesting period, 2010 to 2014, and 40 percent earned upon liquidation. On December 20, 2012, the Company issued an additional 944,444 Management Units, which also have a five year vesting period, at a fair value of $0.38 per unit. Members holding Preferred Units and Common Units vote together as a single class. A member is entitled to one vote for each Preferred Unit and Common Unit held by such member in connection with the election of directors and on all matters to be voted upon by the members of the Company. Management Units have no voting power.
Members holding Class C Preferred Units have rights to all distributions, including those resulting from a liquidation, until their capital is returned. Members holding Class A and B Preferred Units then receive all distributions until their capital is returned. Members holding Common Units then receive all distributions until their capital is returned. Any additional distributions are distributed among all unit holders, including Management Units, ratably based upon number of units held.
As an LLC, the liability of the members is limited to their contributed capital. Allocation of net income is based on a hypothetical distribution at book value.
F-45
Recent Accounting Developments
The following recently issued accounting pronouncements have or will be adopted by the Company:
Offsetting Assets and Liabilities
In December 2011, the Financial Accounting Standards Board ("FASB"), issued authoritative guidance requiring entities to disclose both gross and net information about instruments and transactions eligible for offset arrangement. The additional disclosures enable users of the financial statements to evaluate the effect or potential effect of netting arrangements on an entity's financial position. These disclosure requirements are effective for interim and annual periods beginning after January 1, 2013. The Company has provided the required disclosures for the periods presented in the first quarter of 2013 as they pertain to its commodity derivative instruments (see Note 4, "Fair Value Measurement"). The disclosure requirements do not affect the Company's operating results, financial position, or cash flows.
3. Acquisition of Properties
No property acquisitions occurred during the three months ended March 31, 2013 and 2012.
On December 20, 2012, Jones Energy acquired certain oil and natural gas properties located in Texas for a purchase price of $251.9 million. The acquired assets represented a strategic fit with the Company's existing Texas Panhandle properties and included both producing properties and undeveloped acreage. The purchase was financed with additional capital and long-term debt. The purchase price was allocated as follows:
| (in thousands of dollars) |
|
|||
|---|---|---|---|---|
Oil and gas properties |
||||
Unproved |
$ | 69,725 | ||
Proved |
182,493 | |||
Asset retirement obligations |
(293 | ) | ||
Total purchase price |
$ | 251,925 | ||
This acquisition qualified as a business combination under ASC 805. The valuation to determine the fair value was principally based on the discounted cash flows of both the producing and undeveloped properties, including projected drilling and equipment costs, recoverable reserves, production streams, future prices and operating costs, and risk-adjusted discount rates reflective of the current market.
The unaudited pro forma results presented below have been prepared to give the effect of the acquisition on our results of operations for the quarter ended March 31, 2012. The unaudited pro forma results do not purport to represent what our actual results of operations would have been if the acquisition had been completed on January 1, 2012 or to project our results of operations for any future date or period.
| |
Quarter Ended March 31, 2012 | ||||||
|---|---|---|---|---|---|---|---|
| (in thousands of dollars) |
Actual |
Pro Forma |
|||||
Total operating revenue |
$ | 42,797 | $ | 51,383 | |||
Total operating expenses |
29,808 | 30,572 | |||||
Operating income |
12,989 | 20,811 | |||||
Net income |
15,443 | 23,266 | |||||
F-46
4. Fair Value Measurement
Fair Value of Financial Instruments
The Company determines fair value amounts using available market information and appropriate valuation methodologies. Fair value is the price that would be received to sell an asset or would be paid to transfer a liability in an orderly transaction between market participants at the measurement date. Considerable judgment is required in interpreting market data to develop the estimates of fair value. The use of different market assumptions and/or estimation methods may have a material effect on the estimated fair value amounts.
The Company enters into a variety of derivative financial instruments, which may include over-the-counter instruments, such as natural gas, crude oil, and natural gas liquid contracts. The Company utilizes valuation techniques that maximize the use of observable inputs, where available. If listed market prices or quotes are not published, fair value is determined based upon a market quote, adjusted by other market-based or independently sourced market data, such as trading volume, historical commodity volatility, and counterparty-specific considerations. These adjustments may include amounts to reflect counterparty credit quality, the time value of money, and the liquidity of the market.
Counterparty credit valuation adjustments are necessary when the market price of an instrument is not indicative of the fair value as a result of the credit quality of the counterparty. Generally, market quotes assume that all counterparties have low default rates and equal credit quality. Therefore, an adjustment may be necessary to reflect the quality of a specific counterparty to determine the fair value of the instrument. The Company currently has all derivative positions placed and held by members of its lending group, which have strong credit quality.
Liquidity valuation adjustments are necessary when the Company is not able to observe a recent market price for financial instruments that trade in less active markets. Exchange traded contracts are valued at market value without making any additional valuation adjustments; therefore, no liquidity reserve is applied.
Valuation Hierarchy
Fair value measurements are grouped into a three-level valuation hierarchy. The valuation hierarchy is based upon the transparency of inputs to the valuation of an asset or liability as of the measurement date. A financial instrument's categorization within the hierarchy is based upon the input that requires the
F-47
highest degree of judgment in the determination of the instrument's fair value. The three levels are defined as follows:
| Level 1 | Pricing inputs are based on published prices in active markets for identical assets or liabilities as of the reporting date. The Company does not classify any of its financial instruments in Level 1. | |
| Level 2 | Pricing inputs include quoted prices for similar assets and liabilities in active markets, and inputs that are observable for the asset or liability, either directly or indirectly, as of the reporting date. Contracts that are not traded on a recognized exchange or are tied to pricing transactions for which forward curve pricing is readily available are classified as Level 2 instruments. These include natural gas, crude oil and natural gas liquids price swaps, and natural gas basis swaps that settle within one year. | |
| Level 3 | Pricing inputs include significant inputs that are generally unobservable from objective sources. The Company classifies natural gas liquid swaps for which future pricing is not readily available as Level 3. The Company obtains estimates from independent third parties for its open positions and subjects those to the credit adjustment criteria described above. |
The financial instruments carried at fair value as of March 31, 2013 and December 31, 2012, by consolidated balance sheet caption and by valuation hierarchy, as described above are as follows:
| (in thousands of dollars) |
December 31, 2012 | ||||||||||||
|---|---|---|---|---|---|---|---|---|---|---|---|---|---|
| |
Fair Value Measurements | ||||||||||||
| Commodity Price Hedges |
(Level 1) |
(Level 2) |
(Level 3) |
Total |
|||||||||
Current assets |
$ | — | $ | 17,648 | $ | — | $ | 17,648 | |||||
Long-term assets |
— | 24,756 | 443 | 25,199 | |||||||||
Current liabilities |
— | 2,992 | 1,043 | 4,035 | |||||||||
Long-term liabilities |
— | 6,739 | 918 | 7,657 | |||||||||
| (in thousands of dollars) |
March 31, 2013 | ||||||||||||
|---|---|---|---|---|---|---|---|---|---|---|---|---|---|
| |
Fair Value Measurements | ||||||||||||
| Commodity Price Hedges |
(Level 1) |
(Level 2) |
(Level 3) |
Total |
|||||||||
Current assets |
$ | — | $ | 8,110 | $ | (276 | ) | $ | 7,834 | ||||
Long-term assets |
— | 20,009 | 772 | 20,781 | |||||||||
Current liabilities |
— | 7,041 | 647 | 7,688 | |||||||||
Long-term liabilities |
— | 4,904 | — | 4,904 | |||||||||
The following table represents quantitative information about Level 3 inputs used in the fair value measurement of the Company's commodity derivative contracts as of March 31, 2013.
| |
Quantitative Information About Level 3 Fair Value Measurements | ||||||||
|---|---|---|---|---|---|---|---|---|---|
| (in thousands of dollars) |
Fair Value |
Valuation Technique |
Unobservable Input |
Range |
|||||
Natural gas liquid swaps |
$ | (151 | ) | Use a discounted cash flow approach using inputs including forward price statements from counterparties | Natural gas liquid futures | $9.61-$82.64 per barrel | |||
Significant increases (decreases) in natural gas liquid futures in isolation would result in a significantly higher (lower) fair value measurement. The following table presents the changes in the Level 3 financial instruments for the three months ended March 31, 2013. Changes in fair value of Level 3 instruments represent changes in unrealized gains and losses for the periods that are reported in other income
F-48
(expense). New contracts entered into during the year are generally entered into at no cost with changes in fair value from the date of agreement representing the entire fair value of the instrument. Transfers between levels are evaluated at the end of the reporting period.
| (in thousands of dollars) |
|
|||
|---|---|---|---|---|
Balance at December 31, 2012, net |
$ | (1,519 | ) | |
Purchases |
— | |||
Settlements |
— | |||
Transfers to Level 2 |
680 | |||
Changes in fair value |
688 | |||
Balance at March 31, 2013, net |
$ | (151 | ) | |
Transfers from Level 3 to Level 2 represent all of the Company's natural gas liquids swaps for which observable forward curve pricing information has become readily available. There were no purchases or settlements in the period that resulted in changes to Level 3.
Offsetting Assets and Liabilities
As of March 31, 2013, the counterparties to our commodity derivative contracts consisted of six financial institutions. All of our counterparties or their affiliates are also lenders under our credit facility. Therefore, we are not generally required to post additional collateral under our derivative agreements.
Our derivative agreements contain set-off provisions that state that in the event of default or early termination, any obligation owed by the defaulting party may be offset against any obligation owed to the defaulting party.
We adopted the guidance requiring disclosure of both gross and net information about financial instruments eligible for netting in the balance sheet under our derivative agreements. The following table presents information about our commodity derivative contracts which are netted on our balance sheet as of March 31, 2013 and December 31, 2012:
| (in thousands) |
Gross Amounts of Recognized Assets |
Gross Amounts Offset in the Balance Sheet |
Amounts of Assets Presented in the Balance |
Gross Amounts Not Offset in the Balance Sheet |
Net Amount |
|||||||||||
|---|---|---|---|---|---|---|---|---|---|---|---|---|---|---|---|---|
December 31, 2012 |
||||||||||||||||
Commodity derivative contracts |
||||||||||||||||
Assets |
49,200 | (7,831 | ) | 41,369 | 1,478 | 42,847 | ||||||||||
Liabilities |
(17,929 | ) | 7,831 | (10,098 | ) | (1,595 | ) | (11,692 | ) | |||||||
March 31, 2013 |
||||||||||||||||
Commodity derivative contracts |
||||||||||||||||
Assets |
39,870 | (11,370 | ) | 28,500 | 115 | 28,615 | ||||||||||
Liabilities |
(23,962 | ) | 11,370 | (12,592 | ) | — | (12,592 | ) | ||||||||
F-49
Nonfinancial Assets and Liabilities
Assets and liabilities acquired in business combinations are recorded at their fair value on the date of acquisition. Significant Level 3 assumptions associated with the calculation of future cash flows used in the analysis of fair value of the oil and gas property acquired include the Company's estimate of future commodity prices, production costs, development expenditures, production, risk-adjusted discount rates, and other relevant data. Additionally, fair value is used to determine the inception value of the Company's AROs. The inputs used to determine such fair value are primarily based upon costs incurred historically for similar work, as well as estimates from independent third parties for costs that would be incurred to restore leased property to the contractually stipulated condition. Additions to the Company's ARO represent a nonrecurring Level 3 measurement.
The Company reviews its proved oil and gas properties for impairment purposes by comparing the expected undiscounted future cash flows at a producing field level to the unamortized capitalized cost of the asset. During the three month period ended March 31, 2012, such reviews indicated that unamortized capitalized costs of certain properties were higher than their expected undiscounted future cash flows due primarily to downward reserve revisions, drilling of marginal or uneconomic wells, or development dry holes in certain producing fields. As a result, the Company recorded a charge of $.02 million during the three months ended March 31, 2012. No impairment was recorded during the three months ended March 31, 2013. Impairment of oil and gas properties charges are recorded on the statement of operations. Significant assumptions associated with the calculation of future cash flows used in the impairment analysis include the Company's estimate of future commodity prices, production costs, development expenditures, production, risk-adjusted discount rates, and other relevant data. As such, the fair value of oil and gas properties used in estimating impairment represents a nonrecurring Level 3 measurement.
5. Derivative Instruments and Hedging Activities
The Company had various commodity derivatives in place to offset uncertain price fluctuations that could affect its future operations as of March 31, 2012 and December 31, 2012, as follows:
Hedging Positions
| |
March 31, 2013 | ||||||||||||
|---|---|---|---|---|---|---|---|---|---|---|---|---|---|
| |
|
Low |
High |
Weighted Average |
Final Expiration |
||||||||
Oil swaps |
Exercise price | $ | 81.00 | $ | 104.45 | $ | 89.49 | ||||||
|
Barrels per month | 24,000 | 143,116 | 89,514 | December 2017 | ||||||||
Natural gas swaps |
Exercise price |
$ |
3.52 |
$ |
6.90 |
$ |
4.96 |
||||||
|
mmbtu per month | 430,000 | 1,110,000 | 758,302 | December 2017 | ||||||||
Basis swaps |
Contract differential |
$ |
(0.65 |
) |
$ |
(0.03 |
) |
$ |
(0.32 |
) |
|||
|
mmbtu per month | 320,000 | 820,000 | 455,556 | March 2016 | ||||||||
Natural gas liquids swaps |
Exercise price |
$ |
6.72 |
$ |
97.13 |
$ |
33.60 |
||||||
|
Barrels per month | 2,000 | 144,973 | 51,333 | December 2017 | ||||||||
F-50
| |
December 31, 2012 | ||||||||||||
|---|---|---|---|---|---|---|---|---|---|---|---|---|---|
| |
|
Low |
High |
Weighted Average |
Final Expiration |
||||||||
Oil swaps |
Exercise price | $ | 81.00 | $ | 104.45 | $ | 89.60 | ||||||
|
Barrels per month | 24,000 | 143,116 | 89,323 | December 2017 | ||||||||
Natural gas swaps |
Exercise price |
$ |
3.52 |
$ |
6.90 |
$ |
4.96 |
||||||
|
mmbtu per month | 430,000 | 1,110,000 | 767,053 | December 2017 | ||||||||
Basis swaps |
Contract differential |
$ |
(0.65 |
) |
$ |
(0.03 |
) |
$ |
(0.31 |
) |
|||
|
mmbtu per month | 320,000 | 850,000 | 484,615 | March 2016 | ||||||||
Natural gas liquids swaps |
Exercise price |
$ |
6.72 |
$ |
97.13 |
$ |
33.81 |
||||||
|
Barrels per month | 2,000 | 144,973 | 55,616 | December 2017 | ||||||||
The Company recognized a net loss on derivative instruments of $11.4 million and a net gain on derivative instruments of $7.7 million for the three months ended March 31, 2013 and 2012, respectively. Net gains and losses on derivative instruments are reported in other income (expense) on the statements of operations.
6. Long-Term Debt
Jones Energy entered into a Senior Secured Revolving Credit Facility (the "Revolver"), dated December 31, 2009, with Wells Fargo Bank, N.A. The Revolver had a first lien, maximum available credit amount of $360.0 million and a borrowing base of $150.0 million. Jones Energy entered into a Second Lien Term Loan (the "Term Loan") with Wells Fargo Energy Capital, Inc. The Term Loan had a face amount of $40.0 million. The Company's oil and gas properties are pledged as collateral against these credit agreements. The original maturity date of the Revolver was December 31, 2013, and the original maturity date of the Term Loan was June 30, 2014.
On November 18, 2011, the borrowing base of the Revolver was increased to $400.0 million, and the funded amount of the Term Loan was increased to $120.0 million.
On November 5, 2012, the credit agreements were amended extending the maturity date of the Revolver to November 5, 2017 and the maturity date of the Term loan to May 5, 2018. The borrowing base was decreased to $360.0 million.
On December 20, 2012 the credit agreements were further amended to finance an acquisition of certain oil and gas properties. The borrowing base on the Revolver was increased to $490.0 million and the funded amount of the Term Loan was increased to $160.0 million.
On June 12, 2013 the credit agreements were further amended. The borrowing base on the Revolver was increased to $500.0 million.
For the three months ended March 31, 2013, the average interest rate under the Revolver was 3.24% on an average outstanding balance of $445.8 million. For the same period, the average interest rate on the Term Loan was 9.25% on the outstanding balance of $160.0 million. Total interest and commitment fees under the two facilities for the first quarter of 2013 was $7.3 million.
The Revolver requires a quarterly payment of commitment fees equal to 0.5% on the daily unused amount of the commitment.
F-51
Terms of the Term Loan require the Company to pay interest on the loan every three months with the principal and interest due on the loan maturity date of May 5, 2018. Prepayment of the principal balance is allowed in whole or in part at any time with a premium payment due in certain conditions. Any amounts prepaid may not be re-borrowed.
The Revolver and Term Loans are categorized as Level 3 in the valuation hierarchy as the debt is not publicly traded and no observable market exists to determine the fair value; however, the carrying value of the Revolver and Term Loans approximate fair value, as they are subject to short-term floating interest rates that approximate the rates available to the Company for those periods.
The Revolver and Term Loans include covenants that require, among other things, restrictions on asset sales, distributions to members, and additional indebtedness, and the maintenance of certain financial ratios, including leverage, proven reserves to debt, and current ratio. At March 31, 2013 and December 31, 2012, the Company was in compliance with its financial debt covenants.
7. Commitments and Contingencies
The Company is subject to legal proceedings and claims that arise in the ordinary course of its business. The Company believes that the final disposition of such matters will not have a material adverse effect on its financial position, results of operations, or liquidity.
8. Income Taxes
The provision for income taxes relates solely to the Texas Margin Tax, and consists of the following for the three months ended March 31, 2013 and March 31, 2012:
| |
Three Months Ended March 31, | ||||||
|---|---|---|---|---|---|---|---|
| (in thousands of dollars) |
2012 |
2013 |
|||||
Current |
$ | — | $ | 22 | |||
Deferred |
111 | (23 | ) | ||||
|
$ | 111 | $ | (1 | ) | ||
Deferred tax assets and liabilities are the result of temporary differences between the financial statement carrying values and tax bases of assets and liabilities. The tax effects of significant components of the Company's net deferred tax liabilities as of March 31, 2013 and December 31, 2012 were as follows:
| (in thousands of dollars) |
December 31, 2012 |
March 31, 2013 |
|||||
|---|---|---|---|---|---|---|---|
Unrealized gain on commodity derivatives |
$ | (62 | ) | $ | (2 | ) | |
Other |
1 | 1 | |||||
Net current deferred tax liability |
$ | (61 | ) | $ | (1 | ) | |
Unrealized gain on commodity derivatives |
$ | (79 | ) | $ | (71 | ) | |
Differences in book and tax bases of oil and gas properties |
(1,797 | ) | (1,843 | ) | |||
Net noncurrent deferred tax liability |
$ | (1,876 | ) | $ | (1,914 | ) | |
9. Subsequent Events
On May 7, 2013, the Company entered into a marketing agreement with a company related through common ownership, Monarch Natural Gas, LLC, for the sale to Monarch of natural gas produced from certain properties. In connection with that agreement, Monarch issued to the Company equity interests in Monarch having a deemed value of $15 million. The Company intends to distribute those equity interests to its owners and officers.
F-52
Report of Independent Registered Public Accounting Firm
To the Board of Directors and Stockholders of Jones Energy, Inc.:
In our opinion, the accompanying balance sheet presents fairly, in all material respects, the financial position of Jones Energy, Inc. at March 29, 2013 in conformity with accounting principles generally accepted in the United States of America. The balance sheet is the responsibility of Jones Energy, Inc.'s management. Our responsibility is to express an opinion on the balance sheet based on our audit. We conducted our audit of this statement in accordance with the standards of the Public Company Accounting Oversight Board (United States). Those standards require that we plan and perform the audit to obtain reasonable assurance about whether the balance sheet is free of material misstatement. An audit includes examining, on a test basis, evidence supporting the amounts and disclosures in the balance sheet, assessing the accounting principles used and significant estimates made by management, and evaluating the overall balance sheet presentation. We believe that our audit of the balance sheet provides a reasonable basis for our opinion.
/s/
PricewaterhouseCoopers LLP
Houston,
Texas
March 29, 2013
F-53
Jones Energy, Inc.
Balance Sheet
| (in thousands of dollars) |
March 29, 2013 |
|
|---|---|---|
Assets |
||
Cash |
$10 | |
Total assets |
$10 | |
Stockholders' equity |
||
Common stock, $0.001 par value; authorized 1,000 shares; 1,000 issued and outstanding |
$10 | |
Total stockholders' equity |
$10 | |
See the accompanying notes to the balance sheet.
F-54
1. Nature of Operations
Jones Energy, Inc. (the "Company") was formed on March 25, 2013, pursuant to the laws of the State of Delaware to become a holding company for Jones Energy Holdings, LLC.
2. Summary of Significant Accounting Policies
Basis of Presentation
This balance sheet has been prepared in accordance with accounting principles generally accepted in the United States of America ("GAAP"). Separate Statements of Operations, Changes in Stockholder's Equity and of Cash Flows have not been presented because the Company has had no business transactions or activities to date.
F-55
Report of Independent Registered Public Accounting Firm
To the Board of Directors and Members of Jones Energy Holdings, LLC:
In our opinion, the accompanying statement of revenues and direct operating expenses ("financial statements") present fairly, in all material respects, the revenues and direct operating expenses of certain oil and gas properties ("Acquired Properties") of Chalker Energy Partners III, LLC and Participating Owners for the period from January 1, 2012 through December 19, 2012 in conformity with accounting principles generally accepted in the United States of America, using the basis of presentation described in Note 1. These financial statements are the responsibility of Jones Energy Holdings, LLC's management. Our responsibility is to express an opinion on the financial statements based on our audit. We conducted our audit of these financial statements in accordance with the standards of the Public Company Accounting Oversight Board (United States). Those standards require that we plan and perform the audit to obtain reasonable assurance about whether the financial statements are free of material misstatement. An audit includes examining, on a test basis, evidence supporting the amounts and disclosures in the financial statements, assessing the accounting principles used and significant estimates made by management, and evaluating the overall financial statement presentation. We believe that our audit provides a reasonable basis for our opinion.
The accompanying financial statements reflect the revenues and direct operating expenses of the Acquired Properties using the basis of presentation described in Note 1 and are not intended to be a complete presentation of the financial position, results of operations, or cash flows of the Acquired Properties.
/s/ PricewaterhouseCoopers LLP
Houston,
Texas
March 20, 2013
F-56
Chalker Energy Partners III, LLC and Participating Owners
Statement of revenues and direct operating expenses of the oil and gas properties purchased by Jones Energy Holdings, LLC from Chalker Energy
Partners III, LLC and participating owners
Period from January 1, 2012 to December 19, 2012
| (in thousands of dollars) |
2012 |
|||
|---|---|---|---|---|
Operating revenues |
$ | 44,871 | ||
Direct operating expenses |
||||
Lease operating |
1,575 | |||
Production taxes |
2,330 | |||
Total operating expenses |
3,905 | |||
Revenues in excess of direct operating expenses |
$ | 40,966 | ||
See accompanying notes to Statement of Revenues and Direct Operating Expenses.
F-57
Chalker Energy Partners III, LLC and participating owners
Notes to statement of revenues and direct operating expenses
1. Basis of presentation
On December 20, 2012, Jones Energy Holdings, LLC ("Jones") acquired from Chalker Energy Partners III, LLC ("Chalker") and Participating Owners an asset package consisting of certain oil and gas properties and related facilities located in the Texas Panhandle (the "Properties") as defined in the November 28, 2012 Purchase and Sale Agreement between Jones and Chalker for approximately $252 million, subject to customary closing adjustments. The accompanying Statement of Revenues and Direct Operating Expenses (the "Statement") relates to the operations of the oil and gas properties acquired by Jones.
The Statement associated with the Properties was derived from Chalker accounting records. During the period presented, the Properties were not accounted for or operated as a consolidated entity or as a separate division by Chalker. Revenues and direct operating expenses for the Properties included in the accompanying Statement represented herein relate only to the interests in the producing oil and natural gas properties which were acquired by Jones and do not represent all of the oil and natural gas operations of Chalker, other owners, or other third party working interest owners. Revenues are reported net of transportation costs. Direct operating expenses include lease operating expenses and production taxes. Indirect general and administrative expenses, depreciation, depletion, and amortization of oil and gas properties and federal and state income taxes have been excluded from direct operating expenses in the accompanying Statement because the allocation of such expenses would be arbitrary and would not be indicative of what such costs would have been had the Properties been operated as a stand-alone entity. Also, omitted amounts are not known or readily available. Full separate financial statements, including a statement of financial position, results of operations, owners' equity and cash flows, prepared in accordance with accounting principles generally accepted in the United States of America do not exist for the Properties and are not practicable to prepare in these circumstances. Accordingly, the historical Statement of the Properties is presented in lieu of the financial statements required under Rule 3-05 of the U.S. Securities and Exchange Commission ("SEC") Regulation S-X.
The Statement is not indicative of the results of operations of the Properties on a go forward basis due to changes in the business and the omission of various expenses as described above.
2. Summary of significant accounting policies
Revenue recognition
Revenues from the sale of crude oil, natural gas, and natural gas liquids are recognized when the product is delivered at a fixed or determinable price, title has transferred, and collectability is reasonably assured and evidenced by a contract. The oil, natural gas, and natural gas liquids revenues recognized for the Properties follow the "sales method" of accounting, so revenues are recognized on all crude oil, natural gas, and natural gas liquids sold to purchasers, regardless of whether the sales are proportionate to its ownership in the property. A receivable or liability is recognized only to the extent that there is an imbalance on a specific property greater than the expected remaining proved reserves.
The revenues for the Properties come from a portfolio of crude oil and natural gas marketing contracts with large, established refiners and utilities. During 2012, the largest purchasers were Valero Marketing and Supply Company and PVR Midstream LLC, which accounted for approximately 78% and 21% of consolidated oil and gas sales, respectively.
F-58
Direct operating expenses
Production costs, including compressor rental, pumpers' salaries, saltwater disposal, ad valorem taxes, insurance, repairs and maintenance and other operating expenses are expensed as incurred and included in lease operating expense on the Statement. Production taxes are paid on oil and natural gas production based on the applicable rate in the area of operation.
Use of estimates
The preparation of the statement of revenues and direct operating expenses in conformity with accounting principles generally accepted in the United States of America requires the use of estimates and assumptions that affect the reported amounts of revenues and direct operating expenses during the reporting period. Actual results may differ from those estimates.
3. Subsequent events
Management of Jones Energy has evaluated events subsequent from December 19, 2012 through the date of issuance of the statement of revenues and direct operating expenses on March 20, 2013.
F-59
Supplemental information on oil and gas producing activities
(Unaudited)
Reserves
Users of this information should be aware that the process of estimating quantities of proved and proved developed oil and gas reserves (including natural gas liquids) is very complex, requiring significant subjective decisions in the evaluation of all available geological, engineering and economic data for each reservoir. The data for a given reservoir also may change substantially over time as a result of numerous factors, including additional development activity, evolving production history and continual reassessment of the viability of production under varying economic conditions. Consequently, material revisions to existing reserve estimates may occur from time to time.
The following tables set forth total proved reserves and the changes in total proved reserves. The 2012 reserve estimates are based on a report prepared by Cawley, Gillespie & Associates, Inc. ("CG&A"), independent petroleum engineers, utilizing data compiled by us. In preparing its report, CG&A evaluated all of the proved reserves of the Properties at December 31, 2012. The reserves for the prior year were computed using 2012 production and new discovery quantities and valuations. There are many uncertainties inherent in estimating proved reserve quantities, and projecting future production rates and the timing of future development expenditures. In addition, reserve estimates of new discoveries are more imprecise than those of properties with production history. Accordingly, these estimates are subject to change as additional information becomes available. Proved reserves are the estimated quantities of natural gas, natural gas liquids and oil that geoscience and engineering data demonstrate with reasonable certainty to be economically producible in future years from known oil and natural gas reservoirs under existing economic conditions, operating methods and government regulations at the end of the respective years. Proved developed reserves are those reserves expected to be recovered through existing wells with existing equipment and operating methods.
F-60
| Estimated proved reserves |
Crude oil (MBbls) |
NGL (MBbls) |
Natural gas (MMcf) |
Total in MMcfe(1) |
|||||||||
|---|---|---|---|---|---|---|---|---|---|---|---|---|---|
December 31, 2011 |
2,239 | 1,967 | 12,648 | 37,884 | |||||||||
Extensions and discoveries |
3,995 | 3,826 | 24,263 | 71,189 | |||||||||
Production |
(418 | ) | (208 | ) | (1,422 | ) | (5,178 | ) | |||||
December 31, 2012 |
5,816 | 5,585 | 35,489 | 103,895 | |||||||||
Estimated proved reserves |
|||||||||||||
December 31, 2012 |
|||||||||||||
Proved developed |
1,885 | 1,659 | 10,672 | 31,936 | |||||||||
Proved undeveloped |
3,931 | 3,926 | 24,817 | 71,959 | |||||||||
|
5,816 | 5,585 | 35,489 | 103,895 | |||||||||
(1) Millions of cubic feet equivalent determined using the ratio of six Mcf of natural gas to one Bbl of crude oil or natural gas liquids.
Standardized measure of discounted future net cash flows relating to proved oil and gas reserves
The following information was developed utilizing procedures prescribed by FASB Accounting Standards Codification Topic 932, Extractive Industries—Oil and Gas (Topic 932). The "standardized measure of discounted future net cash flows" should not be viewed as representative of the current value of our proved oil and gas reserves. It and the other information contained in the following tables may be useful for certain comparative purposes, but should not be solely relied upon in evaluation performance.
In reviewing the information that follows, the following factors should be taken into account:
- •
- future costs and sales prices will probably differ from those required to be used in these calculations;
- •
- actual production rates for future periods may vary significantly from the rates assumed in the calculations;
- •
- a 10% discount rate may not be reasonable relative to risk inherent in realizing future net oil and natural gas revenues.
Under the standardized measure, future cash inflows were estimated by using the average of the historical unweighted first-day-of-the-month prices of oil and natural gas for the period ended December 31, 2012. Future cash inflows were reduced by estimated future development and production costs based on year-end costs in order to arrive at net cash flows. Use of a 10% discount rate and year-end prices and costs are required by ASC 932.
F-61
The standardized measure of discounted future net cash flows from estimated proved oil and natural gas reserves is as follows:
| (in thousands) |
2012 |
|||
|---|---|---|---|---|
Future cash inflows |
$ | 799,584 | ||
Less related future: |
||||
Production costs |
(185,198 | ) | ||
Development costs |
(135,151 | ) | ||
Future net cash flows |
479,235 | |||
10% annual discount for estimated timing of cash flows |
(209,989 | ) | ||
Standardized measure of discounted future net cash flows |
$ | 269,246 | ||
A summary of the changes in standardized measure of discounted future net cash flows applicable to proved natural gas and crude oil reserves is as follows:
| (in thousands) |
2012 |
|||
|---|---|---|---|---|
Balance, beginning of period |
$ | 93,525 | ||
Net change in sales and transfer prices, net of production expenses |
31,297 | |||
Changes in estimated future development costs |
(1,804 | ) | ||
Sales and transfers of oil and gas produced during the period |
(42,846 | ) | ||
Net change due to extensions and discoveries |
174,836 | |||
Previously estimated development costs incurred during the period |
4,885 | |||
Accretion of discount |
9,353 | |||
Balance, end of period |
$ | 269,246 | ||
F-62
Glossary of oil and natural gas terms
The terms defined in this section are used throughout this prospectus:
"AMI" Area of mutual interest, typically referring to a contractually defined area under a joint development agreement whereby parties are subject to mutual participatory rights and restrictions.
"Basin"—A large natural depression on the earth's surface in which sediments generally brought by water accumulate.
"Bbl"—One stock tank barrel, of 42 U.S. gallons liquid volume, used herein in reference to crude oil, condensate or NGLs.
"Boe"—Barrels of oil equivalent, with 6,000 cubic feet of natural gas being equivalent to one barrel of oil.
"Boe/d"—Barrels of oil equivalent per day.
"British thermal unit (BTU)"—The heat required to raise the temperature of one pound of water by one degree Fahrenheit.
"Completion"—The process of treating a drilled well followed by the installation of permanent equipment for the production of oil or natural gas, or in the case of a dry hole, the reporting of abandonment to the appropriate agency.
"Condensate"—Liquid hydrocarbons associated with the production of a primarily natural gas reserve.
"Developed acreage"—The number of acres that are allocated or assignable to productive wells or wells capable of production.
"Developed reserves"—Reserves of any category that can be expected to be recovered (i) through existing wells with existing equipment and operating methods or in which the cost of the required equipment is relatively minor when compared to the cost of a new well; and (ii) through installed extraction equipment and infrastructure operational at the time of the reserves estimate if the extraction is by means not involving a well.
"Development well"—A well drilled within the proved area of a natural gas or oil reservoir to the depth of a stratigraphic horizon known to be productive.
"Dry hole"—A well found to be incapable of producing hydrocarbons in sufficient quantities such that proceeds from the sale of such production do not exceed production expenses and taxes.
"Economically producible"—A resource which generates revenue that exceeds, or is reasonably expected to exceed, the costs of the operation.
"Exploratory well"—A well drilled to find and produce oil or natural gas reserves not classified as proved, to find a new reservoir in a field previously found to be productive of oil or natural gas in another reservoir or to extend a known reservoir.
"Farm-in or farm-out"—An agreement under which the owner of a working interest in an oil or natural gas lease assigns the working interest or a portion of the working interest to another party who desires to drill on the leased acreage. Generally, the assignee is required to drill one or more wells in order to earn its interest in the acreage. The assignor usually retains a royalty or reversionary interest in the lease. The interests received by an assignee is a "farm-in" while the interest transferred by the assignor is a "farm-out."
A-1
"Field"—An area consisting of a single reservoir or multiple reservoirs all grouped on, or related to, the same individual geological structural feature or stratigraphic condition.
"Formation"—A layer of rock which has distinct characteristics that differ from nearby rock.
"Fracture stimulation"—A process whereby fluids mixed with proppants are injected into a wellbore under pressure in order to fracture, or crack open, reservoir rock, thereby allowing oil and/or natural gas trapped in the reservoir rock to travel through the fractures and into the well for production.
"Gross acres or gross wells"—The total acres or well, as the case may be, in which a working interest is owned.
"Horizontal drilling"—A drilling technique used in certain formations where a well is drilled vertically to a certain depth and then drilled at a right angle within a specified interval.
"Joint development agreement"—Includes joint venture agreements, farm-in and farm-out agreements, joint operating agreements and similar partnering arrangements.
"MBbl"—One thousand barrels of oil, condensate or NGLs.
"MBoe"—One thousand barrels of oil equivalent, determined using the equivalent of six Mcf of natural gas to one Bbl of crude oil.
"Mcf"—One thousand cubic feet of natural gas.
"MMBoe"—One million barrels of oil equivalent.
"MMBtu"—One million British thermal units.
"MMcf"—One million cubic feet of natural gas.
"Net acres or net wells"—The sum of the fractional working interest owned in gross acres or gross wells. An owner who has 50% interest in 100 acres owns 50 net acres.
"Net revenue interest"—An owner's interest in the revenues of a well after deducting proceeds allocated to royalty and overriding interests.
"Possible reserves"—Additional reserves that are less certain to be recognized than probable reserves.
"Probable reserves"—Additional reserves that are less certain to be recognized than proved reserves but which, in sum with proved reserves, are as likely as not to be recovered.
"Productive well"—A well that is found to be capable of producing hydrocarbons in sufficient quantities such that proceeds from the sale of the production exceed production expenses and taxes.
"Prospect"—A specific geographic area which, based on supporting geological, geophysical or other data and also preliminary economic analysis using reasonably anticipated prices and costs, is considered to have potential for the discovery of commercial hydrocarbons.
"Proved developed non-producing"—Hydrocarbons in a potentially producing horizon penetrated by a wellbore, the production of which has been postponed pending installation of surface equipment or gathering facilities, or pending the production of hydrocarbons from another formation penetrated by the wellbore. The hydrocarbons are classified as proved but non-producing reserves.
"Proved developed reserves"—Proved reserves that can be expected to be recovered through existing wells and facilities and by existing operating methods.
A-2
"Proved reserves"—Reserves of oil and natural gas that have been proved to a high degree of certainty by analysis of the producing history of a reservoir and/or by volumetric analysis of adequate geological and engineering data.
"Proved undeveloped reserves (PUD)"—Proved reserves that are expected to be recovered from new wells on undrilled acreage or from existing wells where a relatively major expenditure is required for recompletion.
"Recompletion"—The process of re-entering an existing wellbore that is either producing or not producing and completing new reservoirs in an attempt to establish or increase existing production.
"Reserves"—Estimated remaining quantities of oil and natural gas and related substances anticipated to be economically producible as of a given date by application of development projects to known accumulations.
"Reservoir"—A porous and permeable underground formation containing a natural accumulation of producible oil and/or natural gas that is confined by impermeable rock or water barriers and is individual and separate from other reservoirs.
"Royalty interest"—An interest in an oil and natural gas property entitling the owner to a share of oil or gas production free of production costs.
"Spacing"—The distance between wells producing from the same reservoir. Spacing is often expressed in terms of acres, e.g., 40-acre spacing, and is often established by regulatory agencies.
"Spud"—The commencement of drilling operations of a new well.
"Standardized measure of discounted future net cash flows"—The present value of estimated future net revenues to be generated from the production of proved reserves, determined in accordance with the regulations of the Securities and Exchange Commission, without giving effect to non-property related expenses such as general and administrative expenses, debt service, future income tax expenses or depreciation, depletion and amortization; discounted using an annual discount rate of 10%.
"Trend"—A region of oil and/or natural gas production, the geographic limits of which have not been fully defined, having geological characteristics that have been ascertained through supporting geological, geophysical or other data to contain the potential for oil and/or natural gas reserves in a particular formation or series of formations.
"Unconventional formation"—A term used in the oil and natural gas industry to refer to a formation in which the targeted reservoirs generally fall into one of three categories: (1) tight sands, (2) coal beds, or (3) oil and gas shales. The reservoirs tend to cover large areas and lack the readily apparent traps, seals and discrete hydrocarbon-water boundaries that typically define conventional reservoirs. These reservoirs generally require fracture stimulation treatments or other special recovery processes in order to produce economic flow rates
"Undeveloped acreage"—Lease acreage on which wells have not been drilled or completed to a point that would permit the production of commercial quantities of oil and natural gas, regardless of whether such acreage contains proved reserves.
"Wellbore"—The hole drilled by the bit that is equipped for oil or gas production on a completed well. Also called well or borehole.
"Working interest"—The right granted to the lessee of a property to explore for and to produce and own oil, gas, or other minerals and receive a share of the production. The working interest owners bear the exploration, development, and operating costs of the property.
A-3
14,000,000 shares
Jones Energy, Inc.
Class A common stock
Prospectus
J.P. Morgan
Barclays
Wells Fargo Securities
| Jefferies | Tudor, Pickering, Holt & Co. | Citigroup |
Capital One Southcoast |
Credit Agricole CIB |
Mitsubishi UFJ Securities |
||
Morgan Stanley |
Stifel |
SunTrust Robinson Humphrey |
, 2013
You should rely only on the information contained in this prospectus. We have not authorized anyone to provide you with information different from that contained in this prospectus. We are offering to sell, and seeking offers to buy, Class A common stock only in jurisdictions where offers and sales are permitted. The information contained in this prospectus is accurate only as of the date of this prospectus, regardless of the time of delivery of this prospectus or of any sale of our Class A common stock.
No action is being taken in any jurisdiction outside the United States to permit a public offering of the Class A common stock or possession or distribution of this prospectus in that jurisdiction. Persons who come into possession of this prospectus in jurisdictions outside the United States are required to inform themselves about and to observe any restrictions as to this offering and the distribution of the prospectus applicable to that jurisdiction.
Through and including , 2013 (the 25th day after the date of this prospectus), all dealers that effect transactions in these securities, whether or not participating in this offering, may be required to deliver a prospectus. This is in addition to the dealers' obligation to deliver a prospectus when acting as an underwriter and with respect to their unsold allotments or subscriptions.
Part II
Information not required in prospectus
Item 13. Other expenses of issuance and distribution
Set forth below are the expenses (other than underwriting discounts) expected to be incurred in connection with the issuance and distribution of the securities registered hereby. With the exception of the SEC registration fee, the FINRA filing fee and the NYSE listing fee, the amounts set forth below are estimates.
SEC registration fee |
$ | 41,725 | ||
FINRA filing fee |
$ | 38,000 | ||
NYSE listing fee |
$ | 125,000 | ||
Printing and engraving expenses |
$ | 400,000 | ||
Fees and expenses of legal counsel |
$ | 1,800,000 | ||
Accounting fees and expenses |
$ | 1,500,000 | ||
Transfer agent and registrar fees |
$ | 4,000 | ||
Miscellaneous |
$ | 91,275 | ||
Total |
$ | 4,000,000 | ||
* To be filed by amendment.
Item 14. Indemnification of directors and officers
Section 145(a) of the DGCL provides, in general, that a corporation may indemnify any person who was or is a party or is threatened to be made a party to any threatened, pending, or completed action, suit, or proceeding, whether civil, criminal, administrative, or investigative (other than an action by or in the right of the corporation), because he or she is or was a director, officer, employee, or agent of the corporation, or is or was serving at the request of the corporation as a director, officer, employee, or agent of another corporation, partnership, joint venture, trust, or other enterprise, against expenses (including attorneys' fees), judgments, fines, and amounts paid in settlement actually and reasonably incurred by the person in connection with such action, suit, or proceeding, if he or she acted in good faith and in a manner he or she reasonably believed to be in or not opposed to the best interests of the corporation and, with respect to any criminal action or proceeding, had no reasonable cause to believe his or her conduct was unlawful.
Section 145(b) of the DGCL provides, in general, that a corporation may indemnify any person who was or is a party or is threatened to be made a party to any threatened, pending, or completed action or suit by or in the right of the corporation to procure a judgment in its favor because the person is or was a director, officer, employee, or agent of the corporation, or is or was serving at the request of the corporation as a director, officer, employee, or agent of another corporation, partnership, joint venture, trust, or other enterprise, against expenses (including attorneys' fees) actually and reasonably incurred by the person in connection with the defense or settlement of such action or suit if he or she acted in good faith and in a manner he or she reasonably believed to be in or not opposed to the best interests of the corporation, except that no indemnification shall be made with respect to any claim, issue, or matter as to which he or she shall have been adjudged to be liable to the corporation unless and only to the extent that the Court of Chancery or other adjudicating court determines that, despite the adjudication of liability but in view of all of the circumstances of the case, he or she is fairly and reasonably entitled to indemnity for such expenses which the Court of Chancery or other adjudicating court shall deem proper.
Section 145(e) of the DGCL provides that expenses (including attorneys' fees) incurred by an officer or director in defending any civil, criminal, administrative or investigative action, suit or proceeding may be paid by the corporation in advance of the final disposition of such action, suit or proceeding upon receipt
II-1
of an undertaking by or on behalf of such director or officer to repay such amount if it shall ultimately be determined that such person is not entitled to be indemnified by the corporation as authorized by Section 145 of the DGCL Law. Section 145(e) of the DGCL further provides that such expenses (including attorneys' fees) incurred by former directors and officers or other employees or agents of the corporation may be so paid upon such terms and conditions as the corporation deems appropriate.
Section 145(g) of the DGCL provides, in general, that a corporation may purchase and maintain insurance on behalf of any person who is or was a director, officer, employee, or agent of the corporation, or is or was serving at the request of the corporation as a director, officer, employee, or agent of another corporation, partnership, joint venture, trust or other enterprise against any liability asserted against such person and incurred by such person in any such capacity, or arising out of his or her status as such, whether or not the corporation would have the power to indemnify the person against such liability under Section 145 of the DGCL.
Our amended and restated bylaws that will be in effect upon the closing of this offering will provide that we will indemnify and hold harmless, to the fullest extent permitted by the DGCL, any person who was or is made or is threatened to be made a party or is otherwise involved in any threatened, pending or completed action, suit, or proceeding, whether civil, criminal, administrative, or investigative, by reason of the fact that he or she is or was one of our directors or executive officers or, while a director or executive officer, is or was serving at our request as a director or officer of another corporation, partnership, joint venture, trust or other enterprise. Our amended and restated bylaws further provide for the advancement of expenses to each of our executive officers and directors.
Our amended and restated certificate of incorporation that will be in effect upon the closing of this offering will provide that, to the fullest extent permitted by the DGCL, our directors shall not be personally liable to us or our stockholders for monetary damages for breach of fiduciary duty as a director. Under Section 102(b)(7) of the DGCL, the personal liability of a director to the corporation or its stockholders for monetary damages for breach of fiduciary duty can be limited or eliminated except (1) for any breach of the director's duty of loyalty to the corporation or its stockholders; (2) for acts or omissions not in good faith or which involve intentional misconduct or a knowing violation of law; (3) under Section 174 of the DGCL (relating to unlawful payment of dividend or unlawful stock purchase or redemption); or (4) for any transaction from which the director derived an improper personal benefit.
We also intend to maintain a general liability insurance policy which covers certain liabilities of directors and officers of our company arising out of claims based on acts or omissions in their capacities as directors or officers, whether or not we would have the power to indemnify such person against such liability under the DGCL or the provisions of our amended and restated certificate of incorporation.
In connection with the sale of Class A common stock being registered hereby, we intend to enter into indemnification agreements with each of our directors and our executive officers. These agreements will provide that we will indemnify each of our directors and such officers to the fullest extent permitted by law and by our amended and restated certificate of incorporation or amended and restated bylaws.
In any underwriting agreement we enter into in connection with the sale of Class A common stock being registered hereby, the underwriters will agree to indemnify, under certain conditions, us, our directors, our officers and persons who control us, within the meaning of the Securities Act, against certain liabilities.
Item 15. Recent sales of unregistered securities
On March 25, 2013, Jones Energy, Inc. issued 1,000 shares of common stock, par value $0.001 per share, to Jones Class B Holdings, LLC for $10,000. These shares are now held by Jones Energy Holdings, LLC
II-2
following a merger of Jones Class B Holdings, LLC with and into Jones Energy Holdings, LLC. The issuance of such shares of common stock was not registered under the Securities Act, because the shares were offered and sold in a transaction exempt from registration under Section 4(2) of the Securities Act.
Item 16. Exhibits and financial statement schedules
The following documents are filed as exhibits to this registration statement:
| Number |
|
Description |
||
|---|---|---|---|---|
| 1.1** | — | Form of Underwriting Agreement (including Form of Lock-Up Agreement) | ||
| 3.1** | — | Form of Amended and Restated Certificate of Incorporation of Jones Energy, Inc. | ||
| 3.2** | — | Form of Amended and Restated Bylaws of Jones Energy, Inc. | ||
| 4.1** | — | Form of Registration Rights and Stockholders Agreement | ||
| 4.2** | — | Form of Class A common stock Certificate | ||
| 5.1 | — | Opinion of Baker Botts L.L.P. as to the legality of the securities being registered | ||
| 10.1** | — | Form of Jones Energy, Inc. 2013 Omnibus Incentive Plan | ||
| 10.2** | — | Form of Jones Energy, Inc. Short Term Incentive Plan | ||
| 10.3** | — | Form of Tax Receivable Agreement | ||
| 10.4** | — | Form of Exchange Agreement | ||
| 10.5** | — | Form of Indemnification Agreement | ||
| 10.6** | — | Asset Purchase and Sale Agreement by and between Jones Energy Holdings, LLC and Southridge Energy, LLC, dated as of April 12, 2011 | ||
| 10.7** | — | Purchase and Sale Agreement by and between Chalker Energy Partners II, LLC, the listed participating owners and Jones Energy Holdings, LLC, dated November 28, 2012 | ||
| 10.8** | — | Jones Energy Holdings, LLC Monarch Equity Plan | ||
| 10.9** | — | Credit Agreement, dated as of December 31, 2009, among Jones Energy Holdings, LLC, as borrower, Wells Fargo Bank N.A., as administrative agent, and the lenders party thereto | ||
| 10.10** | — | Agreement and Amendment No. 1 to Credit Agreement (First Lien) | ||
| 10.11** | — | Master Assignment, Agreement and Amendment No. 2 to Credit Agreement | ||
| 10.12** | — | Master Assignment, Agreement and Amendment No. 3 to Credit Agreement | ||
| 10.13** | — | Agreement and Amendment No. 4 to Credit Agreement (First Lien) | ||
| 10.14** | — | Master Assignment, Agreement and Amendment No. 5 to Credit Agreement | ||
| 10.15** | — | Waiver and Amendment No. 6 to Credit Agreement | ||
| 10.16** | — | Second Lien Credit Agreement, dated as of December 31, 2009, among Jones Energy Holdings, LLC, as borrower, Wells Fargo Energy Capital, Inc., as administrative agent, and the lenders party thereto | ||
| 10.17** | — | Agreement and Amendment No. 1 to Second Lien Credit Agreement | ||
| 10.18** | — | Agreement and Amendment No. 2 to Second Lien Credit Agreement | ||
| 10.19** | — | Agreement and Amendment No. 3 to Second Lien Credit Agreement | ||
| 10.20** | — | Agreement and Amendment No. 4 to Second Lien Credit Agreement | ||
| 10.21** | — | Agreement and Amendment No. 5 to Second Lien Credit Agreement | ||
| 10.22** | — | Waiver and Amendment No. 6 to Second Lien Credit Agreement | ||
| 10.23** | — | Form of Jones Energy Holdings, LLC Third Amended and Restated Limited Liability Company Agreement | ||
| 10.24** | — | Waiver, Agreement and Amendment No. 7 to Credit Agreement and Amendment to Guarantee and Collateral Agreement | ||
| 10.25** | — | Waiver, Agreement and Amendment No. 7 to Second Lien Credit Agreement | ||
| 10.26** | — | Form of Restructuring Agreement | ||
| 10.27** | — | Form of Monarch Equity Award Agreement | ||
II-3
| Number |
|
Description |
||
|---|---|---|---|---|
| 21.1** | — | List of Subsidiaries of Jones Energy, Inc. | ||
| 23.1 | — | Consent of PricewaterhouseCoopers LLP | ||
| 23.2** | — | Consent of Cawley Gillespie & Associates, Inc. | ||
| 23.3 | — | Consent of Baker Botts L.L.P. (contained in Exhibit 5.1) | ||
| 24.1** | — | Powers of Attorney (contained on the signature page to this Registration Statement) | ||
| 99.1** | — | Summary Report of Cawley Gillespie & Associates, Inc. for reserves as of December 31, 2012 | ||
| 99.2** | — | Summary Report of Cawley Gillespie & Associates, Inc. for reserves as of December 31, 2011 | ||
| 99.3** | — | Summary Report of Cawley Gillespie & Associates, Inc. for reserves as of December 31, 2010 | ||
| 99.4** | — | Consent of Alan D. Bell, a director nominee | ||
* To be filed by amendment
** Previously filed
The undersigned registrant hereby undertakes to provide to the underwriters at the closing specified in the underwriting agreement certificates in such denominations and registered in such names as required by the underwriters to permit prompt delivery to each purchaser.
Insofar as indemnification for liabilities arising under the Securities Act may be permitted to directors, officers and controlling persons of the registrant pursuant to the foregoing provisions, or otherwise, the registrant has been advised that in the opinion of the Securities and Exchange Commission such indemnification is against public policy as expressed in the Securities Act and is, therefore, unenforceable. In the event that a claim for indemnification against such liabilities (other than the payment by the registrant of expenses incurred or paid by a director, officer or controlling person of the registrant in the successful defense of any action, suit or proceeding) is asserted by such director, officer or controlling person in connection with the securities being registered, the registrant will, unless in the opinion of its counsel the matter has been settled by controlling precedent, submit to a court of appropriate jurisdiction the question whether such indemnification by it is against public policy as expressed in the Securities Act and will be governed by the final adjudication of such issue.
The undersigned registrant hereby undertakes that, for the purpose of determining liability of the registrant under the Securities Act to any purchaser in the initial distribution of the securities, in a primary offering of securities of the undersigned registrant pursuant to this registration statement, regardless of the underwriting method used to sell the securities to the purchaser, if the securities are offered or sold to such purchaser by means of any of the following communications, the undersigned registrant will be a seller to the purchaser and will be considered to offer or sell such securities to such purchaser:
(i) Any preliminary prospectus or prospectus of the undersigned registrant relating to this offering required to be filed pursuant to Rule 424;
(ii) Any free writing prospectus relating to this offering prepared by or on behalf of the undersigned registrant or used or referred to by the undersigned registrant;
(iii) The portion of any other free writing prospectus relating to this offering containing material information about the undersigned registrant or its securities provided by or on behalf of the undersigned registrant; and
(iv) Any other communication that is an offer in this offering made by the undersigned registrant to the purchaser.
II-4
The undersigned registrant hereby undertakes that:
(1) For purposes of determining any liability under the Securities Act, the information omitted from the form of prospectus filed as part of this registration statement in reliance upon Rule 430A and contained in a form of prospectus filed by the registrant pursuant to Rule 424(b)(1) or (4) or 497(h) under the Securities Act shall be deemed to be part of this registration statement as of the time it was declared effective.
(2) For the purpose of determining any liability under the Securities Act, each post-effective amendment that contains a form of prospectus shall be deemed to be a new registration statement relating to the securities offered therein, and the offering of such securities at that time shall be deemed to be the initial bona fide offering thereof.
The registrant undertakes to provide to the common unitholders the financial statements required by Form 10-K for the first full fiscal year of operations of the registrant.
II-5
Pursuant to the requirements of the Securities Act of 1933, as amended, the registrant has duly caused this Registration Statement to be signed on its behalf by the undersigned, thereunto duly authorized, in the City of Austin, State of Texas, on July 11, 2013.
| Jones Energy, Inc. | ||||
By: |
/s/ JONNY JONES |
|||
| Jonny Jones Chief Executive Officer |
||||
Pursuant to the requirements of the Securities Act of 1933, as amended, this Registration Statement has been signed by the following persons in the capacities and the dates indicated.
| Name |
Title |
Date |
||
|---|---|---|---|---|
| /s/ JONNY JONES Jonny Jones |
Chairman of the Board and Chief Executive Officer (Principal Executive Officer) | July 11, 2013 | ||
* Mike S. McConnell |
Director and President |
July 11, 2013 |
||
* Robert J. Brooks |
Executive Vice President and Chief Financial Officer (Principal Accounting and Financial Officer) |
July 11, 2013 |
||
* Howard I. Hoffen |
Director |
July 11, 2013 |
||
* Gregory D. Myers |
Director |
July 11, 2013 |
||
| *By: | /s/ JONNY JONES |
|||
| Jonny Jones Attorney-in-fact |
II-6