Attached files
| file | filename |
|---|---|
| 8-K - 8-K CURRENT REPORT - MSC INDUSTRIAL DIRECT CO INC | v349733_8k.htm |
| EX-99.1 - EXHIBIT 99.1 - MSC INDUSTRIAL DIRECT CO INC | v349733_ex99-1.htm |
Exhibit 99.2

1 Fiscal 3Q’13 Earnings Presentation July 10, 2013

2 Risks and Non - GAAP Disclosures This presentation contains forward - looking statements within the meaning of U.S. securities laws, including guidance about expected future results, expectations regarding our ability to gain market share and expected benefits from our investment and strategic plans, including the Barnes Distribution North America acquisition. These forward - looking statements involve risks and uncertainties that could cause actual results to differ materially from those anticipated by these statements; are based on our current expectations; and we assume no obligation to update them. These risks include the Company’s ability to timely and efficiently integrate its recent acquisition of the business of Barnes Distribution North America (“BDNA”) and rea liz e the anticipated synergies from the transaction ; current economic, political, and social conditions; general economic conditions in the markets in which the Company operates ; changing customer and product mixes ; competition; industry consolidation and other changes in the industrial distribution sector ; volatility in commodity and energy prices ; the outcome of potential government or regulatory proceedings or future litigation ; credit risk of our customers ; risk of cancellation or rescheduling of customer orders ; work stoppages or other business interruptions (including those due to extreme weather conditions) at transportation centers or shipping ports ; risk of loss of key suppliers, key brands or supply chain disruptions ; dependence on our information systems ; retention of key personnel; and risk of delays in opening or expanding our customer fulfillment centers or customer service centers. Information about these risks is noted in the earnings press release and in the Risk Factors and MD&A sections of our latest annual and quarterly reports filed with the SEC, as well as in our other SEC filings. Investors are cautioned not to place un due reliance on these forward - looking statements . Throughout this conference call we will reference both GAAP and adjusted financial results, which are non - GAAP financial measures. Please refer to the reconciliation tables at the end of this presentation for a reconciliation of the adjusted financial measures to the most directly comparable GAAP measures. 2

3 Glossary 3 ▪ Reported Results – results as reported using U.S. Generally Accepted Accounting Principles (US GAAP). ▪ Adjusted Results – exclude non - recurring relocation costs associated with our Davidson facility, as well as the non - recurring transaction and integration costs associated with the BDNA acquisition. ▪ Comparable Adjusted Results – exclude the BDNA operating results and non - recurring relocation costs associated with our Davidson facility, as well as the non - recurring transaction and integration costs associated with the BDNA acquisition.

4 BDNA - Related Guidance Reaffirmed ▪ $15 million - $20 million run - rate cost synergies by FY15 ▪ EPS contribution for FY13 slightly better than expected ▪ $0.15 - $0.20 EPS accretion in FY14 ▪ $0.30 - $0.40 EPS accretion in FY15 ▪ >$100 million NPV of cash tax benefits ▪ $25 million - $30 million in total integration and non - recurring transaction costs of which $7.6 million have been incurred through the end of FQ3’13 4

5 F3Q’13 Guidance Comparison 3Q 2013 Guidance Comparable Adjusted 3Q 2013 Results (1) Variance (from midpoint) Sales $597M - $609M $602M - $1M Gross Margin 44.7% - 45.1% 45.0% + 10 bps Adjusted EPS $0.95 - $0.99 $1.03 + $0.06 Adjusted Operating Expenses $171M $167M - $4M Tax Rate 38.2% 37.1% - 110 bps 5 (1) Previously provided guidance for F3Q 2013 excluded the BDNA operating results, non - recurring relocation costs associated with ou r Davidson facility, as well as the non - recurring transaction and integration costs associated with the BDNA acquisition. The Comp arable Adjusted F3Q 2013 financial results are on the same basis. Reconciliations are provided on slides 9 - 13.

6 F3Q’13 EPS Walk (1) 6 (1) Previously provided guidance for F3Q 2013 excluded the BDNA operating results, non - recurring relocation costs associated with ou r Davidson facility, as well as the non - recurring transaction and integration costs associated with the BDNA acquisition. The Comp arable Adjusted F3Q 2013 financial results are on the same basis. Reconciliations are provided on slides 9 - 13.

7 F4Q’13 Guidance Sales $661M – $673M Gross Margin 45.0% +/ - 20 bps Adjusted EPS $0.87 – $0.91 Tax Rate 37.5% Assumptions: • Includes BDNA operating results at neutral impact to EPS • Excludes non - recurring transaction and integration costs associated with the BDNA acquisition and relocation costs associated with our Davidson facility. Each is expected to have a $0.03 impact to GAAP diluted EPS • FQ4’13 has 4 less selling days than FQ4’12, virtually one week given the 4 th of July Holiday falls on a Thursday in FY’13 7

8 Adjusted F4Q’13 EPS Guidance Walk (1) 8 (1) Adjusted results exclude non - recurring relocation costs associated with our Davidson facility, as well as the non - recurring tran saction and integration costs associated with the BDNA acquisition. The impact of the extra week, pricing impact, and other items are app rox imate and do not conform to GAAP accounting standards.

9 Reconciliations 9 Non - GAAP Financial Measures To supplement MSC’s unaudited selected financial data presented on a basis consistent with Generally Accepted Accounting Prin cip les (“GAAP”), the Company discloses certain non - GAAP financial measures, including adjusted operating income, adjusted net income, adjusted net in come per diluted share, comparable adjusted operating income, comparable adjusted net income, and comparable adjusted net income per diluted share. The adjusted supplemental measures exclude non - recurring costs associated with the Barnes Distribution North America (“BDNA”) and co - location of our corporate headquarters in Davidson, North Carolina and the related tax effects. The comparable adjusted supplemental measures exclude BDN A operations, non - recurring costs associated with BDNA, and co - location of our corporate headquarters in Davidson, North Carolina and the related tax effects. These non - GAAP measures are not in accordance with or an alternative for GAAP, and may be different from non - GAAP measures used by other c ompanies. We believe that these non - GAAP measures have limitations in that they do not reflect all of the amounts associated with MSC's resul ts of operations as determined in accordance with GAAP and that these measures should only be used to evaluate MSC’s results of operations in con jun ction with the corresponding GAAP measures. The presentation of this additional information is not meant to be considered in isolation or a s a substitute for the most directly comparable GAAP measures. We compensate for the limitations of non - GAAP financial measures by relying upon GAAP result s to gain a complete picture of Company performance. In calculating “adjusted” non - GAAP financial measures, we exclude the non - recurring costs described above to facilitate a review of the comparability of the Company’s operating performance on a period - to - period basis because such costs are not, in our view, related to the Company’s on going operational performance. We use the “adjusted” non - GAAP measures to evaluate the operating performance of our business, for comparison with forecasts and strategic plans, and for benchmarking performance externally against competitors. In addition, we use the “adjusted” non - GAAP f inancial measures as performance metrics for management incentive programs. Since we find these measures to be useful, we believe that investors ben efit from seeing results “through the eyes” of management in addition to seeing GAAP results. We believe that the “adjusted” non - GAAP measures, when rea d in conjunction with the Company’s GAAP financials, provide useful information to investors by offering: • the ability to make more meaningful period - to - period comparisons of the Company’s on - going operating results; • the ability to better identify trends in the Company’s underlying business and perform related trend analyses; and • a better understanding of how management plans and measures the Company’s underlying business. In calculating “comparable adjusted” non - GAAP financial measures, we exclude the non - recurring costs described above and also ex clude the BDNA operating results in order to facilitate a comparison of our operating results for the quarter ended June 1, 2013 with our gu ida nce for such quarter. The following tables reconcile GAAP operating income, GAAP net income and GAAP net income per diluted share (“EPS”) to non - GAAP adjusted operating income, adjusted net income, adjusted net income per diluted share, comparable adjusted operating income, comparable adjusted ne t income, and comparable adjusted net income per diluted share:
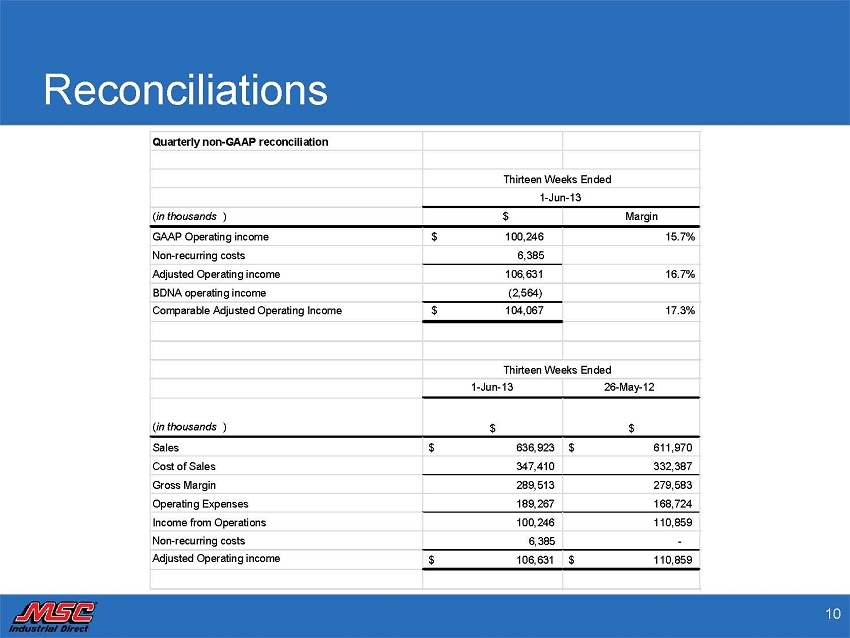
10 Reconciliations 10 Quarterly non - GAAP reconciliation ( in thousands ) $ Margin GAAP Operating income $ 100,246 15.7% Non - recurring costs 6,385 Adjusted Operating income 106,631 16.7% BDNA operating income (2,564) Comparable Adjusted Operating Income $ 104,067 17.3% 1 - Jun - 13 26 - May - 12 ( in thousands ) $ $ Sales 636,923 $ 611,970 $ Cost of Sales 347,410 332,387 Gross Margin 289,513 279,583 Operating Expenses 189,267 168,724 Income from Operations 100,246 110,859 Non - recurring costs 6,385 - Adjusted Operating income 106,631 $ 110,859 $ Thirteen Weeks Ended 1 - Jun - 13 Thirteen Weeks Ended

11 Reconciliations 11 1 - Jun - 13 26 - May - 12 ( in thousands and excluding BDNA operations ) $ $ Sales 602,190 $ 611,970 $ Cost of Sales 331,266 332,387 Gross Margin 270,924 279,583 Operating Expenses 173,242 168,724 Income from Operations 97,682 110,859 Non - recurring costs 6,385 - Comparable Adjusted Operating income 104,067 $ 110,859 $ Thirteen Weeks Ended

12 Reconciliations 12 Diluted EPS GAAP net income $ 62,354 $ 0.98 Non - recurring costs* 4,390 0.07 Adjusted net income 66,744 1.05 BDNA net income (1,343) (0.02) Comparable Adjusted net income $ 65,401 $ 1.03 ( in thousands, except per share amounts ) $(after tax) * On a pre - tax basis includes approximately $930 of non - recurring relocation costs associated with the Co - Location of the Compan y’s headquarters in Davidson, North Carolina and approximately $6,049 of non - recurring transaction costs associated with the BDNA acquisition for the thirteen weeks ended June 1, 2013. The non - recurring costs were calculated using an effective tax rate of 3 7.1%. Thirteen Weeks Ended 1 - Jun - 13
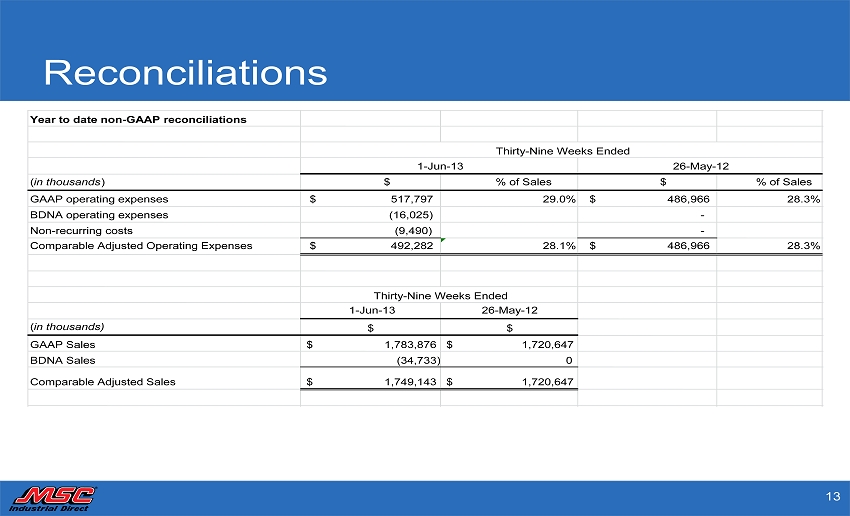
13 Reconciliations 13 Year to date non - GAAP reconciliations ( in thousands ) $ % of Sales $ % of Sales GAAP operating expenses $ 517,797 29.0% $ 486,966 28.3% BDNA operating expenses (16,025) - Non - recurring costs (9,490) - Comparable Adjusted Operating Expenses $ 492,282 28.1% $ 486,966 28.3% 1 - Jun - 13 26 - May - 12 ( in thousands) $ $ GAAP Sales 1,783,876 $ 1,720,647 $ BDNA Sales (34,733) 0 Comparable Adjusted Sales 1,749,143 $ 1,720,647 $ 1 - Jun - 13 26 - May - 12 Thirty - Nine Weeks Ended Thirty - Nine Weeks Ended