Attached files
| file | filename |
|---|---|
| 8-K - 8-K - ATLANTIC POWER CORP | a13-15304_18k.htm |
| EX-99.2 - EX-99.2 - ATLANTIC POWER CORP | a13-15304_1ex99d2.htm |
Exhibit 99.1
|
|
2013 Annual General and Special Meeting of Shareholders June 21, 2013 |
|
|
Cautionary Note Regarding Forward-looking Statements 2 To the extent any statements made in this presentation contain information that is not historical, these statements are forward-looking statements or forward-looking information, as applicable, within the meaning of Section 27A of the U.S. Securities Act of 1933, as amended, and Section 21E of the U.S. Securities Exchange Act of 1934, as amended, and under Canadian securities law (collectively “forward-looking statements”). These forward-looking statements relate to, among other things: Atlantic Power Corporation’s (“AT”, “Atlantic Power” or the “Company”) expectations regarding the outcome of recontracting discussions related to certain projects; expectations regarding project cash flows; expectations regarding the completion of construction at the Piedmont project and expected date for commercial operation thereof; expectations regarding growth, acquisitions and leverage related to such acquisitions; expectations regarding the availability of tax equity investments; expectations regarding our ability to fund the anticipated dividend level; expectations regarding the reinvestment of cash in growth projects or to further reduce debt; expectations regarding the ability to generate sufficient amounts of cash and cash equivalents to maintain our operations and meet obligations as they become due; expectations regarding the ability to refinance existing debt; and outlook on growth at Atlantic Power. Forward-looking statements can generally be identified by the use of words such as “should,” “intend,” “may,” “expect,” “believe,” “anticipate,” “estimate,” “continue,” “plan,” “project,” “will,” “could,” “would,” “target,” “potential” and other similar expressions. In addition, any statements that refer to expectations, projections or other characterizations of future events or circumstances are forward-looking statements. Although Atlantic Power believes that the expectations reflected in such forward-looking statements are reasonable, such statements involve risks and uncertainties, should not be read as guarantees of future performance or results, and undue reliance should not be placed on such statements. Certain material factors or assumptions are applied in making forward-looking statements, including, but not limited to, third party projections of regional fuel and electric capacity and energy prices or cash flows that are based on assumptions about future economic conditions and courses of action as well as factors and assumptions set out below. Actual results may differ materially from those expressed or implied in such statements. Important factors that could cause actual results to differ materially from these expectations include, among other things: (i) the availability to AT of investment and acquisition opportunities; (ii) Atlantic Power’s access to capital and the state of the capital markets; (iii) the amount of distributions expected to be received from the Company’s projects; (iv) the receipt of sale proceeds in 2013; (v) investment of $140 to $150 million of net cash expected to be available in the second half of 2013, and expected return on investment; (vi) the other risk factors relating to the Company and the power industry, as detailed from time to time in the Company’s filings with the SEC and Canadian securities regulators. Additional information about these factors and about the material factors or assumptions underlying such forward-looking statements may be found in the Company’s Annual Report on Form 10-K for the year ended December 31, 2012, under the sections entitled “Risk Factors” and “Management’s Discussion and Analysis of Financial Condition and Results of Operations” and in the Company’s Quarterly Report on Form 10-Q for the three months ended March 31, 2013 under the sections entitled “Risk Factors” and Management’s Discussion and Analysis of Financial Condition and Results of Operations”. These forward-looking statements are made as of the date of this communication and, except as expressly required by applicable law, the Company assumes no obligation to update or revise them to reflect new events or circumstances. All amounts in this presentation are in US$ unless otherwise stated. Cash Available for Distribution and Payout Ratio are not measures recognized under GAAP and do not have standardized meanings prescribed by GAAP. Management believes that Cash Available for Distribution and Payout Ratio are relevant supplemental measures of the Company’s ability to earn and distribute cash returns to investors. Reconciliation of Cash Available for Distribution and Payout Ratio to the most comparable GAAP measure, cash flows from operating activities, is provided on slides 15 and 16 of this presentation. Investors are cautioned that the Company may calculate these measures in a manner that is different from other companies. Project Adjusted EBITDA is defined as project income (loss) plus interest, taxes, depreciation and amortization (including non-cash impairment charges) and changes in fair value of derivative instruments. Project Adjusted EBITDA is not a measure recognized under GAAP and is therefore unlikely to be comparable to similar measures presented by other companies and does not have a standardized meaning prescribed by GAAP. Management uses Project Adjusted EBITDA at the project level to provide comparative information about project performance and believes such information is helpful to investors. A reconciliation of Project Adjusted EBITDA to the most comparable GAAP measure, project income (loss), is provided on slides 15 and 16 of this presentation. Investors are cautioned that the Company may calculate this measure in a manner that is different from other companies. The Company has not provided a reconciliation of forward-looking non-GAAP measures, due primarily to variability and difficulty in making accurate forecasts and projections, as not all of the information necessary for a quantitative reconciliation is available to the Company without unreasonable efforts. The Company has not reconciled non-GAAP financial measures relating to individual projects to the directly comparable GAAP measures due to the difficulty in making the relevant adjustments on an individual project basis. Disclaimer –Non-GAAP Measures |
|
|
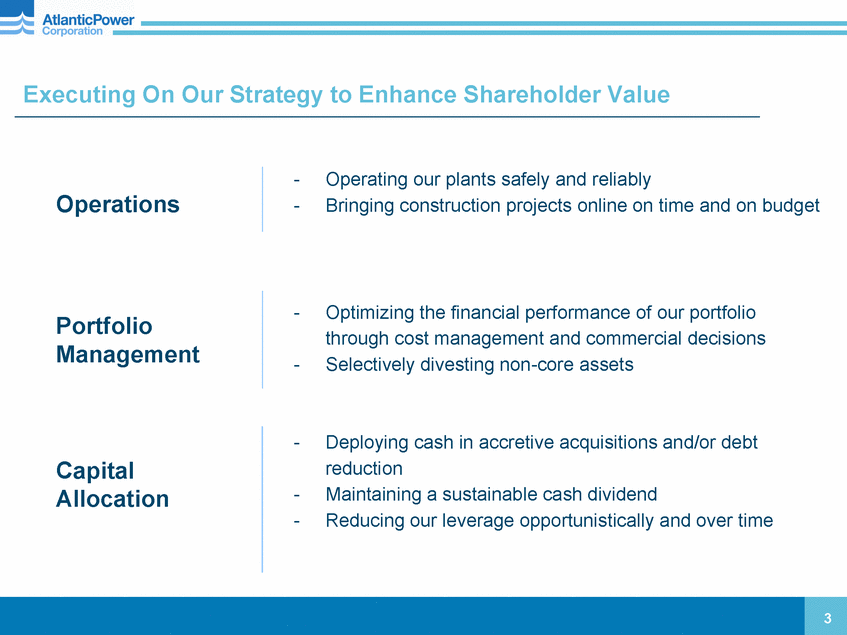
Executing On Our Strategy to Enhance Shareholder Value 3 -Operating our plants safely and reliably -Bringing construction projects online on time and on budget -Optimizing the financial performance of our portfolio through cost management and commercial decisions -Selectively divesting non-core assets -Deploying cash in accretive acquisitions and/or debt reduction -Maintaining a sustainable cash dividend -Reducing our leverage opportunistically and over time Operations Portfolio Management Capital Allocation |
|
|
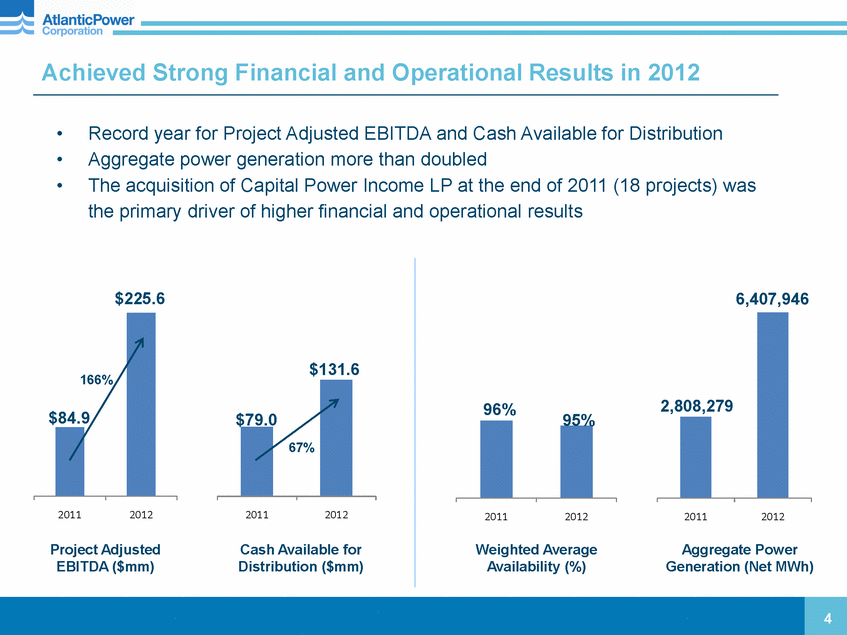
2011 2012 2011 2012 2011 2012 2011 2012 Achieved Strong Financial and Operational Results in 2012 4 Project Adjusted EBITDA ($mm) Cash Available for Distribution ($mm) Weighted Average Availability (%) Aggregate Power Generation (Net MWh) $84.9 $225.6 $79.0 $131.6 67% 166% 96% 95% 2,808,279 6,407,946 •Record year for Project Adjusted EBITDA and Cash Available for Distribution •Aggregate power generation more than doubled •The acquisition of Capital Power Income LP at the end of 2011 (18 projects) was the primary driver of higher financial and operational results |
|
|
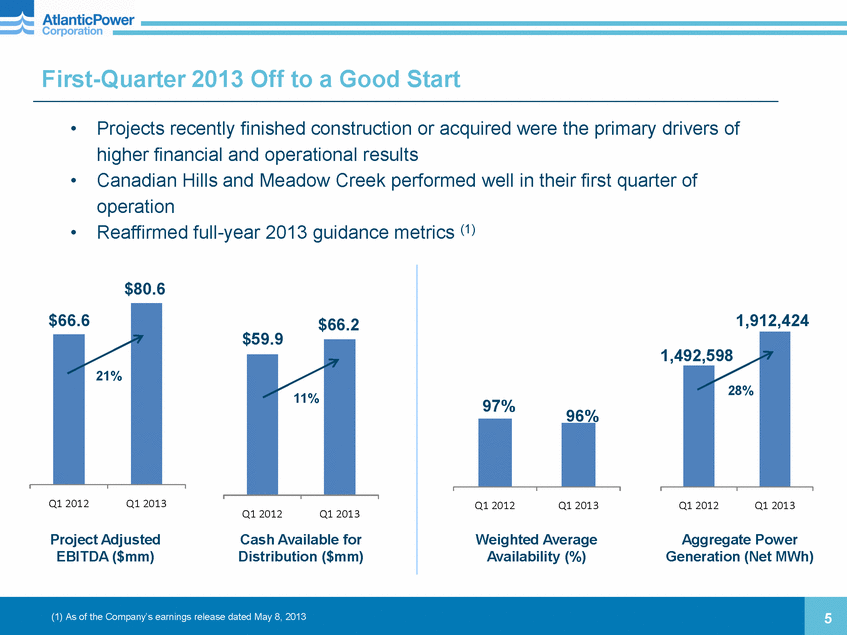
Q1 2012 Q1 2013 Q1 2012 Q1 2013 First-Quarter 2013 Off to a Good Start 5 Q1 2012 Q1 2013 Q1 2012 Q1 2013 Project Adjusted EBITDA ($mm) Cash Available for Distribution ($mm) Weighted Average Availability (%) Aggregate Power Generation (Net MWh) $66.6 $80.6 $59.9 $66.2 11% 21% 97% 96% 1,492,598 1,912,424 Projects recently finished construction or acquired were the primary drivers of higher financial and operational results Canadian Hills and Meadow Creek performed well in their first quarter of operation Reaffirmed full-year 2013 guidance metrics (1) 28% (1) As of the Company’s earnings release dated May 8, 2013 |
|
|
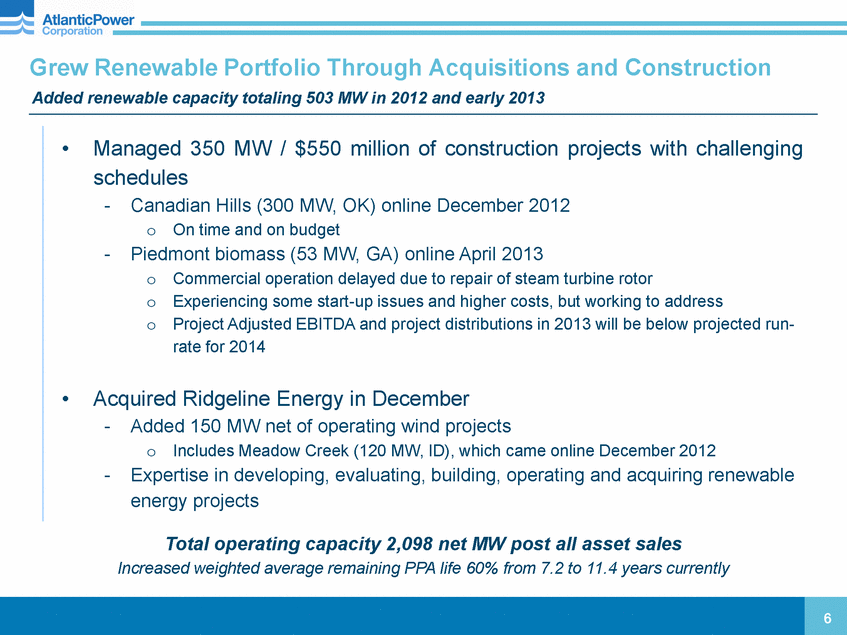
Grew Renewable Portfolio Through Acquisitions and Construction 6 Managed 350 MW / $550million of construction projects with challenging schedules Canadian Hills (300 MW, OK) online December 2012 On time and on budget Piedmont biomass (53 MW, GA) online April 2013 Commercial operation delayed due to repair of steam turbine rotor Experiencing some start-up issues and higher costs, but working to address Project Adjusted EBITDA and project distributions in 2013 will be below projected run- rate for 2014 Acquired Ridgeline Energy in December Added 150 MW net of operating wind projects Includes Meadow Creek (120 MW, ID), which came online December 2012 -Expertise in developing, evaluating, building, operating and acquiring renewable energy projects Total operating capacity 2,098 net MW post all asset sales Increased weighted average remaining PPA life 60% from 7.2 to 11.4 years currently Added renewable capacity totaling 503 MW in 2012 and early 2013 |
|
|
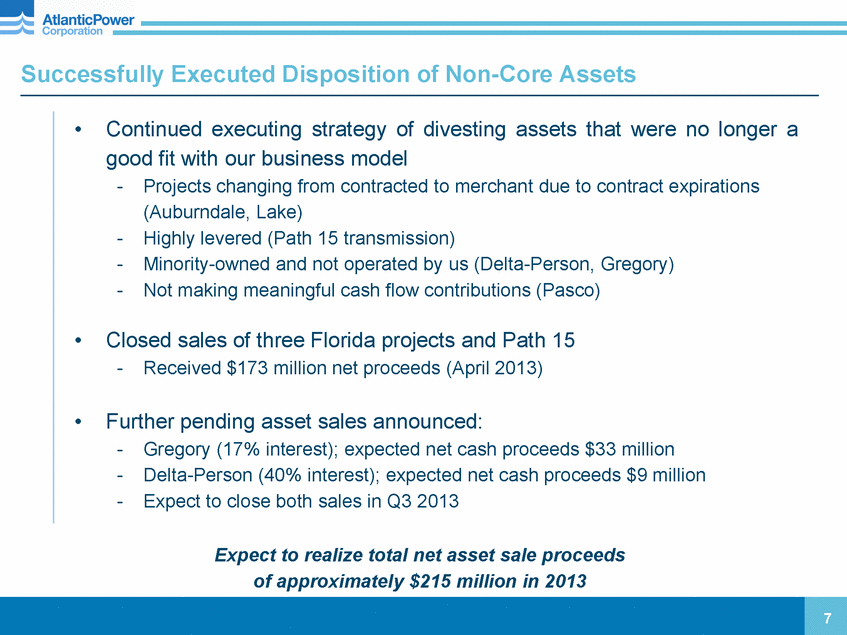
Successfully Executed Disposition of Non-Core Assets 7 Continued executing strategy of divesting assets that were no longer a good fit with our business model Projects changing from contracted to merchant due to contract expirations (Auburndale, Lake) Highly levered (Path 15 transmission) -Minority-owned and not operated by us (Delta-Person, Gregory) Not making meaningful cash flow contributions (Pasco) Closed sales of three Florida projects and Path15 Received $173 million net proceeds (April 2013) Further pending asset sales announced: Gregory (17% interest); expected net cash proceeds $33 million Delta-Person (40% interest); expected net cash proceeds $9 million Expect to close both sales in Q3 2013 Expect to realize total net asset sale proceeds of approximately $215 million in 2013 |
|
|
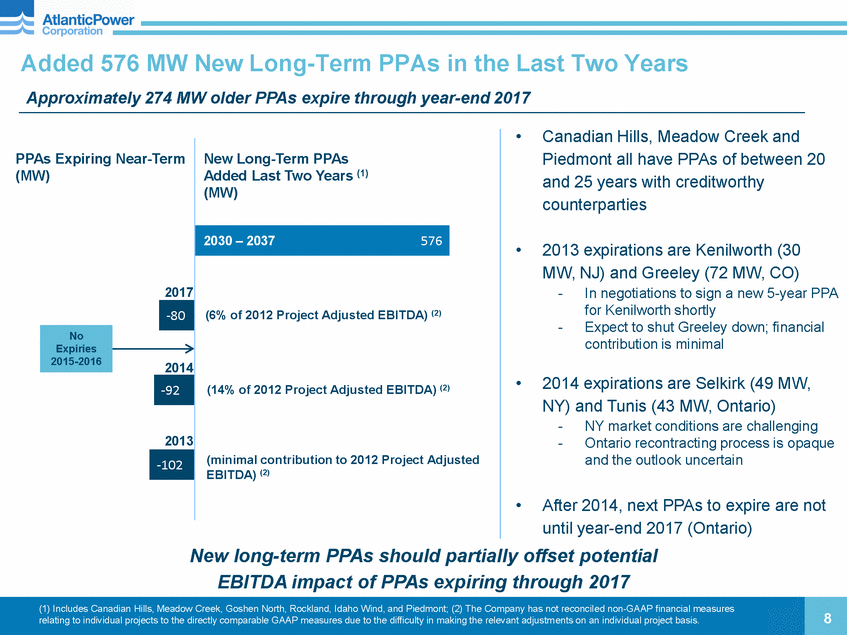
Added 576 MW New Long-Term PPAs in the Last Two Years 8 Canadian Hills, Meadow Creek and Piedmont all have PPAs of between 20 and 25 years with creditworthy counterparties 2013 expirations are Kenilworth (30 MW, NJ) and Greeley (72 MW, CO) In negotiations to sign a new 5-year PPA for Kenilworth shortly Expect to shut Greeley down; financial contribution is minimal •2014 expirations are Selkirk (49 MW, NY) and Tunis (43 MW, Ontario) NY market conditions are challenging Ontario recontracting process is opaque and the outlook uncertain •After 2014, next PPAs to expire are not until year-end 2017 (Ontario) Approximately 274 MW older PPAs expire through year-end 2017 (1) Includes Canadian Hills, Meadow Creek, Goshen North, Rockland, Idaho Wind, and Piedmont; (2) The Company has not reconciled non-GAAP financial measures relating to individual projects to the directly comparable GAAP measures due to the difficulty in making the relevant adjustments on an individual project basis. PPAs Expiring Near-Term (MW) (14% of 2012 Project Adjusted EBITDA) (2) (6% of 2012 Project Adjusted EBITDA) (2) (minimal contribution to 2012 Project Adjusted EBITDA) (2) 2013 2014 2017 New Long-Term PPAs Added Last Two Years (1) (MW) 2030 –2037 No Expiries 2015-2016 New long-term PPAs should partially offset potential EBITDA impact of PPAs expiring through 2017 |
|
|
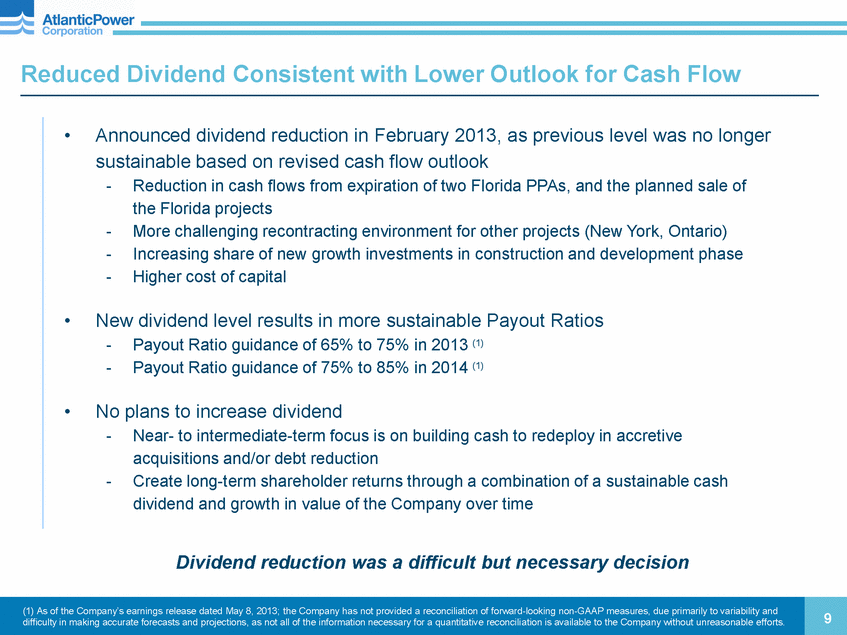
Reduced Dividend Consistent with Lower Outlook for Cash Flow 9 • Announced dividend reduction in February 2013, as previous level was no longer sustainable based on revised cash flow outlook -Reduction in cash flows from expiration of two Florida PPAs, and the planned sale of the Florida projects - More challenging recontracting environment for other projects (New York, Ontario) - Increasing share of new growth investments in construction and development phase -Higher cost of capital • New dividend level results in more sustainable Payout Ratios - Payout Ratio guidance of 65% to 75% in 2013 (1) - Payout Ratio guidance of 75% to 85% in 2014 (1) • No plans to increase dividend - Near- to intermediate-term focus is on building cash to redeploy in accretive acquisitions and/or debt reduction - Create long-term shareholder returns through a combination of a sustainable cash dividend and growth in value of the Company over time Dividend reduction was a difficult but necessary decision (1) As of the Company’s earnings release dated May 8, 2013; the Company has not provided a reconciliation of forward-looking non-GAAP measures, due primarily to variability and difficulty in making accurate forecasts and projections, as not all of the information necessary for a quantitative reconciliation is available to the Company without unreasonable efforts. |
|
|
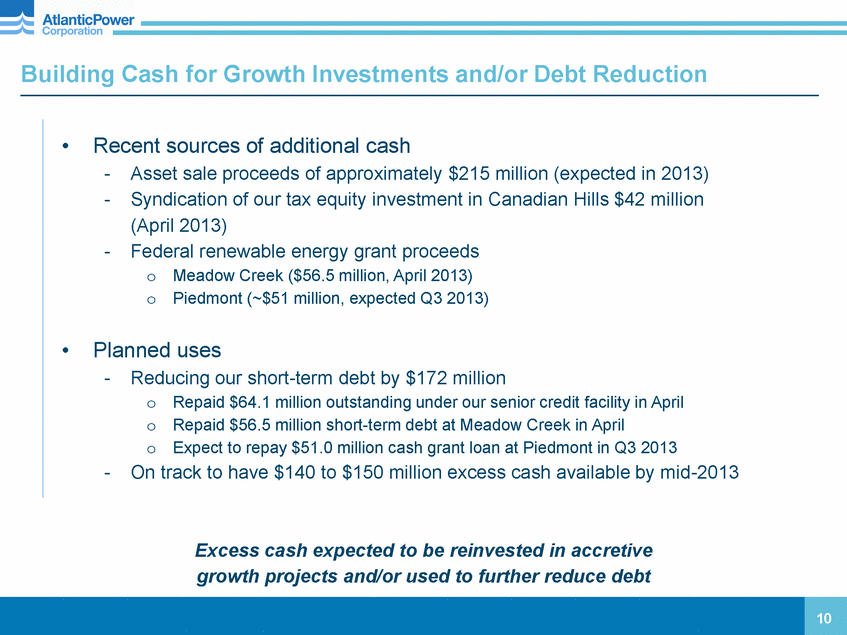
Building Cash for Growth Investments and/or Debt Reduction 10 • Recent sources of additional cash - Asset sale proceeds of approximately $215 million (expected in 2013) - Syndication of our tax equity investment in Canadian Hills $42 million (April 2013) - Federal renewable energy grant proceeds Meadow Creek ($56.5 million, April 2013) Piedmont (~$51 million, expected Q3 2013) • Planneduses - Reducing our short-term debt by $172 million Repaid $64.1 million outstanding under our senior credit facility in April Repaid $56.5 million short-term debt at Meadow Creek in April Expect to repay $51.0 million cash grant loan at Piedmont in Q3 2013 - On track to have $140 to $150 million excess cash available by mid-2013 Excess cash expected to be reinvested in accretive growth projects and/or used to further reduce debt |
|
|
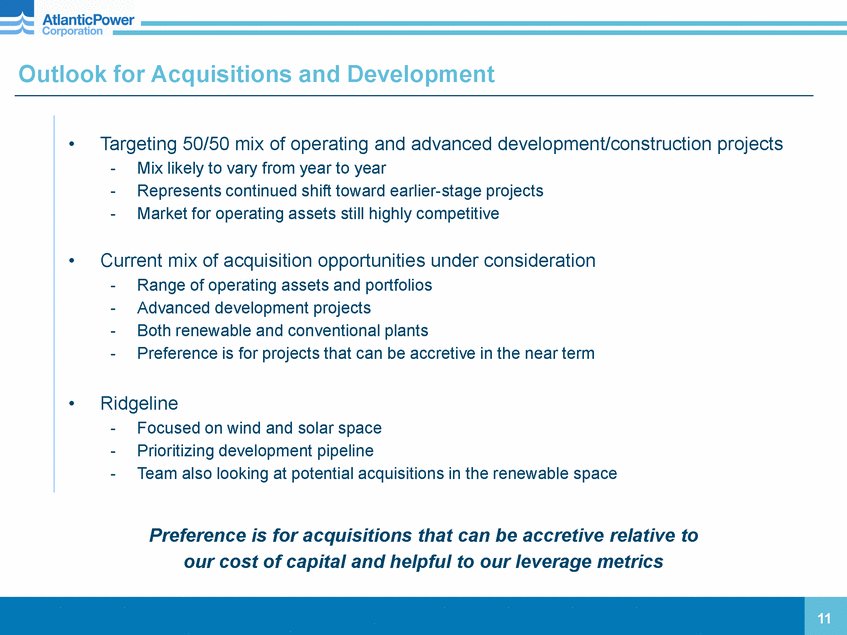
Outlook for Acquisitions and Development 11 • Targeting50/50 mix of operating and advanced development/construction projects -Mix likely to vary from year to year -Represents continued shift toward earlier-stage projects -Market for operating assets still highly competitive • Current mix of acquisition opportunities under consideration -Range of operating assets and portfolios -Advanced development projects -Both renewable and conventional plants -Preference is for projects that can be accretive in the near term • Ridgeline -Focused on wind and solar space -Prioritizing development pipeline -Team also looking at potential acquisitions in the renewable space Preference is for acquisitions that can be accretive relative to our cost of capital and helpful to our leverage metrics |
|
|
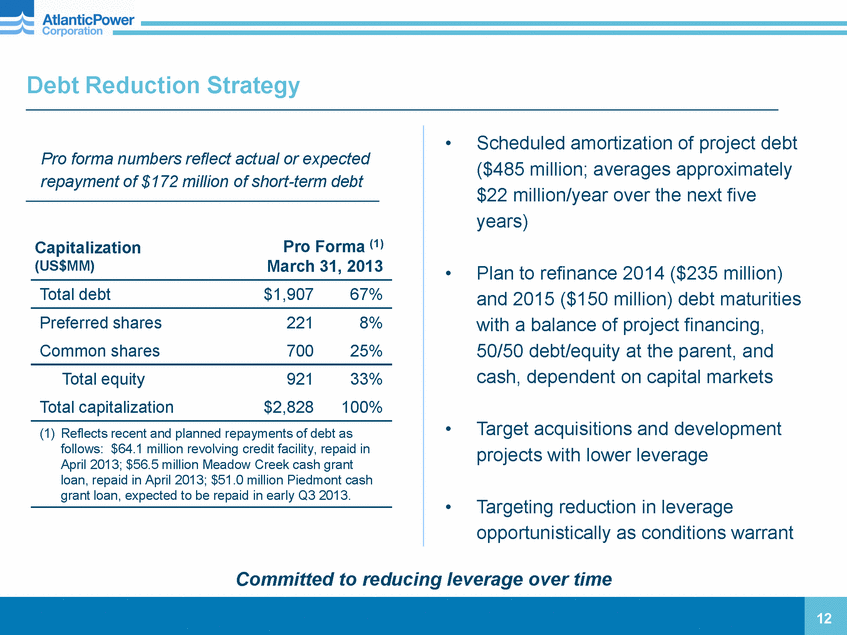
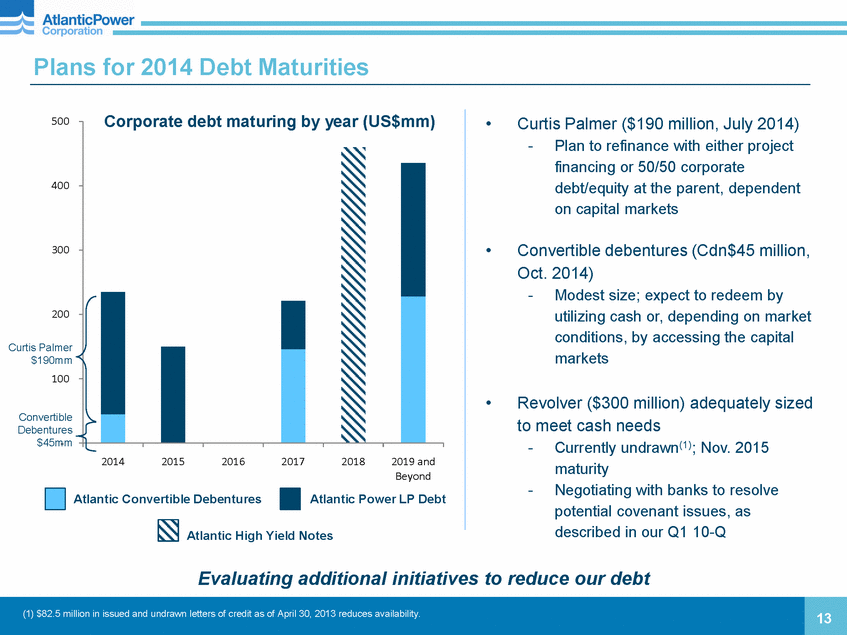
Debt Reduction Strategy 12 ProForma (1) March 31, 2013 Total debt $1,907 67% Preferred shares 221 8% Common shares 700 25% Total equity 921 33% Total capitalization $2,828 100% (1)Reflects recent and planned repayments of debt as follows: $64.1 million revolving credit facility, repaid in April 2013; $56.5 million Meadow Creek cash grant loan, repaid in April 2013; $51.0 million Piedmont cash grant loan, expected to be repaid in early Q3 2013. • Scheduled amortization of project debt ($485 million; averages approximately $22 million/year over the next five years) • Plan to refinance 2014 ($235 million) and 2015 ($150 million) debt maturities with a balance of project financing, 50/50 debt/equity at the parent, and cash, dependent on capital markets •Target acquisitions and development projects with lower leverage • Targeting reduction in leverage opportunistically as conditions warrant Capitalization (US$MM) Pro forma numbers reflect actual or expected repayment of $172 million of short-term debt Committed to reducing leverage over time - 100 200 300 400 500 2014 2015 2016 2017 2018 2019 and Beyond |
|
|
Plans for 2014 Debt Maturities 13 • Curtis Palmer ($190 million, July 2014) -Plan to refinance with either project financing or 50/50 corporate debt/equity at the parent, dependent on capital markets • Convertible debentures (Cdn$45 million, Oct. 2014) -Modest size; expect to redeem by utilizing cash or, depending on market conditions, by accessing the capital markets • Revolver ($300 million) adequately sized to meet cash needs -Currently undrawn(1); Nov. 2015 maturity - Negotiating with banks to resolve potential covenant issues, as described in our Q1 10-Q Atlantic Power LP Debt Atlantic Convertible Debentures Atlantic High Yield Notes Curtis Palmer $190mm Convertible Debentures $45mm Corporate debt maturing by year (US$mm) (1) $82.5 million in issued and undrawn letters of credit as of April 30, 2013 reduces availability. Evaluating additional initiatives to reduce our debt |
|
|
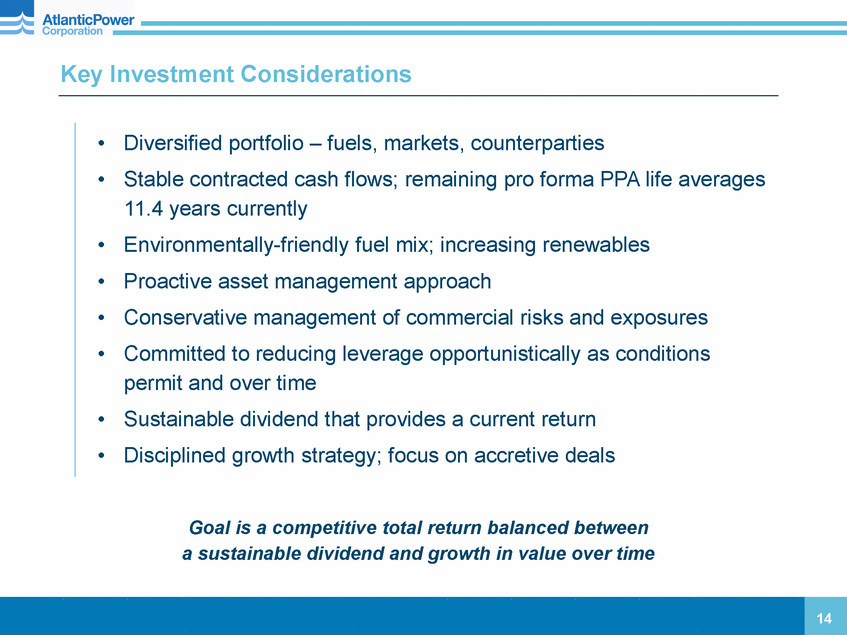
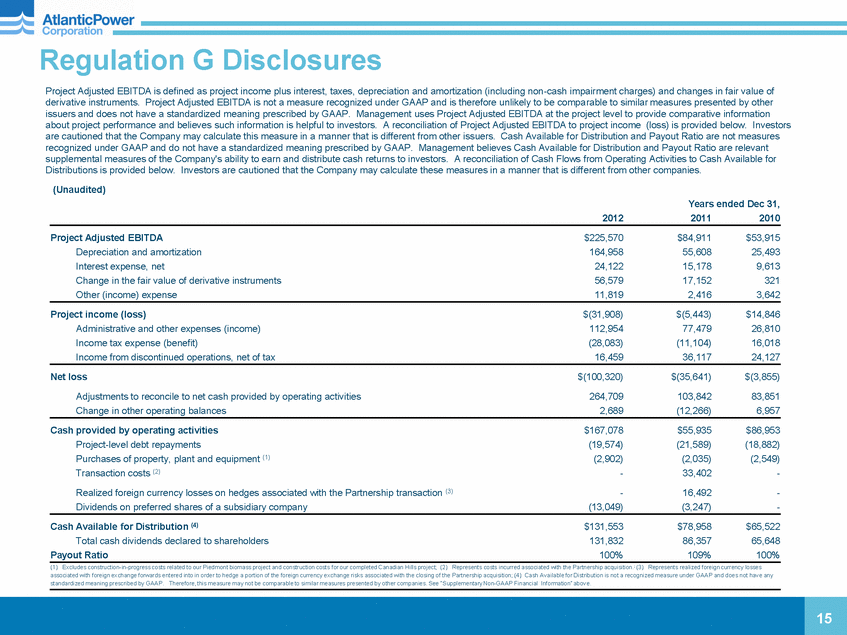
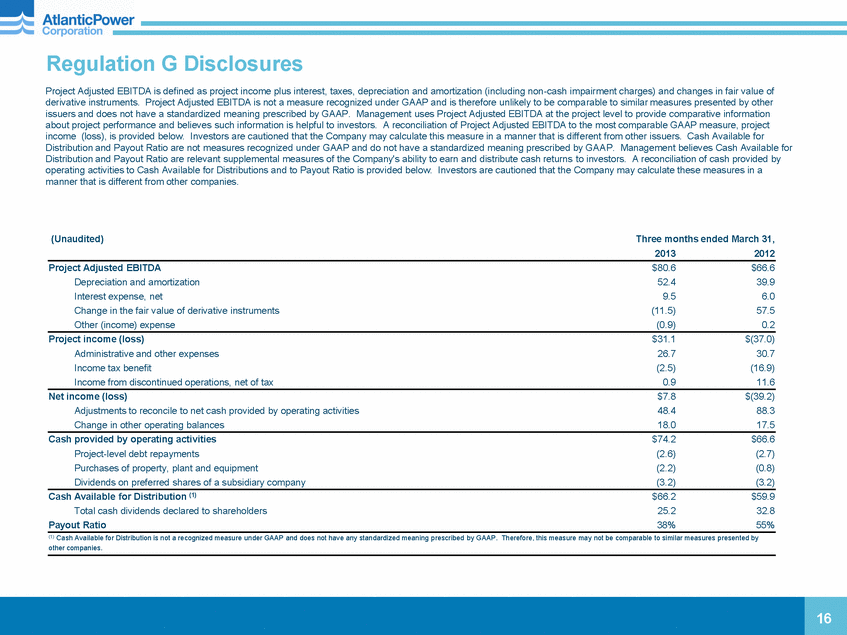
APC BEST logo.tifKey Investment Considerations 14 •Diversified portfolio –fuels, markets, counterparties •Stable contracted cash flows; remaining pro forma PPA life averages 11.4 years currently •Environmentally-friendly fuel mix; increasing renewables •Proactive asset management approach •Conservative management of commercial risks and exposures •Committed to reducing leverage opportunistically as conditions permit and over time •Sustainable dividend that provides a current return •Disciplined growth strategy; focus on accretive deals Goal is a competitive total return balanced between a sustainable dividend and growth in value over time APC BEST logo.tifRegulation G Disclosures Project Adjusted EBITDA is defined as project income plus interest, taxes, depreciation and amortization (including non-cash impairment charges) and changes in fair value of derivative instruments. Project Adjusted EBITDA is not a measure recognized under GAAP and is therefore unlikely to be comparable to similar measures presented by other issuers and does not have a standardized meaning prescribed by GAAP. Management uses Project Adjusted EBITDA at the project level to provide comparative information about project performance and believes such information is helpful to investors. A reconciliation of Project Adjusted EBITDA to project income (loss) is provided below. Investors are cautioned that the Company may calculate this measure in a manner that is different from other issuers. Cash Available for Distribution and Payout Ratio are not measures recognized under GAAP and do not have a standardized meaning prescribed by GAAP. Management believes Cash Available for Distribution and Payout Ratio are relevant supplemental measures of the Company's ability to earn and distribute cash returns to investors. A reconciliation of Cash Flows from Operating Activities to Cash Available for Distributions is provided below. Investors are cautioned that the Company may calculate these measures in a manner that is different from other companies. 15 (Unaudited) Years ended Dec 31, 2012 2011 2010 Project Adjusted EBITDA $225,570 $84,911 $53,915 Depreciation and amortization 164,958 55,608 25,493 Interest expense, net 24,122 15,178 9,613 Change in the fair value of derivative instruments 56,579 17,152 321 Other(income)expense 11,819 2,416 3,642 Project income(loss) $(31,908) $(5,443) $14,846 Administrative and other expenses(income) 112,954 77,479 26,810 Income tax expense(benefit) (28,083) (11,104) 16,018 Income from discontinued operations, net of tax 16,459 36,117 24,127 Netloss $(100,320) $(35,641) $(3,855) Adjustments to reconcile to net cash provided by operating activities 264,709 103,842 83,851 Change in other operating balances 2,689 (12,266) 6,957 Cash provided by operating activities $167,078 $55,935 $86,953 Project-level debt repayments (19,574) (21,589) (18,882) Purchases of property, plant and equipment (1) (2,902) (2,035) (2,549) Transaction costs (2) - 33,402 - Realized foreign currency losses on hedges associated with the Partnership transaction (3) - 16,492 - Dividends on preferred shares of a subsidiary company (13,049) (3,247) - Cash Available for Distribution(4) $131,553 $78,958 $65,522 Total cash dividends declared to shareholders 131,832 86,357 65,648 Payout Ratio 100% 109% 100% (1) Excludes construction-in-progress costs related to our Piedmont biomass project and construction costs for our completed Canadian Hills project; (2) Represents costs incurred associated with the Partnership acquisition.;(3) Represents realized foreign currency losses associated with foreign exchange forwards entered into in order to hedge a portion of the foreign currency exchange risks associated with the closing of the Partnership acquisition; (4) Cash Available for Distribution is not a recognized measure under GAAP and does not have any standardized meaning prescribed by GAAP. Therefore, this measure may not be comparable to similar measures presented by other companies. See “Supplementary Non-GAAP Financial Information” above. APC BEST logo.tifRegulation G Disclosures 16 (Unaudited) Three months ended March 31, 2013 2012 Project Adjusted EBITDA $80.6 $66.6 Depreciation and amortization 52.4 39.9 Interest expense, net 9.5 6.0 Change in the fair value of derivative instruments (11.5) 57.5 Other(income)expense (0.9) 0.2 Project income(loss) $31.1 $(37.0) Administrative and other expenses 26.7 30.7 Income tax benefit (2.5) (16.9) Income from discontinued operations, net of tax 0.9 11.6 Netincome (loss) $7.8 $(39.2) Adjustments to reconcile to net cash provided by operating activities 48.4 88.3 Change in other operating balances 18.0 17.5 Cash provided by operating activities $74.2 $66.6 Project-level debt repayments (2.6) (2.7) Purchases of property, plant and equipment (2.2) (0.8) Dividends on preferred shares of a subsidiary company (3.2) (3.2) Cash Available for Distribution(1) $66.2 $59.9 Total cash dividends declared to shareholders 25.2 32.8 Payout Ratio 38% 55% (1)Cash Available for Distribution is not a recognized measure under GAAP and does not have any standardized meaning prescribed by GAAP. Therefore, this measure may not be comparable to similar measures presented by other companies. Project Adjusted EBITDA is defined as project income plus interest, taxes, depreciation and amortization (including non-cash impairment charges) and changes in fair value of derivative instruments. Project Adjusted EBITDA is not a measure recognized under GAAP and is therefore unlikely to be comparable to similar measures presented by other issuers and does not have a standardized meaning prescribed by GAAP. Management uses Project Adjusted EBITDA at the project level to provide comparative information about project performance and believes such information is helpful to investors. A reconciliation of Project Adjusted EBITDA to the most comparable GAAP measure, project income (loss), is provided below. Investors are cautioned that the Company may calculate this measure in a manner that is different from other issuers. Cash Available for Distribution and Payout Ratio are not measures recognized under GAAP and do not have a standardized meaning prescribed by GAAP. Management believes Cash Available for Distribution and Payout Ratio are relevant supplemental measures of the Company's ability to earn and distribute cash returns to investors. A reconciliation of cash provided by operating activities to Cash Available for Distributions and to Payout Ratio is provided below. Investors are cautioned that the Company may calculate these measures in a manner that is different from other companies. |
|
|
Regulation G Disclosures Project Adjusted EBITDA is defined as project income plus interest, taxes, depreciation and amortization (including non-cash impairment charges) and changes in fair value of derivative instruments. Project Adjusted EBITDA is not a measure recognized under GAAP and is therefore unlikely to be comparable to similar measures presented by other issuers and does not have a standardized meaning prescribed by GAAP. Management uses Project Adjusted EBITDA at the project level to provide comparative information about project performance and believes such information is helpful to investors. A reconciliation of Project Adjusted EBITDA to project income (loss) is provided below. Investors are cautioned that the Company may calculate this measure in a manner that is different from other issuers. Cash Available for Distribution and Payout Ratio are not measures recognized under GAAP and do not have a standardized meaning prescribed by GAAP. Management believes Cash Available for Distribution and Payout Ratio are relevant supplemental measures of the Company's ability to earn and distribute cash returns to investors. A reconciliation of Cash Flows from Operating Activities to Cash Available for Distributions is provided below. Investors are cautioned that the Company may calculate these measures in a manner that is different from other companies. 15 (Unaudited) Years ended Dec 31, 2012 2011 2010 Project Adjusted EBITDA $225,570 $84,911 $53,915 Depreciation and amortization 164,958 55,608 25,493 Interest expense, net 24,122 15,178 9,613 Change in the fair value of derivative instruments 56,579 17,152 321 Other (income) expense 11,819 2,416 3,642 Project income (loss) $(31,908) $(5,443) $14,846 Administrative and other expenses (income) 112,954 77,479 26,810 Income tax expense (benefit) (28,083) (11,104) 16,018 Income from discontinued operations, net of tax 16,459 36,117 24,127 Netloss $(100,320) $(35,641) $(3,855) Adjustments to reconcile to net cash provided by operating activities 264,709 103,842 83,851 Change in other operating balances 2,689 (12,266) 6,957 Cash provided by operating activities $167,078 $55,935 $86,953 Project-level debt repayments (19,574) (21,589) (18,882) Purchases of property, plant and equipment (1) (2,902) (2,035) (2,549) Transaction costs (2) - 33,402 - Realized foreign currency losses on hedges associated with the Partnership transaction (3) - 16,492 - Dividends on preferred shares of a subsidiary company (13,049) (3,247) - Cash Available for Distribution (4) $131,553 $78,958 $65,522 Total cash dividends declared to shareholders 131,832 86,357 65,648 Payout Ratio 100% 109% 100% (1) Excludes construction-in-progress costs related to our Piedmont biomass project and construction costs for our completed Canadian Hills project; (2) Represents costs incurred associated with the Partnership acquisition.; (3) Represents realized foreign currency losses associated with foreign exchange forwards entered into in order to hedge a portion of the foreign currency exchange risks associated with the closing of the Partnership acquisition; (4) Cash Available for Distribution is not a recognized measure under GAAP and does not have any standardized meaning prescribed by GAAP. Therefore, this measure may not be comparable to similar measures presented by other companies. See “Supplementary Non-GAAP Financial Information” above. |
|
|
Regulation G Disclosures 16 (Unaudited) Three months ended March 31, 2013 2012 Project Adjusted EBITDA $80.6 $66.6 Depreciation and amortization 52.4 39.9 Interest expense, net 9.5 6.0 Change in the fair value of derivative instruments (11.5) 57.5 Other (income) expense (0.9) 0.2 Project income (loss) $31.1 $(37.0) Administrative and other expenses 26.7 30.7 Income tax benefit (2.5) (16.9) Income from discontinued operations, net of tax 0.9 11.6 Net income (loss) $7.8 $(39.2) Adjustment store concile to net cash provided by operating activities 48.4 88.3 Change in other operating balances 18.0 17.5 Cash provided by operating activities $74.2 $66.6 Project-level debt repayments (2.6) (2.7) Purchases of property, plant and equipment (2.2) (0.8) Dividends on preferred shares of a subsidiary company (3.2) (3.2) Cash Available for Distribution (1) $66.2 $59.9 Total cash dividends declared to shareholders 25.2 32.8 Payout Ratio 38% 55% (1) Cash Available for Distribution is not a recognized measure under GAAP and does not have any standardized meaning prescribed by GAAP. Therefore, this measure may not be comparable to similar measures presented by other companies. Project Adjusted EBITDA is defined as project income plus interest, taxes, depreciation and amortization (including non-cash impairment charges) and changes in fair value of derivative instruments. Project Adjusted EBITDA is not a measure recognized under GAAP and is therefore unlikely to be comparable to similar measures presented by other issuers and does not have a standardized meaning prescribed by GAAP. Management uses Project Adjusted EBITDA at the project level to provide comparative information about project performance and believes such information is helpful to investors. A reconciliation of Project Adjusted EBITDA to the most comparable GAAP measure, project income (loss), is provided below. Investors are cautioned that the Company may calculate this measure in a manner that is different from other issuers. Cash Available for Distribution and Payout Ratio are not measures recognized under GAAP and do not have a standardized meaning prescribed by GAAP. Management believes Cash Available for Distribution and Payout Ratio are relevant supplemental measures of the Company's ability to earn and distribute cash returns to investors. A reconciliation of cash provided by operating activities to Cash Available for Distributions and to Payout Ratio is provided below. Investors are cautioned that the Company may calculate these measures in a manner that is different from other companies.
|

