Attached files
| file | filename |
|---|---|
| 8-K - FORM 8-K - EveryWare Global, Inc. | d557835d8k.htm |
| EX-99.2 - EX-99.2 - EveryWare Global, Inc. | d557835dex992.htm |
 June 18, 2013
Global Leader in Quality Tabletop and Kitchen Solutions.
Exhibit 99.1 |
 1
Forward Looking Statements
This presentation includes "forward looking statements" within the meaning
of the "safe harbor" provisions of the United States Private Securities
Litigation
Reform
Act
of
1995.
Forward-looking
statements
may
be
identified
by
the
use
of
words
such
as
"anticipate",
"believe",
"expect",
"estimate",
"plan", "outlook", “target”, and "project" and
other similar expressions that predict or indicate future events or trends or that are not statements of
historical matters. Such forward looking statements with respect
to revenues, earnings, performance, strategies, prospects, product launches and
other aspects of the business of EveryWare Global, Inc., formerly known as
ROI Acquisition Corp. (“EveryWare”), are based on current expectations that are
subject to risks and uncertainties. A number of factors could cause actual results
or outcomes to differ materially from those indicated by such forward
looking statements. These factors include, but are not limited to: (1) the ability
of EveryWare to meet its financial and strategic goals, due to, among
other
things,
competition,
the
ability
of
the
combined
company
to
grow
and
manage
growth
profitably,
maintain
relationships
with
suppliers
and
obtain
adequate supply of products and retain its key employees; (2) changes in applicable
laws or regulations; (3) the possibility that EveryWare may be adversely
affected by other economic, business, and/or competitive factors; (4) EveryWare’s ability to maintain its listing on Nasdaq; (5) EveryWare’s
ability to successfully integrate recent acquisitions and realize anticipated
synergies (6) other risks and uncertainties indicated from time to time in
EveryWare’s
filings
with
the
Securities
and
Exchange
Commission
(“SEC”),
including
those
under
the
heading
“Risk
Factors”
in
ROI’s
proxy
statement/prospectus filed with the SEC on May 10, 2013. You are
cautioned not to place undue reliance upon any forward-looking statements,
which speak only as of the date made, and EveryWare undertakes no obligation
to update or revise the forward-looking statements, whether as a result of new
information, future events or otherwise.
Financial Presentation
This presentation includes non-GAAP financial measures, including EBITDA,
Adjusted EBITDA, Adjusted EBITDA margin and Free Cash Flow. EBITDA is
calculated as earnings before interest and taxes (“EBIT”) plus depreciation and amortization (“EBITDA”). Adjusted EBITDA is calculated as EBITDA
plus restructuring expenses, certain historical acquisition/merger-related
transaction fees, inventory writedown, management fees and reimbursed
expenses paid to our equity sponsor, certain other adjustments that management
believes are not representative of its core operating performance,
adjustments for the full-year impact of certain cost improvements implemented
within the fiscal year, the cost in 2012 related to out-of-the-money natural
gas hedges and the estimated increased expenses of operating as a public
company. A reconciliation of net income to Adjusted EBITDA is set forth on
page
24.
Adjusted
EBITDA
margin
is
defined
as
Adjusted
EBITDA
divided
by
net
sales.
Free
Cash
Flow
is
defined
as
Adjusted
EBITDA
less
maintenance capital expenditures. Wherever referenced, unless otherwise noted, 2011
results include financial results for the two months ended December 31, 2011
for Oneida and 12 months ended December 31, 2011 for Anchor. EveryWare
believes
that
these
non-GAAP
measures
of
financial
results
provide
useful
information
to
management
and
investors
regarding
certain
financial and business trends relating to EveryWare’s financial condition and
results of operations. EveryWare’s management uses these non-GAAP
measures to compare EveryWare’s performance to that of prior periods for trend
analyses, for purposes of determining management incentive compensation, and
for budgeting and planning purposes. These measures are used in monthly financial reports prepared for management and
EveryWare’s board of directors. EveryWare believes that the use of these
non-GAAP financial measures provides an additional tool for investors to use
in evaluating ongoing operating results and trends and in comparing
EveryWare’s financial measures with other consumer products companies, many of
which present similar non-GAAP financial measures to investors. Management of
EveryWare does not consider these non-GAAP measures in isolation or as
an alternative to financial measures determined in accordance with GAAP. The principal limitation of these non-GAAP financial measures is that
they exclude significant expenses and income that are required by GAAP to be
recorded in EveryWare’s financial statements. In addition, they are
subject to inherent limitations as they reflect the exercise of judgments by
management about which expenses and income are excluded or included in
determining these non-GAAP financial measures. In order to compensate for these
limitations, management presents non-GAAP financial measures in
connection with GAAP results. You should review EveryWare’s audited financial
statements, as presented in ROI’s proxy statement/prospectus (which was
filed with the SEC on May 10, 2013), and not rely on any single financial measure to evaluate EveryWare’s business. |
 2
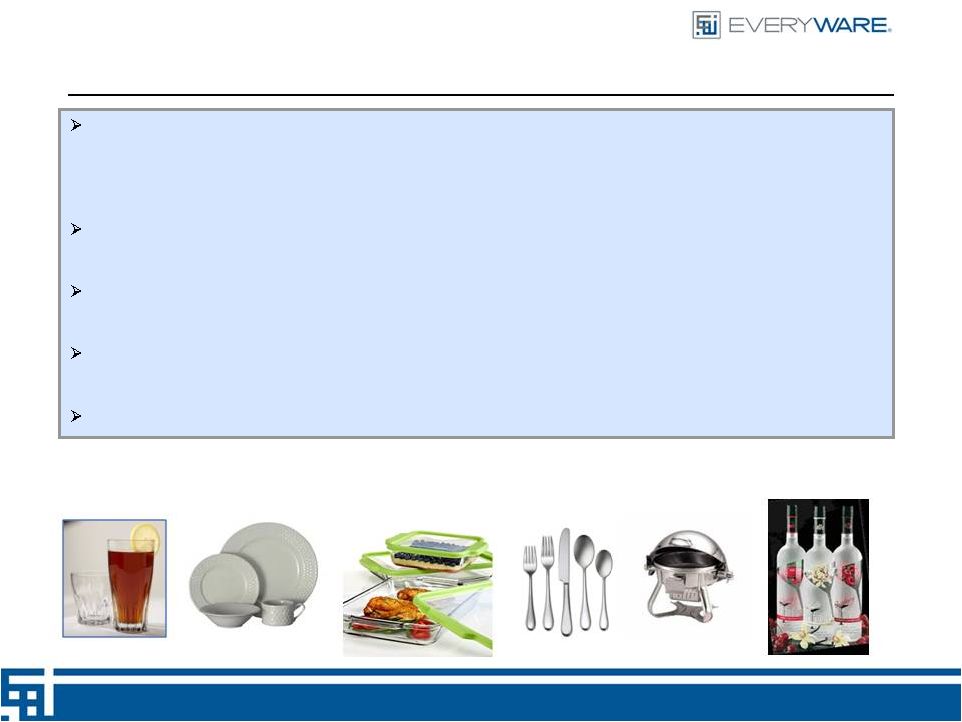
EveryWare (Nasdaq: EVRY) is a leading global marketer of tabletop and food
preparation products for the consumer and foodservice markets, with
operations in the United States, Canada, Mexico, Latin America, Europe and
Asia 2013
Projected
financial
results
reflect
$457mm
Revenues
and
$61mm
Adjusted
EBITDA
(1)
Added to the Russell 3000 Index in June, 2013
Leading brands and market position across broad platform
Extensive growth opportunities across all segments
(1) See slide 24 for a reconciliation of Adjusted EBITDA to Net Income
About EveryWare |
 3
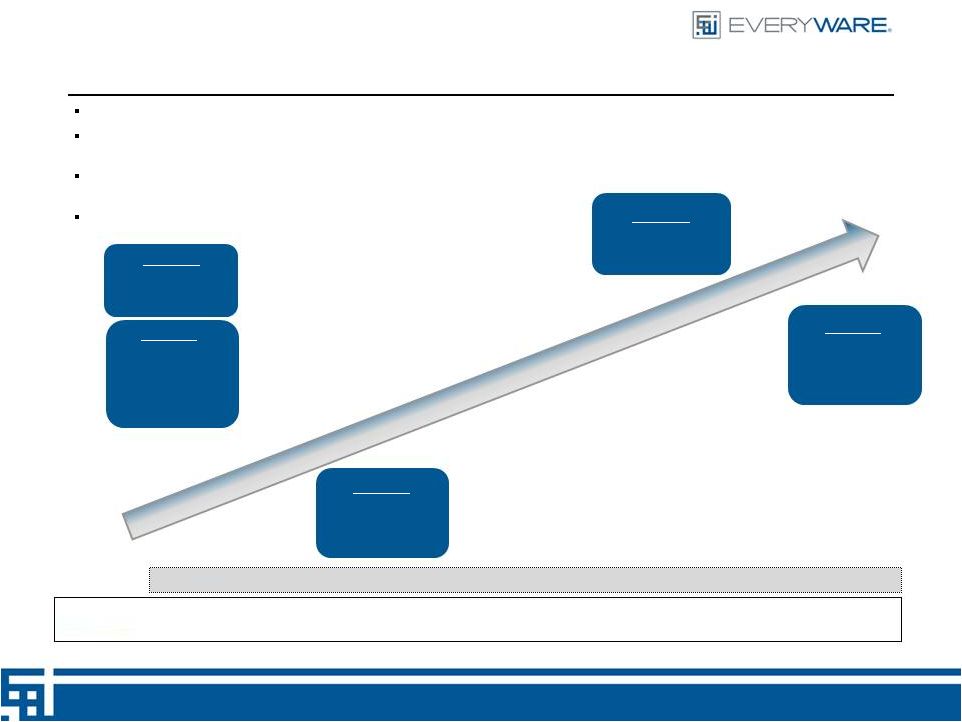
Creating the EveryWare Platform
EveryWare
Global
is
the
culmination
of
several
acquisitions
over
the
past
5
years
Complete
tabletop
offering
including
several
of
the
most
recognizable
brands
in
the
industry
Since
2007,
the
platform
has
experienced
industry
leading
growth
with
Revenue
expanding at a CAGR of 16.2%
Engrained
culture
of
continuous
operational
improvement
(1) 2011 results are proforma and reflect 12 months of
Oneida Sep-2007
Purchased
Indiana Glass
Apr-2007
Acquired
Anchor
Hocking
out of
bankruptcy
Nov-2011
Acquired Oneida,
Ltd.
Mar-2012
Formed
EveryWare
Global, Inc.
Sep-2008
Purchased
Alco Consumer
Products
2007
2008
2009
2010
2011
(1)
2012
$ in millions
Net Sales:
$200.0
$256.3
$254.1
$263.5
$417.1
$421.7 |
 4
EveryWare: Leading Global Tabletop Solutions
Vision
To become the leading global
marketer of trusted brands
in dining and food
preparation, recognized for providing
quality tabletop and kitchen solutions Unique Business Model
Strong Fundamentals
Iconic, globally-recognized brand names
#1 or #2 market leadership across consumer and
institutional markets
Longstanding, loyal blue-chip customer relationships
Broad distribution infrastructure
Owned asset base with high replacement cost
Large, addressable industry with positive tailwinds
Highly diversified across channel, customer,
category, etc.
Consistent recurring revenue model
Strong net sales and EBITDA growth
Strong free cash flow generation
Significant growth and margin expansion
opportunities expected to require low incremental
investment
Exceptionally efficient capital utilization |
 5
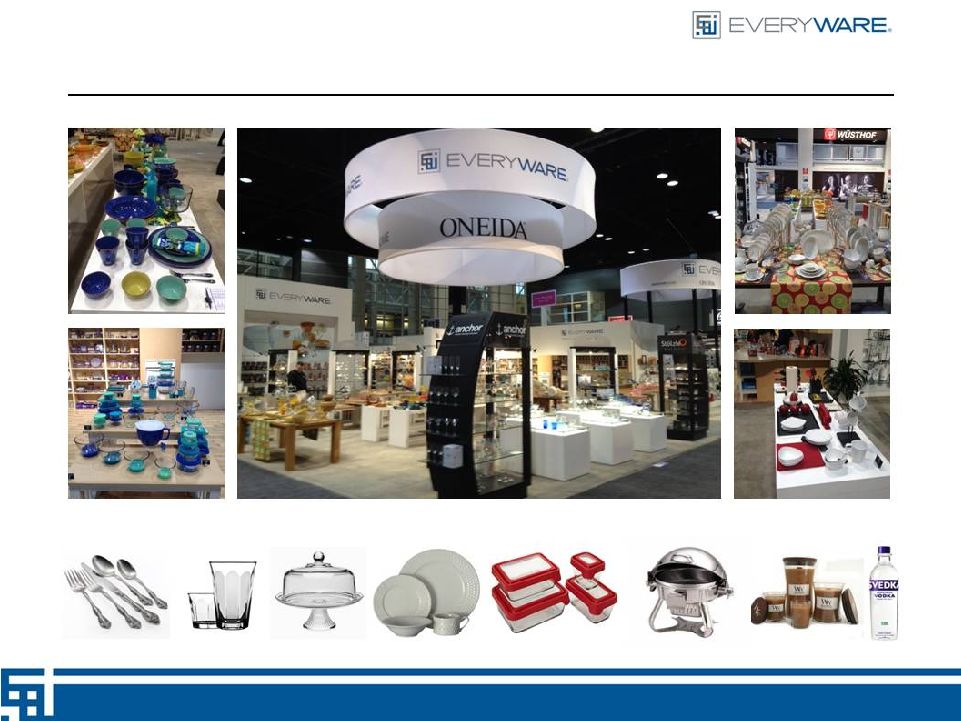
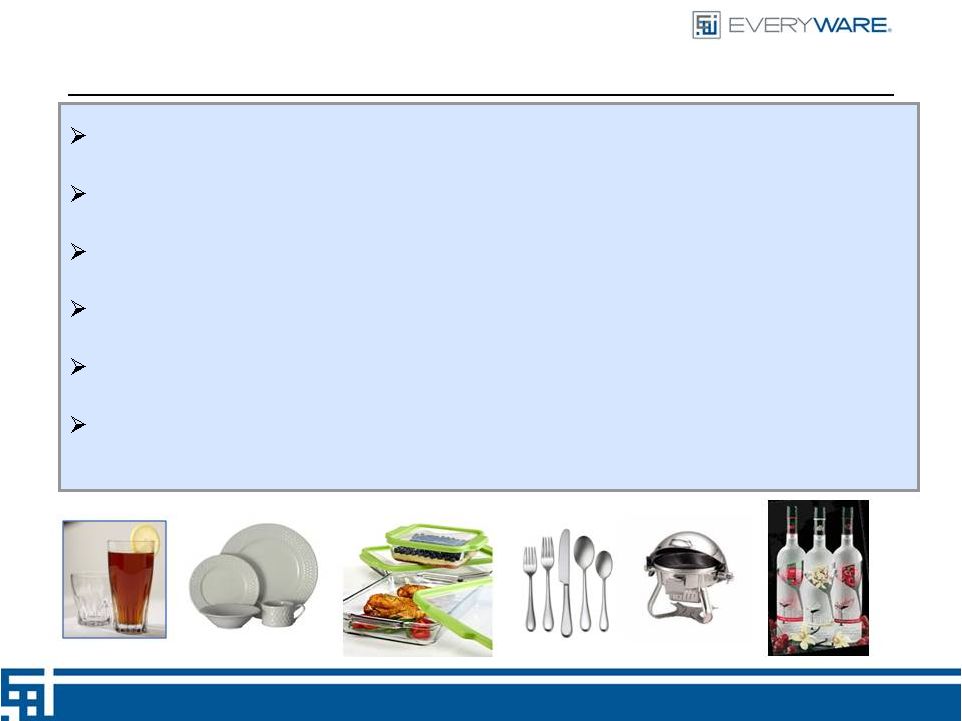
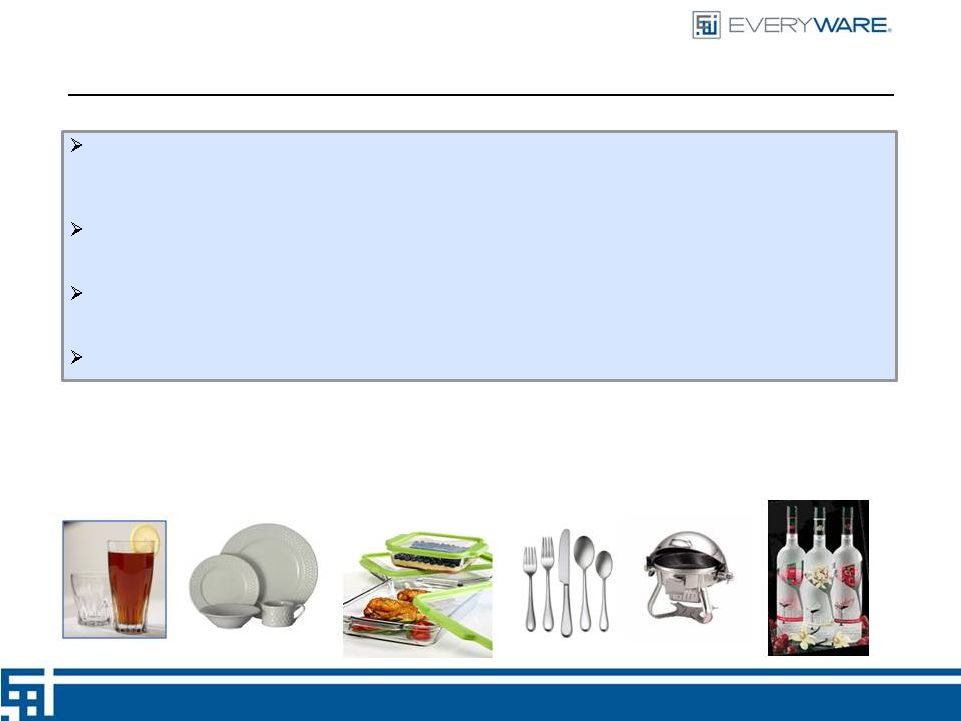
Leading Product Innovation |
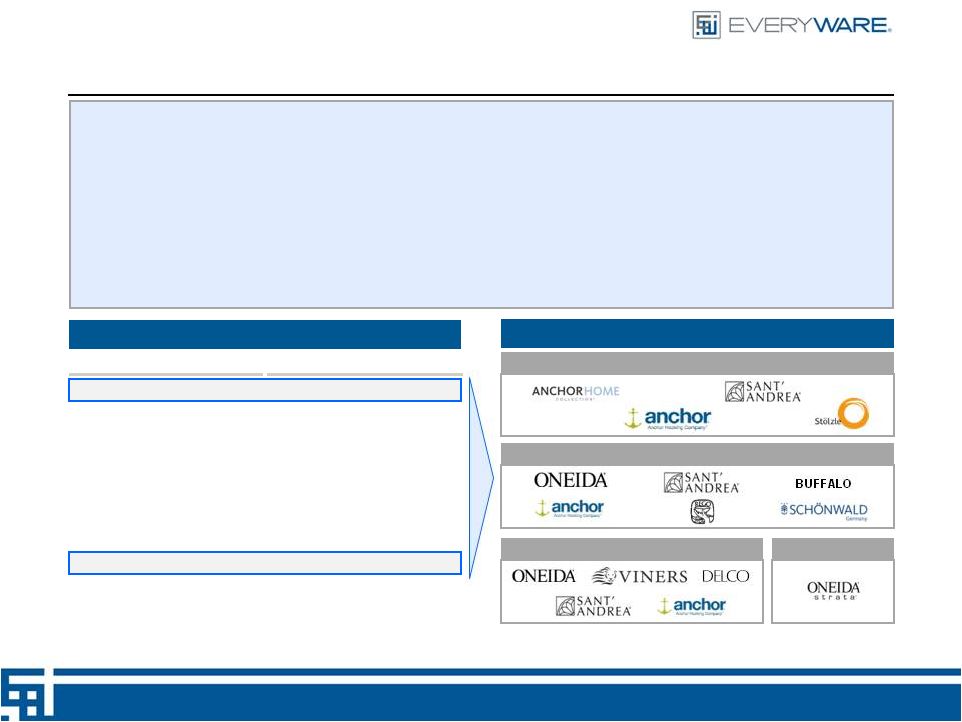 Renowned Brand Names with a Diversified Brand Strategy
2003
Most Recent
6
HFN Tabletop Brand Recognition
(1)
Dinnerware /Serveware
Flatware
Banquetware
Representative Brands
(3)
Glassware
(1)
Per Home Furnishing News (“HFN”) survey based on brand recognition and
sampling female consumers in the U.S. (2)
#1 in glassware.
(3)
Stölzle and Schönwold brands are licensed by EveryWare.
–
Tabletop
purchasing
decisions
by
both
consumers
and
institutions
are
highly
influenced
by
brand
reputation
•
Oneida’s brand reputation uniquely extends throughout the general household
category and is globally recognized by both consumer and institutional
customers •
Anchor
has
established
a
highly-recognized
brand
name
that
is
synonymous
with
quality,
value
and
durability,
backed
by
a
100+
year history
–
Diversified owned-brand strategy provides EveryWare with product offerings at
virtually all price points –
Branding strategy tailored to market and geography based on consumer views and
trends •
Strategic approach to new product development driven by identifying market voids
and strategically evaluating margin opportunities •
Since 2011, EveryWare has commercially launched an average of 150 products and 600
SKUs per year #1 Oneida
#2 Corelle
#3 Lenox
#4 Waterford
#5 Pfaltzgraff
#6 Mikasa
#7 Farberware
#8 Anchor Hocking
(2)
#9 Wedgwood
#10 Libbey
#1 Oneida
#2 Waterford
#3 Lenox
#4 Pfaltzgraff
#5 Wedgwood
#6 Corelle
#7 Mikasa
#8 Anchor Hocking
(2)
#9 Fiesta Ware
#10 Noritake |
 Leading Market Positions Across a Broad Range of Categories
7
–
Uniquely targets the consumer and foodservice tabletop markets with a
comprehensive offering across all sub-categories –
Leading market positions in core categories with high brand awareness
–
Migration of foodservice and mass retailers to full-line suppliers to
consolidate vendor structures and optimize category management (1)
Based on Management’s estimates.
(2)
#1 in Consumer glass dinnerware.
Bakeware
Beverageware
Dinnerware
Flatware
Serveware
Crystal
Candles
Premium
Spirit
Bottles
Industrial
/ Lighting
Floral
Consumer
Food-
service
Consumer
Food-
service
Consumer
Food-
service
Consumer
Food-
service
Consumer
Food-
service
Existing Channel
Market Positions
(1)
#2
#2
#3
#1
(2)
#1
#1
#1
#1
#1
#1
#1
#1
•
Portfolio of 9,000+ products is the broadest and most diverse tabletop platform in
the industry •
Few multi-channel players across entirety of the broader tabletop sector
•
#1 or #2 market position in seven of the major categories in which Anchor
competes •
#1 position in retail and foodservice flatware and foodservice dinnerware and
crystal •
EveryWare’s leading brand equity provides a competitive advantage in key
areas such as space allocation and promotions |
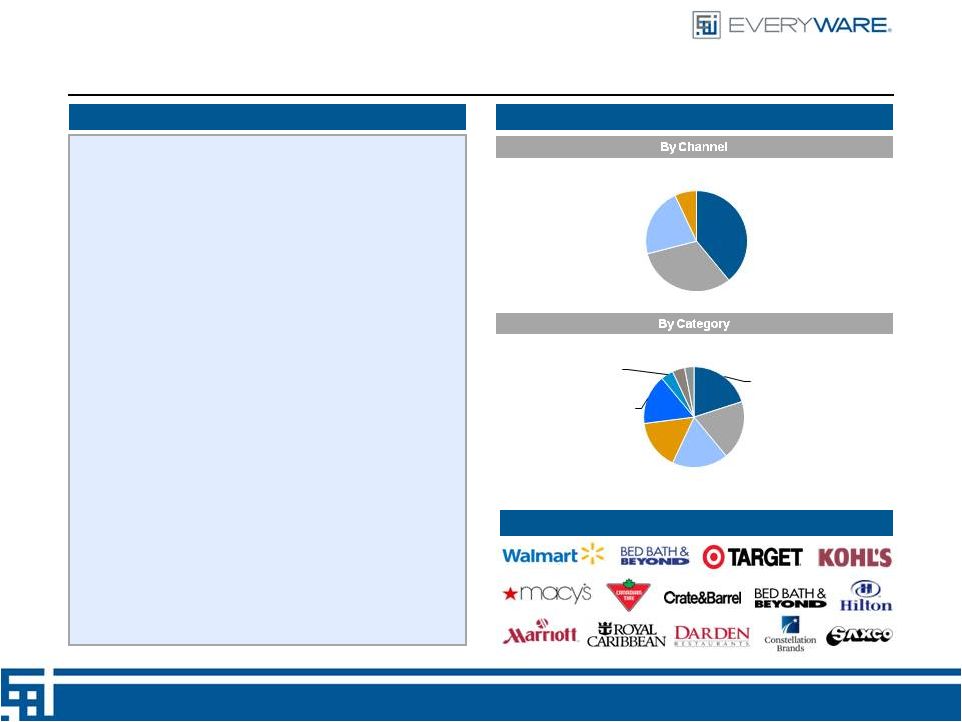
 Customer
% of 2012
Sales
(1)
Length of
Relationship
Wal-Mart
14%
>25y
Specialty customer
4%
>30y
Foodservice customer
3%
>30y
Foodservice customer
3%
>5y
Consumer customer
3%
>45y
Consumer customer
2%
>5y
Specialty customer
2%
>45y
Specialty customer
2%
>15y
Foodservice customer
2%
>25y
Specialty customer
2%
>15y
Top 10 Customers
37%
8
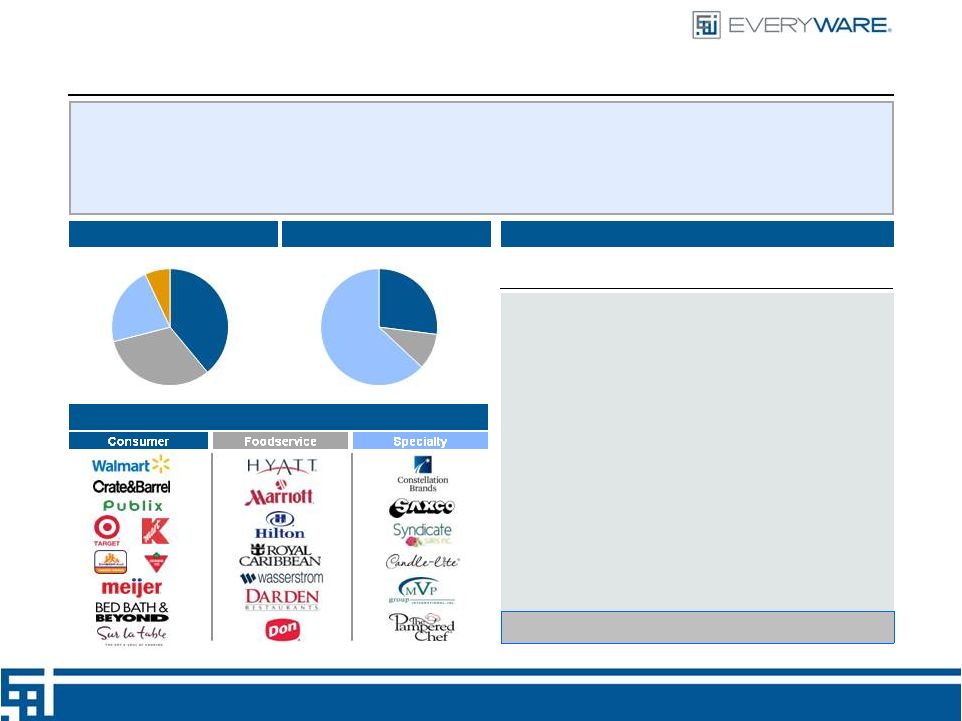
Longstanding, High-Quality and Diverse Customer Relationships
Top 10 Customers
2012 Sales
(1)
by Channel
2012 Sales
(1)
by Customer
Representative Customers
(1)
Gross Sales Less Returns.
Top 5
27%
Top 6 -
10
10%
Other
63%
Consumer
39%
Foodservice
32%
Specialty
22%
International
7%
–
Top supplier to many of its customers in one or more product categories
–
New
account
wins
in
2012
/
2013
will
enhance
market
share
growth
(2
Grocery,
1
Specialty
Retail,
1
Spirits)
•
Largest customer represents 14% of 2012 sales
(1)
•
No other customer accounts for more than 4% of sales
(1)
–
Extensive long-term relationships with a highly diversified and loyal
blue-chip customer base |
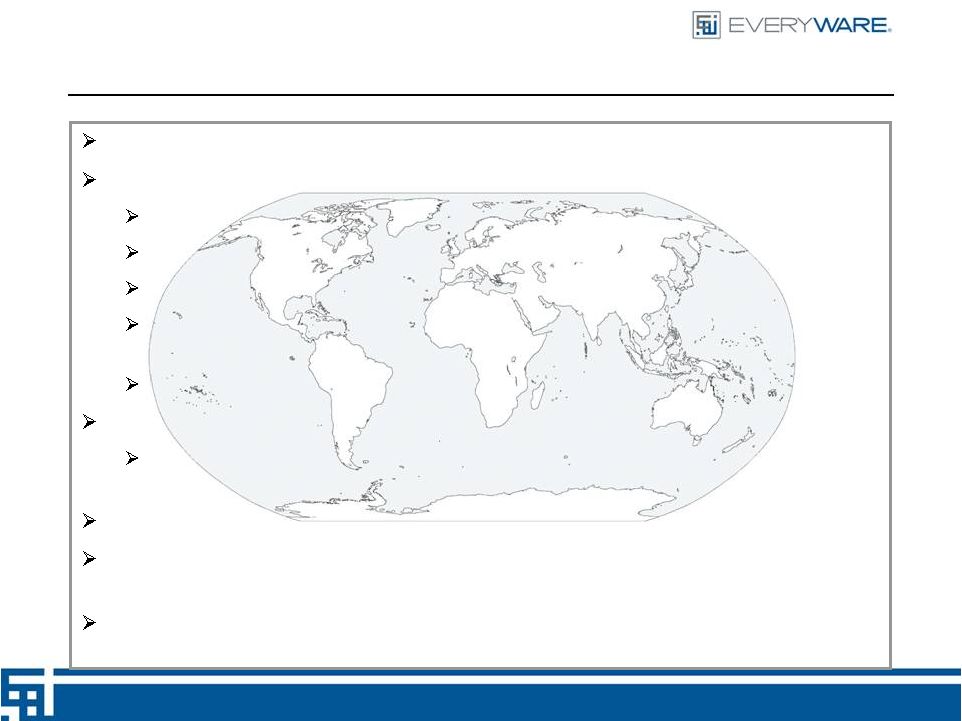
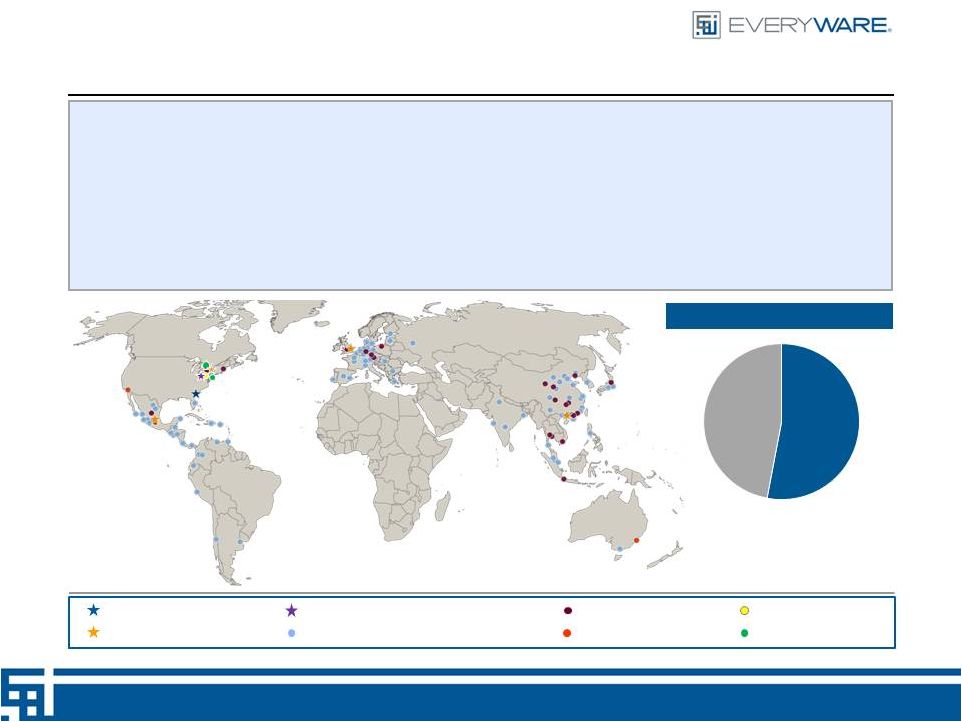 9
–
EveryWare is headquartered in Lancaster, OH and operates two best-in-class
manufacturing and distribution facilities •
Lancaster, OH: 900,000 sq. ft. owned manufacturing facility which houses
three furnaces and 15 production lines •
Monaca, PA: 400,000 sq. ft. owned manufacturing facility which houses one
furnace and 7 production lines •
Lancaster, OH: 1,300,000 sq. ft. leased distribution facility serving
Anchor’s global customers •
Savannah, GA: 500,000 sq. ft. leased distribution facility primarily serving
Oneida's domestic customers (1)
Includes licensed Oneida brand revenue at wholesale.
Broad Manufacturing and Distribution Infrastructure
Legend
Distribution Center and Warehouse
Regional Administrative Office
Production, Distribution, Warehousing and Sales
International Distributor Partners / Showrooms
Manufacturing Partners
Licenses
Production and Sales
Sales
2012 Gross Sales Mix
(1)
Manufactured
47%
Sourced
53%
–
Oneida utilizes a 100% outsourced manufacturing strategy, with no supplier
accounting for more than 14% of purchases –
Since 2008, EveryWare has invested approximately $58 million of capital into its
manufacturing locations, including investments to add capacity, upgrade
machinery and permanently remove costs |
 10
Significant Domestic and International Growth Opportunities
Segment
Market Indicators
Existing / New Growth Opportunities
–
Housing recovery
–
GDP growth
–
Consumer confidence
–
Strong expected international
GDP growth in Korea, Mexico
and Brazil
–
Rebound in Europe
–
Growth of U.S. brands in
foreign markets
–
Key manufacturing partners with leading OEMs
–
Leverage unique manufacturing capabilities and distribution
advantages
–
Identify future niche markets, similar to Specialty Liquor
–
Top 5 specialty customers averaged 22% growth
–
Generated a 28% CAGR from key products since 2009
–
Optimize existing infrastructure in UK, Mexico and China
–
Brand stratification and store re-branding
–
Recent penetration of Korea market
–
JV and distribution partners in key new markets
–
Leverage brand portfolio and product development
–
Continued emerging market penetration
Consumer
(39% of ‘12 Net Sales)
Foodservice
(32% of ‘12 Net Sales)
Specialty
(22% of ‘12 Net Sales)
International
(7% of ‘12 Net Sales)
–
Housing recovery
–
GDP growth
–
Consumer confidence
–
New product development
–
Brand stratification
–
Expansion to club, grocery, department store, specialty channels
–
Direct (e-commerce)
–
Continuous product innovation
–
Top 7 consumer accounts averaged 10% growth in 2012
–
Restaurant SSS growth and
square footage growth
–
Increasing hotel RevPAR
–
Convention industry recovery
–
Total tabletop solution
–
Logistics savings
–
Limited overlap between legacy Oneida and Anchor in foodservice
–
Category expansion –
WKI, Buffet, Euro, Strata
–
Logistics savings
–
Sales to the top 4 customers grew 14% in 2012 |
 Strong Focus to Advance the Business
11
Integration of Anchor Hocking and Oneida completed in 2012.
Merger agreement announced with ROI Acquisition Corp on January 31.
Distribution agreement with Korean distributor announced on February 28.
Successful completion of merger with ROI Acquisition Corp on May
21.
Strong first quarter 2013 announced on May 28.
Acquired the George Wilkinson and Samuel Groves business units of
Metalrax Housewares on June 18. |
 12
Metric
Long-Term Goals
Revenue
Growth
GAAP EPS
Growth
Adjusted
EBITDA
Margin
5% –
7%
15% –
18%
11% –13%
Commentary / Strategic Initiative
–
Broader international and channel penetration
–
Continued
product
innovation
to
provide
a
full
tabletop
solution
across
all channels and price points
–
Market share gains within consumer and foodservice channels
–
Low price sensitivity of beverage glass sales
–
Continued product stratification addressing all consumer segments
–
Leverage existing infrastructure and maintain proven pricing prowess
to expand margins
–
Earnings growth through revenue growth, margin expansion and
deleveraging
Experienced Team Driving Execution
International
% of Total Sales
40% |
 Appendix |
 14
Q1 2013 Performance
Total revenue increased 3.1% to $99.3 million, up from $96.4 million in the first
quarter of fiscal 2012
EBITDA
(1)
increased
58.1%
to
$9.1
million,
up
from
$5.8
million
in
the
first
quarter
of
fiscal
2012
Increased business with blue-chip customer base
Further synergies and cost savings generated from merger of Oneida and Anchor
Hocking (1) See slide 24 for a reconciliation of EBITDA to Net Income.
|
 Focus on International Growth
15
Focused on growth through both customer and product expansion
Anticipate meaningful growth in the UK in 2013
EveryWare announced acquisition of UK bakeware business on June 18
Acquisition brings additional iconic European brands to the platform
Anticipates will be accretive in the first 12 months, adding $14-$16mm in
revenue Purchased businesses for a low EBITDA multiple of <3x based on
first 12 months of EveryWare’s ownership
Adds manufacturing capabilities in the UK to help provide locally sourced
product Building on core offerings in Mexico
Reclaimed
License
in
January
for
Oneida
in
Mexico
–
re-launch
is
underway
with
product arriving on customers shelves in Q3, Q4
Opened new market in Korea
China adding retail sales on later half of the year to current Foodservice only
offering
EveryWare launches new company in Brazil and expands its international
footprint |
 2012 Sales Mix
(1)
16
EveryWare at a Glance
Leading Consumer Product Company
(1)
Presented as Gross Sales Less Returns.
Select Longstanding Blue-Chip Customer Base
Beverageware
18%
Consumer
39%
Foodservice
32%
Specialty
22%
International
7%
Dinnerware /
Serveware
20%
Pantry
19%
Flatware
16%
Food Prep
16%
Décor
4%
Spirits
4%
Industrial
3%
–
World’s largest marketer of flatware for the consumer
and foodservice industries
–
#1 or #2 market share position in key categories within
the consumer retail and institutional foodservice
markets
–
Leading designer, manufacturer and marketer of glass
products across retail, foodservice and specialty
channels
–
Highly recurring revenue model driven by replacement
purchases (Oneida –
70%, Anchor –
90%)
–
25+ year relationships with loyal blue-chip customers
–
Highly diversified customer base
–
Global footprint with broad manufacturing and
distribution infrastructure
–
$50bn global housewares and $2.7bn global
foodservice tabletop markets
–
FY2011A –
FY2013E Revenue CAGR of 25.2% and
Adj. EBITDA CAGR of 30.5%
•
Largest customer, Wal-Mart = 14% of 2012 sales
•
Products span all price points and categories
–
Leading, brand-focused, diversified, global marketer
and wholesaler of tabletop and food preparation
products for the consumer and foodservice markets
–
Led by the iconic Oneida and Anchor Hocking brands
–
Broadest tabletop platform in the industry |
 17
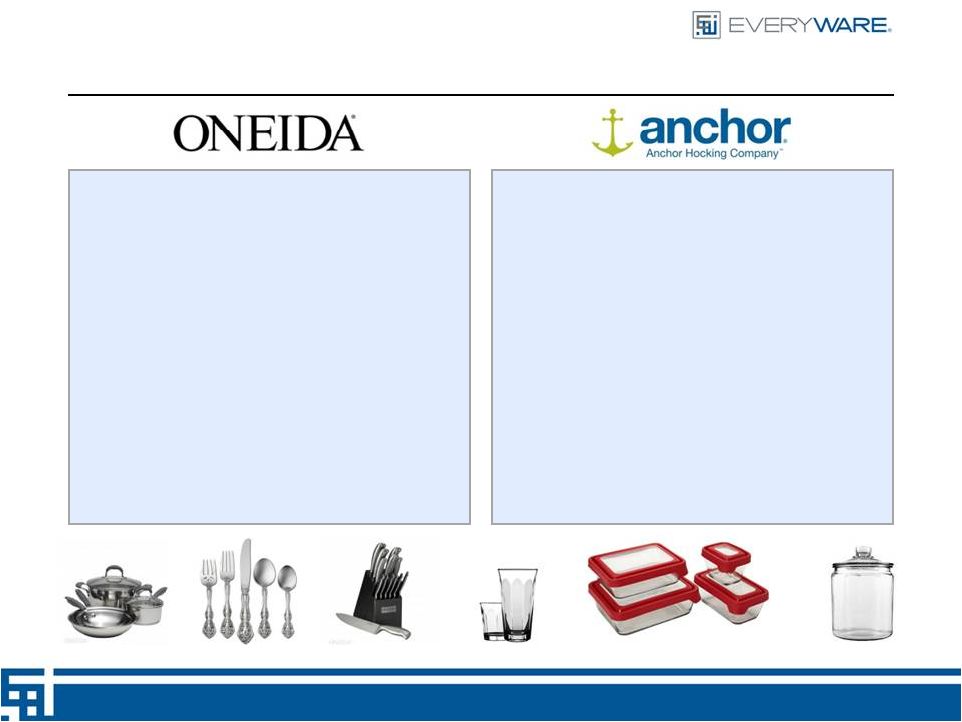
(1)
Based on Management’s estimates.
–
World’s largest marketer of flatware and dinnerware for the
consumer and foodservice industries
•
27% and 30% consumer flatware and foodservice flatware
market share
(1)
, respectively
•
#1 provider of flatware to both the consumer and
foodservice sectors
•
Largest supplier of dinnerware to the foodservice industry
in North America
•
Consistently ranked as the #1 tabletop brand according to
the Home Furnishings News (“HFN”) survey
–
Broad portfolio of over 5,700 products includes:
•
Flatware, dinnerware, crystal stemware, bakeware and
cookware
–
Serves a global customer base directly or through licensed
partners, primarily under the Oneida brand name
–
History extends more than 100 years
–
Leading designer, manufacturer and marketer of quality glass
products across retail, foodservice and specialty markets
channels
•
Most recognized glassware brand name in the U.S.
•
#1 or #2 market position in all its core glassware categories
•
#1 supplier of candle containers and premium spirit bottles
•
#2 in glass bakeware, drinkware and floral vases
•
#3 glassware supplier to the foodservice industry
•
Top five tabletop glassware producer worldwide
–
Broad portfolio of over 3,600 products includes:
•
Beverageware, stemware, bakeware, serveware, food
storage, candle containers, floral vases and specialty
products
Renowned Brand Names with a Diversified Brand Strategy
–
Presently serves a primarily North American customer base
–
History extends more than 100 years |
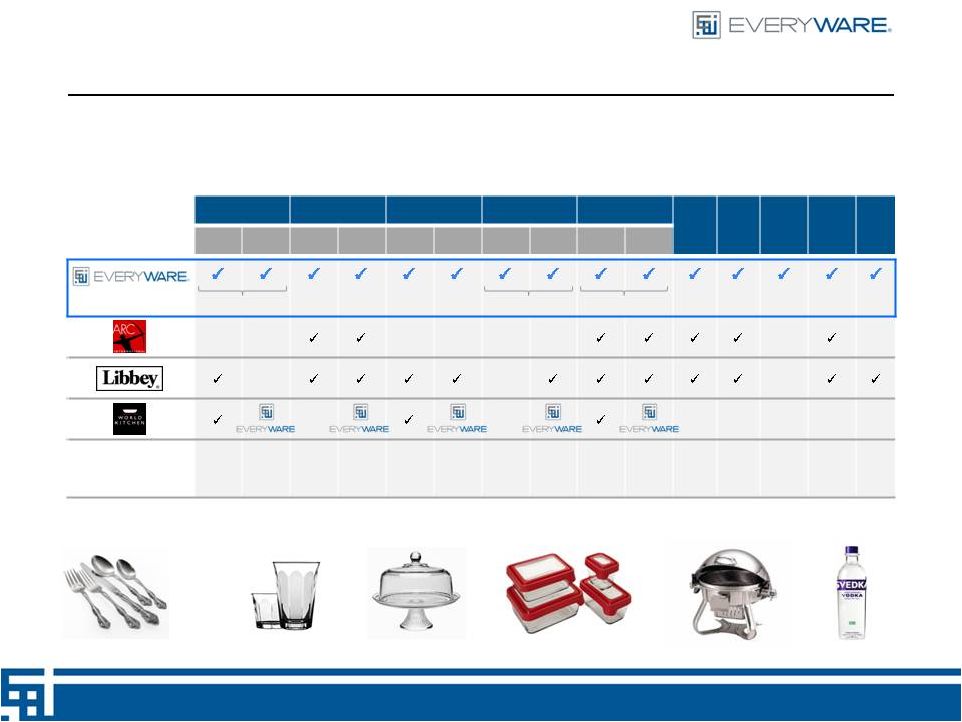 Leading Market Position vs Peers
18
(1)
Based on Management’s estimates.
(2)
#1 in Consumer glass dinnerware.
Bakeware
Beverageware
Dinnerware
Flatware
Serveware
Crystal
Candles
Premium
Spirit
Bottles
Industrial
/ Lighting
Floral
Consumer
Food-
service
Consumer
Food-
service
Consumer
Food-
service
Consumer
Food-
service
Consumer
Food-
service
Existing Channel
Market Positions
(1)
#2
#2
#3
#1
(2)
#1
#1
#1
#1
#1
#1
#1
#1
Others
Pasabahce
TTU
Waterford
Gibson
Steelite
Homer
Fortessa
Lenox
Cambridge
Lifetime
Hampton
Walco
Schott-
Zwisesel
Bormioli
Arkansas
Glass
The Glass
Group |
 19
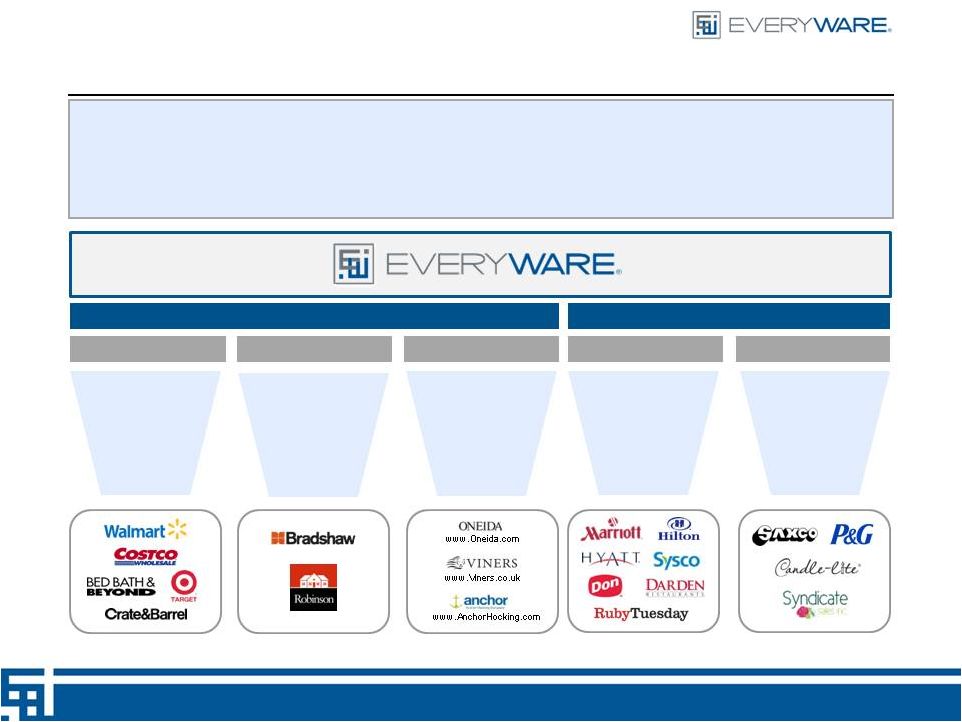
Foodservice / B2B
One of the most
experienced
foodservice
sales teams in
the industry
Established
OEM contracts
and direct selling
customers
–
Multiple go-to market strategies including owned brands, a
direct-to-consumer website and catalog business, licensing arrangements,
and distribution agreements
–
Enhanced direct relationship with consumer through branding, trend-right
colors / designs, unique product features and customized product strategy
by channel and category –
Diverse and flexible strategy promotes tailored approach to the marketplace and
optimized resource allocation Consumer / Retail
Strong, long-
standing retailer
relationships for
the combined
platform
High growth
direct-to-
consumer online
platform benefits
from combined
portfolio
High margin
licensing
business easily
expandable to
adjacent product
categories and
diverse markets
Longstanding, High-Quality and Diverse Customer Relationships
Retail
Licensing
Consumer Direct Online
Foodservice
OEM and Direct Sell |
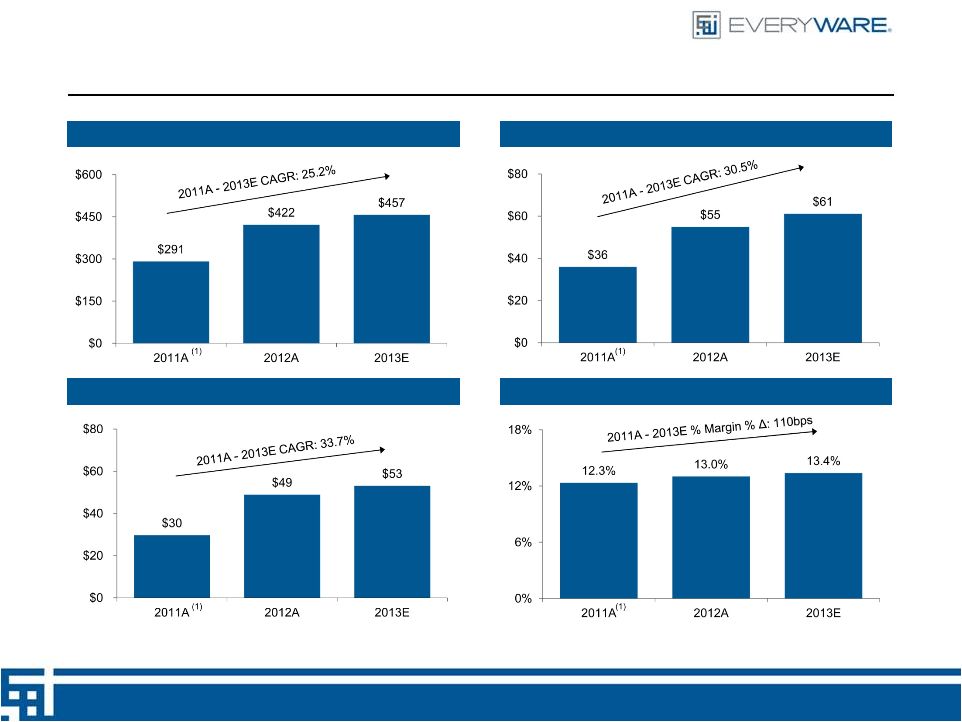 20
Historical and Projected Financial Performance
Net Sales ($mm)
Adjusted EBITDA
(2)
($mm)
Unleveraged Free Cash Flow
(3)
($mm)
Adjusted EBITDA
(2)
Margin (%)
(1)
2011 results include 12 months of Anchor and 2 months of Oneida.
(2)
See
“Adjusted
EBITDA
Reconciliation”
on
page 24.
(3)
Unleveraged Free Cash Flow is a non-GAAP measure and assumes FY2013E Furnace
Maintenance CapEx of $3.5 million. |
 21
Recurring Revenue Model and Owned Asset Base with High Replacement Cost
High Switching
Costs Drive Highly
Recurring Revenues
–
High switching costs associated with purchasing new tabletop collections drives
recurring revenue model
•
Oneida:
70% replenishment business and 30% new installations
•
Anchor:
90%
replenishment
business
and
10%
new
installations
Limited
Competition
From Low Cost
Glassware Imports
–
Minimal threat from international manufacturers given high shipping costs of
glassware •
Heavy weight of glass
•
Need for protective packaging, occupying a significant portion of total package
volume •
Higher breakage rates
Owned Asset
Base with High
Replacement Cost
–
Management estimates that it would require over $250 million of invested capital
to replicate EveryWare’s capabilities
•
Since 1983, no new tabletop glass production facilities have been opened in North
America •
There are no known plans underway for the construction of new glass
facilities –
Since 2008, EveryWare has invested approximately $58 million of capital into its
manufacturing locations, including investments to add capacity, upgrade
machinery and permanently remove costs •
Management estimates minimal incremental capital investment required (Maintenance
CapEx of ~1.5% of net sales)
–
Long-term investments based on well-recognized, iconic brands and
confidence in replacement product availability
–
Consistency of models increases customer stickiness
–
EveryWare can significantly increase its foodservice glass revenue and accommodate
incremental sourced business without significant expansion capital
expenditures |
 22
Large, Addressable Industry with Positive Tailwinds and Dynamics
U.S.
Single-Family
New
Home
Sales
(000s)
(2)
U.S. Consumer Confidence Index
(1)
(1)
Source: The Conference Board. Data represents U.S. Consumer Confidence
Index (1985 = 100) on a monthly basis as of February 26, 2013.
(2)
Source: U.S. Census Bureau. Data represents new single-family houses
sold (in thousands) in the United States on a monthly basis as of February 26, 2013. Note: Seasonally adjusted for annual rate.
(3)
Source: Wall Street research.
(4)
Source:
Wall
Street
research.
Data
represents
average
same
store
sales
growth
for
a
representative
sample
of
public
casual
and
fine
dining
restaurants.
STRICTLY CONFIDENTIAL
–
EveryWare
participates
in
the
large
$50
billion
global
housewares
and
$2.7
billion
global
foodservice
tabletop
markets,
of
which
the
U.S. represents $12.2 billion (tabletop and food preparation) and $990 million
(restaurant and beyond restaurant), respectively –
The U.S. tabletop, food preparation, restaurant, and beyond restaurant markets in
which EveryWare competes represent $4.9 billion, $7.3 billion, $580
million, and $410 million markets, respectively Restaurant
Industry
Same
Store
Sales
(4)
Lodging RevPAR (% change)
(3) |
 23
Experienced Team; Execution Focused
Name
Title
Industry
Experience
Prior Experience
John Sheppard
Chief Executive Officer
22
Cott, Coca-Cola
Bernard Peters
EVP and Chief Financial Officer
14
Heartland Automotive Services, Pampered Chef, Marriott, Coca-Cola
Bert Filice
SVP North America Sales
25
Trudeau N.A., Coopers & Lybrand
Jaci Volles
Chief Marketing Officer
28
Lifetime Brands, May Department Stores
Colin Walker
SVP International
12
Cott, DHR International, Deloitte, Imasco, Canada Trust
Dan Taylor
SVP Operations
21
World Kitchen, Corning
Kerri Love
SVP, General Counsel and
Secretary
16
Greif, VIA NET.WORKS |
 24
Reconciliation of Net Income (Loss) to EBITDA & Adjusted EBITDA
Quarters ended March 31,
Twelve months ended December 31,
2012
2013
2011A
2012A
2013E
Net Income (loss)
$ (6,283)
$ 197
$ 7,521
$ (3,957)
$ 17,085
Interest
9,819
4,139
6,794
22,536
17,549
Taxes
(1,040)
902
2,929
(585)
10,034
Depreciation
2,379
2,871
7,065
10,298
12,412
Amortization
898
1,018
715
4,299
4,039
EBITDA
5,773
9,127
25,024
32,591
61,119
Restructuring
2,298
361
2,001
6,877
-
Acquisition/Merger-Related Transaction Fees
419
664
3,200
3,685
-
Inventory Writedown
945
263
1,906
2,498
-
Management Fees
704
625
1,834
2,594
-
Other
101
429
1,948
1,247
-
Annualization of proforma cost savings
-
-
-
4,552
-
Impact of unwind of natural gas hedges
-
-
-
2,843
-
PF Public Company Expenses
-
-
-
(2,000)
-
Adjusted EBITDA
$ 10,240
$ 11,469
$ 35,913
$ 54,887
$ 61,119 |