Attached files
| file | filename |
|---|---|
| 8-K - 8-K - CHRISTOPHER & BANKS CORP | form8-kminneapolisinvestor.htm |

Charting Our Path to Profitability June 2013

Certain statements on the slides which follow may be forward-looking statements about Christopher & Banks Corporation (the “Company”). Such forward-looking statements involve risks and uncertainties which may cause actual results to differ. These forward-looking statements may be identified by such terms as “will”, “expect”, “believe”, “anticipate”, “outlook”, “target”, “plan”, “initiatives”, “estimated”, “strategy” and similar terms. You are directed to the cautionary statements regarding risks or uncertainties described in the Company’s filings with the Securities and Exchange Commission, including our most recent Annual Report on Form 10-K and other SEC filings made since the date of that 10-K report. Participants are cautioned not to place undue reliance on such forward-looking statements, which reflect management’s views only as of June 18, 2013. The Company undertakes no obligation to update or revise the forward-looking statements. 2 Safe Harbor

Our Vision & Mission Vision: To become her trusted brand by delivering style and value every day. Mission: To provide women of all sizes, apparel and accessories with style and versatility that reflects who she is; lasting quality and affordable value she expects; delivered with the personalized attention she deserves. 3

4 An established brand targeting the baby boomer market with fashionable assortments that meet our customers’ needs for style, versatility and value 601 stores in two primary brand concepts: 376 Christopher & Banks stores – missy & petite - with an average of 3,300 square feet per store 154 CJ Banks stores– size 14 & more - with an average of 3,600 square feet per store We operate an additional 45 MPW (Missy, Petite, Women) stores and 26 outlet stores E-commerce sites for each brand Company Overview

Our Core Customer Target baby boomers - 45-60 years Avg. household income $70k-$75k More than 50% higher than US avg. 70% work outside of the home 2/3 married Purchases 3.2 times annually Self-reports that she visits more frequently Spends $139 annually On average, $43 per purchase 5

6 New senior management team and re-energized organization LuAnn Via, President and CEO, joined November 26, 2012; a 30+ year retail executive veteran: President and CEO of Payless ShoeSource, Inc. Group Divisional President of Lane Bryant and Cacique President of Catherines Stores, Inc. Vice President, General Merchandise Manager of Sears Holding Company Senior Vice President, General Merchandise Manager of Product Development at Saks, Inc. Peter Michielutti, joined as SVP and CFO in April 2012; brings more than 20 years retail finance experience: CFO of Whitehall Jewelers CFO of Wilsons Leather CFO of Fingerhut Two Divisional General Merchandise Managers appointed December 2011 New VP of eCommerce and Digital Marketing came on board April 1, 2013 New Senior Management

Introduction: Senior Leadership Team Michelle Rice – SVP, Store Operations Monica Dahl - SVP, Marketing Luke Komarek - SVP, General Counsel Cindy Stemper – SVP, Human Resources Lisa Klein - VP, Information Technology and P&A Ann McDermott – GMM, Christopher & Banks Tricia Perket – GMM, CJ Banks Mike Tripp – VP, Supply Chain and Logistics Donna Fauchald - VP, Real Estate Brad Smith – VP, eCommerce and Digital Marketing 7

Corporate Strategic Initiatives 8 Elements of Strategic Initiatives Focused assortments and merchandising Improved price/value equation Targeted messaging and marketing Enhanced store experience Operational Excellence

9 Balanced assortments to offer the right mix of merchandise Continued reduction of the number of styles and SKUs while increasing depth in a greater number of key styles Rebalanced mix of good/better/best with greater emphasis on good and better Delivering fashionable, age appropriate clothing that fits a real woman Focused on style, quality and value along with versatility and great fit Providing easy, complete outfitting with complementing accessories Improved inventory flow for freshness and increased productivity Reduced floor sets to six versus twelve, continuing to evaluate further reduction Increased depth and greater number of key styles; supplemented with small deliveries Increased efficiencies with adjustments in the product development cycle to improve speed to market Improved lifecycle performance bodes well for merchandise margins Focused Assortments and Merchandising

10 Offering an improved price/value proposition that has resonated well with customers Providing more attractive opening price points Simplified pricing structure and reduced ticket prices on average by 20% Expanding top 10 key programs at key price points Driving higher full price selling with right product, more balanced mix of good/better/best and clear value message Improved Price/Value Equation

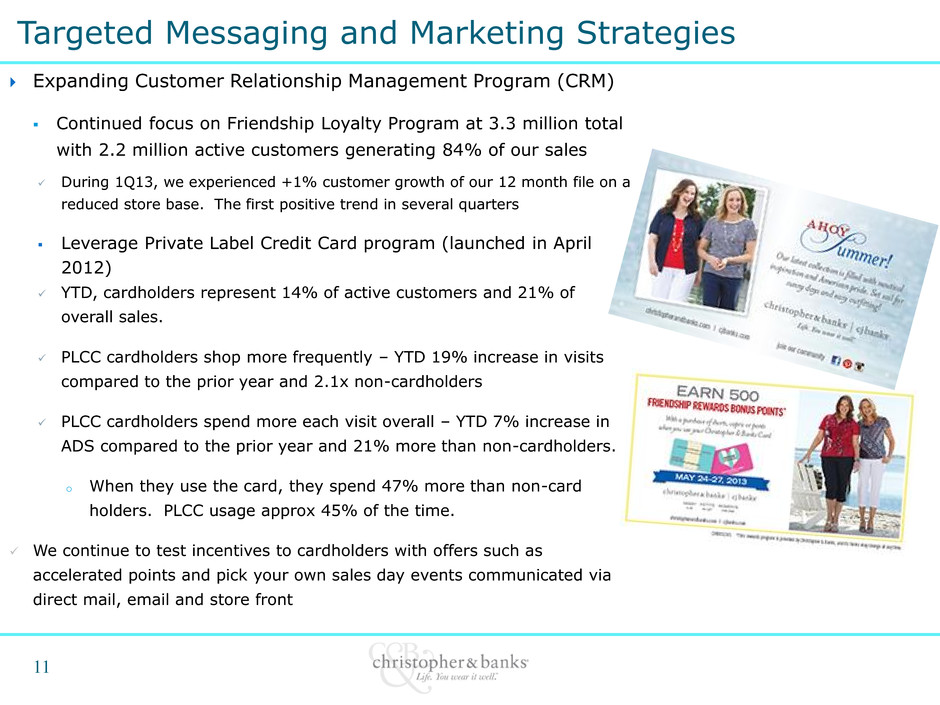
11 Expanding Customer Relationship Management Program (CRM) Continued focus on Friendship Loyalty Program at 3.3 million total with 2.2 million active customers generating 84% of our sales During 1Q13, we experienced +1% customer growth of our 12 month file on a reduced store base. The first positive trend in several quarters Leverage Private Label Credit Card program (launched in April 2012) YTD, cardholders represent 14% of active customers and 21% of overall sales. PLCC cardholders shop more frequently – YTD 19% increase in visits compared to the prior year and 2.1x non-cardholders PLCC cardholders spend more each visit overall – YTD 7% increase in ADS compared to the prior year and 21% more than non-cardholders. o When they use the card, they spend 47% more than non-card holders. PLCC usage approx 45% of the time. We continue to test incentives to cardholders with offers such as accelerated points and pick your own sales day events communicated via direct mail, email and store front Targeted Messaging and Marketing Strategies

12 Increased effective direct marketing efforts Coming off of a successful 4Q12 where we generated twice the incremental sales of the same numbers of mailings during the prior year 1Q13 continued to see extremely profitable and effective direct mail campaigns particularly in March with the launch of the spring season and fashion event. We continue to test frequency, depth and offers to understand the potential for increased investment. Continue to integrate merchandise product and promotional messages into effective email communications Enhanced pre-planned promotional strategy Increased targeted category promotions and reduced store- wide events Refined store signage to drive traffic and provide clarity of offer Supplemented in-store offers with effective bounce-backs for repeat visits Targeted Messaging and Marketing (cont’d)

Enhanced Store Experience Refreshing “Selling with Care” program Introducing additional selling techniques Supporting with additional learning tools such as videos Adding selling hours to increase service levels Re-enforcing clientelling as key to selling culture Talent Expanded training and development programs Revised and enhanced On-boarding Program by providing updated and cohesive new hire checklists Visual merchandising enhancements Creating strong brand message through signing and overall visual displays of new product offerings Provided additional direction on brand standards to create consistency from store to store Update store presentation with addition of mannequins, tables and props Leveraging special events to foster relationships & differentiate from the competition In-store seasonal Fashion Events Maximize grassroots opportunities i.e.; women’s conventions, leadership conferences & women’s clubs 13

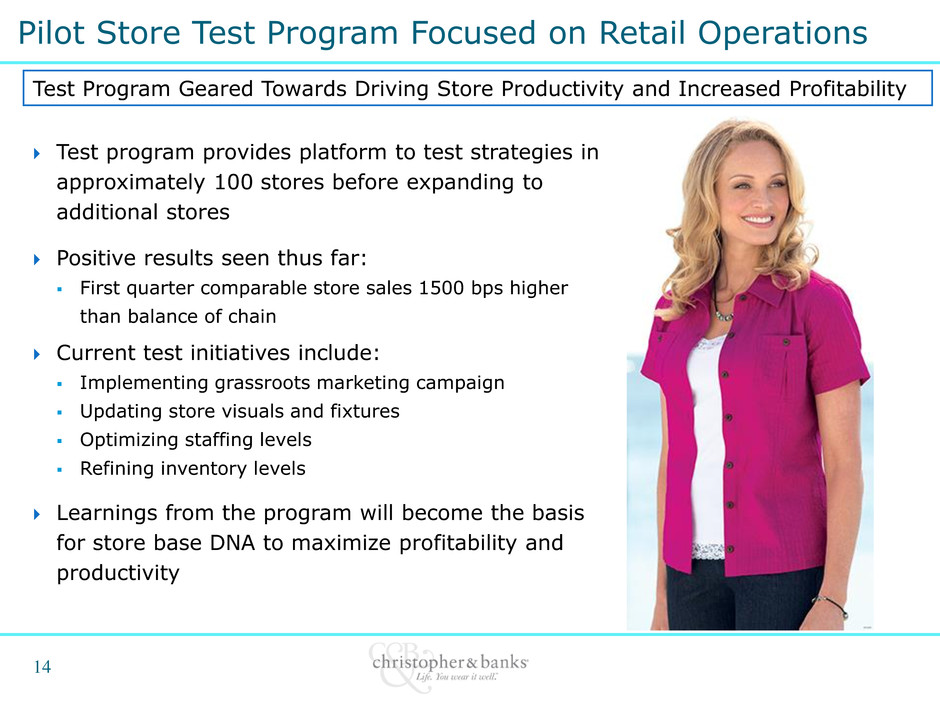
14 Test program provides platform to test strategies in approximately 100 stores before expanding to additional stores Positive results seen thus far: First quarter comparable store sales 1500 bps higher than balance of chain Current test initiatives include: Implementing grassroots marketing campaign Updating store visuals and fixtures Optimizing staffing levels Refining inventory levels Learnings from the program will become the basis for store base DNA to maximize profitability and productivity Pilot Store Test Program Focused on Retail Operations Test Program Geared Towards Driving Store Productivity and Increased Profitability

15 Plan to open 5 outlet stores and two MPW stores in fiscal 2013 Longer term, openings are expected to be primarily outlet stores Evaluating opportunities to convert Christopher & Banks and CJ Banks single brand stores into MPW stores Better serve our customer with full complement of missy, petite and women’s sizes in one location Methodical and disciplined bottoms-up approach to real estate Analyze sales and margin productivity across categories and size ranges in each location to determine where there is opportunity to maximize productivity Plan to combine 6 Christopher & Banks and 6 CJ Banks stores into 6 MPW stores Real Estate Strategy

16 Unique customer niche largely ignored by others Multi-channel strategy with small market focus Strategic initiatives driving improved sales and merchandise margin performance Significant operating margin expansion opportunity Enhanced balance sheet with improved liquidity and flexibility Strengthened management team and Board of Directors Investment Highlights

Financial Highlights

18 Total comparable sales for first quarter up 23.4% Compared to a 18.5% increase in the fourth quarter and a 14.6% decrease in last year’s first quarter Improved conversion rates and higher units per transactions led to 11.4% increase in average transactions per store Despite operating an average of 10.5% fewer stores, sales for the quarter grew 15.9% as compared to the same period last year Gross margin in the first quarter of 34.2% compared to 23.1% for last year’s first quarter Merchandise margin rate accounts for two-thirds of improvement Leveraging of buying and occupancy accounted for one-third Improved Financial Performance

19 Thirteen Weeks Ended May 4, 2013 Thirteen Weeks Ended April 28, 2012 Net Sales $108.5 $93.6 Gross Profit $37.1 $21.7 Gross Margin 34.2% 23.1% Selling, General & Administrative $32.7 $30.8 SG&A as % of sales 30.1% 32.9% Depreciation & Amortization $3.4 $5.0 Operating Income (Loss) $0.8 ($13.4) Net Income (Loss) $0.6 ($13.4) Adjusted Net Income (Loss)* $0.8 ($14.2) Diluted EPS $0.02 ($0.38) First Quarter Income Statement Summary * Excluding impairment and restructuring

20 May 4, 2013 April 28, 2012 Cash and Investments $40.5 $33.7 Merchandise Inventories 43.0 44.5 Property and Equipment, net 38.8 52.9 Total Assets $136.3 $140.3 Long -Term Debt — — Stockholders’ Equity $76.7 $76.4 Balance Sheet Summary

21 For the second quarter: Expect comparable store sales to increase in the high single digits Expect 450 to 550 basis points of gross margin improvement, split between improved merchandise margins, three-fourths, and positive leverage on occupancy expense, one-fourth. Expect SG&A dollars to be between 30.5% and 31.0% of sales For Fiscal 2013: Expect capital expenditures to be approximately $10.0 - $10.5 million Fiscal 2013 Outlook
