Attached files
| file | filename |
|---|---|
| 8-K - 8-K - Beneficial Mutual Bancorp Inc | a13-15108_18k.htm |
Exhibit 99.1
|
|
BENEFICIAL MUTUAL BANCORP INVESTOR PRESENTATION JUNE 18, 2013 |
|
|
2 SAFE HARBOR STATEMENT THIS PRESENTATION MAY CONTAIN PROJECTIONS AND OTHER “FORWARD-LOOKING STATEMENTS” WITHIN THE MEANING OF THE FEDERAL SECURITIES LAWS. THESE STATEMENTS ARE NOT HISTORICAL FACTS, RATHER STATEMENTS BASED ON THE CURRENT EXPECTATIONS OF BENEFICIAL MUTUAL BANCORP, INC. (THE “COMPANY”) REGARDING ITS BUSINESS STRATEGIES, INTENDED RESULTS AND FUTURE PERFORMANCE. FORWARD-LOOKING STATEMENTS ARE PRECEDED BY TERMS SUCH AS “EXPECTS,” “BELIEVES,” “ANTICIPATES,” “INTENDS” AND SIMILAR EXPRESSIONS. MANAGEMENT’S ABILITY TO PREDICT RESULTS OR THE EFFECT OF FUTURE PLANS OR STRATEGIES IS INHERENTLY UNCERTAIN. FACTORS THAT COULD AFFECT ACTUAL RESULTS INCLUDE INTEREST RATE TRENDS, THE GENERAL ECONOMIC CLIMATE IN THE MARKET AREA IN WHICH THE COMPANY OPERATES, AS WELL AS NATIONWIDE, THE COMPANY’S ABILITY TO CONTROL COSTS AND EXPENSES, COMPETITIVE PRODUCTS AND PRICING, LOAN DELINQUENCY RATES, CHANGES IN FEDERAL AND STATE LEGISLATION AND REGULATION AND OTHER FACTORS THAT MAY BE DESCRIBED IN THE COMPANY’S FILINGS WITH THE SECURITIES AND EXCHANGE COMMISSION, INCLUDING ITS ANNUAL REPORTS ON FORM 10-K AND QUARTERLY REPORTS ON FORM 10-Q AND OTHER REQUIRED FILINGS. THESE FACTORS SHOULD BE CONSIDERED IN EVALUATING THE FORWARD-LOOKING STATEMENTS AND UNDUE RELIANCE SHOULD NOT BE PLACED ON SUCH STATEMENTS. THE COMPANY ASSUMES NO OBLIGATION TO UPDATE ANY FORWARD-LOOKING STATEMENTS. THIS PRESENTATION INCLUDES INTERIM AND UNAUDITED FINANCIALS, WHICH ARE SUBJECT TO FURTHER REVIEW BY THE COMPANY’S INDEPENDENT ACCOUNTANTS. |
|
|
3 PRESENTATION TOPICS OUR MARKET CURRENT FOCUS Q1 2013 FINANCIAL HIGHLIGHTS OTHER MATTERS |
|
|
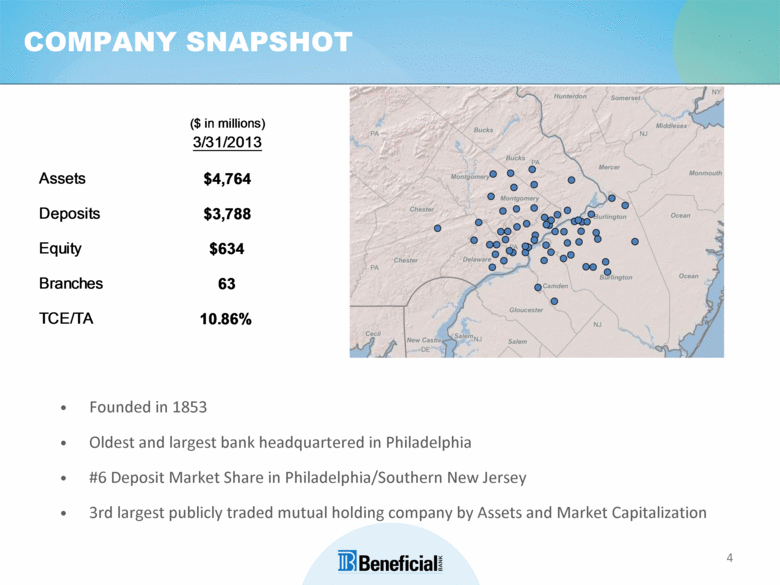
4 COMPANY SNAPSHOT Founded in 1853 Oldest and largest bank headquartered in Philadelphia #6 Deposit Market Share in Philadelphia/Southern New Jersey 3rd largest publicly traded mutual holding company by Assets and Market Capitalization |
|
|
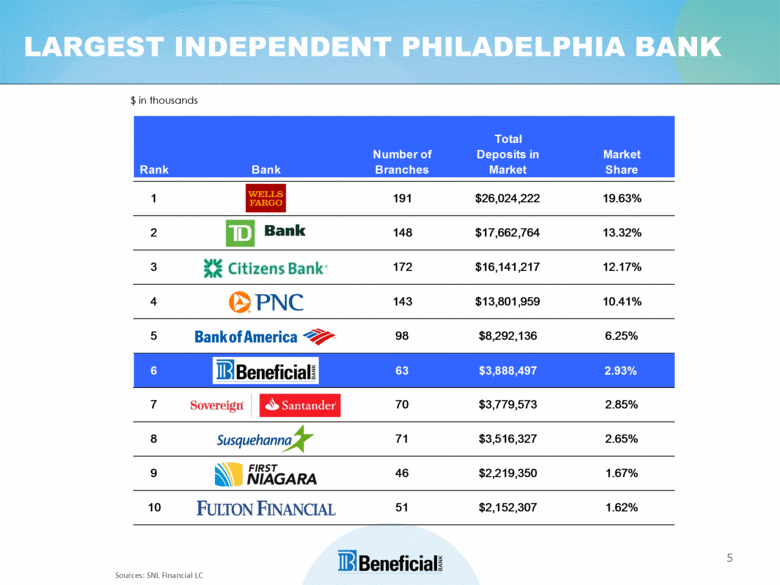
5 LARGEST INDEPENDENT PHILADELPHIA BANK Sources: SNL Financial LC $ in thousands |
|
|
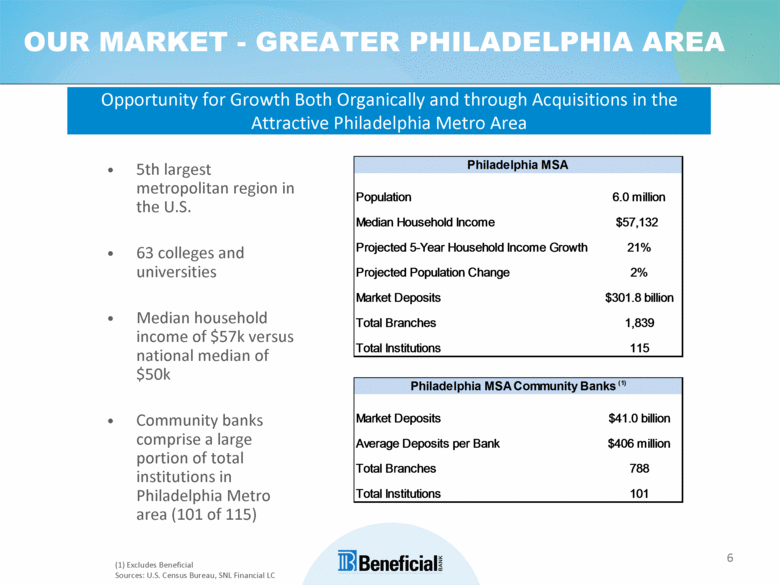
6 OUR MARKET - GREATER PHILADELPHIA AREA (1) Excludes Beneficial Sources: U.S. Census Bureau, SNL Financial LC Opportunity for Growth Both Organically and through Acquisitions in the Attractive Philadelphia Metro Area 5th largest metropolitan region in the U.S. 63 colleges and universities Median household income of $57k versus national median of $50k Community banks comprise a large portion of total institutions in Philadelphia Metro area (101 of 115) |
|
|
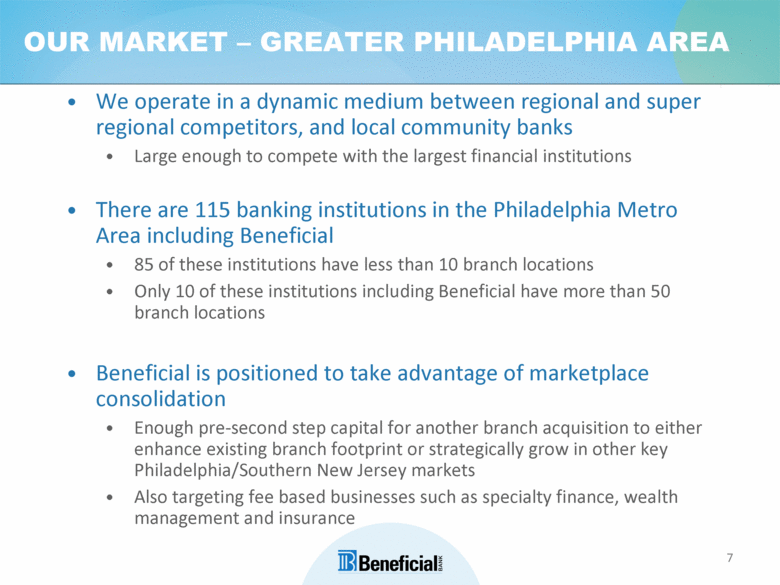
7 OUR MARKET – GREATER PHILADELPHIA AREA We operate in a dynamic medium between regional and super regional competitors, and local community banks Large enough to compete with the largest financial institutions There are 115 banking institutions in the Philadelphia Metro Area including Beneficial 85 of these institutions have less than 10 branch locations Only 10 of these institutions including Beneficial have more than 50 branch locations Beneficial is positioned to take advantage of marketplace consolidation Enough pre-second step capital for another branch acquisition to either enhance existing branch footprint or strategically grow in other key Philadelphia/Southern New Jersey markets Also targeting fee based businesses such as specialty finance, wealth management and insurance |
|
|
8 PRESENTATION TOPICS OUR MARKET CURRENT FOCUS Q1 2013 FINANCIAL HIGHLIGHTS OTHER MATTERS |
|
|
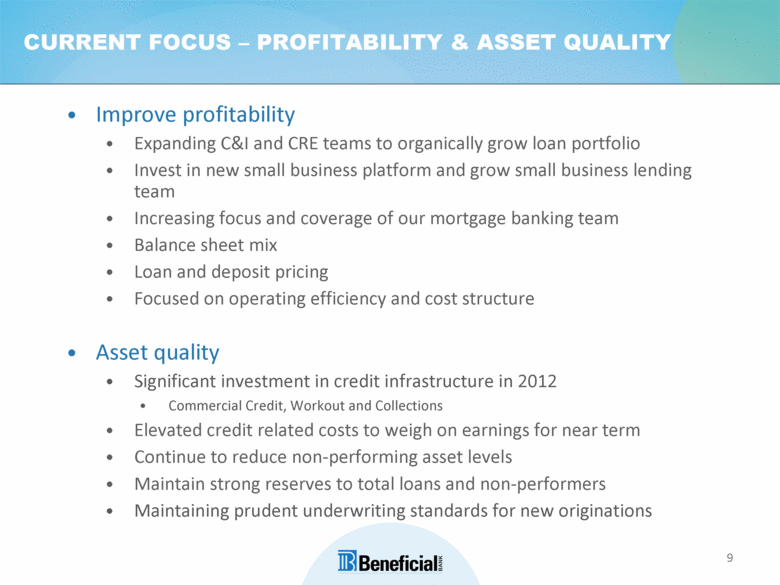
9 CURRENT FOCUS – PROFITABILITY & ASSET QUALITY Improve profitability Expanding C&I and CRE teams to organically grow loan portfolio Invest in new small business platform and grow small business lending team Increasing focus and coverage of our mortgage banking team Balance sheet mix Loan and deposit pricing Focused on operating efficiency and cost structure Asset quality Significant investment in credit infrastructure in 2012 Commercial Credit, Workout and Collections Elevated credit related costs to weigh on earnings for near term Continue to reduce non-performing asset levels Maintain strong reserves to total loans and non-performers Maintaining prudent underwriting standards for new originations |
|
|
10 CURRENT FOCUS – COMMERICAL LENDING New Commercial Lending Organizational Structure in place Created separate C&I and Commercial Real Estate teams in 2012, as well as a new Business Development group Recruiting/building Commercial Real Estate, C&I, and Small Business lending teams (goal of adding 12-15 new lenders) Targeting in-market relationship building and maximizing opportunities from existing relationships Preparing to take advantage of opportunities when the economy improves and loan demand grows in our region |
|
|
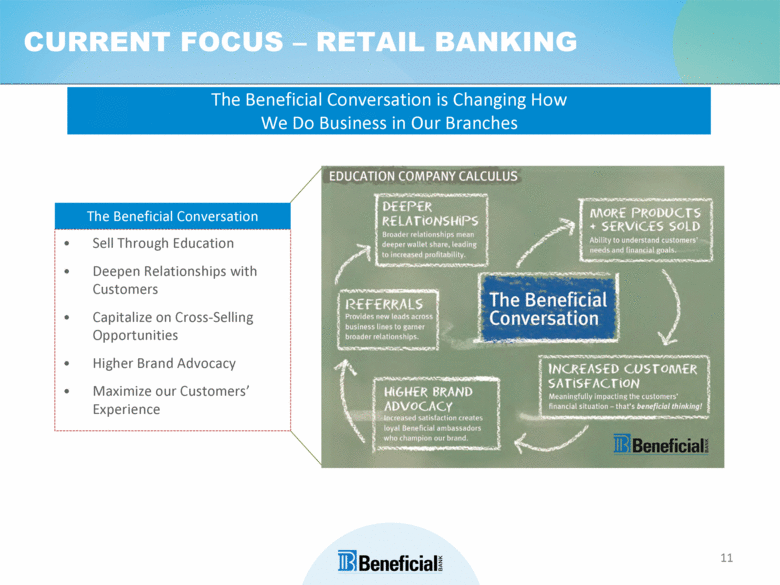
11 CURRENT FOCUS – RETAIL BANKING The Beneficial Conversation is Changing How We Do Business in Our Branches Sell Through Education Deepen Relationships with Customers Capitalize on Cross-Selling Opportunities Higher Brand Advocacy Maximize our Customers’ Experience The Beneficial Conversation |
|
|
12 CURRENT FOCUS – RETAIL BANKING Continue to provide superior customer service as recognized by J.D. Power & Associates as # 1 in Mid-Atlantic Region and # 2 in the U.S. Align our products and services to our customers’ needs Mobile Banking Bill Pay (2013) Remote Deposit Capture (2013) On-line Account Opening (2013) Devon and Springfield campuses opened in the first quarter of 2013. Three additional campuses being constructed late 2013; early 2014. Improve pricing and mix of deposits |
|
|
13 CURRENT FOCUS – MORTGAGE BANKING Development of new Mortgage Banking Team began in the second quarter of 2011 Continue to build team out in all counties throughout our footprint Representatives develop relationships in our footprint and support our branch network; no out-of-market origination Have generated $375 million of mortgage originations since Q3 2011 |
|
|
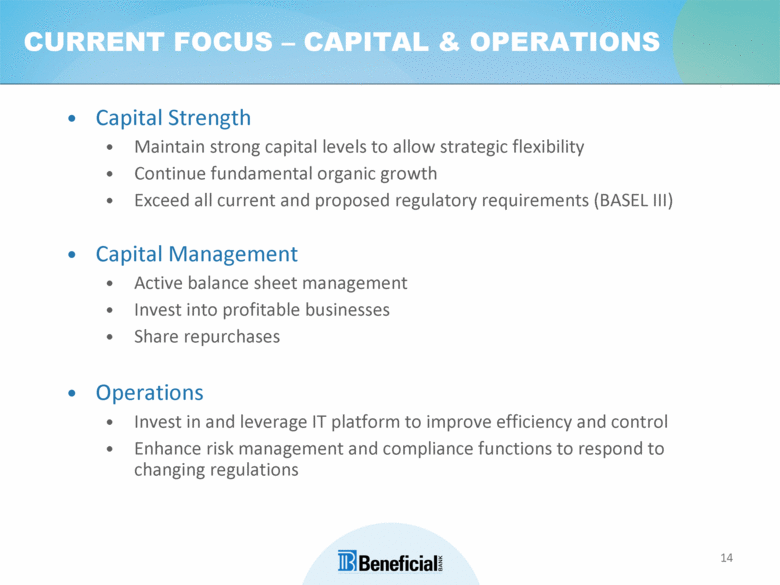
14 CURRENT FOCUS – CAPITAL & OPERATIONS Capital Strength Maintain strong capital levels to allow strategic flexibility Continue fundamental organic growth Exceed all current and proposed regulatory requirements (BASEL III) Capital Management Active balance sheet management Invest into profitable businesses Share repurchases Operations Invest in and leverage IT platform to improve efficiency and control Enhance risk management and compliance functions to respond to changing regulations |
|
|
15 PRESENTATION TOPICS OUR MARKET CURRENT FOCUS Q1 2013 FINANCIAL HIGHLIGHTS OTHER MATTERS |
|
|
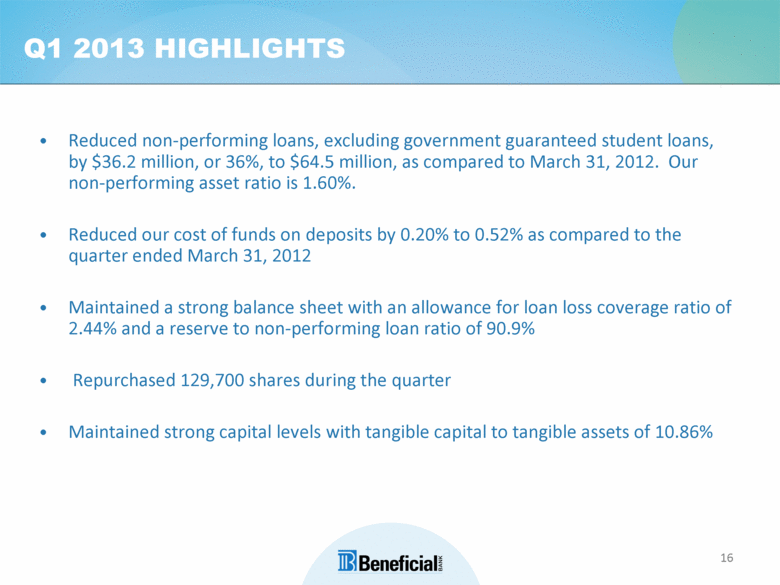
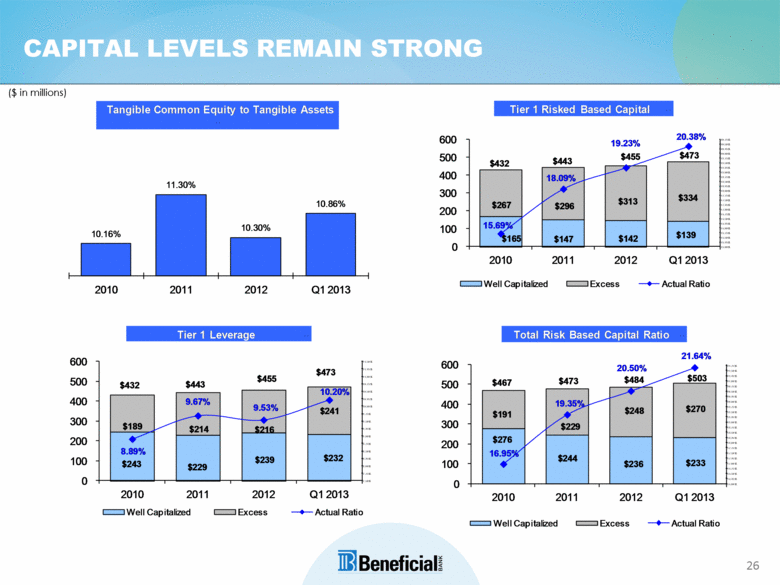
16 Q1 2013 HIGHLIGHTS Reduced non-performing loans, excluding government guaranteed student loans, by $36.2 million, or 36%, to $64.5 million, as compared to March 31, 2012. Our non-performing asset ratio is 1.60%. Reduced our cost of funds on deposits by 0.20% to 0.52% as compared to the quarter ended March 31, 2012 Maintained a strong balance sheet with an allowance for loan loss coverage ratio of 2.44% and a reserve to non-performing loan ratio of 90.9% Repurchased 129,700 shares during the quarter Maintained strong capital levels with tangible capital to tangible assets of 10.86% |
|
|
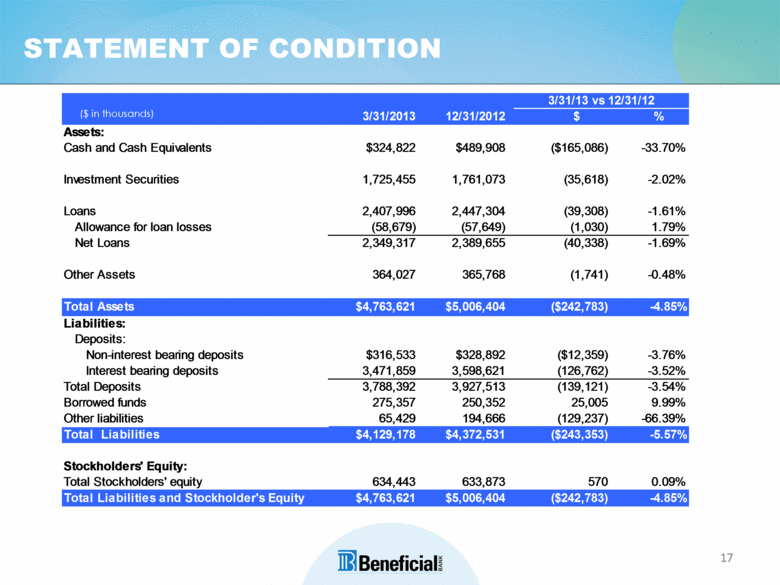
17 STATEMENT OF CONDITION ($ in thousands) |
|
|
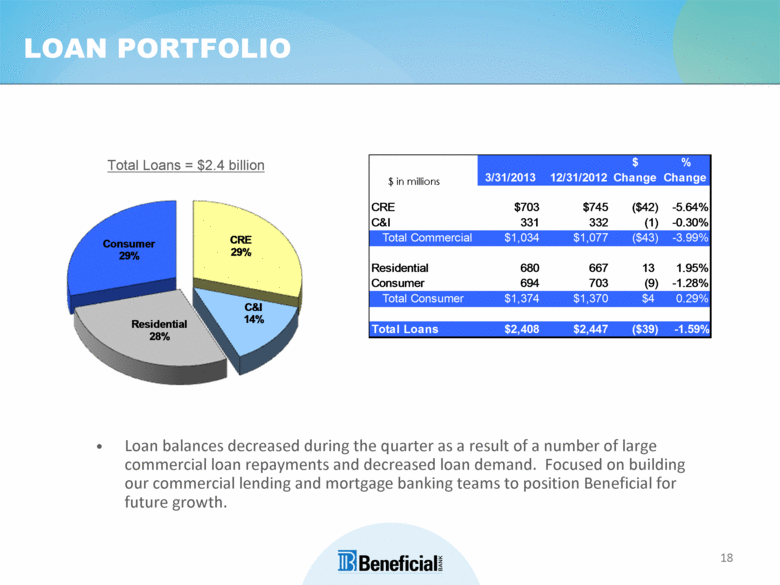
18 LOAN PORTFOLIO Total Loans = $2.4 billion $ in millions Loan balances decreased during the quarter as a result of a number of large commercial loan repayments and decreased loan demand. Focused on building our commercial lending and mortgage banking teams to position Beneficial for future growth. |
|
|
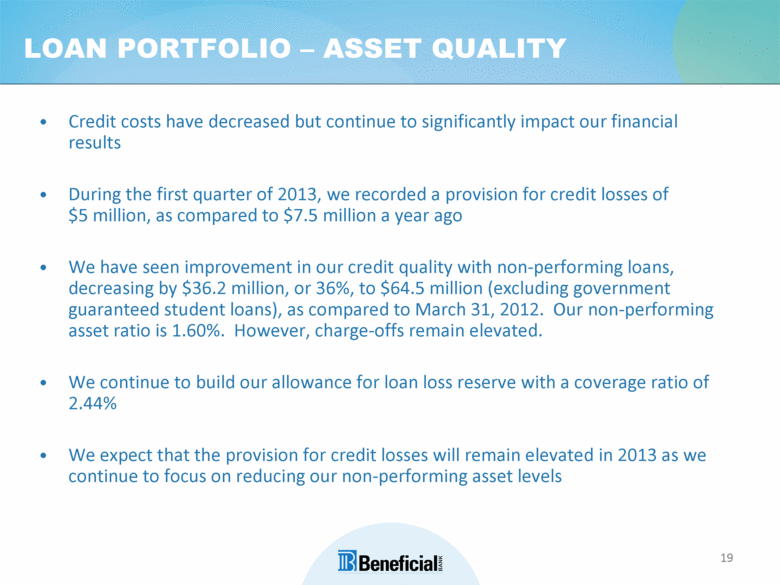
19 LOAN PORTFOLIO – ASSET QUALITY Credit costs have decreased but continue to significantly impact our financial results During the first quarter of 2013, we recorded a provision for credit losses of $5 million, as compared to $7.5 million a year ago We have seen improvement in our credit quality with non-performing loans, decreasing by $36.2 million, or 36%, to $64.5 million (excluding government guaranteed student loans), as compared to March 31, 2012. Our non-performing asset ratio is 1.60%. However, charge-offs remain elevated. We continue to build our allowance for loan loss reserve with a coverage ratio of 2.44% We expect that the provision for credit losses will remain elevated in 2013 as we continue to focus on reducing our non-performing asset levels |
|
|
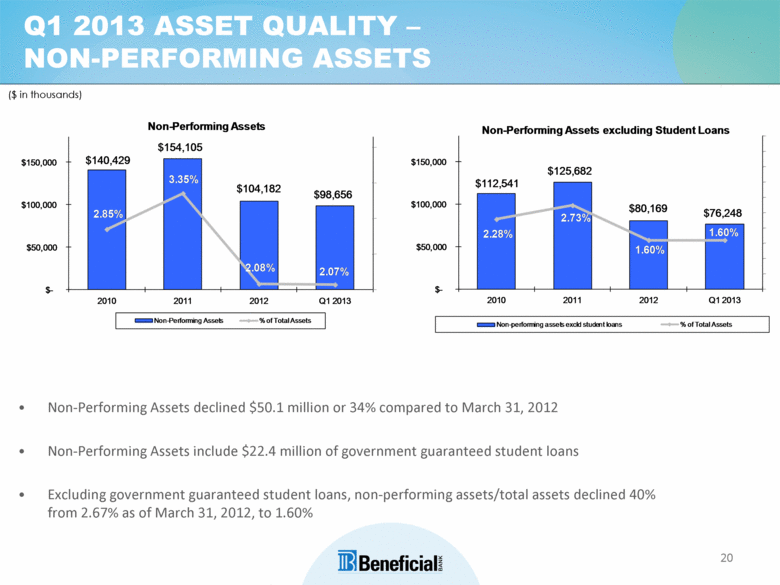
20 Q1 2013 ASSET QUALITY – NON-PERFORMING ASSETS ($ in thousands) Non-Performing Assets declined $50.1 million or 34% compared to March 31, 2012 Non-Performing Assets include $22.4 million of government guaranteed student loans Excluding government guaranteed student loans, non-performing assets/total assets declined 40% from 2.67% as of March 31, 2012, to 1.60% |
|
|
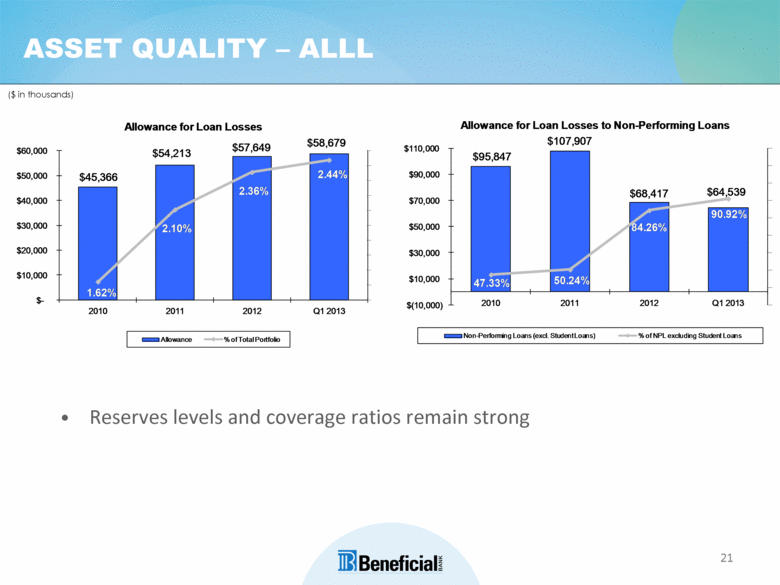
21 ASSET QUALITY – ALLL ($ in thousands) Reserves levels and coverage ratios remain strong |
|
|
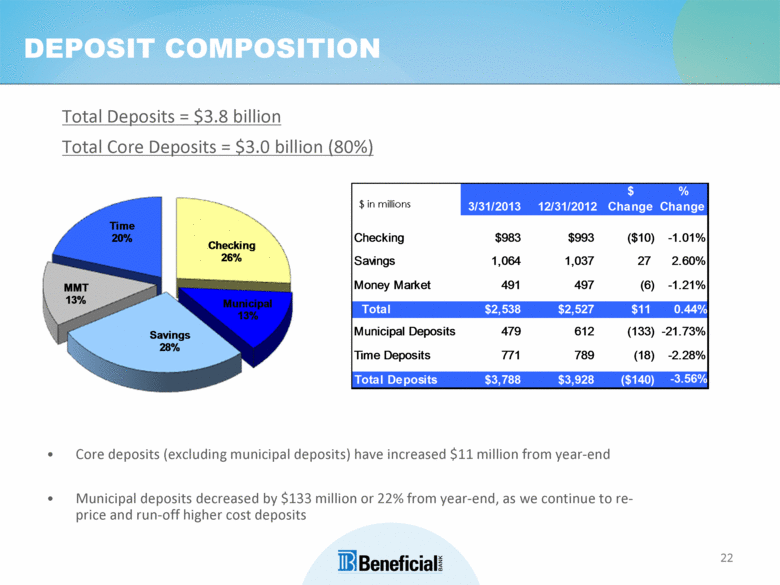
22 DEPOSIT COMPOSITION $ in millions Total Deposits = $3.8 billion Total Core Deposits = $3.0 billion (80%) Core deposits (excluding municipal deposits) have increased $11 million from year-end Municipal deposits decreased by $133 million or 22% from year-end, as we continue to re-price and run-off higher cost deposits |
|
|
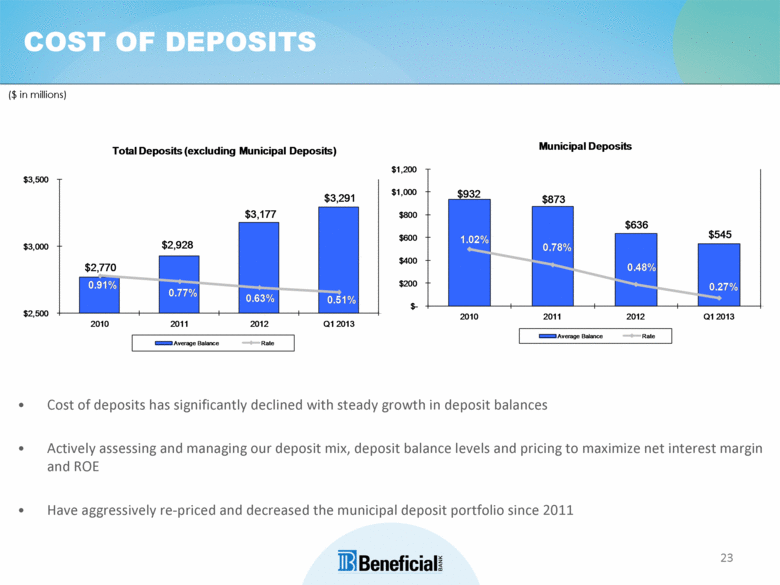
23 COST OF DEPOSITS ($ in millions) Cost of deposits has significantly declined with steady growth in deposit balances Actively assessing and managing our deposit mix, deposit balance levels and pricing to maximize net interest margin and ROE Have aggressively re-priced and decreased the municipal deposit portfolio since 2011 |
|
|
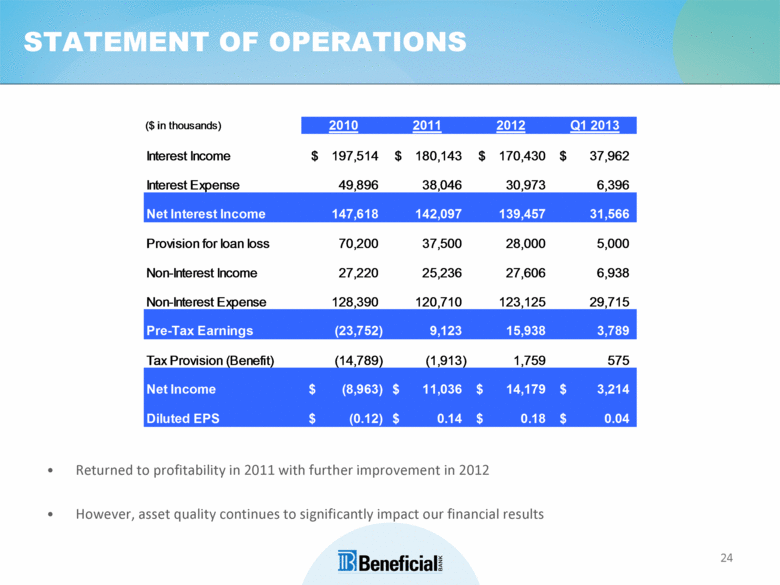
24 STATEMENT OF OPERATIONS Returned to profitability in 2011 with further improvement in 2012 However, asset quality continues to significantly impact our financial results |
|
|
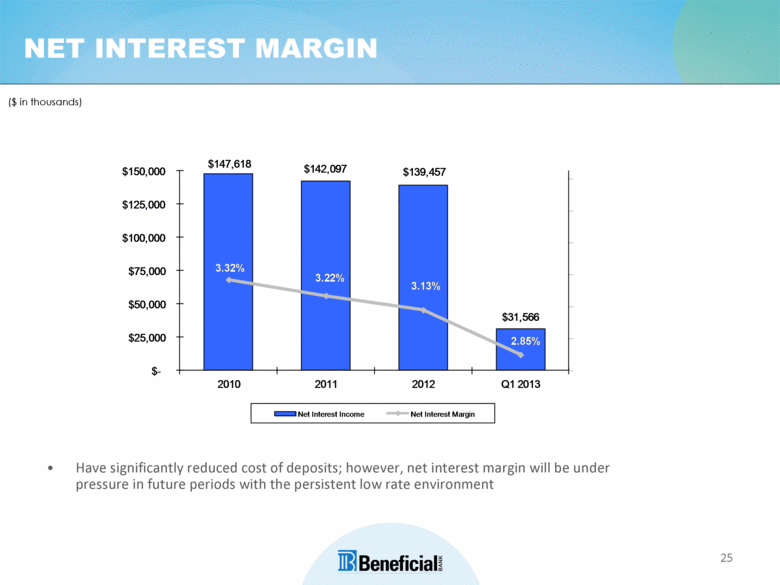
25 NET INTEREST MARGIN Have significantly reduced cost of deposits; however, net interest margin will be under pressure in future periods with the persistent low rate environment ($ in thousands) |
|
|
26 CAPITAL LEVELS REMAIN STRONG ($ in millions) |
|
|
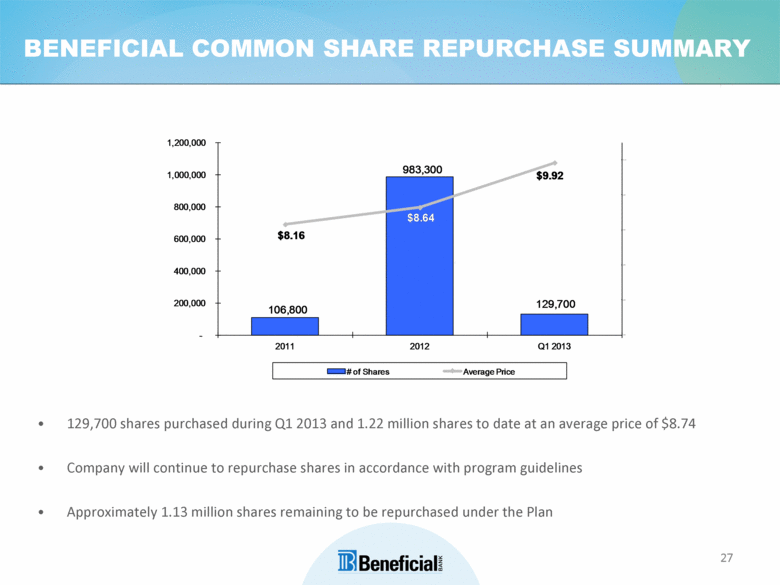
27 BENEFICIAL COMMON SHARE REPURCHASE SUMMARY 129,700 shares purchased during Q1 2013 and 1.22 million shares to date at an average price of $8.74 Company will continue to repurchase shares in accordance with program guidelines Approximately 1.13 million shares remaining to be repurchased under the Plan |
|
|
28 PRESENTATION TOPICS OUR MARKET CURRENT FOCUS Q1 2013 FINANCIAL HIGHLIGHTS OTHER MATTERS |
|
|
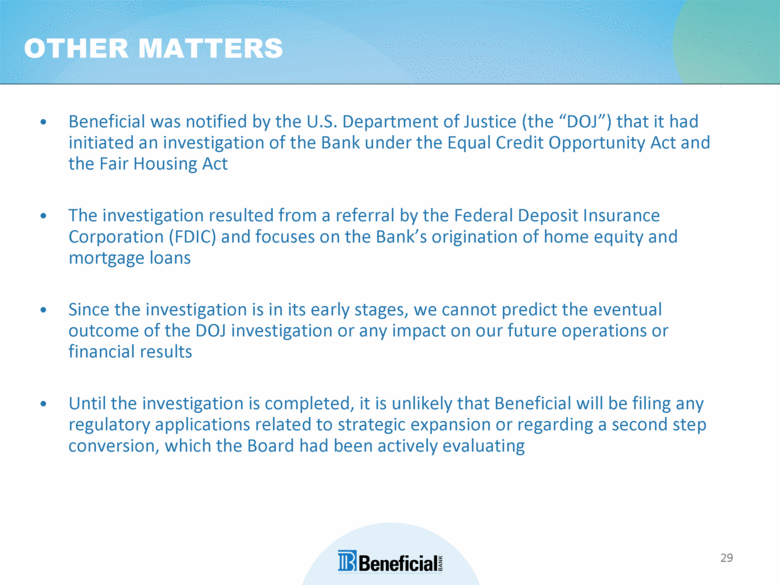
29 OTHER MATTERS Beneficial was notified by the U.S. Department of Justice (the “DOJ”) that it had initiated an investigation of the Bank under the Equal Credit Opportunity Act and the Fair Housing Act The investigation resulted from a referral by the Federal Deposit Insurance Corporation (FDIC) and focuses on the Bank’s origination of home equity and mortgage loans Since the investigation is in its early stages, we cannot predict the eventual outcome of the DOJ investigation or any impact on our future operations or financial results Until the investigation is completed, it is unlikely that Beneficial will be filing any regulatory applications related to strategic expansion or regarding a second step conversion, which the Board had been actively evaluating |
|
|
30 |


