Attached files
| file | filename |
|---|---|
| EX-10.6 - EX-10.6 - Green Field Energy Services, Inc. | d484319dex106.htm |
| EX-23.1 - EX-23.1 - Green Field Energy Services, Inc. | d484319dex231.htm |
| EX-23.4 - EX-23.4 - Green Field Energy Services, Inc. | d484319dex234.htm |
| EX-10.8 - EX-10.8 - Green Field Energy Services, Inc. | d484319dex108.htm |
| EX-10.7 - EX-10.7 - Green Field Energy Services, Inc. | d484319dex107.htm |
| EX-10.9 - EX-10.9 - Green Field Energy Services, Inc. | d484319dex109.htm |
Table of Contents
As filed with the Securities and Exchange Commission on June 14, 2013
Registration No. 333-182107
UNITED STATES
SECURITIES AND EXCHANGE COMMISSION
Washington, D.C. 20549
Amendment No. 1
to
Form S-1
REGISTRATION STATEMENT
UNDER
THE SECURITIES ACT OF 1933
Green Field Energy Services, Inc.
(Exact Name of Registrant as Specified in Its Charter)
| Delaware | 1389 | 11-3682539 | ||
| (State or Other Jurisdiction of Incorporation or Organization) |
(Primary Standard Industrial Classification Code Number) |
(I.R.S. Employer Identification Number) |
4023 Ambassador Caffery Parkway, Suite 200
Lafayette, Louisiana 70503
(337) 706-1700
(address, Including Zip Code, and Telephone Number, Including Area Code, of Registrant’s Principal Executive Offices)
Earl J. Blackwell
Chief Financial Officer
4023 Ambassador Caffery Parkway, Suite 200
Lafayette, Louisiana 70503
(337) 706-1700
(Name, Address, Including Zip Code, and Telephone Number, Including Area Code, of Agent for Service)
Copies to:
J. Michael Chambers
Ryan J. Maierson
Latham & Watkins LLP
811 Main Street, Suite 3700
Houston, Texas 77002
(713) 546-5400
Approximate date of commencement of proposed sale to the public: As soon as practicable after this Registration Statement becomes effective.
If any of the securities being registered on this form are to be offered on a delayed or continuous basis pursuant to Rule 415 under the Securities Act of 1933, check the following box. x
If this form is filed to register additional securities for an offering pursuant to Rule 462(b) under the Securities Act, check the following box and list the Securities Act registration statement number of the earlier effective registration statement for the same offering. ¨
If this form is a post-effective amendment filed pursuant to Rule 462(c) under the Securities Act, check the following box and list the Securities Act registration statement number of the earlier effective registration statement for the same offering. ¨
If this form is a post-effective amendment filed pursuant to Rule 462(d) under the Securities Act, check the following box and list the Securities Act registration statement number of the earlier effective registration statement for the same offering. ¨
Indicate by check mark whether the registrant is a large accelerated filer, an accelerated filer, a non-accelerated filer, or a smaller reporting company. See the definitions of “large accelerated filer,” “accelerated filer” and “smaller reporting company” in Rule 12b-2 of the Exchange Act. (Check one):
| Large accelerated filer | ¨ | Accelerated filer | ¨ | |||
| Non-accelerated filer | ¨ (Do not check if a smaller reporting company) | Smaller reporting company | x | |||
CALCULATION OF REGISTRATION FEE
|
| ||||
| Title of Each Class of Securities to be Registered |
Proposed Maximum Offering Price(1) |
Amount of Registration Fee | ||
| Common stock, par value $0.01 per share, underlying warrants |
$ 2,470 | $0.29 | ||
|
| ||||
|
| ||||
| (1) | Estimated in accordance with Rule 457(g), calculated on the basis of the warrant exercise price, $0.01 per share. |
The Registrant hereby amends this registration statement on such date or dates as may be necessary to delay its effective date until the Registrant shall file a further amendment which specifically states that this registration statement shall thereafter become effective in accordance with Section 8(a) of the Securities Act of 1933 or until the registration statement shall become effective on such date as the Securities and Exchange Commission, acting pursuant to said Section 8(a), may determine.
Table of Contents
The information in this prospectus is not complete and may be changed. We may not sell these securities until the registration statement filed with the Securities and Exchange Commission is effective. This prospectus is not an offer to sell these securities, and it is not soliciting any offer to buy these securities in any state where the offer or sale is not permitted.
Subject to Completion, dated June 14, 2013
PRELIMINARY PROSPECTUS

Green Field Energy Services, Inc.
247,058 Shares of Common Stock
This prospectus relates to the resale of 247,058 shares of common stock, $0.01 par value per share (“common stock”), to be offered by the shareholders identified under the “Selling Shareholders” section of this prospectus upon the exercise of outstanding warrants. We initially issued (the “November 2011 Private Placement”) the warrants as part of 250,000 units (the “Units”), each consisting of $1,000 principal amount of our 13% senior secured notes due 2016 (the “Notes”) and a warrant to purchase 0.988235 shares of common stock (the “Warrants”).
We will not receive any proceeds from the sale of common stock by the selling shareholders. The selling shareholders and any brokers, dealers or agents, upon affecting the sale of any of the common stock offered by this prospectus, may be deemed “underwriters” as that term is defined under the Securities Act of 1933 or the Securities Exchange Act of 1934, or the rules and regulations thereunder.
Our common stock is not listed for trading on any national securities exchange and we have no plans to list our stock on any exchange. The securities being registered in this offering may not be liquid since they are not listed on any exchange or quoted in the OTC Bulletin Board. Because there is currently no active trading market, selling stockholders will sell at a stated fixed price until our common stock in quoted on the OTC Bulletin Board. The selling shareholders may sell shares of common stock from time to time in privately negotiated transactions or, if a public market for our stock develops, on the principal market on which our common stock may be traded in the future. We can provide no assurance to you that a public market for our stock will develop and if so, what the market price of our stock may be.
Investing in our common stock involves risks. You should carefully consider the “Risk Factors” beginning on page 6 of this prospectus.
We are an emerging growth company under applicable Securities and Exchange Commission rules and are eligible for, and are relying on, certain reduced public company reporting requirements. See “Summary—Emerging Growth Company Status” on page 3 of this prospectus.
NEITHER THE SECURITIES AND EXCHANGE COMMISSION NOR ANY STATE SECURITIES COMMISSION HAS APPROVED OR DISAPPROVED OF THESE SECURITIES OR PASSED UPON THE ADEQUACY OR ACCURACY OF THIS PROSPECTUS. ANY REPRESENTATION TO THE CONTRARY IS A CRIMINAL OFFENSE.
YOU SHOULD READ THIS ENTIRE DOCUMENT AND THE ACCOMPANYING LETTER OF TRANSMITTAL AND RELATED DOCUMENTS AND ANY AMENDMENTS OR SUPPLEMENTS CAREFULLY BEFORE MAKING A DECISION WHETHER TO PURCHASE OUR COMMON STOCK.
The date of this prospectus is , 2013
Table of Contents
| ii | ||||
| iii | ||||
| 1 | ||||
| 6 | ||||
| 19 | ||||
| 20 | ||||
| Management’s Discussion and Analysis of Financial Condition and Results of Operations |
21 | |||
| 43 | ||||
| 62 | ||||
| 66 | ||||
| 67 | ||||
| 69 | ||||
| 70 | ||||
| 74 | ||||
| 76 | ||||
| 77 | ||||
| 81 | ||||
| 81 | ||||
| 81 | ||||
| F-1 |
Industry and Market Data
The market data and certain other statistical information used throughout this prospectus are based on independent industry publications, government publications or other published independent sources. Some data is also based on our good faith estimates. Although we believe these third-party sources are reliable as of their respective dates and the information is accurate and complete, we have not independently verified the accuracy or completeness of this information. The industry in which we operate is subject to a high degree of uncertainty and risk due to a variety of factors, including those described in the section entitled “Risk Factors.” These and other factors could cause results to differ materially from those expressed in these publications.
Trade Names and Trademarks
This prospectus may also include trade names and trademarks of other companies. Our use or display of other parties’ trade names, trademarks or products is not intended to, and does not imply a relationship with, or endorsement or sponsorship of us by, the respective owners of such trade names, trademarks or products.
i
Table of Contents
We have filed with the Securities and Exchange Commission (the “SEC”) a registration statement (“Registration Statement”) on Form S-1 under the Securities Act of 1933, as amended (the “Securities Act”), with respect to the common stock. This prospectus, which is a part of the Registration Statement, omits certain information included in the Registration Statement and in its exhibits. For further information relating to us and our common stock, we refer you to the Registration Statement and its exhibits, from which this prospectus incorporates important business and financial information about the Company that is not included in or delivered herewith. You may read and copy the Registration Statement, including its exhibits, at the SEC’s Public Reading Room located at 100 F. Street, N.E., Room 1580, Washington D.C. 20549. You may obtain information on the operation of the Public Reading Room by calling the SEC at 1-800-SEC-0300. The SEC also maintains a Web site (www.sec.gov) that contains reports, proxy and information statements and other information regarding registrants like us who file electronically with the SEC.
We are not currently subject to the informational requirements of the Securities Exchange Act of 1934, as amended (the “Exchange Act”). Following effectiveness of the registration statement of which this prospectus is a part, we will file annual, quarterly and current reports and other information with the SEC in accordance with the Exchange Act. You may read and copy any document we file with the SEC at the SEC’s address set forth above.
You should rely only on the information contained in this prospectus. We have not authorized any person to provide you with any information or represent anything not contained in this prospectus, and, if given or made, any such other information or representation should not be relied upon as having been authorized by us. We are not making an offer to sell our common stock in any jurisdiction where an offer or sale is not permitted. You should not assume that the information contained in this prospectus is accurate as of any date other than the date on the front cover of this prospectus. We will disclose any material changes in our affairs in an amendment to this prospectus or a prospectus supplement.
We are not making an offer to sell these securities or soliciting an offer to buy these securities in any jurisdiction where an offer or solicitation is not authorized or in which the person making that offer or solicitation is not qualified to do so or to anyone whom it is unlawful to make an offer or solicitation.
ii
Table of Contents
Cautionary Statement Regarding Forward-Looking Statements
This prospectus contains “forward-looking statements” that involve known and unknown risks, uncertainties and other important factors that may cause our actual results, performance or achievements to be materially different from any future results, performances or achievements expressed or implied by the forward-looking statements. Forward-looking statements may include, but are not limited to, projections of revenue, statements relating to our future financial performance, the growth of the market for our services, expansion plans and opportunities and statements regarding our plans, strategies and objectives for future operations. In some cases, you can identify forward-looking statements by terminology such as “may,” “will,” “should,” “expect,” “plan,” “anticipate,” “believe,” “estimate,” “predict,” “potential” or “continue,” the negative of such terms or other comparable terminology.
Forward-looking statements reflect our current views about future events, are based on assumptions, and are subject to known and unknown risks and uncertainties. Many important factors could cause actual results or achievements to differ materially from any future results or achievements expressed in or implied by our forward-looking statements, including the factors listed below. Many of the factors that will determine future events or achievements are beyond our ability to control or predict. Certain of these are important factors that could cause actual results or achievements to differ materially from the results or achievements reflected in our forward-looking statements, including, but not limited to:
| • | general economic conditions and conditions affecting the industries we serve; |
| • | the level of oil and natural gas exploration, development and production in the U.S.; |
| • | our future financial and operating performance and results; |
| • | our business strategy and budgets; |
| • | changes in technology; |
| • | our financial strategy; |
| • | amount, nature and timing of our capital expenditures; |
| • | changes in competition and government regulations; |
| • | our operating costs and other expenses; |
| • | our cash flow and anticipated liquidity; and |
| • | our plans, forecasts, objectives, expectations and intentions. |
These forward-looking statements reflect our views and assumptions only as of the date such forward-looking statements are made. You should not place undue reliance on forward-looking statements. Except as required by law, we assume no responsibility for updating any forward-looking statements nor do we intend to do so. Our actual results, performance or achievements could differ materially from the results expressed in, or implied by, these forward-looking statements. The risks included in this section are not exhaustive. Additional factors that could cause actual results to differ materially from those described in the forward-looking statements are set forth under the section titled “Risk Factors.”
iii
Table of Contents
The following summary highlights information contained elsewhere in this prospectus and does not contain all of the information you should consider before investing in our common stock. You should read carefully the rest of this prospectus and should consider, among other things, the matters set forth under the sections titled “Risk Factors” and “Management’s Discussion and Analysis of Financial Condition and Results of Operations” and our combined financial statements and related notes to those statements and other financial data included elsewhere in this prospectus. Some of the statements in the following summary are forward-looking statements. See the section titled “Cautionary Statement Regarding Forward-Looking Statements.” Unless the context requires otherwise, references in this prospectus to the “Company,” “we,” “us,” “our” or “ours” refer to Green Field Energy Services, Inc., together with its subsidiaries and predecessor entities.
Company Overview
Formed in 1969, we are an independent oilfield services company that provides a wide range of pressure pumping related services to oil and natural gas drilling and production companies to help develop and enhance the production of hydrocarbons. Our traditional oilfield pumping services included cementing, coiled tubing, pressure pumping, acidizing, and other pumping services. We also produce our own TFPs (as defined below). In December 2010, we began providing hydraulic fracturing pumping services as a part of our portfolio of services provided to our customers using our own internally produced turbine-powered hydraulic fracturing units. To support our hydraulic fracturing operations, we have also entered into two long-term leases during 2011 for sand mines in Louisiana and Mississippi. These mines are expected to supply a portion of our fracturing sand needs and provide us with the opportunity to sell fracturing sand to third parties. Our hydraulic fracturing operations utilize turbine-powered hydraulic fracturing pumping equipment that we believe provides several advantages over the diesel-powered pumping equipment generally utilized in the industry. These advantages include lower emissions, a smaller operating footprint, lower operating costs and greater fuel flexibility, including the ability to operate on natural gas. “HP” as used in this prospectus means the maximum horsepower rating on the applicable pump(s).
Each of our turbine-powered hydraulic fracturing units consists primarily of a high pressure hydraulic pump, a turbine engine, a gear box, electrical and hydraulic assemblies, and skids (collectively, a “TFP”) and various hoses, valves, tanks and other supporting equipment that are typically mounted to a flat-bed trailer. The group of hydraulic fracturing units, other equipment and vehicles necessary to perform a typical fracturing job is referred to as a hydraulic fracturing “spread” and we refer to all of our spreads together as our hydraulic fracturing “fleet.”
As of May 20, 2013, we had approximately 159,750 HP of high pressure pumping capacity in our fleet, of which 150,750 HP was turbine powered. During December 2012, we placed into service the first of six planned new coiled tubing units. A second new coiled tubing unit and two new cementing units were also placed into service in April and May of 2013, respectively. We do not anticipate adding more horsepower without additional firm customer commitments in the future and we may also consider reconfiguring or selling some portion of the earlier assembled units in the fleet based on customer commitments and our evaluation of the market over the near term.
1
Table of Contents
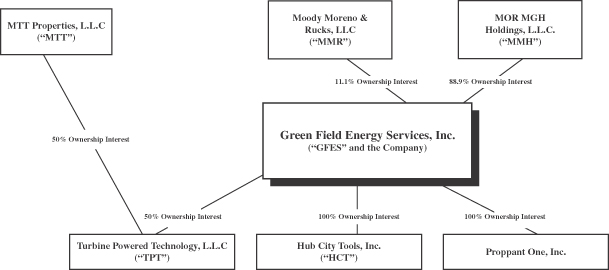
Organizational Structure
The following diagram depicts our organizational structure and ownership as of March 31, 2013.
General Corporate Information
Green Field Energy Services, Inc. is incorporated under Delaware law. Our principal executive offices are located at 4023 Ambassador Caffery Parkway, Suite 200, Lafayette, LA 70503, and our telephone number at that address is (337) 706-1700. Our website address is http://gfes.com; however, information contained on our website is not incorporated by reference into this prospectus, and you should not consider the information contained on our website to be part of this prospectus.
Emerging Growth Company Status
We qualify as an emerging growth company as that term is used in the Jumpstart Our Business Startups Act (the “JOBS Act”). An emerging growth company may take advantage of specified reduced reporting and other burdens that are otherwise applicable generally to public companies. For instance, emerging growth companies are not required to:
| • | provide an auditor’s attestation report on management’s assessment of the effectiveness of our system of internal control over financial reporting pursuant to Section 404 of the Sarbanes-Oxley Act of 2002; |
| • | comply with any new requirements adopted by the Public Company Accounting Oversight Board, or the PCAOB, requiring mandatory audit firm rotation or a supplement to the auditor’s report in which the auditor would be required to provide additional information about the audit and the financial statements of the issuer; |
| • | provide certain disclosures regarding executive compensation required of larger public companies; or |
| • | hold shareholder advisory votes on executive compensation. |
We may take advantage of these reduced reporting burdens which are also available to us as a smaller reporting company as defined under Rule 12b-2 of the Securities Exchange Act of 1934, as amended, or the Exchange Act.
2
Table of Contents
We will cease to be an emerging growth company upon the earliest of:
| • | when we have $1.0 billion or more in annual revenues; |
| • | when we have at least $700 million in market value of our common stock held by non-affiliates; |
| • | when we issue more than $1.0 billion of non-convertible debt over a rolling three-year period; or |
| • | the last day of the fiscal year following the fifth anniversary of our initial public offering. |
Section 107 of the JOBS Act provides that an emerging growth company can take advantage of the extended transition period provided in Section 7(a)(2)(B) of the Securities Act of 1933 for complying with new or revised accounting standards. In other words, an emerging growth company can delay the adoption of certain accounting standards until those standards would otherwise apply to private companies. However, we are choosing to “opt out” of such extended transition period, and as a result, we will comply with new or revised accounting standards on the relevant dates on which adoption of such standards is required for non-emerging growth companies. Section 107 of the JOBS Act provides that our decision to opt out of the extended transition period for complying with new or revised accounting standards is irrevocable.
3
Table of Contents
Summary of the Offering
| Issuer |
Green Field Energy Services, Inc. |
| Common Stock Being Offered by the Selling Shareholders |
247,058 shares of common stock issuable upon exercise of the Warrants. |
| Shares of Common Stock Outstanding Prior to this Offering |
1,524,446 |
| Shares of Common Stock Outstanding After this Offering |
1,771,504 |
| Use of Proceeds |
All of the common stock offered hereby will be sold by the selling shareholders. We will not receive any proceeds from the sale of these shares. See “Use of Proceeds.” |
| Offering Price |
All or some of the shares offered hereby may be sold from time to time in amounts and or terms to be determined by the selling stockholders at the time of sale. |
| Voting Rights |
Holders of common stock are entitled to one vote for each share of common stock held. |
| Dividend Policy |
Holders of common stock have the right to receive dividends when and as dividends are declared by our Board of Directors. We have not paid dividends on our common stock and do not anticipate paying any cash dividends on our common stock in the foreseeable future. In addition, the terms of our Shell Credit Facility and the indenture governing our Notes restrict our ability to pay dividends on our common stock. |
| Liquidation Rights |
Upon any liquidation, dissolution or winding up of the affairs of the Company, whether voluntary or involuntary, any assets remaining after satisfaction of the rights of creditors and the rights of any holders of preferred stock will be distributed to the holders of common stock. |
| Trading Market |
There is currently no established public market for trading of the shares of our common stock being offered hereby. |
| Risk Factors |
You should carefully consider the information set forth in this prospects and, in particular, the specific factors set forth in the “Risk Factors” section before deciding whether to purchase shares of our common stock. |
4
Table of Contents
November 2011 Private Placement
In November 2011, we issued an aggregate of 250,000 units (the “Units”) to certain qualified institutional buyers (the “Purchasers”) for aggregate cash proceeds of $247,500,000, at a price per Unit of $990.00 (the “November 2011 Private Placement”).
Each Unit consisted of $1,000 principal amount of our 13% senior secured notes due 2016 (the “Notes”) and one one warrant (together with all other warrants issued in connection with the Units, the “Warrants”) to purchase 0.988235 shares of our common stock (together with all other shares of our common stock issuable upon exercise of the Warrants, the “Warrant Shares”). Each Warrant entitles the holder, subject to certain conditions, to purchase 0.988235 Warrant Shares at an exercise price of $0.01 per share, subject to adjustment. The Warrants are exercisable at any time and will expire on November 15, 2021.
In connection with the November 2011 Private Placement, we granted each Purchaser registration rights. We are obligated to use our best efforts to cause a registration statement registering for resale the common stock underlying the Warrant Shares. The shares underlying the Warrant Shares are registered pursuant to this prospectus.
For more information about the common stock, see “Description of Common Stock.”
Risk Factors
You should carefully consider all of the information set forth in this prospectus and, in particular, you should refer to the section captioned “Risk Factors” for an explanation of certain risks related to investing in the common stock.
5
Table of Contents
You should carefully consider the risks described below, as well as the other information contained in this prospectus and our other filings with the SEC, before making an investment decision in our common stock. The risks described below are not the only ones that we face. Additional risks not presently known to us or that we currently deem immaterial may also impair our business operations. The actual occurrence of any of these risks could materially adversely affect our business, financial condition and results of operations. In that case, the value of the Securities could decline substantially, and you may lose part or all of your investment.
Risks Related to Investing in our Common Stock
There may be no public market for the common stock being offered, which could significantly impair the liquidity of the common stock.
There has been no public market for any of the common stock. As of the date of this prospectus, all of our common stock is privately held. Our common stock is not listed on any exchange and we do not intend to apply for any listing. We cannot assure you as to:
| • | whether any public market will develop for the common stock; |
| • | the liquidity of any such market that may develop; |
| • | your ability to sell your common stock; or |
| • | the price at which you would be able to sell your common stock. |
The initial purchaser of the Warrants from which these shares of common stock are issuable upon exercise has advised us that it intends to make a market in the common stock. The initial purchaser is not obligated, however, to make a market in the common stock, and they may discontinue any such market-making at any time at their sole discretion. Accordingly, we cannot assure you as to the development or liquidity of any market for our common stock.
There may be dilution of the value of our common stock when the Warrants become exercised.
On November 15, 2011, we issued warrants to purchase common stock representing 17.6% of our outstanding common stock on a fully diluted basis as of such date (assuming exercise of all such warrants) as part of an issuance of investment units consisting of (a) $1,000 principal amount of our Notes and (b) one Warrant. Because common stock is issuable upon exercise of the Warrants, and in particular because the Warrants are initially exercisable for $0.01 per share of common stock, there may be a dilutive effect on the value of our common stock when the Warrants are exercised.
We do not intend to pay dividends on the common stock in the foreseeable future.
We have not paid dividends on our common stock and do not anticipate paying any cash dividends on the common stock in the foreseeable future. In addition, the terms of our Shell Credit Facility (as later defined) and the indenture governing the Notes restrict our ability to pay dividends on the common stock.
As a result of our exchange offering, we will become subject to financial reporting and other requirements for which our accounting and other management systems and resources may not be adequately prepared.
Our concurrent exchange offering will subject us to reporting and other obligations under the Securities Exchange Act of 1934, as amended, including the requirements of Section 404 of the Sarbanes-Oxley Act. Section 404 will require us to conduct an annual management assessment of the effectiveness of our internal controls over financial reporting and to obtain a report by our independent auditors addressing these assessments. These reporting and other obligations will place significant demands on our management, administrative,
6
Table of Contents
operational and accounting resources. We also expect these regulations to increase our legal and financial compliance costs, make it more difficult to attract and retain qualified officers and members of our board of directors and make some activities more difficult, time consuming and costly. We are presently upgrading our systems, implementing financial and management controls and reporting systems and procedures; we also have hired additional accounting and finance staff. If we are unable to accomplish these objectives in a timely and effective fashion, our ability to comply with our financial reporting requirements and other rules that apply to reporting companies could be impaired. Any failure to maintain effective internal controls could have a material adverse effect on our business, operating results and stock price. Moreover, effective internal control is necessary for us to provide reliable financial reports and prevent fraud. If we cannot provide reliable financial reports or prevent fraud, we may not be able to manage our business as effectively as we would if an effective control environment existed, and our business and reputation with investors may be harmed.
Risks Relating to Our Business
Our independent registered public accounting firm’s report on our financial statements included an explanatory paragraph regarding our ability to continue as a going concern.
As discussed in Note 2 to our 2012 consolidated financial statements, such financial statements were prepared assuming that we would continue as a going concern. We have recurring operating losses and a net working capital deficiency that raise substantial doubt about our ability to continue as a going concern. Our independent registered public accounting firm included an explanatory paragraph in its report on our 2012 consolidated financial statements regarding the substantial doubt about our ability to continue as a going concern. We continue to experience net operating losses. Our ability to continue as a going concern is subject to our ability to generate a profit and/or obtain necessary funding from outside sources, including by the sale of our securities or obtaining loans from financial institutions or our controlling stockholders, where possible. If we obtain additional financing, such funds may not be available on favorable terms. To the extent that we raise additional funds by issuing equity securities, our stockholders may experience significant dilution. Any debt financing, if available, may involve restrictive covenants that restrict our ability to conduct our business. Our continued net operating losses increase the difficulty of our meeting such goals and our efforts to continue as a going concern may not prove successful.
Our business depends on the oil and natural gas industry and particularly on the level of exploration, development and production of oil and natural gas in the United States. Our markets may be adversely affected by industry conditions that are beyond our control.
We depend on our customers’ willingness to make operating and capital expenditures to explore for, develop and produce oil and natural gas in the United States. If these expenditures decline, our business may suffer. Our customers’ willingness to explore, develop and produce depends largely upon prevailing industry conditions that are influenced by numerous factors over which our management has no control, such as:
| • | the supply of and demand for oil and natural gas, including current natural gas storage capacity and usage; |
| • | the prices, and expectations about future prices, of oil and natural gas; |
| • | the supply of and demand for hydraulic fracturing and other well service equipment in the United States; |
| • | public pressure on, and legislative and regulatory interest within, federal, state and local governments to stop, significantly limit or regulate hydraulic fracturing activities; |
| • | the expected rates of decline of current oil and natural gas production; |
| • | lead times associated with acquiring equipment and products and availability of personnel; |
| • | regulation of drilling activity; |
| • | the discovery rates of new oil and natural gas reserves; |
7
Table of Contents
| • | available pipeline and other transportation capacity; |
| • | weather conditions, including hurricanes that can affect oil and natural gas operations over a wide area; |
| • | political instability in oil and natural gas producing countries; |
| • | domestic and worldwide economic conditions; |
| • | technical advances affecting energy consumption; |
| • | the price and availability of alternative fuels; and |
| • | merger and divestiture activity among oil and natural gas producers. |
The level of activity in the oil and natural gas exploration and production (“E&P”) industry in the United States is volatile. In 2009, our industry experienced an unprecedented decline in drilling activity in the United States as rig counts dropped by approximately 57% from 2008 highs. Unexpected material declines in oil and natural gas prices, or drilling or completion activity in the southern United States oil and natural gas shale regions, could have a material adverse effect on our business, financial condition, results of operations and cash flows. In addition, a decrease in the development rate of oil and natural gas reserves in our market areas may also have an adverse impact on our business, even in an environment of stronger oil and natural gas prices.
We have operated at a loss in the past and there is no assurance of our profitability in the future.
Historically, we have experienced periods of low demand for our services and have incurred operating losses. In the future, we may incur further operating losses and experience negative operating cash flow. We may not be able to reduce our costs, increase revenues, or reduce our debt service obligations sufficient to achieve or maintain profitability and generate positive operating income in the future.
We may be unable to implement price increases or maintain existing prices on our core services.
We periodically seek to increase the prices of our services to offset rising costs and to generate higher returns for our stockholders. However, we operate in a very competitive industry and as a result, we are not always successful in raising, or maintaining our existing prices. Additionally, during periods of increased market demand, a significant amount of new service capacity may enter the market, which also puts pressure on the pricing of our services and limits our ability to increase or maintain prices. Furthermore, during periods of declining pricing for our services, we may not be able to reduce our costs accordingly, which could further adversely affect our profitability.
Even when we are able to increase our prices, we may not be able to do so at a rate that is sufficient to offset such rising costs. In periods of high demand for oilfield services, a tighter labor market may result in higher labor costs. During such periods, our labor costs could increase at a greater rate than our ability to raise prices for our services. Also, we may not be able to successfully increase prices without adversely affecting our activity levels. The inability to maintain our prices or to increase our prices as costs increase could have a material adverse effect on our business, financial position and results of operations.
8
Table of Contents
Our inability to acquire or delays in the delivery of our new fracturing spreads or future orders of specialized equipment from suppliers could harm our business, results of operations and financial condition.
As of May 20, 2013, we had approximately 159,750 HP of high pressure pumping capacity in our fleet, of which 150,750 HP was turbine powered. During December 2012, we placed into service the first of six planned new coiled tubing units. A second new coiled tubing unit and two new cementing units were also placed into service in April and May of 2013, respectively.
The delivery of the pumps or any other fracturing equipment we have ordered or may order in the future could be materially delayed or not delivered at all. Three equipment suppliers are constructing our hydraulic fracturing pumps to be utilized for our hydraulic fracturing units. These pumps will then be delivered to Dynamic Industries, Inc. (“Dynamic”) for mounting onto the pump skids, and then to Turbine Powered Technology L.L.C. (“TPT”), for the addition of the turbines and completion of the TFPs. Please see the section titled “Certain Relationships and Related Person Transactions—Joint Venture” for additional information. The overall number of hydraulic fracturing equipment suppliers in the industry is limited, and there is high demand for such equipment, which may increase the risk of delay or failure to deliver and limit our ability to find alternative suppliers. Any material delay or failure to deliver new equipment could defer or substantially reduce our revenue from the deployment of this equipment for our fracturing units.
If we cause disruptions to our customers’ businesses or provide inadequate service, particularly by failing to meet our delivery deadlines with Shell, our customers may have claims for damages against us, which could cause us to lose customers, have a negative effect on our reputation and adversely affect our results of operations.
If we fail to provide services under our contracts with our customers, like our contract with Shell Western E&P, (“Shell”), we may disrupt such customers’ business, which could result in a reduction in our revenues or a claim for substantial damages against us. In addition, a failure or inability to meet a contractual requirement could seriously damage our reputation and affect our ability to attract new business. Any significant failure of our equipment, or any major disruption in our acquisition of equipment from TPT or our other vendors, could impede our ability to provide services to our customers, have a negative impact on our reputation, cause us to lose customers and adversely affect our results of operations. For example, under our contract with Shell, if we fail to meet the required number of frac stages per month, Shell may terminate the agreement for cause, and we would be required to pay Shell $10 million in liquidated damages within 90 days of the date such termination is effective. The successful assertion of one or more large claims against us in amounts greater than those covered by our current insurance policies could materially adversely affect our business, financial condition and results of operations. Even if such assertions against us are unsuccessful, we may incur reputational harm and substantial legal fees.
If Shell terminates our agreement under certain circumstances that constitute a change of control, we must pay $100 million to Shell in liquidated damages.
Shell may terminate the Shell agreement upon a change of control. A change of control occurs upon our consolidation or merger, a sale, lease, exchange or other transfer of substantially all our assets, or a combination in which our shareholders immediately before such combination do not hold, directly or indirectly, more than 50% of the voting securities of the combined company, except that no change of control shall have occurred if Michel B. Moreno remains Chairman of the Company and certain other conditions are met. Following a change of control termination, we must pay Shell $100 million in liquidated damages, which would have a significant negative impact on our liquidity.
9
Table of Contents
Delays in deliveries of key raw materials or increases in the cost of key raw materials could harm our business, results of operations and financial condition.
We have established relationships with a limited number of suppliers of our raw materials. Should any of our current suppliers be unable to provide the necessary raw materials (such as proppant or chemicals) or otherwise fail to deliver such raw materials in a timely manner and in the quantities required, any resulting delays in the provision of services could have a material adverse effect on our business, financial condition, results of operations and cash flows. Our industry has faced sporadic proppant shortages associated with pressure pumping operations requiring work stoppages, which adversely impacted the operating results of several competitors. We may not be able to mitigate any future shortages of raw materials, including proppants. In connection with the newly leased sand mines, we have entered into a contract with Alliance Consulting Group, LLC (“Alliance”), an affiliate, to build and operate a wet and dry facility to process and transport sand from our mines. This agreement with is in the process of being assumed by Shale Support Services, LLC (“SSS”). However, there can be no assurance that such equipment will be delivered as anticipated and any such delays or unavailability may adversely impact our ability to produce the estimated quantity of sand at each mine. Failure to achieve our production estimates in a timely manner could have a material adverse effect on any or all of our future cash flows, profitability, results of operations and financial condition.
Inaccuracies in our estimates of sand reserves could result in lower than expected revenues and higher than expected costs.
We base our sand reserves estimates on engineering, economic and geological data assembled and analyzed by our staff and on the data and conclusions in the subsurface sand report prepared by Westward Environmental, Inc. These estimates are also based on the expected cost of production and projected sale prices. There are numerous factors and assumptions inherent in estimating quantities and qualities of sand reserves and costs to mine recoverable reserves, including many factors beyond our control. Estimates of economically recoverable sand reserves necessarily depend upon a number of variable factors and assumptions, all of which may vary considerably from actual results.
For these reasons, estimates of the quantities and qualities of the economically recoverable sand attributable to our sand mines, classifications of sand reserves based on risk of recovery, estimated cost of production and estimates of net cash flows expected from particular reserves as prepared by different engineers or by the same engineers at different times may vary materially due to changes in the above factors and assumptions. Actual production from identified sand deposit areas or properties and revenues and expenditures associated with our mining operations may vary materially from estimates. Accordingly, these estimates may not reflect our actual sand reserves. Any inaccuracy in our estimates related to sand reserves could result in lower than expected revenues and higher than expected costs, which could have a material adverse effect on our financial results.
Our agreement with a sand supplier includes significant take-or-pay obligations and other risks.
In order to secure a sufficient source of sand to perform under our agreement with Shell and other future hydraulic fracturing service arrangements, we have entered into a four-year agreement with a sand supplier that contains provisions under which we are required to take delivery of a certain annual volume of sand or pay the seller for the volume difference between the required quantity and the volume actually purchased. The agreement fixes a price per ton of sand for the four-year period, subject to an annual increase or decrease of not more than 5% if such adjustment is agreed upon by the parties. Please see the section titled “Business—Sand Purchase Agreement” for additional information. If we are unable to generate sufficient cash from operations or obtain alternative financing, our cash position may not be sufficient to pay for the take-or-pay volumes.
Federal and state legislative and regulatory initiatives relating to hydraulic fracturing could result in increased costs and additional operating restrictions or delays.
Hydraulic fracturing is an important common practice, utilized by many of our customers, that is used to stimulate production of hydrocarbons, particularly natural gas, from tight formations, including shales. The
10
Table of Contents
process involves the injection of water, sand and chemicals under pressure into formations to fracture the surrounding rock and stimulate production. Federal, state, regional and local legislative and regulatory initiatives relating to hydraulic fracturing could result in increased costs and additional operating restrictions or delays as well as adversely affect our support services. See the section titled “Management’s Discussion and Analysis of Financial Condition and Results of Operations—Hydraulic Fracturing Legislation and Regulation.”
The federal Safe Drinking Water Act (the “SDWA”) regulates the underground injection of substances through the Underground Injection Control (the “UIC”) program. Due to a 2005 amendment to the SDWA, hydraulic fracturing generally has been exempt from regulation under the UIC program except for the underground injection of hydraulic fracturing fluids or propping agents that contain diesel fuels. As a result, hydraulic fracturing is typically regulated by state environmental regulators or oil and gas commissions and not pursuant to the SDWA. However, the EPA believes that hydraulic fracturing with fluids containing diesel fuel are subject to regulation under the UIC program, specifically as “Class II” UIC wells and can be regulated through the use of Emergency Orders under the SDWA. In addition, the EPA has commenced a study, at the order of the U.S. Congress, of the potential environmental and health impacts of hydraulic fracturing activities, and a committee of the U.S. House of Representatives is also conducting an investigation of hydraulic fracturing practices. As part of these studies, both the EPA and the House committee have requested that certain companies provide them with information concerning the chemicals used in the hydraulic fracturing process. These studies, depending on their results, could spur initiatives for federal regulation of hydraulic fracturing under the SDWA or otherwise. Legislation, which has not passed, has been introduced before.
Congress in the last few sessions to remove the exemption of hydraulic fracturing under the SDWA and to require disclosure to a regulatory agency of chemicals used in the fracturing process. In addition, on October 21, 2011, the EPA announced its intention to propose regulations by 2014 under the federal Clean Water Act to regulate wastewater discharges from hydraulic fracturing and other natural gas production. The adoption of new federal laws or regulations imposing reporting obligations on, or otherwise limiting or regulating, the hydraulic fracturing process could make it more difficult to complete oil and natural gas wells in shale formations, increase our and our customers’ costs of compliance, and adversely affect the hydraulic fracturing services that we render for our E&P customers.
On August 16, 2012, the EPA published final regulations under the federal Clean Air Act, as amended, (the “CAA”) that establish new air emission controls for oil and natural gas production and natural gas processing operations. Specifically, the EPA’s rule package includes New Source Performance Standards to address emissions of sulfur dioxide and volatile organic compounds (“VOCs”) and a separate set of emission standards to address hazardous air pollutants frequently associated with oil and natural gas production and processing activities. The final rule includes a 95% reduction in VOCs emitted by requiring the use of reduced emission completions or “green completions” on all hydraulically-fractured wells constructed or refractured after January 1, 2015. The rules also establish specific new requirements regarding emissions from compressors, controllers, dehydrators, storage tanks and other production equipment. EPA received numerous requests for reconsideration of these rules from both industry and the environmental community, and court challenges to the rules were also filed. EPA intends to issue revised rules in 2013 that are likely responsive to some of these requests. For example, on April 12, 2013 EPA published a proposed amendment extending compliance dates for certain storage vessels. The final revised rules could require modifications to our operations or increase our capital and operating costs without being offset by increased product capture. At this point, we cannot predict the final regulatory requirements or the cost to comply with such requirements with any certainty. In addition, the U.S. Department of the Interior published a revised proposed rule on May 24, 2013 that would updated existing regulation of hydraulic fracturing activities on federal lands, including requirements for disclosure, well bore integrity and handling of flowback water.
In most states, our customers are required to obtain permits from one or more governmental agencies in order to perform drilling and completion activities, including hydraulic fracturing. Such permits are typically required by state and regional governmental agencies, but can also be required by federal and local governmental agencies.
11
Table of Contents
The requirements for such permits vary depending on the location where such drilling and completion activities will be conducted. As with all permitting processes, there is a degree of uncertainty as to whether a permit will be granted, the time it will take for a permit to be issued and the conditions that may be imposed in connection with the granting of the permit. In addition, there is an opportunity for public comment or challenge with respect to certain permit applications.
Various state, regional and local governments have implemented, or are considering, increased regulatory oversight of hydraulic fracturing through additional permit requirements, operational restrictions, disclosure requirements, and temporary or permanent bans on hydraulic fracturing in certain environmentally sensitive areas such as certain watersheds. For example, Colorado, Texas and Wyoming have passed laws and regulations requiring the disclosure of information regarding the substances used in the hydraulic fracturing process and other states are considering similar requirements. The availability of information regarding the constituents of hydraulic fracturing fluids could potentially make it easier for third parties opposing the hydraulic fracturing process to initiate legal proceedings based on allegations that specific chemicals used in the fracturing process could adversely affect groundwater.
In addition, a number of states have conducted, are currently conducting, or may in the future conduct, regulatory reviews that potentially could restrict or limit our customers’ access to shale formations located in their states. In some jurisdictions, including New York State and within the jurisdiction of the Delaware River Basin Commission, certain regulatory authorities have delayed or suspended the issuance of permits while the potential environmental impacts associated with issuing such permits can be studied and appropriate mitigation measures evaluated. Permitting delays, an inability to obtain new permits or revocation of our or our customers’ current permits could cause a loss of revenue and potentially have a materially adverse effect on our operations. See the section titled “Business—Environmental Matters.”
The adoption of new laws or regulations imposing reporting obligations on, or otherwise limiting, hydraulic fracturing could make it more difficult to complete natural gas wells in shale formations, increase costs of compliance, and adversely affect the hydraulic fracturing services that we render for our E&P customers. In addition, if hydraulic fracturing becomes regulated at the federal level as a result of federal legislation or regulatory initiatives by the EPA, hydraulic fracturing activities could become subject to additional permitting requirements, and also to attendant permitting delays and potential increases in cost, which could adversely affect our business and results of operations.
Our executive officers and certain key personnel are critical to our business and these officers and key personnel may not remain with us in the future.
Our future success depends upon the continued service of our executive officers and other key personnel, particularly Michel B. Moreno, our Chief Executive Officer, Enrique “Rick” Fontova, our President, and Earl Blackwell, our Chief Financial Officer. If we lose the services of Mr. Moreno, Mr. Fontova or Mr. Blackwell, our other officers or other key personnel, our business, operating results and financial condition could be harmed. Additionally, proceeds from the key person life insurance on any of Mr. Moreno, Mr. Fontova or Mr. Blackwell would not be sufficient to cover our losses in the event we were to lose any of their services.
Reliance upon a few large customers may adversely affect our revenues and operating results.
As of March 31, 2013, 94.8% of our revenues were from our top five customers. It is likely that we will continue to derive a significant portion of our revenue from a relatively small number of customers in the future. If a major customer fails to pay us or decides not to continue to use our services, revenue could decline and our operating results and financial condition could be harmed.
12
Table of Contents
If we are unable to fully protect our intellectual property rights, we may suffer a loss in our competitive advantage over other companies.
Certain technologies used in our business provide us with a competitive advantage over other companies that we believe will increase our market share. We attempt to protect these technologies and competitive advantages by protecting our intellectual property rights via trademark, copyright and trade secret laws, as well as licensing agreements and third-party non-disclosure and assignment agreements. While we do have an exclusive license under a third-party patent application claiming certain TFP technology, we do not have our own patents or patent applications relating to many of our key processes or technology. We attempt to protect these processes and technology as unpatented proprietary technology. Among such technology are trade secrets that we believe provide us with a competitive advantage, including proprietary designs we use in fabricating our hydraulic fracturing units. It is possible that others will independently develop the same or similar technology or otherwise obtain access to the unpatented technology that we license. To protect our trade secrets and other proprietary information, we often require employees, consultants, advisors and collaborators to enter into confidentiality agreements. We cannot assure you that these agreements will provide meaningful protection for our trade secrets, know-how or other proprietary information in the event of any unauthorized use, misappropriation or disclosure of such trade secrets, know-how or other proprietary information. Our failure to obtain or maintain adequate protection of our intellectual property rights for any reason or our inability to prevent competitors from replicating our technology could have a material adverse effect on our business, results of operations and financial condition.
We have secured exclusive rights, through our supply agreements with TPT, to certain TFP technology held by TPT relating to the Frac Stack PackTM configuration. Some of this TFP technology is the subject of a non-provisional patent application filed in the United States Patent and Trademark Office on August 25, 2011. Please see the section titled “Business—Intellectual Property Rights” and “Certain Relationships and Related Person Transactions—Joint Venture” for additional information. We cannot assure you that this patent application will be approved. We also cannot assure you that the patents issuing as a result of this or any future domestic or foreign patent applications will have the same scope of coverage as the application as filed. If issued, the patent could be challenged, invalidated or circumvented by others and may not be of sufficient scope or strength to provide us with any meaningful protection. Further, we cannot assure you that competitors will not infringe the patent, or that we will have adequate rights or resources to enforce the patent. Many patent applications in the United States are maintained in secrecy for a period of time after they are filed, and since publication of discoveries in the scientific or patent literature tends to lag behind actual discoveries by several months, we cannot be certain that our licensor was the first creator of the invention covered by the patent application made or that it was the first to file a patent application for the invention. Because some patent applications are maintained in secrecy for a period of time, there is also a risk that we could adopt a technology without knowledge of a pending patent application, which technology would infringe a third party patent once that patent is issued.
If third parties claim that we infringe upon their intellectual property rights, our operating profits could be adversely affected.
We face the risk of claims that we have infringed third parties’ intellectual property rights. For example, our equipment and manufacturing operations may unintentionally infringe upon the patents of a competitor or other company that uses patented components or processes in its manufacturing operations, and that company may have legal recourse against our use of its protected information. Our competitors, many of which have substantially greater resources and may have made substantial investments in competing technologies, may have applied for or obtained, or may in the future apply for and obtain, patents that will prevent, limit or otherwise interfere with our ability to make and sell our services. We have not conducted an independent review of patents issued to third parties. The large number of patents, the rapid rate of new patent issuances, the complexities of the technology involved and uncertainty of litigation increase the risk of business assets and management’s attention being diverted to patent litigation. In addition, because of the recent introduction to the market of TFP
13
Table of Contents
technology, claims that its use infringe on the patent rights of others are more likely to be asserted after more widespread use. We also face the risk of claims that we have misappropriated third parties’ trade secret information.
Any claims of patent or other intellectual property infringement, even those without merit, could:
| • | be expensive and time consuming to defend; |
| • | cause us to cease making, licensing or using services and products that incorporate the challenged intellectual property; |
| • | require us to redesign or reengineer our products, if feasible; |
| • | divert management’s attention and resources; or |
| • | require us to enter into royalty or licensing agreements in order to obtain the right to use a third party’s intellectual property. |
Any royalty or licensing agreements, if required, may not be available to us on acceptable terms or at all. A successful claim of infringement against us could result in our being required to pay significant damages, enter into costly license or royalty agreements, or stop the sale of certain services and products, any of which could have a negative impact on our operating profits and harm our future prospects.
New technology may cause us to become less competitive.
The oilfield service industry is subject to the introduction of new drilling and completion techniques and services using new technologies, some of which may be subject to patent protection. Although we believe our equipment and processes currently give us a competitive advantage, as competitors and others use or develop new or comparable technologies in the future, we may lose market share or be placed at a competitive disadvantage. Further, we may face competitive pressure to implement or acquire certain new technologies at a substantial cost. Some of our competitors have greater financial, technical and personnel resources that may allow them to enjoy technological advantages and implement new technologies before we can. We cannot be certain that we will be able to implement new technologies or services and products on a timely basis or at an acceptable cost. Thus, limits on our ability to effectively use and implement new and emerging technologies may have a material adverse effect on our business, financial condition or results of operations.
We are vulnerable to the potential difficulties associated with rapid growth and expansion.
We intend to grow rapidly over the next several years. We believe that our future success depends on our ability to manage the growth we expect to occur and the demands from increased responsibility on our management personnel. The following factors could present difficulties to us:
| • | lack of sufficient executive-level personnel; |
| • | increased administrative burden; |
| • | long lead times associated with acquiring additional equipment, including potential delays with respect to our on-order fracturing units; and |
| • | ability to maintain the level of focused service attention that we have historically been able to provide to our customers. |
In addition, we may in the future seek to grow our business through acquisitions that enhance our existing operations. The success of any completed acquisition will depend on our ability to integrate effectively the acquired business into our existing operations. The process of integrating acquired businesses may involve unforeseen difficulties and may require a disproportionate amount of our managerial and financial resources. Our operating results could be adversely affected if we do not successfully manage these potential difficulties.
14
Table of Contents
We may be unable to employ a sufficient number of skilled and qualified workers.
The delivery of our services and products requires personnel with specialized skills and experience who can perform physically demanding work. As a result of the volatility in the energy service industry and the demanding nature of the work, workers may choose to pursue employment in fields that offer a more desirable work environment. Our ability to be productive and profitable will depend upon our ability to employ and retain skilled workers. In addition, our ability to expand our operations depends in part on our ability to increase the size of our skilled labor force. The demand for skilled workers in our geographic areas of operations is high, and the supply is limited. A significant increase in the wages paid by competing employers could result in a reduction of our skilled labor force, increases in the wage rates that we must pay, or both. If either of these events were to occur, our capacity and profitability could be diminished and our growth potential could be impaired.
Our operations are subject to hazards inherent in the energy services industry.
Risks inherent to our industry, such as equipment defects, vehicle accidents, explosions and uncontrollable flows of the chemicals we use in hydraulic fracturing as well as gas or well fluids, can cause personal injury, loss of life, suspension of operations, damage to formations, damage to facilities, business interruption and damage to, or destruction of property, equipment and the environment. These risks could expose us to substantial liability for personal injury, wrongful death, property damage, loss of oil and natural gas production, pollution and other environmental damages. The existence, frequency and severity of such incidents will affect operating costs, insurability and relationships with customers, employees and regulators. In particular, our customers may elect not to purchase our services if they view our safety record as unacceptable, which could cause us to lose customers and substantial revenues.
Our operational personnel have experienced accidents which have, in some instances, resulted in serious injuries. Our safety procedures may not always prevent such damages. Our insurance coverage may be inadequate to cover our liabilities. In addition, we may not be able to maintain adequate insurance in the future at rates we consider reasonable and commercially justifiable or on terms as favorable as our current arrangements. The occurrence of a significant uninsured claim, a claim in excess of the insurance coverage limits maintained by us or a claim at a time when we are not able to obtain liability insurance could have a material adverse effect on our ability to conduct normal business operations and on our financial condition, results of operations and cash flows.
We participate in a capital-intensive industry. We may not be able to finance future growth of our operations or future acquisitions.
Historically, we have funded the growth of our operations and equipment purchases from bank debt, capital contributions from our equity sponsors and cash generated by our business. If we do not generate sufficient cash from operations to expand our business, our growth could be limited unless we are able to obtain additional capital through equity or debt financings or bank borrowings. Our inability to grow our business may adversely impact our ability to sustain or improve our profits.
Our industry is highly competitive and we may not be able to provide services that meet the specific needs of oil and natural gas E&P companies at competitive prices.
Our industry is highly competitive. The principal competitive factors in our markets are generally technical expertise, fleet capability and experience. We compete with large national and multi-national companies that have longer operating histories, greater financial resources and greater name recognition than we do and who can operate at a loss in the regions in which we operate. Several of our competitors provide a broader array of services and have a stronger presence in more geographic markets. Our competitors may be able to respond more quickly to new or emerging technologies and services and changes in customer requirements. As a result of competition, we may lose market share or be unable to maintain or increase prices for our present services or to acquire additional business opportunities, which could have a material adverse effect on our business, financial
15
Table of Contents
condition, results of operations and cash flows. In addition, competition among oilfield service and equipment providers is affected by each provider’s reputation for innovation, safety and quality. Our reputation for safety and quality may not be sufficient to enable us to maintain our competitive position.
MMH has significant influence over us, including influence over decisions that require stockholder approval, which could limit your ability to influence the outcome of key transactions, including a change of control.
MMH holds 88.9% of our outstanding common stock as of March 31, 2013 without giving effect to the exercise of the Warrants. As a result, MMH may exert controlling influence over our decisions to enter into any corporate transaction regardless of whether others believe that the transaction is in our best interests.
As long as MMH continues to hold a large portion of our outstanding common stock, it will have the ability to influence the vote in any election of directors and over decisions that require stockholder approval. In addition, the concentration of ownership may have the effect of delaying, preventing or deterring a change in control of our Company, could deprive stockholders of an opportunity to receive a premium for their common stock as part of a sale of our Company and might ultimately affect the value of our common stock.
MMH is also in the business of making investments in companies and may from time to time acquire and hold interests in businesses that compete directly or indirectly with us. MMH may also pursue acquisition opportunities that are complementary to our business, and, as a result, those acquisition opportunities may not be available to us.
We engage in transactions and enter agreements with entities affiliated with or controlled by our stockholders, which could have a material adverse effect on our ability to raise capital or to do business.
We engage in transactions and enter agreements with entities affiliated with or controlled by our stockholders. We believe that the transactions and agreements we have entered into with these affiliated entities are on terms that are at least as favorable as could reasonably have been obtained at such time from third parties. However, these relationships could create, or appear to create, potential conflicts of interest when our board of directors is faced with decisions that could have different implications for us and these affiliated entities. The appearance of conflicts, even if such conflicts do not materialize, might adversely affect the public’s perception of us, as well as our relationship with other companies and our ability to enter into new relationships in the future, which could have a material adverse effect on our ability to raise capital or to do business.
Weather conditions could materially impair our business.
Our current and future operations, which may extend into Louisiana and parts of Texas, may be adversely affected by hurricanes and tropical storms, resulting in reduced demand for our services. Adverse weather can also directly impede our own operations. Repercussions of severe weather conditions may include:
| • | curtailment of services; |
| • | weather-related damage to facilities and equipment, resulting in suspension of operations; |
| • | inability to deliver equipment, personnel and products to job sites in accordance with contract schedules; |
| • | increase in the price of insurance; and |
| • | loss of productivity. |
These constraints could also delay our operations, reduce our revenues and materially increase our operating and capital costs.
16
Table of Contents
Climate change legislation or regulations restricting emissions of greenhouse gases could result in increased operating costs and reduced demand for our services.
On December 15, 2009, the EPA published its findings that emissions of carbon dioxide, methane and other greenhouse gases (“GHGs”) present an endangerment to public health and welfare because emissions of such gases are, according to the EPA, contributing to the warming of the earth’s atmosphere and other climate changes. Based on these findings, the EPA has begun to adopt and implement regulations that would restrict emissions of GHGs under existing provisions of the federal Clean Air Act (the “CAA”). The EPA recently adopted two sets of rules regulating GHG emissions under the CAA, one of which requires a reduction in emissions of GHGs from motor vehicles and the other of which will require that certain large stationary sources obtain permits for their emissions of GHGs. The EPA has also adopted rules requiring the reporting of GHG emissions from certain large GHG emission sources, on an annual basis, beginning in 2011 for emissions occurring after January 1, 2010. Further GHG regulation of our business could have an additional impact on our financial results.
In addition, both houses of Congress have actively considered legislation to reduce emissions of GHGs, and more than one-third of the states have already taken legal measures to reduce emissions of GHGs, primarily through the planned development of GHG emission inventories and/or regional GHG cap and trade programs. Most of these cap and trade programs work by requiring either major sources of GHG emissions or major producers of fuels to acquire and surrender emission allowances, with the number of allowances available for purchase reduced each year until the overall GHG emission reduction goal is achieved.
Any new federal, regional or state restrictions on emissions of carbon dioxide or other GHGs that may be imposed in areas in which we conduct business could result in increased compliance costs or additional operating restrictions on our customers. Such restrictions could potentially make our customers’ products more expensive and thus reduce demand for them, which could have a material adverse effect on the demand for our services and our business. Finally, some scientists have concluded that increasing concentrations of GHGs in the earth’s atmosphere may produce climate changes that have significant physical effects, such as increased frequency and severity of storms, droughts, and floods and other climatic events. If any such effects were to occur, they could have an adverse effect on our results of operations
We, and our customers, are subject to extensive and costly environmental, health and safety laws and regulations that may require us to take actions that will adversely affect our results of operations.
Our business, and our customers’ business, is significantly affected by stringent and complex federal, state and local laws and regulations governing the discharge of substances into the environment or otherwise relating to protection of the environment or human health and safety. As part of our business, we emit, handle, transport, and dispose of a variety of fluids and substances used by our customers in connection with their oil and natural gas E&P activities. We also generate and dispose of hazardous waste. The emission, generation, handling, transportation, and disposal of these fluids, substances, and wastes are regulated by a number of laws, including the CAA, the Resource Conservation and Recovery Act, the Comprehensive Environmental Response, Compensation, and Liability Act, the Clean Water Act, the SDWA, and analogous state laws and regulations. Failure to properly handle, transport, or dispose of these materials or otherwise conduct our operations in accordance with these and other environmental laws and regulations could expose us to liability for governmental penalties, third-party claims, cleanup costs associated with releases of such materials, damages to natural resources, and other damages, as well as potentially impair our ability to conduct our operations. We could be exposed to liability for cleanup costs, natural resource damages and other damages as a result of our conduct that was lawful at the time it occurred or the conduct of, or conditions caused by, prior operators or other third parties. We could also be subject to private party tort claims in connection with actual or alleged environmental impacts associated with our operations.
Environmental laws and regulations may, among other things, require the acquisition of permits to conduct our operations; restrict the amounts and types of substances that may be released into the environment or the way we
17
Table of Contents
use, handle or dispose of our wastes in connection with our operations; cause us to incur significant capital expenditures to install pollution control or safety-related equipment at our operating facilities; limit or prohibit construction or drilling activities in sensitive areas such as wetlands, wilderness areas or areas inhabited by endangered or threatened species; impose specific health and safety criteria addressing worker protection; require investigatory and remedial actions to mitigate pollution conditions caused by our operations or attributable to former operations; and impose substantial liabilities on us for pollution resulting from our operations. Environmental laws and regulations have changed in the past, and they are likely to change in the future. If existing regulatory requirements or enforcement policies change, we may be required to make significant unanticipated capital and operating expenditures.
Any failure by us to comply with applicable environmental, health and safety laws and regulations may result in governmental authorities taking actions against our business that could adversely impact our operations andfinancial condition, including the:
| • | issuance of material administrative, civil and criminal penalties; |
| • | modification, denial or revocation of permits or other authorizations; |
| • | imposition of limitations on our operations; and |
| • | performance of site investigatory, remedial or other corrective actions. |
The oil and gas industry presents environmental risks and hazards and environmental regulation has tended to become more stringent over time. Environmental laws and regulations may restrict the rate of oil and natural gas production below the rate that would otherwise be possible. The regulatory burden on the oil and natural gas industry increases the cost of doing business in the industry and consequently affects profitability. In addition, an increase in regulatory requirements on oil and gas exploration and completion activities could significantly delay or interrupt our customers’ operations.
More stringent trucking regulations may increase our costs and negatively impact our results of operations.
As part of the services we provide, we operate as a motor carrier and therefore are subject to regulation by the United States Department of Transportation (the “DOT”), and by other various state agencies. These regulatory authorities exercise broad powers, governing activities such as the authorization to engage in motor carrier operations and regulatory safety, and hazardous materials labeling, placarding and marking. There are additional regulations specifically relating to the trucking industry, including testing and specification of equipment and product handling requirements. The trucking industry is subject to possible regulatory and legislative changes that may affect the economics of the industry by requiring changes in operating practices or by changing the demand for common or contract carrier services or the cost of providing truckload services. Some of these possible changes include increasingly stringent environmental regulations, changes in the hours of service regulations that govern the amount of time a driver may drive in any specific period, onboard black box recorder devices or limits on vehicle weight and size.
Interstate motor carrier operations are subject to safety requirements prescribed by the DOT. To a large degree, intrastate motor carrier operations are subject to state safety regulations that mirror federal regulations. Such matters as weight and dimension of equipment are also subject to federal and state regulations.
From time to time, various legislative proposals are introduced, including proposals to increase federal, state or local taxes, including taxes on motor fuels, which may increase our costs or adversely impact the recruitment of drivers. We cannot predict whether, or in what form, any increase in such taxes applicable to us will be enacted.
18
Table of Contents
All of the common stock referred to in this offering will be offered by the selling shareholders. We will not receive any proceeds from the resale of the common stock by those selling shareholders. We will receive proceeds in the amount of $0.01 per share when the selling shareholders exercise the 250,000 Warrants entitling them to purchase 247,058 shares of common stock that they may sell from time to time. If all Warrants are exercised, we will receive $2,470.58, which will be used for general corporate purposes.
19
Table of Contents
We have not paid dividends on our common stock, and we do not anticipate paying dividends on our common stock in the foreseeable future. In addition, the terms of our Shell Credit Facility (as later defined) and the indenture governing the Notes restrict our ability to pay dividends on the common stock.
20
Table of Contents
Management’s Discussion and Analysis of
Financial Condition and Results of Operations
The following discussion and analysis should be read in conjunction with our audited consolidated financial statements and related notes included elsewhere in this prospectus. This discussion contains forward-looking statements based on our current expectations, assumptions, estimates and projections about our operations, the hydraulic fracturing services industry and the broader oil and natural gas exploration and production industry. These forward-looking statements involve known and unknown risks, uncertainties and other facts outside of our control that may cause actual results or events to differ materially from those anticipated in such forward-looking statements. Factors that could cause or contribute to such differences include, but are not limited to: general economic and competitive conditions, changes in market prices for oil and natural gas, the level of oil and natural gas drilling and corresponding increases or decreases in the demand for our services, the level of capital expenditures by our existing and prospective customers, regulatory changes and other uncertainties, as well as those factors discussed below and elsewhere in this prospectus, particularly in the sections titled “Risk Factors” and “Cautionary Statement Regarding Forward-Looking Statements.” We undertake no obligation to update any forward-looking statements, even if new information becomes available or other events materially impact any of the forward-looking statements contained in this prospectus.
Overview
Formed in 1969, we are an independent oilfield services company that provides a wide range of pressure pumping related services to oil and natural gas drilling and production companies to help develop and enhance the production of hydrocarbons. Our traditional oilfield pumping services included cementing, coiled tubing, pressure pumping, acidizing, and other pumping services. In December 2010, we began providing hydraulic fracturing pumping services as a part of our portfolio of services provided to our customers using our own internally produced turbine-powered hydraulic fracturing units. To support our hydraulic fracturing operations, we have also entered into two long-term leases during 2011 for sand mines in Louisiana and Mississippi. These mines are expected to supply a portion of our fracturing sand needs and provide us with the opportunity to sell fracturing sand to third parties.
Beginning in March of 2013, we have begun a new service to manufacture and sell equipment for use in the power generation equipment industry. Our initial sales of power generation equipment were to an affiliate of our chief executive officer, Michel B. Moreno. We currently provide our services to a diverse group of major and large independent oil and natural gas companies throughout North America.
During May 2011, we redeemed through a series of transactions, all of the then existing members’ ownership for cash payments of $2.2 million, an obligation to pay $30.7 million and contingent consideration of up to $30 million, subsequently amended to $35.7 million, based on revenues that are earned from our turbine driven equipment. A new member was admitted for a cash contribution of $0.7 million. This series of transactions resulted in a change of control of the Company which required that a new basis of accounting be established as of the date of the change in control. Due to this, certain of the consolidated financial statements and certain disclosures are presented in distinct periods to indicate the application of the two bases of accounting. The term “Predecessor” refers to the Company prior to the change in control and the term “Successor” refers to the Company following the change in control.
Even though the Company’s operations did not significantly change as a result of the change in control, during the Successor period, the Company’s operations were impacted by the significant growth in its hydraulic fracturing services. Therefore, comparisons of the financial position and results of operations to those of the Predecessor may not be meaningful. In the opinion of management, all adjustments (consisting of normal recurring adjustments) considered necessary for a fair presentation have been included.
How We Generate Our Revenues
Prior to December 2010, our revenue had been derived from our traditional well services, including cementing, coiled tubing, pressure pumping, acidizing, and other pumping services. Since December 2010, in response to the
21
Table of Contents
introduction of shale fracturing to the industry, we began providing an additional pressure pumping service, hydraulic fracturing, to our established customer base to provide us with additional pressure pumping service revenue. As was the case in the year ended December 31, 2012, we expect that a majority of our revenue will be derived from our hydraulic fracturing product offering.
Hydraulic Fracturing Services. We provide hydraulic fracturing and other services to our customers through three different types of customer arrangements:
| • | per-stage payments for the committed hydraulic fracturing spreads under long-term agreements, such as our agreement with Shell; |
| • | contracts providing minimum monthly service fees; and |
| • | spot market arrangements to provide hydraulic fracturing services at prevailing market rates. |
Under any of these arrangements, the fees we charge per fracturing stage will be based on the equipment and personnel required for the job, the flow rate and pressures in the hydraulic fracturing pumps, market conditions in the region in which the services are performed as well as the type and volumes of chemicals and proppants that are consumed during the fracturing process. With respect to our turbine-powered hydraulic fracturing fleet, in September 2011 we entered into a two-year agreement with Shell to provide Shell with hydraulic fracturing services. We delivered our first hydraulic fracturing unit pursuant to our Shell agreement during the first quarter of 2012.
Our long-term contracts require that we provide our hydraulic fracturing equipment, the crew to operate that equipment and the required fuel, chemicals and proppant, and our customers are generally be charged per fracturing stage completed. Our contracts for minimum monthly services are for multiple-year terms, and our customers agree to pay us on a monthly basis for a specified number of fracturing stages, whether or not those stages are actually fractured. To the extent customers utilize more than the specified contract minimums, we are paid an agreed-upon amount per stage actually fractured. Although we have entered into the Shell agreement and will seek additional term contracts for our remaining hydraulic fracturing fleet, we have the flexibility to pursue short-term engagements with multiple customers. We charge prevailing market prices per stage for this work. We believe our ability to provide services in the spot market allows us to take advantage of any favorable pricing and allows us to develop new customer relationships.
Under the long-term contracts and for spot market work, we also charge fees for set up and mobilization of equipment, depending on the job.
We have entered into a lease for two sand mines and expect to generate revenue from third-party sales of sand. The sand from these mines satisfies a portion of our own fracturing sand needs as well as provides us the opportunity to sell fracturing sand to third parties. We have also entered into an agreement with Alliance, an affiliate, to build and operate a wet and dry processing plant that will perform the mining, processing and transportation of raw fracturing sand from these mines to support a portion of our own fracturing sand needs as well as demand from other consumers of fracturing and other types of sand. We pay Alliance $29 per ton for these services and as of March 31, 2013 had prepaid Alliance $4.5 million which will offset future costs. The Company’s agreement with Alliance is in the process of being assumed by SSS.
We have received inquiries from a number of oilfield service companies, including some subsidiaries of E&P companies, regarding possible sale or lease arrangements for our TFPs. We may consider entering into selective sale or lease arrangements to generate near-term cash flow and profitability while we continue to build out our fracturing operations. We expect that we would enter into such an arrangement only in situations in which we would not have the opportunity to provide such services or if our customer agrees that it will not develop or use turbine fracturing technology other than ours for a reasonable period of time.
Well Services. Our revenue from our traditional well pumping services has been, and we believe will continue to be, derived from prevailing market rates for such services, together with associated materials charges. We intend
22
Table of Contents
to expand our well services capacity and, to that end, plan to add new cementing and coiled tubing units to our fleet. We placed into service the first of six new coiled tubing units in December 2012 and, in addition, expect to take delivery of and place into service five coiled tubing units and four cementing units during 2013.
Our cementing, coiled tubing, pressure pumping, acidizing and other pumping services are provided in the spot market at prevailing prices per job. We may also charge fees for set up and mobilization of equipment in certain circumstances. The set-up charges and project rates vary with the type of service to be performed, the equipment and personnel required for the job, the distance of the project from our equipment and market conditions in the region in which the service is to be performed. We also charge customers for the materials, such as stimulation fluids, nitrogen, acids and cement, that we use in each job. Materials charges reflect the cost of the materials plus a markup and are based on the actual quantity of materials used in the project. We have entered into Master Service Agreements (“MSAs”) with approximately 90 oil and natural gas companies that enable us to provide well services to those companies on request.
How We Manage Costs and Secure Critical Equipment
The principal expenses involved in conducting our business are the costs of acquiring, maintaining and repairing our equipment, labor and related personnel expenses, product and material costs and fuel costs. Additionally, we will incur costs to deliver and stage our hydraulic fracturing spreads to the worksite.
We purchase our hydraulic fracturing components, including turbine engines, pumps, skids, instrumentation and gear boxes, from third-party vendors, and we then oversee the assembly of the components into TFPs, which we believe provides us access to end products in a timely and more cost-effective manner than purchasing fully constructed components from third parties. Certain installation services necessary for the manufacture of TFPs is provided by TPT under the terms of our installation agreement with it. Please see the section titled “Certain Relationships and Related Person Transactions—Joint Venture” for additional information.
A critical element of our ability to accurately predict and manage the costs of assembling our TFPs is an exclusive agreement TPT has with a vendor that provides remanufactured turbine engines previously used in U.S. military applications. Under our equipment purchase agreement with TPT, we have negotiated a fixed price for up to 200 turbine engines and have taken delivery of 72 turbine engines including 24 held in inventory as of March 31, 2013. The 200 turbines will be sufficient to produce approximately 450,000 HP for use in our TFPs. We believe the reliability of our turbine supply will be a key aspect of our future success as we continue to grow our hydraulic fracturing fleet.
Preventative maintenance on our equipment is an important factor in our profitability. If our equipment is not maintained properly, our repair costs may increase and, during periods of high activity, our ability to operate efficiently could be significantly diminished due to having equipment out of service. Our maintenance crews perform regular inspections and preventative maintenance on each of our trucks and other mechanical equipment. Our management monitors the performance of our maintenance crews at each of our service centers by monitoring the level of maintenance expenses over time and comparing those expenses to budgeted maintenance expenses. A rising level of maintenance expenses over time relative to budgeted amounts can be an early indication that our preventative maintenance schedule is not being followed or that certain of our equipment is in need of major repair or replacement. In this situation, management can take corrective measures to help reduce maintenance expenses as well as ensure that maintenance issues do not interfere with operations. With respect to our hydraulic fracturing fleet, because our TFPs will be assembled using newly remanufactured turbine engines and other new components, we anticipate that our down time for maintenance and repair will initially be lower than our competitors whose hydraulic fracturing equipment has been in use for some time.
We incur significant fuel consumption in connection with the operation of our hydraulic fracturing fleet and the transportation of our equipment and products. However, the ability of our TFPs to utilize natural gas, diesel or biofuel allows us to select the lowest-cost fuel in each market in which we operate.
23
Table of Contents
Raw fracturing sand is an essential element of the proppant used in the fracturing process. We have entered into a lease for two sand mines and expect to generate revenue from third-party sales of sand once we invest in new mining and refining equipment and develop the infrastructure to transport the raw fracturing sand from the mines to the final point of sale. We believe our sand operations will provide a reliable, cost-effective source of raw fracturing sand for certain of our jobs. We expect the sand from these mines to satisfy a portion of our own fracturing sand needs as well as provide us the opportunity to sell fracturing sand to third parties. Based on a report prepared by Westward Environmental, Inc., our mines in Mississippi and Louisiana have an estimated 11 million tons and 7 million tons of proven reserves, respectively, that fall within the sieve size range traditionally used in fracturing operations.
Depreciation and amortization represented approximately 14.4% of our revenues for the three months ended March 31, 2013. Direct labor costs represented approximately 13.6% of our revenues for the three months ended March 31, 2013. Other direct costs, including proppant, chemical and freight costs, represented approximately 75.0% of our revenues for the three months ended March 31, 2013. Indirect costs represented approximately 6.2% of our revenues for three months ended March 31, 2013.
How We Manage Our Operations
Our management team uses a variety of tools to monitor and manage our operations in the following three areas: (1) asset utilization; (2) customer satisfaction; and (3) safety performance.
Asset Utilization. With respect to hydraulic fracturing services, we will measure our activity levels by the total number of hydraulic fracturing stages completed per month by each of our hydraulic fracturing spreads. With respect to our well services, we measure our activity levels by the total number of jobs completed per month. We may also track the number of wells we have serviced in connection with analyzing our fracturing stage count. We also monitor the number of requests we receive for our services and equipment, as well as the number of times either we or our customers decline a job request because of pricing or equipment availability. By consistently monitoring the activity level, pricing and relative performance of each of our spreads and jobs, we can more efficiently allocate our equipment and personnel to maximize our revenue generation and profitability.
As of May 20, 2013, we had approximately 159,750 HP of high pressure pumping capacity in our fleet, of which 150,750 HP was turbine powered. During December 2012, we placed into service the first of six planned new coiled tubing units. A second new coiled tubing unit and two new cementing units were also placed into service in April and May of 2013, respectively.
During the three months ended March 31, 2013, we completed 556 fracturing stages and generated average revenue per fracturing stage of approximately $106,258. During this period we also completed 477 well services jobs, generating average revenue per job of approximately $10,319.
Customer Satisfaction. We value our longstanding relationships with our producer customers. We regularly review changes in our revenue per customer to assess each customer’s level of demand for, and satisfaction with, our services. Our management also uses this information to evaluate our position relative to our competitors in the various markets in which we operate.
Safety Performance. Maintaining a strong safety record is a critical component of our operational success. Many of our customers have safety standards we must satisfy before we can perform services for them. We maintain a safety database which allows management to identify negative trends in operational incidents so that appropriate measures can be taken to maintain and enhance our safety standards. We believe our outstanding safety record and proactive behavior-based safety program are significant contributors to our ability to maintain strong customer relationships and gain new work.
24
Table of Contents
Our Challenges
We face many challenges and risks in the industry in which we operate. Although many factors contributing to these risks are beyond our ability to control, we continuously monitor these risks, and we have taken steps to mitigate them to the extent practicable. In addition, we believe that given sufficient capital, we are well positioned to capitalize on the current growth opportunities available in the hydraulic fracturing market. However, we may be unable to capitalize on our competitive strengths to achieve our business objectives and, consequently, our results of operations may be adversely affected. Please read the section titled “Risk Factors” in this prospectus for additional information about the risks we face.
Going Concern Consideration. As discussed in Note 2 to our 2012 consolidated financial statements, we have recurring operating losses and a net working capital deficiency that raise substantial doubt about our ability to continue as a going concern. Our independent registered public accounting firm included an explanatory paragraph in its report on our 2012 consolidated financial statements regarding the substantial doubt about our ability to continue as a going concern. Refer to Note 2 in our 2012 consolidated financial statements for the disclosures describing our plans in regard to these matters.
Attracting and Retaining Operational Personnel. Our ability to provide services profitably and to expand our operations depends on our ability to attract and retain experienced, knowledgeable and skilled operational employees. The demand for skilled workers in our geographic areas of operations is high, resulting in intense competition among oilfield services companies for skilled workers. In addition, we are likely to face increased competition for skilled personnel as new and existing oilfield services companies enter or expand their operations in the hydraulic fracturing sector. We believe that the following elements will help us meet this challenge:
| • | the fact that our TFPs require fewer employees per job than conventional diesel-powered hydraulic fracturing equipment; |
| • | the appeal of operating and being associated with equipment that utilizes the Frac Stack Pack™ technology; |
| • | our competitive compensation and benefits package; and |
| • | the ease of operating our turbine-powered hydraulic fracturing equipment relative to conventional diesel-powered equipment. |
Hydraulic Fracturing Legislation and Regulation. Hydraulic fracturing generally has been exempt from federal regulation under the SDWA since 2005 except for the underground injection of hydraulic fracturing fluids or propping agents that contain diesel fuels. Our hydraulic fracturing operations do not include the underground injection of hydraulic fracturing fluids or propping agents that contain diesel as a constituent. Legislation has been introduced before Congress in the last few sessions to provide for federal regulation of hydraulic fracturing and to require disclosure of the chemicals used in the fracturing process. Although the federal legislation did not pass, if similar federal legislation is introduced and becomes law in the future, the legislation could establish an additional level of regulation that could lead to operational delays or increased operating costs. The EPA commenced a study, at the order of Congress, of the potential environmental and health impacts of hydraulic fracturing activities, and a committee of the U.S. House of Representatives is also conducting an investigation of hydraulic fracturing practices. EPA issued a Progress Report in December 2012 and a final draft is anticipated by 2014 for peer review and public comment. On October 21, 2011, the EPA announced its intention to propose regulations by 2014 under the Clean Water Act to regulate wastewater discharges from hydraulic fracturing and other natural gas production. The EPA is also using administrative Emergency Orders under the SDWA to regulate certain hydraulic fracturing activities. In addition, various state, regional and local governments have implemented, or are considering, increased regulatory oversight of hydraulic fracturing, and Texas and other states have adopted legislation that requires disclosure of information regarding the substances used in the hydraulic fracturing process to state regulators and the public.
On August 16, 2012, the EPA published final regulations under the federal Clean Air Act, as amended, (the “CAA”) that establish new air emission controls for oil and natural gas production and natural gas processing
25
Table of Contents
operations. Specifically, the EPA’s rule package includes New Source Performance Standards to address emissions of sulfur dioxide and volatile organic compounds (“VOCs”) and a separate set of emission standards to address hazardous air pollutants frequently associated with oil and natural gas production and processing activities. The final rule includes a 95% reduction in VOCs emitted by requiring the use of reduced emission completions or “green completions” on all hydraulically-fractured wells constructed or refractured after January 1, 2015. The rules also establish specific new requirements regarding emissions from compressors, controllers, dehydrators, storage tanks and other production equipment. EPA received numerous requests for reconsideration of these rules from both industry and the environmental community, and court challenges to the rules were also filed. EPA intends to issue revised rules in 2013 that are likely responsive to some of these requests. For example, on April 12, 2013 EPA published a proposed amendment extending compliance dates for certain storage vessels. The final revised rules could require modifications to our operations or increase our capital and operating costs without being offset by increased product capture. At this point, we cannot predict the final regulatory requirements or the cost to comply with such requirements with any certainty. In addition, the U.S. Department of the Interior published a revised proposed rule on May 24, 2013 that would updated existing regulation of hydraulic fracturing activities on federal lands, including requirements for disclosure, well bore integrity and handling of flowback water.
In addition, the EPA has implemented its Tier 4 regulations, which, among other things, set emission standards for certain off-road diesel engines that are used to power equipment in the field. Field tests regarding operation of our current turbine-powered hydraulic fracturing units have demonstrated compliance with the Tier 4 standards with respect to NOx and carbon monoxide emissions. Further emissions controls may be required with respect to other emissions regulated by Tier 4 standards, including particulate matter. We believe our turbine-powered fleet’s fuel flexibility provide us with significant advantages relative to many of our competitors in meeting any newly proposed standards.
In most states, our customers are required to obtain permits from one or more governmental agencies in order to perform drilling and completion activities, including hydraulic fracturing. Such permits are typically required by state and regional governmental agencies, but can also be required by federal and local governmental agencies. The requirements for such permits vary depending on the location where such drilling and completion activities will be conducted. As with all permitting processes, there is a degree of uncertainty as to whether a permit will be granted, the time it will take for a permit to be issued and the conditions that may be imposed in connection with the granting of the permit. In addition, there is an opportunity for public comment or challenge with respect to certain permit applications.
Various state, regional and local governments have implemented, or are considering, increased regulatory oversight of hydraulic fracturing through additional permit requirements, operational restrictions, disclosure requirements, and temporary or permanent bans on hydraulic fracturing in certain environmentally sensitive areas such as certain watersheds. For example, Colorado, Texas and Wyoming have passed laws and regulations requiring the disclosure of information regarding the substances used in the hydraulic fracturing process and other states are considering similar requirements. The availability of information regarding the constituents of hydraulic fracturing fluids could potentially make it easier for third parties opposing the hydraulic fracturing process to initiate legal proceedings based on allegations that specific chemicals used in the fracturing process could adversely affect groundwater.
In addition, a number of states have conducted, are currently conducting, or may in the future conduct, regulatory reviews that potentially could restrict or limit our customers’ access to shale formations located in their states. In some jurisdictions, including New York State and within the jurisdiction of the Delaware River Basin Commission, certain regulatory authorities have delayed or suspended the issuance of permits while the potential environmental impacts associated with issuing such permits can be studied and appropriate mitigation measures evaluated. Permitting delays, an inability to obtain new permits or revocation of our or our customers’ current permits could cause a loss of revenue and potentially have a materially adverse effect on our operations. The adoption of new laws or regulations imposing reporting obligations on, or otherwise limiting or regulating, the
26
Table of Contents
hydraulic fracturing process could make it more difficult to complete oil and natural gas wells in shale formations, increase our and our customers’ costs of compliance, and adversely affect the hydraulic fracturing services that we render for our E&P customers. In addition, if hydraulic fracturing becomes regulated at the federal level as a result of federal legislation or regulatory initiatives by the EPA, fracturing activities could become subject to additional permitting or regulatory requirements, and also to attendant permitting delays and potential increases in cost, which could adversely affect our business and results of operations.
Equipment Supply. The overall number of hydraulic fracturing equipment suppliers in the industry in which we operate is limited, and there has historically been high demand for this equipment. However, we do not foresee difficulties in obtaining needed equipment to complete our planned additions of operating equipment or the parts needed to maintain existing operating equipment.
As of May 20, 2013, we had approximately 159,750 HP of high pressure pumping capacity in our fleet, of which 150,750 HP was turbine powered. During December 2012 we placed into service the first of six planned new coiled tubing units. A second new coiled tubing unit and two new cementing units were also placed into service in April and May of 2013. We do not anticipate adding more horsepower without additional firm customer commitments in the future and we may also consider reconfiguring or selling some portion of the earlier assembled units in the fleet based on customer commitments and our evaluation of the market over the near term.
Since March 2013, we have manufactured and sold approximately $1.0 million of equipment for use in the power generation equipment industry to an affiliate of our chief executive officer, Michel B. Moreno. We may continue to engage additional similar equipment sales to this customer or others in the future, but there is no guarantee that we will do so.
Financing Future Growth. Historically, we have funded our growth through capital contributions, borrowings from our equity holders and third parties, and cash generated from our business. The successful execution of our growth strategy depends on our ability to raise capital as needed to, among other things, finance the purchase of additional hydraulic fracturing equipment and provide working capital. As discussed in Note 2 of our audited consolidated financial statements, we expect the required capital to be provided through a combination of (i) a short-term credit facility, (ii) additional equity raised, (iii) cost reduction and revenue improvement initiatives, (iv) extending services into the manufacturing and sale of turbine driven equipment, and (v) securing amendments to our primary debt facility. If we are unable to generate sufficient cash flows, obtain additional capital on favorable terms or at all, and secure amendments to our primary debt, we may be unable to fund further growth and future operations. However, we see increased demand for our services and turbine driven equipment fueled by natural gas and believe we are well positioned to achieve our working capital and capital expenditure requirements to serve that demand.
Recent Capital Raising Transactions
Amended and Restated Shell Credit Facility and Consent Solicitation. In October 2012, the Company entered into an amended and restated credit facility with Shell pursuant to which Shell agreed to provide up to an aggregate $95.0 million of senior secured term loans, which loans may not be reborrowed once repaid. As of September 30, 2012, there was approximately $24 million outstanding under the then-existing credit facility with Shell, and, upon closing of the Shell Credit Facility, there was approximately $94 million outstanding thereunder. The Shell Credit Facility is secured by a first priority lien on all of the Company’s motor vehicles and equipment. In connection with the Shell Credit Facility, an affiliate of Shell and the trustee under the indenture governing the Notes entered into an amended and restated intercreditor agreement setting forth the relative priority and interests with respect to the Company’s motor vehicles and equipment as between Shell and the trustee, on behalf of the Note holders. Repayments, which will total 25 monthly installments and commenced November 15, 2012, are to be $2.0 million per month through October 2013, $4.0 million per month for the next six months, $7.5 million per month for the next six months and one payment of $1.0 million in the final month.
27
Table of Contents
The Company initiated a successful consent solicitation (the “Consent Solicitation”) offer to modify certain of the covenants contained in the indenture governing its outstanding Notes to effectuate the above and to provide it with additional operating and financial flexibility. Specifically, the company obtained the required consents from the Note holders in order to, among other things:
| • | permit the one-time incurrence of up to $95.0 million in senior term loans secured by a first priority security interest in all of the Company’s motor vehicles and equipment under a credit agreement with Shell, for the purpose of financing the purchase of additional motor vehicles and equipment; |
| • | permit the deferral until August 2013 of the Company’s semi-annual obligation to make an offer to repurchase Notes from the holders thereof; and |
| • | add an obligation we issue shares of preferred stock, or arrange for other capital contributions at certain times, yielding gross proceeds of up to $15.0 million in the aggregate. |
In connection with the Consent Solicitation, the Company agreed to pay the Note holders a consent fee in the amount of 2.5% of the principal amount of any Notes with respect to which consents were validly delivered. This consent fee was payable in the form of new Notes issued under and governed by the terms and conditions of the Company’s indenture, as supplemented. Upon receipt and acceptance of consents for all the Notes then outstanding, the Company issued $5,948,000 in aggregate principal amount of new Notes, for an aggregate principal amount of $255,948,000.
Further, also in connection with the Consent Solicitation:
| • | the Company amended its warrant agreement in order to grant its Warrant holders tag-along rights with respect to certain sales of the its common stock; and |
| • | the Company amended its registration rights agreement in order to provide that the new Notes issued as the consent fee for its consent offer benefit from the registration rights applicable to the existing Notes. |
Private Stock Offering. In October 2012, the Company issued non-voting, non-convertible preferred stock that is not entitled to dividends to its existing shareholders in exchange for $10.0 million in gross proceeds and secured a commitment to purchase from time to time additional shares of preferred stock at a price per share equal to the fair market value of such shares yielding gross proceeds to us equal to the amount by which $10.0 million exceeds the aggregate cash on hand for the Company and its consolidated subsidiaries as at the last business day of any fiscal quarter; provided that in no event will such shareholders be required to purchase more than $15.0 million in additional shares in the aggregate.
Effects of Inflation
Inflation did not have a material impact on our results of operations for the years ended December 31, 2011 or 2010. Although the impact of inflation has been insignificant in recent years, it is still a factor in the United States economy and may increase the cost to acquire or replace property, plant and equipment. It may also increase the costs of labor and supplies. In particular, during the year ended December 31, 2012 we experienced unusually high costs for certain of the chemicals used in our services, namely guar, as a result of weather related shortages and high demand, but these costs have since abated significantly. To the extent permitted by competition, regulation and our existing agreements, we generally have and will continue to pass along increased costs to our customers in the form of higher fees.
Critical Accounting Policies
Certain accounting policies require the application of judgment by management in selecting appropriate assumptions for calculating financial estimates, which inherently contain some degree of uncertainty. Management bases its estimates on historical experience and various other assumptions that are believed to be reasonable under the circumstances, the results of which form the basis for making judgments about the reported
28
Table of Contents
carrying values of assets and liabilities and the reported amounts of revenue and expenses that may not be readily apparent from other sources. Actual results may differ from these estimates under different assumptions or conditions. We believe the following are some of the more critical accounting policies and related judgments and estimates used in the preparation of its consolidated financial statements.
Fair Value Measurement. Fair value is defined as the exchange price that would be received to sell an asset or paid to transfer a liability in a principal or most advantageous market for the asset or liability in an orderly transaction between market participants at the measurement date, using assumptions market participants would use when pricing an asset or liability. An orderly transaction assumes exposure to the market for a customary period for marketing activities prior to the measurement date and not a forced liquidation or distressed sale. Fair value measurement and disclosure guidance provides a three-level hierarchy that prioritizes the inputs of valuation techniques used to measure fair value into three broad categories:
Level 1 — Unadjusted quoted prices in active markets for identical assets or liabilities.
Level 2 — Observable inputs such as quoted prices for similar assets and liabilities in active markets, quoted prices for similar assets and liabilities in markets that are not active, or other inputs that are observable or can be corroborated by observable market data.
Level 3 — Unobservable inputs that are supported by little or no market activity and that are significant to the fair value of the assets or liabilities. This includes certain pricing models, discounted cash flow methodologies, and similar techniques that use significant unobservable inputs.
Fair value may be recorded for certain assets and liabilities every reported period on a recurring basis or under certain circumstances, on a non-recurring basis.
The fair value of the contingent consideration is determined using the estimated cash flows related to the Company’s revenue that is projected to be earned from the Company’s hydraulic fracturing spreads. These cash flows are discounted using a discount rate that reflects the nature of the investment and the risk of the cash flows associated with the contingent consideration. The liability for contingent consideration is reported at fair value on a recurring basis at each reporting period.
Business Combination Accounting. Acquisitions are accounted for under ASC 805, Business Combinations, which requires the use of the purchase method of accounting. All identifiable assets acquired and liabilities assumed are recorded at fair value. In connection with the Company’s change in control during May 2011, the Company recognized all assets and liabilities at their fair value as of the date of the change in control.
In accordance with ASC 805, estimated fair values are subject to adjustment up to one year after the acquisition date to the extent that additional information relative to closing date fair values becomes available. Material adjustments to acquisition date estimated fair values are recorded in the period in which the acquisition occurred and, as a result, previously reported results are subject to change. During the second quarter of 2012, we finalized our fair value assessment related to the change in control transaction. We had preliminarily estimated the portion of revenue attributable to turbine driven equipment, which is used to determine the fair value of the liability for contingent consideration. We updated this preliminary estimate based on actual jobs performed during 2012, which reduced the portion of the revenue attributable to the use of turbine driven equipment. This change in estimate resulted in a decrease in the fair value of contingent consideration at the change in control rate of approximately $5.8 million. In addition, we finalized the valuation of intangible assets acquired, which reduced the fair value of intangible assets by $2.0 million. The aggregate effect of these adjustments reduced goodwill recorded in the transaction by $3.8 million.
Impairment of long-lived assets, including intangible assets. Long-lived assets, which include property, plant and equipment, goodwill, and other intangible assets comprise a significant amount of our total assets. Long-lived assets to be held and used, including amortizable intangible assets, are reviewed for impairment whenever events or changes in circumstances indicate that the carrying amounts may not be recoverable. Goodwill is
29
Table of Contents
reviewed for impairment on an annual basis or when events or changes in circumstances indicate that the carrying amount may not be recoverable. An impairment loss is recorded in the period in which it is determined that the carrying amount is not recoverable. Such impairment assessments require us to make judgments and estimates, including long-term forecasts of its future revenues and costs related to the assets subject to review. These forecasts require assumptions about demand for our products and services, future market conditions and technological developments. Significant and unanticipated changes to these assumptions could result in an impairment change in future periods.
See the Notes to our audited and unaudited consolidated financial statements included elsewhere in this prospectus for additional information on accounting policies affecting our financial condition and results of operations.
Results of Operations
In the near term, we expect that our revenues and results of operations will be positively impacted by increased utilization of our operating equipment, improved pricing for our services, the service revenues generated by growth in our fleet of hydraulic fracturing and well services equipment, and less volatility in the price we pay for certain chemicals such as guar.
Results for the Three Months Ended March 31, 2013 Compared to the Three Months Ended March 31, 2012
The following table summarizes the change in our results of operations for the three months ended March 31, 2013 when compared to the three months ended March 31, 2012 (the “Current Quarter” and “Prior Quarter”, respectively):
| THREE MONTHS ENDED MARCH 31, 2012 |
THREE MONTHS ENDED MARCH 31, 2013 |
$ CHANGE | ||||||||||
| Statement of Operations Data: |
||||||||||||
| Revenue |
$ | 6,277 | $ | 68,375 | $ | 62,098 | ||||||
| Operating costs: |
||||||||||||
| Costs of revenue |
11,212 | 64,873 | 53,661 | |||||||||
| Selling and administrative expenses |
5,515 | 6,501 | 987 | |||||||||
| Depreciation and amortization |
3,085 | 9,849 | 6,764 | |||||||||
|
|
|
|
|
|
|
|||||||
| Total operating costs |
19,812 | 81,224 | 61,412 | |||||||||
|
|
|
|
|
|
|
|||||||
| Income (loss) from operations |
(13,534 | ) | (12,849 | ) | 685 | |||||||
| Other income (expense): |
||||||||||||
| Interest expense |
(5,517 | ) | (12,975 | ) | (7,458 | ) | ||||||
| Other income (expense) |
(6 | ) | (111 | ) | (105 | ) | ||||||
|
|
|
|
|
|
|
|||||||
| Net other expense |
(5,523 | ) | (13,086 | ) | (7,563 | ) | ||||||
|
|
|
|
|
|
|
|||||||
| Income (loss) before income taxes |
(19,057 | ) | (25,935 | ) | (6,878 | ) | ||||||
| Income tax expense (benefit) |
(2,476 | ) | (759 | ) | 1,717 | |||||||
|
|
|
|
|
|
|
|||||||
| Net income (loss) |
$ | (16,581 | ) | $ | (25,176 | ) | $ | (8,595 | ) | |||
|
|
|
|
|
|
|
|||||||
| (thousands) | ||||||||||||
Revenue
Revenue increased $62.1 million, or 989.2%, to $68.4 million for the Current Quarter as compared to $6.3 million for the Prior Quarter. The increase was primarily due to an increase in operating activity resulting from the two hydraulic fracturing spreads that were placed into service in May 2012 and in July 2012. During the
30
Table of Contents
Current Quarter we placed into service a fourth hydraulic fracturing spread which was not significantly utilized in the quarter. Of our four spreads in service, only two were highly utilized during the Current Quarter. The remaining spread, which was placed into service in 2012, was idle during the Current Quarter as it was being readied for relocation and to receive up-fitting to enable certain of its TFP’s to utilize field gas as fuel. During the Current Quarter we completed 556 hydraulic fracturing stages with average revenue per stage of $106,258, and our well services equipment completed 477 jobs with average revenue per job of $10,319. During the Prior Quarter one active hydraulic fracturing spread in service completed 14 stages with average revenue per stage of $121,267 and our well services equipment completed 521 jobs with average revenue per job of $8,545. The Current Quarter’s increase in the number of fracturing stages completed is primarily a result of an increase in number and utilization of our hydraulic fracturing spreads in service during the Current Quarter versus the Prior Quarter. The decrease in average revenue per fracturing stage in the Current Quarter as compared to the Prior Quarter resulted primarily from the variations in our customers’ specifications for fracturing their wells. The Current Quarter’s decrease in well services job count and increase in average revenue per job as compared to the Prior quarter is primarily a result of normal variations in the mix of jobs performed.
Costs of Revenue
Costs of revenue increased $53.7 million, or 478.6%, to $64.9 million for the Current Quarter as compared to $11.2 million for the Prior Quarter. This increase was primarily due to an increase in operating activity resulting from the addition of additional hydraulic fracturing spreads during 2012 and increased utilization of our hydraulic fracturing fleet. The most significant increases were in the costs of products (such as sand and chemicals), direct labor, repairs and maintenance, freight, fuel and oil, and lodging. As a percentage of revenue, costs of products (such as sand and chemicals), direct labor, repairs and maintenance, freight, fuel and oil, and lodging represented 51.4%, 13.6%, 9.4%, 8.1%, 1.7% and 2.9%, respectively in the Current Quarter as compared to 44.7%, 39.4%, 31.8%, 16.8%, 8.9% and 5.6%, respectively in the Prior Quarter. The increase in product costs as a percentage of sales is reflective of a drastic increase in fracturing revenues relative to well services revenues in the Current Quarter as compared to the Prior Quarter. In addition, fracturing operations typically require a higher proportion of products to complete a stage for the shale areas in which we service our customers and thus a greater amount of products are used on average to complete a fracturing stage relative to the amount of product used to complete well services jobs. Other than product costs, the remaining costs detailed above decreased as a percentage of revenue in the Current Quarter as compared to the Prior Quarter primarily as a result of improved utilization of the hydraulic fracturing fleet. The net effect of the increase in utilization of the in service hydraulic fracturing fleet was a decrease in our costs as a percentage of revenue to 94.9% for the Current Quarter as compared to 178.6% for the Prior Quarter.
Gross Margin
In March of the Current Quarter certain pricing adjustments became effective with one of our major customers and we continue our ongoing efforts to reduce our costs of operations. In addition, management believes that improved utilization of hydraulic horsepower will occur which should improve our margins for hydraulic fracturing services. We would also expect an improvement in margins in the event our capital expansion plan is restarted as expansion of our fleet of hydraulic fracturing spreads would allow for increased revenues and the leveraging of our operating overhead costs. Our ability to continue to expand our fleet of operating equipment is dependent on our liquidity and capital constraints—see the Liquidity and Capital Resources section below for additional information.
Selling and Administrative Expenses
Selling and administrative expenses increased $1.0 million, or 17.9%, to $6.5 million for the Current Quarter as compared to $5.5 million for the Prior Quarter. This increase was primarily due to an increase in costs associated with the overall growth of our organization and asset base. The most significant increases were in professional fees, travel expenses and wage and benefits costs which increased $0.3 million, $0.3 million and $0.2 million, respectively, for the Current Quarter as compared to the Prior Quarter. As a percentage of revenue, selling and
31
Table of Contents
administrative expenses decreased to 9.5% for the Current Quarter as compared to 87.9% for the Prior Quarter as a result of increased revenues.
Depreciation and Amortization
Depreciation and amortization expense increased $6.8 million, or 219.3%, to $9.9 million for the Current Quarter as compared to $3.1 million for the Prior Quarter. During the Current Quarter the increase in depreciation and amortization expense was primarily due to the increased level of operating assets in service as compared to the Prior Quarter. As a percentage of revenue, depreciation and amortization decreased to 14.4% for the Current Quarter as compared to 49.1% for the Prior Quarter as a result of increased revenues.
Interest Expense
Interest expense increased $7.5 million, or 135.2%, to $13.0 million for the Current Quarter as compared to $5.5 million for the Prior Quarter. The increase included a $0.8 million fair value adjustment related to a revaluation of earn-out payable as compared to a $0.7 million fair value adjustment to the earn-out payable valuation recorded in the Prior Quarter. The fair value adjustments resulted in an increase to interest expense for both the Current Quarter and Prior Quarter.
Excluding the fair value adjustments recorded in both Quarters, interest expense for the Current Quarter would have increased $6.7 million, or 139.6%, to $11.5 million, as compared to $4.8 million for the Prior Quarter. The increase was primarily due to a higher level of outstanding borrowings and the discontinuation of capitalized interest recorded during the Current Quarter as compared to the Prior Quarter. We did not capitalize interest during the Current Quarter as a result of the suspension of our fixed asset construction program during the Current Quarter.
Other Expense
Other expense increased $0.1 million for the Current Quarter as compared to $0.0 million for the Prior Quarter. Other expenses for the Current Quarter relate primarily to a loss on the sale of assets disposed in the Current Quarter.
Income Tax Expense (Benefit)
Income tax benefit decreased $1.7 million to $0.8 million for the Current Quarter as compared to $2.5 million for the Prior Quarter. As a result of our net loss of $16.6 million during the Prior Quarter, we recorded additional federal net operating losses that resulted in a net deferred tax amount at March 31, 2013. As a result of our cumulative losses incurred, we have determined that it is more likely than not that a portion of our net deferred tax amount is not recoverable. Accordingly, we established a full valuation allowance for our net deferred tax amount during the Prior Quarter. In addition, during the Current Quarter, we reduced our estimated state tax expense by $0.8 million based on our expected filing elections.
Net Income (Loss)
As a result of the foregoing factors, net loss increased by $8.6 million, or 51.8%, to $25.2 million for the Current Quarter as compared to a net loss of $16.6 million for Prior Quarter.
32
Table of Contents
Results for the Year Ended December 31, 2012 Compared to Year Ended December 31, 2011
As discussed in “Business—Corporate Reorganization”, our 2011 results represent two distinct accounting periods due to the change in control transaction and the resultant change in accounting basis. For comparative purposes, we have combined in the table below and in the discussion of our results of operations the Predecessor and Successor periods. As a result, the combined results may not agree with the amounts presented in our financial statements due to this basis of presentation.
The following table summarizes the change in our results of operations for the year ended December 31, 2012 when compared to the year ended December 31, 2011:
| PREDECESSOR | SUCCESSOR | COMBINED PREDECESSOR/ SUCCESSOR |
SUCCESSOR | |||||||||||||||||
| FOUR MONTHS ENDED APRIL 30, 2011 |
EIGHT MONTHS ENDED DECEMBER 31, 2011 |
YEAR ENDED DECEMBER 31, 2011 |
YEAR ENDED DECEMBER 31, 2012 |
$ CHANGE | ||||||||||||||||
| Statement of Operations Data: |
||||||||||||||||||||
| Revenue |
$ | 14,446 | $ | 18,625 | $ | 33,071 | $ | 144,783 | $ | 111,712 | ||||||||||
| Operating costs: |
||||||||||||||||||||
| Costs of revenue |
9,815 | 15,601 | 25,416 | 147,113 | 121,697 | |||||||||||||||
| Provision for doubtful accounts |
— | 109 | 109 | 6,304 | 6,195 | |||||||||||||||
| Selling and administrative expenses |
2,002 | 11,545 | 13,547 | 22,286 | 8,739 | |||||||||||||||
| Depreciation and amortization |
1,724 | 9,396 | 11,120 | 21,170 | 10,050 | |||||||||||||||
|
|
|
|
|
|
|
|
|
|
|
|||||||||||
| Total operating costs |
13,541 | 36,651 | 50,192 | 196,873 | 146,681 | |||||||||||||||
|
|
|
|
|
|
|
|
|
|
|
|||||||||||
| Income (loss) from operations |
905 | (18,026 | ) | (17,121 | ) | (52,090 | ) | (34,969 | ) | |||||||||||
| Other income (expense): |
||||||||||||||||||||
| Interest expense |
(364 | ) | (4,522 | ) | (4,886 | ) | (23,864 | ) | (18,978 | ) | ||||||||||
| Other income (expense) |
44 | (1,476 | ) | (1,432 | ) | (278 | ) | 1,154 | ||||||||||||
|
|
|
|
|
|
|
|
|
|
|
|||||||||||
| Net other expense |
(320 | ) | (5,998 | ) | (6,318 | ) | (24,142 | ) | (17,824 | ) | ||||||||||
|
|
|
|
|
|
|
|
|
|
|
|||||||||||
| Income (loss) before income taxes |
585 | (24,024 | ) | (23,439 | ) | (76,233 | ) | (52,794 | ) | |||||||||||
| Income tax expense (benefit) |
63 | 2,530 | 2,593 | (1,637 | ) | (4,230 | ) | |||||||||||||
|
|
|
|
|
|
|
|
|
|
|
|||||||||||
| Net income (loss) |
$ | 522 | $ | (26,554 | ) | $ | (26,032 | ) | $ | (74,596 | ) | $ | (48,564 | ) | ||||||
|
|
|
|
|
|
|
|
|
|
|
|||||||||||
| (in thousands) | ||||||||||||||||||||
Revenue
Revenue increased $111.7 million, or 337.8%, to $144.8 million for the year ended December 31, 2012 as compared to $33.1 million for the year ended December 31, 2011. The increase in revenue was primarily due to an increase in the number of hydraulic fracturing stages performed and an increase in the average revenue per well services job. During the year ended December 31, 2012, three hydraulic fracturing spreads completed 1,152 stages with average revenue per stage of $104,195 and our well services equipment completed 2,496 jobs with average revenue per job of $9,629. During the year ended December 31, 2011, one hydraulic fracturing spread in service completed 45 stages with average revenue per stage of $145,304 and our well services equipment completed 2,888 jobs with average revenue per job of $9,183. The increase in the quantity of hydraulic fracturing
33
Table of Contents
stages performed is primarily a result of the increase in the number of hydraulic fracturing spreads in service for the year ended December 31, 2012 as compared to the prior year. The decrease in average revenue per stage for the year ended December 31, 2012 resulted primarily from the fact that two of the three hydraulic fracturing spreads in service during this year were under long-term contractual agreements, as compared to the year ended December 31, 2011 during which the stages completed were based on spot market pricing existing at that time which was generally higher than our 2012 long-term contracts. For the year ended December 31, 2012 as compared to the year ended December 31, 2011 the decrease in well services job count is primarily a result of a reduced level of activity for pump down services and the increase in average revenue per well services job resulted primarily from variations in the sales mix for jobs performed.
Costs of Revenue
Costs of revenue increased $121.7 million, or 478.8%, to $147.1 million for the year ended December 31, 2012 as compared to $25.4 million for the year ended December 31, 2011. The increase in costs of revenue was primarily due to an overall increase in operating activity and unusually high unit prices for chemicals such as guar. Relative to the average price paid for guar during 2011, average prices paid for guar during 2012 were 143% higher. The most significant increases were in costs of products (such as sand and chemicals), direct labor, repairs and maintenance, freight, fuel and oil, and lodging which represented 45.4%, 16.2%, 14.0%, 8.7%, 5.5% and 3.7% of revenue, respectively for the year ended December 31, 2012 as compared to 12.6%, 20.6%, 13.7%, 1.8%, 8.2% and 2.5% of revenue, respectively for the prior year ended December 31, 2011. These increases in cost result primarily from increased hydraulic fracturing activity during the year ended December 31, 2012 as compared to the prior year. The net effect of the increase in costs of revenue, limited utilization of the hydraulic fracturing spread placed into service in July 2012 along with a limited ability to pass on the increased costs of certain chemical to our customers was that costs as a percentage of revenue increased to 101.6% for the year ended December 31, 2012 compared with 76.9% for the year ended December 31, 2011.
Provision for Doubtful Accounts
Provision for doubtful accounts increased $6.2 million to $6.3 million for the year ended December 31, 2012 as compared to $0.1 million for the year ended December 31, 2011. The increase was primarily due to customer disputes related to charges incurred in providing hydraulic fracturing services performed in 2012. As a result, the provision for doubtful accounts increased as a percentage of revenue to 4.4% for the year ended December 31, 2012 as compared to 0.3% for the year ended December 31, 2011.
Selling and Administrative Expenses
Selling and administrative expenses increased $8.7 million, or 64.5%, to $22.3 million for the year ended December 31, 2012 as compared to $13.5 million for the year ended December 31, 2011. This increase was primarily due to an increase in costs associated with senior management, sales and administrative personnel additions and the overall growth of our organization and asset base during the year ended December 1, 2012. The most significant increases were in wage and benefits costs, travel related costs, and insurance expenses which increased $4.0 million, $1.7 million and $1.2 million, respectively, for the year ended December 31, 2012 as compared to the prior year. Selling and administrative expenses decreased as a percentage of revenue to 15.4% for the year ended December 31, 2012 compared to 41.0% for the year ended December 31, 2011 as a result of growth in our revenues.
Depreciation and Amortization
Depreciation and amortization increased $10.1 million, or 90.4%, to $21.2 million for the year ended December 31, 2012 as compared to $11.1 million for the year ended December 31, 2011. The increase was primarily due to the increase in the level of assets in service throughout the year ended December 31, 2012 as compared to the level of assets in service at the prior year end and was offset partially by a $3.5 million reduction
34
Table of Contents
in amortization expense as compared to the prior year. The $3.5 million reduction to amortization expense relates primarily to loan costs that were fully amortized in the year ended December 31, 2011. As a percentage of revenue, depreciation and amortization decreased to 14.6% for the year ended December 31, 2012 as compared to 33.6% for the year ended December 31, 2011 primarily as a result of the increase in revenues and the relatively fixed nature of depreciation and amortization.
Interest Expense
Interest expense increased $19.0 million, or 388.4%, to $23.9 million for the year ended December 31, 2012 as compared to $4.9 million for the year ended December 31, 2011. The increase included a $2.1 million fair value adjustment related to a revaluation of earn-out payable for the year ended December 31, 2012 which resulted in a decrease to interest expense.
Excluding the fair value adjustments recorded in both years, interest expense for the year ended December 31, 2012 would have increased $21.7 million, or 430.6%, to $26.0 million from $4.3 million for the year ended December 31, 2011. This increase in interest expense was primarily due to an increase in the amount of outstanding borrowings for the year ended December 31, 2012 as compared to the amount of outstanding borrowings at the prior year ended December 31, 2011. We did not experience any increase in interest expense due to a change in interest rates.
During December 2012, we suspended its assembly of further hydraulic fracturing spreads. As a result, in 2013, interest expense recorded by us will reflect higher interest expense as a result of our no longer capitalizing any interest relating to our construction in progress.
Other Income (Expense)
Other expense decreased $1.1 million, or 79.8%, to $0.3 million for the year ended December 31, 2012 as compared to $1.4 million for the year ended December 31, 2011. The decrease was primarily due to a reduced level of borrowing fees expensed during the year ended December 31, 2012 as compared to the year ended December 31, 2011.
Income Tax Expense (Benefit)
Income tax expense decreased $4.2 million, or 163.1%, to an income tax benefit of $1.6 million for the year ended December 31, 2012 as compared to an income tax expense of $2.6 million for the year ended December 31, 2011. As a result of our net loss of $74.6 million for the year ended December 31, 2012, we recorded additional federal net operating losses that resulted in a net deferred tax amount of $28.2 million at December 31, 2012. As a result of our cumulative losses incurred, we have determined that is its more likely than not that a portion of our net deferred tax amount is not recoverable. Accordingly, we established a full valuation allowance for our net deferred tax amount. Included in our income tax expense (benefit) for the years ended December 31, 2011 and 2012 are $0.1 million and $0.8 million of expense relating to state taxes. The increase in state tax expense is primarily attributable to the increase in the number of hydraulic fracturing spreads in service for the year ended December 31, 2012 compared to the year ended December 31, 2011.
Net Income (Loss)
As a result of the foregoing factors, net loss increased by $48.6 million, or 167.8%, to a net loss of $74.6 million for the year ended December 31, 2012 as compared to a $26.0 million net loss for the year ended December 31, 2011.
35
Table of Contents
Results for the Year Ended December 31, 2011 Compared to Year Ended December 31, 2010
| PREDECESSOR | PREDECESSOR | SUCCESSOR | COMBINED PREDECESSOR/ SUCCESSOR |
|||||||||||||||||
| YEAR ENDED DECEMBER 31, 2010 |
PERIOD FROM JANUARY 1 TO APRIL 30, 2011 |
PERIOD FROM MAY 1 TO DECEMBER 31, 2011 |
YEAR ENDED DECEMBER 31, 2011 |
$ CHANGE | ||||||||||||||||
| Statement of Operations Data: |
||||||||||||||||||||
| Revenue |
$ | 28,362 | $ | 14,446 | $ | 18,625 | $ | 33,071 | $ | 4,709 | ||||||||||
| Operating costs: |
||||||||||||||||||||
| Costs of revenue |
16,615 | 9,815 | 15,601 | 25,416 | 8,801 | |||||||||||||||
| Provision for doubtful accounts |
201 | — | 109 | 109 | (92 | ) | ||||||||||||||
| Selling and administrative expenses |
3,831 | 2,002 | 11,545 | 13,547 | 9,716 | |||||||||||||||
| Depreciation and amortization |
4,602 | 1,724 | 9,396 | 11,120 | 6,518 | |||||||||||||||
|
|
|
|
|
|
|
|
|
|
|
|||||||||||
| Total operating costs |
25,249 | 13,541 | 36,651 | 50,192 | 24,943 | |||||||||||||||
|
|
|
|
|
|
|
|
|
|
|
|||||||||||
| Income (loss) from operations |
3,113 | 905 | (18,026 | ) | (17,121 | ) | (20,234 | ) | ||||||||||||
| Other income (expense): |
||||||||||||||||||||
| Interest expense |
(1,034 | ) | (364 | ) | (4,522 | ) | (4,886 | ) | (3,852 | ) | ||||||||||
| Other income (expense) |
(468 | ) | 44 | (1,476 | ) | (1,432 | ) | (964 | ) | |||||||||||
|
|
|
|
|
|
|
|
|
|
|
|||||||||||
| Net other expense |
(1,502 | ) | (320 | ) | (5,998 | ) | (6,318 | ) | (4,816 | ) | ||||||||||
|
|
|
|
|
|
|
|
|
|
|
|||||||||||
| Income (loss) before income taxes |
1,611 | 585 | (24,024 | ) | (23,439 | ) | (25,050 | ) | ||||||||||||
| Income tax expense (benefit) |
78 | 63 | 2,530 | 2,593 | 2,515 | |||||||||||||||
|
|
|
|
|
|
|
|
|
|
|
|||||||||||
| Net income (loss) |
$ | 1,533 | $ | 522 | $ | (26,554 | ) | $ | (26,032 | ) | $ | (27,565 | ) | |||||||
|
|
|
|
|
|
|
|
|
|
|
|||||||||||
| (in thousands) |
Revenue
Revenue increased $4.7 million, or 16.6%, to $33.1 million for the year ended December 31, 2011 as compared to $28.4 million for the year ended December 31, 2010. The increase in revenue was primarily due to an increase in average revenue per fracturing stage and per well services job as well as an increase in hydraulic fracturing activity. During the year ended December 31, 2011, one hydraulic fracturing spread in service completed 45 stages with average revenue per stage of $145,304 and our well services equipment completed 2,888 jobs with average revenue per job of $9,183. During the prior year ended December 31, 2010 our hydraulic fracturing equipment completed 24 stages with average revenue per stage of $72,936 and our well services equipment completed 3,262 jobs with average revenue per job of $8,157.
Costs of Revenue
Costs of revenue increased $8.8 million, or 53.0%, to $25.4 million for the year ended December 31, 2011 as compared to $16.6 million for the year ended December 31, 2010. The primary increase in costs of revenue was due to an overall increase in operating activity. The most significant increases were in direct labor, costs of products (such as sand and chemicals), repairs and maintenance, fuel and oil, and indirect labor costs which represented 27.6%, 50.4%, 13.0%, 10.3% and 8.0% of revenue, respectively for the year ended December 31, 2011 as compared to 25.5%, 35.1%, 9.3%, 7.4% and 7.3% of revenue, respectively for the prior year ended December 31, 2010. As a result of the foregoing and an under-utilization of our operating equipment in service, costs as a percentage of revenue increased to 76.9% for the year ended December 31, 2011 compared with 58.6% for the year ended December 31, 2010.
Provision for Doubtful Accounts
Provision for doubtful accounts decreased $0.1 million, or 45.8%, to $0.1 million for the year ended December 31, 2011 as compared to $0.2 million for the year ended December 31, 2010. The decrease was
36
Table of Contents
primarily due to insignificant changes to our provision for doubtful accounts. As a result, the provision for doubtful accounts decreased as a percentage of revenue to 0.3% for the year ended December 31, 2011 as compared to 0.7% for the year ended December 31, 2010.
Selling and Administrative Expenses
Selling and administrative expenses increased $9.7 million, or 253.6%, to $13.5 million for the year ended December 31, 2011 as compared to $3.8 million for the year ended December 31, 2010. This increase was primarily due to increases in personnel costs and travel related costs along with significant professional fees all resulting from the growth of our business operations. As a result, selling and administrative expenses increased as a percentage of revenue to 41.0% for the year ended December 31, 2011 compared to 13.5% for the year ended December 31, 2010.
Depreciation and Amortization
Depreciation and amortization increased $6.5 million, or 141.6%, to $11.1 million for the year ended December 31, 2011 as compared to $4.6 million for the year ended December 31, 2010. The increase was primarily due to the effect of a full year of depreciation incurred during the year ended December 31, 2011 for the first spread of fracturing equipment which entered service during the fourth quarter of the year ended December 31, 2010. As a percentage of revenue, depreciation and amortization increased to 33.6% in 2011 from 16.2% in 2010 as a result of less than full utilization of the first spread of fracturing equipment during 2011 and the relatively fixed nature of depreciation and amortization.
Interest Expense
Interest expense increased $3.9 million, or 372.5%, to $4.9 million for the year ended December 31, 2011 as compared to $1.0 million for the year ended December 31, 2010. The increase included a $0.6 million fair value adjustment related to a revaluation of earn-out payable for the year ended December 31, 2011 which resulted in an increase to interest expense.
Excluding the fair value adjustment, interest expense for the year ended December 31, 2011 would have increased $3.3 million, or 330.0%, to $4.3 million. This increase was primarily due to an increase in the amount of outstanding borrowings for the year ended December 31, 2011 as compared to the amount of outstanding borrowings at the prior year end. We did not experience any increase in interest expense due to a change in interest rates.
Other Income (Expense)
Other expense increased $1.0 million, or 206.0%, to $1.4 million for the year ended December 31, 2011 as compared to $0.5 million for the year ended December 31, 2010. The increase was primarily due to lender’s facility fees of $1.5 million at December 31, 2011 as compared to $0.5 million at December 31, 2010.
Income Tax Expense (Benefit)
Income tax expense increased $2.5 million for the year ended December 31, 2011 as compared to $0.1 million for the year ended December 31, 2010. The increase in taxes primarily to the recording of a $2.5 million deferred tax liability during 2011.
Net Income (Loss)
As a result of the foregoing factors, net income decreased by $27.6 million, or 1,798.1%, to a net loss of $26.0 million for the year ended December 31, 2011 as compared to net income of $1.5 million for the year ended December 31, 2010.
37
Table of Contents
Liquidity and Capital Resources
Our historical sources of liquidity have been capital contributions and borrowings from our equity holders, the proceeds from the private offering of the Notes and other indebtedness and cash generated from our business prior to 2012. Our primary uses of capital have been the acquisition of equipment, debt service, and cash used by operations as we have expanded our business. Primarily as a result of under-utilization of our hydraulic fracturing spread placed into service during the third quarter of 2012, an escalation in the price of certain chemicals we use in the delivery of our services and market factors, the Company experienced negative cash flows from operations throughout 2012.
Sources of cash to cover the negative cash flow from operations and the expansion of our fleet of operating equipment were secured as a result of our entering into a supplemental indenture dated October 24, 2012. The supplemental indenture permitted the funding of the remaining $70 million under the Shell agreement, allowed us to secure an additional $30 million line of credit secured by receivables and inventory and requires up to an additional $13 million of preferred stock to be issued in addition to the $12 million that has been issued previously.
We entered into an agreement, effective September 2, 2011, with Shell to provide Shell with the exclusive right to use a minimum of two high pressure hydraulic fracturing units, with additional units to be made available at Shell’s option. If a termination for cause event occurs, Shell may terminate the agreement and we must pay Shell $10 million in liquidated damages within 90-days after the date such termination is effective. A termination for cause event includes, but is not limited to, (i) failure to deliver the first or second hydraulic fracturing unit on or before its scheduled delivery date, plus, in each case, a 60-day cure period, (ii) failure to achieve certain performance targets or (iii) failure to achieve certain start-up milestones. Shell may also terminate upon a change of control. A change of control occurs upon our consolidation or merger, a sale, lease, exchange or other transfer of substantially all our assets, or a combination in which our shareholders immediately before such combination do not hold, directly or indirectly, more than 50% of the voting securities of the combined company, except that no change of control shall have occurred if Michel B. Moreno remains Chairman of the Company and certain other conditions are met. Following a change of control termination, we must pay Shell $100 million in liquidated damages. Should we be required to pay Shell liquidated damages under a termination for cause event or a change of control, such costs will have a negative impact on our liquidity and capital resources. See “Business—Shell Agreement.”
In April 2012 we entered into an amendment to the Shell agreement to add a senior credit facility and amend the provisions of the security agreement contained in the Shell agreement. The amendment commits Shell to provide advances to the Company in four tranches. In October 2012, the Company entered into a Second Amendment to the Shell agreement pursuant to which Shell agreed to provide up to an aggregate $95.0 million of senior secured term loans, which loans may not be reborrowed once repaid. This credit facility, which we refer to as the “Shell Credit Facility”, is secured by a first priority lien on all of the Company’s motor vehicles and equipment. In connection with the Shell Credit Facility, an affiliate of Shell and the trustee under the indenture governing the Company’s Notes entered into an amended and restated intercreditor agreement setting forth the relative priority and interests with respect to the Company’s motor vehicles and equipment as between Shell and the trustee, on behalf of the Note holders. Repayments, which will total 25 monthly installments and commenced November 15, 2012, are to be $2.0 million per month through October 2013, $4.0 million per month for the next six months, $7.5 million per month for the next six months and one payment of $1.0 million in the final month. As of March 31, 2012, we had approximately $84.0 million outstanding under the Shell Credit Facility.
Effective October 28, 2011, we have made arrangements to acquire 300,000 tons of northern white sand per year for four years from Great Northern Sand LLC (“GNS”) for our own use in our hydraulic fracturing operations and for sales to customers. During this period we pay GNS a monthly fee per ton of sand delivered. To the extent we fail to purchase our contracted amount in any given year, we will pay GNS liquidated damages calculated based on a dollar amount per ton we did not order for that year. Our obligation to purchase a contracted amount annually could have an adverse impact on our liquidity. See “Business—Sand Purchase Agreement.”
38
Table of Contents
Our agreement with Alliance requires us to pay a fixed rate for sand processing services until certain tonnage or time measures are met, regardless of prevailing market rates for such services or market prices for our sand. If market prices for our sand decline, our liquidity could be negatively impacted by lower margins due to the fixed rate we pay for sand processing services. In addition, we are wholly dependent on Alliance for sand processing services. If Alliance refuses to provide sand processing services to us, our liquidity could be negatively impacted. This agreement with Alliance is in the process of being assumed by SSS.
In February 2013, we entered into a new agreement to purchase chemicals from Chemrock Technologies, LLC, a chemical company, in which MMR, one of our stockholders, had a 50% ownership interest. The contract calls for market pricing and may result in payments that could exceed $40.0 million dollars over eighteen months. The agreement requires a prepayment of $3.9 million to Chemrock which will be applied against future purchases. As of March 31, 2013, $1.0 million of the required prepayment amount has been paid. We may also purchase chemicals from unrelated vendors, however we have agreed to purchase at least $40.0 million dollars worth of product over the term of the agreement, or pay a penalty equal to the average lost profit to Chemrock for the amount not purchased. Our obligation to purchase a contracted amount over the term of this agreement could have an adverse impact on our liquidity.
Ongoing and increased exploration and production of unconventional oil and natural gas fields has led to increased demand for hydraulic fracturing services. Two technologies—horizontal drilling and hydraulic fracturing—are critical to recovering oil and natural gas from unconventional resource formations. Because of the correlation between horizontal drilling and the need for hydraulic fracturing, pumping, coiled tubing and other related services, we view the horizontal rig count as one indicator of the overall demand for our services. According to Baker Hughes, the horizontal rig count has increased from 108 in 2004 to 1,136 as of February 1, 2013. In addition to an increase in rig count, the percentage of active drilling rigs used to drill horizontal wells, has increased from 17.3% in 2006 to 57.4% in 2011. While the aggregate rig count has exhibited growth, the number of rigs drilling for natural gas has recently declined to its lowest level in 13 years as a result of low natural gas prices, while the number of rigs drilling for oil has more than offset this decline as a result of relatively high prices for oil. To the extent that the recent fluctuations in global crude oil prices develop into a prolonged decline, this drop could result in a reduction in the growth rate of active oil rigs and a decline in the number of active oil rigs from current levels. Should oil and gas prices continue to exhibit instability and should demand for both commodities to decline simultaneously, we may experience a negative impact on our liquidity and capital resources.
Our ability to satisfy debt service obligations and to secure required capital will depend upon our ability to implement our financial plan as discussed in Note 2 of the 2012 consolidated financial statements. We expect the required capital to be provided through a combination of (i) a short term credit facility, (ii) additional equity raised, (iii) cost reduction and revenue improvement initiatives, (iv) extending services into the manufacturing and sale of our turbine driven units, and (v) securing amendments to our primary debt facility. If we are unable to generate sufficient cash flows or to obtain additional capital on favorable terms or at all, we may be unable to finance further growth and operations. We expect that operations will begin to generate cash as a result of improved pricing, improvements in the spot market prices for hydraulic fracturing services and improvement in the utilization of our hydraulic fracturing services equipment during 2013. In addition, we see increased demand for our services and hydraulic fracturing fleet fueled by natural gas and believe we are well positioned to finance our required working capital and capital expenditures to serve that demand. However, spot prices are subject to change based on changes in market factors.
39
Table of Contents
Capital Expenditures
We have made capital expenditures of approximately $10.0 million for the three month period ending March 31, 2013.
The oil and natural gas hydraulic fracturing and well services business is capital-intensive, requiring significant investment to expand, upgrade and maintain equipment. Our capital requirements consist primarily of:
| • | growth capital expenditures through 2013, such as those to acquire equipment and other assets to grow our business; and |
| • | maintenance capital expenditures, which are capital expenditures made to extend the useful life of partially or fully depreciated assets. |
Our capital budget may be adjusted as business conditions warrant. However, if oil and natural gas prices decline significantly, we could defer a significant portion of our non-contracted budgeted capital expenditures until later periods to prioritize capital projects that we believe have the highest expected returns and potential to generate near term cash flows. We routinely monitor and adjust our capital expenditures in response to our projected needs for new equipment while seeking to maintain our targeted liquidity.
Additionally, we will continually monitor service offerings and technologies that may complement our businesses and opportunities to acquire additional equipment to meet our customers’ needs. We actively review acquisition opportunities on an ongoing basis. Our ability to make significant acquisitions for cash would likely depend on our ability to obtain additional equity or debt financing, which we may not be able to obtain on terms acceptable to us or at all.
Financial Condition and Cash Flows
The following table summarizes the change in our statement of cash flows for the three months ended March 31, 2013 when compared to the three months ended March 31, 2012 (the “Current Period” and “Prior Period”, respectively):
| THREE MONTHS ENDED MARCH 31, 2012 |
THREE MONTHS ENDED MARCH 31, 2013 |
|||||||
| STATEMENT OF CASH FLOWS |
||||||||
| Cash flows provided by (used in): |
||||||||
| Operating activities |
$ | (27,890 | ) | $ | 9,932 | |||
| Investing activities |
(44,079 | ) | (7,270 | ) | ||||
| Financing activities |
2,694 | (5,560 | ) | |||||
|
|
|
|
|
|||||
| Change in cash and cash equivalents |
$ | (69,276 | ) | $ | (2,898 | ) | ||
|
|
|
|
|
|||||
| (thousands | ) | |||||||
Net Cash Flows (Used in) Provided by Operating Activities
Net cash provided by operating activities increased $37.8 million, to $9.9 million, for the Current Period compared to net cash used in operating activities of $27.9 million for the Prior Period. This increase in net cash flows are primarily due to a $14.5 million increase in accounts payable and accrued expenses and a $21.0 decline in inventory purchases between periods. This was partially offset by a decrease in net loss, net of non-cash items, of $0.1 million for the Current Period.
40
Table of Contents
Net Cash Flows Used in Investing Activities
Net cash used in investing activities decreased $36.8 million, to $7.3 million, for the Current Period compared to $44.1 million for the Prior Period. This decrease was primarily due to a $34.3 million decrease in purchases of property and equipment and a $2.5 million increase in proceeds from the sale of property. For the Current Period, net cash used in investing activities consisted primarily of purchases of property, plant and equipment of $10.0 million and was partially offset by $2.7 million of net cash provided by proceeds from the sale of our Weatherford, Texas district office in the Current Period. Equipment expenditures generally include various vehicles, auxiliary equipment, components needed for the manufacture and assembly of turbine-powered hydraulic fracturing equipment and well services equipment. Refer to the Liquidity and Capital Resources section for discussion of our plans regarding future investing activities.
Net Cash Flows Provided by (Used in) Financing Activities
Net cash used in financing activities increased $8.2 million, to $5.6 million of net cash used in financing activities for the Current Period compared to $2.7 million of net cash provided by financing activities for the Prior Period. The decrease was primarily due to a $7.1 million increase in debt repayments, a $2.9 million decrease in borrowings and a $1.6 million increase in proceeds from the issuance of preferred stock. For the Current Period net cash provided by financing activities consisted primarily of a $1.6 million in proceeds from the sale of preferred stock and $0.1 million in proceeds from the issuance of debt. Net cash used by financing activities consisted primarily of net repayments of debt of $7.1 million.
As discussed above, our 2011 results represent two distinct accounting periods due to the change in control transaction and the resultant change in accounting basis. For comparative purposes, we have combined in the table below and in the discussion of our financial conditions and cash flows the Predecessor and Successor periods. As a result, the combined results may not agree with the amounts presented in our financial statements due to this basis of presentation.
The following table sets forth historical cash flows information for each of the years ended December 31, 2012, 2011 and 2010:
| PREDECESSOR | PREDECESSOR | SUCCESSOR | COMBINED PREDECESSOR/ SUCCESSOR |
|
||||||||||||||||||
| YEAR ENDED DECEMBER 31, 2010 |
PERIOD FROM JANUARY 1, TO APRIL 30, 2011 |
PERIOD FROM MAY 1 TO DECEMBER 31, 2011 |
YEAR ENDED DECEMBER 31, 2011 |
YEAR ENDED DECEMBER 31, 2012 |
||||||||||||||||||
| STATEMENT OF CASH FLOWS |
||||||||||||||||||||||
| Cash flows provided by (used in): |
||||||||||||||||||||||
| Operating activities |
$ | 3,085 | $ | 2,054 | $ | (39 | ) | $ | 2,015 | $ | (81,527 | ) | ||||||||||
| Investing activities |
(2,421 | ) | (256 | ) | (120,333 | ) | (120,589 | ) | (98,100 | ) | ||||||||||||
| Financing activities |
(46 | ) | (1,006 | ) | 205,860 | 204,854 | 100,942 | |||||||||||||||
|
|
|
|
|
|
|
|
|
|
|
|||||||||||||
| Change in cash and cash equivalents |
$ | 618 | $ | 792 | $ | 85,488 | $ | 86,280 | $ | (78,685 | ) | |||||||||||
|
|
|
|
|
|
|
|
|
|
|
|||||||||||||
(in thousands)
41
Table of Contents
Net Cash Flows Provided by (Used in) Operating Activities
Net cash used by operating activities increased $83.5 million, to $81.5 million for the year ended December 31, 2012 compared to $2.0 million net cash provided by operating activities for the year ended December 31, 2011. The decrease in net cash flows provided primarily reflect an increase in net loss, net of non-cash items, of $35.3 million, and $56.2 million of net cash used to support increased levels of working assets such as accounts receivable, inventory and prepaid expenses for the year ended December 31, 2012. These amounts were partially offset by $7.9 million of net cash provided by operating activities for the year ended December 31, 2012 resulting primarily from an increase in accounts payable.
Net cash provided by operating activities decreased $1.1 million, to $2.0 million for the year ended December 31, 2011 compared to $3.1 million for the year ended December 31, 2010. The decrease in net cash flows primarily reflects an increase in net loss, net of non-cash items, of $18.1 million which was partially offset by $17.0 million of net cash provided by operating activities resulting primarily from decreased levels of accounts receivable and other receivables and increased levels of accounts payable for the year ended December 31, 2011.
Net Cash Flows Provided by (Used in) Investing Activities
Net cash used in investing activities decreased $22.5 million, to $98.1 million, for the year ended December 31, 2012 compared to $120.6 million for the year ended December 31, 2011. This decrease was primarily due to a $21.4 million decrease in purchases of property and equipment. During the year ended December 31, 2012, net cash used in investing activities consisted primarily of purchases of property, plant and equipment of $98.5 million related to the capital expenditure plan in progress and was partially offset by $0.4 million of net cash provided by proceeds from the sale of property. Equipment expenditures generally include various vehicles, auxiliary equipment, components needed for the manufacture and assembly of turbine-powered hydraulic fracturing equipment and well services equipment.
Net cash used in investing activities increased $118.2 million, to $120.6 million, for the year ended December 31, 2011 compared to $2.4 million for the year ended December 31, 2010. This increase was primarily due to $120.0 million in purchases of property, plant and equipment related to hydraulic fracturing and well service equipment additions. Expenditures included the construction of a new district office in Weatherford, Texas and various support equipment and components needed to grow our fleet of hydraulic fracturing and well service equipment.
Net Cash Flows Provided by (Used in) Financing Activities
Net cash provided by financing activities decreased $103.9 million, to $101.0 million, for the year ended December 31, 2012 compared to $204.9 million for the year ended December 31, 2011. The decrease was primarily due to $241.6 million of net cash provided by proceeds from the issuance of senior notes during the year ended December 31, 2011. Net cash provided by financing activities during the year ended December 31, 2012 consisted primarily of $100.0 million of net proceeds from advances by Shell under the revolver agreement, $10.0 million from the sale of preferred stock, $1.9 million of net proceeds from Ford Motor Credit and $2.5 million in financed insurance premiums. Net cash used by financing activities during the year ended December 31, 2012 consisted primarily of net principal repayments of $12.9 million of which $10.0 million was repayment to Shell on the revolving credit facility and $0.7 million used to pay financing fees.
Net cash provided by financing activities increased $204.9 million to $204.9 million, for the year ended December 31, 2011 compared to $0.0 million for the year ended December 31, 2010. The increase was primarily due to net cash provided by financing activities relating to the senior notes transaction that closed in November 2011 which provided $241.6 million in net cash proceeds from the issuance of 250,000 units at a price of $990 per unit with each unit consisting of $1,000 principal amount of 13% senior secured notes due 2016 and one warrant to purchase .988235 shares of the Company’s common stock. Shareholders also provided $1.2 million in capital contributions. This was partially offset by net cash used in financing activities consisting primarily of net repayments of $29.6 million under our prior senior secured facilities, $14.0 million in debt issuance costs, and $0.2 million to repay owners and affiliates.
Off-Balance Sheet Arrangements
We do not have any off-balance sheet arrangements.
42
Table of Contents
Company Overview
Formed in 1969, we are an independent oilfield services company that provides a wide range of pressure pumping related services to oil and natural gas drilling and production companies to help develop and enhance the production of hydrocarbons. Our traditional oilfield pumping services included cementing, coiled tubing, pressure pumping, acidizing, and other pumping services. We also produce our own TFPs. In December 2010, we began providing hydraulic fracturing pumping services as a part of our portfolio of services provided to our customers using our own internally produced turbine-powered hydraulic fracturing units. To support our hydraulic fracturing operations, we have also entered into two long-term leases during 2011 for sand mines in Louisiana and Mississippi. These mines are expected to supply a portion of our fracturing sand needs and provide us with the opportunity to sell fracturing sand to third parties. Our hydraulic fracturing operations utilize turbine-powered hydraulic fracturing pumping equipment that we believe provides several advantages over the diesel-powered pumping equipment generally utilized in the industry. These advantages include lower emissions, a smaller operating footprint, lower operating costs and greater fuel flexibility, including the ability to operate on natural gas.
Each of our turbine-powered hydraulic fracturing units consists primarily of a TFP and various hoses, valves, tanks and other supporting equipment that are typically mounted to a flat-bed trailer. The group of hydraulic fracturing units, other equipment and vehicles necessary to perform a typical fracturing job is referred to as a hydraulic fracturing “spread” and we refer to all of our spreads together as our hydraulic fracturing “fleet.”
As of May 20, 2013, we had approximately 159,750 HP of high pressure pumping capacity in our fleet, of which 150,750 HP was turbine powered. During December 2012 we placed into service the first of six planned new coiled tubing units. A second new coiled tubing unit and two new cementing units were also placed into service in April and May of 2013. We do not anticipate adding more horsepower without additional firm customer commitments in the future and we may also consider reconfiguring or selling some portion of the earlier assembled units in the fleet based on customer commitments and our evaluation of the market over the near term.
Our current well services customers include Shell, Anadarko Petroleum Corporation, Apache Corporation, Encana Corporation, EOG Resources, Inc. and Denbury Resources Inc. We have entered into MSAs to provide our services to approximately 90 oil and natural gas companies.
In 2011 we entered into a two-year agreement with Shell to provide hydraulic fracturing services. We began providing hydraulic fracturing services to Shell under this agreement in January 2012. Shell has dedicated resources, including technical staff, to work with us to ensure timely completion of hydraulic fracturing equipment that satisfies its technical and safety standards. Please see the section titled “Business—Shell Agreement.”
Corporate Reorganization
Conversion
The Company was formerly a Louisiana limited liability company under the name Hub City Industries, L.L.C. In September 2011, we changed our name to Green Field Energy Services, LLC, and in October 2011, we converted into a Delaware corporation.
Equity Redemptions and Repurchases
In May 2011, we entered into agreements with certain of our members to repurchase all of their equity interests in us for cash. These redemption agreements required upfront payments to be made to certain parties as well as
43
Table of Contents
earnout payments to be made to all parties over time based on the gross revenues of our hydraulic fracturing services. As of September 30, 2011, payment of the repurchase obligations with respect to the equity interests of two members, Moody Moreno & Rucks, L.L.C. (“MMR”) and Egle Ventures, L.L.C. (“Egle”), remained outstanding and were classified as debt on our balance sheet as of that date. On October 13, 2011, the Company and MMR, an entity in which our Chief Executive Officer indirectly holds a 40% ownership interest, agreed to rescind the redemption agreement applicable to the equity interests previously held by MMR, thereby eliminating the approximate associated $27.9 million debt obligation reflected on the Company’s balance sheet. On October 14, 2011, the Company paid $0.7 million of its outstanding obligation to Egle and MOR MGH Holdings, L.L.C. (“MMH”) assumed the remainder of that obligation, in the amount of $3.0 million, thereby eliminating the associated approximate $3.7 million debt obligation reflected on the Company’s balance sheet. Egle is owned by our prior chief executive officer, John Eglé. Please see the section titled “Certain Relationships and Related Person Transactions.” Following these redemptions and repurchases, as of October 17, 2011, MMH owned, on a undiluted basis, 88.9% of our common stock and MMR owned, on an undiluted basis, the remaining 11.1%. This series of transactions resulted in a change of control of the Company in May 2011 which requires a new basis of accounting be established as of the date of the change in control. Due to this, the consolidated financial statements and certain disclosures are presented in distinct periods to indicate the application of the two bases of accounting. The term “Predecessor” refers to the Company prior to the change in control and the term “Successor” refers to the Company following the change in control.
Stock Split
In November 2011 we amended our certificate of incorporation to, among other things, effect a stock split on a 1,400 for 1 basis. The stock split was effected simultaneously for all our then-issued and outstanding common stock and the exchange ratio was the same for each share of issued and outstanding common stock. The stock split affected all of our stockholders uniformly and did not affect any stockholder’s percentage ownership interest in us. Shares of common stock issued pursuant to the stock split are fully paid and nonassessable.
Our Service Lines
We currently conduct our operations through the following service lines:
Hydraulic Fracturing Services
Our customers utilize our hydraulic fracturing services to enhance the production of oil and natural gas from formations with restricted natural flow of hydrocarbons. The fracturing process consists of pumping a fluid into a perforated well casing or tubing at a sufficient pressure and rate to cause the underground formation to crack, allowing the oil or natural gas to flow more freely. Sand, bauxite, resin-coated sand or ceramic particles, each referred to as a proppant or propping agent, are suspended in the fracturing fluid and prop open the cracks created by the hydraulic fracturing process in the underground formation. The extremely high pressure required to stimulate wells in many of the regions in which we operate presents a challenging environment for achieving a successfully fractured horizontal well. As a result, an important element of the services we provide to oil and natural gas producers is designing the optimum well completion, which includes determining the proper fluid, proppant and injection specifications to maximize production. Our contracted engineering staff also provides technical evaluation, job design and fluid recommendations to our customers as an integral element of our hydraulic fracturing service.
Our TFPs are powered by remanufactured turbine engines previously used in U.S. military applications. These turbine engines have a reputation for reliability and durability. We believe our TFPs are more cost effective to operate and maintain than conventional diesel-powered equipment. Prior field tests regarding operation of our current TFPs have demonstrated compliance with respect to emissions of nitrogen oxides (“NOx”) and carbon monoxide under the United States Environmental Protection Agency (“EPA”) Clean Air Nonroad Diesel Tier 4 (“Tier 4”) standards that regulate emissions from certain off-road diesel engines. Further emission controls may
44
Table of Contents
be required with respect to other emissions regulated by Tier 4 standards, including particulate matter. We conducted further Tier 4 emissions testing in the second quarter of 2012 on certain of our new TFPs.
The following table compares our current turbine-powered pressure pumping equipment against conventional diesel-powered pressure pumping equipment.
| TURBINE-POWERED |
CONVENTIONAL DIESEL- POWERED | |||
| Multi-Fuel Capability |
Natural gas, diesel or biofuel | Diesel or biofuel | ||
| Emissions (using diesel) |
Lower than typical diesel emissions: Have met Tier 4 standards for NOx and carbon monoxide | Requires catalytic converter to meet Tier 4 standards (reduces HP, additional cost) | ||
| HP per trailer |
4,500 HP (2 pumps) | 2,250 HP (1 pump) | ||
| Major Engine Repair |
Generally onsite repair or exchange | Generally requires trip to repair shop |
We intend to provide hydraulic fracturing and other services to our customers through long-term agreements, such as our agreement with Shell, agreements providing minimum monthly service fees and spot market agreements.
Sand Reserves
Raw fracturing sand is an essential element of the proppant used in the hydraulic fracturing process. In 2011 we entered into a long-term lease arrangement for two open-pit sand mines, referred to as “wet pit” mines, in Mississippi and Louisiana to secure access to sand for use in our hydraulic fracturing operations as well as to market and sell to other providers of hydraulic fracturing services. The lease expires on September 30, 2041. The base cost for the lease of the Mississippi mine and the Louisiana mine over the lease term is approximately $1.5 million and $2.0 million, respectively. Additionally, we pay royalty fees per ton that vary based on the type of sand, gravel, or clay and other earthen materials extracted. The lease also contains options to purchase the mines in various segments. All of such options expire within the first three years of the lease period. Our mine in Louisiana is referred to as the “Hickory Mine,” and our mine in Mississippi is referred to as the “Nicholson Mine.” As of April 26, 2013, we had a total of 11.0 million tons of proven recoverable mineral reserves at our Nicholson mine and 7.0 million tons of proven recoverable mineral reserves at our Hickory mine.
Prior to our lease, the mines had been operated by other operators that primarily extracted aggregate used for construction materials. Since acquiring the lease we have entered into an agreement with Alliance, an affiliate and the designated operator of the mines, to build and operate a wet and dry processing plant and to perform the dredging of our mines and the processing and transportation of the materials from our mines. Under that agreement Alliance has begun to renovate and upgrade the production capabilities of the Hickory Mine to enable it to produce multiple products through various wet processing methods, including suction dredging, washing and screening. The Company’s agreement with Alliance is in the process of being assumed by SSS . We plan to similarly develop the Nicholson Mine in the future. Once the dredged and processed material on site, certain types of sand and aggregate will be marketed to other consumers. The operator will transport our fracturing sand from our site to a dry processing facility for further processing. We will use this further processed sand to support a portion of our own fracturing sand needs as well as the demand from other consumers of fracturing sand.
We created a wholly owned subsidiary, Proppant One, Inc., to market the sand from these mines. We believe our sand operations will provide a reliable source of raw fracturing sand. We have also made arrangements to acquire 300,000 tons of sand annually for four years to partially meet our hydraulic fracturing service obligations pursuant to the Shell agreement and other future arrangements. See the section titled “Business—Sand Purchase Agreement.”
45
Table of Contents
We believe that our mines provide us with a large and useful quality of sand reserves. “Reserves” are defined by SEC Industry Guide 7 as that part of a mineral deposit that could be economically and legally extracted or produced at the time of the reserve determination. Industry Guide 7 divides reserves between “proven (measured) reserves” and “probable (indicated) reserves” which are defined as follows:
| • | Proven (measured) reserves. Reserves for which (a) quantity is computed from dimensions revealed in outcrops, trenches, workings or drill holes; grade and/or quality are computed from the results of detailed sampling and (b) the sites for inspection, sampling and measurement are spaced so closely and the geologic character is so well defined that size, shape, depth and mineral content of reserves are well-established. |
| • | Probable (indicated) reserves. Reserves for which quantity and grade and/or quality are computed from information similar to that used for proven (measured) reserves, but the sites for inspection, sampling, and measurement are farther apart or are otherwise less adequately spaced. The degree of assurance, although lower than that for proven (measured) reserves, is high enough to assume continuity between points of observation. |
We categorize our reserves as proven in accordance with these SEC definitions. We estimate that we had a total of approximately 18.0 million tons of proven recoverable mineral reserves as of April 26, 2013. The quantity and nature of the mineral reserves at each of our properties are estimated first by third-party geologist and mining engineering firm Westward Environmental, Inc., (“Westward”) who prepared an estimate of our proven mineral reserves at our Hickory and Nicholson facilities, and we internally track the depletion rate on an interim basis.
To opine as to the economic viability of our reserves, Westward considered the ratio over overburden to minable material, also known as the stripping ratio; the percent of the reserve which can be recovered and sold as a commercial product; and the presence of a market demand for the product. Based on its review of those factors and its extensive experience with similar operations, and taking into account possible cost increases associated with a maturing mine, Westward concluded that our mines contained a total of 18.0 million tons of proven fracturing sand reserves. The cutoff grade used by Westward in estimating our reserves considers only sand that will pass through a #20 mesh and are retained on a #70 mesh screen as proven reserves, meaning only sands with mesh sizes between #20 and #70 are included in Westward’s estimate of our proven reserves.
Fracturing Sand Production Facilities
The following table provides information regarding our existing fracturing sand production facilities as of April 26, 2013.
| Mine/Plant Location |
Proven Reserves(1) |
Probable Reserves(1) |
Primary Reserve Composition |
Lease Expiration Date(2) |
Mine Area(3) |
|||||||||||||||
| (millions) | (millions) | (acres) | ||||||||||||||||||
| Hickory |
7.0 | 16.2 | 14–60 mesh | September 30, 2041 | 133 | |||||||||||||||
| Nicholson |
11.0 | 2.1 | 50–15 mesh | September 30, 2041 | 185 | |||||||||||||||
| (1) | Reserves are estimated as of April 26, 2013 by third-party independent engineering firms based on core drilling results and in accordance with the SEC’s definitions of proven reserves. |
| (2) | Our leases are subject to a limited option to purchase at the end of the lease term. |
| (3) | Reserves estimate for Nicholson are based on current MDEQ permitted acres; total acres leased total 406 and may be also be minable although not currently permitted. |
46
Table of Contents
Hickory Mine
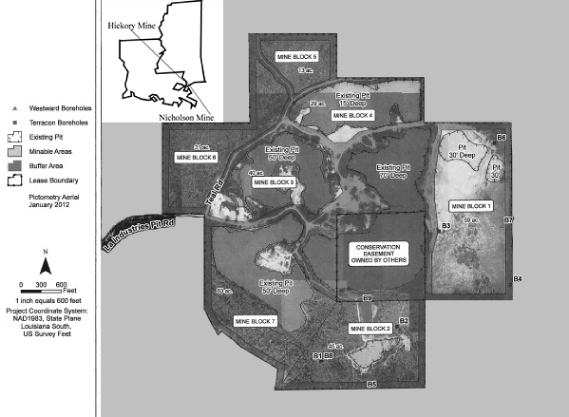
In response to our own needs and customer demand for fracturing sand for use in hydraulic fracturing operations, we leased a sand mining facility in Pearl River, Louisiana known as the Hickory Pit in October 2011, and have not yet commenced operations. We lease the surface mining rights to a 300-acre mine site that, as of April 26, 2013, contained approximately 7.0 million tons of proven recoverable reserves between 20 and 70 mesh. The mineral reserves at our Hickory mine are secured under a property lease that expires in 2041. Pursuant to the lease agreement we have made payments to secure the lease and will pay royalties for each ton of sand and gravel extracted. We also pay the operator $29 per ton for saleable fracturing sand that has been processed through a wet and dry facility. Our royalty payments are (1) $3.50 per ton for #67 or larger gravel; (2) $2.50 per ton for gravel smaller than #67; (3) $2.50 per ton for specialty sand to include but not limited to masonary sand, blasting sand, and API certified fracturing sand; and (4) $1.25 per ton for other clay or earthen material removed including fill and concrete sand. However, our total royalty payment for material extracted from all of our properties will never exceed $30 million dollars, and we have a limited option to purchase the property.
The Hickory Mine lies above the Deweyville Allogroup-Mitchell Hammock alloformation. This area forms terraces lying between modern floodplains and the surface of the Prarie Allogroup found along the valley walls of the nearby coastal river systems. These terrace segments occur over a range of about 15 feet in elevation and are characterized by oversized relict meander loops, and exhibits well-preserved relict channels. The Alliance wet plant facility on the property is currently under construction and will be a completely new facility which will rely primarily on industrial grade suction dredging and aggregate processing equipment to dredge, wash and process up to 250 tons of aggregate per hour of which wet fracturing sand would represent approximately 100 tons per hour. The dry plant sits inside a metal enclosed building and contains a 175 ton per hour fluid bed dryer as well as five high capacity mineral separators. The dryer is capable of producing approximately 1.0 million tons per year of dry fracturing sand in varying gradations, including 20/40, 30/50 and 40/70 mesh. The dredge
47
Table of Contents
used for our mine is operated with diesel fuel and the on-site processing plant will utilize electric power from a local utility, while the dry plant facility runs on electricity and natural gas, and we obtain the necessary water from natural sources on the property.
Our Hickory lease and the aggregate processing facility are located approximately 18 miles south of the Alliance dry plant and are accessible through a 1.5 mile gravel road and a 16 mile paved county/state road that provides us with year-round trucking access. Once produced and dried, sand from our Hickory facility will be stored in one of four on-site silos with a combined storage capacity of 24,000 tons. Outgoing shipments of fracturing sand will be loaded onto rail cars operated by the mine operator on rail spurs they lease or own. Those rail cars are then are pulled on a rail line owned by Burlington Northern Sante Fe Railroad. Because of the cost efficiencies of shipping fracturing sand by rail, the dry processing plant’s strategic location adjacent to a Burlington Northern Santa Fe rail line provides our customers with the ability to transport fracturing sand from the Alliance dry processing facility to all major unconventional oil and natural gas basins currently producing in the United States.
We have spent $1.3 million on lease payments and equipment and $4.6 million in advance payments to Alliance for wet mine operating and dry plant processing fees. We are currently planning no new capital expenditures on the property.
Nicholson Mine
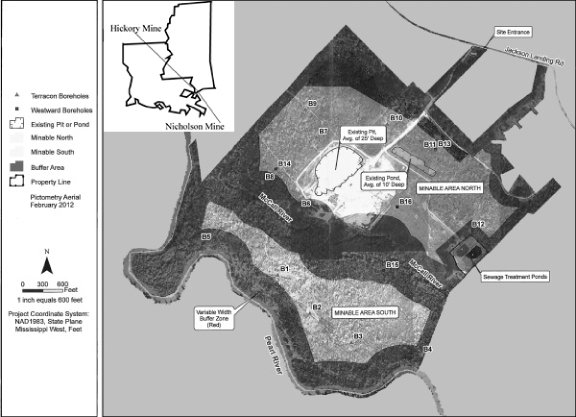
Our Nicholson mine is located in Nicholson, Mississippi, originally commenced mining operations in 2009 and has established road access, electrical utilities provided by the local utility company with water sources occurring naturally on site. We leased the surface mining rights to a 406-acre mineral deposit that is currently not being mined and does not have the necessary dredging equipment or wet processing plant necessary to begin mining operations. There are currently no definitive plans to begin capital expenditures necessary to commence mining
48
Table of Contents
operations. As of April 26, 2013, the Nicholson mineral deposit contained approximately 11.0 million tons of proven recoverable reserves. The property contains 406 acres of open land approximately four miles southwest of Picayune, Mississippi. We are not currently producing sand at our Nicholson Facility, as our needs and the needs of our hydraulic fracturing customers do not require us to operate this mine. Should we choose to begin operations at the Nicholson facility, we will be obligated to make payments of (1) $3.50 per ton for #67 or larger gravel; (2) $2.50 per ton for gravel smaller than #67; (3) $2.50 per ton for specialty sand to include but not limited to Mason sand, Blasting sand, and API Certified Frac Sand; and (4) $1.25 per ton for other clay or earthen material removed including fill and concrete sand, for royalties on the material extracted from the property. However, our total royalty payment for material extracted from all of our properties will never exceed $30 million dollars, and we have a limited right to purchase the property.
Our Nicholson Mine lies above three surfact geology zones: the Holocene backswamp, the Holocene meander belts, and the Pleistocene Praire Allogroup undifferentiated. These areas are part of the modern Pearl River deltaic and flood plains, and reflect the infilling of an entrenched valley during the late Pleistocene low level sea stands. The equipment necessary to begin mining operations at the Nicholson Facility includes various improvements such as suction dredging, washing and screening equipment. These facilities run on diesel fuel and electricity, and we obtain the necessary water from wells on the property. Heavy equipment would be used to mine sand from an open-pit in phases lasting from one to three years in duration. The previously mined area of our Nicholson property covers approximately 66. We have spent $0.7 million on lease payments for the property and currently are planning no new capital expenditures on the property.
Any production from the Nicholson facility in the future will be transported by trucks that access the mine site from adjoining county and state roads and delivered to the Alliance dry processing plant approximately five miles from the Nicholson mine.
Well Services
Our well services include (i) cementing, (ii) coiled tubing, (iii) pressure pumping, (iv) acidizing and (v) other pumping services. This suite of well services complements our turbine-powered hydraulic fracturing services while providing stable cash flow and an additional source of growth.
The following table summarizes our well services fleet in service as of December 31, 2011 and 2012.
| SERVICE UNITS |
2011 | 2012 | ||||||
| Hydraulic fracturing units (TFP’s) |
8 | 55 | ||||||
| Cementing units |
3 | 3 | ||||||
| Coiled tubing units |
4 | 5 | ||||||
| Pressure pumping units |
5 | 4 | ||||||
| Acidizing units |
10 | 8 | ||||||
| Nitrogen & other pumping units |
8 | 8 | ||||||
| • | Cementing involves the use of pressure pumping equipment to deliver a slurry of liquid cement that is pumped down a well between the casing and the borehole to isolate fluid zones and to minimize potential damage to hydrocarbon bearing and surrounding formations. In addition, the cement provides structural integrity for the casing by securing it to the earth. Cementing is also done when recompleting wells, where one zone is plugged and another is opened. |
| • | Coiled Tubing involves the insertion of a flexible steel pipe into wells to perform various well servicing operations. Coiled tubing typically has a diameter of less than three inches and is manufactured in continuous lengths of thousands of feet. Due to its small diameter, coiled tubing can be inserted into existing production tubing and used to perform a variety of services to enhance the flow of oil or natural gas without using a larger, more costly workover rig. The principal advantages of using coiled tubing in a workover include the ability to (i) continue production from the well without interruption, |
49
Table of Contents
| (ii) move continuous coiled tubing in and out of a well significantly faster than conventional pipe, (iii) direct fluids into a wellbore with more precision, (iv) provide a source of energy to power a down-hole motor or manipulate down-hole tools and (v) enhance access to remote fields due to the smaller size and mobility of a coiled tubing unit. |
| • | Pressure Pumping involves the use of pressure pumping equipment for well injection, cased-hole testing, workover pumping, mud displacement and wireline pumpdowns. |
| • | Acidizing involves the injection of highly reactive, low pH solutions (such as hydrochloric acid) into the area where hydrocarbons enter the wellbore. Acidizing is the most common means of reducing near-wellbore damage, as it dissolves and dilutes contaminants that have accumulated and may restrict the flow of hydrocarbons from a reservoir toward the wellbore, thus increasing well productivity. |
| • | Other Pumping Services involve the use of nitrogen, an inert gas, in various pressure pumping operations. When provided as a stand-alone service, nitrogen pumping is used to displace fluids in various oilfield applications. |
Industry Overview
The pressure pumping industry provides hydraulic fracturing and other well stimulation services to oil and natural gas companies. Hydraulic fracturing involves pumping a fluid down a perforated well casing or tubing under high pressure to cause the underground formation to crack, allowing the oil or natural gas to flow more freely. A propping agent is suspended in the fracturing fluid and props open the cracks created by the hydraulic fracturing process in the underground formation. Proppants generally consist of sand, bauxite, resin-coated sand or ceramic particles.
The two main factors influencing demand for hydraulic fracturing services in North America are (1) the level of horizontal drilling activity by oil and natural gas companies and (2) the fracturing requirements of the well being drilled, including the number of fracturing stages and the type and volume of fluids, chemicals and proppant pumped per stage. When drilling a horizontal well, the operator drills vertically into the formation and “steers” the drill string to create a horizontal section of the wellbore inside the target formation, which is referred to as a “lateral.” This lateral is divided into “stages” which are isolated zones that focus the high-pressure fluid and proppant being pumped into the well into distinct portions of the wellbore and surrounding formation.
We believe the primary factors increasing the demand for our services are the following:
Ongoing, Sustained Development of Existing and Emerging Unconventional Resource Basins. Over the past decade, exploration and production (“E&P”) companies have focused on exploiting the vast resource potential available across many of North America’s unconventional resource plays through the application of horizontal drilling and completion technologies, including multi-stage hydraulic fracturing. We believe long-term capital for the continued development of these basins will be provided in part by the participation of large, well-capitalized domestic and international oil and natural gas companies that have made and continue to make significant capital commitments through joint ventures and direct investments in North America’s unconventional basins. We believe that these companies are less likely to materially alter their drilling programs in response to short-term commodity price fluctuations.
Increased Horizontal Drilling and Greater Service Intensity in Unconventional Basins. Because of the correlation between horizontal drilling and the need for hydraulic fracturing, pumping and other related services, we view the horizontal rig count as one indicator of the overall demand for our services. According to Baker Hughes Incorporated, the U.S. horizontal rig count has risen from approximately 335 rigs at the beginning of 2007 to 1,136 rigs as of February 1, 2013. Development of horizontal wells has evolved to feature increasingly longer laterals and more fracturing stages, which has increased the requirement for advanced hydraulic fracturing and stimulation services.
50
Table of Contents
Increased Drilling in Oil- and Liquids-Rich Formations. There is increasing drilling activity in oil- and liquids-rich formations in the United States, such as the Eagle Ford, Bakken and Niobrara Shales. According to Baker Hughes Incorporated, the oil- and liquids-focused rig count increased from a low of 20.9% of 876 total active rigs in June 2009 to 53.4% of 2,007 total active rigs as of December 31, 2011. Although the E&P industry is cyclical and oil prices have historically been volatile, we believe that many of the oil- and liquids-rich plays are economically attractive even if oil prices fall below current prices and drilling activity in these areas will continue to support sustained growth in demand for our services.
Constrained Supply of Hydraulic Fracturing Fleets, Proppants and Other Products. The supply of hydraulic fracturing fleets, proppants, replacement and repair parts and other products has not kept up with the increased demand for such products due primarily to increased drilling in unconventional formations. Moreover, individual fracturing stages have become more intensive, requiring more fluids, chemicals and proppant per stage. As drilling in unconventional formations continues and becomes more intensive, we expect the supply and demand imbalance for hydraulic fracturing fleets, proppants and other products to continue throughout 2012 and into 2013.
Utilization of Hydraulic Fracturing for the Redevelopment of Conventional Fields. Oil and natural gas companies have begun to apply the knowledge gained through the extensive development of unconventional resource plays to their existing conventional basins. Many of the techniques, including hydraulic fracturing, applied in unconventional development, when applied to conventional wells either through workover or recompletion, have the potential to enhance overall production or enable production from previously unproductive horizons and improve overall field economics. As a result, hydraulic fracturing services are increasingly being deployed in more mature, traditionally oil-focused basins like the Permian and the Granite Wash basins.
Our Competitive Strengths
We believe that the following competitive strengths position us well within the oilfield services industry:
Differentiated Turbine-Powered Fracturing Equipment. Our TFPs have multiple benefits over conventional diesel-powered fracturing equipment, including:
| • | Greater fuel flexibility—our TFPs can operate on natural gas, diesel fuel or biofuel, whereas conventional fracturing equipment can generally operate on only diesel or biofuel. We believe our ability to operate our TFPs with various types of fuels, particularly natural gas, will provide significant value for our customers through, among other things, potential cost savings and ease of permitting. |
| • | Smaller footprint—the Frac Stack PackTM configuration, for which we have an exclusive license, allows us to provide two pumps (4,500—5,000 total HP) on a single trailer, whereas conventional configurations allow for only a single diesel-powered pump (1,800—2,500 total HP) on a trailer. |
| • | Lower emissions—our current TFPs, even when running on diesel fuel, produce lower emissions than conventional diesel-powered fracturing equipment and have met the Tier 4 standards for NOx and carbon monoxide gas emissions. If we operate our TFPs on natural gas, emissions will be even lower than when we use diesel as a fuel. |
| • | Easier major engine repair or replacement—because our turbine engines are much smaller and lighter than conventional diesel engines, we have the option to repair or replace turbine engines onsite, whereas a repair or replacement of a diesel engine generally requires a trip to a repair shop. |
Increasing Interest in Turbine Fracturing Pumps. We have entered into a two-year agreement with Shell to provide hydraulic fracturing services to Shell’s onshore U.S. E&P business using our TFPs. Shell has dedicated resources, including technical staff, to assist us with producing equipment that satisfies its technical and safety standards. We began providing hydraulic fracturing services to Shell during the first quarter of 2012. We believe that Shell’s interest and investment in our TFP technology, and its status as a premier E&P company with high standards for its well services providers, will allow our specialized TFPs to more quickly gain acceptance by other customers.
51
Table of Contents
Complementary Well Services. We have been providing a wide range of well services to the oil and natural gas industry for over 40 years. These services include: (i) cementing, (ii) coiled tubing, (iii) pressure pumping, (iv) acidizing and (v) other pumping services. We believe that we have developed a reputation for providing quality and reliable services and that our reputation and existing customer base will benefit us as we expand our hydraulic fracturing services. In addition, we believe that our well services diversify our revenue-generating operations and provide an additional source of cash flow.
Secured Sources of Critical Equipment Components. As of March 31, 2013, we had approximately $63.2 million of components for hydraulic fracturing spreads and well services equipment on order with or had made other arrangements to acquire from multiple reliable vendors. The key components of our hydraulic fracturing spreads on order include the pumps, turbines, gearboxes, electrical and hydraulic assemblies and skids. We believe we have secured access to high quality equipment through our strong supplier relationships and contractual agreements.
Highly Experienced Management Team. Our management team has extensive industry experience. Our Chairman and Chief Executive Officer, Michel B. Moreno, beneficially owns 93.3% of the common stock of the Company. Mr. Moreno is the founder and Chief Executive Officer of Moreno Group, LLC, a global, full-service construction company serving the upstream and downstream oil and gas sectors, co-founder of Dynamic Offshore Resources, LLC, an oil and gas company focused on acquiring and developing producing properties in the Gulf of Mexico, and Chief Executive Officer of Dynamic Industries, LLC, a leading fabricator and related field services provider serving the upstream and downstream oil and gas sectors. Our President, Enrique “Rick” Fontova, has over 32 years of oil and natural gas experience, the last nine of which have been spent in the oilfield services industry following 22 years with Shell Oil Company. Our senior management team has an average of more than 25 years of experience in the energy services industry.
Our Strategy
We plan to build upon our competitive strengths to grow our business through the following strategies:
Capitalize on Growth in Development of Shale and Other Resource Plays. The U.S. Energy Information Administration (the “EIA”), forecasts that production from shale gas sources will account for approximately 47% of U.S. dry gas production in 2035, up from 16% in 2009. We intend to focus our services on shale development and similar onshore resource basins with long-term development potential and attractive economics. We intend to focus our operations on regions that include the Eagle Ford, Marcellus, Utica, Permian and other basins. We also plan to expand our business to include other unconventional oil and natural gas formations, including the Marcellus Shale and Utica Shale in the Appalachian Basin in Pennsylvania, Ohio and West Virginia, and the Haynesville Shale in northern Louisiana, as we increase our fracturing fleet and enter into new agreements with our customers.
Selective Lease or Sale of Turbine Fracturing Equipment. We have received inquiries from a number of oilfield service companies, including Baker Hughes and subsidiaries of some E&P companies, regarding possible sale or lease arrangements for our TFPs. We may consider entering into selective sale or lease arrangements to generate near-term cash flow and profitability while we continue to build out our hydraulic fracturing operations. We expect that we would enter into such an arrangement only in situations in which we would not have the opportunity to provide such services or if our customer agrees that it will not develop or use turbine fracturing technology other than ours for a reasonable period of time.
Continue to Expand our Existing Service Offerings. We continue to evaluate opportunities to grow our existing well services through acquisitions and organic growth opportunities that complement or expand our existing hydraulic fracturing and well services businesses.
52
Table of Contents
Continued Vertical Integration of our Fracturing Services. We believe that continued vertical integration of our hydraulic fracturing services represents an opportunity to reduce our operating costs and improve our financial performance. We have recently entered into a long-term lease arrangement for two sand mines in Mississippi and Louisiana to secure access to sand, the principal proppant used in hydraulic fracturing, which we also plan to market and sell to other providers of hydraulic fracturing services. We are actively considering various opportunities to implement our vertical integration strategy into other components of the hydraulic fracturing supply chain, including through the opportunistic acquisition of a chemical provider.
Shell Agreement
We entered into an agreement, effective September 2, 2011, with Shell to provide Shell with the exclusive right to use a minimum of two high pressure hydraulic fracturing units, with additional units to be made available at Shell’s option. The first hydraulic fracturing unit was delivered during the first quarter of 2012 and the second is expected to be delivered later that year. Shell prepaid us for the purchase, mobilization, modification and preparation of equipment and services provided under the agreement. We used a portion of the proceeds of the private offering of the Notes to repay that prepayment in full. Michel B. Moreno and his spouse provided personal guarantees to secure the performance of our obligations pursuant to the agreement.
The Shell Agreement terminates on July 11, 2014, subject to Shell’s right to terminate at any time with 180 days’ written notice. Shell may, at its sole discretion, deliver up to five one-year extensions. In addition, if a termination for cause event occurs, Shell may terminate the agreement and we must pay Shell $10 million in liquidated damages within 90-days after the date such termination is effective. A termination for cause event includes, but is not limited to, (i) failure to deliver the first or second hydraulic fracturing unit on or before its scheduled delivery date, plus, in each case, a 60-day cure period, (ii) failure to achieve certain performance targets or (iii) failure to achieve certain start-up milestones.
Shell may also terminate upon a change of control. A change of control occurs upon our consolidation or merger, a sale, lease, exchange or other transfer of substantially all our assets, or a combination in which our shareholders immediately before such combination do not hold, directly or indirectly, more than 50% of the voting securities of the combined company, except that no change of control shall have occurred if Michel B. Moreno remains Chairman of the Company and certain other conditions are met. Following a change of control termination, we must pay Shell $100 million in liquidated damages.
The agreement may also be terminated by Shell upon a force majeure event.
In April 2012 we entered into an Amendment to the Shell agreement (the “Amendment”), to add a senior credit facility and amend the provisions of the security agreement contained in the Shell agreement. The Amendment commits Shell to provide advances to the Company in four tranches. The first three tranches are of $30 million each and the last tranche is of $10 million. The first tranche was advanced in May 2012.
In October 2012, we entered into an amendment and restatement of the Shell agreement (the “Shell Credit Facility”) pursuant to which Shell agreed to provide up to an aggregate $100.0 million of senior secured term loans, which loans may not be reborrowed once repaid. As of March 31, 2012, we had approximately $84.0 million outstanding under the Shell Credit Facility. The Shell Credit Facility is secured by a first priority lien on all of our motor vehicles and equipment except for the vehicles securing the Ford Motor Credit loans and the Nations Equipment Finance capital leases. In connection with the Shell Credit Facility, an affiliate of Shell and the trustee under the indenture governing our notes entered into an amended and restated intercreditor agreement setting forth the relative priority and interests with respect to our motor vehicles and equipment as between Shell and the trustee, on behalf of our Note holders. Repayments, which will total 25 monthly installments which commenced November 15, 2012, are to be $2.0 million per month through October 2013 $4.0 million per month for the next six months, $7.5 million per month for the next six months and one payment of $1.0 million in the final month.
53
Table of Contents
Sand Purchase Agreement
We have made arrangements to acquire 300,000 tons of northern white sand per year from GNS, with monthly deliveries to continue through June 2016. We have agreed to make an aggregate of $15 million of advance payments towards the purchase price of the sand through four equal payments of $3.75 million, the first two of which were paid in November 2011 and February 2012. The last two payments are scheduled for April 2012 and thereafter upon certain conditions being satisfied. Beginning in September 2012, or the first month thereafter in which we receive our first delivery of sand, we will pay GNS a monthly fee per ton of sand delivered.
To the extent we fail to purchase our contracted amount in any given year, we will pay GNS liquidated damages calculated based on a dollar amount per ton we did not order for that year. If we pay liquidated damages during a contract year, we may apply any liquidated damages as a payment towards excess tons ordered in the subsequent year and the contract will be deemed to be extended by the period of time necessary to take delivery of sand in an amount equal in value to the liquidated damages paid. GNS may terminate the agreement by written notice if we (i) fail to make timely payment, (ii) fail to perform any other provision of the agreement (following a 30-day cure period after receipt of written notice from GNS) or (iii) become insolvent or engage in an act that reasonably causes GNS to deem itself insecure.
Alliance Consulting Group Agreement
In January 2012 we entered into an agreement with Alliance Consulting Group, an affiliate, to build and operate a wet and dry processing plant that will perform the mining, processing and transportation of raw fracturing sand from these mines to support a portion of our own fracturing sand needs as well as demand from other consumers of fracturing and other types of sand. We will pay Alliance $29 per ton for these services and as of September 30, 2012 had prepaid Alliance $4.5 million which will offset future costs. We project that the annual raw fracturing sand output will be approximately one million tons.
Shale Support Services, LLC
In January 2013, the Company began procuring raw fracturing sand from SSS on an open account basis. SSS is controlled by the Company’s Chairman and Chief Executive Officer, Michel B. Moreno. As of March 31, 2013 the Company owed SSS $394,455. The Company’s agreement with Alliance Consulting Group, LLC is in the process of being assumed by SSS.
Chemrock Technologies Agreement
In February 2012, we entered into an agreement to purchase chemicals from Chemrock Technologies, LLC, a chemical company, in which MMR, one of our stockholders, had a 50% ownership interest. The contract called for preferred pricing for us. Chemrock provided us $0 and $29,987,749 in chemical products for the years ended December 31, 2011 and December 31, 2012, respectively. The agreement was cancelled in January, 2013. At December 31, 2012, we had no amount owed to Chemrock.
On February 28, 2013, we entered into a new agreement to purchase chemicals from Chemrock Technologies, LLC. The contract calls for market pricing and may result in payments that could exceed $40.0 million dollars over eighteen months. The agreement requires a prepayment of $3.9 million to Chemrock which will be applied against future purchases. As of March 31, 2013, $1.0 million of the required prepayment amount has been paid. We may also purchase chemicals from unrelated vendors. The chemicals we purchase from Chemrock include clay controllers, acid corrosion inhibitors, hydrochloric acid, foaming agents, friction reducers, iron control agents, gel stabilizers, soda ash, and acid anti-sludge agents, among other products. These chemicals have a number of uses in hydraulic fracturing including reducing corrosion rates, aerating water sensitive reservoirs, and neutralizing the pH levels of the fluids in the well.
54
Table of Contents
Customers
Our customers primarily include independent oil and natural gas exploration and production companies. For the year ended December 31, 2012, our top five customers accounted for 88% of total revenues with Shell representing 79% of total revenues. During the year ended December 31, 2011, our top five customers accounted for 52% of total revenues with EXCO Resources, Navidad Resources, L.L.C. and Shell accounting for 17%, 12%, and 11% of total revenues, respectively. During the year ended December 31, 2010, our top five customers accounted for 38% of revenues with EXCO Resources and Chesapeake Operating, Inc. accounting for 11% and 11% of total revenues, respectively.
Suppliers
We purchase the materials used in our hydraulic fracturing and well services, such as coiled tubing and cementing, from various suppliers. We purchase equipment and components for our hydraulic fracturing and well service spreads from a number of suppliers, including Advanced Turbine Services, FMC Technologies-Fluid Control Division, Yantai Jereh Petroleum Equipment & Technologies Co., Ltd., EBR Services, L.L.C., National Oilwell Varco L.P. and Keystone Oilfield Fabrication, L.L.C.
In September 2011 we formed TPT as a joint venture with MTT. TPT purchases the turbine-engines used in our TFPs and assembles the TFPs. Under the joint venture arrangements, we have the exclusive right to purchase turbines and accessory equipment from TPT until October 2016. Our royalty-free perpetual license to use purchased equipment will survive the termination of the exclusivity period. Following the termination of the exclusivity period, we will also have a perpetual right of first offer on all TFPs sold by TPT. Along with the equipment purchase arrangements, we have entered into installation and maintenance agreements with TPT. Under these agreements, TPT provides all labor and professional supervisory and managerial personnel as are required for installation of turbine engines on trailers or into skids and maintains and repairs all turbine-powered equipment, accessory equipment, and all gearboxes and accessory gearboxes that we purchase. Under such agreements, we pay costs plus agreed upon markups to TPT.
Where we currently source materials from a single supplier, we believe that we will be able to make satisfactory alternative arrangements in the event of interruption of supply, except with respect to our agreement to obtain TFPs exclusively from TPT. However, given the limited number of suppliers of certain of our raw materials, we may not always be able to make alternative arrangements should one of our suppliers fail to deliver or timely deliver our materials.
During the three months ended March 31, 2013, we purchased more than 5% of our materials or equipment from each of ChemRock Technologies L.L.C., Independence Oilfield Chemicals, LLC, Pel-State Bulk Plant, LLC, Thomas Petroleum, LLC and Preferred Resin Holding Company, LLC. During the year ended December 31, 2011, we purchased 5% or more of our materials or equipment from each of, Dynamic Industries, Inc., Yantai Jereh Petroleum Equipment & Technologies Co., Ltd., FMC Technologies, Inc., Rush Truck Center of Texas, L.P. and Marine Turbine Technologies, L.L.C. During the year ended December 31, 2012, we purchased 5% or more of our materials or equipment from each of, ChemRock Technologies, L.L.C., Advanced Turbine Services, FMC Technologies-Fluid Control Division, Inc., Rush Truck Center of Texas, L.P., Turbine Powered Technologies, L.L.C. and EBR Services, L.L.C.
Equipment
As of May 20, 2013, we had approximately 159,750 HP of high pressure pumping capacity in our fleet, of which 150,750 HP was turbine powered. During December 2012 we placed into service the first of six planned new coiled tubing units. A second new coiled tubing unit and two new cementing units were also placed into service in April and May of 2013. We do not anticipate adding more horsepower without additional firm customer commitments in the future and we may also consider reconfiguring or selling some portion of the earlier assembled units in the fleet based on customer commitments and our evaluation of the market over the near term.
55
Table of Contents
Competition
The competition for our services includes multi-national oilfield service companies as well as regional competitors. Our major multi-national competitors include Halliburton Company, Schlumberger Ltd. and Baker Hughes. Our multi-national competitors typically have a more diverse product and service offerings than we do. In addition, we compete against a number of smaller, regional operators, which offer products and services, other than products and services related to our TFPs, similar to the products and services we offer.
Seasonality
Our results of operations have not historically reflected any material seasonal tendencies, and we currently do not believe that seasonal fluctuations will have a material impact on us in the foreseeable future.
56
Table of Contents
Properties
Our primary corporate office is located at 4023 Ambassador Caffery Parkway, Suite 200, Lafayette, LA 70503. We currently lease the corporate office under a lease agreement that expires on May 31, 2014. We also own or lease several other facilities. Our leases, other than our lease with respect to sand mines, generally have terms of one to three years. We believe that our existing facilities are adequate for our operations and their locations allow us to efficiently serve our customers. Other than our sand mine facilities, we do not believe that any single facility is material to our operations and, if necessary, we could readily obtain a replacement facility. As of March 31, 2013, we maintained the following properties in addition to our primary corporate office:
| LOCATION |
USE OF FACILITY |
EXPIRATION OF LEASE OR OWN | ||
| 4700 NE Evangeline Thruway Carencro, LA 70520 | District office—storing and repairing equipment and general office purposes | December 14, 2017 | ||
| 11441 State Hwy 43 South Marshall, TX 75670 | District office—storing and repairing equipment and general office purposes | Own | ||
| 301 Duhon Rd Lafayette, LA 70506 | Storing and repairing equipment and general office purposes | July 31, 2013 | ||
| 1600 Stout St, Ste 1370 Denver, CO 80202 | Sales office | October 15, 2014 | ||
| 3700 Ambassador Caffery, Unit 2045, Lafayette, LA 70503 | Storage unit | Month-to-month | ||
| 301 Commerce St, 21st Floor Fort Worth, TX 76102 | Vacant office space | April 30, 2016 | ||
| 3116 Jackson Landing Rd. Nicholson, MS 39463 |
Sand mine | September 30, 2041 lease expiration, subject to limited option to purchase | ||
| 69761 LA Industries Pit Rd. Pearl River, LA 70452 |
Sand mine | September 30, 2041 lease expiration, subject to limited option to purchase | ||
| 99 Pullin Rd Pleasanton, TX, 78064 |
District Office | January 1, 2016 | ||
| 200 Egg Rd Carrizo Springs, TX 78834 |
Man camp (owned) and field lodging (non-owned) |
Own | ||
| 12914 West County Rd 91 Midland, TX 79707 |
District Office | January 31, 2016 | ||
| 3221 Veterans Memorial Blvd., Ste B Abbeville, LA 70510 |
Warehouse | October 31, 2013 | ||
| 10777 Westheimer Rd., Ste 170 Houston, TX 77042 |
Sales office | January 31, 2016 | ||
Permits
In order to conduct our sand operations, we are required to obtain permits from various local, and state government agencies. The various permits we must obtain address such issues as mining, construction, air quality, water discharge and quality, noise, dust and reclamation. Prior to receiving these permits, we must comply with the regulatory requirements imposed by the issuing governmental authority. In some cases, we also must have certain plans pre-approved, such as site reclamation plans, prior to obtaining the required permits. A
57
Table of Contents
decision by a governmental agency to deny or delay issuing a new or renewed permit or approval, or to revoke or substantially modify an existing permit or approval, could have a material adverse effect on our ability to continue operations at the affected facility. Expansion of our existing operations also is predicated upon securing the necessary environmental and other permits and approvals.
Our Hickory Mine does not require a permit from the Louisiana Department of Environmental Quality (“LADEQ”), but is subject to regulations promulgated by that agency. Our Hickory Mine is in full complaince with Louisiana state laws and the regulations of the LADEQ. Our mine is also in compliance with Part 46 of the Mine Saftey and Health Administration regulations.
Our Nicholson Mine requires a surface mining permit from the Mississippi Department of Environmental Quality (“MDEQ”). This property has historically been mined under such a permit and bond, which we plan to re-file when we plan to resume operations on the mine. In addition, this mine requires an Army Corps of Engineers 404 permit along with wetlands delineation due to navigable waterways running through the property. We plan to file this permit in connection with resuming operations at the mine.
Risk Management and Insurance
Our operations are subject to hazards inherent in the oil and gas industry, including accidents, blowouts, explosions, craterings, fires, oil spills and hazardous materials spills. These conditions can cause:
| • | personal injury or loss of life; |
| • | damage to, or destruction of property, equipment, the environment and wildlife; and |
| • | suspension of operations. |
In addition, claims for loss of oil and natural gas production and damage to formations can occur in the well services industry. If a serious accident were to occur at a location where our equipment and services are being used, it could result in us being named as a defendant in lawsuits asserting large claims.
Because our business involves the transportation of heavy equipment and materials, we may also experience traffic accidents which may result in spills, property damage and personal injury.
Despite our efforts to maintain high safety standards, we from time to time have suffered accidents, and there is a risk that we will experience accidents in the future. In addition to the property and personal losses from these accidents, the frequency and severity of these incidents affect our operating costs and insurability, and our relationship with customers, employees and regulatory agencies. Any significant increase in the frequency or severity of these incidents, or the general level of compensatory payments, could adversely affect the cost of, or our ability to obtain, workers’ compensation and other forms of insurance, and could have other material adverse effects on our financial condition and results of operations.
We maintain insurance coverage of types and amounts that we believe to be customary in the industry including workers’ compensation, commercial general liability, business auto, property, umbrella liability and excess liability insurance all subject to certain limitations, deductibles and caps. As discussed below, our MSAs provide, among other things, that our customers generally assume liability for underground pollution and pollution emanating from the wellbore as a result of an explosion, fire or blowout. We retain the risk for any liability not indemnified by our customers in excess of our insurance coverage. Our insurance coverage may be inadequate to cover our liabilities and our customers may be unable or unwilling to fulfill their indemnity obligations to us under the MSAs. In addition, we may not be able to maintain adequate insurance in the future at affordable rates.
We enter into MSAs with each of our customers. Our MSAs delineate our and our customer’s respective indemnification obligations with respect to the services we provide. With respect to our hydraulic fracturing services, our MSAs typically provide for knock-for-knock indemnification for all losses, which means that we
58
Table of Contents
and our customers assume liability for damages to our respective personnel and property without regard to fault. For catastrophic losses, our MSAs generally include industry-standard carve-outs from the knock-for-knock indemnities, pursuant to which our customers (typically the exploration and production company) assume liability for (i) damage to the hole, including the cost to re-drill; (ii) damage to the formation, underground strata and the reservoir; (iii) damages or claims arising from loss of control of a well or a blowout; and (iv) allegations of subsurface trespass.
Our MSAs typically provide for industry-standard pollution indemnities, pursuant to which we assume liability for surface pollution associated with our equipment, and our customer assumes liability arising from all other pollution, including, without limitation, underground pollution and pollution emanating from the wellbore as a result of an explosion, fire or blowout.
The description of our insurance and our indemnification provisions set forth above is a summary of their material terms. Future MSAs or insurance policies may change as a result of market and other conditions.
Intellectual Property Rights
We currently have no foreign or domestic patents or pending patent applications but protect our unpatented proprietary technology under a combination of trade secret laws and third-party nondisclosure and assignment agreements. In addition, we currently have an exclusive license from TPT under its technology relating to the Frac Stack Pack™ to make and commercialize our TFPs and use the Frac Stack Pack™ trademark. Ted McIntyre II, filed a non-provisional patent application with the United States Patent and Trademark Office on August 25, 2011 claiming certain aspects of the technology which he subsequently transferred to TPT. Mr. McIntyre is currently the Manager and Chief Executive Officer of TPT. Please see the section titled “Certain Relationships and Related Person Transactions—Joint Venture” for additional information.
Legal Proceedings
We are from time to time a party to various claims and legal proceedings related to our business. We maintain insurance coverage to reduce financial risk associated with certain of these claims and proceedings. It is not possible to predict the outcome of these claims and proceedings. However there are no current material claims or legal proceedings pending against us that, in the opinion of our management, are likely to have a material adverse effect on our business, financial condition, results of operations or liquidity.
Environmental Matters
Our business, and our customers’ business, is significantly affected by stringent and complex federal, state and local laws and regulations governing the discharge of substances into the environment or otherwise relating to protection of the environment or human health and safety. As part of our business, we emit, handle, transport, and dispose of a variety of fluids and substances used by our customers in connection with their oil and natural gas E&P activities. We also generate and dispose of hazardous waste. The emission, generation, handling, transportation, and disposal of these fluids, substances, and wastes are regulated by a number of laws, including the CAA, the Resource Conservation and Recovery Act, the Comprehensive Environmental Response, Compensation, and Liability Act, the Clean Water Act, the SDWA, and analogous state laws and regulations. Failure to properly handle, transport, or dispose of these materials or otherwise conduct our operations in accordance with these and other environmental laws and regulations could expose us to liability for governmental penalties, third-party claims, cleanup costs associated with releases of such materials, damages to natural resources, and other damages, as well as potentially impair our ability to conduct our operations. We could be exposed to liability for cleanup costs, natural resource damages and other damages as a result of our conduct that was lawful at the time it occurred or the conduct of, or conditions caused by, prior operators or other third parties. We could also be subject to private party tort claims in connection with actual or alleged environmental impacts associated with our operations.
59
Table of Contents
Environmental laws and regulations may, among other things, require the acquisition of permits to conduct our operations; restrict the amounts and types of substances that may be released into the environment or the way we use, handle or dispose of our wastes in connection with our operations; cause us to incur significant capital expenditures to install pollution control or safety-related equipment at our operating facilities; limit or prohibit construction or drilling activities in sensitive areas such as wetlands, wilderness areas or areas inhabited by endangered or threatened species; impose specific health and safety criteria addressing worker protection; require investigatory and remedial actions to mitigate pollution conditions caused by our operations or attributable to former operations; and impose substantial liabilities on us for pollution resulting from our operations. Environmental laws and regulations have changed in the past, and they are likely to change in the future. If existing regulatory requirements or enforcement policies change, we may be required to make significant unanticipated capital and operating expenditures.
Any failure by us to comply with applicable environmental, health and safety laws and regulations may result in governmental authorities taking actions against our business that could adversely impact our operations andfinancial condition, including the:
| • | issuance of material administrative, civil and criminal penalties; |
| • | modification, denial or revocation of permits or other authorizations; |
| • | imposition of limitations on our operations; and |
| • | performance of site investigatory, remedial or other corrective actions. |
The oil and gas industry presents environmental risks and hazards and environmental regulation has tended to become more stringent over time. Environmental laws and regulations may restrict the rate of oil and natural gas production below the rate that would otherwise be possible. The regulatory burden on the oil and natural gas industry increases the cost of doing business in the industry and consequently affects profitability. In addition, an increase in regulatory requirements on oil and gas exploration and completion activities could significantly delay or interrupt our customers’ operations.
Climate Change
On December 15, 2009, the EPA published its findings that emissions of carbon dioxide, methane and other GHGs present an endangerment to public health and welfare because emissions of such gases are, according to the EPA, contributing to the warming of the earth’s atmosphere and other climate changes. Based on these findings, the EPA has begun to adopt and implement regulations that would restrict emissions of GHGs under existing provisions of the CAA. The EPA recently adopted two sets of rules regulating GHG emissions under the CAA, one of which requires a reduction in emissions of GHGs from motor vehicles and the other of which will require that certain large stationary sources obtain permits for their emissions of GHGs. The EPA has also adopted rules requiring the reporting of GHG emissions from certain large GHG emission sources, on an annual basis, beginning in 2011 for omissions occurring after January 1, 2010. In November 2010, the EPA expanded its existing GHG reporting rule to include onshore and offshore oil and natural gas production and onshore processing, transmission, storage and distribution facilities, which may include certain of our facilities, beginning in 2012 for emissions occurring in 2011. Further GHG regulation of our business could have an additional impact on our financial results.
In addition, both houses of Congress have actively considered legislation to reduce emissions of GHGs, and more than one-third of the states have already taken legal measures to reduce emissions of GHGs, primarily through the development of GHG emission inventories and/or regional GHG cap and trade programs. Most of these cap and trade programs work by requiring either major sources of emissions or major producers of fuels to acquire and surrender emission allowances, with the number of allowances available for purchase reduced each year until the overall GHG emission reduction goal is achieved.
Any new federal, regional or state restrictions on emissions of carbon dioxide or other GHGs that may be imposed in areas in which we conduct business could result in increased compliance costs or additional operating restrictions on our customers. Such restrictions could potentially make our customers’ products more expensive and thus reduce demand for them, which could have a material adverse effect on the demand for our services and
60
Table of Contents
our business. Finally, some scientists have concluded that increasing concentrations of GHGs in the earth’s atmosphere may produce climate changes that have significant physical effects, such as increased frequency and severity of storms, droughts, and floods and other climatic events. If any such effects were to occur, they could have an adverse effect on our results of operations.
Employees
As of March 31, 2013, our workforce consisted of 422 employees, including 7 part-time employees. We are not a party to any collective bargaining agreements. We consider our relations with our employees to be good, and we have not had any major labor-related issues such as business interruptions during the past several years.
61
Table of Contents
Directors and Executive Officers
| NAME |
AGE | TITLE | ||
| Michel B. Moreno |
44 | Chairman and Chief Executive Officer | ||
| Enrique “Rick” Fontova |
55 | President and Director | ||
| Earl J. Blackwell |
71 | Chief Financial Officer | ||
| Charlie Kilgore |
53 | Director | ||
| Mark Knight |
55 | Director | ||
Set forth below is the description of the backgrounds of our directors and executive officers.
Michel B. Moreno has been a beneficial equity holder and an advisor to the Company since June 2006. Upon our corporate reorganization in October 2011, Mr. Moreno became the Chairman of our Board of Directors and our Chief Executive Officer. He intends to devote 90% of his professional time to discharge his duties as an officer of the Company. Mr. Moreno beneficially owns 81.63% of the common stock of the Company. He is also the founder and former Chief Executive Officer of Moreno Group, LLC, a global, full-service construction company serving the upstream and downstream oil and gas sectors and owns Dynamic Cranes LLC, an offshore crane rental company. He is also a non-controlling owner and former Chief Executive Officer of Dynamic Industries, Inc., a leading fabricator and related field services provider serving the upstream and downstream oil and gas sectors. He co-founded and subsequently sold Dynamic Offshore Resources, LLC, an oil and gas company focused on acquiring and developing producing properties in the Gulf of Mexico. In addition, he founded and grew several other companies until their sale including: Moreno and Associates, a safety consulting company for the offshore oil and gas industry, and Pure Water Solutions, an equipment rental company for the offshore oil and gas industry.
Enrique “Rick” Fontova was our Chief Executive Officer from May 2011 until our corporate reorganization in October 2011, at which time Mr. Fontova became our President and a Director. He intends to devote all of his professional time to discharge his duties as an officer of the Company. Mr. Fontova has over 31 years of oil and natural gas experience, the last nine of which have been spent in the oilfield services industry following 22 years with Shell Oil Company. Mr. Fontova joined Moreno Group, LLC as president of Dynamic Power, LLC in February of 2009, and previously served as Senior Vice President of International Sales and Operations of Eventure Global Technology, which provides solid expandable casing services.
Earl J. Blackwell has been our Chief Financial Officer since 2009. He was previously involved with the Company through his position as Managing Director of Moody Moreno & Rucks L.L.C., a private equity firm that invests in companies in the environmental, energy, communications, and oil and gas industries and which invested in a predecessor of the Company in 2005. He intends to devote all of his professional time to discharge his duties as an officer of the Company. Mr. Blackwell has extensive experience as a Certified Public Accountant for 15 years including as Senior Partner at Broadhurst, Blackwell & Gardes, a Certified Public Accounting Firm. He also has 25 years of experience as Chief Financial Officer or Chief Operating Officer in several industrial waste and property development companies.
Charlie Kilgore became a director upon our corporate reorganization in October 2011. In 1997 Mr. Kilgore founded and currently serves as Chief Executive Officer of Kilgore Marine Services, an industrial marine transportation company servicing the Gulf of Mexico. He has 26 years of experience in operating marine transportation service companies, and previously worked as a Drilling Engineer for Conoco Inc.
Mark Knight became a director upon our corporate reorganization in October 2011. Since 2003, he has served as President and Chief Executive Officer of Knight Oil Tools Inc., which provides rental tools, fishing services, well
62
Table of Contents
services, saw services, and manufacturing packages to the oil and gas industry. Mr. Knight is also a board member for the Boys and Girls Club of Acadiana, Acadiana Symphony, Evangeline Area Council of the Boy Scouts of America, Our Lady of Fatima School Board, and currently serves on the St. Thomas More Foundation Board.
Board of Directors
Our Board of Directors is currently comprised of Michel B. Moreno, Enrique “Rick” Fontova, Charlie Kilgore and Mark Knight. Each of our directors is elected or appointed to hold office until the next annual meeting of stockholders and until his successor has been elected and qualified.
Executive Compensation
Summary Compensation Table
The following table sets forth summary information concerning the compensation awarded to, paid to or earned by each of our named executive officers during the fiscal years ended December 31, 2011 and 2012.
| Name and Principal Position |
Year | Salary ($) |
Bonus ($)(1) |
All Other Compensation ($) |
Total ($) |
|||||||||||||||
| Michel B. Moreno |
2012 | 475,000 | — | 15,923 | 490,923 | |||||||||||||||
| Chairman and Chief Executive Officer |
2011 | 303,066 | (2) | 765,727 | (3) | — | 1,068,793 | |||||||||||||
| Enrique Fontova |
2012 | 375,000 | — | 14,492 | 389,492 | |||||||||||||||
| President and Director |
2011 | 186,984 | (4) | 200,000 | 7,200 | 394,184 | ||||||||||||||
| Earl Blackwell |
2012 | 273,077 | — | — | 273,077 | |||||||||||||||
| Chief Financial Officer |
2011 | 205,323 | 48,125 | — | 253,448 | |||||||||||||||
| (1) | As of December 31, 2012, we have not determined to pay any annual bonuses for 2012. We expect that any annual bonus determinations for 2012 will be made in the second or third quarter of 2013. For a complete description of the annual bonus program, see the “Narrative to Disclosure to Summary Compensation Table—Annual Bonuses” section below. |
| (2) | Mr. Moreno became our Chairman of the Board and Chief Executive Officer, effective October 6, 2011, in connection with our corporate reorganization. The amount shown for 2011 in the “Salary” column for Mr. Moreno represents his base salary earned for the period from his date of hire on May 1, 2011 through December 31, 2011. |
| (3) | Mr. Moreno’s bonus amount shown in 2011 was comprised of an annual bonus of $355,149 and a one-time special bonus of $410,578. The one-time special bonus was earned as of December 31, 2011 and was paid by the Company in January 2012 to reward Mr. Moreno for exceptional performance in closing the offering of our Notes in November 2011. |
| (4) | Mr. Fontova served as our Chief Executive Officer effective from May 16, 2011 until October 6, 2011, at which time, he became our President and Director, effective October 6, 2011, in connection with our corporate reorganization. The amount shown in the “Salary” column for Mr. Fontova represents his base salary earned for the period from his date of hire on May 16, 2011 through December 31, 2011. |
Narrative Disclosure to Summary Compensation Table
Employment Agreements
We have entered into employment agreements with each of our named executive officers in connection with the executive’s employment with us. The principal elements of these employment agreements are summarized below.
63
Table of Contents
Messrs. Moreno, Fontova and Blackwell
Effective as of October 6, 2011, we entered into employment agreements with each of Messrs. Moreno and Fontova that provide for Mr. Moreno’s employment as our Chief Executive Officer and Mr. Fontova’s employment as our President, respectively. Effective as of May 1, 2011, we entered into an employment with Mr. Blackwell that provides for his employment as our Chief Financial Officer. The employment agreements with Messrs. Moreno and Fontova have a term of four years beginning on October 6, 2011 and ending on October 6, 2015, and the employment agreement with Mr. Blackwell has a term of three years beginning on November 1, 2011 and ending on November 1, 2014, in each case, subject to automatic one-year extensions thereafter, unless either party provides at least 30 days’ prior notice of non-renewal.
As of December 31, 2012, the annual base salaries of the executives remained unchanged relative to the annual base salaries in effect as of December 31, 2011. As of December 31, 2011, the annual base salaries of the executives pursuant to their employment agreements were $475,000 for Mr. Moreno, $375,000 for Mr. Fontova and $275,000 for Mr. Blackwell, in each case, subject to annual review by the Company. Mr. Fontova’s annual base salary was increased to $375,000 from $100,000 effective July 16, 2011. Mr. Blackwell’s annual base salary was increased to $275,00 from $154,500 effective May 1, 2011. In addition to annual base salary, Messrs. Moreno and Fontova are eligible for an annual bonus of 50% to 100% of their respective annual base salaries, and Mr. Blackwell is eligible for an annual bonus without reference to a specified percentage of annual base salary. During their employment, Messrs. Moreno, Fontova and Blackwell are eligible to receive the same benefits generally made available our employees, as well as four weeks of paid vacation time each year.
The employment agreements with Messrs. Moreno, Fontova and Blackwell provide that in the event that the executive’s employment is terminated by the Company either (i) upon our determination to cease the Company’s business operations or (ii) upon the sale of a majority interest in the stock or ownership interests of the Company, or all or substantially all of the Company’s assets, in each case, at our election, the executive will be entitled to receive a cash payment equivalent to six months of the executive’s base salary payable within seven business days after the date of termination. If the executive’s employment is terminated due to the expiration of the then-current term of the employment agreement, the executive will be entitled to payment of any target annual bonus payable within seven business days after the date of termination. If the executive’s employment is terminated by reason of his death or disability, he will be entitled to receive a cash payment equivalent to one year’s base salary, in the case of Messrs. Moreno and Fontova, or six months’ base salary, in the case of Mr. Blackwell, of the executive’s base salary payable within seven business days after the date of termination.
The employment agreements with Messrs. Moreno, Fontova and Blackwell contain certain non-competition and non-solicitation covenants that apply during the term of the employment agreements and for a two-year period thereafter and a confidentiality covenant that applies indefinitely.
Perquisites and other Personal Benefits
We provide our named executive officers with limited perquisites and personal benefits, which serve as an important recruiting and retention tool. Each of Messrs. Moreno and Fontova is entitled to a monthly automobile allowance of $1,500 and $1,200, respectively, which are paid bi-weekly. Mr. Moreno’s auto allowance commenced in February 2012. Mr. Fontova’s auto allowance commenced in July 2011.
Annual Bonus
We do not have a formal bonus plan, but we have historically paid discretionary cash bonuses to our named executive officers as we believe annual cash bonuses motivate employees. While the employment agreements with each of Messrs. Moreno and Fontova provide for a target annual bonus expressed as a percentage of annual base salary, the employment agreement with Mr. Blackwell does not refer to a specified percentage of annual base salary. Mr. Moreno, as Chief Executive Officer, determines the actual annual bonus amounts based on an evaluation of the Company’s performance, the executive’s contributions to the Company’s performance and the
64
Table of Contents
executive’s individual performance. As of the date of this filing, annual bonus amounts for 2012, if any, have not yet been determined. We expect any such determination to be made during the second quarter of 2013 based on the foregoing considerations.
Outstanding Equity Awards at Fiscal Year-End
None of our named executive officers held any outstanding equity awards as of December 31, 2012.
Retirement Benefits
We currently maintain a 401(k) plan pursuant to which employees, including our named executive officers, may contribute a portion of their eligible compensation, subject to the maximum allowed under the Internal Revenue Code. We provided employer matching contributions under the plan totaling $1,036,880 during 2012. We did not provide any employer matching contributions under the plan during 2011.
Additional Narrative Disclosure
For a description of the material terms of the severance provisions of the employment agreements with our named executive officers, please see the “Narrative to Disclosure to Summary Compensation Table—Employment Agreements” section above. Our named executive officers were not entitled to any change in control protections during 2012.
Director Compensation
We did not pay or award any compensation to our non-employee directors during 2012.
Director Independence
Two of the four members of our Board of Directors are non-management directors. We believe such non-management directors are “independent” as defined in the currently applicable listing standards of the New York Stock Exchange. Prior to the effective date of this registration statement, our Board of Directors will affirmatively determine whether or not such non-management directors are independent under such standards.
Audit Committee of the Board
We do not have a separately-designated standing audit committee. The entire Board of Directors performs the functions of an audit committee, but no written charter governs the actions of the Board when performing the functions that would generally be performed by an audit committee. The Board of Directors approves the selection of our independent accountants and meets and interacts with the independent accountants to discuss issues related to financial reporting. In addition, the Board of Directors reviews the scope and results of the audit with the independent accountants, reviews with management and the independent accountants our annual operating results, considers the adequacy of our internal accounting procedures and considers other auditing and accounting matters including fees to be paid to the independent auditor and the performance of the independent auditor.
Code of Ethics
Due to our small size and the limited number of persons comprising our management, we have not adopted a generally applicable code of ethics. However, under our employment agreements with our Chief Executive Officer, our President, and our Chief Financial Officer, such officers have agreed to a code of ethics and behavior consistent with our corporate philosophy.
65
Table of Contents
The following table presents the number and percentage of shares of common stock of the Company that are beneficially owned as of March 31, 2013 by (i) each person or group that is known to us to be the beneficial owner of more than 5% of such common stock, (ii) each of our named executive officers and directors and (iii) our executive officers and directors as a group.
The amounts and percentages of common stock beneficially owned are reported on the basis of SEC regulations governing the determination of beneficial ownership of securities. Under SEC rules, a person is deemed to be a “beneficial owner” of a security if that person has or shares “voting power,” which includes the power to vote or to direct the voting of such security, or “investment power,” which includes the power to dispose of or to direct the disposition of such security. A person is also deemed to be a beneficial owner of any securities of which that person has the right to acquire beneficial ownership within 60 days. Under these rules, more than one person may be deemed to be a beneficial owner of the same securities and a person may be deemed to be a beneficial owner of securities as to which he or she has no economic interest. To our knowledge, each of the security holders listed below has sole voting and investment power as to the securities shown unless otherwise noted and subject to community property laws where applicable.
| NAME(1) |
NUMBER OF SHARES OF COMMON STOCK |
PERCENTAGE OWNERSHIP |
||||||
| Greater than 5% holders: |
||||||||
|
MMH(2) |
1,244,460 | 88.9 | % | |||||
|
MMR(3) |
155,540 | 11.1 | % | |||||
| Named Executive Officers and Directors: |
||||||||
| Michel B. Moreno |
1,306,620 | 93.3 | % | |||||
| Enrique “Rick” Fontova |
— | * | ||||||
| Earl J. Blackwell |
— | * | ||||||
| Charlie Kilgore |
— | * | ||||||
| Mark Knight |
— | * | ||||||
| All executive officers and directors as a group |
1,306,620 | 93.3 | % | |||||
| * | Indicates less than 1%. |
| (1) | Unless otherwise indicated, the business address of each of the holders is: c/o Green Field Energy Services, Inc., 4023 Ambassador Caffery Parkway, Suite 200, Lafayette, LA 70503. |
| (2) | Michel B. Moreno controls MMH through his 50% ownership of the limited company interest of MMH. |
| (3) | Michel B. Moreno indirectly owns 40% of the limited company interest of MMR. |
66
Table of Contents
This prospectus relates to the offering by the selling shareholders identified in the table below of 247,058 shares of common stock, par value $0.01 per share. All of the shares of common stock offered by this prospectus are being sold by the selling shareholders. These shares of common stock are issuable upon exercise of the Warrants issued to Purchasers in our November 2011 Private Placement.
The table below has been prepared based upon the information furnished to us by the selling shareholders. The selling shareholders identified below may have sold, transferred or otherwise disposed of some or all of their shares since the date on which the information in the following table is presented in transactions exempt from, or not subject to, the registration requirements of the Securities Act. Information concerning the selling shareholders may change from time to time and, if necessary, we will amend or supplement this prospectus accordingly. We cannot provide an estimate as to the number of shares of common stock that will be held by the selling shareholders upon termination of the offering covered by this prospectus because the selling shareholders may offer some or all of their shares of common stock under this prospectus. The selling shareholders may also sell, transfer or otherwise dispose of all or a portion of their shares in transactions exempt from the registration requirements of the Securities Act or pursuant to another effective registration statement covering those shares.
The following table sets forth, based on information provided to us by the selling shareholders or known to us, the name of each selling stockholder, the nature of any position, office or other material relationship, if any, which the selling stockholder has had, within the past three years, with us or with any of our predecessors or affiliates, and the number of shares of our common stock beneficially owned by the stockholder before this offering. The number of shares owned are those beneficially owned, as determined under the rules of the SEC, and the information is not necessarily indicative of beneficial ownership for any other purpose. Under these rules, beneficial ownership includes any shares of common stock as to which a person has sole or shared voting power or investment power and any shares of common stock which the person has the right to acquire within 60 days through the exercise of any option, warrant or right, through conversion of any security or pursuant to the automatic termination of a power of attorney or revocation of a trust, discretionary account or similar arrangement.
We have assumed all shares of common stock reflected on the table will be sold from time to time in the offering covered by this prospectus. Because the selling shareholders may offer all or any portions of the shares of common stock listed in the table below, no estimate can be given as to the amount of those shares of common stock covered by this prospectus that will be held by the selling shareholders upon the termination of the offering.
| Selling Stockholder |
Shares of Common Stock Owned Before this Offering |
Shares of Common Stock Underlying Warrants Owned Before this Offering(1) |
Percentage
of Common Stock Beneficially Owned Before this Offering(2) |
Shares of Common Stock Being Offered in this Offering(3) |
Shares of Common Stock Beneficially Owned After this Offering |
Percentage of Common Stock Beneficially Owned After this Offering(2) | ||||||
| TOTALS: |
| * | Represents less than 1%. |
| (1) | Represents shares of our common stock remaining issuable under warrants issued in connection with the November 2011 Private Placement. |
67
Table of Contents
| (2) | Applicable percentage ownership before the offering is based on 1,400,000 shares of common stock outstanding as of December 31, 2012. Applicable percentage ownership after the offering is based on 1,771,504 shares of common stock, which includes the 247,058 shares of common stock issuable upon exercise of the Warrant Shares registered pursuant to this prospectus. |
| (3) | Assumes that (i) all of the shares of common stock to be registered on the registration statement of which this prospectus is a part are sold in the offering and (ii) that no other shares of common stock are acquired or sold by the selling stockholder prior to the completion of the offering. However, subject to the restrictions of transfer agreed to by the selling shareholders (see “Determination of Offering Price and Plan of Distribution” in this prospectus), the selling shareholders may sell all, some or none of the shares offered pursuant to this prospectus or sell some or all of their shares pursuant to an exemption from the registration provisions of the Securities Act, including under Rule 144. |
68
Table of Contents
Determination of Offering Price and Plan of Distribution
We are registering the shares of common stock issuable upon exercise of the Warrants to permit the resale of Warrant Shares by the holders of the warrants from time to time after the date of this prospectus. We will not receive any of the proceeds from the sale by the selling shareholders of the Warrant Shares. We will bear all fees and expenses incident to our obligation to register the Warrant Shares.
The Warrant Shares may not be liquid since they are not listed on any exchange or quoted in the OTC Bulletin Board. Because there is currently no active trading market, selling stockholders will sell at a stated fixed price until our common stock in quoted on the OTC Bulletin Board.
The selling shareholders and their transferees of any sort, including pledgees or secured parties of such selling shareholders in case of default, may from time to time sell all or any of their shares of common stock on or through the facilities of any stock exchange, market or trading facility on which the shares are traded or quoted. These sales may be at fixed or negotiated prices. The principal factors to be considered by a selling shareholder in determining the price include the following:
| • | the information included in this prospectus and otherwise available to the selling shareholder; |
| • | the history of and prospects for our business and our past and present operations; |
| • | the history and prospects for the industry in which we compete; |
| • | our past and present earnings and current financial position; |
| • | the market for securities of companies in businesses similar to ours; and |
| • | the general condition of the securities market. |
There were two holders of record of our common stock as of September 30, 2012, the most recent practicable date before the filing of this document.
The selling shareholders may use a variety of methods when selling our common stock, including ordinary brokerage transactions and transactions where the broker-dealer solicits purchasers, block trades in which the broker-dealer may attempt to sell as an agent or resell as a principal, including for its own account, an exchange distribution in accordance with the rules of any such exchange, privately negotiated transactions or any other method permitted by law. The selling shareholders may also sell shares under Rule 144 under the Securities Act, if available, or in other private resales, rather than under this prospectus.
If the selling shareholder effects the sale or transfer of its common stock through a broker-dealer, such broker-dealer may receive compensation in the form of discounts, concessions or commissions from the selling shareholder or the purchasers of common stock for whom such broker-dealer may act as agent or to whom they sell as principal or both (which compensation is not expected to exceed what is customary in the types of transactions involved). The selling shareholder and any broker-dealer that acts in connection with the sale or transfer of the common stock may be deemed to be “underwriters” within the meaning of Securities Act. In such event, any commissions received by such broker-dealer or agent and any profits on the resale of the shares of common stock purchased by them may be deemed to be underwriting commissions or discounts under the Securities Act.
Upon our being notified in writing by a selling shareholder that any material arrangement has been entered into with any broker-dealer for the sale of common stock, a supplement to this prospectus will be filed to the extent applicable that sets forth the amount of common stock to be sold and the terms of the sale, any plan of distribution, the names of any underwriters, brokers, dealers or agents, any discounts, commissions, concessions or other items constituting compensation from the selling shareholders or any other information as may be required under the Securities Act.
We are required to pay all fees and expenses incident to the registration of the common stock. We have agreed to indemnify the selling shareholders against certain losses, claims, damages and liabilities, including liabilities under the Securities Act.
69
Table of Contents
Certain Relationships and Related Person Transactions
Our parent companies
The list below shows our parent companies:
| • | MMH controls Green Field Energy Services, Inc. through its 88.9% ownership of our common stock as of March 31, 2013; and |
| • | Michel B. Moreno controls MMH through his 50% ownership of the limited liability company interests of MMH. |
Joint Venture
In September 2011 we formed TPT in conjunction with MTT. MTT is owned and controlled by Ted McIntyre, II, the developer of the turbine-powered technology underlying TFPs. Under the joint venture arrangements, Mr. McIntyre, MTT and its affiliates transferred all rights in the technology to TPT.
Under the operating agreement of TPT, we and MTT each have a 50% ownership interest in TPT. Mr. McIntyre is the Manager and Chief Executive Officer of TPT and has the right of management and control of TPT’s day to day affairs and business and of the maintenance of TPT’s property, subject to fiduciary duties and certain other limitations as provided in the operating agreement (which include, among other things, limitations on TPT’s management under Section 5.13.2 (“Limitations on Management”) of its operating agreement, to, without the consent of us and MTT, (a) sell, exchange, lease, mortgage, pledge or transfer all, substantially all, or any material portion of TPT’s assets; (b) undertake any other action, activity, obligation, or commitment by or on behalf of TPT that would require, involve, or result, either individually or annually in the aggregate: (i) in an expenditure or outlay of funds by TPT, or a commitment or obligation of TPT to pay, turnover, transfer, subject to any encumbrance, or otherwise dispose of, cash in excess of $1.0 million, or assets or other property with a value of more than $1.0 million; or (ii) in a commitment or obligation by TPT to otherwise become liable or obligated for any other obligations in excess of $1.0 million; or (iii) borrowing funds, executing promissory notes or loan agreements or incurring any indebtedness in excess of $250,000; (c) merge or consolidate TPT with or into any other entity; (d) change the character of TPT’s business; (e) allow TPT to act as endorser, guarantor, or surety for the debt or obligations of any other person; (f) initiate any bankruptcy proceedings by or on behalf of TPT; (g) dissolve TPT; (h) commission any act that would make it impossible for TPT to carry on its ordinary business; and (i) cause or allow TPT to guarantee payment of the promissory notes, mortgage notes, collateral mortgage notes, hand notes, or any other indebtedness or obligations of any person, firm, corporation, partnership or other entity to any bank, savings and loan association or any other creditor or other entity whatsoever). Mr. McIntyre can be removed only by a vote of the members holding 51% of the ownership interests. In addition, under the operating agreement if (i) 50% or more of our ownership interests becomes owned by a person or entity that is not an affiliate or (ii) there occurs any other change in our ownership that results in a change of control, we shall no longer have any voting rights in TPT and may have our ownership interests purchased at the option of the other members at such time; provided, that our ownership interests in TPT will not be subject to such change of control provision for so long as any Notes are outstanding. The operating agreement further provides that, for the avoidance of doubt, if a “Default” occurs under the terms of and as defined in the indenture governing the Notes, the collateral agent acting on behalf of the holders of the Notes (or any designees of such agent), will be admitted as and will become a member of TPT in place of the Company without any further vote or any other type of approval by the member or members at such time.
We will also have the exclusive right to purchase turbines and accessory equipment from TPT until October 2016. Our royalty-free perpetual license to use purchased equipment will survive the termination of the exclusivity period. Following the termination of the exclusivity period, we will also have a perpetual right of first offer on all TFPs sold by TPT.
70
Table of Contents
In connection with the formation of TPT, TPT assumed the obligations under our equipment purchase agreement with Marine Turbine Technologies, L.L.C., an entity owned and controlled by Mr. McIntyre, which assembled and supplied our first TFP under license from Mr. McIntyre. Under the equipment purchase agreement, we have an irrevocable, perpetual license and right to purchase up to 200 turbines and accessory equipment from MTT for use in our hydraulic fracturing and well services business as well as the right to resell, lease, and rent the turbine engines for such purposes to third parties.
Along with the equipment purchase agreement, we have entered into installation and maintenance agreements with TPT. Under these agreements, TPT provides all labor and professional supervisory and managerial personnel as are required for installation of turbine engines on trailers or into skids and maintains and repairs all turbine-powered equipment, accessory equipment, and all gearboxes and accessory gearboxes that we purchase. Under such agreements, we pay costs plus agreed upon markups to TPT.
TPT has arrangements with a supplier of turbine engines to acquire 50 re-manufactured turbine engines for $19.2 million with an option to acquire an additional 100 turbine engines at fixed prices as provided in the arrangements. As a consequence of our obligation under the installation agreement and amended equipment purchase agreement with TPT, we have become obligated to fund the costs to acquire the initial 50 and any subsequent purchases of turbine engines pursuant to TPT’s exercise of such option under TPT’s arrangements with its supplier.
Redemption and Earnout
Pursuant to redemption agreements entered into in May 2011 among the Company and certain of its members, the Company agreed to redeem all of its outstanding membership interests, other than those held by MMH. The redemption agreement of MMR was subsequently rescinded. Following a cash payment to Egle in the amount of approximately $0.7 million by the Company and the assumption by MMH of the remainder of the Company’s obligation to Egle in the amount of $3.0 million, the Company satisfied its initial purchase obligation pursuant to the Egle redemption agreement. Please read the section titled “Business—Corporate Reorganization—Equity Redemptions and Repurchases.”
In addition to such upfront payments, the redemption agreements provide that the Company make earnout payments to the members based on a percentage of the Company’s gross revenues attributable to its hydraulic fracturing services, in an aggregate amount not to exceed 3.36% of such revenues. Such earnout payments are to be made to such members until an aggregate total of $35.7 million is paid. The earnout payments accrue from the date of the closing of each respective redemption agreement and are payable, in arrears, no later than the 15th of the month following each calendar quarter with respect to existing hydraulic fracturing spreads (commencing with the calendar quarter ended September 30, 2011). With respect to new hydraulic fracturing spreads, earnout payments will commence twelve months after such new hydraulic fracturing spreads are placed in service.
Dynamic Industries, Inc. Agreement
In April 2011, we entered into an agreement with Dynamic under which Dynamic promises to provide the material and labor for producing hydraulic fracturing units according to our specifications. Our Chairman and Chief Executive Officer, Michel B. Moreno, owns a non-controlling interest in Dynamic. Such agreement contains hourly labor rates and customary markups for materials and subcontracted services. The agreement can be terminated upon written notice by either party. During the year ended December 31, 2012 the Company made purchases under the agreement totaling $5.2 million. The total value of the completed work was approximately $43.7 million.
71
Table of Contents
Aircraft Leases
In June 2011, we entered into three aircraft leases with entities controlled by our Chairman and Chief Executive Officer, Michel B. Moreno. Pursuant to these aircraft leases, the Company has access to two, non-commercial aircraft that we can utilize from time to time to transport our personnel on a rental basis for appropriate business only travel. The Company made payments to the lessors as follows:
| Year ended December 31, | Three Months Ended March 31, 2013 |
|||||||||||
| 2011 | 2012 | |||||||||||
| Aerodynamic, LLC |
788,943 | 660,000 | 165,000 | |||||||||
| Casafin II, LLC |
696,488 | 1,626,833 | 566,896 | |||||||||
| Moreno Properties, LLC |
424,554 | 752,369 | 137,432 | |||||||||
Agreements with Entities Controlled by our Stockholders
In February 2012, we entered into an agreement to purchase chemicals from Chemrock Technologies, LLC, a chemical company, in which MMR, one of our stockholders, had a 50% ownership interest. The contract called for preferred pricing for us. Chemrock provided us with $0 and $29,987,749 in chemical products for the years ended December 31, 2011 and December 31, 2012, respectively. The agreement was cancelled in January, 2013. At December 31, 2012, we had no amount owed to Chemrock.
On February 28, 2013, we entered into a new agreement to purchase chemicals from Chemrock Technologies, LLC. The contract calls for market pricing and may result in payments that could exceed $40.0 million dollars over eighteen months. The agreement requires a prepayment of $3.9 million to Chemrock which will be applied against future purchases. As of March 31, 2013, $1.0 million of the prepayment amount has been paid. We may also purchase chemicals from unrelated vendors.
We have also entered into an agreement with Alliance Consulting Group. Alliance will build and operate a wet and dry processing plant that will perform the mining, processing and transportation of raw fracturing sand from these mines to support a portion of our own fracturing sand needs as well as demand from other consumers of fracturing and other types of sand. Our Chairman and Chief Executive Officer, Michel B. Moreno, has a controlling interest in Elle Investments, LLC which is a 50% owner of Alliance. We will pay Alliance $29 a ton for these services, approximately $29.0 million a year, and as of December 31, 2012 had prepaid Alliance $4.6 million which will offset future costs.
In January 2013, the Company began procuring raw fracturing sand from SSS on an open account basis. SSS is controlled by the Company’s Chairman and Chief Executive Officer, Michel B. Moreno. As of March 31, 2013 the Company owed SSS $394,455. The Company’s agreement with Alliance Consulting Group, LLC is in the process of being assumed by SSS.
In March of 2013, the Company sold components for power generation equipment to Turbine Generation Services, LLC (“TGS”). TGS is owned by MOR DOH Holdings, LLC, an entity controlled by the Company’s Chairman and Chief Executive Officer, Michel B. Moreno. As of March 31, 2013 the Company had no amounts owed to it by TGS.
Please see the section titled “Summary—Organizational Structure.” We may in the future use services provided by or acquire other materials or equipment from companies owned or partially owned by our stockholders. Any such arrangements will be pursuant to written agreements negotiated on the basis of competitive market pricing and other market terms and conditions.
72
Table of Contents
Moreno, Fontova and Blackwell Employment Agreements
We have entered into employment agreements with Enrique “Rick” Fontova, our President, Michel B. Moreno, our Chief Executive Officer, and Earl J. Blackwell, our Chief Financial Officer. Mr. Moreno has beneficial ownership of more than 5% of the equity of the Company. Item 11 “Executive Compensation—Employment Agreements” describes such agreements and such description is incorporated herein by reference.
Elle Investments, LLC
During the year ended December 31, 2011, we incurred $2.5 million of indebtedness from Elle Investments, LLC, an entity beneficially owned by Michel B. Moreno, our Chairman and Chief Executive Officer. These funds were utilized to procure equipment. We repaid this indebtedness in full prior to December 31, 2011.
73
Table of Contents
Our authorized capital stock consists of 2.0 million shares of common stock, $0.01 par value per share. There are currently 1,524,446 million shares of common stock outstanding, held of record by three stockholders.
The following description summarizes some of the terms of our common stock. Because it is only a summary, it does not contain all the information that may be important to you. For a complete description you should refer to our certificate of incorporation, as amended, and bylaws.
Voting, Dividend and Other Rights
Each share of common stock entitles the holder to one vote with respect to each matter presented to our stockholders on which the holders of common stock are entitled to vote. Our common stock votes as a single class on all matters, including all matters relating to the election and removal of directors on our Board of Directors. Holders of our common stock will not have cumulative voting rights. Except in respect of matters relating to the election and removal of directors on our Board of Directors and as otherwise provided in our certificate of incorporation, as amended, our bylaws, the rules and regulations of any stock exchange applicable to us, or any law or regulation applicable to us or our securities, all matters to be voted on by our stockholders must be approved by a majority in voting power of the shares present in person or by proxy at the meeting and entitled to vote on the matter. In the case of the election of directors at a meeting at which there is a quorum, directors will be elected by a plurality of the votes cast at such meeting.
The holders of our common stock are entitled to receive, from funds legally available for the payment thereof, dividends, if any, when and if declared by resolution of the Board of Directors, subject to certain restrictions in the indenture governing our Notes on the payment of dividends on our common stock. We have never declared or paid any cash dividends on our common stock. We do not intend to pay any cash dividends on our common stock for the foreseeable future. Any determination to pay dividends in the future will be at the discretion of our Board of Directors and will depend upon results of operations, capital requirements, financial condition, contractual restrictions, restrictions imposed by applicable law and other factors our Board of Directors deems relevant.
In the event of any voluntary or involuntary liquidation, dissolution or winding up of our affairs, holders of common stock would be entitled to share ratably in our assets that are legally available for distribution to stockholders after payment of our debts and other liabilities.
The holders of our common stock have no preemptive or conversion rights or other subscription rights. There are no redemption or sinking fund provisions applicable to our common stock.
Delaware Law and Certain Certificate of Incorporation and Bylaw Provisions
Number of Directors; Vacancies
Our bylaws provide that our Board of Directors must consist of one or more members. The Board of Directors, or its remaining members, even though less than a quorum, is empowered to fill vacancies on the Board of Directors occurring for any reason. A description of the composition of our Board of Directors is described in “Management.”
Actions Taken by the Board
In order for our Board of Directors to approve an action at a board meeting, the presence of directors entitled to cast a majority of the votes of the whole Board of Directors shall constitute a quorum. Except as otherwise provided by our certificate of incorporation, bylaws or applicable law, a majority of the votes entitled to be cast by directors present at the meeting at which there is a quorum shall be the act of the Board of Directors. Our Board of Directors can take an action without holding a meeting if it does so by unanimous written consent.
74
Table of Contents
Amendments to the Certificate of Incorporation
The Delaware General Corporation Law allows us to amend our certificate of incorporation at any time to add or change a provision that is required or permitted to be included in the certificate of incorporation or to delete a provision that is not required to be included in the certificate of incorporation. The Board of Directors may amend our certificate of incorporation only with the approval of a majority in voting power of our stockholders.
Action by Written Consent of Stockholders
The Delaware General Corporation Law and our bylaws provide that any action required or permitted to be taken at a meeting of stockholders can be taken by written consent signed by the holders of our common stock holding equal to or greater than the number of shares of common stock that would have been required to approve such action at a meeting of stockholders at which all shares entitled vote on such action were present and voted.
Amendments to the Bylaws
Our bylaws and certificate of incorporation provide that our Board of Directors has the power to alter, amend or repeal the bylaws. Our stockholders also have the power to alter, amend or repeal any bylaws whether adopted by them or otherwise.
Delaware Business Combination Provisions
By a provision in our certificate of incorporation, we have opted not to be governed by the provisions of Section 203 of the General Corporation Law of Delaware, which regulates certain corporate takeovers.
75
Table of Contents
Shares Eligible for Future Sales
Assuming exercise in full of all of the Warrants and sale of all 247,058 shares of common stock being offered by the selling shareholders, we will have 1,647,058 shares of common stock outstanding. Of these shares, 247,058 will be freely transferable without restriction or further registration under the Securities Act by persons other than “affiliates,” as that term is defined in Rule 144 under the Securities Act. Generally, the balance of our outstanding shares of common stock are “restricted securities” within the meaning of Rule 144 under the Securities Act, subject to the limitations and restrictions that are described below. Shares of common stock purchased by our affiliates will be “restricted securities” under Rule 144A. Restricted securities may be sold in the public market only if registered or if they qualify for an exemption from registration under Rules 144 or 701 promulgated under the Securities Act.
Rule 144 Limitations
The availability of Rule 144 will vary depending on whether restricted securities are held by an affiliate or a non-affiliate. In general, under Rule 144, an affiliate who has beneficially owned restricted securities within the meaning of Rule 144 for at least one year would be entitled to sell within any three-month period, a number of shares of common stock that does not exceed 1% of the number of shares of common stock then outstanding, which will equal approximately 16,470 shares after the filing of this registration statement, assuming exercise in full of all the Warrants. Sales under Rule 144 are also subject to certain manner of sale provisions, notice requirements and the availability of current public information about our Company. The volume limitations, manner of sale and notice provisions described above will not apply to sales by non-affiliates. For purposes of Rule 144, a non-affiliate is any person or entity who is not our affiliate at the time of sale and has not been our affiliate during the preceding three months. A non-affiliate who has beneficially owned restricted securities for six months may rely on Rule 144 provided that certain public information regarding us is available. A non-affiliate who has beneficially owned the restricted securities proposed to be sold for at least one year will not be subject to any restrictions under Rule 144.
Registration Rights Agreements
In connection with the sale of the Notes and accompanying Warrants, we entered into a registration rights agreement with certain holders who, as a result of their ownership of common stock, might be characterized as “underwriters”. To our knowledge, these holders have the right to acquire upon exercise of their Warrants a total of 247,058 shares of common stock.
Warrants
As of December 31, 2012, there were outstanding 250,000 Warrants exercisable for a total of 247,058 shares of common stock at an exercise price of $0.01 per share.
76
Table of Contents
Material U.S. Federal Income Tax Considerations For Non-U.S. Holders
The following is a summary of the material U.S. federal income tax consequences to non-U.S. holders (as defined below) of the acquisition, ownership and disposition of our common stock. This discussion is not a complete analysis of all of the potential U.S. federal income tax consequences relating thereto, nor does it address the Medicare tax on net investment income, estate and gift tax consequences or any tax consequences arising under any state, local or non-U.S. tax laws, or any other U.S. federal tax laws. This discussion is based on the Internal Revenue Code of 1986, as amended, or the Code, Treasury Regulations promulgated thereunder, judicial decisions, and published rulings and administrative pronouncements of the Internal Revenue Service, or IRS, all as in effect as of the date of this offering. These authorities may change, possibly retroactively, resulting in U.S. federal income tax consequences different from those discussed below. No ruling has been or will be sought from the IRS with respect to the matters discussed below, and there can be no assurance the IRS will not take a contrary position regarding the tax consequences of the acquisition, ownership or disposition of our common stock, or that any such contrary position would not be sustained by a court.
This discussion is limited to non-U.S. holders who purchase our common stock pursuant to this prospectus and who hold such common stock as a “capital asset” within the meaning of Section 1221 of the Code (generally, property held for investment). This discussion does not address all of the U.S. federal income tax consequences that may be relevant to a particular holder in light of such holder’s particular circumstances. This discussion also does not consider any specific facts or circumstances that may be relevant to holders subject to special rules under the U.S. federal income tax laws, including, without limitation:
| • | financial institutions, banks and thrifts; |
| • | insurance companies; |
| • | tax-exempt organizations; |
| • | partnerships or other pass-through entities; |
| • | real estate investment trusts or regulated investment companies; |
| • | traders in securities that elect to mark to market; |
| • | broker-dealers or dealers in securities or currencies; |
| • | U.S. expatriates; |
| • | “controlled foreign corporations”, “passive foreign investment companies” or corporations that accumulate earnings to avoid U.S. federal income tax; |
| • | persons that own, or are deemed to own, more than five percent (5%) of our outstanding common stock (except to the extent specifically set forth below); |
| • | persons deemed to sell our common stock under the constructive sale provisions of the Code; |
| • | persons who hold or receive our common stock pursuant to the exercise of any employee stock option or otherwise as compensation; |
| • | persons subject to the alternative minimum tax; or |
| • | persons that hold our common stock as a position in a hedging transaction, “straddle”, “conversion transaction” or other risk reduction transaction. |
THIS DISCUSSION IS FOR GENERAL INFORMATION ONLY AND IS NOT TAX ADVICE. PROSPECTIVE INVESTORS SHOULD CONSULT THEIR TAX ADVISORS REGARDING THE PARTICULAR U.S. FEDERAL INCOME TAX CONSEQUENCES TO THEM OF ACQUIRING, OWNING AND DISPOSING OF OUR COMMON STOCK, AS WELL AS ANY TAX CONSEQUENCES ARISING UNDER ANY STATE, LOCAL OR NON-U.S. TAX LAWS AND ANY OTHER U.S. FEDERAL TAX LAWS.
77
Table of Contents
Definition of Non-U.S. Holder
For purposes of this discussion, a non-U.S. holder is any beneficial owner of our common stock that is not a “U.S. person” or a partnership for U.S. federal income tax purposes. A U.S. person is any of the following:
| • | an individual who is a citizen or resident of the United States; |
| • | a corporation (or other entity treated as a corporation for U.S. federal income tax purposes) created or organized under the laws of the United States, any state thereof or the District of Columbia; |
| • | an estate the income of which is subject to U.S. federal income tax regardless of its source; or |
| • | a trust (1) whose administration is subject to the primary supervision of a U.S. court and which has one or more U.S. persons who have the authority to control all substantial decisions of the trust, or (2) that has a valid election in effect under applicable Treasury Regulations to be treated as a U.S. person. |
If a partnership holds our common stock, the U.S. federal income tax treatment of a partner will generally depend on the status of the partner and the tax treatment of the partnership. A partner in a partnership holding our common stock should consult its tax advisor with regard to the U.S. federal income tax treatment of an investment in the common stock.
Distributions on Our Common Stock
We do not intend to pay dividends on our common stock for the foreseeable future. However, if we make cash or other property distributions on our common stock, such distributions generally will constitute dividends for U.S. federal income tax purposes to the extent paid from our current or accumulated earnings and profits, as determined under U.S. federal income tax principles. Amounts not treated as dividends for U.S. federal income tax purposes will constitute a return of capital and will first be applied against and reduce a non-U.S. holder’s tax basis in the common stock, but not below zero. Distributions in excess of our current and accumulated earnings and profits and in excess of a non-U.S. holder’s tax basis in its shares will be taxable as capital gain realized on the sale or other disposition of the common stock and will be treated as described under “Dispositions of Our Common Stock” below.
Dividends paid to a non-U.S. holder of our common stock generally will be subject to U.S. federal withholding tax at a rate of 30% of the gross amount of the dividends, or such lower rate specified by an applicable income tax treaty. To receive the benefit of a reduced treaty rate, a non-U.S. holder generally must furnish to us or our paying agent a valid IRS Form W-8BEN (or applicable successor form) certifying such holder’s qualification for the reduced rate. This certification must be provided to us or our paying agent prior to the payment of dividends and must be updated periodically. Non-U.S. holders that do not timely provide us or our paying agent with the required certification, but that qualify for a reduced treaty rate, may obtain a refund of any excess amounts withheld by timely filing an appropriate claim for refund with the IRS. Non-U.S. holders should consult their tax advisors regarding their entitlement to benefits under an applicable income tax treaty.
Dividends paid on our common stock that are effectively connected with a non-U.S. holder’s conduct of a trade or business in the United States (and, if required by an applicable income tax treaty, are attributable to a permanent establishment maintained by the non-U.S. holder in the United States) will be exempt from U.S. federal withholding tax. To claim the exemption, the non-U.S. holder must generally furnish to us or our paying agent a properly executed IRS Form W-8ECI (or applicable successor form).
Any dividends paid on our common stock that are effectively connected with a non-U.S. holder’s U.S. trade or business (and if required by an applicable income tax treaty, attributable to a permanent establishment maintained by the non-U.S. holder in the United States) generally will be subject to U.S. federal income tax on a net income basis at the regular graduated U.S. federal income tax rates in much the same manner as if such holder were a resident of the United States. A non-U.S. holder that is a corporation also may be subject to an
78
Table of Contents
additional branch profits tax equal to 30% (or such lower rate specified by an applicable income tax treaty) of its effectively connected earnings and profits for the taxable year, as adjusted for certain items. Non-U.S. holders should consult any applicable income tax treaties that may provide for different rules.
Dispositions of Our Common Stock
Subject to the discussion below regarding backup withholding, a non-U.S. holder generally will not be subject to U.S. federal income tax on any gain realized upon the sale or other disposition of our common stock, unless:
| • | the gain is effectively connected with the non-U.S. holder’s conduct of a trade or business in the United States (and, if required by an applicable income tax treaty, is attributable to a permanent establishment maintained by the non-U.S. holder in the United States); |
| • | the non-U.S. holder is a nonresident alien individual present in the U.S. for 183 days or more during the taxable year of the disposition, and certain other requirements are met; or |
| • | our common stock constitutes a “U.S. real property interest” by reason of our status as a U.S. real property holding corporation, or USRPHC, for U.S. federal income tax purposes. |
Gain described in the first bullet point above will be subject to U.S. federal income tax on a net income basis at the regular graduated U.S. federal income tax rates in much the same manner as if such holder were a resident of the U.S. A non-U.S. holder that is a corporation also may be subject to an additional branch profits tax equal to 30% (or such lower rate specified by an applicable income tax treaty) of its effectively connected earnings and profits for the taxable year, as adjusted for certain items. Non-U.S. holders should consult any applicable income tax treaties that may provide for different rules.
Gain described in the second bullet point above will be subject to U.S. federal income tax at a flat 30% rate (or such lower rate specified by an applicable income tax treaty), but may be offset by U.S. source capital losses (even though the individual is not considered a resident of the United States), provided that the non-U.S. holder has timely filed U.S. federal income tax returns with respect to such losses.
With respect to the third bullet point above, we believe we are not currently and do not anticipate becoming a USRPHC for United States federal income tax purposes. However, because the determination of whether we are a USRPHC depends on the fair market value of our United States real property interests relative to the fair market value of our other trade or business assets and our non-United States real property interests, there can be no assurance that we are not a USRPHC or will not become one in the future. Even if we are a USRPHC, gain arising from the sale or other taxable disposition by a non-U.S. holder of our common stock will not be subject to tax if such class of stock is “regularly traded,” as defined by applicable Treasury Regulations, on an established securities market, and such non-U.S. holder owned, actually or constructively, 5% or less of such class of our stock throughout the shorter of the five-year period ending on the date of the sale or exchange or the non-U.S. holder’s holding period for such stock. We do not believe our common stock will be “regularly traded” on an established securities market within the meaning of applicable Treasury Regulations, and we cannot guarantee that the common stock will become regularly traded on an established securities market in the future. If gain on the sale or other taxable disposition of our stock were subject to taxation under the third bullet point above, the non-United States holder would be subject to regular United States federal income tax with respect to such gain in generally the same manner as a U.S. person.
Information Reporting and Backup Withholding
We must report annually to the IRS and to each non-U.S. holder the amount of distributions on our common stock paid to such holder and the amount, if any, of tax withheld with respect to those distributions. These information reporting requirements will apply in certain circumstances even if no withholding is required, such as where the distributions are effectively connected with the holder’s conduct of a U.S. trade or business or
79
Table of Contents
withholding is reduced or eliminated by an applicable income tax treaty. This information also may be made available under a specific treaty or agreement with the tax authorities in the country in which the non-U.S. holder resides or is established. Backup withholding, however, generally will not apply to distributions to a non-U.S. holder of our common stock provided the non-U.S. holder furnishes to us or our paying agent the required certification as to its non-U.S. status, such as by providing a valid IRS Form W-8BEN or IRS Form W-8ECI, or certain other requirements are met. Notwithstanding the foregoing, backup withholding may apply if either we or our paying agent has actual knowledge, or reason to know, that the holder is a U.S. person that is not an exempt recipient.
Unless a non-U.S. holder complies with certification procedures to establish that it is not a U.S. person, information returns may be filed with the IRS in connection with, and the non-U.S. holder may be subject to backup withholding on the proceeds from, a sale or other disposition of our common stock. The certification procedures described in the above paragraph will satisfy these certification requirements as well.
Backup withholding is not an additional tax. Any amounts withheld under the backup withholding rules may be allowed as a refund or a credit against a non-U.S. holder’s U.S. federal income tax liability, provided the required information is timely furnished to the IRS.
Additional Withholding Tax on Payments Made to Foreign Accounts
Withholding taxes may be imposed under the Foreign Account Tax Compliance Act (“FATCA”) on certain types of payments made to non-U.S. financial institutions and certain other non-U.S. entities. Specifically, a 30% withholding tax may be imposed on dividends on, or gross proceeds from the sale or other disposition of, our common stock paid to a “foreign financial institution” or a “non-financial foreign entity” (each as defined in the Code), unless (1) the foreign financial institution undertakes certain diligence and reporting obligations, (2) the non-financial foreign entity either certifies it does not have any “substantial United States owners” (as defined in the Code) or furnishes identifying information regarding each substantial United States owner, or (3) the foreign financial institution or non-financial foreign entity otherwise qualifies for an exemption from these rules. If the payee is a foreign financial institution and is subject to the diligence and reporting requirements in (1) above, it must enter into an agreement with the U.S. Department of the Treasury requiring, among other things, that it undertake to identify accounts held by certain “specified United States persons” or “United States-owned foreign entities” (each as defined in the Code), annually report certain information about such accounts, and withhold 30% on payments to non-compliant foreign financial institutions and certain other account holders. Foreign financial institutions located in jurisdictions that have an intergovernmental agreement with the United States governing FATCA may be subject to different rules.
Under the applicable Treasury Regulations, withholding under FATCA generally will apply to payments of dividends on our common stock made on or after January 1, 2014 and to payments of gross proceeds from the sale or other disposition of such stock on or after January 1, 2017. Prospective investors should consult their tax advisors regarding the potential application of withholding under FATCA to their investment in our common stock.
80
Table of Contents
The validity of the shares of common stock offered by this prospectus will be passed upon for us by Latham & Watkins LLP, Houston, Texas.
The consolidated balance sheets of Green Field Energy Services, Inc. (the Company or Successor), formerly Green Field Energy Services, LLC, as of December 31, 2012 and 2011, and the related consolidated statements of operations, equity, and cash flows for the year ended December 31, 2012 and the period from May 1, 2011 to December 31, 2011, and the related consolidated statements of operations, equity and cash flows for the period from January 1, 2011 to April 30, 2011 of Hub City Industries, LLC (Predecessor), in this Prospectus and registration statement have been audited by Ernst & Young LLP, independent registered public accounting firm, as set forth in their report thereon (which contains an explanatory paragraph describing conditions that raise substantial doubt about the Company’s ability to continue as a going concern as described in Note 2 to the consolidated financial statements) appearing elsewhere herein, and are included in reliance upon such report given the authority of such firm as experts in accounting and auditing.
Information included in this prospectus regarding our estimated quantities of sand reserves was obtained from a report prepared by Westward Environmental, Inc., independent geophysical engineers with respect to Green Field Energy Services, Inc.
Where You Can Find More Information
We have filed with the SEC a registration statement on Form S-1 with respect to the common stock being offered for resale by this prospectus. This prospectus does not contain all of the information found in the registration statement. For further information regarding us and the common stock offered for resale by this prospectus, please review the full registration statement, including its exhibits.] The registration statement, including the exhibits, may be inspected and copied at the public reference facilities maintained by the SEC at 100 F Street, N.E., Washington D.C. 20549. Copies of this material can also be obtained from the public reference section of the SEC at prescribed rates, or accessed at the SEC’s website at www.sec.gov. Please call the SEC at 1-800-SEC-0330 for further information on its public reference room.
The SEC’s proxy rules and regulations do not, nor do the rules of any stock exchange, require us to send an annual report to security holders. Upon the effectiveness of this registration statement, we will become subject to the Exchange Act’s periodic reporting requirements, including the requirement to file current, annual and quarterly reports with the SEC. The annual reports we file will contain financial information that has been audited and reported on, with an opinion by an independent certified public accounting firm.
81
Table of Contents
| ITEM 8. | FINANCIAL STATEMENTS AND SUPPLEMENTARY DATA |
Green Field Energy Services, Inc.
INDEX TO CONSOLIDATED FINANCIAL STATEMENTS
F-1
Table of Contents
GREEN FIELD ENERGY SERVICES, INC.
UNAUDITED CONSOLIDATED BALANCE SHEETS
| DECEMBER 31, 2012 |
MARCH 31, 2013 |
|||||||
| Assets |
||||||||
| Current assets: |
||||||||
| Cash |
$ | 8,433,539 | $ | 5,535,374 | ||||
| Accounts receivable—net of allowance |
27,595,658 | 33,879,645 | ||||||
| Other receivables |
287,146 | 264,205 | ||||||
| Note receivable |
282,000 | — | ||||||
| Due from related parties |
— | 48,219 | ||||||
| Inventory |
19,644,715 | 18,346,756 | ||||||
| Prepaid expenses and other current assets |
10,350,644 | 9,710,257 | ||||||
|
|
|
|
|
|||||
| Total current assets |
66,593,702 | 67,784,456 | ||||||
| Property, plant and equipment: |
||||||||
| Property and equipment |
222,943,295 | 257,680,965 | ||||||
| Construction in progress |
44,222,576 | 13,075,376 | ||||||
|
|
|
|
|
|||||
| Total property, plant and equipment |
267,165,871 | 270,756,341 | ||||||
| Less accumulated depreciation |
(25,434,890 | ) | (34,896,993 | ) | ||||
|
|
|
|
|
|||||
| Net property, plant and equipment |
241,730,981 | 235,859,348 | ||||||
|
|
|
|
|
|||||
| Other assets: |
||||||||
| Deposits |
26,372,479 | 30,549,078 | ||||||
| Loan costs—net of accumulated amortization |
8,177,422 | 7,714,639 | ||||||
| Intangible assets—net of accumulated amortization |
10,396,416 | 10,159,145 | ||||||
| Goodwill |
5,647,335 | 5,647,335 | ||||||
|
|
|
|
|
|||||
| Total other assets |
50,593,652 | 54,070,197 | ||||||
|
|
|
|
|
|||||
| Total assets |
$ | 358,918,335 | $ | 357,714,001 | ||||
|
|
|
|
|
|||||
| Liabilities and Stockholders’ Equity |
||||||||
| Current liabilities: |
||||||||
| Accounts payable |
$ | 30,408,847 | $ | 50,153,441 | ||||
| Accrued liabilities |
22,458,837 | 29,035,543 | ||||||
| Notes payable |
1,230,179 | 557,964 | ||||||
| Current portion of long-term debt |
52,229,548 | 58,540,904 | ||||||
| Current portion of capital lease obligation |
1,118,108 | 1,154,647 | ||||||
| Current earn-out payable |
1,078,204 | 1,396,935 | ||||||
| Deferred income |
2,916,282 | 2,350,796 | ||||||
|
|
|
|
|
|||||
| Total current liabilities |
111,440,005 | 143,190,230 | ||||||
| Long-term liabilities: |
||||||||
| Long-term debt, net of current portion |
236,681,828 | 227,209,869 | ||||||
| Capital lease obligation, net of current portion |
5,052,797 | 4,750,066 | ||||||
| Earn-out payable, net of current portion |
12,923,959 | 13,353,746 | ||||||
|
|
|
|
|
|||||
| Total long-term liabilities |
254,658,584 | 245,313,681 | ||||||
| Stockholders’ equity (deficit): |
||||||||
| Common stock—$.01 par value, authorized 2,000,000 shares, issued and outstanding, 1,400,000 shares |
14,000 | 14,000 | ||||||
| Preferred stock—$.01 par value, authorized 150,000 shares, issued and outstanding, 0 and 115,664 shares, respectively |
1,000 | 1,157 | ||||||
| Additional paid in capital |
93,954,335 | 95,520,639 | ||||||
| Accumulated deficit |
(101,149,589 | ) | (126,325,706 | ) | ||||
|
|
|
|
|
|||||
| Total stockholders’ equity (deficit) |
(7,180,254 | ) | (30,789,910 | ) | ||||
|
|
|
|
|
|||||
| Total liabilities and stockholders’ equity (deficit) |
$ | 358,918,335 | $ | 357,714,001 | ||||
|
|
|
|
|
|||||
The accompanying notes are an integral part of these consolidated financial statements.
F-2
Table of Contents
GREEN FIELD ENERGY SERVICES, INC.
UNAUDITED CONSOLIDATED STATEMENTS OF OPERATIONS
| THREE MONTHS ENDED MARCH 31, 2012 |
THREE MONTHS ENDED MARCH 31, 2013 |
|||||||
| Revenue |
$ | 6,277,462 | $ | 68,375,103 | ||||
| Operating costs: |
||||||||
| Costs of revenue |
11,211,801 | 64,873,244 | ||||||
| Selling and administrative expenses |
5,514,800 | 6,501,489 | ||||||
| Depreciation and amortization |
3,084,943 | 9,849,169 | ||||||
|
|
|
|
|
|||||
| Total operating costs |
19,811,544 | 81,223,902 | ||||||
|
|
|
|
|
|||||
| Income (loss) from operations |
(13,534,082 | ) | (12,848,799 | ) | ||||
| Other income (expense): |
||||||||
| Interest expense |
(5,517,435 | ) | (12,975,431 | ) | ||||
| Other income (expense) |
(5,798 | ) | (111,068 | ) | ||||
|
|
|
|
|
|||||
| Net other expense |
(5,523,233 | ) | (13,086,499 | ) | ||||
|
|
|
|
|
|||||
| Income (loss) before provision for income tax |
(19,057,315 | ) | (25,935,298 | ) | ||||
| Income tax expense (benefit) |
(2,475,835 | ) | (759,181 | ) | ||||
|
|
|
|
|
|||||
| Net income (loss) |
$ | (16,581,480 | ) | $ | (25,176,117 | ) | ||
|
|
|
|
|
|||||
| Basic and diluted net loss per share of common stock: |
||||||||
| Net loss per share of common stock |
$ | (11.84 | ) | $ | (17.98 | ) | ||
| Basic and diluted average common shares outstanding: |
||||||||
| Basic and diluted |
1,400,000 | 1,400,000 | ||||||
The accompanying notes are an integral part of these consolidated financial statements.
F-3
Table of Contents
GREEN FIELD ENERGY SERVICES, INC.
UNAUDITED CONSOLIDATED STATEMENTS OF CASH FLOWS
| THREE MONTHS ENDED MARCH 31, 2012 |
THREE MONTHS ENDED MARCH 31, 2013 |
|||||||
| Cash flows from operating activities: |
||||||||
| Net income (loss) |
$ | (16,581,480 | ) | $ | (25,176,117 | ) | ||
| Adjustments to reconcile net income (loss) to net cash provided (used) by operating activities: |
||||||||
| Depreciation and amortization |
3,084,943 | 9,849,169 | ||||||
| Change in fair value of earn-out payable |
(83,999 | ) | 748,518 | |||||
| (Gain) Loss on sale of assets |
(30,494 | ) | 125,009 | |||||
| Deferred income taxes |
(2,478,000 | ) | — | |||||
| Loan cost amortization |
184,977 | 262,783 | ||||||
| Discount accretion |
2,534,809 | 2,395,948 | ||||||
| (Increase) decrease in: |
||||||||
| Accounts receivable |
(1,958,042 | ) | (6,283,988 | ) | ||||
| Other receivables |
(328,861 | ) | 22,941 | |||||
| Inventory |
(19,733,229 | ) | 1,297,959 | |||||
| Prepaid expenses |
(4,167,554 | ) | 840,387 | |||||
| Other assets |
(3,496,522 | ) | (3,857,553 | ) | ||||
| Increase (decrease) in: |
||||||||
| Accounts payable |
7,968,601 | 19,744,594 | ||||||
| Accrued expenses |
7,194,659 | 9,944,393 | ||||||
| Deferred income |
— | 18,160 | ||||||
|
|
|
|
|
|||||
| Total adjustments |
(11,308,712 | ) | 35,108,320 | |||||
|
|
|
|
|
|||||
| Net cash provided (used) by operating activities |
(27,890,192 | ) | 9,932,203 | |||||
|
|
|
|
|
|||||
| Cash flows from investing activities: |
||||||||
| Cash payments for the purchase of property, plant and equipment |
(44,269,345 | ) | (9,960,452 | ) | ||||
| Proceeds from the sale of property |
190,325 | 2,690,446 | ||||||
|
|
|
|
|
|||||
| Net cash used by investing activities |
(44,079,020 | ) | (7,270,006 | ) | ||||
|
|
|
|
|
|||||
| Cash flows from financing activities: |
||||||||
| Due to/from owners and affiliates |
(229,671 | ) | (48,219 | ) | ||||
| Proceeds from issuance of debt |
3,000,467 | 59,200 | ||||||
| Proceeds from sale of preferred stock |
— | 1,566,461 | ||||||
| Principal payments on long-term debt |
(77,237 | ) | (7,137,804 | ) | ||||
|
|
|
|
|
|||||
| Net cash (used) provided by financing activities |
2,693,559 | (5,560,362 | ) | |||||
|
|
|
|
|
|||||
| Net decrease in cash |
(69,275,653 | ) | (2,898,165 | ) | ||||
| CASH AND CASH EQUIVALENTS, beginning of year |
87,118,385 | 8,433,539 | ||||||
|
|
|
|
|
|||||
| CASH AND CASH EQUIVALENTS, end of year |
$ | 17,842,732 | $ | 5,535,374 | ||||
|
|
|
|
|
|||||
| SUPPLEMENTAL DISCLOSURES OF CASH FLOW INFORMATION: |
||||||||
| Interest paid, net of capitalized interest |
$ | 16,596 | $ | 268,617 | ||||
|
|
|
|
|
|||||
| Income taxes paid |
$ | 2,165 | $ | 15,462 | ||||
|
|
|
|
|
|||||
The accompanying notes are an integral part of these consolidated financial statements.
F-4
Table of Contents
Green Field Energy Services, Inc.
Notes to Unaudited Consolidated Financial Statements
| NOTE 1 DESCRIPTION | OF BUSINESS AND SUMMARY OF SIGNIFICANT ACCOUNTING POLICIES |
Description of Business
Formed in 1969, the Company, as defined below is an independent oilfield services company that provides a wide range of pressure pumping related services to oil and natural gas drilling and production companies in Louisiana and Texas to help develop and enhance the production of hydrocarbons. The Company also manufactures equipment for use in the power generation industry.
The Company’s traditional oilfield pumping services included cementing, coiled tubing, pressure pumping, acidizing, and other pumping services. In December 2010, the Company began providing hydraulic fracturing pumping services as a part of its portfolio of services provided to its existing well pressure pumping customers using its own internally produced turbine-powered hydraulic fracturing units. To support its hydraulic fracturing operations, it has also entered into two long-term leases during 2011 for sand mines in Louisiana and Mississippi. These mines are expected to supply a portion of its fracturing sand needs and provide the Company the opportunity to sell fracturing sand to third parties.
In March 2013, the Company began manufacturing power generation equipment for sale to Turbine Generation Services, LLC (TGS), a related party—see Note 4.
The Company currently provides services to a diverse group of major and large independent oil and natural gas companies.
Basis of Presentation
These unaudited consolidated interim financial statements have been prepared in accordance with accounting principles generally accepted in the United States for interim financial information and with the instructions to Form 10-Q and Article 10 of Regulation S-X. Accordingly, they do not include all of the information and footnotes required by accounting principles generally accepted in the United States for complete financial statements. In the opinion of management, all adjustments (consisting of normal recurring adjustments) considered necessary for a fair presentation have been included. Operating results for the three-month period ended March 31, 2013 are not necessarily indicative of the results that may be expected for the year ended December 31, 2013.
For further information, refer to the consolidated financial statements and footnotes thereto included in the Company’s Annual Report for the year ended December 31, 2012.
Principles of Consolidation
The accompanying financial statements include the consolidated accounts of Green Field Energy Services, Inc., a Delaware corporation (formerly Hub City Industries, LLC, Green Field Energy Services, LLC, and Green Field Energy Services, Inc., a Louisiana corporation), Hub City Tools, Inc., and Proppant One, Inc. These companies are collectively hereafter referred to as the Company. The Company consolidates majority owned subsidiaries and any variable interest entities (VIEs) of which it is the primary beneficiary. When it does not have a controlling interest in an entity, but exerts a significant influence over the entity, it applies the equity method of accounting. The cost method is used when it does not have the ability to exert significant influence. All significant inter-company balances and transactions have been eliminated in the consolidated statements.
The Company’s investment in its joint venture was $1,231,380 as of December 31, 2012 and March 31, 2013. Due to the level of financial involvement of the Company, TPT meets the definition of a variable interest entity and the Company is the primary beneficiary of the venture. Accordingly, the Company consolidates this
F-5
Table of Contents
interest with its investment classified as property, plant and equipment on the balance sheet since these contributions were used by the venture to purchase equipment.
| NOTE | 2 GOING CONCERN |
The accompanying consolidated financial statements have been prepared assuming that the Company will continue as a going concern. The Company has incurred recurring losses from operations, including a loss of approximately $25.2 million for the three months ended March 31, 2013, and has a net working capital deficiency of approximately $75.4 million as of March 31, 2013, that raise substantial doubt about its ability to continue as a going concern. The consolidated financial statements do not include any adjustments that might result from the outcome of this uncertainty. Management’s plans with regards to the uncertainty include obtaining a short term debt facility; raising additional capital; improving operating margins through cost reduction initiatives, revenue enhancements and new product offerings; and pursuing further revisions to its senior notes payable under its primary debt facility as were obtained in 2012.
During the latter half of 2012 and through May 2013, management has been pursuing a $30.0 million short term debt facility as well negotiating with several outside parties to raise capital for the Company. Management believes the $30.0 million debt facility together with the additional capital would be sufficient for the Company to meet its net working capital deficit and provide sufficient funds to allow the Company to meet its existing obligations and commitments and also allow the Company to continue with the expansion of its frac spread units currently in process of assembly. There can be no assurances that either a short term debt facility or additional capital from outside investors will successfully be obtained on terms that management feels is appropriate.
In addition, management has evaluated its operational structure and its existing contractual arrangements. It has implemented certain cost reduction and revenue improvement initiatives that management believes will allow for an improvement in its margins being generated from operations. The Company successfully implemented revisions to a large service contract that allows for an increase in pricing, which became effective March 9, 2013, that management believes will be sufficient to provide positive operating margins to the Company under the terms of this contract. During the three months ended March 31, 2012 and the three months ended March 31, 2013, the Company earned revenues of approximately $1.7 million and $60.2 million, respectively, from this customer. In 2012, the Company was adversely impacted by the sudden and severe increase in the price of guar. Guar is one of the primary components that is used to complete the fracing of an oil and gas field. As part of a separate contract amendment with the same customer, effective October 2012, the Company was able to obtain price adjustments which management believes will allow it to effectively pass the price of this commodity through to the underlying customer. In addition, the Company made a decision in December 2012, to close its Weatherford, Texas location and consolidate these operations at its Pleasanton, Texas location. The Company is also expanding its product offerings to include selective sale of turbine-powered equipment to third parties.
During 2012, the Company successfully obtained several amendments to its senior notes payable. Management is evaluating the possibility of obtaining other amendments with the objective of reducing its annual cash requirements under the indenture. There can be no assurances that any additional amendments will be obtained that would enable the Company to reduce its annual cash requirements under the indenture.
| NOTE | 3 INCOME TAXES |
The Company typically provides for income taxes at a statutory rate of 35% adjusted for permanent differences expected to be realized. As a result of prior period losses the Company has determined it is not more likely than not that its net deferred to asset is recoverable. Accordingly, the Company established a full valuation allowance for its net deferred tax asset.
F-6
Table of Contents
NOTE 4 RELATED PARTY TRANSACTIONS
Related parties of the Company include the following entities: MMR, LLC (MMR), MOR MGH, LLC (MOR), Elle Investments, LLC, Marine Turbine Technology, L.L.C. (MTT), Alliance Consulting Group, LLC, Aerodynamic, LLC, Casafin II, LLC, Chemrock Technology, L.L.C., Moreno Properties, LLC, Dynamic Industries, Shale Support Services, LLC (SSS) and Turbine Generation Services, LLC (TGS).
Related party transactions included the following for the three month period ended March 31, 2013:
| Reimbursements |
||||
| M. Moreno |
$ | 64,647 | ||
|
|
|
|||
| Assembly charges |
||||
| Turbine Powered Technology, LLC |
$ | 857,261 | ||
|
|
|
|||
| Inventory purchases |
||||
| Shale Support Services, LLC |
$ | 2,003,866 | ||
| ChemRock Technology, L.L.C |
7,533,934 | |||
| Turbine Powered Technology, LLC |
161,963 | |||
|
|
|
|||
| $ | 9,699,763 | |||
|
|
|
|||
| Aircraft lease payments |
||||
| Aerodynamic, LLC |
$ | 165,000 | ||
|
|
|
|||
| Flight charges |
||||
| Moreno Properties, LLC |
$ | 137,432 | ||
| Casafin II, LLC |
566,896 | |||
|
|
|
|||
| $ | 704,328 | |||
|
|
|
|||
| Services purchased |
||||
| Turbine Powered Technology, LLC |
$ | 2,122,785 | ||
|
|
|
|||
| Inventory Sales |
||||
| Turbine Generation Services, LLC |
$ | 2,298,000 | ||
|
|
|
Shale Support Services, LLC
In January 2013, the Company began procuring raw frac sand from Shale Support Services, LLC (SSS) on an open account basis. SSS is controlled by the Company’s Chairman and Chief Executive Officer, Michel B. Moreno. As of March 31, 2013 the Company owed SSS $394,455. The Company’s agreement with Alliance Consulting Group, LLC is in the process of being assumed by SSS.
Turbine Generation Services, LLC
In March of 2013, the Company sold components for power generation equipment to Turbine Generation Services, LLC (TGS). TGS is owned by MOR DOH Holdings, LLC, an entity controlled by the Company’s Chairman and Chief Executive Officer, Michel B. Moreno. As of March 31, 2013 the Company had no amounts owed to it by TGS.
NOTE 5 COMMITMENTS AND CONTINGENCIES
Sand Purchase Agreement
During 2011, the Company made arrangements to acquire 300,000 tons of northern white sand per year for four years from Great Northern Sand, LLC (GNS), with monthly deliveries expected to begin in September 2012 and
F-7
Table of Contents
to continue through June 2016. The Company has made aggregate advance payemnts of $15 million towards the purchase price of the sand which are included within deposits until sand is accepted under the agreement. No additional advances are required under this agreement. The Company began taking delivery of sand in November 2012 and has commitments to take delivery of 300,000 tons per year through June 2016. If the Company does not take delivery of 300,000 tons per year, it is required to pay the counterparty for any shortfall in deliveries at the normal contractual rate. The Company is allowed to recoup this amount in the following year by taking delivery of the corresponding tonnage of sand. The Company will pay GNS a monthly fee per ton of sand delivered. The payment of the per ton fees will be offset by a certain amount per ton until such time that the $15 million of advance payments have been fully amortized. The amount of these advance payments expected to be realized within twelve months of the balance sheet date, approximately $3.6 million, is classified within other current assets at March 31, 2013. The remaining balance of $11.3 million is classified within deposits as a component of long-term assets at March 31, 2013.
NOTE 6 FAIR VALUE MEASUREMENTS
Fair Value Measurements
ASC 820, Fair Value Measurements and Disclosures (ASC 820), establishes a hierarchy that prioritizes inputs to valuation techniques used to measure fair value and requires companies to disclose the fair value of their financial instruments according to a fair value hierarchy (i.e., Level 1, 2, and 3 inputs, as defined). The fair value hierarchy gives the highest priority to quoted prices (unadjusted) in active markets for identical assets or liabilities and the lowest priority to unobservable inputs. Additionally, companies are required to provide enhanced disclosure regarding instruments in the Level 3 category (which use inputs to the valuation techniques that are unobservable and require significant management judgment), including a reconciliation of the beginning and ending balances separately for each major category of assets and liabilities.
Financial instruments measured and reported at fair value are classified and disclosed in one of the following categories:
Level 1 Inputs — Quoted prices (unadjusted) in active markets for identical assets or liabilities at the reporting date.
Level 2 Inputs — Quoted prices for similar assets or liabilities in active markets; quoted prices for identical or similar assets or liabilities that are not active; and inputs other than quoted market prices that are observable, such as models or other valuation methodologies.
Level 3 Inputs — Unobservable inputs for the valuation of the asset or liability. Level 3 include assets or liabilities for which there is little, if any, market activity. These inputs require significant management judgment or estimation.
Assets and liabilities measured at fair value on a recurring basis at March 31, 2013 were as follows:
| Quoted Prices in Active Markets for Identical Assets (Level 1) |
Significant Other Observable Inputs (Level 2) |
Significant Unobservable Inputs (Level 3) |
Total March 31, 2013 |
|||||||||||||
| Assets |
$ | — | $ | — | $ | — | $ | — | ||||||||
|
|
|
|
|
|
|
|
|
|||||||||
| Liabilities |
||||||||||||||||
| Earn-out payable |
$ | — | $ | — | $ | 14,750,681 | $ | 14,750,681 | ||||||||
|
|
|
|
|
|
|
|
|
|||||||||
The fair value of the earn-out payable is determined using the estimated cash flows related to the Company’s revenue that is projected to be earned from the Company’s TDE (Turbine Driven Equipment). These cash flows
F-8
Table of Contents
are discounted using a discount rate that reflects the nature of the investment and the risk of the cash flows associated with the instrument adjusted at each reporting period. The Company used a discount rate of 14.2% and 13.6% for the fair value calculation as of December 31, 2012 and March 31, 2013, respectively. The Company’s calculation as of March 31, 2013 incorporated three months of accretion from the calculation as of December 31, 2012. The change in discount rate and accretion resulted in a net increase to the fair value of the contingent consideration as of March 31, 2013.
There were no other significant changes to inputs used in the calculation as of March 31, 2013. The earn-out payable is classified as Level 3 within the fair value hierarchy.
The changes in Level 3 fair value measurements that are measured at fair value on a recurring basis were as follows:
| Earn-out payable | ||||
| Earn-out payable, December 31, 2012 |
$ | 14,002,163 | ||
| Net change in fair value recognized as interest expense |
748,518 | |||
| Payments |
— | |||
|
|
|
|||
| Earn-out payable, March 31, 2013 |
$ | 14,750,681 | ||
|
|
|
|||
The fair value of cash and cash equivalents and our variable rate debt approximated book value at December 31, 2012 and March 31, 2013. The fair value of our senior notes due 2016 approximated $247.1 million at December 31, 2012 and $251.9 million at March 31, 2013. We used Level 3 inputs consistent with those used in our fair value measurement of the earn-out payable discussed above.
NOTE 7 EARNINGS PER SHARE
The Company had a net loss from operations for the three months ended March 31, 2013 and for the three months ended March 31, 2012. Accordingly, the Company’s diluted per share calculation for these periods was equivalent to its basic net loss per share calculation because it excluded the assumed exercise of the warrants. These instruments were excluded for these periods because they were considered to be anti-dilutive, meaning their inclusion would have reduced the reported net loss per share for these periods. The excluded warrants totaled 250,000 and would convert into 247,059 shares of common stock, if exercised. The Company’s outstanding preferred stock is not entitled to any dividends.
NOTE 8 SUBSEQUENT EVENTS
Management has evaluated subsequent events through May 20, 2013.
In April 2013, in connection with the Company’s management incentive plan, the Board of Directors authorized the issuance of 124,446 shares of common stock of the Company to the Company’s President, Enrique “Rick” Fontova, effective April 2013. The Board of Directors also authorized the Company to reimburse Mr. Fontova for the tax liability he experiences as a result of the issuance of the 124,446 shares of common stock as the Company intends such issuance to be income tax neutral to Mr. Fontova. The Company has not yet completed its analysis with regards to the valuation of the shares issued or the resulting income tax liability. The Company will recognize compensation expense related to the shares issued as well as an increase to stockholder’s equity during the second quarter. The Company will also accrue during the second quarter a liability associated with the estimated tax liability, which will also result in an increase to compensation expense.
F-9
Table of Contents
NOTE 9 GUARANTOR FINANCIAL STATEMENTS
The following condensed consolidating financial information includes information regarding Green Field Energy Services, Inc. (GFES), as parent, and Hub City Tools, Inc. (HCT), as guarantor. Included are the condensed consolidating balance sheets at December 31, 2012 and March 31, 2013 and the related condensed consolidated statements of operations and cash flow for the three months years ended at March 31, 2012 and March 31, 2013, which should be read in conjunction with the notes included herein and the notes to the audited consolidated financial statements included in the Company’s Annual Report for the year ended December 31, 2012.
F-10
Table of Contents
GREEN FIELD ENERGY SERVICES, INC.
UNAUDITED CONDENSED CONSOLIDATED BALANCE SHEETS
| GFES | HCT | Eliminating | Consolidated GFES |
|||||||||||||
| MARCH 31, 2013 |
MARCH 31, 2013 |
MARCH 31, 2013 |
||||||||||||||
| Assets |
||||||||||||||||
| Current assets: |
||||||||||||||||
| Cash |
$ | 5,529,312 | $ | 6,062 | $ | 5,535,374 | ||||||||||
| Accounts receivable—net of allowance |
33,879,645 | — | 33,879,645 | |||||||||||||
| Other receivables |
261,411 | 2,794 | 264,205 | |||||||||||||
| Due from related parties |
344,421 | — | $ | (296,202 | ) | 48,219 | ||||||||||
| Inventory |
18,346,756 | — | 18,346,756 | |||||||||||||
| Prepaid expenses |
9,709,210 | 1,047 | 9,710,257 | |||||||||||||
|
|
|
|
|
|
|
|
|
|||||||||
| Total current assets |
68,070,755 | 9,903 | (296,202 | ) | 67,784,456 | |||||||||||
| Property, plant and equipment: |
||||||||||||||||
| Property and equipment |
257,060,693 | 620,272 | 257,680,965 | |||||||||||||
| Construction in progress |
13,075,376 | — | 13,075,376 | |||||||||||||
|
|
|
|
|
|
|
|
|
|||||||||
| Total property, plant and equipment |
270,136,069 | 620,272 | — | 270,756,341 | ||||||||||||
| Less accumulated depreciation |
(34,718,049 | ) | (178,944 | ) | (34,896,993 | ) | ||||||||||
|
|
|
|
|
|
|
|
|
|||||||||
| Net property, plant and equipment |
235,418,020 | 441,328 | — | 235,859,348 | ||||||||||||
|
|
|
|
|
|
|
|
|
|||||||||
| Other assets: |
||||||||||||||||
| Deposits |
30,545,878 | 3,200 | 30,549,078 | |||||||||||||
| Loan costs—net of accumulated amortization |
7,714,639 | — | 7,714,639 | |||||||||||||
| Intangible assets |
10,159,145 | — | 10,159,145 | |||||||||||||
| Goodwill |
5,647,335 | — | 5,647,335 | |||||||||||||
|
|
|
|
|
|
|
|
|
|||||||||
| Total other assets |
54,066,997 | 3,200 | — | 54,070,197 | ||||||||||||
|
|
|
|
|
|
|
|
|
|||||||||
| Total assets |
$ | 357,555,772 | $ | 454,431 | $ | (296,202 | ) | $ | 357,714,001 | |||||||
|
|
|
|
|
|
|
|
|
|||||||||
| Liabilities and Stockholders’ Equity |
||||||||||||||||
| Current liabilities: |
||||||||||||||||
| Accounts payable |
$ | 50,153,441 | $ | — | $ | 50,153,441 | ||||||||||
| Accrued liabilities |
29,035,543 | — | 29,035,543 | |||||||||||||
| Notes payable |
557,964 | — | 557,964 | |||||||||||||
| Current portion of long-term debt |
58,540,904 | — | 58,540,904 | |||||||||||||
| Current portion of capital lease obligation |
1,154,647 | — | 1,154,647 | |||||||||||||
| Current earn-out payable |
1,396,935 | — | 1,396,935 | |||||||||||||
| Due to related parties |
— | 296,202 | $ | (296,202 | ) | — | ||||||||||
| Deferred income |
2,350,796 | — | 2,350,796 | |||||||||||||
|
|
|
|
|
|
|
|
|
|||||||||
| Total current liabilities |
143,190,230 | 296,202 | (296,202 | ) | 143,190,230 | |||||||||||
| Long-term liabilities: |
||||||||||||||||
| Long-term debt, net of current portion |
227,209,869 | — | 227,209,869 | |||||||||||||
| Capital lease obligation, net of current portion |
4,750,066 | — | 4,750,066 | |||||||||||||
| Earn-out payable, net of current portion |
13,353,746 | — | 13,353,746 | |||||||||||||
|
|
|
|
|
|
|
|
|
|||||||||
| Total long-term liabilities |
245,313,681 | — | — | 245,313,681 | ||||||||||||
| Stockholders’ equity: |
||||||||||||||||
| Common stock—$.01 par value, authorized 2,000,000 shares, issued and outstanding, 1,400,000 shares |
14,000 | — | 14,000 | |||||||||||||
| Preferred stock—$.01 par value, authorized 150,000 shares, issued and outstanding, 0 and 100,000 shares, respectively |
1,157 | — | 1,157 | |||||||||||||
| Additional paid in capital |
95,520,639 | — | 95,520,639 | |||||||||||||
| Accumulated deficit |
(126,483,935 | ) | 158,229 | (126,325,706 | ) | |||||||||||
|
|
|
|
|
|
|
|
|
|||||||||
| Total stockholders’ equity |
(30,948,139 | ) | 158,229 | — | (30,789,910 | ) | ||||||||||
|
|
|
|
|
|
|
|
|
|||||||||
| Total liabilities and stockholders’ equity |
$ | 357,555,772 | $ | 454,431 | $ | (296,202 | ) | $ | 357,714,001 | |||||||
|
|
|
|
|
|
|
|
|
|||||||||
The accompanying notes are an integral part of these unaudited consolidated financial statements
F-11
Table of Contents
GREEN FIELD ENERGY SERVICES, INC.
UNAUDITED CONDENSED CONSOLIDATED STATEMENTS OF OPERATIONS
| GFES | HCT | Consolidated GFES |
||||||||||
| THREE MONTHS ENDED MARCH 31, 2013 |
THREE MONTHS ENDED MARCH 31, 2013 |
THREE MONTHS ENDED MARCH 31, 2013 |
||||||||||
| Revenue |
$ | 68,375,103 | $ | — | $ | 68,375,103 | ||||||
| Operating costs: |
||||||||||||
| Costs of revenue |
64,873,244 | — | 64,873,244 | |||||||||
| Selling and administrative expenses |
6,501,489 | — | 6,501,489 | |||||||||
| Depreciation and amortization |
9,849,169 | — | 9,849,169 | |||||||||
|
|
|
|
|
|
|
|||||||
| Total operating costs |
81,223,902 | — | 81,223,902 | |||||||||
|
|
|
|
|
|
|
|||||||
| Loss from operations |
(12,848,799 | ) | — | (12,848,799 | ) | |||||||
| Other expense: |
||||||||||||
| Interest expense |
(12,975,431 | ) | — | (12,975,431 | ) | |||||||
| Other expense |
(111,068 | ) | — | (111,068 | ) | |||||||
|
|
|
|
|
|
|
|||||||
| Net other expense |
(13,086,499 | ) | — | (13,086,499 | ) | |||||||
|
|
|
|
|
|
|
|||||||
| Loss before provision for income tax |
(25,935,298 | ) | — | (25,935,298 | ) | |||||||
| Income tax expense (benefit) |
(758,344 | ) | (837 | ) | (759,181 | ) | ||||||
|
|
|
|
|
|
|
|||||||
| Net (loss) income |
$ | (25,176,954 | ) | $ | 837 | $ | (25,176,117 | ) | ||||
|
|
|
|
|
|
|
|||||||
The accompanying notes are an integral part of these unaudited consolidated financial statements.
F-12
Table of Contents
GREEN FIELD ENERGY SERVICES, INC.
UNAUDITED CONDENSED CONSOLIDATED STATEMENTS OF CASH FLOWS
| GFES | HCT | Consolidated GFES |
||||||||||
| THREE MONTHS ENDED MARCH 31, 2013 |
THREE MONTHS ENDED MARCH 31, 2013 |
THREE MONTHS ENDED MARCH 31, 2013 |
||||||||||
| CASH FLOWS FROM OPERATING ACTIVITIES |
||||||||||||
| Net cash provided by operating activities |
$ | 9,931,416 | $ | 787 | $ | 9,932,203 | ||||||
|
|
|
|
|
|
|
|||||||
| CASH FLOWS FROM INVESTING ACTIVITIES |
||||||||||||
| Net cash used by investing activities |
(7,270,006 | ) | — | (7,270,006 | ) | |||||||
|
|
|
|
|
|
|
|||||||
| CASH FLOWS FROM FINANCING ACTIVITIES |
||||||||||||
| Net cash used by financing activities |
(5,560,362 | ) | — | (5,560,362 | ) | |||||||
|
|
|
|
|
|
|
|||||||
| Net (decrease) increase in cash |
(2,898,952 | ) | 787 | (2,898,165 | ) | |||||||
| CASH AND CASH EQUIVALENTS, beginning of year |
8,428,264 | 5,275 | 8,433,539 | |||||||||
|
|
|
|
|
|
|
|||||||
| CASH AND CASH EQUIVALENTS, end of year |
$ | 5,529,312 | $ | 6,062 | $ | 5,535,374 | ||||||
|
|
|
|
|
|
|
|||||||
| SUPPLEMENTAL DISCLOSURES OF CASH FLOW INFORMATION: |
||||||||||||
| Interest paid |
$ | 268,617 | $ | — | $ | 268,617 | ||||||
|
|
|
|
|
|
|
|||||||
| Income taxes paid |
$ | — | $ | — | $ | 15,462 | ||||||
|
|
|
|
|
|
|
|||||||
The accompanying notes are an integral part of these unaudited consolidated financial statements.
F-13
Table of Contents
GREEN FIELD ENERGY SERVICES, INC.
CONDENSED CONSOLIDATED BALANCE SHEETS
| GFES | HCT | Consolidated GFES |
||||||||||||||
| DECEMBER 31, 2012 |
DECEMBER 31, 2012 |
Eliminating | DECEMBER 31, 2012 |
|||||||||||||
| Assets |
||||||||||||||||
| Current assets: |
||||||||||||||||
| Cash |
$ | 8,428,264 | $ | 5,275 | $ | 8,433,539 | ||||||||||
| Accounts receivable—net of allowance |
27,595,658 | — | 27,595,658 | |||||||||||||
| Other receivables |
284,352 | 2,794 | 287,146 | |||||||||||||
| Note receivable |
282,000 | — | 282,000 | |||||||||||||
| Due from related parties |
296,202 | — | (296,202 | ) | — | |||||||||||
| Inventory |
19,644,715 | — | 19,644,715 | |||||||||||||
| Prepaid expenses |
10,349,597 | 1,047 | 10,350,644 | |||||||||||||
|
|
|
|
|
|
|
|
|
|||||||||
| Total current assets |
66,880,788 | 9,116 | (296,202 | ) | 66,593,702 | |||||||||||
| Property, plant and equipment: |
||||||||||||||||
| Property and equipment |
222,323,023 | 620,272 | 222,943,295 | |||||||||||||
| Construction in progress |
44,222,576 | — | 44,222,576 | |||||||||||||
|
|
|
|
|
|
|
|
|
|||||||||
| Total property, plant and equipment |
266,545,599 | 620,272 | — | 267,165,871 | ||||||||||||
| Less accumulated depreciation |
(25,255,946 | ) | (178,944 | ) | (25,434,890 | ) | ||||||||||
|
|
|
|
|
|
|
|
|
|||||||||
| Net property, plant and equipment |
241,289,653 | 441,328 | — | 241,730,981 | ||||||||||||
|
|
|
|
|
|
|
|
|
|||||||||
| Other assets: |
||||||||||||||||
| Deposits |
26,369,279 | 3,200 | 26,372,479 | |||||||||||||
| Loan costs—net of accumulated amortization |
8,177,422 | — | 8,177,422 | |||||||||||||
| Intangible assets |
10,396,416 | — | 10,396,416 | |||||||||||||
| Goodwill |
5,647,335 | — | 5,647,335 | |||||||||||||
| Other |
— | — | — | |||||||||||||
|
|
|
|
|
|
|
|
|
|||||||||
| Total other assets |
50,590,452 | 3,200 | — | 50,593,652 | ||||||||||||
|
|
|
|
|
|
|
|
|
|||||||||
| Total assets |
$ | 358,760,893 | $ | 453,644 | $ | (296,202 | ) | $ | 358,918,335 | |||||||
|
|
|
|
|
|
|
|
|
|||||||||
| Liabilities and Stockholders’ Equity |
||||||||||||||||
| Current liabilities: |
||||||||||||||||
| Accounts payable |
$ | 30,408,847 | $ | — | $ | 30,408,847 | ||||||||||
| Accrued liabilities |
22,458,837 | — | 22,458,837 | |||||||||||||
| Notes payable |
1,230,179 | — | 1,230,179 | |||||||||||||
| Current portion of long-term debt |
52,229,548 | — | 52,229,548 | |||||||||||||
| Current portion of capital lease obligation |
1,118,108 | — | 1,118,108 | |||||||||||||
| Current earn-out payable |
1,078,204 | — | 1,078,204 | |||||||||||||
| Due to related parties |
— | 296,202 | (296,202 | ) | — | |||||||||||
| Deferred income |
2,916,282 | — | 2,916,282 | |||||||||||||
|
|
|
|
|
|
|
|
|
|||||||||
| Total current liabilities |
111,440,005 | 296,202 | (296,202 | ) | 111,440,005 | |||||||||||
| Long-term liabilities: |
||||||||||||||||
| Long-term debt, net of current portion |
236,681,828 | — | 236,681,828 | |||||||||||||
| Capital lease obligation, net of current portion |
5,052,797 | — | 5,052,797 | |||||||||||||
| Earn-out payable, net of current portion |
12,923,959 | — | 12,923,959 | |||||||||||||
|
|
|
|
|
|
|
|
|
|||||||||
| Total long-term liabilities |
254,658,584 | — | — | 254,658,584 | ||||||||||||
| Stockholders’ equity: |
||||||||||||||||
| Common stock—$.01 par value, authorized 2,000,000 shares, issued and outstanding, 1,400,000 shares |
14,000 | — | 14,000 | |||||||||||||
| Preferred stock—$.01 par value, authorized 150,000 shares, issued and outstanding, 0 and 100,000 shares, respectively |
1,000 | — | 1,000 | |||||||||||||
| Additional paid in capital |
93,954,335 | — | 93,954,335 | |||||||||||||
| Accumulated deficit |
(101,307,031 | ) | 157,442 | (101,149,589 | ) | |||||||||||
|
|
|
|
|
|
|
|
|
|||||||||
| Total stockholders’ equity |
(7,337,696 | ) | 157,442 | — | (7,180,254 | ) | ||||||||||
|
|
|
|
|
|
|
|
|
|||||||||
| Total liabilities and stockholders’ equity |
$ | 358,760,893 | $ | 453,644 | $ | (296,202 | ) | $ | 358,918,335 | |||||||
|
|
|
|
|
|
|
|
|
|||||||||
The accompanying notes are an integral part of these consolidated financial statements
F-14
Table of Contents
GREEN FIELD ENERGY SERVICES, INC.
UNAUDITED CONDENSED CONSOLIDATED STATEMENTS OF OPERATIONS
| GFES | HCT | Consolidated GFES | ||||||||||
| THREE MONTHS ENDED MARCH 31, 2012 |
THREE MONTHS ENDED MARCH 31, 2012 |
THREE MONTHS ENDED MARCH 31, 2012 |
||||||||||
| Revenue |
$ | 6,277,462 | $ | — | $ | 6,277,462 | ||||||
| Operating costs: |
||||||||||||
| Costs of revenue |
11,211,801 | — | 11,211,801 | |||||||||
| Selling and administrative expenses |
5,514,800 | — | 5,514,800 | |||||||||
| Depreciation and amortization |
3,058,102 | 26,841 | 3,084,943 | |||||||||
|
|
|
|
|
|
|
|||||||
| Total operating costs |
19,784,703 | 26,841 | 19,811,544 | |||||||||
|
|
|
|
|
|
|
|||||||
| Loss from operations |
(13,507,241 | ) | (26,841 | ) | (13,534,082 | ) | ||||||
| Other expense: |
||||||||||||
| Interest expense |
(5,517,435 | ) | — | (5,517,435 | ) | |||||||
| Other expense |
(5,798 | ) | — | (5,798 | ) | |||||||
|
|
|
|
|
|
|
|||||||
| Net other expense |
(5,523,233 | ) | — | (5,523,233 | ) | |||||||
|
|
|
|
|
|
|
|||||||
| Loss before provision for income tax |
(19,030,474 | ) | (26,841 | ) | (19,057,315 | ) | ||||||
| Income tax benefit |
(2,475,835 | ) | — | (2,475,835 | ) | |||||||
|
|
|
|
|
|
|
|||||||
| Net loss |
$ | (16,554,639 | ) | $ | (26,841 | ) | $ | (16,581,480 | ) | |||
|
|
|
|
|
|
|
|||||||
The accompanying notes are an integral part of these unaudited consolidated financial statements.
F-15
Table of Contents
GREEN FIELD ENERGY SERVICES, INC.
UNAUDITED CONDENSED CONSOLIDATED STATEMENTS OF CASH FLOWS
| GFES | HCT | Consolidated GFES | ||||||||||
| THREE MONTHS ENDED MARCH 31, 2012 |
THREE MONTHS ENDED MARCH 31, 2012 |
THREE MONTHS ENDED MARCH 31, 2012 |
||||||||||
| CASH FLOWS FROM OPERATING ACTIVITIES |
||||||||||||
| Net cash used by operating activities |
$ | (27,890,192 | ) | $ | — | $ | (27,890,192 | ) | ||||
|
|
|
|
|
|
|
|||||||
| CASH FLOWS FROM INVESTING ACTIVITIES |
||||||||||||
| Net cash used by investing activities |
(44,079,020 | ) | — | (44,079,020 | ) | |||||||
|
|
|
|
|
|
|
|||||||
| CASH FLOWS FROM FINANCING ACTIVITIES |
||||||||||||
| Net cash provided by financing activities |
2,693,559 | — | 2,693,559 | |||||||||
|
|
|
|
|
|
|
|||||||
| Net decrease in cash |
(69,275,653 | ) | — | (69,275,653 | ) | |||||||
| CASH AND CASH EQUIVALENTS, beginning of year |
87,113,110 | 5,275 | 87,118,385 | |||||||||
|
|
|
|
|
|
|
|||||||
| CASH AND CASH EQUIVALENTS, end of year |
$ | 17,837,457 | $ | 5,275 | $ | 17,842,732 | ||||||
|
|
|
|
|
|
|
|||||||
| SUPPLEMENTAL DISCLOSURES OF CASH FLOW INFORMATION: |
||||||||||||
| Interest paid |
$ | 16,596 | $ | — | $ | 16,596 | ||||||
|
|
|
|
|
|
|
|||||||
| Income taxes paid |
$ | — | $ | — | $ | 2,165 | ||||||
|
|
|
|
|
|
|
|||||||
The accompanying notes are an integral part of these unaudited consolidated financial statements.
F-16
Table of Contents
REPORT OF INDEPENDENT REGISTERED PUBLIC ACCOUNTING FIRM
To the Stockholders of
Green Field Energy Services, Inc.
We have audited the accompanying consolidated balance sheets of Green Field Energy Services, Inc. (the Company or Successor), formerly Green Field Energy Services, LLC, as of December 31, 2012 and 2011, and the related consolidated statements of operations, equity, and cash flows for the year ended December 31, 2012 and the period from May 1, 2011 to December 31, 2011, and the related consolidated statements of operations, equity, and cash flows for the period from January 1, 2011 to April 30, 2011 of Hub City Industries, LLC (Predecessor). These financial statements are the responsibility of the Company’s management. Our responsibility is to express an opinion on these financial statements based on our audits.
We conducted our audits in accordance with the standards of the Public Company Accounting Oversight Board (United States). Those standards require that we plan and perform the audit to obtain reasonable assurance about whether the financial statements are free of material misstatement. We were not engaged to perform an audit of the Company’s or the Predecessor’s internal control over financial reporting. Our audits included consideration of internal control over financial reporting as a basis for designing audit procedures that are appropriate in the circumstances, but not for the purpose of expressing an opinion on the effectiveness of the Company’s or the Predecessor’s internal control over financial reporting. Accordingly, we express no such opinion. An audit also includes examining, on a test basis, evidence supporting the amounts and disclosures in the financial statements, assessing the accounting principles used and significant estimates made by management, and evaluating the overall financial statement presentation. We believe that our audits provide a reasonable basis for our opinion.
In our opinion, the financial statements referred to above present fairly, in all material respects, the consolidated financial position of Green Field Energy Services, Inc. at December 31, 2012 and 2011, and the consolidated results of its operations and its cash flows for the year ended December 31, 2012, the period from May 1, 2011 to December 31, 2011, and the consolidated results of Hub City Industries, LLC’s operations and cash flows for the period from January 1, 2011 to April 30, 2011 in conformity with U.S. generally accepted accounting principles.
The accompanying consolidated financial statements have been prepared assuming that the Company will continue as a going concern. As discussed in Note 2 to the financial statements, the Company has recurring operating losses and has a net working capital deficiency that raise substantial doubt about its ability to continue as a going concern. Management’s plans in regard to these matters also are described in Note 2. The consolidated financial statements do not include any adjustments that might result from the outcome of this uncertainty.

New Orleans, Louisiana
April 15, 2013
F-17
Table of Contents
GREEN FIELD ENERGY SERVICES, INC.
| DECEMBER 31, 2011 |
DECEMBER 31, 2012 |
|||||||
| Assets |
||||||||
| Current assets: |
||||||||
| Cash |
$ | 87,118,385 | $ | 8,433,539 | ||||
| Accounts receivable—net of allowance |
3,965,654 | 27,595,658 | ||||||
| Other receivables |
18,483 | 287,146 | ||||||
| Note receivable |
— | 282,000 | ||||||
| Due from related parties |
20,329 | — | ||||||
| Inventory |
347,489 | 19,644,715 | ||||||
| Prepaid expenses and other current assets |
1,769,133 | 10,350,644 | ||||||
|
|
|
|
|
|||||
| Total current assets |
93,239,473 | 66,593,702 | ||||||
| Property, plant and equipment: |
||||||||
| Property and equipment |
55,400,686 | 222,943,295 | ||||||
| Construction in progress |
115,415,402 | 44,222,576 | ||||||
|
|
|
|
|
|||||
| Total property, plant and equipment |
170,816,088 | 267,165,871 | ||||||
| Less accumulated depreciation |
(5,208,019 | ) | (25,434,890 | ) | ||||
|
|
|
|
|
|||||
| Net property, plant and equipment |
165,608,069 | 241,730,981 | ||||||
|
|
|
|
|
|||||
| Other assets: |
||||||||
| Deposits |
4,910,546 | 26,372,479 | ||||||
| Loan costs—net of accumulated amortization |
8,136,473 | 8,177,422 | ||||||
| Intangible assets |
11,246,728 | 10,396,416 | ||||||
| Goodwill |
5,647,335 | 5,647,335 | ||||||
| Other |
10,589 | — | ||||||
|
|
|
|
|
|||||
| Total other assets |
29,951,671 | 50,593,652 | ||||||
|
|
|
|
|
|||||
| Total assets |
$ | 288,799,213 | $ | 358,918,335 | ||||
|
|
|
|
|
|||||
| Liabilities and Stockholders’ Equity |
||||||||
| Current liabilities: |
||||||||
| Accounts payable |
$ | 1,026,819 | $ | 30,408,847 | ||||
| Accrued liabilities |
18,884,139 | 22,458,837 | ||||||
| Notes payable |
429,604 | 1,230,179 | ||||||
| Current portion of long-term debt |
156,969 | 52,229,548 | ||||||
| Current portion of capital lease obligation |
— | 1,118,108 | ||||||
| Current earn-out payable |
2,520,000 | 1,078,204 | ||||||
| Deferred income tax |
2,478,000 | — | ||||||
| Deferred income |
— | 2,916,282 | ||||||
|
|
|
|
|
|||||
| Total current liabilities |
25,495,531 | 111,440,005 | ||||||
| Long-term liabilities: |
||||||||
| Long-term debt, net of current portion |
192,294,261 | 236,681,828 | ||||||
| Capital lease obligation, net of current portion |
— | 5,052,797 | ||||||
| Earn-out payable, net of current portion |
13,029,637 | 12,923,959 | ||||||
|
|
|
|
|
|||||
| Total long-term liabilities |
205,323,898 | 254,658,584 | ||||||
| Stockholders’ equity (deficit): |
||||||||
| Common stock—$.01 par value, authorized 2,000,000 shares, issued and outstanding, 1,400,000 shares |
14,000 | 14,000 | ||||||
| Preferred stock—$.01 par value, authorized 150,000 shares, issued and outstanding, 0 and 100,000 shares, respectively |
— | 1,000 | ||||||
| Additional paid in capital |
84,519,335 | 93,954,335 | ||||||
| Accumulated deficit |
(26,553,551 | ) | (101,149,589 | ) | ||||
|
|
|
|
|
|||||
| Total stockholders’ equity (deficit) |
57,979,784 | (7,180,254 | ) | |||||
|
|
|
|
|
|||||
| Total liabilities and stockholders’ equity (deficit) |
$ | 288,799,213 | $ | 358,918,335 | ||||
|
|
|
|
|
|||||
The accompanying notes are an integral part of these consolidated financial statements.
F-18
Table of Contents
GREEN FIELD ENERGY SERVICES, INC.
CONSOLIDATED STATEMENT OF OPERATIONS
| PREDECESSOR | SUCCESSOR | SUCCESSOR | ||||||||||||
| FOUR MONTHS ENDED APRIL 30, 2011 |
EIGHT MONTHS ENDED DECEMBER 31, 2011 |
YEAR ENDED DECEMBER 31, 2012 |
||||||||||||
| Revenue |
$ | 14,445,519 | $ | 18,625,394 | $ | 144,782,856 | ||||||||
| Operating costs: |
||||||||||||||
| Costs of revenue |
9,814,813 | 15,601,359 | 147,112,827 | |||||||||||
| Provision for doubtful accounts |
— | 108,722 | 6,303,916 | |||||||||||
| Selling and administrative expenses |
2,001,562 | 11,545,418 | 22,286,480 | |||||||||||
| Depreciation and amortization |
1,723,932 | 9,395,607 | 21,170,029 | |||||||||||
|
|
|
|
|
|
|
|||||||||
| Total operating costs |
13,540,307 | 36,651,106 | 196,873,252 | |||||||||||
|
|
|
|
|
|
|
|||||||||
| Income (loss) from operations |
905,212 | (18,025,712 | ) | (52,090,396 | ) | |||||||||
| Other income (expense): |
||||||||||||||
| Interest expense |
(364,126 | ) | (4,521,809 | ) | (23,864,482 | ) | ||||||||
| Other income (expense) |
44,181 | (1,476,503 | ) | (277,831 | ) | |||||||||
|
|
|
|
|
|
|
|||||||||
| Net other expense |
(319,945 | ) | (5,998,312 | ) | (24,142,313 | ) | ||||||||
|
|
|
|
|
|
|
|||||||||
| Income (loss) before provision for income tax |
585,267 | (24,024,024 | ) | (76,232,709 | ) | |||||||||
| Income tax expense (benefit) |
63,231 | 2,529,527 | (1,636,671 | ) | ||||||||||
|
|
|
|
|
|
|
|||||||||
| Net income (loss) |
$ | 522,036 | $ | (26,553,551 | ) | $ | (74,596,038 | ) | ||||||
|
|
|
|
|
|
|
|||||||||
| Basic and diluted net loss per share of common stock: |
||||||||||||||
| Net loss per share of common stock |
N/A | $ | (20.38 | ) | $ | (53.28 | ) | |||||||
| Basic and diluted average common sharesoutstanding: |
||||||||||||||
| Basic and diluted |
N/A | 1,302,788 | 1,400,000 | |||||||||||
The accompanying notes are an integral part of these consolidated financial statements.
F-19
Table of Contents
GREEN FIELD ENERGY SERVICES, INC.
CONSOLIDATED STATEMENTS OF EQUITY
For the period from January 1, 2011 to April 30, 2011
| CLASS A & B | CLASS C | TOTAL | ||||||||||
| PREDECESSOR |
||||||||||||
| Balance, December 31, 2010 |
$ | 16,270,431 | $ | (187,508 | ) | $ | 16,082,923 | |||||
|
|
|
|
|
|
|
|||||||
| Net income |
522,036 | — | 522,036 | |||||||||
| Contributions |
— | — | — | |||||||||
| Distributions |
— | — | — | |||||||||
|
|
|
|
|
|
|
|||||||
| Balance, April 30, 2011 |
$ | 16,792,467 | $ | (187,508 | ) | $ | 16,604,959 | |||||
|
|
|
|
|
|
|
|||||||
GREEN FIELD ENERGY SERVICES, INC.
CONSOLIDATED STATEMENTS OF EQUITY
For the period from May 1, 2011 to December 31, 2011 and the year ended December 31, 2012
| SUCCESSOR | MEMBERS’ EQUITY |
COMMON STOCK |
PREFERRED STOCK |
ADDITIONAL PAID-IN CAPITAL |
ACCUMULATED DEFICIT |
TOTAL | ||||||||||||||||||
| Initial contribution |
$ | 686,750 | $ | — | $ | — | $ | — | $ | — | $ | 686,750 | ||||||||||||
| Contributions |
1,150,000 | — | — | — | — | 1,150,000 | ||||||||||||||||||
| Conversion from LLC to Corporation |
(1,836,750 | ) | 12,460 | — | 1,824,290 | — | — | |||||||||||||||||
| Net loss |
— | — | — | — | (26,553,551 | ) | (26,553,551 | ) | ||||||||||||||||
| Contributions |
— | — | — | 3,000,000 | — | 3,000,000 | ||||||||||||||||||
| Warrant issuance |
— | — | — | 53,873,064 | — | 53,873,064 | ||||||||||||||||||
| Share issuance |
— | 1,540 | — | 25,821,981 | — | 25,823,521 | ||||||||||||||||||
|
|
|
|
|
|
|
|
|
|
|
|
|
|||||||||||||
| Balance, December 31, 2011 |
$ | — | $ | 14,000 | $ | 84,519,335 | $ | (26,553,551 | ) | $ | 57,979,784 | |||||||||||||
|
|
|
|
|
|
|
|
|
|
|
|
|
|||||||||||||
| Net loss |
$ | — | $ | — | $ | — | $ | — | $ | (74,596,038 | ) | $ | (74,596,038 | ) | ||||||||||
| Share issuance |
— | — | 1,000 | 9,435,000 | — | 9,436,000 | ||||||||||||||||||
|
|
|
|
|
|
|
|
|
|
|
|
|
|||||||||||||
| Balance, December 31, 2012 |
$ | — | $ | 14,000 | $ | 1,000 | $ | 93,954,335 | $ | (101,149,589 | ) | $ | (7,180,254 | ) | ||||||||||
|
|
|
|
|
|
|
|
|
|
|
|
|
|||||||||||||
The accompanying notes are an integral part of these consolidated financial statements.
F-20
Table of Contents
GREEN FIELD ENERGY SERVICES, INC.
CONSOLIDATED STATEMENT OF CASH FLOWS
| PREDECESSOR | SUCCESSOR | SUCCESSOR | ||||||||||||
| FOUR MONTHS ENDED APRIL 30, 2011 |
EIGHT MONTHS ENDED DECEMBER 31, 2011 |
YEAR ENDED DECEMBER 31, 2012 |
||||||||||||
| Cash flows from operating activities: |
||||||||||||||
| Net income (loss) |
$ | 522,036 | $ | (26,553,551 | ) | $ | (74,596,038 | ) | ||||||
| Adjustments to reconcile net income (loss) to net cash provided (used) by operating activities: |
||||||||||||||
| Depreciation and amortization |
1,723,932 | 9,395,607 | 21,170,029 | |||||||||||
| Change in fair value of earn-out payable |
— | 637,999 | (2,104,200 | ) | ||||||||||
| Bad debt expense |
— | 108,722 | 6,303,916 | |||||||||||
| (Gain) Loss on sale of assets |
(40,179 | ) | 603 | 207,822 | ||||||||||
| Deferred income taxes |
— | 2,451,968 | (2,478,000 | ) | ||||||||||
| Loan cost amortization |
— | 4,208,737 | 667,332 | |||||||||||
| Discount accretion |
— | — | 7,948,783 | |||||||||||
| (Increase) decrease in: |
||||||||||||||
| Accounts receivable |
(148,526 | ) | 1,942,098 | (29,933,920 | ) | |||||||||
| Other receivables |
(472,230 | ) | 1,690,410 | (268,663 | ) | |||||||||
| Inventory |
237,118 | (205,822 | ) | (11,571,979 | ) | |||||||||
| Prepaid expenses |
703,514 | (1,317,871 | ) | (8,581,511 | ) | |||||||||
| Other assets |
(133,964 | ) | (8,626,461 | ) | (12,133,999 | ) | ||||||||
| Increase (decrease) in: |
||||||||||||||
| Accounts payable |
(898,530 | ) | (526,908 | ) | 29,382,027 | |||||||||
| Accrued expenses |
560,780 | 16,754,920 | (5,538,249 | ) | ||||||||||
|
|
|
|
|
|
|
|||||||||
| Total adjustments |
1,531,915 | 26,514,002 | (6,930,612 | ) | ||||||||||
|
|
|
|
|
|
|
|||||||||
| Net cash provided (used) by operating activities |
2,053,951 | (39,549 | ) | (81,526,650 | ) | |||||||||
|
|
|
|
|
|
|
|||||||||
| Cash flows from investing activities: |
||||||||||||||
| Cash payments for the purchase of property, plant and equipment |
(338,716 | ) | (119,647,129 | ) | (98,548,344 | ) | ||||||||
| Proceeds from the sale of property |
83,118 | 1,314 | 447,825 | |||||||||||
| Acquisition of Green Field |
— | (686,750 | ) | — | ||||||||||
|
|
|
|
|
|
|
|||||||||
| Net cash used by investing activities |
(255,598 | ) | (120,332,565 | ) | (98,100,519 | ) | ||||||||
|
|
|
|
|
|
|
|||||||||
| Cash flows from financing activities: |
||||||||||||||
| Due to/from owners and affiliates |
113,411 | (314,101 | ) | 20,329 | ||||||||||
| Proceeds from issuance of debt |
— | 305,247,628 | 104,500,031 | |||||||||||
| Debt issuance costs |
— | (14,012,797 | ) | (708,280 | ) | |||||||||
| Proceeds from sale of preferred stock |
— | — | 10,000,000 | |||||||||||
| Principal payments on long-term debt |
(1,119,803 | ) | (86,210,905 | ) | (12,869,757 | ) | ||||||||
| Capital contributions |
— | 1,150,000 | — | |||||||||||
|
|
|
|
|
|
|
|||||||||
| Net cash (used) provided by financing activities |
(1,006,392 | ) | 205,859,825 | 100,942,323 | ||||||||||
|
|
|
|
|
|
|
|||||||||
| Net increase (decrease) in cash |
791,961 | 85,487,711 | (78,684,846 | ) | ||||||||||
| CASH AND CASH EQUIVALENTS, beginning of year |
838,713 | 1,630,674 | 87,118,385 | |||||||||||
|
|
|
|
|
|
|
|||||||||
| CASH AND CASH EQUIVALENTS, end of year |
$ | 1,630,674 | $ | 87,118,385 | $ | 8,433,539 | ||||||||
|
|
|
|
|
|
|
|||||||||
| SUPPLEMENTAL DISCLOSURES OF CASH FLOW INFORMATION: |
||||||||||||||
| Interest paid, net of capitalized interest |
$ | 284,568 | $ | 3,575,451 | $ | 16,406,572 | ||||||||
|
|
|
|
|
|
|
|||||||||
| Income taxes paid |
$ | — | $ | — | $ | 201,850 | ||||||||
|
|
|
|
|
|
|
|||||||||
| NON-CASH TRANSACTIONS: |
||||||||||||||
| Capital leases |
$ | — | $ | — | $ | 6,761,577 | ||||||||
|
|
|
|
|
|
|
|||||||||
The accompanying notes are an integral part of these consolidated financial statements.
F-21
Table of Contents
Green Field Energy Services, Inc.
Notes to Consolidated Financial Statements
| NOTE 1 SUMMARY | OF SIGNIFICANT ACCOUNTING POLICIES |
Description of Business
Formed in 1969, the Company is an independent oilfield services company that provides a wide range of pressure pumping related services to oil and natural gas drilling and production companies in Louisiana and Texas to help develop and enhance the production of hydrocarbons.
The Company’s traditional oilfield pumping services included cementing, coiled tubing, pressure pumping, acidizing, and other pumping services. In December 2010, the Company began providing hydraulic fracturing pumping services as a part of its portfolio of services provided to its existing well pressure pumping customers using its own internally produced turbine-powered hydraulic fracturing units. To support its hydraulic fracturing operations, it has also entered into two long-term leases during 2011 for sand mines in Louisiana and Mississippi. These mines are expected to supply a portion of its fracturing sand needs and provide the Company the opportunity to sell fracturing sand to third parties.
The Company currently provides services to a diverse group of major and large independent oil and natural gas companies.
Basis of Presentation
During May 2011, through a series of transactions, the Company redeemed all of the existing members’ ownership interests for cash payments of $2.2 million, an obligation to pay $30.7 million and contingent consideration of up to $30.0 million, subsequently amended to $35.7 million, based on revenues that are earned from the Company’s frac turbine units. A new member was admitted for a cash contribution of $0.7 million. This series of transactions resulted in a change of control of the Company which required a new basis of accounting be established as of the date of the change in control. As a result, all assets and liabilities of the Company were required to be recognized at their fair value. See Note 13 for more information. Due to these transactions, the consolidated financial statements are presented in distinct periods to indicate the application of the two bases of accounting. The term “Predecessor” refers to the Company prior to the change in control and the term “Successor” refers to the Company following the change in control. Even though the Company’s operations did not significantly change as a result of the change in control, during the Successor period, the Company’s operations were impacted by the significant growth in its hydraulic fracturing services. Therefore, comparisons of the results of operations to those of the Predecessor may not be meaningful. For comparative purposes, we have combined in certain footnote disclosures the Predecessor and Successor periods. As a result, the combined results may not agree with the amounts presented in our financial statements due to the basis of presentation.
Principles of Consolidation
The accompanying financial statements include the consolidated accounts of Green Field Energy Services, Inc., a Delaware corporation (formerly Hub City Industries, LLC, Green Field Energy Services, LLC, and Green Field Energy Services, Inc., a Louisiana corporation), Hub City Tools, Inc., and Proppant One, Inc. During 2011, the Company formed Proppant One, a wholly owned subsidiary, to market the Company’s sand operations. These companies are collectively hereafter referred to as the Company. The Company consolidates majority owned subsidiaries and any variable interest entities (VIEs) of which it is the primary beneficiary. When it does not have a controlling interest in an entity, but exerts a significant influence over the entity, it applies the equity method of accounting. The cost method is used when it does not have the ability to exert significant influence. All significant inter-company balances and transactions have been eliminated in the consolidated statements.
F-22
Table of Contents
Revenue Recognition
Revenues are generally recognized in the Company’s well and hydraulic fracturing services operations as services are rendered. Revenues recognized typically include an equipment and personnel charge determined by applying a base rate for the amount of time the equipment is in operation, product charges for sand, chemicals and other products actually consumed during the course of providing its services. A mobilization charge is based on the distance equipment and products are transported to the jobs site. Mobilization charges relate to transportation and setup charges and are recognized as revenue when equipment has arrived on site and is prepared for use to perform services for the customer. Taxes collected from customers which are then remitted to governmental authorities are presented on a net basis.
Accounts Receivable and Allowance for Doubtful Accounts
Accounts receivable are stated at the historical carrying value amount, net of write-offs and an allowance for doubtful accounts. The Company provides services to a diversified group of customers in the petroleum industry, including major oil companies, located in the United States. Credit is extended based on an evaluation of each customer’s financial condition. Credit losses and uncollectible amounts due to disputed charges with a customer are provided when the Company has determined the balance is probable of not being collected.
Change of Legal Organization
On September 1, 2011, the Company changed its name from Hub City Industries, LLC to Green Field Energy Services, LLC. In October 2011, Green Field Energy Services, LLC became a “C” Corporation of Louisiana, then pursuant to its senior notes offering, the Company converted to a Delaware Corporation whereby all shares of stock issued and outstanding prior to the Delaware conversion became 1,000 shares of issued and outstanding shares of common stock for the newly converted Delaware Corporation. In November 2011, in an amendment to the Certificate of Incorporation, the Company authorized a 1,400 share to 1 stock split for each share of common stock outstanding.
Cash and Cash Equivalents
For purposes of the statement of cash flows, the Company considers all highly liquid instruments purchased with an original maturity of three months or less to be cash equivalents.
Inventory
Inventory, consisting of various chemicals, parts and equipment, is valued at the lower of cost or market value determined on the first in first out method. Included in inventory at December 31, 2012 is $9.2 million of equipment that was reclassified from construction in progress during 2012, which is available for use in the Company’s fleet of frac spread units. The remaining inventory amount of $10.4 million is made up of various chemicals and parts for use in the Company’s operations.
Loan Costs
Loan costs are carried on the books net of accumulated amortization. Amortization is calculated on an effective interest basis over the expected life of the loan or notes. Amortization expense was $4,208,737 and $667,332 for the years ended December 31, 2011 and 2012, respectively.
Income taxes
Income taxes are provided for the tax effects of transactions reported in the financial statements and consist of taxes currently due plus deferred taxes. Income tax expense is based on income reported in the accompanying consolidated statements of operations adjusted for differences that will never enter into the computation of taxes
F-23
Table of Contents
payable under applicable tax laws. Deferred taxes are recognized for differences between the basis of assets and liabilities for financial statements and income tax purposes. Prior to its conversion to a C Corporation effective October 1, 2011, the income of Hub City Industries, LLC and Green Field Energy Services, LLC, which were treated as a partnership for federal income tax purposes, was passed through to its members and accordingly no federal and, where applicable, state taxes were paid by this entity. Consequently, no provision for income taxes was recorded for this entity in the accompanying financial statements prior to October 1, 2011. On October 1, 2011, in connection with its conversion to a C Corporation, the Company recorded approximately $3.4 million in net deferred tax asset related to existing cumulative temporary differences as of that date.
Deferred tax assets and liabilities are identified separately as current or noncurrent based on the classification of the related asset or liability. A deferred tax asset or liability not associated with an asset or liability for financial reporting purposes is classified as current or noncurrent according to the expected reversal date of the temporary difference.
Goodwill
Goodwill represents the excess of the consideration paid over the fair value of the net assets acquired as a result of the change in control that occurred in May 2011. See Note 13. Goodwill is evaluated for impairment at least annually in accordance with the provisions of ASC 350, Intangibles—Goodwill and Other. Based on the Company’s latest impairment analysis, no impairment of goodwill was noted.
Intangible assets
The Company amortizes intangible assets with finite lives on a straight-line basis over their estimated useful lives. Customer lists are amortized over fifteen years. Covenants not to compete are amortized over five years. Intangible assets are reviewed annually for impairment or when events or circumstances indicate their carrying amounts may not be recoverable. No impairments were recorded for the year ended December 31, 2012.
Depreciation
Fixed assets were adjusted to fair value as of May 2011 as discussed in Note 13, which established a new cost basis for fixed assets as of that date. Depreciation of these fixed assets, including assets recorded under capital leases, for financial statement purposes, is provided by the straight-line method over the estimated useful lives of the assets as follows:
| Leasehold improvements |
7-39 | |||
| Vehicles |
3-7 | |||
| Furniture |
5-7 | |||
| Equipment |
3-10 |
Gains or losses on sales of these assets are credited or charged to other income or other deductions. When events or changes in circumstances indicate that assets may be impaired, an evaluation is performed by comparing the undiscounted cash flows to be generated by the assets to its carrying value. The impairment loss is measured by the estimated fair value of the asset compared to the asset’s carrying amount with the difference recorded as impairment.
Advertising Costs
Advertising costs are expensed as incurred.
F-24
Table of Contents
Fair Value Measurements
ASC 820, Fair Value Measurements and Disclosures (ASC 820), establishes a hierarchy that prioritizes inputs to valuation techniques used to measure fair value and requires companies to disclose the fair value of their financial instruments according to a fair value hierarchy (i.e., Level 1, 2, and 3 inputs, as defined). The fair value hierarchy gives the highest priority to quoted prices (unadjusted) in active markets for identical assets or liabilities and the lowest priority to unobservable inputs. Additionally, companies are required to provide enhanced disclosure regarding instruments in the Level 3 category (which use inputs to the valuation techniques that are unobservable and require significant management judgment), including a reconciliation of the beginning and ending balances separately for each major category of assets and liabilities. See Note 14.
Uses of Estimates
The preparation of financial statements in conformity with accounting principles generally accepted in the United States of America requires management to make estimates and assumptions that affect the reported amounts of assets and liabilities at the date of the financial statements and the reported amounts of revenues and expenses during the reporting period. Actual results could differ from those estimates.
Reclassification Adjustments
Certain amounts in the consolidated statement of cash flows for the year ended December 31, 2011 have been reclassified to conform with the 2012 financial statements. Bad debt expense of $0.1 million and amortization expense of $4.2 million have been reclassified from the changes to accounts receivable and other assets, respectively. Additionally, $0.1 million of bad debt expense was reclassified from selling and administrative expenses in the consolidated statement of operations for the year ended December 31, 2011.
Subsequent Events
Management has evaluated subsequent events through April 15, 2013, the date the financial statements were available to be issued.
On February 28, 2013, the Company entered into an agreement to purchase chemicals from Chemrock Technologies, LLC, a chemical company. The contract calls for market pricing and may result in payments that could exceed $40.0 million dollars over eighteen months. The agreement requires a prepayment of $3.9 million to Chemrock which will be applied against future purchases. Of the required prepayment amount, $1.0 million has been paid. The Company may also purchase chemicals from unrelated vendors.
| NOTE 2 GOING | CONCERN |
The accompanying consolidated financial statements have been prepared assuming that the Company will continue as a going concern. The Company has incurred recurring losses from operations, including a loss of approximately $74.6 million for the year ended December 31, 2012, and has a net working capital deficiency of approximately $40.9 million as of December 31, 2012, that raise substantial doubt about its ability to continue as a going concern. The consolidated financial statements do not include any adjustments that might result from the outcome of this uncertainty. Management’s plans with regards to the uncertainty include obtaining a short term debt facility; raising additional capital; improving operating margins through cost reduction initiatives, revenue enhancements and new product offerings; and pursuing further revisions to its senior notes payable under its primary debt facility as were obtained in 2012 (see Note 7).
During the latter half of 2012 and through April 2013, management has been pursuing a $30.0 million short term debt facility as well negotiating with several outside parties to raise capital for the Company. Management believes the $30.0 million debt facility together with the additional capital would be sufficient for the Company to meet its net working capital deficit and provide sufficient funds to allow the Company to meet its existing
F-25
Table of Contents
obligations and commitments and also allow the Company to continue with the expansion of its frac spread units currently in process of assembly (see Notes 4 and 12 for further discussion of construction in progress and related commitments). There can be no assurances that either a short term debt facility or additional capital from outside investors will successfully be obtained on terms that management feels is appropriate.
In addition, management has evaluated its operational structure and its existing contractual arrangements. It has implemented certain cost reduction and revenue improvement initiatives that management believes will allow for an improvement in its margins being generated from operations. The Company successfully implemented revisions to a large service contract that allows for an increase in pricing, which became effective March 9, 2013, that management believes will be sufficient to provide positive operating margins to the Company under the terms of this contract. During 2012, the Company earned revenues of approximately $114 million from this customer. In 2012, the Company was adversely impacted by the sudden and severe increase in the price of guar. Guar is one of the primary components that is used to complete the fracing of an oil and gas field. As part of a separate contract amendment with the same customer, effective October 2012, the Company was able to obtain price adjustments which management believes will allow it to effectively pass the price of this commodity through to the underlying customer. In addition, the Company made a decision in December 2012, to close its Weatherford, Texas location and consolidate these operations at its Pleasanton, Texas location. The Company is also exploring expanding its product offerings to include selective lease, sale or assembly of turbine fracturing equipment to other third parties.
During 2012, the Company successfully obtained several amendments to its senior notes payable (see Note 7). Management is evaluating the possibility of obtaining other amendments with the objective of reducing its annual cash requirements under the indenture. There can be no assurances that any additional amendments will be obtained that would enable the Company to reduce its annual cash requirements under the indenture.
| NOTE 3 ACCOUNTS | RECEIVABLE AND REVENUE CONCENTRATIONS |
For the year ended December 31, 2011 three customers accounted for 17%, 12% and 11% of revenues. At December 31, 2011, trade receivables from these three customers were approximately $0.1 million, $0.0 and $0.5 million, respectively.
For the year ended December 31, 2012 one customer accounted for 79% of revenues. At December 31, 2012, trade receivables from this customer were approximately $22.3 million.
Below is a schedule of accounts receivable as of December 31, 2011 and 2012:
| 2011 | 2012 | |||||||
| Accounts receivable |
$ | 4,002,926 | $ | 28,521,400 | ||||
| Allowance for doubtful accounts |
(37,272 | ) | (925,742 | ) | ||||
|
|
|
|
|
|||||
| Accounts receivable—net of allowance |
$ | 3,965,654 | $ | 27,595,658 | ||||
|
|
|
|
|
|||||
Below is a schedule of allowance for doubtful accounts for the years ended December 31, 2011 and 2012:
| 2011 | 2012 | |||||||
| Balance, beginning of year |
$ | 197,333 | $ | 37,272 | ||||
| Provision for doubtful accounts |
108,722 | 6,303,916 | ||||||
| Write-off of receivables |
(268,783 | ) | (5,415,446 | ) | ||||
|
|
|
|
|
|||||
| Balance, end of year |
$ | 37,272 | $ | 925,742 | ||||
|
|
|
|
|
|||||
F-26
Table of Contents
| NOTE 4 PROPERTY, | PLANT AND EQUIPMENT |
Below is a schedule of property, plant and equipment as of December 31, 2011 and 2012:
| 2011 | 2012 | |||||||
| Equipment |
$ | 42,391,220 | $ | 182,905,016 | ||||
| Furniture and fixtures |
230,140 | 688,505 | ||||||
| Leasehold improvements |
453,296 | 2,557,406 | ||||||
| Building |
1,505,219 | 4,629,816 | ||||||
| Rental equipment |
68,220 | 68,220 | ||||||
| Land |
1,078,400 | 1,911,865 | ||||||
| Computer equipment |
349,960 | 2,244,624 | ||||||
| Vehicles |
9,324,231 | 27,937,843 | ||||||
| Construction in progress—equipment |
115,415,402 | 44,222,576 | ||||||
|
|
|
|
|
|||||
| 170,816,088 | 267,165,871 | |||||||
| Less: Accumulated depreciation and amortization |
(5,208,019 | ) | (25,434,890 | ) | ||||
|
|
|
|
|
|||||
| Net Property, Plant and Equipment |
$ | 165,608,069 | $ | 241,730,981 | ||||
|
|
|
|
|
|||||
In connection with the change in control described in Note 13, the Company recognized its property, plant and equipment at fair value as of May 2011.
The Company had $115,415,402 and $44,222,576 in construction in progress at December 31, 2011 and 2012, respectively, which includes self-constructed equipment to be used for future operations.
Construction in progress generally includes assembly and component costs for self-constructed operating equipment, costs of procured equipment in the process of being up-fitted or being upgraded to be placed into service, unallocated capitalized interest, and costs related to operating facilities under construction. Timing as to completion of in process equipment and in service dates will be determined by the Company’s management. Construction in progress at December 31, 2012 represents $25,145,167 of assembly and component costs for a hydraulic fracturing spread expected to be placed into service during the first half of 2013. The remaining balance of construction in progress at December 31, 2012 of $19,077,409 is intended to be used for the construction of two additional hydraulic fracturing spreads, five coil tubing units, and four cementing units. Included in our inventory at December 31, 2012 is approximately $9,232,110 of equipment intended for use in the construction of these assets. The Company has approximately $25,884,122 of commitments for additional equipment expenditures expected to be incurred in 2013 for construction of these assets, and included in deposits at December 31, 2012 is $8,328,008 of deposits intended for use in the construction of these assets. Additionally, the Company expects to incur an additional $38,077,037 in 2013 for product and labor charges in order to complete the construction of our construction in progress.
In addition, the Company has approximately $24,239,900 of commitments for additional equipment expenditures which may be deferred beyond 2013. These purchase commitments relate to equipment which is expected to be used in our operations but which may also be used in our construction activities as necessary.
During December 2012, upon completing its plan to suspend the assembly of further frac spread units, the Company reclassified $7,853,854 and $9,327,934 of costs from construction in progress to inventory and deposits, respectively, on the balance sheet at December 31, 2012. These reclassifications are reflected as non-cash changes in the respective accounts on the statement of cash flows for the year ended December 31, 2012.
Depreciation expense charged to operations was $6,910,802 and $20,370,687 for the years ended December 31, 2011 and 2012, respectively. For the years ended December 31, 2011 and 2012, the Company capitalized interest totaling $4,596,941 and $17,336,077, respectively.
F-27
Table of Contents
| NOTE 5 INTANGIBLE | ASSETS |
Intangible assets consist of the following as of December 31, 2011 and 2012:
| 2011 | 2012 | |||||||
| Customer lists |
$ | 10,859,000 | $ | 10,859,000 | ||||
| Covenants not to compete |
1,106,000 | 1,106,000 | ||||||
|
|
|
|
|
|||||
| 11,965,000 | 11,965,000 | |||||||
| Less: Accumulated amortization |
(718,272 | ) | (1,568,584 | ) | ||||
|
|
|
|
|
|||||
| Net |
$ | 11,246,728 | $ | 10,396,416 | ||||
|
|
|
|
|
|||||
Amortization expense related to intangible assets for the years ended December 31, 2011 and 2012 was $718,272 and $850,312, respectively. Annual future aggregate estimated amortization expense of intangible assets for the next 5 years is as follows:
| December 31, 2012 |
||||
| 2013 |
$ | 945,133 | ||
| 2014 |
945,133 | |||
| 2015 |
945,133 | |||
| 2016 |
797,667 | |||
| 2017 |
723,933 | |||
| Thereafter |
6,039,417 | |||
|
|
|
|||
| $ | 10,396,416 | |||
|
|
|
|||
| NOTE 6 NOTES | PAYABLE |
| December 31, 2011 |
December 31, 2012 |
|||||||
| Note payable to TMC/Midsouth Bank, NA, dated September 28, 2011, original amount of $177,319 bearing interest at 4.262% per annum, paid June 2012 |
$ | 124,778 | $ | — | ||||
| Note payable to TMC/Midsouth Bank, NA, dated July 15, 2011, original amount $663,569 bearing interest at 4.25% per annum, paid May 2012 |
304,826 | — | ||||||
| Note payable to Bank Direct Capital Finance, dated July 20, 2012, original amount of $2,069,037 bearing interest at 3.95% per annum, payable in 11 monthly of $191,829, collateralized by insurance policies |
— | 949,465 | ||||||
| Note payable to Bank Direct Capital Finance, dated September 27, 2012, original amount of $384,094 bearing interest at 3.95% per annum, payable in 11 monthly of $35,611, collateralized by insurance policies |
— | 280,714 | ||||||
|
|
|
|
|
|||||
| Total notes payable |
$ | 429,604 | $ | 1,230,179 | ||||
|
|
|
|
|
|||||
F-28
Table of Contents
| NOTE 7 LONG-TERM | DEBT |
| December 31, 2011 |
December 31, 2012 |
|||||||
| Senior notes payable in the face amount of $250,000,000 and $255,948,000, respectively, consisting of 250,000 units of $1,000 principal amounts of 13% senior secured notes and $5,948,000 of principal amounts of 13% senior secured notes due 2016 |
$ | 191,958,214 | $ | 199,906,997 | ||||
| Term notes payable to Ford Motor Credit, various dates, payable in 36 monthly installments of $563 to $2,920, bearing interest at 4.24% to 6.54% per annum, secured by vehicles |
493,016 | 1,920,661 | ||||||
| Senior Credit Revolver payable to Shell, dated October 22, 2012, due in twenty-five monthly installments |
— | 87,083,718 | ||||||
|
|
|
|
|
|||||
| Total |
$ | 192,451,230 | $ | 288,911,376 | ||||
| Less: current maturities of long-term debt and bond payable |
(156,969 | ) | (52,229,548 | ) | ||||
|
|
|
|
|
|||||
| Net long-term debt and bond payable |
$ | 192,294,261 | $ | 236,681,828 | ||||
|
|
|
|
|
|||||
Future debt maturities are as follows:
| 2013 |
$ | 52,229,548 | ||
| 2014 |
106,770,331 | |||
| 2015 |
47,150,440 | |||
| 2016 |
82,756,506 | |||
| 2017 and thereafter |
4,549 | |||
|
|
|
|||
| $ | 288,911,376 | |||
|
|
|
Overview
On November 15, 2011, the Company issued 250,000 units, each consisting of $1,000 principal amount of 13% senior secured notes due 2016 (the Notes) and one warrant to purchase .988235 shares of the Company’s common stock (the Warrants). The units were issued at a price of $990 per unit and resulted in net proceeds of $241.6 million after deducting fees and expenses related to the offering.
The units were issued to qualified institutional buyers pursuant to Rule 144A under the Securities Act. The Company also entered into a registration rights agreement with respect to the Notes whereby the Company has agreed to make an offer to exchange the Notes for registered, publicly tradable securities that have substantially identical terms as the Notes. The exchange offer would be completed through the filing of a registration statement with the Securities and Exchange Commission (SEC) no later than 210 days after the offering with such registration statement being declared effective on or prior to 300 days after the offering and the exchange offer consummated within 30 business days after such registration statement is declared effective. Additionally, the Company entered into a registration rights agreement with respect to the warrant shares whereby the Company has filed a shelf registration statement with the SEC covering the registration of the warrant shares and agreed to use commercially reasonable efforts to cause such registration statement to be declared effective no later than 300 days after the offering. The registration statements with respect to the Notes and the warrant shares are still pending SEC review, and the Company will incur additional interest expense until such registration statements are declared effective. With respect to the first 90-day period immediately following the date upon which we were required to be declared effective, we incurred additional interest expense of 0.25% per annum of the principal amount of the Notes and will incur an additional 0.25% per annum of interest expense, up to a maximum amount of 1.00% per annum, with respect to each subsequent 90-day period until such registration statement is declared effective.
F-29
Table of Contents
On October 23, 2012, we initiated a successful consent solicitation (the “Consent Solicitation”) offer to modify certain of the covenants contained in the indenture governing the Notes to provide us with additional operating and financial flexibility. In connection with the Consent Solicitation, we agreed to pay our Note holders a consent fee in the amount of 2.5% of the principal amount of any Notes with respect to which consents were validly delivered. This consent fee was payable in the form of new Notes issued under and governed by the terms and conditions of our indenture, as supplemented. Upon receipt and acceptance of consents for all the Notes then outstanding, we issued $5,948,000 in aggregate principal amount of new Notes to finance the fee necessary to complete the transaction. The new Notes were issued under and are governed by the terms and conditions of the indenture, as amended, and will be entitled to the benefits of the registration rights agreement, as amended. The new Notes will form part of the same series of notes as the Notes with identical scheduled payments of interest and principal.
As agreed to under the Consent Solicitation, in October 2012, we issued non-voting, non-convertible preferred stock that is not entitled to dividends to our existing shareholders in exchange for $10.0 million in gross proceeds and secured a commitment to purchase from time to time additional shares of preferred stock at a price per share equal to the fair market value of such shares yielding gross proceeds to us equal to the amount by which $10.0 million exceeds the aggregate cash on hand for us and our consolidated subsidiaries as of the last business day of any fiscal quarter; provided that in no event will such shareholders be required to purchase more than $15.0 million in additional shares in the aggregate. The total gross proceeds from such purchases of preferred stock shall not exceed $25.0 million in the aggregate.
Further, also in connection with the Consent Solicitation, we amended our warrant agreement in order to grant our warrant holders tag-along rights with respect to certain sales of the our common stock. We also amended our registration rights agreement in order to provide that the new Notes issued as the consent fee for our consent offer benefit from the registration rights applicable to the existing Notes.
The Notes
The following discussion of the Notes relates to the terms and covenants pertaining thereto as of December 31, 2012, which include certain amendments which were made to the terms of the Notes on October 23, 2012.
The Notes mature on November 15, 2016 and bear interest at a fixed annual rate of 13%, to be payable semi-annually on May 15 and November 15 of each year. The Notes are fully and unconditionally and irrevocably guaranteed, jointly and severally, on a senior secured basis by each of the Company’s existing and future domestic restricted subsidiaries.
The Notes are secured by a security interest on substantially all of the Company’s tangible and intangible assets subject to certain exceptions. The covenants under the Company’s indenture relating to the Notes allow the Company to enter into a senior credit facility in an aggregate principal amount not exceeding the greater of $30.0 million and a specified percentage of the Company’s tangible assets, such security interest and pledge will be contractually subordinated to the liens thereon that secure such senior credit facility, pursuant to an intercreditor agreement. The Notes rank senior in right of payment to all of the Company’s existing and future subordinated indebtedness but are effectively subordinated to any senior credit facility entered into in accordance with such indenture, to the extent of the value of the collateral secured thereby.
As amended in October 2012, the Notes permit the one-time incurrence of up to $95.0 million in senior term loans secured by a first priority security interest in motor vehicles and equipment under a credit agreement with Shell, for the purpose of financing the purchase of additional motor vehicles and equipment.
The Company may redeem the Notes in whole or in part on or after November 15, 2014 at a redemption price of 109.75% of principal amount in 2014 and 100% of principal amount in 2015 and thereafter. Prior to November 15, 2014, the Company may, at its option, redeem up to 35% of the aggregate principal amount of the Notes at a
F-30
Table of Contents
redemption price of 113% of principal amount with the proceeds of certain equity offerings. Additionally, the Company may, at its option, redeem the Notes at any time prior to November 15, 2014 at a price equal to 100% of the principal amount of the Notes redeemed by paying a make whole premium.
If the Company experiences certain kinds of changes in control, the Company must offer to repurchase the Notes at a price equal to 101% of the principal amount. Upon the sale of certain assets, the Company may be required to offer to use the net proceeds of the sale to repurchase some of the Notes at 100% of the principal amount. Additionally, the Company must offer to repurchase some of the Notes at 108% of the principal amount with the Semi-Annual Offer Amount, as defined in the offering memorandum, as amended, after each of June 30 and December 31 of each year, commencing with June 30, 2013. Upon such time as certain conditions are met, the repurchase price of the Notes in connection with the semi-annual repurchase will decrease to 103%. The portion of the carrying value related to the June 30, 2013 offer, net of discount, is classified as current. The Semi-Annual Offer Amount is equal to the excess of $30 million over the aggregate principal amount of Notes repurchased and cancelled or redeemed during the six-month period ending on June 30 or December 31 with respect to which the Semi-Annual Offer is being made.
The Notes include certain covenants that, among other things, limit the Company’s ability to incur additional debt, pay dividends and make other restricted payments, redeem or repurchase capital stock or subordinated debt, transfer or sell assets, make investments, maintain minimum cash balances, enter into transactions with affiliates, create or incur liens and merge or consolidate with any other person.
The Company accounted for the amendment to its Senior Notes indenture as a debt modification resulting in an increase to our effective interest rate from 21.9% under the original Notes indenture to 22.8% under the amended Notes indenture.
The Warrants
The Warrants entitle the holder, subject to certain conditions, to purchase .988235 warrant shares at an exercise price of $0.01 per share, subject to adjustment. The Warrants are exercisable any time and expire on November 15, 2021. The Warrants do not entitle the holder to receive any dividends paid on shares of common stock or to any other rights of the holders of the Company’s common stock.
The estimated fair value of the Warrants of approximately $56.2 million was recorded as a discount to the Notes and an increase to additional paid in capital in stockholders’ equity, net of issuance costs, resulting in an aggregate discount to the Notes of approximately $64.7 million including the initial purchaser’s discount and additional discount recorded as a result of the amendment in October 2012. The resulting effective yield on the Notes is 22.8%, and the discount is being amortized over the term of the Notes using the effective interest method.
Amended and Restated Shell Credit Facility
In October 2012, the Company entered into an amended and restated credit facility (the “Shell Credit Facility”) with Shell pursuant to which Shell agreed to provide up to an aggregate $100.0 million of senior secured term loans, which loans may not be reborrowed once repaid. As of September 30, 2012, the Company had borrowed $30.0 million and there was approximately $24.0 million outstanding under the then-existing credit facility with Shell. Upon closing of the Shell Credit Facility the Company borrowed an additional $70.0 million and there was approximately $94.0 million outstanding thereunder. As of December 31, 2012, there was approximately $90.0 million outstanding under the Shell Credit Facility. The Shell Credit Facility is secured by a first priority lien on all of the Company’s motor vehicles and equipment except for the vehicles securing the Ford Motor Credit loans and the Nations Equipment Finance capital leases. In connection with the Shell Credit Facility, Shell and the trustee under the indenture governing the senior notes due 2016 (the “Notes”) entered into an amended and restated intercreditor agreement setting forth the relative priority and interests with respect to the Company’s
F-31
Table of Contents
motor vehicles and equipment as between Shell and the trustee, on behalf of the Company’s Note holders. Repayment will be in 25 monthly installments which commenced November 15, 2012. Repayments are to be $2.0 million per month for the first twelve months, $4.0 million per month for the next six months, $7.5 million per month for the next six months and one payment of $1.0 million in the final month. The Company recorded a discount of $3.4 million upon execution of the agreement related to imputed interest. The Company also recorded deferred revenue of $3.4 million related to pricing discounts received by Shell. The Company will amortize these amounts over the life of the facility through interest expense and revenue, respectively. The company amortized $0.5 million of each balance during 2012.
NOTE 8 LEASES
Operating
The Company leases office space under various non-cancelable operating leases. The leases expire between January 2013 and December 2017. For the years ended December 31, 2011 and 2012, the Company incurred rental expense of $409,716 and $1,032,065, respectively.
The total future minimum rental commitment at December 31, 2012 under the leases, are as follows:
| 2013 |
$ | 5,953,509 | ||
| 2014 |
5,859,813 | |||
| 2015 |
3,519,269 | |||
| 2016 |
232,863 | |||
| 2017 |
48,000 | |||
|
|
|
|||
| Total minimum lease payments |
$ | 15,613,454 | ||
|
|
|
Capital
The Company leases vehicles under various non-cancellable capital leases that were entered into in 2012. The leases expire October 2017. For the years ended December 31, 2011 and 2012, the Company made lease payments of $0 and $1,954,466, respectively. The Company classified $6,761,577 relating to these capital leases within property and equipment on the balance sheet at December 31, 2012. Accumulated amortization of $590,672 was recorded relating to these assets at December 31, 2012.
The total future minimum rental commitment at December 31, 2012 under the leases, are as follows:
| 2013 |
$ | 1,851,646 | ||
| 2014 |
1,851,646 | |||
| 2015 |
1,851,646 | |||
| 2016 |
1,851,646 | |||
| 2017 |
702,215 | |||
|
|
|
|||
| Less: Interest |
(1,937,894 | ) | ||
|
|
|
|||
| Total minimum lease payments |
$ | 6,170,905 | ||
|
|
|
| NOTE 9 INCOME | TAXES |
The Company typically provides for income taxes at a statutory rate of 35% adjusted for permanent differences expected to be realized. As a result of prior period losses the Company has determined it is more likely than not that its net deferred tax asset is not recoverable. Accordingly, the Company established a full valuation allowance for its net deferred tax asset.
F-32
Table of Contents
The provision for income tax expense is comprised of the following:
| 2011 | 2012 | |||||||
| Current |
||||||||
| Federal |
$ | — | $ | — | ||||
| State |
114,758 | 841,329 | ||||||
|
|
|
|
|
|||||
| 114,758 | 841,329 | |||||||
|
|
|
|
|
|||||
| Deferred |
||||||||
| Federal |
2,344,000 | (26,682,000 | ) | |||||
| State |
134,000 | (1,524,000 | ) | |||||
|
|
|
|
|
|||||
| 2,478,000 | (28,206,000 | ) | ||||||
|
|
|
|
|
|||||
| Valuation Allowance |
— | 25,728,000 | ||||||
|
|
|
|
|
|||||
| Total |
$ | 2,592,758 | $ | (1,636,671 | ) | |||
|
|
|
|
|
|||||
The deferred tax assets and liabilities consist of the following:
| 2011 | 2012 | |||||||
| Deferred Tax Assets |
||||||||
| Allowance for doubtful accounts |
$ | 14,000 | $ | 343,000 | ||||
| Contingent consideration |
768,000 | 689,000 | ||||||
| Net operating loss |
6,152,000 | 59,236,000 | ||||||
|
|
|
|
|
|||||
| Deferred tax asset before valuation allowance |
$ | 6,934,000 | $ | 60,268,000 | ||||
|
|
|
|
|
|||||
| Valuation allowance |
— | (25,728,000 | ) | |||||
|
|
|
|
|
|||||
| Total deferred tax asset |
$ | 6,934,000 | $ | 34,540,000 | ||||
|
|
|
|
|
|||||
| Deferred Tax Liabilities |
||||||||
| Intangibles |
(4,911,000 | ) | (3,847,000 | ) | ||||
| Depreciation |
$ | (4,501,000 | ) | $ | (30,693,000 | ) | ||
|
|
|
|
|
|||||
| Total deferred tax liability |
$ | (9,412,000 | ) | $ | (34,540,000 | ) | ||
|
|
|
|
|
|||||
| Net Deferred Taxes |
$ | (2,478,000 | ) | $ | — | |||
|
|
|
|
|
|||||
The Company has net operating losses of approximately $160,097,011 which, if unused, will expire in 2031.
A reconciliation of income tax expense at the statutory rate to income tax expense at the Company’s effective rate is as follows:
| 2011 | 2012 | |||||||
| Computed at the expected statutory rate |
(35.0 | )% | (35.0 | )% | ||||
| State income tax |
(2.0 | ) | (0.8 | ) | ||||
| L.L.C. net earnings |
16.0 | — | ||||||
| Conversion to C corporation |
(14.4 | ) | — | |||||
| Rescission of redemption agreement(1) |
48.8 | — | ||||||
| Valuation allowance |
— | 33.7 | ||||||
| Other |
(2.3 | ) | — | |||||
|
|
|
|
|
|||||
| Effective income tax rate |
11.1 | % | (2.1 | )% | ||||
|
|
|
|
|
|||||
| (1) | Relates to the write-off of deferred tax assets associated with payables that were extinguished in the rescission of the redemption agreement and will no longer be recognized for tax purposes. |
F-33
Table of Contents
| NOTE 10 RELATED | PARTY TRANSACTIONS |
Related parties of the Company include the following entities: MMR, LLC (MMR), MOR MGH, LLC (MOR), Elle Investments, LLC, Marine Turbine Technology, L.L.C. (MTT), Alliance Consulting Group, LLC, Aerodynamic, LLC, Casafin II, LLC, Chemrock Technology, L.L.C., Moreno Properties, LLC and Dynamic Industries.
Related party transactions for the years ended December 31, 2011 and 2012 are as follows:
| 2011 | 2012 | |||||||
| Due (to) from related parties |
||||||||
| M . Moreno |
$ | 20,329 | $ | — | ||||
|
|
|
|
|
|||||
| Reimbursements |
||||||||
| Elle Investments, LLC |
$ | 2,591,644 | $ | — | ||||
| M . Moreno |
75,572 | |||||||
|
|
|
|
|
|||||
| $ | 2,591,644 | $ | 75,572 | |||||
|
|
|
|
|
|||||
| Assembly charges |
||||||||
| Turbine Powered Technology, LLC |
$ | 1,502,219 | $ | 11,568,228 | ||||
|
|
|
|
|
|||||
| Inventory |
||||||||
| ChemRock Technology, L.L.C |
$ | — | $ | 29,987,749 | ||||
| Turbine Powered Technology, LLC |
177,411 | |||||||
|
|
|
|
|
|||||
| $ | — | $ | 30,165,160 | |||||
|
|
|
|
|
|||||
| Aircraft lease |
||||||||
| Aerodynamic, LLC |
$ | 385,000 | $ | 660,000 | ||||
|
|
|
|
|
|||||
| Flight charges |
||||||||
| Moreno Properties |
$ | 424,554 | $ | 752,369 | ||||
| Aerodynamic, LLC |
403,943 | — | ||||||
| Casafin II, LLC |
696,488 | 1,626,833 | ||||||
|
|
|
|
|
|||||
| $ | 1,524,985 | $ | 2,379,202 | |||||
|
|
|
|
|
|||||
| Improvements |
||||||||
| Alliance Consulting Group, LLC |
$ | 398,250 | $ | 232,250 | ||||
|
|
|
|
|
|||||
| Prepayments |
||||||||
| Alliance Consulting Group, LLC |
$ | — | $ | 4,600,000 | ||||
|
|
|
|
|
|||||
| Capital contributions |
||||||||
| Turbine Powered Technology, LLC |
$ | 370,810 | $ | 860,570 | ||||
|
|
|
|
|
|||||
| Fixed Asset Purchases |
||||||||
| MTT |
$ | 18,566,855 | $ | — | ||||
| Dynamic Industries |
38,357,547 | 5,239,702 | ||||||
|
|
|
|
|
|||||
| $ | 56,924,402 | $ | 5,239,702 | |||||
|
|
|
|
|
|||||
| Services |
||||||||
| Alliance Consulting Group, LLC |
$ | — | $ | 163,738 | ||||
| Turbine Powered Technology, LLC |
— | 4,479,545 | ||||||
| Dynamic Industries |
2,807 | |||||||
|
|
|
|
|
|||||
| $ | — | $ | 4,646,090 | |||||
|
|
|
|
|
|||||
| Administrative fees |
||||||||
| MMR |
$ | 288,910 | $ | — | ||||
|
|
|
|
|
|||||
F-34
Table of Contents
Elle Investments, L.L.C. Loan
During the year ended December 31, 2011, the Company borrowed $2.5 million from Elle Investments to procure equipment. This amount was repaid prior to December 31, 2011.
Creation of Turbine Powered Technology, LLC.
On September 22, 2011, the Company and MTT formed Turbine Powered Technology, LLC (TPT), for the purpose of holding certain intellectual property and other rights associated with turbine-powered hydraulic fracturing pumps, to assemble turbine-powered hydraulic fracturing pumps to be used by the Company and to provide maintenance of turbine powered equipment being used by or sold by the Company. The Company owns 50% of TPT. The Company’s initial contribution to the joint venture was $250,000 and the Company has committed to pay an assembly fee to the joint venture which will approximate the joint venture overhead cost. The Company’s investment in the joint venture was $370,810 as of December 31, 2011 and $1,231,380 as of December 31, 2012. Due to the level of financial involvement of the Company, TPT meets the definition of a variable interest entity and the Company is the primary beneficiary of the venture. Accordingly, the Company consolidates this interest with its investment classified as property, plant and equipment on the balance sheet since these contributions were used by the venture to purchase equipment.
In connection with the formation of TPT, TPT assumed the obligations of MTT under the Company’s equipment purchase agreement with MTT. Under the equipment purchase agreement, the Company has an irrevocable, perpetual license to use and the right to purchase up to 200 turbines and accessory equipment from TPT for use in its hydraulic fracturing and well services business, as well as, the right to resell, lease, and rent the turbine engines for such purposes to third parties. As of December 31, 2012 the Company had exercised its right for the purchase of 75 turbine engines and had access to an additional 125 turbine engines. Along with the equipment purchase agreement, the Company has entered into installation and maintenance agreements with TPT. Under these agreements, TPT provides all labor and professional supervisory and managerial personnel as are required for installation of turbine engines on trailers or into skids and maintains and repairs all turbine-powered equipment, accessory equipment, and all gearboxes and accessory gearboxes that the Company purchases. Under such agreements the Company pays cost plus agreed upon markups to TPT. At December 31, 2012 the Company owed TPT $3,257,492.
Dynamic Industries, Inc. Agreement
In April 2011, the Company entered into an agreement with Dynamic Industries, Inc. (Dynamic) under which Dynamic promises to provide the material and labor for producing hydraulic fracturing units according to the Company’s specifications. The Company’s Chairman and Chief Executive Officer owns and was in control of Dynamic at that time. Such agreement contains hourly labor rates and customary markups for materials and subcontracted services. The agreement can be terminated upon written notice by either party. Dynamic provided the Company $38,357,083 and $5,239,702 in fixed asset purchases for the years ended December 31, 2011 and December 31, 2012, respectively. At December 31, 2012 the Company had no amount owed to Dynamic.
Aircraft Leases
In June 2011, the Company entered into two aircraft leases with entities controlled by the Company’s Chairman and Chief Executive Officer (CEO). Pursuant to these aircraft leases, the Company has access to two, non-commercial aircraft that it can utilize from time to time to transport its personnel on a rental basis for appropriate business-only travel. In addition, the Company’s CEO and one other officer may also use the aircraft for personal travel. For the years ended December 31, 2011 and December 31, 2012, the Company made payments to the lessors as follows:
| 2011 | 2012 | |||||||
| Aerodynamic, LLC |
$ | 403,943 | $ | 605,000 | ||||
| Casafin II, LLC |
616,838 | 1,383,892 | ||||||
|
|
|
|
|
|||||
| $ | 1,020,781 | $ | 1,988,892 | |||||
|
|
|
|
|
|||||
F-35
Table of Contents
At December 31, 2012 the Company owed the lessors a combined total of $297,942.
Alliance Consulting Group Agreement
In January 2012, the Company entered into an agreement with Alliance Consulting Group. Alliance will build and operate a Wet and Dry processing plant that will perform the mining, processing and transportation of raw fracturing sand from these mines to support a portion of the Company’s fracturing sand needs as well as demand from other consumers of fracturing and other types of sand. The Company’s Chairman and Chief Executive Officer, Michel B. Moreno, has a controlling interest in Elle Investments, LLC which is a 50% owner of Alliance. The Company will pay Alliance $29 a ton for these services, approximately $29.0 million a year, and as of December 31, 2012 had prepaid Alliance $4.6 million which will offset future costs; which is classified with deposits, as a component of long-term assets, at December 31, 2012. The agreement between the Company and Alliance Consulting Group is in the process of being assumed, with the same terms, by a separate affiliate controlled by the Company’s CEO.
Chemrock Technologies, LLC Agreement
In February 2012, the Company entered into an agreement to purchase chemicals from Chemrock Technologies, LLC, a chemical company, in which MMR, one of the Company’s stockholders, had a 50% ownership interest. The contract called for preferred pricing to the Company. Chemrock provided the Company $0 and $29,987,749 in chemical products for the years ended December 31, 2011 and December 31, 2012, respectively. The agreement was cancelled in January, 2013. At December 31, 2012, the Company had no amount owed to Chemrock.
On February 28, 2013, the Company entered into an agreement to purchase chemicals from Chemrock Technologies, LLC. The contract calls for market pricing and may result in payments that could exceed $40.0 million dollars over eighteen months. The agreement requires a prepayment of $3.9 million to Chemrock which will be applied against future purchases. Of the required prepayment amount, $1.0 million has been paid. The Company may also purchase chemicals from unrelated vendors.
| NOTE 11 RETIREMENT | PLAN |
The employees of the Company are allowed to participate in the Profit Sharing 401 (k) Plan. The Plan covers all full-time employees of the Company who have one year of service and are age eighteen or older. They are subject to the provisions of the Employee Retirement Income Security Act of 1974 (ERISA). Each year (at the option of management) the Company may make profit sharing contributions. Participants may contribute up to 15 percent of their annual wages before bonuses and overtime. Employer contributions to the plan were $0 and $1,036,880 for the years ended December 31, 2011 and 2012, respectively.
| NOTE 12 COMMITMENTS | AND CONTINGENCIES |
Commitment to Purchase Equipment
The Company has approximately $50,124,022 of outstanding commitments for the purchase of additional equipment at December 31, 2012, of which approximately $25,884,122 of expenditures are expected to be incurred in 2013 in order to complete the construction of equipment of which $44,222,576 was reported as construction in progress at December 31, 2012. The remaining $24,239,900 of commitments are for additional equipment expenditures which may be deferred beyond 2013 and which are expected be used in our operations but which may also be used in our equipment construction activities as necessary. The outstanding commitments amount of $50,124,022 excludes deposits totaling $8,328,008 which are reflected as deposits in the Company’s balance sheet as of December 31, 2012.
F-36
Table of Contents
Multiple Year Lease of Two Sand Minds
Effective October 1, 2011, the Company entered into an agreement to lease two sand mines located in Louisiana and Mississippi. The lease is for 30 years and has a purchase option. A $2,000,000 payment was made at closing which included $1,137,500 for equipment, which is included in property, plant and equipment, and an upfront lease payment in the amount of $862,500 included with prepayments. In addition, the Company will pay royalties ranging from $1.50 to $2.50 per ton of sand sold. As of December 31, 2012, no amounts have been purchased under this lease agreement.
Sand Purchase Agreement
Effective October 28, 2011, the Company made arrangements to acquire 300,000 tons of northern white sand per year for four years from Great Northern Sand LLC (GNS), with monthly deliveries expected to begin in September 2012 and to continue through June 2016. The Company agreed to make an aggregate of $15 million of advance payments towards the purchase price of the sand through four equal payments of $3.75 million, scheduled for November 2011, February 2012, April 2012 and thereafter upon certain conditions being satisfied and will be included with deposits until sand is accepted under the agreement. The Company began taking delivery of sand in November 2012 and has commitments to take delivery of 300,000 tons per year through June 2016. If the Company does not take delivery of 300,000 tons per year, it is required to pay the counterparty for any shortfall in deliveries at the normal contractual rate. The Company is allowed to recoup this amount in the following year by taking delivery of the corresponding tonnage of sand. The Company will pay GNS a monthly fee per ton of sand delivered. The payment of the per ton fees will be offset by a certain amount per ton until such time that the $15 million of advance payments have been fully amortized. The amount of these advance payments expected to be realized within twelve months of the balance sheet date, approximately $3.6 million, is classified within other current assets at December 31, 2012. The remaining balance of $11.3 million is classified within deposits as a component of long-term assets at December 31, 2012.
Litigation
The Company is a defendant in litigation arising from the normal course of business. The opinion of management is that the various lawsuits are without merit and the Company intends to vigorously defend itself against the claims. Defense of these suits are in the preliminary stages and while no probable outcome can be determined at this time, management believes the Company will be successful in defending these claims. Accordingly, no estimated loss provision has been made in the accompanying financial statements.
| NOTE 13 CHANGE | IN CONTROL |
During May 2011, the Company, through a series of transactions had a change of control of the Company which required all assets and liabilities to be recognized at their fair value as of the date of the change of control. During the second quarter of 2012, the Company finalized its fair value assessment related to its transactions. The Company had preliminarily estimated the portion of revenue attributable to the turbine driven equipment. The Company updated that estimate based on actual jobs performed during 2012, which reduced the portion of the revenue attributable to the use of turbine driven equipment. That change decreased the fair value of contingent consideration by approximately $5.8 million. In addition, the Company completed the final amounts assigned to its intangible assets acquired, which reduced the fair value of intangible by $2.0 million. The offset to the Company’s adjustments reduced goodwill by $3.8 million.
F-37
Table of Contents
| Preliminary Allocation |
Final Adjustments |
Final Allocation |
||||||||||
| Cash and cash equivalents |
$ | 1,630,668 | $ | — | $ | 1,630,668 | ||||||
| Accounts receivable |
7,725,368 | — | 7,725,368 | |||||||||
| Inventories |
211,079 | — | 211,079 | |||||||||
| Prepaids |
451,263 | — | 451,263 | |||||||||
| Fixed Assets |
49,426,322 | — | 49,426,322 | |||||||||
| Intangibles |
13,993,000 | (2,028,000 | ) | 11,965,000 | ||||||||
| Goodwill |
9,422,335 | (3,775,000 | ) | 5,647,335 | ||||||||
| Other assets |
550,433 | — | 550,433 | |||||||||
|
|
|
|
|
|
|
|||||||
| Total assets |
$ | 83,410,468 | $ | (5,803,000 | ) | $ | 77,607,468 | |||||
|
|
|
|
|
|
|
|||||||
| Accounts payable |
$ | 1,553,729 | $ | — | $ | 1,553,729 | ||||||
| Accrued liabilities and other |
2,640,306 | — | 2,640,306 | |||||||||
| Debt |
59,863,683 | — | 59,863,683 | |||||||||
| Contingent consideration |
18,666,000 | (5,803,000 | ) | 12,863,000 | ||||||||
|
|
|
|
|
|
|
|||||||
| Total liabilities |
$ | 82,723,718 | $ | (5,803,000 | ) | $ | 76,920,718 | |||||
|
|
|
|
|
|
|
|||||||
On October 13, 2011, the Company and a former equity holder of the Company agreed to rescind its redemption agreement whereby the former equity holder received a 11.1% ownership interest in the Company in exchange for the payment of their $27.7 million receivable due from the Company. In connection therewith, the Company also entered into an agreement to amend the contingent consideration payable to the former equity owner by increasing the fair value of the potential payment by approximately $5 million. The Company’s CEO and existing shareholder has a one-third interest in this former equity holder. The rescission of the redemption agreement with the former equity holder was accounted for as an extinguishment of the obligation with the carrying value of the obligation, net of the change to the earn-out (see Note 14) recorded as an adjustment to the capital of the Company. In addition, the Company’s CEO and another former equity holder entered into an agreement whereby the Company’s CEO assumed the obligation to pay approximately $3 million to the former equity holder. This transaction is accounted for as a non cash capital contribution from the CEO.
| NOTE 14 FAIR | VALUE DISCLOSURE |
Fair Value Measurements
ASC 820, Fair Value Measurements and Disclosures (ASC 820), establishes a hierarchy that prioritizes inputs to valuation techniques used to measure fair value and requires companies to disclose the fair value of their financial instruments according to a fair value hierarchy (i.e., Level 1, 2, and 3 inputs, as defined). The fair value hierarchy gives the highest priority to quoted prices (unadjusted) in active markets for identical assets or liabilities and the lowest priority to unobservable inputs. Additionally, companies are required to provide enhanced disclosure regarding instruments in the Level 3 category (which use inputs to the valuation techniques that are unobservable and require significant management judgment), including a reconciliation of the beginning and ending balances separately for each major category of assets and liabilities.
Financial instruments measured and reported at fair value are classified and disclosed in one of the following categories:
Level 1 Inputs—Quoted prices (unadjusted) in active markets for identical assets or liabilities at the reporting date.
Level 2 Inputs—Quoted prices for similar assets or liabilities in active markets; quoted prices for identical or similar assets or liabilities that are not active; and inputs other than quoted market prices that are observable, such as models or other valuation methodologies.
F-38
Table of Contents
Level 3 Inputs—Unobservable inputs for the valuation of the asset or liability. Level 3 include assets or liabilities for which there is little, if any, market activity. These inputs require significant management judgment or estimation.
Assets and liabilities measured at fair value on a recurring basis at December 31, 2012 were as follows:
| Quoted Prices in Active Markets for Identical Assets (Level 1) |
Significant Other Observable Inputs (Level 2) |
Significant Unobservable Inputs (Level 3) |
Total December 31, 2012 |
|||||||||||||
| Assets |
$ | — | $ | — | $ | — | $ | — | ||||||||
|
|
|
|
|
|
|
|
|
|||||||||
| Liabilities |
||||||||||||||||
| Earnout Payable |
$ | — | $ | — | $ | 14,002,163 | $ | 14,002,163 | ||||||||
|
|
|
|
|
|
|
|
|
|||||||||
Assets and liabilities measured at fair value on a recurring basis at December 31, 2011 were as follows:
| Quoted Prices in Active Markets for Identical Assets (Level 1) |
Significant Other Observable Inputs (Level 2) |
Significant Unobservable Inputs (Level 3) |
Total December 31, 2011 |
|||||||||||||
| Assets |
$ | — | $ | — | $ | — | $ | — | ||||||||
|
|
|
|
|
|
|
|
|
|||||||||
| Liabilities |
||||||||||||||||
| Earnout Payable |
$ | — | $ | — | $ | 15,549,637 | $ | 15,549,637 | ||||||||
|
|
|
|
|
|
|
|
|
|||||||||
The fair value of the earn-out payable is determined using the estimated cash flows related to the Company’s revenue that is projected to be earned from the Company’s TDE (Turbine Driven Equipment). These cash flows are discounted using a discount rate that reflects the nature of the investment and the risk of the cash flows associated with the instrument adjusted at each reporting period. The Company used a discount rate of 15.5% and 14.2% for the fair value calculation as of December 31, 2011 and December 31, 2012, respectively. The Company’s calculation as of December 31, 2012 incorporated twelve months of accretion from the calculation as of December 31, 2011. The December 31, 2012 calculation also included a change in the projected revenue stream whereby a longer payment period was assumed based on the Company’s assessment of current market conditions. These changes resulted in a net decrease to the fair value of the contingent consideration as of December 31, 2012. There were no other significant changes to inputs used in the calculation as of December 31, 2012. The earn-out payable is classified as Level 3 within the fair value hierarchy.
The changes in Level 3 fair value measurements that are measured at fair value on a recurring basis at December 31, 2011 and 2012 were as follows:
| Earn-out payable | ||||
| Initial recognition, May 1, 2011 |
$ | 12,863,000 | ||
| Net change in fair value recognized as interest expense |
637,999 | |||
| Change in fair value resulting from October 2011 rescission, recorded as an adjustment to paid-in capital |
2,085,000 | |||
| Payments |
(36,362 | ) | ||
|
|
|
|||
| Balance, December 31, 2011 |
$ | 15,549,637 | ||
| Change in fair value recognized as an increase to additional paid in capital |
564,000 | |||
| Net change in fair value recognized as interest expense |
(2,104,200 | ) | ||
| Payments |
(7,274 | ) | ||
|
|
|
|||
| Balance, December 31, 2012 |
$ | 14,002,163 | ||
|
|
|
|||
F-39
Table of Contents
During 2012, the Company concluded it had made a computational error in 2011 related to an input used in the determination of the fair value of the contingent consideration. This amount was determined to be immaterial to the 2011 financial statements and accordingly the Company recorded the impact of the adjustment in 2012 as a reduction of paid-in capital and an increase to the contingent consideration of $564,000. The fair value of cash and cash equivalents and our variable rate debt approximated book value at December 31, 2011 and December 31, 2012. The fair value of our senior notes due 2016 approximated $247.1 million at December 31, 2012 and approximated book value at December 31, 2011. We used Level 3 inputs consistent with those used in our fair value measurement of the earn-out payable discussed above.
The Company applied fair value concepts in the recording of the assets and liabilities resulting from the change of control of the Company which required all assets and liabilities to be recognized at their fair value as of the date of the change of control (see Note 13—Change in Control). The fair value of all assets and liabilities was estimated using various methods, including for short-term assets and liabilities comparison to the historical amount adjusted for any credit risk, if any; for property, plant and equipment to historical appraisal values adjusted for economic depreciation and other factors; for intangible assets the income approach adjusted for various economic cost factors and the discounted net future cash benefit; and for contingent consideration the future estimated revenue stream discounted using a discount that reflects the nature of the investment and related risks. Significant inputs were historical financial data, current period cost information and various market interest rates. These inputs were considered Level 3 inputs.
| NOTE 15 EARNINGS | PER SHARE |
The Company had a net loss from operations for the year ended December 31, 2012 and for the eight month successor period ended December 31, 2011. Accordingly, the Company’s diluted per share calculation for these periods was equivalent to its basic net loss per share calculation because it excluded the assumed exercise of the warrants. Those instruments were excluded for these periods because they were considered to be anti-dilutive, meaning their inclusion would have reduced the reported net loss per share for these periods. The excluded warrants totaled 250,000 and would convert into 247,059 shares of common stock, if exercised.
| NOTE 16 GUARANTOR | FINANCIAL STATEMENTS |
The following condensed consolidating financial information includes information regarding Green Field Energy Services, Inc. (GFES), as parent, and Hub City Tools, Inc. (HCT), as guarantor. Included are the condensed consolidating balance sheets at December 31, 2012 and December 31, 2011 and the related condensed consolidated statements of operations and cash flow for the years ended at December 31, 2012 and December 31, 2011, which should be read in conjunction with the notes to these consolidated financial statements.
F-40
Table of Contents
GREEN FIELD ENERGY SERVICES, INC.
CONDENSED CONSOLIDATED BALANCE SHEETS
| GFES | HCT | Consolidated GFES |
||||||||||||||
| DECEMBER 31, 2012 |
DECEMBER 31, 2012 |
Eliminating | DECEMBER 31, 2012 |
|||||||||||||
| Assets |
||||||||||||||||
| Current assets: |
||||||||||||||||
| Cash |
$ | 8,428,264 | $ | 5,275 | $ | 8,433,539 | ||||||||||
| Accounts receivable—net of allowance |
27,595,658 | — | 27,595,658 | |||||||||||||
| Other receivables |
284,352 | 2,794 | 287,146 | |||||||||||||
| Note receivable |
282,000 | — | 282,000 | |||||||||||||
| Due from related parties |
296,202 | — | $ | (296,202 | ) | — | ||||||||||
| Inventory |
19,644,715 | — | 19,644,715 | |||||||||||||
| Prepaid expenses |
10,349,597 | 1,047 | 10,350,644 | |||||||||||||
|
|
|
|
|
|
|
|
|
|||||||||
| Total current assets |
66,880,788 | 9,116 | (296,202 | ) | 66,593,702 | |||||||||||
| Property, plant and equipment: |
||||||||||||||||
| Property and equipment |
222,323,023 | 620,272 | 222,943,295 | |||||||||||||
| Construction in progress |
44,222,576 | — | 44,222,576 | |||||||||||||
|
|
|
|
|
|
|
|
|
|||||||||
| Total property, plant and equipment |
266,545,599 | 620,272 | — | 267,165,871 | ||||||||||||
| Less accumulated depreciation |
(25,255,946 | ) | (178,944 | ) | (25,434,890 | ) | ||||||||||
|
|
|
|
|
|
|
|
|
|||||||||
| Net property, plant and equipment |
241,289,653 | 441,328 | — | 241,730,981 | ||||||||||||
|
|
|
|
|
|
|
|
|
|||||||||
| Other assets: |
||||||||||||||||
| Deposits |
26,369,279 | 3,200 | 26,372,479 | |||||||||||||
| Loan costs—net of accumulated amortization |
8,177,422 | — | 8,177,422 | |||||||||||||
| Intangible assets |
10,396,416 | — | 10,396,416 | |||||||||||||
| Goodwill |
5,647,335 | — | 5,647,335 | |||||||||||||
| Other |
— | — | — | |||||||||||||
|
|
|
|
|
|
|
|
|
|||||||||
| Total other assets |
50,590,452 | 3,200 | — | 50,593,652 | ||||||||||||
|
|
|
|
|
|
|
|
|
|||||||||
| Total assets |
$ | 358,760,893 | $ | 453,644 | $ | (296,202 | ) | $ | 358,918,335 | |||||||
|
|
|
|
|
|
|
|
|
|||||||||
| Liabilities and Stockholders’ Equity |
||||||||||||||||
| Current liabilities: |
||||||||||||||||
| Accounts payable |
$ | 30,408,847 | $ | — | $ | 30,408,847 | ||||||||||
| Accrued liabilities |
22,458,837 | — | 22,458,837 | |||||||||||||
| Notes payable |
1,230,179 | — | 1,230,179 | |||||||||||||
| Current portion of long-term debt |
52,229,548 | — | 52,229,548 | |||||||||||||
| Current portion of capital lease obligation |
1,118,108 | — | 1,118,108 | |||||||||||||
| Current earn-out payable |
1,078,204 | — | 1,078,204 | |||||||||||||
| Due to related parties |
— | 296,202 | $ | (296,202 | ) | — | ||||||||||
| Deferred income tax |
— | — | — | |||||||||||||
| Deferred income |
2,916,282 | — | 2,916,282 | |||||||||||||
|
|
|
|
|
|
|
|
|
|||||||||
| Total current liabilities |
111,440,005 | 296,202 | (296,202 | ) | 111,440,005 | |||||||||||
| Long-term liabilities: |
||||||||||||||||
| Long-term debt, net of current portion |
236,681,828 | — | 236,681,828 | |||||||||||||
| Capital lease obligation, net of current portion |
5,052,797 | — | 5,052,797 | |||||||||||||
| Earn-out payable, net of current portion |
12,923,959 | — | 12,923,959 | |||||||||||||
|
|
|
|
|
|
|
|
|
|||||||||
| Total long-term liabilities |
254,658,584 | — | — | 254,658,584 | ||||||||||||
| Stockholders’ equity: |
||||||||||||||||
| Common stock—$.01 par value, authorized 2,000,000 shares, issued and outstanding, 1,400,000 shares |
14,000 | — | 14,000 | |||||||||||||
| Preferred stock—$.01 par value, authorized 150,000 shares, issued and outstanding, 0 and 100,000 shares, respectively |
1,000 | — | 1,000 | |||||||||||||
| Additional paid in capital |
93,954,335 | — | 93,954,335 | |||||||||||||
| Accumulated deficit |
(101,307,031 | ) | 157,442 | (101,149,589 | ) | |||||||||||
|
|
|
|
|
|
|
|
|
|||||||||
| Total stockholders’ equity |
(7,337,696 | ) | 157,442 | — | (7,180,254 | ) | ||||||||||
|
|
|
|
|
|
|
|
|
|||||||||
| Total liabilities and stockholders’ equity |
$ | 358,760,893 | $ | 453,644 | $ | (296,202 | ) | $ | 358,918,335 | |||||||
|
|
|
|
|
|
|
|
|
|||||||||
The accompanying notes are an integral part of these consolidated financial statements
F-41
Table of Contents
GREEN FIELD ENERGY SERVICES, INC.
CONDENSED CONSOLIDATED BALANCE SHEETS
| GFES | HCT | Eliminating | Consolidated GFES |
|||||||||||||
| DECEMBER 31, 2011 |
DECEMBER 31, 2011 |
DECEMBER 31, 2011 |
||||||||||||||
| Assets |
||||||||||||||||
| Current assets: |
||||||||||||||||
| Cash |
$ | 87,113,110 | $ | 5,275 | $ | 87,118,385 | ||||||||||
| Accounts receivable—net of allowance |
3,965,654 | — | 3,965,654 | |||||||||||||
| Other receivables |
15,689 | 2,794 | 18,483 | |||||||||||||
| Note receivable |
— | — | — | |||||||||||||
| Due from related parties |
316,731 | — | $ | (296,402 | ) | 20,329 | ||||||||||
| Inventory |
347,489 | — | 347,489 | |||||||||||||
| Prepaid expenses |
1,768,086 | 1,047 | 1,769,133 | |||||||||||||
|
|
|
|
|
|
|
|
|
|||||||||
| Total current assets |
93,526,759 | 9,116 | (296,402 | ) | 93,239,473 | |||||||||||
| Property, plant and equipment: |
||||||||||||||||
| Property and equipment |
54,780,414 | 620,272 | 55,400,686 | |||||||||||||
| Construction in progress |
115,415,402 | — | 115,415,402 | |||||||||||||
|
|
|
|
|
|
|
|
|
|||||||||
| Total property, plant and equipment |
170,195,816 | 620,272 | — | 170,816,088 | ||||||||||||
| Less accumulated depreciation |
(5,136,453 | ) | (71,566 | ) | (5,208,019 | ) | ||||||||||
|
|
|
|
|
|
|
|
|
|||||||||
| Net property, plant and equipment |
165,059,363 | 548,706 | — | 165,608,069 | ||||||||||||
|
|
|
|
|
|
|
|
|
|||||||||
| Other assets: |
||||||||||||||||
| Deposits |
4,907,146 | 3,400 | 4,910,546 | |||||||||||||
| Loan costs—net of accumulated amortization |
8,136,473 | — | 8,136,473 | |||||||||||||
| Intangible assets |
11,246,728 | — | 11,246,728 | |||||||||||||
| Goodwill |
5,647,335 | — | 5,647,335 | |||||||||||||
| Other |
10,589 | — | 10,589 | |||||||||||||
|
|
|
|
|
|
|
|
|
|||||||||
| Total other assets |
29,948,271 | 3,400 | — | 29,951,671 | ||||||||||||
|
|
|
|
|
|
|
|
|
|||||||||
| Total assets |
$ | 288,534,393 | $ | 561,222 | $ | (296,402 | ) | $ | 288,799,213 | |||||||
|
|
|
|
|
|
|
|
|
|||||||||
| Liabilities and Stockholders’ Equity |
||||||||||||||||
| Current liabilities: |
||||||||||||||||
| Accounts payable |
$ | 1,026,819 | $ | — | $ | 1,026,819 | ||||||||||
| Accrued liabilities |
18,884,139 | — | 18,884,139 | |||||||||||||
| Notes payable |
429,604 | — | 429,604 | |||||||||||||
| Current portion of long-term debt |
156,969 | — | 156,969 | |||||||||||||
| Current portion of capital lease obligation |
— | — | — | |||||||||||||
| Current earn-out payable |
2,520,000 | — | 2,520,000 | |||||||||||||
| Due to related parties |
— | 296,402 | $ | (296,402 | ) | — | ||||||||||
| Deferred income tax |
2,478,000 | — | 2,478,000 | |||||||||||||
| Deferred income |
— | — | — | |||||||||||||
|
|
|
|
|
|
|
|
|
|||||||||
| Total current liabilities |
25,495,531 | 296,402 | (296,402 | ) | 25,495,531 | |||||||||||
| Long-term liabilities: |
||||||||||||||||
| Long-term debt, net of current portion |
192,294,261 | — | 192,294,261 | |||||||||||||
| Capital lease obligation, net of current portion |
— | — | — | |||||||||||||
| Earn-out payable, net of current portion |
13,029,637 | — | 13,029,637 | |||||||||||||
|
|
|
|
|
|
|
|
|
|||||||||
| Total long-term liabilities |
205,323,898 | — | — | 205,323,898 | ||||||||||||
| Stockholders’ equity: |
||||||||||||||||
| Common stock—$.01 par value, authorized 2,000,000 shares, issued and outstanding, 1,400,000 shares |
14,000 | — | 14,000 | |||||||||||||
| Preferred stock—$.01 par value, authorized 150,000 shares, issued and outstanding, 0 and 100,000 shares, respectively |
— | — | — | |||||||||||||
| Additional paid in capital |
84,519,335 | — | 84,519,335 | |||||||||||||
| Accumulated deficit |
(26,818,371 | ) | 264,820 | (26,553,551 | ) | |||||||||||
|
|
|
|
|
|
|
|
|
|||||||||
| Total stockholders’ equity |
57,714,964 | 264,820 | — | 57,979,784 | ||||||||||||
|
|
|
|
|
|
|
|
|
|||||||||
| Total liabilities and stockholders’ equity |
$ | 288,534,393 | $ | 561,222 | $ | (296,402 | ) | $ | 288,799,213 | |||||||
|
|
|
|
|
|
|
|
|
|||||||||
The accompanying notes are an integral part of these consolidated financial statements
F-42
Table of Contents
GREEN FIELD ENERGY SERVICES, INC.
CONDENSED CONSOLIDATED STATEMENTS OF OPERATIONS
| GFES | HCT | Consolidated GFES |
||||||||||
| YEAR ENDED DECEMBER 31, 2012 |
YEAR ENDED DECEMBER 31, 2012 |
YEAR ENDED DECEMBER 31, 2012 |
||||||||||
| Revenue |
$ | 144,782,856 | $ | — | $ | 144,782,856 | ||||||
| Operating costs: |
||||||||||||
| Costs of revenue |
147,112,827 | — | 147,112,827 | |||||||||
| Provision for doubtful accounts |
6,303,916 | — | 6,303,916 | |||||||||
| Selling and administrative expenses |
22,286,430 | 50 | 22,286,480 | |||||||||
| Depreciation and amortization |
21,062,651 | 107,378 | 21,170,029 | |||||||||
|
|
|
|
|
|
|
|||||||
| Total operating costs |
196,765,824 | 107,428 | 196,873,252 | |||||||||
|
|
|
|
|
|
|
|||||||
| Loss from operations |
(51,982,968 | ) | (107,428 | ) | (52,090,396 | ) | ||||||
| Other income (expense): |
||||||||||||
| Interest expense |
(23,864,482 | ) | — | (23,864,482 | ) | |||||||
| Other expense |
(277,831 | ) | — | (277,831 | ) | |||||||
|
|
|
|
|
|
|
|||||||
| Net other expense |
(24,142,313 | ) | — | (24,142,313 | ) | |||||||
|
|
|
|
|
|
|
|||||||
| Loss before provision for income tax |
(76,125,281 | ) | (107,428 | ) | (76,232,709 | ) | ||||||
| Income tax expense (benefit) |
(1,636,671 | ) | — | (1,636,671 | ) | |||||||
|
|
|
|
|
|
|
|||||||
| Net loss |
$ | (74,488,610 | ) | $ | (107,428 | ) | $ | (74,596,038 | ) | |||
|
|
|
|
|
|
|
|||||||
The accompanying notes are an integral part of these consolidated financial statements.
F-43
Table of Contents
GREEN FIELD ENERGY SERVICES, INC.
CONDENSED CONSOLIDATED STATEMENTS OF OPERATIONS
| GFES | HCT | Consolidated GFES |
||||||||||
| YEAR ENDED DECEMBER 31, 2011 |
YEAR ENDED DECEMBER 31, 2011 |
YEAR ENDED DECEMBER 31, 2011 |
||||||||||
| Revenue |
$ | 33,070,913 | $ | — | $ | 33,070,913 | ||||||
| Operating costs: |
||||||||||||
| Costs of revenue |
25,416,172 | — | 25,416,172 | |||||||||
| Provision for doubtful accounts |
108,722 | — | 108,722 | |||||||||
| Selling and administrative expenses |
13,543,853 | 3,127 | 13,546,980 | |||||||||
| Depreciation and amortization |
11,011,679 | 107,860 | 11,119,539 | |||||||||
|
|
|
|
|
|
|
|||||||
| Total operating costs |
50,080,426 | 110,987 | 50,191,413 | |||||||||
|
|
|
|
|
|
|
|||||||
| Loss from operations |
(17,009,513 | ) | (110,987 | ) | (17,120,500 | ) | ||||||
| Other income (expense): |
||||||||||||
| Interest expense |
(4,885,935 | ) | — | (4,885,935 | ) | |||||||
| Other income (expense) |
(1,433,514 | ) | 1,192 | (1,432,322 | ) | |||||||
|
|
|
|
|
|
|
|||||||
| Net other expense |
(6,319,449 | ) | 1,192 | (6,318,257 | ) | |||||||
|
|
|
|
|
|
|
|||||||
| Loss before provision for income tax |
(23,328,962 | ) | (109,795 | ) | (23,438,757 | ) | ||||||
| Income tax expense (benefit) |
2,618,790 | (26,032 | ) | 2,592,758 | ||||||||
|
|
|
|
|
|
|
|||||||
| Net loss |
$ | (25,947,752 | ) | $ | (83,763 | ) | $ | (26,031,515 | ) | |||
|
|
|
|
|
|
|
|||||||
The accompanying notes are an integral part of these consolidated financial statements.
F-44
Table of Contents
GREEN FIELD ENERGY SERVICES, INC.
CONDENSED CONSOLIDATED STATEMENTS OF CASH FLOWS
| GFES | HCT | Consolidated GFES |
||||||||||
| YEAR ENDED DECEMBER 31, 2012 |
YEAR ENDED DECEMBER 31, 2012 |
YEAR ENDED DECEMBER 31, 2012 |
||||||||||
| CASH FLOWS FROM OPERATING ACTIVITIES |
||||||||||||
| Net cash used by operating activities |
$ | (81,526,650 | ) | $ | — | $ | (81,526,650 | ) | ||||
|
|
|
|
|
|
|
|||||||
| CASH FLOWS FROM INVESTING ACTIVITIES |
||||||||||||
| Net cash used by investing activities |
(98,100,519 | ) | — | (98,100,519 | ) | |||||||
|
|
|
|
|
|
|
|||||||
| CASH FLOWS FROM FINANCING ACTIVITIES |
||||||||||||
| Net cash provided by financing activities |
100,942,323 | — | 100,942,323 | |||||||||
|
|
|
|
|
|
|
|||||||
| Net decrease in cash |
(78,684,846 | ) | — | (78,684,846 | ) | |||||||
| CASH AND CASH EQUIVALENTS, beginning of year |
87,113,110 | 5,275 | 87,118,385 | |||||||||
|
|
|
|
|
|
|
|||||||
| CASH AND CASH EQUIVALENTS, end of year |
$ | 8,428,264 | $ | 5,275 | $ | 8,433,539 | ||||||
|
|
|
|
|
|
|
|||||||
| SUPPLEMENTAL DISCLOSURES OF CASH FLOW INFORMATION: |
||||||||||||
| Interest paid |
$ | 16,406,572 | $ | — | $ | 16,406,572 | ||||||
|
|
|
|
|
|
|
|||||||
| Income taxes paid |
$ | — | $ | — | $ | 201,850 | ||||||
|
|
|
|
|
|
|
|||||||
| NON-CASH TRANSACTIONS: |
||||||||||||
| Capital leases |
$ | 6,761,577 | $ | — | $ | 6,761,577 | ||||||
|
|
|
|
|
|
|
|||||||
The accompanying notes are an integral part of these consolidated financial statements.
F-45
Table of Contents
GREEN FIELD ENERGY SERVICES, INC.
CONDENSED CONSOLIDATED STATEMENTS OF CASH FLOWS
| GFES | HCT | Consolidated GFES |
||||||||||
| YEAR ENDED DECEMBER 31, 2011 |
YEAR ENDED DECEMBER 31, 2011 |
YEAR ENDED DECEMBER 31, 2011 |
||||||||||
| CASH FLOWS FROM OPERATING ACTIVITIES |
||||||||||||
| Net cash used by operating activities |
$ | 2,015,177 | $ | (775 | ) | $ | 2,014,402 | |||||
|
|
|
|
|
|
|
|||||||
| CASH FLOWS FROM INVESTING ACTIVITIES |
||||||||||||
| Net cash used by investing activities |
(120,588,163 | ) | — | (120,588,163 | ) | |||||||
|
|
|
|
|
|
|
|||||||
| CASH FLOWS FROM FINANCING ACTIVITIES |
||||||||||||
| Net cash provided by financing activities |
204,853,433 | — | 204,853,433 | |||||||||
|
|
|
|
|
|
|
|||||||
| Net decrease in cash |
86,280,447 | (775 | ) | 86,279,672 | ||||||||
| CASH AND CASH EQUIVALENTS, beginning of year |
831,773 | 6,940 | 838,713 | |||||||||
|
|
|
|
|
|
|
|||||||
| CASH AND CASH EQUIVALENTS, end of year |
$ | 87,112,220 | $ | 6,165 | $ | 87,118,385 | ||||||
|
|
|
|
|
|
|
|||||||
| SUPPLEMENTAL DISCLOSURES OF CASH FLOW INFORMATION: |
||||||||||||
| Interest paid |
$ | 3,860,019 | $ | — | $ | 3,860,019 | ||||||
|
|
|
|
|
|
|
|||||||
| Income taxes paid |
$ | — | $ | — | $ | — | ||||||
|
|
|
|
|
|
|
|||||||
| NON-CASH TRANSACTIONS: |
||||||||||||
| Capital leases |
$ | — | $ | — | $ | — | ||||||
|
|
|
|
|
|
|
|||||||
The accompanying notes are an integral part of these consolidated financial statements.
F-46
Table of Contents

247,058 Shares of Common Stock
Prospectus
, 2013
Until , 2013, all dealers that effect transactions in these securities, whether or not participating in this offering, may be required to deliver a prospectus. This is in addition to the dealers’ obligation to deliver a prospectus when acting as underwriters and with respect to their unsold allotments or subscriptions.
Table of Contents
PART II
INFORMATION NOT REQUIRED IN PROSPECTUS
| Item 13. | Other Expenses of Issuance and Distribution. |
Set forth below are the expenses (other than underwriting discounts and commissions and the structuring fee) expected to be incurred in connection with the issuance and distribution of the securities registered hereby. With the exception of the SEC registration fee, the FINRA filing fee and the NYSE listing fee, the amounts set forth below are estimates.
| SEC registration fee |
$ | 0.29 | ||
| Printing and engraving expenses |
* | |||
| Accounting fees and expenses |
* | |||
| Legal fees and expenses |
* | |||
| Transfer agent and registrar fees |
* | |||
| Miscellaneous |
* | |||
|
|
|
|||
| Total |
$ | * | ||
|
|
|
| * | To be provided by amendment. |
| Item 14. | Indemnification of Directors and Officers. |
General Corporation Law
The Company is incorporated under the laws of the State of Delaware. Section 145 (“Section 145”) of the General Corporation Law of the State of Delaware, as the same exists or may hereafter be amended (the “General Corporation Law”), inter alia, provides that a Delaware corporation may indemnify any persons who were, are or are threatened to be made, parties to any threatened, pending or completed action, suit or proceeding, whether civil, criminal, administrative or investigative (other than an action by or in the right of such corporation), by reason of the fact that such person is or was an officer, director, employee or agent of such corporation, or is or was serving at the request of such corporation as a director, officer, employee or agent of another corporation or enterprise. The indemnity may include expenses (including attorneys’ fees), judgments, fines and amounts paid in settlement actually and reasonably incurred by such person in connection with such action, suit or proceeding, provided such person acted in good faith and in a manner he reasonably believed to be in or not opposed to the corporation’s best interests and, with respect to any criminal action or proceeding, had no reasonable cause to believe that his conduct was illegal. A Delaware corporation may indemnify any persons who are, were or are threatened to be made, a party to any threatened, pending or completed action or suit by or in the right of the corporation by reason of the fact that such person was a director, officer, employee or agent of such corporation, or is or was serving at the request of such corporation as a director, officer, employee or agent of another corporation or enterprise. The indemnity may include expenses (including attorneys’ fees) actually and reasonably incurred by such person in connection with the defense or settlement of such action or suit, provided such person acted in good faith and in a manner he reasonably believed to be in or not opposed to the corporation’s best interests, provided that no indemnification is permitted without judicial approval if the officer, director, employee or agent is adjudged to be liable to the corporation. Where an officer, director, employee or agent is successful on the merits or otherwise in the defense of any action referred to above, a Delaware corporation must indemnify him against the expenses which such officer or director has actually and reasonably incurred.
Section 145 further authorizes a corporation to purchase and maintain insurance on behalf of any person who is or was a director, officer, employee or agent of the corporation, or is or was serving at the request of the corporation as a director, officer, employee or agent of another corporation or enterprise, against any liability asserted against him and incurred by him in any such capacity, arising out of his status as such, whether or not the corporation would otherwise have the power to indemnify him under Section 145.
II-1
Table of Contents
Certificate of Incorporation and Bylaws
The Company’s Certificate of Incorporation and Bylaws provide for the indemnification of officers and directors to the fullest extent permitted by the General Corporation Law.
Liability Insurance
The Company’s directors and officers are covered under directors’ and officers’ liability insurance policies maintained by us.
Insofar as indemnification for liabilities arising under the Securities Act may be permitted to directors, officers and controlling persons of the registrant pursuant to the provisions described under Item 20 or otherwise, the registrant has been advised that in the opinion of the SEC such indemnification is against public policy as expressed in the Securities Act and is, therefore, unenforceable. In the event that a claim for indemnification against such liabilities (other than the payment by the registrant of expenses incurred or paid by a director, officer or controlling person of the registrant in the successful defense of any action, suit or proceeding) is asserted by such director, officer or controlling person in connection with the securities being registered, the registrant will, unless in the opinion of counsel the matter has been settled by controlling precedent, submit to a court of appropriate jurisdiction the question whether such indemnification by it is against public policy as expressed in the Securities Act and will be governed by the final adjudication of such issue.
| Item 15. | Recent Sales of Unregistered Securities. |
On November 15, 2011, the Company issued 250,000 units, each consisting of $1,000 principal amount of 13% senior secured notes due 2016 and one warrant to purchase .988235 shares of the Company’s common stock. The units were issued at a price of $990 per unit and resulted in net proceeds of $241.6 million after deducting fees and expenses related to the offering. The Company originally sold the Units to Jefferies & Company, Inc., the initial purchaser, under the terms of a purchase agreement dated November 9, 2011. The initial purchaser subsequently resold the Units to qualified institutional buyers in reliance on Rule 144A and Regulation S under the Securities Act.
In October 2012, the Company agreed to pay our the holders of our notes issued November 15, 2011 a consent fee in connection with a consent solicitation. The consent fee was in the amount of 2.5% of the principal amount of any notes with respect to which consents were validly delivered. This consent fee was payable in the form of new notes issued under and governed by the terms and conditions of our indenture, as supplemented. Upon receipt and acceptance of consents for all the notes then outstanding, we issued $5,948,000 in aggregate principal amount of new notes.
In October 2012, the Company issued non-voting, non-convertible preferred stock that is not entitled to dividends to its existing shareholders in exchange for $10.0 million in gross proceeds and secured a commitment to purchase from time to time additional shares of preferred stock at a price per share equal to the fair market value of such shares yielding gross proceeds to us equal to the amount by which $10.0 million exceeds the aggregate cash on hand for the Company and its consolidated subsidiaries as at the last business day of any fiscal quarter; provided that in no event will such shareholders be required to purchase more than $15.0 million in additional shares in the aggregate.
In April 2013, the Registrant granted a 124,466 shares of the Registrant’s common stock to Mr. Fontova, the President of the Registrant. This issuance of securities was exempt from registration under the Securities Act of 1933, as amended, in reliance on Section 4(2) of the Securities Act of 1933, as amended, and Regulation D promulgated thereunder, as transactions by an issuer not involving any public offering. Mr. Fontova represented that he was an accredited investor and that he was acquiring the securities for investment only and not with a view toward the public sale or distribution thereof. Mr. Fontova received written disclosures that the securities had not been registered under the Securities Act of 1933, as amended, and that any resale must be made pursuant
II-2
Table of Contents
to a registration statement or an available exemption from registration. Mr. Fontova has adequate access, through his relationship with the Registrant, to financial statement and non-financial statement information about the Registrant. The sale of these securities was made without general solicitation or advertising.
| Item 16. | Exhibits and Financial Statement Schedules. |
(a) The exhibits listed below in the “Index to Exhibits” are part of this Registration Statement on Form S-1 and are numbered in accordance with Item 601 of Regulation S-K.
(b) Financial Statement Schedules.
Financial statement schedules are omitted because they are not required or the required information is shown in our financial statements or notes thereto.
| Item 17. | Undertakings. |
Insofar as indemnification for liabilities arising under the Securities Act may be permitted to directors, officers and controlling persons of the registrant pursuant to the foregoing provisions, or otherwise, the registrant has been advised that in the opinion of the Securities and Exchange Commission such indemnification is against public policy as expressed in the Securities Act and is, therefore, unenforceable. In the event that a claim for indemnification against such liabilities (other than the payment by the registrant of expenses incurred or paid by a director, officer or controlling person of the registrant in the successful defense of any action, suit or proceeding) is asserted by such director, officer or controlling person in connection with the securities being registered, the registrant will, unless in the opinion of its counsel the matter has been settled by controlling precedent, submit to a court of appropriate jurisdiction the question of whether such indemnification by it is against public policy as expressed in the Securities Act and will be governed by the final adjudication of such issue.
The undersigned registrant hereby undertakes that:
| (1) | to file, during any period in which offers or sales are being made, a post-effective amendment to this registration statement: |
(a) to include any prospectus required by section 10(a)(3) of the Securities Act;
(b) to reflect in the prospectus any facts or events arising after the effective date of the registration statement (or the most recent post-effective amendment thereof) which, individually or in the aggregate, represent a fundamental change in the information in the registration statement. Notwithstanding the foregoing, any increase or decrease in volume of securities offered (if the total dollar value of securities offered would not exceed that which was registered) and any deviation from the low or high end of the estimated maximum offering range may be reflected in the form of prospectus filed with the SEC pursuant to Rule 424(b) if, in the aggregate, the changes in volume and price represent no more than a 20% change in the maximum aggregate offering price set forth in the “Calculation of Registration Fee” table in the effective registration statement;
(c) to include any material information with respect to the plan of distribution not previously disclosed in the registration statement or any material change to such information in the registration statement;
| (2) | that, for the purpose of determining any liability under the Securities Act, each such post-effective amendment shall be deemed to be a new registration statement relating to the securities offered therein, and the offering of such securities at that time shall be deemed to be the initial bona fide offering thereof; and |
| (3) | to remove from registration by means of a post-effective amendment any of the securities being registered which remain unsold at the termination of the offering. |
II-3
Table of Contents
SIGNATURES
Pursuant to the requirements of the Securities Act of 1933, as amended, the registrant has duly caused this registration statement to be signed on its behalf by the undersigned, thereunto duly authorized, in the City of Lafayette, State of Louisiana, on June 14, 2013.
| Green Field Energy Services, Inc. | ||
| By: | /S/ MICHEL B. MORENO | |
| Michel B. Moreno | ||
| Chief Executive Officer and Director | ||
Pursuant to the requirements of the Securities Act of 1933, as amended, this registration statement has been signed below by the following persons in the capacities indicated on June 14, 2013.
| Signature |
Title | |
| /S/ MICHEL B. MORENO Michel B. Moreno |
Chief Executive Officer and Director (Principal Executive Officer) | |
| /S/ EARL J. BLACKWELL Earl J. Blackwell |
Chief Financial Officer | |
| /S/ * Enrique Fontova |
President and Director | |
| /S/ * Charlie Kilgore |
Director | |
| /S/ * Mark Knight |
Director | |
| *By: | /S/ EARL J. BLACKWELL | |
| Earl J. Blackwell Attorney-in-Fact | ||
II-4
Table of Contents
INDEX TO EXHIBITS
| Exhibit |
Title | |
| 3.1 | Certificate of Incorporation, as amended, of Green Field Energy Services, Inc. | |
| 3.2 | Bylaws of Green Field Energy Services, Inc. | |
| 3.3 | Amendment No. 2 to the Certificate of Incorporation of Green Field Energy Services, Inc. | |
| 4.1 | Indenture dated November 15, 2011 by and among Green Field Energy Services, Inc., Hub City Tools, Inc., as guarantor, and Wilmington Trust, National Association, as Trustee | |
| 4.2 | Form of 13% Senior Secured Note due 2016 (included in Exhibit 4.1) | |
| 4.3 | Debt Registration Rights Agreement dated November 15, 2011 by and among Green Field Energy Services, Inc., Hub City Tools, Inc., as guarantor, and Jefferies & Company, Inc. | |
| 4.4 | Form of Exchange Note | |
| 4.5 | Warrant Agreement dated November 15, 2011 by and between Green Field Energy Services, Inc. and Wilmington Trust, National Association, as Warrant Agent | |
| 4.6 | Form of Warrant (included in Exhibit 4.5) | |
| 4.7 | Equity Registration Rights Agreement dated November 15, 2011 by and among Green Field Energy Services, Inc. and Jefferies & Company, Inc. | |
| 4.8 | Supplemental Indenture, dated October 23, 2012 by and among Green Field Energy Services, Inc., Hub City Tools, Inc., as guarantor, and Wilmington Trust National Association, as trustee and Collateral Agent | |
| 4.9 | Share Purchase Agreement, dated as of October 24, 2012 by and among Green Field Energy Services, Inc., MOR MGH Holdings, L.L.C., and Moreno & Rucks, L.L.C. | |
| 4.10 | Amendment No. 1 to Warrant Agreement dated October 24, 2012 by and between Green Field Energy Services, Inc. and Wilmington Trust, National Association, as Warrant Agent, MOR MGH Holdings, L.L.C., and Moody Moreno & Rucks, L.L.C. as Shareholders. | |
| 4.11 | Amendment No. 1 to Debt Registration Rights Agreement dated October 24, 2012 by and between Green Field Energy Services, Inc., Hub City Tools, Inc. and Jefferies & Company, Inc. | |
| 5.1 | Opinion of Latham & Watkins LLP | |
| 5.2 | Opinion of Babineaux, Poché, Anthony & Slavich L.L.C. | |
| 10.1 | Employment Agreement, dated October 24, 2011, by and between Green Field Energy Services, Inc. and Michel B. Moreno | |
| 10.2 | Amendment to Employment Agreement, dated April 13, 2012, by and between Green Field Energy Services, Inc. and Michel B. Moreno | |
| 10.3 | Employment Agreement, effective as of October 6, 2011, by and between Green Field Energy Services, Inc. and Enrique Fontova | |
| 10.4 | Employment Agreement, effective as of May 1, 2011, by and between Green Field Energy Services, Inc. and Earl J. Blackwell | |
| 10.5 | Second Amended and Restated Employment, Non-Disclosure and Non-Compete Agreement, effective as of May 1, 2011, by and between Green Field Energy Services, Inc. (f/k/a Hub City Industries, L.L.C.) and John M. Egle | |
| 10.6*† | Contract for High Pressure Fracturing Services dated effective as of September 2, 2011 between Green Field Energy Services, Inc. (f/k/a Hub City Industries, L.L.C.) and SWEP I LP (d/b/a Shell Western E&P) | |
II-5
Table of Contents
| Exhibit |
Title | |
| 10.7* | Amendment to Contract for High Pressure Fracturing Services between Green Field Energy Services, Inc. (f/k/a Hub City Industries, L.L.C.) and SWEP I LP (d/b/a Shell Western E&P) | |
| 10.8* | Second Amendment to Contract for High Pressure Fracturing Services dated November 9, 2011 between Green Field Energy Services, Inc. (f/k/a Hub City Industries, L.L.C.) and SWEP I LP (d/b/a Shell Western E&P) | |
| 10.9*† | Third Amendment to Contract for High Pressure Fracturing Services dated April 26, 2012 between Green Field Energy Services, Inc. (f/k/a Hub City Industries, L.L.C.) and SWEP I LP (d/b/a Shell Western E&P) | |
| 10.10 | Intercreditor Agreement dated as of May 2, 2012 among Green Field Energy Services, Inc., Hub City Tools, Inc., SWEP I, LP, and Wilmington Trust, National Association | |
| 10.11† | Security Agreement dated as of November 15, 2011 among Green Field Energy Services, Inc. and certain of its subsidiaries, and Wilmington Trust, National Association, as collateral agent | |
| 10.12† | Lease Agreement with Option to Purchase dated as of October 1, 2011 by and between Green Field Energy Services, Inc. (f/k/a Green Field Energy Services, L.L.C.) and Mass Prentiss Blackwell, Jr. | |
| 10.13† | Sand Mining and Refining Agreement dated effective January 23, 2012 by and between Green Field Energy Services, Inc. and Alliance Consulting Group, L.L.C. | |
| 10.14† | Master Purchase Order Agreement dated effective as of February 28, 2013 by and between Green Field Energy Services, Inc. and ChemRock Technologies, L.L.C. | |
| 10.15† | Plant Construction Reimbursement and Sales Agreement dated as of October 28, 2011 by and between Green Field Energy Services, Inc. (f/k/a Green Field Energy Services, L.L.C.) and Great Northern Sand LLC | |
| 10.16† | Amendment to Plant Construction Reimbursement and Sales Agreement dated as of October 28, 2011 by and between Green Field Energy Services, Inc. (f/k/a Green Field Energy Services, L.L.C.) and Great Northern Sand LLC | |
| 10.17 | Operating Agreement of Turbine Powered Technology, LLC. dated effective as of September 22, 2011 by and between Green Field Energy Services, Inc. (f/k/a Green Field Energy Services, LLC) and MTT Properties, LLC | |
| 10.18 | First Amendment to Operating Agreement of Turbine Powered Technology, LLC. dated as of October 28, 2011 by and between Green Field Energy Services, Inc. (f/k/a Green Field Energy Services, LLC) and MTT Properties, LLC | |
| 10.19 | Second Amendment to Operating Agreement of Turbine Powered Technology, LLC dated as of November 9, 2011 by and between Green Field Energy Services, Inc. (f/k/a Green Field Energy Services, LLC) and MTT Properties, LLC | |
| 10.20† | Equipment Purchase Agreement dated effective as of July 8, 2011 by and between Green Field Energy Services, Inc. (f/k/a Hub City Industries, L.L.C.) and Marine Turbine Technologies, L.L.C. | |
| 10.21 | Amendment to Equipment Purchase Agreement dated effective as of September 22, 2011 by and between Green Field Energy Services, Inc. (f/k/a Hub City Industries, L.L.C.) and Marine Turbine Technologies, L.L.C. | |
| 10.22† | Turbine Driven Equipment Maintenance Agreement dated effective as of September 22, 2011 by and between Green Field Energy Services, Inc. and Turbine Powered Technology, LLC | |
| 10.23† | Turbine Driven Equipment Installation Agreement dated effective as of September 22, 2011 by and between Green Field Energy Services, Inc. and Turbine Powered Technology, LLC | |
II-6
Table of Contents
| Exhibit |
Title | |
| 10.24 | Turbine Driven Equipment License Agreement dated effective as of September 22, 2011 by and between Green Field Energy Services, Inc. and Turbine Powered Technology, LLC | |
| 10.25† | Agreement dated effective as of April 21, 2011 by and between Green Field Energy Services, Inc. (f/k/a Hub City Industries, L.L.C.) and Dynamic Industries, Inc. | |
| 10.26 | Fourth Amendment to Contract for High Pressure Fracturing Services, dated October 22, 2012, between Green Field Energy Services, Inc. (f/k/a Hub City Industries, L.L.C.) and SWEPI LP (d/b/a Shell Western E&P). | |
| 10.27 | First Amendment to Master Purchase Agreement dated effective as of February 28, 2013 by and between Green Field Energy Services, Inc. and ChemRock Technologies, L.L.C. | |
| 21.1 | List of Subsidiaries | |
| 23.1* | Consent of Ernst & Young LLP | |
| 23.2 | Consent of Latham & Watkins LLP (included in Exhibit 5.1) | |
| 23.3 | Consent of Babineaux, Poché, Anthony & Slavich L.L.C. (included in Exhibit 5.2) | |
| 23.4* | Consent of Westward Environmental, Inc. | |
| 24.1 | Powers of Attorney (included on signature page to registration statement) | |
| 25.1 | Statement of Eligibility of Trustee on Form T-1 | |
| 99.2 | Form of Letter of Transmittal | |
| 99.3 | Form of Notice of Guaranteed Delivery | |
| 99.4 | Form of Letter to DTC Participants | |
| 99.5 | Form of Letter to Beneficial Holders | |
| * | Filed herewith. |
| † | This Exhibit has been filed separately with the Secretary of the Securities and Exchange Commission without the redaction pursuant to a Confidential Treatment Request under Rule 24b-2 of the Securities Exchange Act of 1934, as amended. |
II-7