Attached files
| file | filename |
|---|---|
| 8-K - CURRENT REPORT ON FORM 8-K - DELTA AIR LINES, INC. | delta_8k.htm |
Exhibit 99.1

Delta: Building A Better Airline Deutsche Bank 2013 Global Industrials and Basic Materials Conference June 13, 2013

This presentation contains various projections and other forward - looking statements which represent Delta’s estimates or expectations regarding future events. All forward - looking statements involve a number of assumptions, risks and uncertainties, many of which are beyond Delta’s control, that could cause the actual results to differ materially from the projected results. Factors which could cause such differences include, without limitation, business, economic, competitive, industry, regulatory, market and financial uncertainties and contingencies, as well as the “Risk Factors” discussed in Delta’s SEC filings. Caution should be taken not to place undue reliance on Delta’s forward - looking statements, which represent Delta’s views only as of the date of this presentation, and which Delta has no current intention to update. In this presentation, we will discuss certain non - GAAP financial measures. You can find the reconciliations of those measures to comparable GAAP measures on our website at delta.com. Safe Harbor 2

Building A Better Airline • Expect record June quarter following first March quarter profit in over a decade • Building on 2012’s financial momentum to grow earnings and expand margins in 2013 and beyond • Investing in network, operations, product and people to drive sustainable revenue growth, corporate share gains and profitability • Structural cost initiatives preserve Delta’s cost advantage and pave the way for future margin expansion • D isciplined approach to capital investment driving sustained free cash flow generation • Deploying capital between debt reduction, shareholder returns and opportunistic pension funding Strong Financial Foundation Positioning Delta for the Future Balanced Capital Deployment 3

A Path of Significant Improvement Delta’s financial foundation has strengthened considerably over the past five years, with a solid pipeline of initiatives in place for further improvement $1.4B $2.8B 2009 2012 1.5% 11.3% 2009 2012 $17.0B $ 11.0B 2009 1Q13 Operating Cash Flow Return on Invested Capital Adjusted Net Debt +$1.4B +9.8 pts - $6.0B 4 • Industry - leading profitability • Industry - leading revenue growth • Investments in high - quality products and service • Running a consistently reliable operation • Disciplined capital spending • Focus on high - return projects with short payback periods • Differentiated fleet strategy that combines used and new aircraft purchases • Over $400 million annual interest expense savings • On track to achieve $10 billion adjusted net debt this year
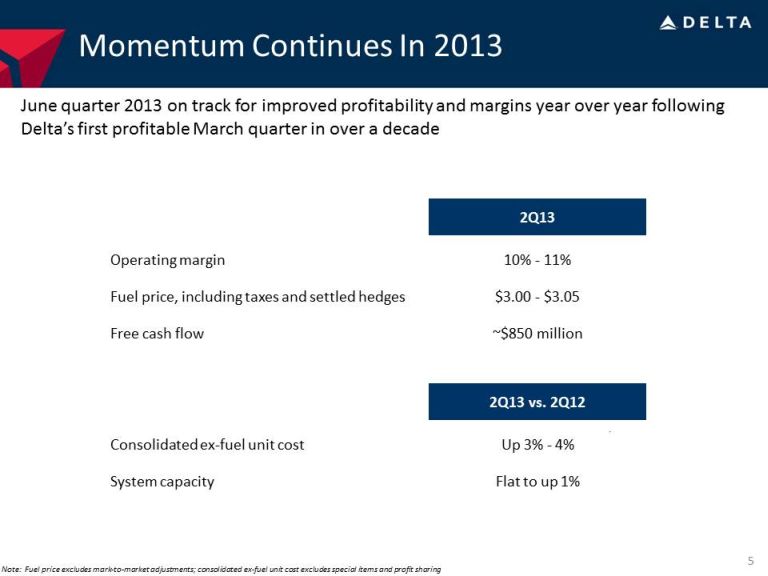
Momentum Continues In 2013 2Q13 Operating margin 10% - 11% Fuel price, including taxes and settled hedges $3.00 - $3.05 Free cash flow ~$850 million 2Q13 vs. 2Q12 Consolidated ex - fuel unit cost Up 3% - 4% System capacity Flat to up 1% 5 Note: Fuel price excludes mark - to - market adjustments; consolidated ex - fuel unit cost excludes special items and profit sharing June quarter 2013 on track for improved profitability and margins year over year following Delta’s first profitable March quarter in over a decade

Consolidation Producing Financial Stability 2002 Now Major Airlines 9 4 Total revenues $75 billion $120 billion Net income ($10) billion $6 billion Leverage ratio 7.0 x 4.5x 6

1,212 422 Deliveries 1999 - 2002 Scheduled Deliveries 2013 - 2016 Airlines Have More Runway Ahead Mainline Aircraft Deliveries for Major U.S. Carriers $30+ billion capital …with a much different forward outlook on capacity and capital The industry is approaching similar levels of profitability… Multiples do not reflect combination of similar profitability and lower forward capital commitments 7 Deliveries 1999 - 2002 Scheduled Deliveries 2013 - 2016 1998-1999 2012 $3,790 M $4,850 M Avg. P/E = 11.4 Avg. P/E = 7.9 Airline Industry Net Income

Delta Is Taking a Different Approach All stakeholders need to share in our success to break the industry’s historical pattern 8 Employees • Best employee relations in the industry Customers • Continued benefits from investments in product, service, technology and operations Shareholders • 4 th consecutive year of profitability, with nearly 10 points of margin expansion over that time • Solid free cash flow generation and achievement of $10 billion debt target What to expect in 2013 Make Delta a great place to work for EMPLOYEES - Job stability with solid wages and benefits - Engaged employees motivated to generate results Make Delta an airline CUSTOMERS want to fly - Reliable, customer - focused operation - High quality products and service Make Delta a great investment for SHAREHOLDERS - Solid returns on invested capital - Balanced capital deployment

Investing in the Business …and Operational Reliability 9 Investing in Network, Product and Facilities….. • Onboard: – Launch of Economy Comfort – Flat bed seats on 85% of international aircraft by end of 2013 – Wi - Fi on all two - class aircraft – Personal on - demand entertainment • Facilities: – New world - class JFK Terminal 4 – State of the art international terminal in Atlanta – Upgraded Delta Sky Clubs, including the Sky Deck in Atlanta and JFK • Expanded network reach through targeted international equity investments in GOL, Aeromexico and Virgin Atlantic • Enhancements to delta.com and mobile applications Investments in network, operations, product and people targeted at making Delta the airline of choice for passengers 76.4% 81.6% 85.9% 2Q/3Q 10 2Q/3Q 11 2Q/3Q 12 98.0% 98.6% 99.5% 2010 2011 2012 On - Time Arrival Rate Completion Factor

14.5 % 13% 13% 11% 6% 8% 4.5 % 4% 0.5% 5.5 % 2.5% 4% 5.5% 5% 2% - 2% 0 .5% 9% 5% 7% 8% 4% 5% 2% 1% - 1% 2% - 1% 1% 2.5% 3% 3% - 4% - 1% Jan-12 Feb Mar Apr May Jun Jul Aug Sep Oct Nov Dec Jan-13 Feb Mar Apr May Delta A4A Excl DAL Generating a Revenue Premium To The Industry Delta has a network, product and operation that customers are willing to pay a premium for Passenger Unit Revenue vs. Prior Year 10

Initiatives to Maximize Revenue Premium • Acquiring 49% stake provides unique opportunity to increase Heathrow presence • London - Heathrow is the largest international destination for corporate travel • Network, operations, and product improvements already generating substantial increases in both corporate share and margins • New JFK T4 provides industry - leading customer experience and better operational efficiency • Innovative “Crossover Rewards” joint loyalty program with Starwood creates opportunity to reward existing customers and attract new high value customers Virgin Atlantic Joint Venture Corporate Share Gains Customer Loyalty 11 Further revenue growth expected from corporate contract gains, the Virgin Atlantic joint venture, and New York initiatives, including the recent opening of JFK T4

1H13 2H13 Longer term Cost Control Key To Margin Expansion $1 billion structural cost initiatives designed to stabilize cost trends and pave the way for margin expansion in 2013 and beyond • Non - fuel unit costs expected to grow 3 - 5% for 2013 • Cost growth peaks in 1Q13 and stabilizes by year end • $1 billion structural cost program reduces rate of cost growth, without jeopardizing our superior product • Fleet restructuring - $300M: unit cost efficiency gained by replacing 50 - seat jets with mainline and large regional jets • Maintenance redesign - $150M: capitalize on market purchase and part - out opportunities • Distribution platforms - $100M: continue to shift distribution to our lowest cost platforms • Staffing efficiency - $325M: higher productivity levels through technology and improved staffing models • Other costs - $125M: improve network efficiency 12 Note: All results exclude special items Non - Fuel Cost Change YOY Up ~4% Up 1 – 2% Up 0 – 2%

Taking a unique approach to Delta’s number one input cost • Trainer Refinery is a unique approach to addressing Delta’s $12 billion annual fuel spend • Agreements in place for 10% of refinery’s crude supply to come from Bakken in second half of 2013 − Allows Delta, not the refiners, to benefit from input cost savings • Next phase of max - jet modifications, combined with process changes to improve yield efficiency, should bring jet production to 40,000 bpd by early 2014, or ~25% of Delta’s domestic consumption • Fuel hedges well positioned at current price levels, with book structured for nearly full participation in recent fuel price drops Managing Fuel Expense to Reduce Risk 13 Jet Fuel Premium/(Discount) to ULSD (cents per gallon) -15.00 -10.00 -5.00 0.00 5.00 10.00 15.00 Jet Fuel Premium/(Discount) to ULSD Historical Avg (pre-2013) Last 90 day average 2009 2011 2013

Capital Discipline Drives Free Cash Flow Capital Spending and Operating Cash Flow ($ Billion) Note: Includes pre - merger NWA Delta’s business model produces both solid financial results and significant free cash flow 1998 – 2000 Cumulative earnings: $6.5 billion Cumulative free cash flow: ($2.0 billion) 2010 – 2012 Cumulative earnings: $4.1 billion Cumulative free cash flow: $3.9 billion 14 $2.6 $3.8 $4.1 $4.8 $4.1 $2.9 $1.8 $1.3 $1.2 $0.9 $2.1 $2.6 $1.2 $1.3 $1.3 $2.0 $2.4 ($2.0) ($1.0) $0.0 $1.0 $2.0 $3.0 $4.0 $5.0 $6.0 1997 1998 1999 2000 2001 2002 2003 2004 2005 2006 2007 2008 2009 2010 2011 2012 2013 2014 2015 2016 2017 Capex Operating Cash Flow $2.0 - $2.5
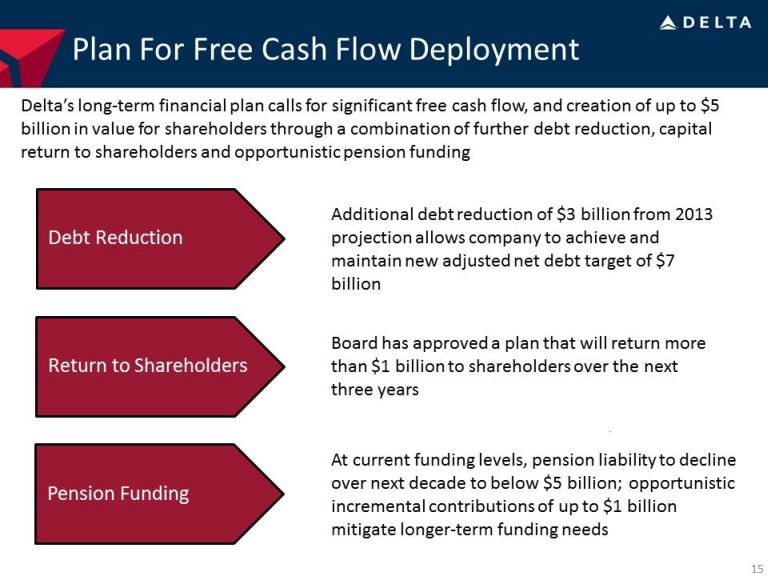
Plan For Free Cash Flow Deployment Delta’s long - term financial plan calls for significant free cash flow, and creation of up to $5 billion in value for shareholders through a combination of further debt reduction, capital return to shareholders and opportunistic pension funding 15 Debt Reduction Return to Shareholders Pension Funding Additional debt reduction of $3 billion from 2013 projection allows company to achieve and maintain new adjusted net debt target of $7 billion Board has approved a plan that will return more than $1 billion to shareholders over the next three years At current funding levels, pension liability to decline over next decade to below $5 billion; opportunistic incremental contributions of up to $1 billion mitigate longer - term funding needs
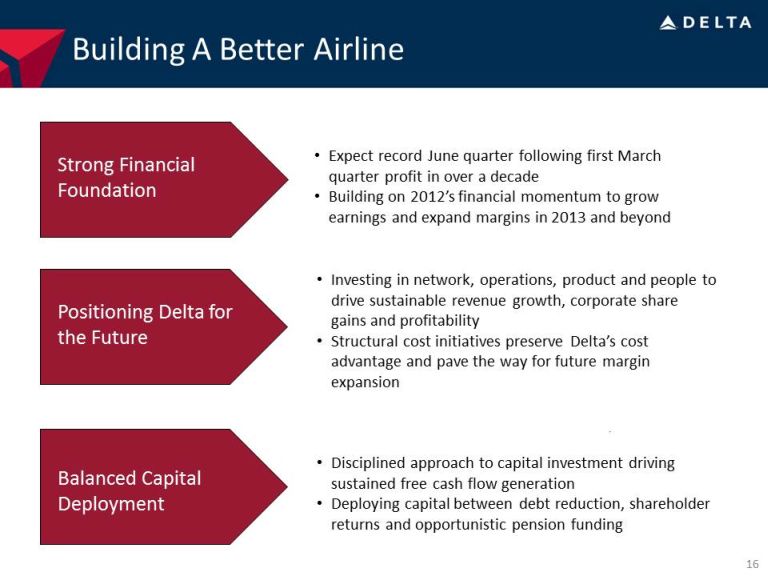
Building A Better Airline • Expect record June quarter following first March quarter profit in over a decade • Building on 2012’s financial momentum to grow earnings and expand margins in 2013 and beyond • Investing in network, operations, product and people to drive sustainable revenue growth, corporate share gains and profitability • Structural cost initiatives preserve Delta’s cost advantage and pave the way for future margin expansion • D isciplined approach to capital investment driving sustained free cash flow generation • Deploying capital between debt reduction, shareholder returns and opportunistic pension funding Strong Financial Foundation Positioning Delta for the Future Balanced Capital Deployment 16


Non-GAAP Financial Measures
Delta sometimes uses information ("non-GAAP financial measures") that is derived from our Consolidated Financial Statements, but that is not presented in accordance with accounting principles generally accepted in the U.S. (“GAAP”). Under the U.S. Securities and Exchange Commission rules, non-GAAP financial measures may be considered in addition to results prepared in accordance with GAAP, but should not be considered a substitute for or superior to GAAP results. The tables below show reconciliations of non-GAAP financial measures to the most directly comparable GAAP financial measures.
Delta is unable to reconcile certain forward-looking projections to GAAP as the nature or amount of special items cannot be estimated at this time.
Delta excludes special items because management believes the exclusion of these items is helpful to investors to evaluate the company’s recurring core operational performance in the period shown.
Delta presents net cash provided by operating activities because management believes this metric is helpful to investors to evaluate the company’s operating activities and cash flows.
Delta presents return on invested capital as management believes this metric is helpful to investors in assessing the company’s ability to generate returns using its invested capital and as a measure against the industry.
Delta uses adjusted total debt, including aircraft rent, in addition to long-term adjusted debt and capital leases, to present estimated financial obligations. Delta reduces adjusted total debt by cash, cash equivalents and short-term investments, resulting in adjusted net debt, to present the amount of assets needed to satisfy the debt. Management believes this metric is helpful to investors in assessing the company’s overall debt profile.
Delta presents combined capital spending as if the company’s merger with Northwest Airlines had occurred at the beginning of the period presented because management believes this metric is helpful to investors to evaluate the company’s combined investing activities and provide a more meaningful comparison to our post-merger amounts.
Delta presents free cash flow because management believes this metric is helpful to investors to evaluate the company's ability to generate cash that is available for use for debt service or general corporate initiatives.
18
Operating Cash Flow
| Full Year | Full Year | |||||||
| (in billions) | 2012 | 2008 | ||||||
| Delta operating cash flow (GAAP) | $ | 2.5 | $ | (1.7 | ) | |||
| SkyMiles used pursuant to advance purchase under AMEX agreement | 0.3 | – | ||||||
| Northwest operating cash flow | – | 0.2 | ||||||
| Net cash provided by operations, adjusted | $ | 2.8 | $ | (1.5 | ) | |||
Return on Invested Capital
| Full Year | Full Year | |||||||
| (in billions, except % return) | 2012 | 2009 | ||||||
| Adjusted Book Value of Equity | $ | 13.9 | $ | 12.9 | ||||
| Average Adjusted Net Debt | $ | 12.0 | $ | 16.8 | ||||
| Average Invested Capital | $ | 25.9 | $ | 29.7 | ||||
| Adjusted Total Operating Income | $ | 2.9 | $ | 0.5 | ||||
| Return on Invested Capital | 11.3% | 1.5% | ||||||
Adjusted Net Debt
| March 31, | December 31, | |||||||||||||||
| (in billions) | 2013 | 2009 | ||||||||||||||
| Debt and capital lease obligations | $ | 12.3 | $ | 17.2 | ||||||||||||
| Plus: unamortized discount, net from purchase accounting and fresh start reporting | 0.5 | $ | 1.1 | |||||||||||||
| Adjusted debt and capital lease obligations | $ | 12.8 | $ | 18.3 | ||||||||||||
| Plus: 7x last twelve months' aircraft rent | 1.8 | 3.4 | ||||||||||||||
| Adjusted total debt | 14.6 | 21.7 | ||||||||||||||
| Less: cash, cash equivalents and short-term investments | (3.6 | ) | (4.7 | ) | ||||||||||||
| Adjusted net debt | $ | 11.0 | $ | 17.0 | ||||||||||||
19
Capital Spending
| Full Year | ||||
| (in billions) | 2008 | |||
| Delta capital expenditures (GAAP) | $ | 1.5 | ||
| Northwest capital expenditures | 1.1 | |||
| Total combined capital spending | $ | 2.6 | ||
Pre-Tax Income
| Three Years Ended | ||||
| (in billions) | December 31, 2012 | |||
| Pre-tax income | $ | 2.4 | ||
| Items excluded: | ||||
| Restructuring and other items | 1.1 | |||
| Loss on extinguishment of debt | 0.6 | |||
| Pre-tax income excluding special items | $ | 4.1 | ||
Free Cash Flow
| Three Years Ended | ||||
| (in billions) | December 31, 2012 | |||
| Net cash provided by operating activities (GAAP) | $ | 8.1 | ||
| Net cash used in investing activities (GAAP) | (5.5 | ) | ||
| Adjustments: | ||||
| Proceeds from sale of property and investments and other | (0.8 | ) | ||
| Purchase of short-term investments | 1.8 | |||
| SkyMiles used pursuant to advance purchase under AMEX agreement | 0.3 | |||
| Total free cash flow | $ | 3.9 | ||
20