Attached files
| file | filename |
|---|---|
| 8-K - FORM 8-K - VIRTUS INVESTMENT PARTNERS, INC. | d555315d8k.htm |
Exhibit 99.1
MORGAN STANLEY FINANCIALS CONFERENCE
JUNE 12, 2013
GEORGE R. AYLWARD
President and
Chief Executive Officer
BROAD CAPABILITIES | COMBINED STRENGTH
Important Disclosures
This presentation contains statements that are, or may be considered to be, forward-looking statements. All statements that are not historical facts, including statements about our beliefs or expectations, are “forward-looking statements” within the meaning of The Private Securities Litigation Reform Act of 1995. These statements may be identified by such forward-looking terminology as “expect,” “estimate,” “plan,” “intend,” “believe,” “anticipate,” “may,” “will,” “should,” “could,” “continue,” “project,” or similar statements or variations of such terms.
Our forward-looking statements are based on a series of expectations, assumptions and projections about our company, are not guarantees of future results or performance, and involve substantial risks and uncertainty, including assumptions and projections concerning our assets under management, cash inflows and outflows, operating cash flows, and future credit facilities, for all forward periods. All of our forward-looking statements are as of the date of this release only. The company can give no assurance that such expectations or forward-looking statements will prove to be correct. Actual results may differ materially.
Our business and our forward-looking statements involve substantial known and unknown risks and uncertainties as described in our most recent Annual Report on Form 10-K or in any of our filings with the Securities and Exchange Commission (“SEC”).
Certain other factors which may impact our continuing operations, prospects, financial results and liquidity or which may cause actual results to differ from such forward-looking statements are discussed or included in the company’s periodic reports filed with the SEC and are available on our website at www.virtus.com under “Investor Relations.” You are urged to carefully consider all such factors.
The company does not undertake or plan to update or revise any such forward-looking statements to reflect actual results, changes in plans, assumptions, estimates or projections, or other circumstances occurring after the date of this release, even if such results, changes or circumstances make it clear that any forward-looking information will not be realized. If there are any future public statements or disclosures by us which modify or impact any of the forward-looking statements contained in or accompanying this release, such statements or disclosures will be deemed to modify or supersede such statements in this release. Morningstar RatingsTM as of 5/31/13 in each fund’s Morningstar Category. For each fund with at least a 3-year history, Morningstar calculates a Morningstar RatingTM based on a Morningstar Risk-Adjusted Return measure that accounts for variation in a fund’s monthly performance (including the effects of sales charges, load and redemption fees), placing more emphasis on downward variations and rewarding consistent performance. The top 10% of funds in each category receive five stars, the next 22.5% receive four stars, the next 35% receive three stars, the next 22.5% receive two stars, and the bottom 10% receive one star. (Each share class is counted as a fraction of one fund within this scale and rated separately, which may cause slight variations in the distribution percentages.) The Overall Morningstar RatingTM for a fund is derived from a weighted average of the performance figures associated with its 3-, 5—and 10-year (if applicable) Morningstar RatingTM metrics.
Morningstar RatingTM is based on the share class with the highest Morningstar Rating; other classes may have different performance characteristics.
Please carefully consider the Virtus Mutual Funds’ investment objectives, risks, charges and expenses before investing. For this and other information about the Virtus Mutual Funds, call 1-800-243-4361 or visit Virtus.com for a prospectus. Read it carefully before you invest or send money.
Past performance is not indicative of future results.
Mutual Funds are distributed by VP Distributors, LLC, member FINRA and subsidiary of Virtus Investment Partners, Inc.
| 2 |
|
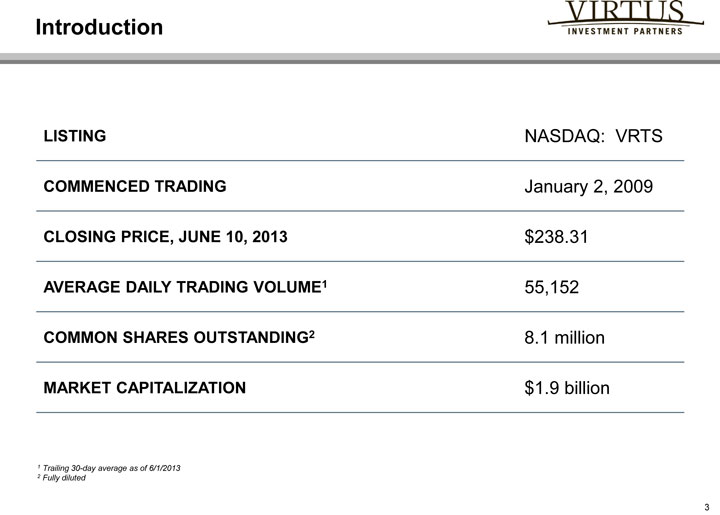
Introduction
LISTING
NASDAQ: VRTS
COMMENCED TRADING
January 2, 2009
CLOSING PRICE, JUNE 10, 2013
$238.31
AVERAGE DAILY TRADING VOLUME1
55,152
COMMON SHARES OUTSTANDING2
8.1 million
MARKET CAPITALIZATION
$1.9 billion
| 1 |
|
Trailing 30-day average as of 6/1/2013 |
| 2 |
|
Fully diluted |
| 3 |
|
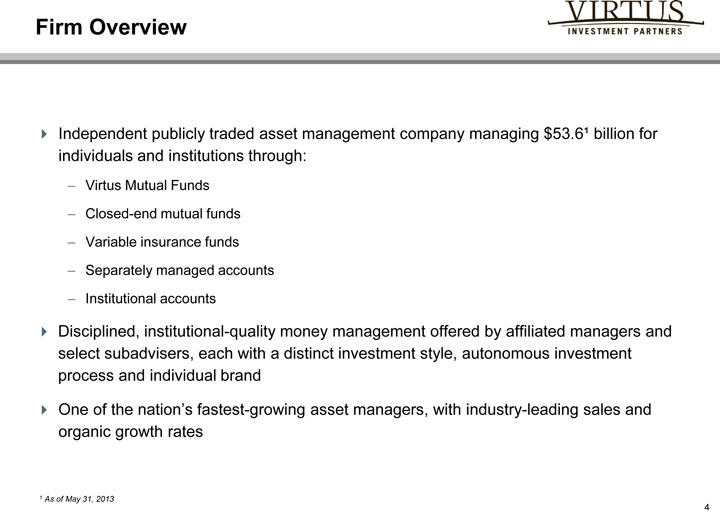
Firm Overview
?Independent publicly traded asset management company managing $53.6ą billion for individuals and institutions through:
– Virtus Mutual Funds
– Closed-end mutual funds
– Variable insurance funds
– Separately managed accounts
– Institutional accounts
?Disciplined, institutional-quality money management offered by affiliated managers and select subadvisers, each with a distinct investment style, autonomous investment process and individual brand ?One of the nation’s fastest-growing asset managers, with industry-leading sales and organic growth rates
| 1 |
|
As of May 31, 2013 |
| 4 |
|
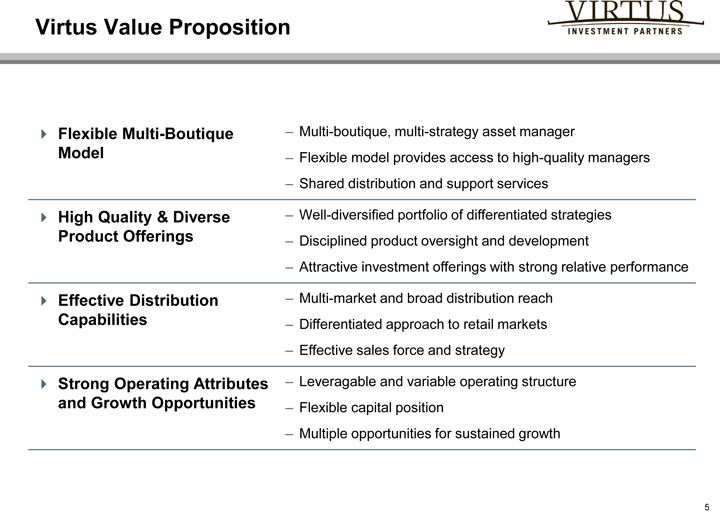
Virtus Value Proposition
Flexible Multi-Boutique
– Multi-boutique, multi-strategy asset manager
Model
– Flexible model provides access to high-quality managers
– Shared distribution and support services
High Quality & Diverse
– Well-diversified portfolio of differentiated strategies
Product Offerings
– Disciplined product oversight and development
– Attractive investment offerings with strong relative performance
Effective Distribution
– Multi-market and broad distribution reach
Capabilities –
Differentiated approach to retail markets
– Effective sales force and strategy
Strong Operating Attributes
– Leveragable and variable operating structure
and Growth Opportunities
– Flexible capital position
– Multiple opportunities for sustained growth
| 5 |
|
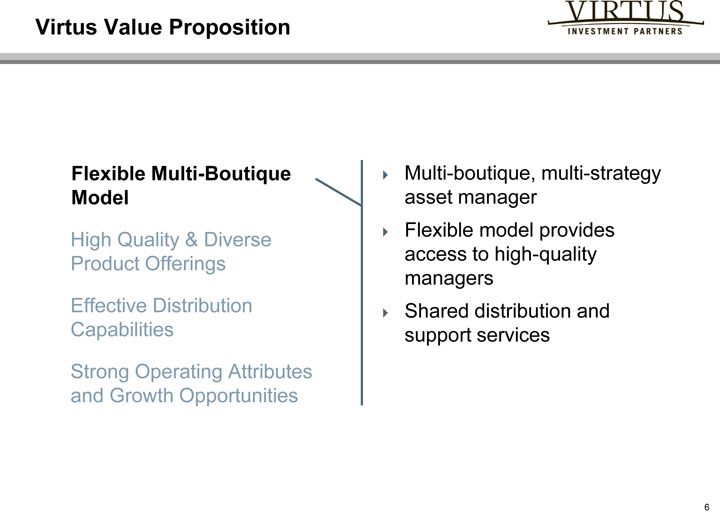
Virtus Value Proposition
Flexible Multi-Boutique
Multi-boutique, multi-strategy
Model
asset manager
High Quality & Diverse
Flexible model provides
Product Offerings
access to high-quality
managers
Effective Distribution
Shared distribution and
Capabilities
support services
Strong Operating Attributes
and Growth Opportunities
| 6 |
|
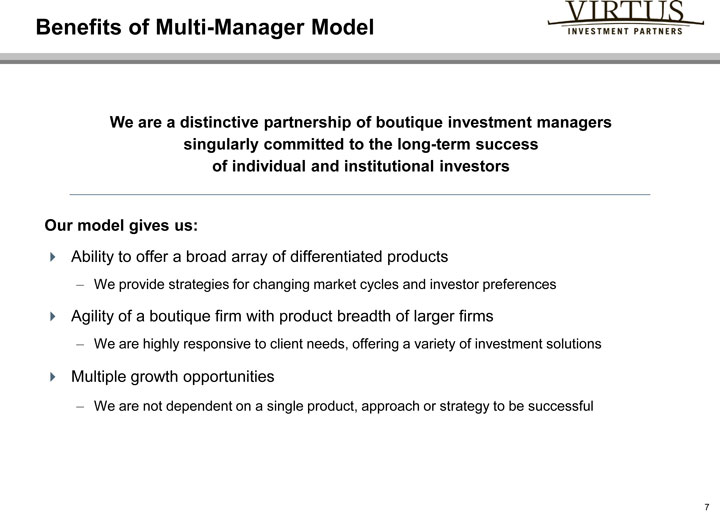
Benefits of Multi-Manager Model
We are a distinctive partnership of boutique investment managers singularly committed to the long-term success of individual and institutional investors
Our model gives us:
?Ability to offer a broad array of differentiated products
– We provide strategies for changing market cycles and investor preferences
?Agility of a boutique firm with product breadth of larger firms
– We are highly responsive to client needs, offering a variety of investment solutions
?Multiple growth opportunities
– We are not dependent on a single product, approach or strategy to be successful
| 7 |
|
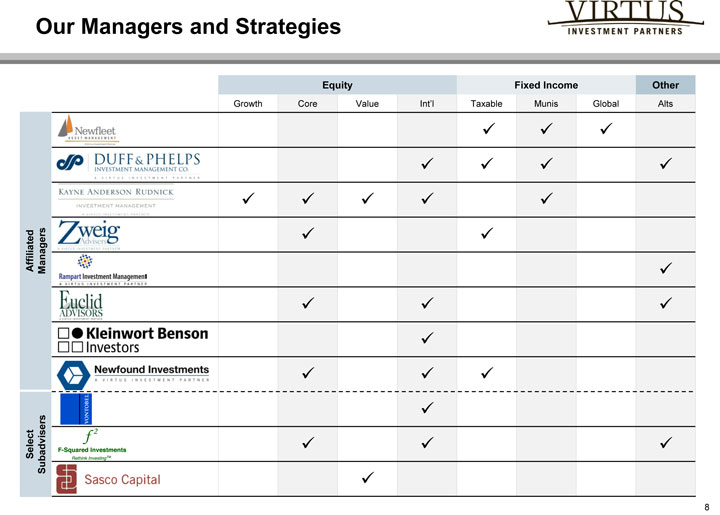
Equity
Fixed Income
Other
Growth
Core
Value
Int’l
Taxable
Munis
Global
Alts
Affiliated Managers
Select Subadvisers
| 8 |
|
Flexible Multi-Boutique Model
Our primary objective is to provide a diverse offering of high quality investment capabilities across asset classes and styles
?Our flexible model allows us to access broad capabilities through:
– Affiliated managers
– Managers in which Virtus has a majority or minority interest
– Unaffiliated subadvisers
?Benefits of this approach include:
– Expanding product capabilities
– Leveraging distribution and shared resources
– Providing multiple growth opportunities
9
Shared Distribution and Support
Our managers focus on what they do best – managing client assets – supported by:
?Strong Retail Distribution
– Broad and deep access in multiple channels
– Experienced retail sales force and extensive national accounts relationships
– Comprehensive marketing and e-business platform
?Shared Business Operations
– Product management, fund services and compliance for investment operations
– Centralized business support including IT, human resources, legal and finance
10
Virtus Value Proposition
Flexible Multi-Boutique Well-diversified portfolio of
Model differentiated strategies
High Quality & Diverse Disciplined product oversight
Product Offerings and development
Attractive investment
Effective Distribution offerings with strong relative
Capabilities performance
Strong Operating Attributes
and Growth Opportunities
11
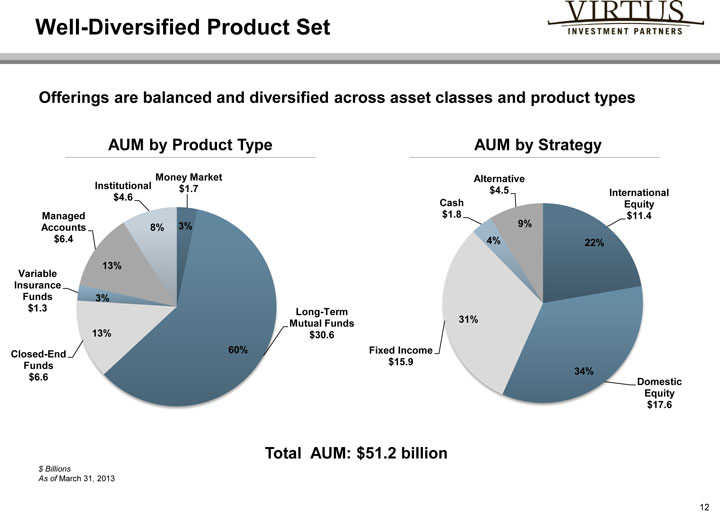
Offerings are balanced and diversified across asset classes and product types
AUM by Product Type AUM by Strategy
Money Market Alternative
Institutional $1.7 $4.5 International
$4.6 Cash Equity
Managed $1.8 $11.4
Accounts 8% 3% 9%
$6.4 4% 22%
13%
Variable
Insurance
Funds 3%
$1.3 Long-Term
Mutual Funds 31%
13% $30.6
Closed-End 60% Fixed Income
Funds $15.9
34%
$6.6 Domestic
Equity
$17.6
Total AUM: $51.2 billion
$ Billions
As of March 31, 2013
12
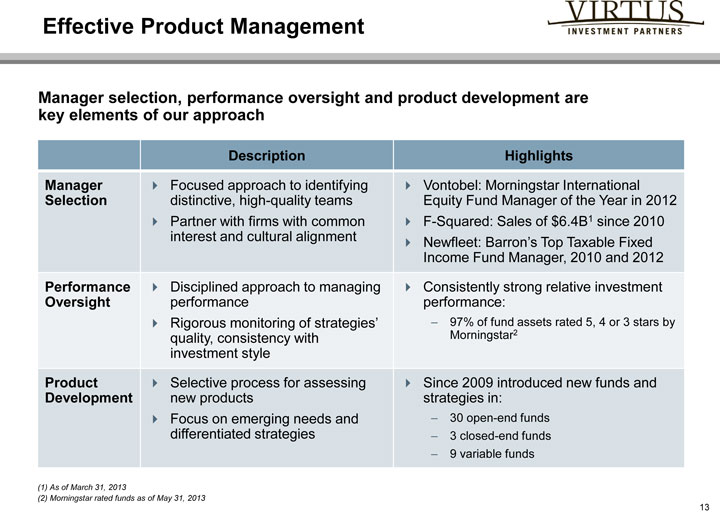
Effective Product Management
Manager selection, performance oversight and product development are key elements of our approach
Description Highlights
Manager Focused approach to identifying Vontobel: Morningstar International
Selection distinctive, high-quality teams Equity Fund Manager of the Year in 2012
Partner with firms with common F-Squared: Sales of $6.4B1 since 2010
interest and cultural alignment Newfleet: Barron’s Top Taxable Fixed
Income Fund Manager, 2010 and 2012
Performance Disciplined approach to managing Consistently strong relative investment
Oversight performance performance:
Rigorous monitoring of strategies’ – 97% of fund assets rated 5, 4 or 3 stars by
quality, consistency with Morningstar2
investment style
Product Selective process for assessing Since 2009 introduced new funds and
Development new products strategies in:
Focus on emerging needs and – 30 open-end funds
differentiated strategies – 3 closed-end funds
– 9 variable funds
| (1) |
|
As of March 31, 2013 |
| (2) |
|
Morningstar rated funds as of May 31, 2013 |
13
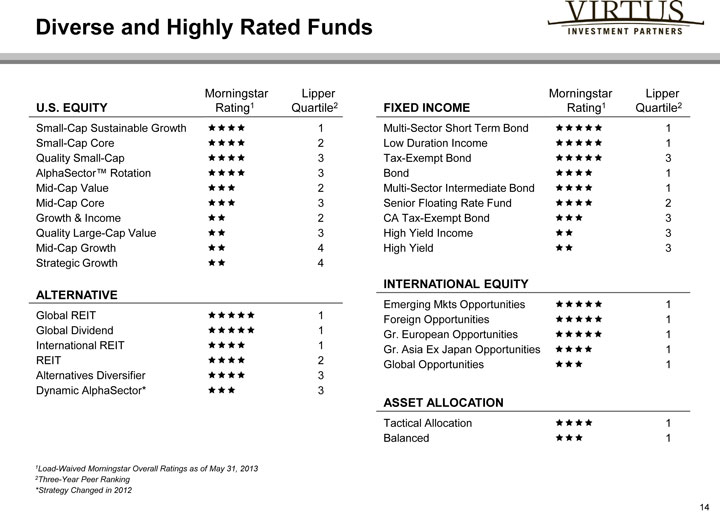
Diverse and Highly Rated Funds
Morningstar Lipper Morningstar Lipper
U.S. EQUITY Rating1 Quartile2 FIXED INCOME Rating1 Quartile2
Small-Cap Sustainable Growth 1 Multi-Sector Short Term Bond 1
Small-Cap Core 2 Low Duration Income 1
Quality Small-Cap 3 Tax-Exempt Bond 3
AlphaSector™ Rotation 3 Bond 1
Mid-Cap Value 2 Multi-Sector Intermediate Bond 1
Mid-Cap Core 3 Senior Floating Rate Fund 2
Growth & Income 2 CA Tax-Exempt Bond 3
Quality Large-Cap Value 3 High Yield Income 3
Mid-Cap Growth 4 High Yield 3
Strategic Growth 4
INTERNATIONAL EQUITY
ALTERNATIVE
Emerging Mkts Opportunities 1
Global REIT 1 Foreign Opportunities 1
Global Dividend 1 Gr. European Opportunities 1
International REIT 1 Gr. Asia Ex Japan Opportunities 1
REIT 2 Global Opportunities 1
Alternatives Diversifier 3
Dynamic AlphaSector* 3
ASSET ALLOCATION
Tactical Allocation 1
Balanced 1
1Load-Waived Morningstar Overall Ratings as of May 31, 2013 2Three-Year Peer Ranking *Strategy Changed in 2012
14
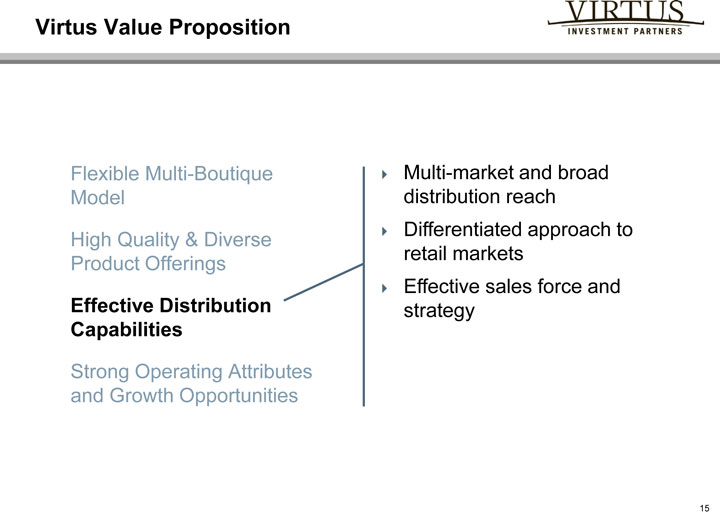
Virtus Value Proposition
Flexible Multi-Boutique Multi-market and broad
Model distribution reach
High Quality & Diverse Differentiated approach to
Product Offerings retail markets
Effective sales force and
Effective Distribution strategy
Capabilities
Strong Operating Attributes
and Growth Opportunities
15
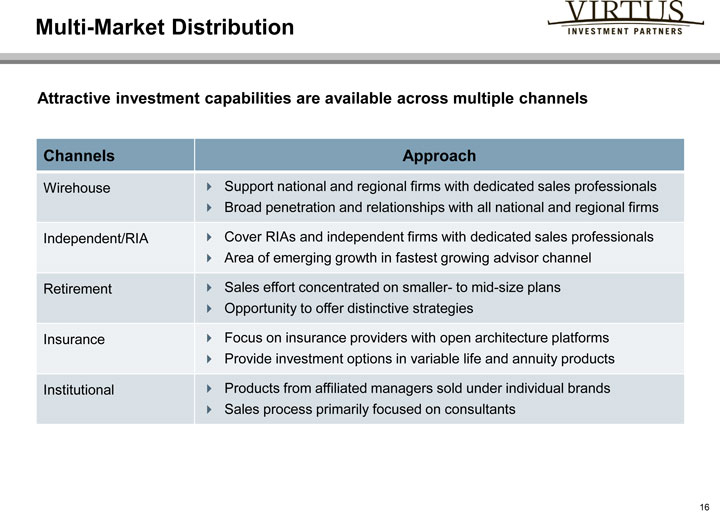
Multi-Market Distribution
Attractive investment capabilities are available across multiple channels
Channels Approach
Wirehouse Support national and regional firms with dedicated sales professionals
Broad penetration and relationships with all national and regional firms
Independent/RIA Cover RIAs and independent firms with dedicated sales professionals
Area of emerging growth in fastest growing advisor channel
Retirement Sales effort concentrated on smaller—to mid-size plans
Opportunity to offer distinctive strategies
Insurance Focus on insurance providers with open architecture platforms
Provide investment options in variable life and annuity products
Institutional Products from affiliated managers sold under individual brands
Sales process primarily focused on consultants
16
Differentiated Approach to Retail Markets
Our differentiated approach distinguishes us in a competitive marketplace
?One-point access to a variety of differentiated and diverse high-quality boutique managers ?Experienced and high-quality retail sales force uses a consultative approach to help financial advisors better manage their book of business ?Assist financial advisors in addressing their clients’ current and future investment needs for:
– Yield
– Less reliance on equity/fixed income markets
– Better global reach
– Help navigating the markets
– Alpha-generating opportunities
17
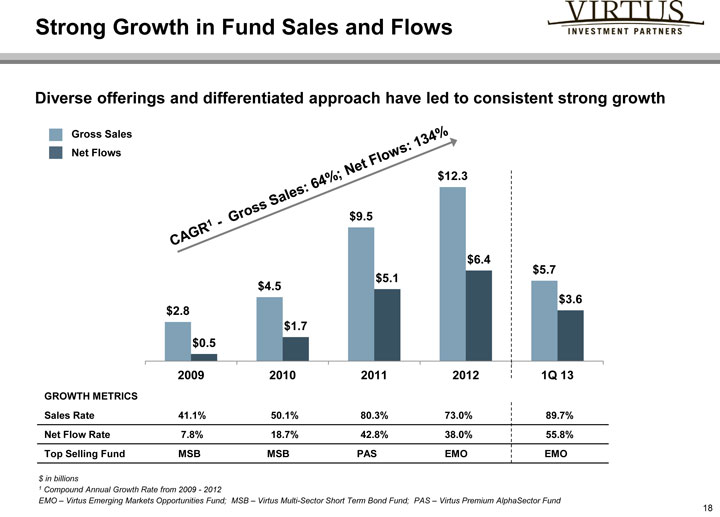
Strong Growth in Fund Sales and Flows
Diverse offerings and differentiated approach have led to consistent strong growth
Gross Sales
Net Flows
$12.3
$9.5
$6.4
$5.7
$4.5 $5.1
$3.6
$2.8
$1.7
$0.5
2009 2010 2011 2012 1Q 13
GROWTH METRICS
Sales Rate 41.1% 50.1% 80.3% 73.0% 89.7%
Net Flow Rate 7.8% 18.7% 42.8% 38.0% 55.8%
Top Selling Fund MSB MSB PAS EMO EMO
$ in billions
| 1 |
|
Compound Annual Growth Rate from 2009—2012 |
EMO – Virtus Emerging Markets Opportunities Fund; MSB – Virtus Multi-Sector Short Term Bond Fund; PAS – Virtus Premium AlphaSector Fund
18
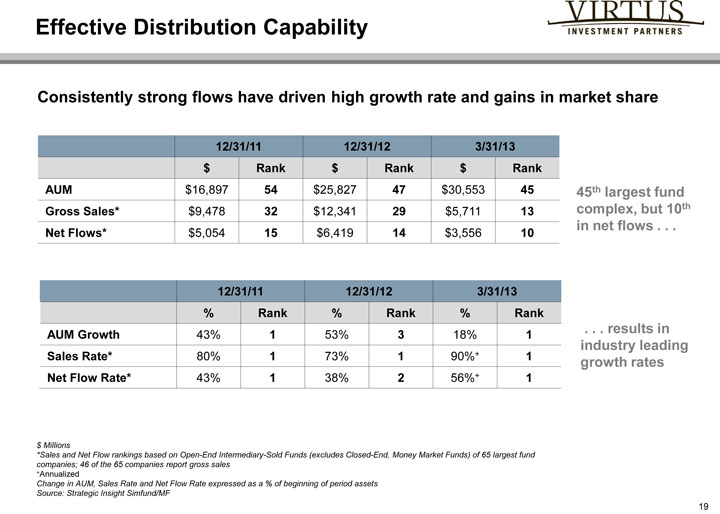
Effective Distribution Capability
Consistently strong flows have driven high growth rate and gains in market share
12/31/11 12/31/12 3/31/13
$ Rank $ Rank $ Rank
AUM $16,897 54 $25,827 47 $30,553 45 45th largest fund
Gross Sales* $9,478 32 $12,341 29 $5,711 13 complex, but 10th
Net Flows* $5,054 15 $6,419 14 $3,556 10 in net flows
12/31/11 12/31/12 3/31/13
% Rank % Rank % Rank
AUM Growth 43% 1 53% 3 18% 1 results in
industry leading
Sales Rate* 80% 1 73% 1 90%+ 1 growth rates
Net Flow Rate* 43% 1 38% 2 56%+ 1
$ Millions
*Sales and Net Flow rankings based on Open-End Intermediary-Sold Funds (excludes Closed-End, Money Market Funds) of 65 largest fund companies; 46 of the 65 companies report gross sales
+Annualized
Change in AUM, Sales Rate and Net Flow Rate expressed as a % of beginning of period assets Source: Strategic Insight Simfund/MF
19
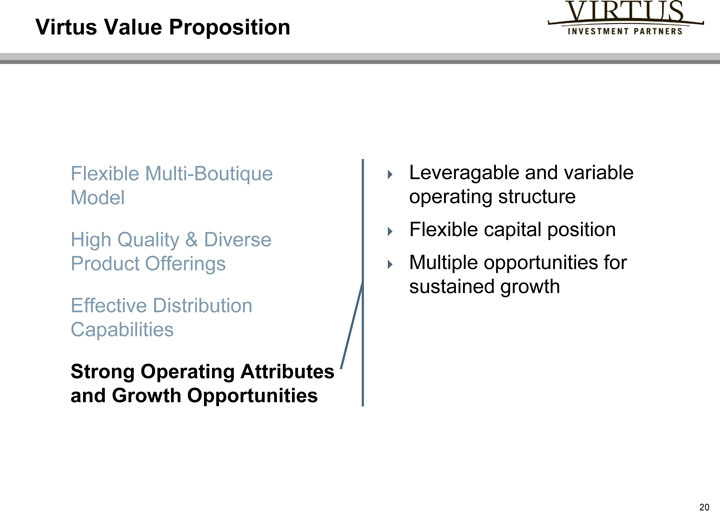
Virtus Value Proposition
Flexible Multi-Boutique Leveragable and variable
Model operating structure
High Quality & Diverse Flexible capital position
Product Offerings Multiple opportunities for
sustained growth
Effective Distribution
Capabilities
Strong Operating Attributes
and Growth Opportunities
20
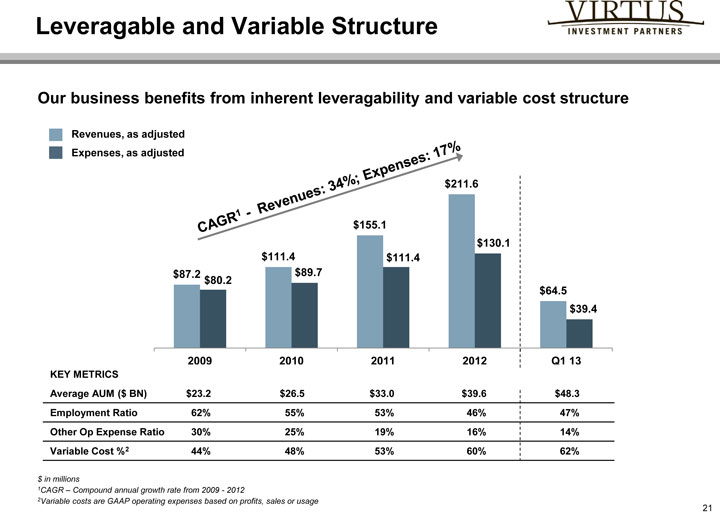
Leveragable and Variable Structure
Our business benefits from inherent leveragability and variable cost structure
Revenues, as adjusted
Expenses, as adjusted
$211.6
$155.1
$130.1
$111.4 $111.4
$87.2 $89.7
$80.2
$64.5
$39.4
2009 2010 2011 2012 Q1 13
KEY METRICS
Average AUM ($ BN) $23.2 $26.5 $33.0 $39.6 $48.3
Employment Ratio 62% 55% 53% 46% 47%
Other Op Expense Ratio 30% 25% 19% 16% 14%
Variable Cost %2 44% 48% 53% 60% 62%
$ in millions
1CAGR – Compound annual growth rate from 2009—2012
2Variable costs are GAAP operating expenses based on profits, sales or usage
21
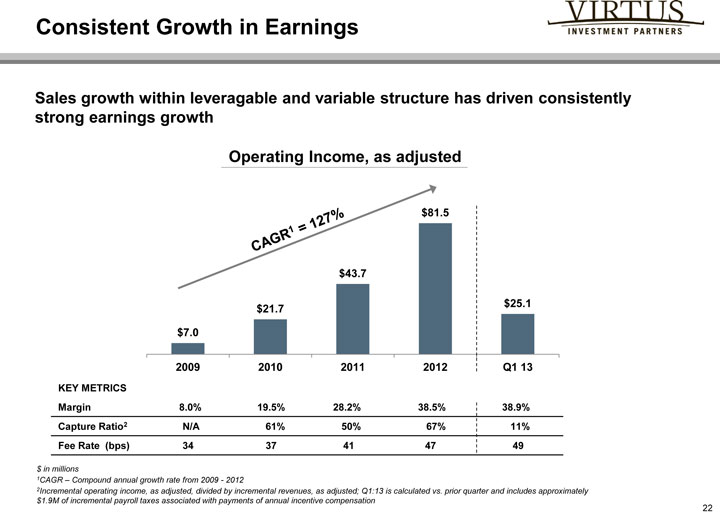
Consistent Growth in Earnings
Sales growth within leveragable and variable structure has driven consistently strong earnings growth
Operating Income, as adjusted
$81.5
$43.7
$21.7 $25.1
$7.0
2009 2010 2011 2012 Q1 13
KEY METRICS
Margin 8.0% 19.5% 28.2% 38.5% 38.9%
Capture Ratio2 N/A 61% 50% 67% 11%
Fee Rate (bps) 34 37 41 47 49
$ in millions
1CAGR – Compound annual growth rate from 2009—2012
2Incremental operating income, as adjusted, divided by incremental revenues, as adjusted; Q1:13 is calculated vs. prior quarter and includes approximately $1.9M of incremental payroll taxes associated with payments of annual incentive compensation
22
 ‘
‘
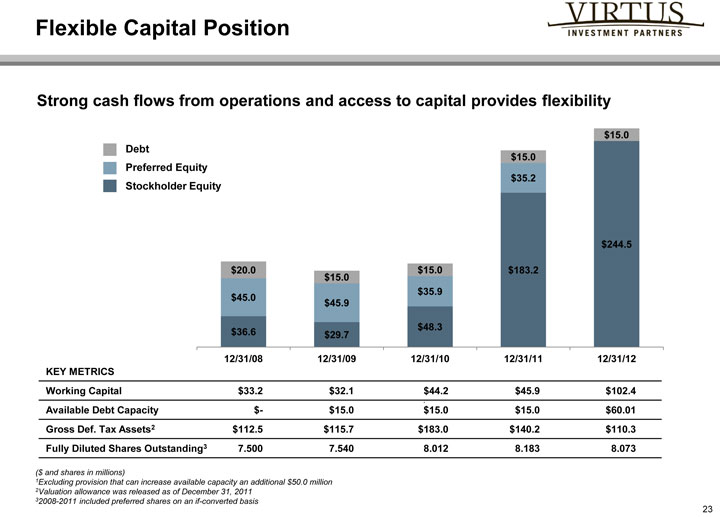
Flexible Capital Position
Strong cash flows from operations and access to capital provides flexibility
$15.0
Debt
$15.0
Preferred Equity
$35.2
Stockholder Equity
$244.5
$20.0 $15.0 $183.2
$15.0
$35.9
$45.0 $45.9
$36.6 $29.7 $48.3
12/31/08 12/31/09 12/31/10 12/31/11 12/31/12
KEY METRICS
Working Capital $33.2 $32.1 $44.2 $45.9 $102.4
Available Debt Capacity $—$15.0 $15.0 $15.0 $60.01
Gross Def. Tax Assets2 $112.5 $115.7 $183.0 $140.2 $110.3
Fully Diluted Shares Outstanding3 7.500 7.540 8.012 8.183 8.073
($ and shares in millions)
1Excluding provision that can increase available capacity an additional $50.0 million 2Valuation allowance was released as of December 31, 2011 32008-2011 included preferred shares on an if-converted basis
23
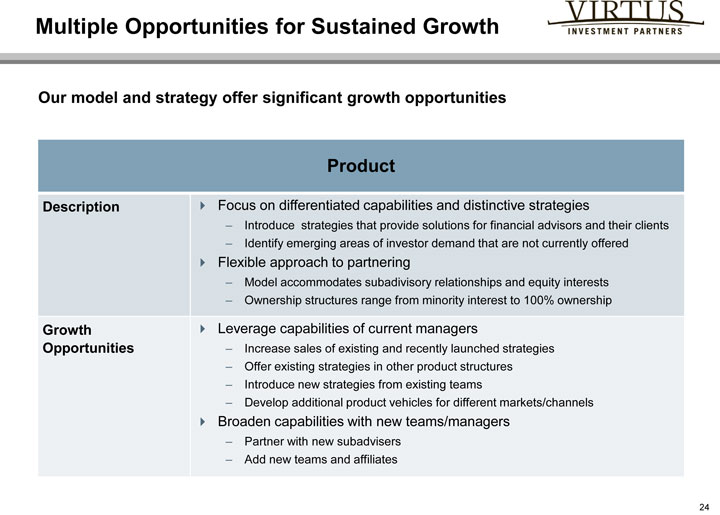
Multiple Opportunities for Sustained Growth
Our model and strategy offer significant growth opportunities
Product
Description Focus on differentiated capabilities and distinctive strategies
– Introduce strategies that provide solutions for financial advisors and their clients
– Identify emerging areas of investor demand that are not currently offered
Flexible approach to partnering
– Model accommodates subadivisory relationships and equity interests
– Ownership structures range from minority interest to 100% ownership
Growth Leverage capabilities of current managers
Opportunities – Increase sales of existing and recently launched strategies
– Offer existing strategies in other product structures
– Introduce new strategies from existing teams
– Develop additional product vehicles for different markets/channels
Broaden capabilities with new teams/managers
– Partner with new subadvisers
– Add new teams and affiliates
24
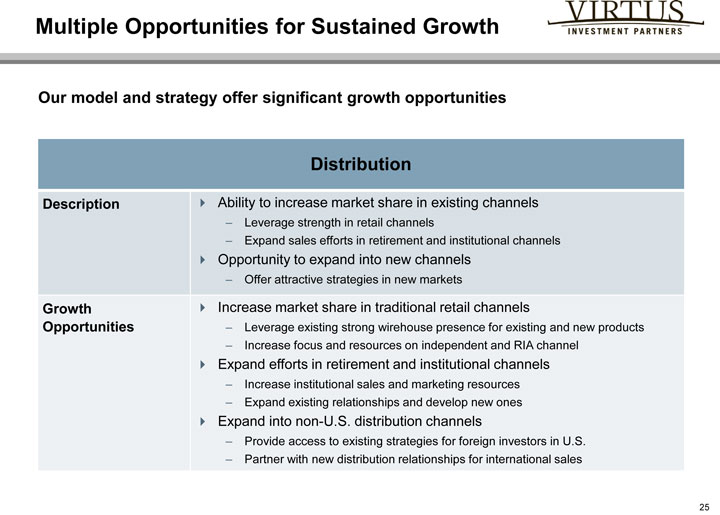
Multiple Opportunities for Sustained Growth
Our model and strategy offer significant growth opportunities
Distribution
Description Ability to increase market share in existing channels
– Leverage strength in retail channels
– Expand sales efforts in retirement and institutional channels
Opportunity to expand into new channels
– Offer attractive strategies in new markets
Growth Increase market share in traditional retail channels
Opportunities – Leverage existing strong wirehouse presence for existing and new products
– Increase focus and resources on independent and RIA channel
Expand efforts in retirement and institutional channels
– Increase institutional sales and marketing resources
– Expand existing relationships and develop new ones
Expand into non-U.S. distribution channels
– Provide access to existing strategies for foreign investors in U.S.
– Partner with new distribution relationships for international sales
25
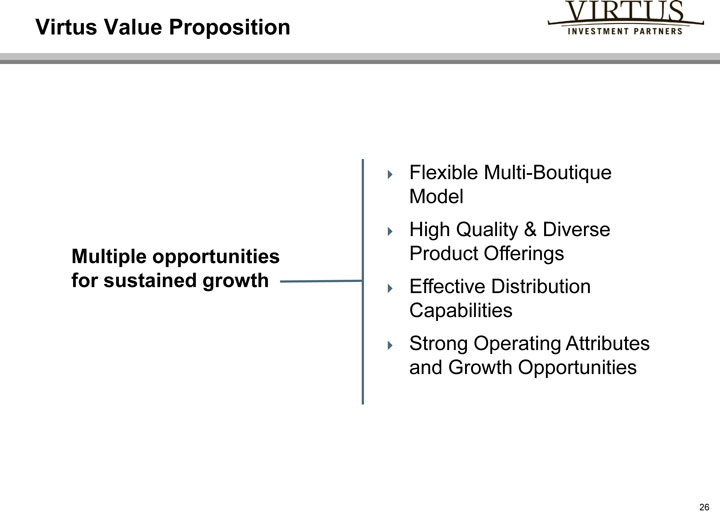
Virtus Value Proposition
Flexible Multi-Boutique
Model
High Quality & Diverse
Multiple opportunities Product Offerings
for sustained growth Effective Distribution
Capabilities
Strong Operating Attributes
and Growth Opportunities
26
Appendix
27
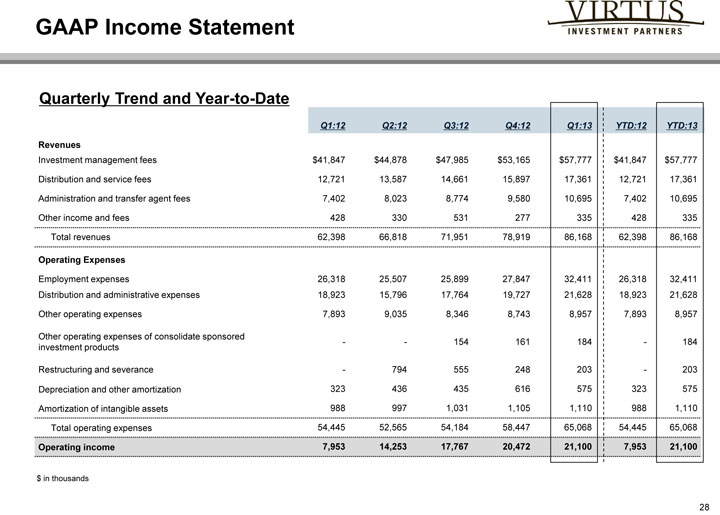
GAAP Income Statement
Quarterly Trend and Year-to-Date
GAAP Income Statement
Quarterly Trend and Year-to-Date
Q1:12 Q2:12 Q3:12 Q4:12 Q1:13 YTD:12 YTD:13
Revenues
Investment management fees $41,847 $44,878 $47,985 $53,165 $57,777 $41,847 $57,777
Distribution and service fees 12,721 13,587 14,661 15,897 17,361 12,721 17,361
Administration and transfer agent fees 7,402 8,023 8,774 9,580 10,695 7,402 10,695
Other income and fees 428 330 531 277 335 428 335
Total revenues 62,398 66,818 71,951 78,919 86,168 62,398 86,168
Operating Expenses
Employment expenses 26,318 25,507 25,899 27,847 32,411 26,318 32,411
Distribution and administrative expenses 18,923 15,796 17,764 19,727 21,628 18,923 21,628
Other operating expenses 7,893 9,035 8,346 8,743 8,957 7,893 8,957
Other operating expenses of consolidate sponsored—154 161 184—184
investment products
Restructuring and severance—794 555 248 203—203
Depreciation and other amortization 323 436 435 616 575 323 575
Amortization of intangible assets 988 997 1,031 1,105 1,110 988 1,110
Total operating expenses 54,445 52,565 54,184 58,447 65,068 54,445 65,068
Operating income 7,953 14,253 17,767 20,472 21,100 7,953 21,100
$ in thousands
28
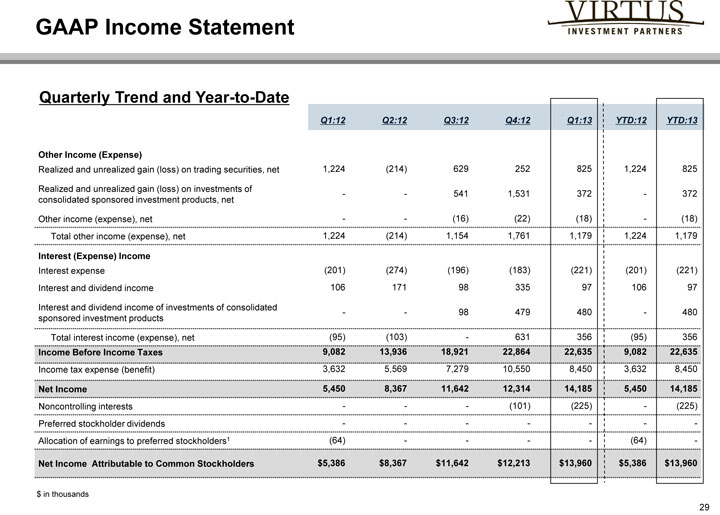
GAAP Income Statement
Quarterly Trend and Year-to-Date
Q1:12 Q2:12 Q3:12 Q4:12 Q1:13 YTD:12 YTD:13
Other Income (Expense)
Realized and unrealized gain (loss) on trading securities, net 1,224 (214) 629 252 825 1,224 825
Realized and unrealized gain (loss) on investments of—541 1,531 372—372
consolidated sponsored investment products, net
Other income (expense), net—(16) (22) (18)—(18)
Total other income (expense), net 1,224 (214) 1,154 1,761 1,179 1,224 1,179
Interest (Expense) Income
Interest expense (201) (274) (196) (183) (221) (201) (221)
Interest and dividend income 106 171 98 335 97 106 97
Interest and dividend income of investments of consolidated—98 479 480—480
sponsored investment products
Total interest income (expense), net (95) (103)—631 356 (95) 356
Income Before Income Taxes 9,082 13,936 18,921 22,864 22,635 9,082 22,635
Income tax expense (benefit) 3,632 5,569 7,279 10,550 8,450 3,632 8,450
Net Income 5,450 8,367 11,642 12,314 14,185 5,450 14,185
Noncontrolling interests——(101) (225)—(225)
Preferred stockholder dividends———-
Allocation of earnings to preferred stockholders1 (64)—— (64)—
Net Income Attributable to Common Stockholders $5,386 $8,367 $11,642 $12,213 $13,960 $5,386 $13,960
$ in thousands
29
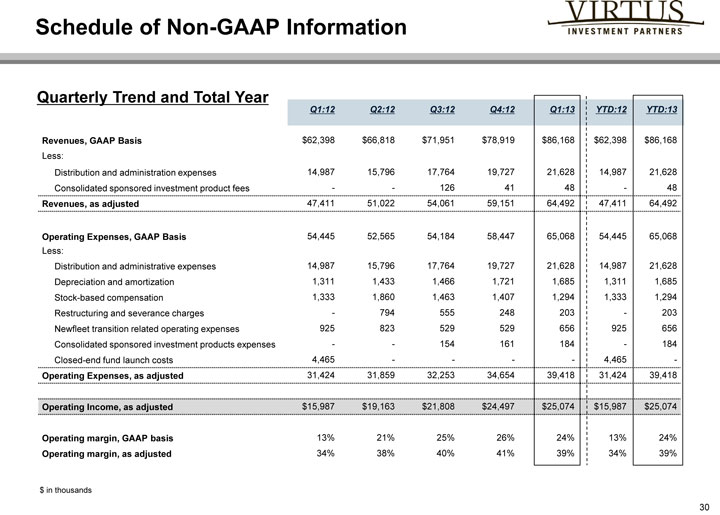
Schedule of Non-GAAP Information
Quarterly Trend and Total Year
Q1:12 Q2:12 Q3:12 Q4:12 Q1:13 YTD:12 YTD:13
Revenues, GAAP Basis $62,398 $66,818 $71,951 $78,919 $86,168 $62,398 $86,168
Less:
Distribution and administration expenses 14,987 15,796 17,764 19,727 21,628 14,987 21,628
Consolidated sponsored investment product fees—126 41 48—48
Revenues, as adjusted 47,411 51,022 54,061 59,151 64,492 47,411 64,492
Operating Expenses, GAAP Basis 54,445 52,565 54,184 58,447 65,068 54,445 65,068
Less:
Distribution and administrative expenses 14,987 15,796 17,764 19,727 21,628 14,987 21,628
epreciation and amortization 1,311 1,433 1,466 1,721 1,685 1,311 1,685
Stock-based compensation 1,333 1,860 1,463 1,407 1,294 1,333 1,294
Restructuring and severance charges—794 555 248 203—203
Newfleet transition related operating expenses 925 823 529 529 656 925 656
Consolidated sponsored investment products expenses—154 161 184—184
Closed-end fund launch costs 4,465—— 4,465—
Operating Expenses, as adjusted 31,424 31,859 32,253 34,654 39,418 31,424 39,418
Operating Income, as adjusted $15,987 $19,163 $21,808 $24,497 $25,074 $15,987 $25,074
Operating margin, GAAP basis 13% 21% 25% 26% 24% 13% 24%
Operating margin, as adjusted 34% 38% 40% 41% 39% 34% 39%
$ in thousands
30
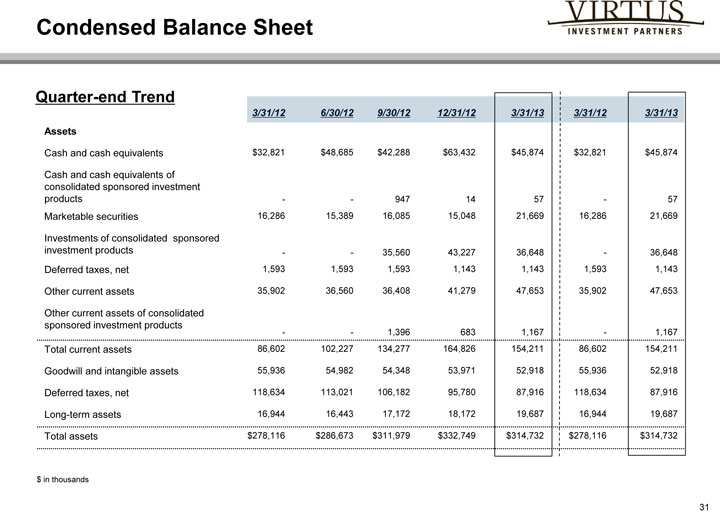
Condensed Balance Sheet
Quarter-end Trend
3/31/12 6/30/12 9/30/12 12/31/12 3/31/13 3/31/12 3/31/13
Assets
Cash and cash equivalents $32,821 $48,685 $42,288 $63,432 $45,874 $32,821 $45,874
Cash and cash equivalents of
consolidated sponsored investment
products—947 14 57—57
Marketable securities 16,286 15,389 16,085 15,048 21,669 16,286 21,669
Investments of consolidated sponsored
investment products—35,560 43,227 36,648—36,648
Deferred taxes, net 1,593 1,593 1,593 1,143 1,143 1,593 1,143
Other current assets 35,902 36,560 36,408 41,279 47,653 35,902 47,653
Other current assets of consolidated
sponsored investment products
—1,396 683 1,167—1,167
Total current assets 86,602 102,227 134,277 164,826 154,211 86,602 154,211
Goodwill and intangible assets 55,936 54,982 54,348 53,971 52,918 55,936 52,918
Deferred taxes, net 118,634 113,021 106,182 95,780 87,916 118,634 87,916
Long-term assets 16,944 16,443 17,172 18,172 19,687 16,944 19,687
Total assets $278,116 $286,673 $311,979 $332,749 $314,732 $278,116 $314,732
$ in thousands
31
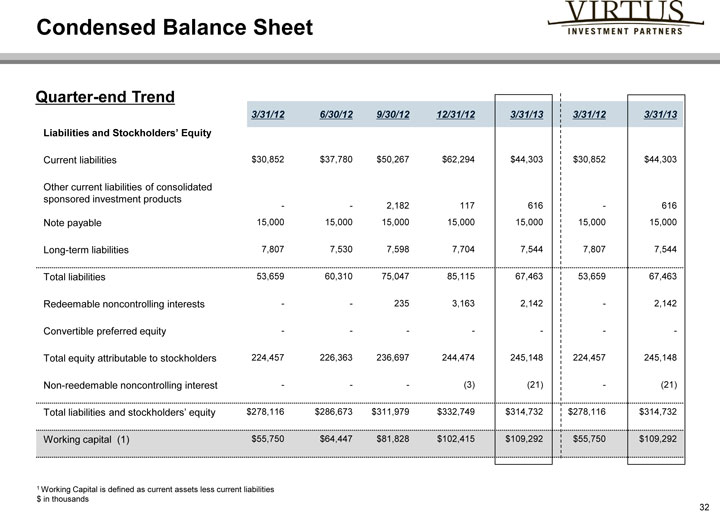
Condensed Balance Sheet
Quarter-end Trend
3/31/12 6/30/12 9/30/12 12/31/12 3/31/13 3/31/12 3/31/13
Liabilities and Stockholders’ Equity
Current liabilities $30,852 $37,780 $50,267 $62,294 $44,303 $30,852 $44,303
Other current liabilities of consolidated
sponsored investment products—2,182 117 616—616
Note payable 15,000 15,000 15,000 15,000 15,000 15,000 15,000
Long-term liabilities 7,807 7,530 7,598 7,704 7,544 7,807 7,544
Total liabilities 53,659 60,310 75,047 85,115 67,463 53,659 67,463
Redeemable noncontrolling interests—235 3,163 2,142—2,142
Convertible preferred equity————
Total equity attributable to stockholders 224,457 226,363 236,697 244,474 245,148 224,457 245,148
Non-reedemable noncontrolling interest——(3) (21)—(21)
Total liabilities and stockholders’ equity $278,116 $286,673 $311,979 $332,749 $314,732 $278,116 $314,732
Working capital (1) $55,750 $64,447 $81,828 $102,415 $109,292 $55,750 $109,292
| 1 |
|
Working Capital is defined as current assets less current liabilities |
$ in thousands
32
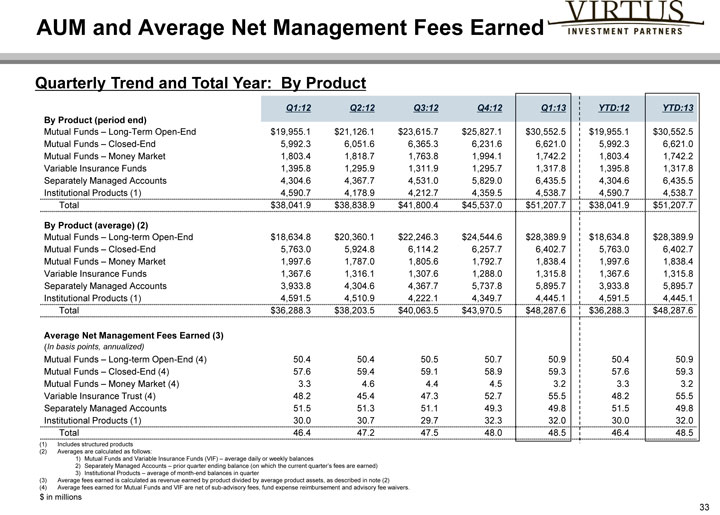
AUM and Average Net Management Fees Earned
Quarterly Trend and Total Year: By Product
Q1:12 Q2:12 Q3:12 Q4:12 Q1:13 YTD:12 YTD:13
By Product (period end)
Mutual Funds – Long-Term Open-End $19,955.1 $21,126.1 $23,615.7 $25,827.1 $30,552.5 $19,955.1 $30,552.5
Mutual Funds – Closed-End 5,992.3 6,051.6 6,365.3 6,231.6 6,621.0 5,992.3 6,621.0
Mutual Funds – Money Market 1,803.4 1,818.7 1,763.8 1,994.1 1,742.2 1,803.4 1,742.2
Variable Insurance Funds 1,395.8 1,295.9 1,311.9 1,295.7 1,317.8 1,395.8 1,317.8
Separately Managed Accounts 4,304.6 4,367.7 4,531.0 5,829.0 6,435.5 4,304.6 6,435.5
Institutional Products (1) 4,590.7 4,178.9 4,212.7 4,359.5 4,538.7 4,590.7 4,538.7
Total $38,041.9 $38,838.9 $41,800.4 $45,537.0 $51,207.7 $38,041.9 $51,207.7
By Product (average) (2)
Mutual Funds – Long-term Open-End $18,634.8 $20,360.1 $22,246.3 $24,544.6 $28,389.9 $18,634.8 $28,389.9
Mutual Funds – Closed-End 5,763.0 5,924.8 6,114.2 6,257.7 6,402.7 5,763.0 6,402.7
Mutual Funds – Money Market 1,997.6 1,787.0 1,805.6 1,792.7 1,838.4 1,997.6 1,838.4
Variable Insurance Funds 1,367.6 1,316.1 1,307.6 1,288.0 1,315.8 1,367.6 1,315.8
Separately Managed Accounts 3,933.8 4,304.6 4,367.7 5,737.8 5,895.7 3,933.8 5,895.7
Institutional Products (1) 4,591.5 4,510.9 4,222.1 4,349.7 4,445.1 4,591.5 4,445.1
Total $36,288.3 $38,203.5 $40,063.5 $43,970.5 $48,287.6 $36,288.3 $48,287.6
Average Net Management Fees Earned (3)
(In basis points, annualized)
Mutual Funds – Long-term Open-End (4) 50.4 50.4 50.5 50.7 50.9 50.4 50.9
Mutual Funds – Closed-End (4) 57.6 59.4 59.1 58.9 59.3 57.6 59.3
Mutual Funds – Money Market (4) 3.3 4.6 4.4 4.5 3.2 3.3 3.2
Variable Insurance Trust (4) 48.2 45.4 47.3 52.7 55.5 48.2 55.5
Separately Managed Accounts 51.5 51.3 51.1 49.3 49.8 51.5 49.8
Institutional Products (1) 30.0 30.7 29.7 32.3 32.0 30.0 32.0
Total 46.4 47.2 47.5 48.0 48.5 46.4 48.5
| (1) |
|
Includes structured products |
| (2) |
|
Averages are calculated as follows: |
1) Mutual Funds and Variable Insurance Funds (VIF) – average daily or weekly balances
2) Separately Managed Accounts – prior quarter ending balance (on which the current quarter’s fees are earned)
3) Institutional Products – average of month-end balances in quarter
(3) Average fees earned is calculated as revenue earned by product divided by average product assets, as described in note (2)
(4) Average fees earned for Mutual Funds and VIF are net of sub-advisory fees, fund expense reimbursement and advisory fee waivers.
$ in millions
33
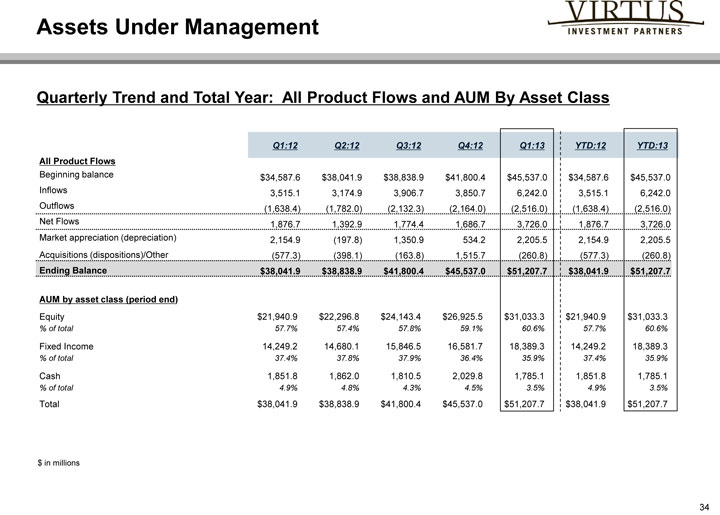
Assets Under Management
Quarterly Trend and Total Year: All Product Flows and AUM By Asset Class
Q1:12 Q2:12 Q3:12 Q4:12 Q1:13 YTD:12 YTD:13
All Product Flows
Beginning balance $34,587.6 $38,041.9 $38,838.9 $41,800.4 $45,537.0 $34,587.6 $45,537.0
Inflows 3,515.1 3,174.9 3,906.7 3,850.7 6,242.0 3,515.1 6,242.0
Outflows (1,638.4) (1,782.0) (2,132.3) (2,164.0) (2,516.0) (1,638.4) (2,516.0)
Net Flows 1,876.7 1,392.9 1,774.4 1,686.7 3,726.0 1,876.7 3,726.0
Market appreciation (depreciation) 2,154.9 (197.8) 1,350.9 534.2 2,205.5 2,154.9 2,205.5
Acquisitions (dispositions)/Other (577.3) (398.1) (163.8) 1,515.7 (260.8) (577.3) (260.8)
Ending Balance $38,041.9 $38,838.9 $41,800.4 $45,537.0 $51,207.7 $38,041.9 $51,207.7
AUM by asset class (period end)
Equity $21,940.9 $22,296.8 $24,143.4 $26,925.5 $31,033.3 $21,940.9 $31,033.3
% of total 57.7% 57.4% 57.8% 59.1% 60.6% 57.7% 60.6%
Fixed Income 14,249.2 14,680.1 15,846.5 16,581.7 18,389.3 14,249.2 18,389.3
% of total 37.4% 37.8% 37.9% 36.4% 35.9% 37.4% 35.9%
Cash 1,851.8 1,862.0 1,810.5 2,029.8 1,785.1 1,851.8 1,785.1
% of total 4.9% 4.8% 4.3% 4.5% 3.5% 4.9% 3.5%
Total $38,041.9 $38,838.9 $41,800.4 $45,537.0 $51,207.7 $38,041.9 $51,207.7
$ in millions
34
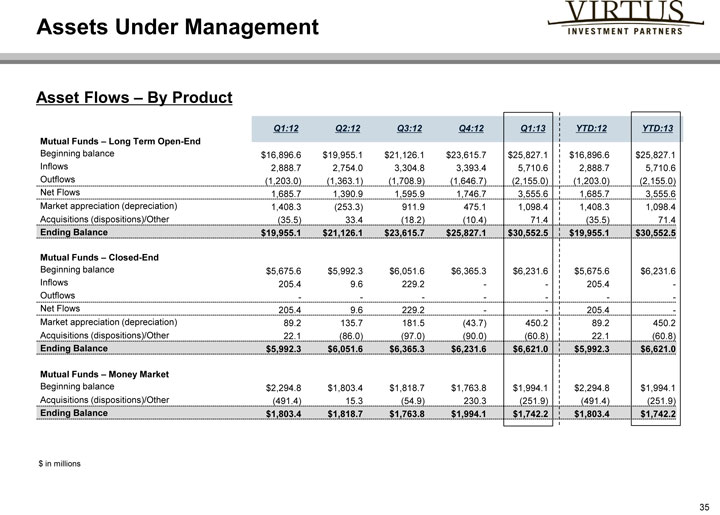
Assets Under Management
Asset Flows – By Product
Q1:12 Q2:12 Q3:12 Q4:12 Q1:13 YTD:12 YTD:13
Mutual Funds – Long Term Open-End
Beginning balance $16,896.6 $19,955.1 $21,126.1 $23,615.7 $25,827.1 $16,896.6 $25,827.1
Inflows 2,888.7 2,754.0 3,304.8 3,393.4 5,710.6 2,888.7 5,710.6
Outflows (1,203.0) (1,363.1) (1,708.9) (1,646.7) (2,155.0) (1,203.0) (2,155.0)
Net Flows 1,685.7 1,390.9 1,595.9 1,746.7 3,555.6 1,685.7 3,555.6
Market appreciation (depreciation) 1,408.3 (253.3) 911.9 475.1 1,098.4 1,408.3 1,098.4
Acquisitions (dispositions)/Other (35.5) 33.4 (18.2) (10.4) 71.4 (35.5) 71.4
Ending Balance $19,955.1 $21,126.1 $23,615.7 $25,827.1 $30,552.5 $19,955.1 $30,552.5
Mutual Funds – Closed-End
Beginning balance $5,675.6 $5,992.3 $6,051.6 $6,365.3 $6,231.6 $5,675.6 $6,231.6
Inflows 205.4 9.6 229.2—205.4—
Outflows————
Net Flows 205.4 9.6 229.2—205.4—
Market appreciation (depreciation) 89.2 135.7 181.5 (43.7) 450.2 89.2 450.2
Acquisitions (dispositions)/Other 22.1 (86.0) (97.0) (90.0) (60.8) 22.1 (60.8)
Ending Balance $5,992.3 $6,051.6 $6,365.3 $6,231.6 $6,621.0 $5,992.3 $6,621.0
Mutual Funds – Money Market
Beginning balance $2,294.8 $1,803.4 $1,818.7 $1,763.8 $1,994.1 $2,294.8 $1,994.1
Acquisitions (dispositions)/Other (491.4) 15.3 (54.9) 230.3 (251.9) (491.4) (251.9)
Ending Balance $1,803.4 $1,818.7 $1,763.8 $1,994.1 $1,742.2 $1,803.4 $1,742.2
$ in millions
35
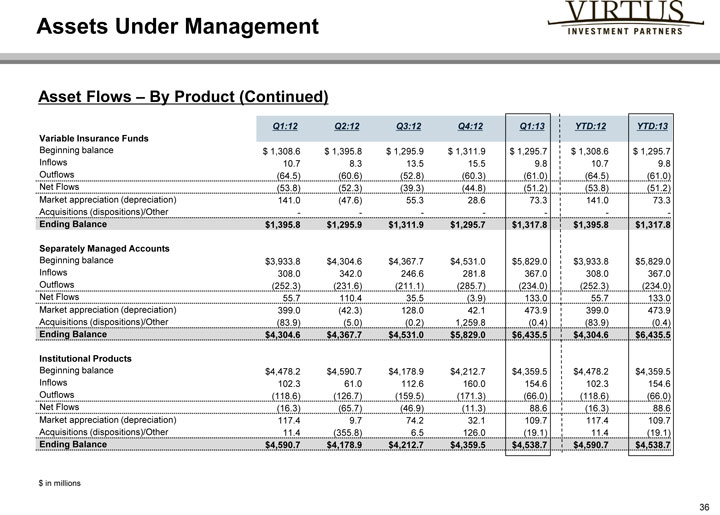
Assets Under Management
Asset Flows – By Product (Continued)
Q1:12 Q2:12 Q3:12 Q4:12 Q1:13 YTD:12 YTD:13
Variable Insurance Funds
Beginning balance $ 1,308.6 $ 1,395.8 $ 1,295.9 $ 1,311.9 $ 1,295.7 $ 1,308.6 $ 1,295.7
Inflows 10.7 8.3 13.5 15.5 9.8 10.7 9.8
Outflows (64.5) (60.6) (52.8) (60.3) (61.0) (64.5) (61.0)
Net Flows (53.8) (52.3) (39.3) (44.8) (51.2) (53.8) (51.2)
Market appreciation (depreciation) 141.0 (47.6) 55.3 28.6 73.3 141.0 73.3
Acquisitions (dispositions)/Other————
Ending Balance $ 1,395.8 $ 1,295.9 $ 1,311.9 $ 1,295.7 $ 1,317.8 $ 1,395.8 $ 1,317.8
Separately Managed Accounts
Beginning balance $ 3,933.8 $ 4,304.6 $ 4,367.7 $ 4,531.0 $ 5,829.0 $ 3,933.8 $ 5,829.0
Inflows 308.0 342.0 246.6 281.8 367.0 308.0 367.0
Outflows (252.3) (231.6) (211.1) (285.7) (234.0) (252.3) (234.0)
Net Flows 55.7 110.4 35.5 (3.9) 133.0 55.7 133.0
Market appreciation (depreciation) 399.0 (42.3) 128.0 42.1 473.9 399.0 473.9
Acquisitions (dispositions)/Other (83.9) (5.0) (0.2) 1,259.8 (0.4) (83.9) (0.4)
Ending Balance $ 4,304.6 $ 4,367.7 $ 4,531.0 $ 5,829.0 $ 6,435.5 $ 4,304.6 $ 6,435.5
Institutional Products
Beginning balance $ 4,478.2 $ 4,590.7 $ 4,178.9 $ 4,212.7 $ 4,359.5 $ 4,478.2 $ 4,359.5
Inflows 102.3 61.0 112.6 160.0 154.6 102.3 154.6
Outflows (118.6) (126.7) (159.5) (171.3) (66.0) (118.6) (66.0)
Net Flows (16.3) (65.7) (46.9) (11.3) 88.6 (16.3) 88.6
Market appreciation (depreciation) 117.4 9.7 74.2 32.1 109.7 117.4 109.7
Acquisitions (dispositions)/Other 11.4 (355.8) 6.5 126.0 (19.1) 11.4 (19.1)
Ending Balance $ 4,590.7 $ 4,178.9 $ 4,212.7 $ 4,359.5 $ 4,538.7 $ 4,590.7 $ 4,538.7
$ in millions
36
Footnotes to Schedule of Non-GAAP Information
The company reports its financial results on a Generally Accepted Accounting Principles (GAAP) basis; however management believes that evaluating the company’s ongoing operating results may be enhanced if investors have additional non-GAAP financial measures. Management reviews non-GAAP financial measures to assess ongoing operations and considers them to only be additional metrics for both management and investors to consider the company’s financial performance over time, as noted in the footnotes below.
Management does not advocate that investors consider such non-GAAP financial measures in isolation from, or as a substitute for, financial results prepared in accordance with GAAP.
Notes for Reconciliation to GAAP Reporting
1) Revenues and expenses related to consolidated sponsored investment products have been excluded to reflect revenues and expenses of the company prior to the consolidation of these products.
2) Revenues, as adjusted, is a non-GAAP financial measure calculated by netting distribution and administration expenses from GAAP revenues. Management believes Revenues, as adjusted, provides useful information to investors because distribution and administration expenses are costs that are generally passed directly through to external parties. For the three months ended March 31, 2012, distribution and administration expenses that included $3.9 million of structuring fees related to the closed-end fund launch. For the purposes of calculating Revenues, as adjusted, for the three months ended March 31, 2012, structuring fees paid to third-party distributors for the closed-end fund launch are excluded as they do not have a related revenue offset.
3) For the three months ended March 31, 2013, March 31, 2012 and December 31, 2012, stock-based compensation expense includes $1.3, $1.0 and $1.4 million, respectively, of expenses related to equity issued under the company’s annual incentive and long-term plans
4) For the three months ended March 31, 2013, March 31, 2012 and December 31, 2012, Newfleet transition-related operating expenses include $0.2 million, $0.3 million and $0.2 million, respectively, of stock-based compensation.
5) For the three months ended March 31, 2012 closed-end fund launch costs comprise structuring fees of $3.9 million payable to underwriters, sales-based incentive compensation of $0.4 million and unreimbursed offering costs of $0.2 million.
6) Operating expenses, as adjusted, is a non-GAAP financial measure that management believes provides investors with additional information because of the nature of the specific excluded operating expenses. Specifically, management adds back amortization attributable to acquisition-related intangible assets as this may be useful to an investor to consider our operating results with the results of other asset management firms that have not engaged in significant acquisitions. In addition, we add back restructuring and severance charges as we believe that operating expenses exclusive of these costs will aid comparability of the information to prior reporting periods. We believe that because of the variety of equity awards used by companies and the varying methodologies for determining stock-based compensation expense, excluding stock-based compensation enhances the ability of management and investors to compare financial results over periods. Distribution and administrative expenses are excluded for the reason set forth above.
7) Operating income (loss), as adjusted, and operating margin, as adjusted, are calculated using the basis of revenues, as adjusted, and operating expenses, as adjusted, as described above.
The above measures should not be considered as substitutes for any measures derived in accordance with GAAP and may not be comparable to similarly titled measures of other companies. Exclusion of items in our non-GAAP presentation should not be considered as an inference that these items are unusual, infrequent or non-recurring.