Attached files
| file | filename |
|---|---|
| 8-K - FORM 8-K - FLOW INTERNATIONAL CORP | q4fy14pressrelease.htm |
| EX-99.1 - PRESS RELEASE DATED JUNE 7, 2013 WITH PRELIMINARY UNAUDITED FINANCIAL RESULTS - FLOW INTERNATIONAL CORP | flow-ex991_20130430xq4prer.htm |
Flow International Corporation Investor Presentation June 7, 2013

2 Safe Harbor Statement This presentation contains forward-looking statements within the meaning of the safe-harbor provisions of the Private Securities Litigation Reform Act of 1995. Such statements involve known and unknown risks, uncertainties and other factors that could cause the actual results of the Company to differ materially from the results expressed or implied by such statements, including delivery of profitable, dynamic growth, growth opportunities for and competitive advantages of waterjets, future gross margin levels, the potential offered by new sales channels, reduced cost on new products, optimizing commission plans, and expected cost reductions. Accordingly, although the Company believes that the expectations reflected in such forward-looking statements are reasonable, there can be no assurance that such expectations will prove to be correct. The Company has no obligation to update the forward-looking information contained in this presentation. The Company further cautions that the results shown for fourth quarter and full fiscal year 2013 are preliminary and may change. The Company does not intend to update these results prior to the filing of its Annual Report on Form 10-K.

3 Company Overview Flow International Corporation… A global technology-based company committed to providing a world-class customer experience Category founder and world leading provider of water jet cutting and cleaning solutions Trailing 4 quarter revenue of $259 Million and EBITDA of $21.6 Million (Preliminary)

4 How a Waterjet Works Ultra-High Pressure hydraulic driven pump generates stream of water with rated pressure of up to 94,000 PSI Small garnet particles introduced to the high velocity water stream to generate abrasive cutting Water and garnet exit at nearly four times the speed of sound capable of cutting steel over two feet thick Pressure is converted to velocity via tiny jeweled orifice creating a stream the thickness of two strands of a human hair 1 2 3 4

5 Waterjet Applications Overview Our ultrahigh-pressure water pumps generate pressures from 40,000 to over 94,000 pounds per square inch (psi) and power waterjet systems that are used to cut and clean many materials. Waterjet applications are virtually unlimited serving many diverse end markets… Flow Waterjets cut shapes in virtually any solid material including: stone, tile, glass, metal, foam, rubber, composites, plastic, and food.

6 Current Situation & Opportunity Flow has an attractive long-term opportunity and market position Significant leadership position in attractive waterjet category Waterjets enjoy very high awareness and acceptance yet are still under-penetrated Flow owns “Technology leadership and superior performance at every price point” Aftermarket parts represent 30% of revenue stream Significant new products launched over the past four years Two strong distribution channels firmly in place and driving growth globally Internal systems investments and process improvements now paying off Currently experiencing a temporary pause in long-term growth curve due to macro-economic uncertainty Foundational strategic investments have been completed allowing meaningful cost reductions to now be implemented

7 Executed on a 3 Year Growth Plan ◦ 12 Quarters ago, internal plan (purple line) put in place to achieve $75M revenue per quarter ◦ Quarterly sequential revenue growth in 9 of the 12 quarters ◦ All-time record revenue in 4 out of the past 6 quarters ◦ Market softened in the 12th quarter (April 30, 2013 quarter) $46,580 $52,935 $57,473 $59,536 $60,030 $64,533 $65,808 $63,397 $66,235 $67,038 $67,658 $58,407 41.5%. 37.5% 40.2% 37.3% 38.5% 39.2% 39.6% 39.2% 37.4% 37.9% 39.4% 36.7% 1.4% 1.6% 4.9% 0.9% 1.9% 8.0% 9.1% 5.4% 6.4% 5.9% 7.1% 0.1% $- $10,000 $20,000 $30,000 $40,000 $50,000 $60,000 $70,000 $80,000 Q1FY11 Q2FY11 Q3FY11 Q4FY11 Q1FY12 Q2FY12 Q3FY12 Q4FY12 Q1FY13 Q2FY13 Q3 FY13 Q4 FY13E Dollars in thousands Sales Gross Margin % Pro Forma Operating Income Margin ** 3-Yr Revenue Plan $75,000 **Pro Forma Operating Income Margin for the fiscal quarters presented excludes a non cash stock compensation charge of $1.1M in Q4 FY12. There were no other adjustments for other periods.

8 Operating Expenses: FY08 vs. FY13E (a) FY08 includes non-recurring charges of $2.9M former CEO contract payment and $0.6M for repurchasing warrants ◦ Operating Expense spending versus five years ago is flat Even after backing out one-time items in 2008, spending increase is less than inflation ◦ Significant strategic investments have been funded by cutting G&A costs, not adding dollars: Product development and launches in R&E and S&M Channel development in S&M Systems enhancement throughout Revenue 244,259$ 100.0% 259,338$ 100.0% 15,079$ 6.2% Total Sales and Marketing 42,272$ 17.3% 50,251$ 19.4% 7,979$ 18.9% Total Research and Engineering 8,771$ 3.6% 11,431$ 4.4% 2,660$ 30.3% Total General and Adminstrative (a) 33,888$ 13.9% 23,572$ 9.1% (10,316)$ -30.4% Total Operating Expenses 84,931$ 34.8% 85,254$ 32.9% 323$ 0 .4% Total Adj. Operating Expenses (a) 81,431$ 33.3% 85,254$ 32.9% 3,823$ 4 .7% D versus 2008 Increase (Decrease) 2008 2013E
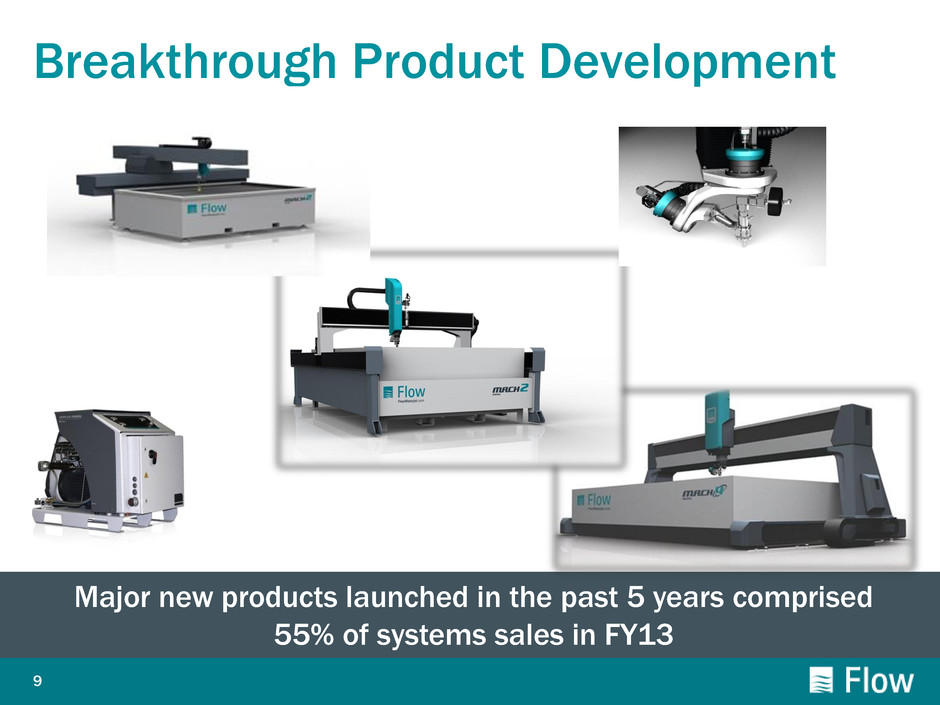
9 Breakthrough Product Development Major new products launched in the past 5 years comprised 55% of systems sales in FY13

10 New Products Investment Between 30% and 50% of R&E for 5 years Total investment ~$21M Annual increment vs FY08 ~$2.4M Return 55% of Systems revenue in FY13 New products generated $31M gross margin in FY13 compared to $21M five year investment Newest products, M4c & M2c, generated $40M revenue in FY13 What’s Next? Gross Margins on newest products still 10 points below fleet representing $4M annual target “Wring out” costs to deliver $4M reduction in annual run rate by year-end FY14 (Expecting $250K in Q1, ramping to $1M in Q4) 55% 45% New Products All Other

11 Dual Distribution Channels Investment ~$3M incremental cost to establish, maintain, and compensate the second or “indirect” channel Return Robust 3 year systems revenue growth rates in both channels Direct: 20% CAGR Indirect: 35% CAGR now generating $70M in annual revenue 90+ indirect partner companies 300+ people selling Flow in 80+ countries What’s Next? Optimize commissions now that both channels are firmly in place

12 Internal Systems Investment ~$15M capital investment ~$2.4M annual depreciation Return Enabled meaningful efficiencies as revenue grew Current headcount nearly 15% lower than in FY08 What’s Next? Optimize installed systems to drive further efficiency while reducing ongoing spend rate because major build phase is complete
13 Preliminary Q4 Results and Q1 Outlook Preliminary Q4 FY13 Results Revenues of $58.4M down 8% vs prior year Breakeven on operating profit Operating expenses were consistent with other quarters in FY13 Gross margins just below 37% due to low volume and excess capacity Q1 FY14 Outlook Revenues similar to Q4 representing ~10% below prior year Operating Income margin of approximately 4% ($2.0M) Does not include anticipated restructuring/one-time charges of up to $1.0M

14 FY13 Full Year Results Preliminary Numbers Revenues of $259M up 2% versus prior year Q3 YTD up 6% Q4 down 8% Record revenues in 3 of the 4 quarters Operating profit of $13M or 5% of sales Operating Expenses flat versus prior year (within 0.5%) Adjusted EBITDA of $21.6M or 8.3% of sales Positive Net Cash Position New four year $40M credit facility

15 $13 Million of Cost Reductions COGS reduction $4M reduction in annual costs related to new products (10 margin points improvement) Expecting $250K impact in Q1, ramping to $1M in Q4 Operating Expenses 10% reduction $9M annually Expecting $1M impact in Q1 ramping to $2.2M in Q4 Total $13M total cost reductions already initiated 5% of FY13 revenue Expecting $1.25M impact in Q1 ramping to $3.2M in Q4 Foundational strategic investments have been completed allowing meaningful cost reductions to now be implemented without compromising Flow’s future The Foundation: New Products, Dual Channels, Internal Systems
16 Evaluating Strategic Alternatives to Enhance Shareholder Value Having invested in new products, channels to market and internal systems, and taken other steps to grow the business and increase margins, the Board believes now is the right time to explore strategic alternatives The Board has retained UBS as financial advisor and will consider, among other alternatives, the potential sale of the Company The Board is committed to maximizing value for all FLOW shareholders There can be no assurance that the exploration of strategic alternatives will result in any transaction

17 Summary Flow holds the global leadership position in attractive category Flow’s 3 year growth plan tracked well for 11 quarters Recent and current quarter negatively impacted by macro-economic uncertainty (down 8% to 10%) Immediate cost reductions put in place to respond to current environment Critical strategic investments largely complete so future growth capabilities remain intact New lower cost business model has been launched With this foundation firmly in place, Flow is evaluating strategic alternatives for creating shareholder value
Flow International Corporation Investor Presentation June 7, 2013

Appendix
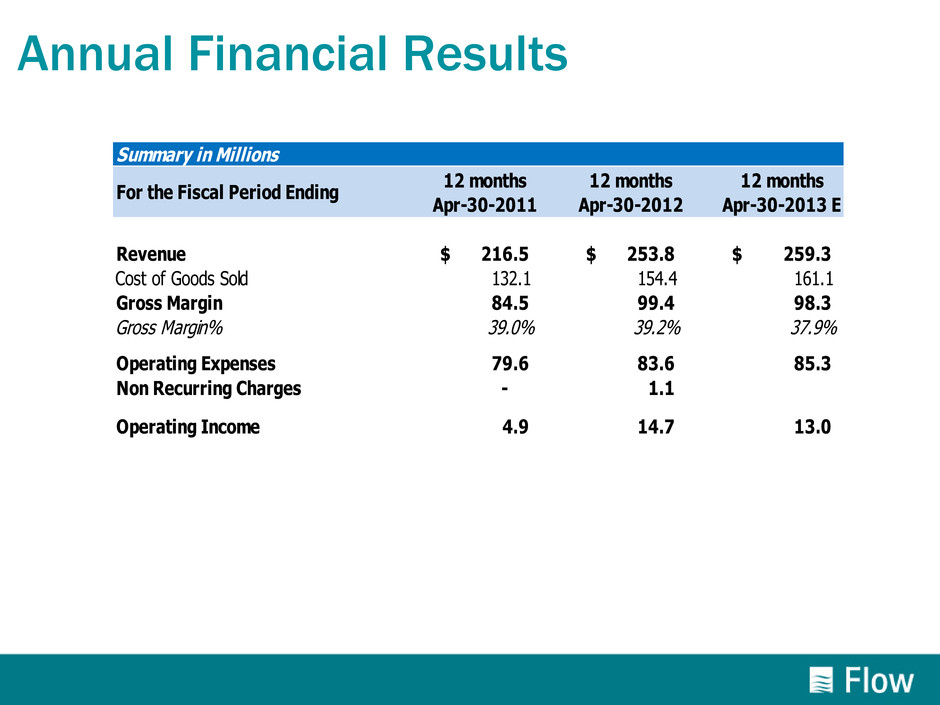
Annual Financial Results Summary in Millions 12 months 12 months 12 months Apr-30-2011 Apr-30-2012 Apr-30-2013 E Revenue 216.5$ 253.8$ 259.3$ Cost of Goods Sold 132.1 154.4 161.1 Gross Margin 84.5 99.4 98.3 Gross Margin% 39.0% 39.2% 37.9% Operating Expenses 79.6 83.6 85.3 Non Recurring Charges - 1.1 Operating Income 4.9 14.7 13.0 For the Fiscal Period Ending

Quarterly Financial Results Summary in Millions 3 months ended 3 months ended 3 months ended 3 months ended 3 months ended 3 months ended Jan-31-2012 Apr-30-2012 Jul-31-2012 Oct-31-2012 Jan-31-2013 Apr-30-2013 E Revenue 65.8$ 63.4$ 66.2$ 67.0$ 67.7$ 58.4$ Cost of Goods Sold 39.7 38.5 41.4 41.6 41.0 37.0 Gross Margin 26.1 24.9 24.8 25.4 26.7 21.4 Gross Margin% 39.6% 39.2% 37.4% 37.9% 39.4% 36.7% Operating Expenses 20.1 21.4 20.6 21.5 21.9 21.4 Non Recurring Charges - 1.1 - - - - Operating Income 6.0 2.4 4.2 4.0 4.8 0.0 For the Fiscal Period Ending

EBITDA Reconciliation Summary in Millions FY12 Q1 FY12 Q2 FY12 Q3 FY12 Q4 FY13 Q1 FY13 Q2 FY13 Q3 FY13 Q4E Revenue 60.0$ 64.5$ 65.8$ 63.4$ 66.2$ 67.0$ 67.7$ 58.4$ Operating Income, as reported 1.2 5.2 6.0 2.4 4.2 4.0 4.8 0.0$ Operating Margin 1.9% 8.0% 9.1% 3.7% 6.4% 5.9% 7.1% 0.1% Consolidated Adjusted EBITDA Operating Income 1.2 5.2 6.0 2.4 4.2 4.0 4.8 0.0 Addback: Depreciation and Amortization 1.6 1.6 1.6 1.5 1.4 1.4 1.5 1.5$ Stock Based Compensation & Other (i) 0.6 0.6 0.5 1.7 0.7 0.6 0.6 0.7$ EBITDA 3.4 7.4 8.1 5.5 6.4 6.0 6.9 2.2 EBITDA Margin 5.6% 11.4% 12.3% 8.7% 9.6% 8.9% 10.3% 3.8% (i) Includes Other Allowable Add Backs Pursuant to Credit Facility Agreement For the Fiscal Period Ending
