Attached files
| file | filename |
|---|---|
| 8-K - FORM 8-K - UDR, Inc. | d549637d8k.htm |
Exhibit 99.1
| Acoma - Denver, CO NAREIT Investor Presentation June 2013 |
| 717 Olympic - Los Angeles, CA UDR, Inc. TABLE OF CONTENTS UDR, Inc. TABLE OF CONTENTS PAGE Why Multifamily Demand 3 New Multifamily Supply 4 Homeownership 5 Multifamily Sector Valuation 6 About UDR, Inc. 7 2013 Objectives / Recent Highlights 8 UDR Strategic Priorities 9 Capital Allocation 10 Development 11 Redevelopment 12 Transactions 13 Joint Ventures 14 Operational Excellence 15 Balance Sheet Management 16 Portfolio Improvement 17 Differentiating Characteristics 18 Investment Attributes 19 APPENDIX 2013 Earnings Guidance 21 UDR 2013 Market Growth Expectations 22 Definitions and Reconciliations 23 2 |
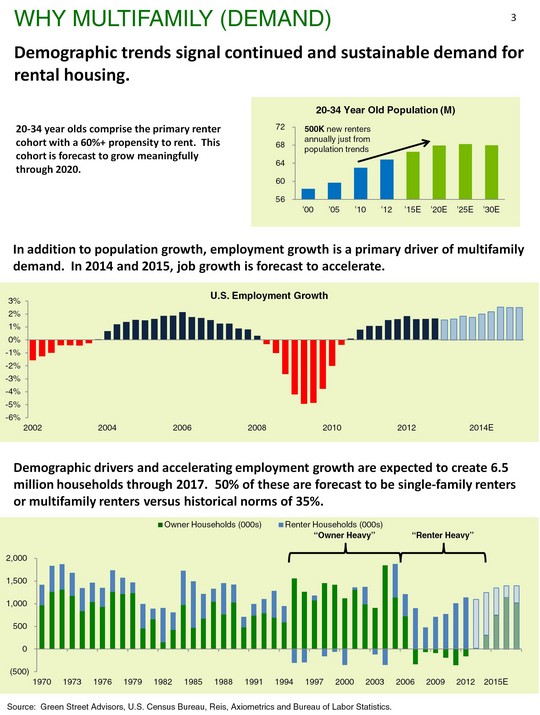
| Why Multifamily (Demand) (CHART) Source: Green Street Advisors, U.S. Census Bureau, Reis, Axiometrics and Bureau of Labor Statistics. 3 20-34 year olds comprise the primary renter cohort with a 60%+ propensity to rent. This cohort is forecast to grow meaningfully through 2020. In addition to population growth, employment growth is a primary driver of multifamily demand. In 2014 and 2015, job growth is forecast to accelerate. Demographic drivers and accelerating employment growth are expected to create 6.5 million households through 2017. 50% of these are forecast to be single-family renters or multifamily renters versus historical norms of 35%. (CHART) Demographic trends signal continued and sustainable demand for rental housing. (CHART) "Owner Heavy" "Renter Heavy" |
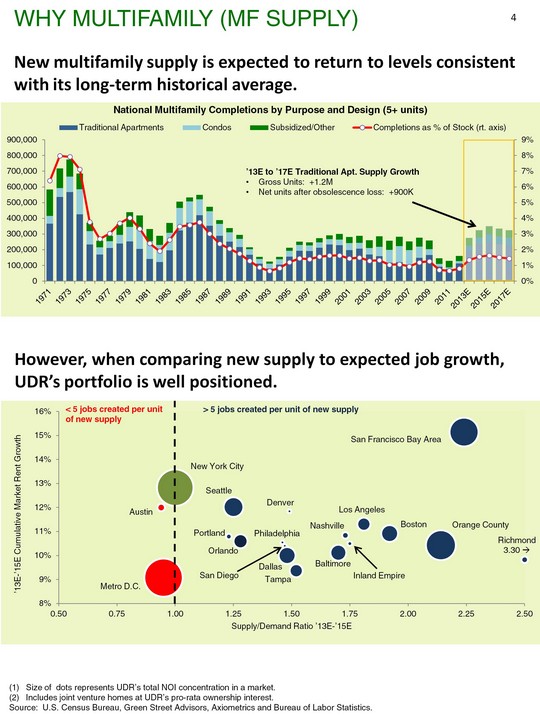
| However, when comparing new supply to expected job growth, UDR's portfolio is well positioned. Size of dots represents UDR's total NOI concentration in a market. Includes joint venture homes at UDR's pro-rata ownership interest. Source: U.S. Census Bureau, Green Street Advisors, Axiometrics and Bureau of Labor Statistics. Why Multifamily (MF Supply) 4 Portland New multifamily supply is expected to return to levels consistent with its long-term historical average. (CHART) '13E to '17E Traditional Apt. Supply Growth Gross Units: +1.2M Net units after obsolescence loss: +900K |
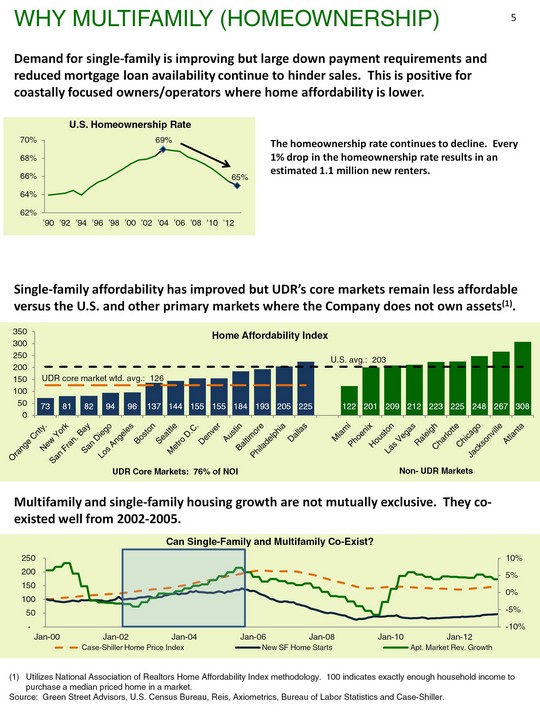
| Utilizes National Association of Realtors Home Affordability Index methodology. 100 indicates exactly enough household income to purchase a median priced home in a market. Source: Green Street Advisors, U.S. Census Bureau, Reis, Axiometrics, Bureau of Labor Statistics and Case-Shiller. Demand for single-family is improving but large down payment requirements and reduced mortgage loan availability continue to hinder sales. This is positive for coastally focused owners/operators where home affordability is lower. Why Multifamily (homeownership) 5 (CHART) The homeownership rate continues to decline. Every 1% drop in the homeownership rate results in an estimated 1.1 million new renters. Multifamily and single-family housing growth are not mutually exclusive. They co- existed well from 2002-2005. (CHART) (CHART) Single-family affordability has improved but UDR's core markets remain less affordable versus the U.S. and other primary markets where the Company does not own assets(1). |
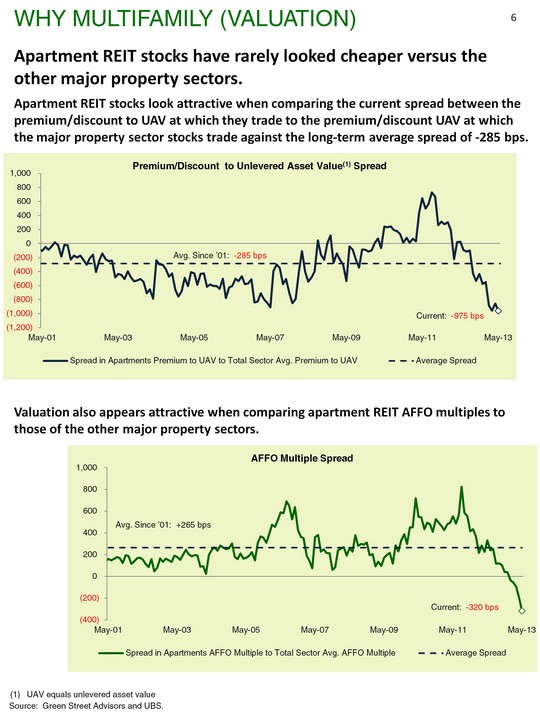
| (CHART) Apartment REIT stocks have rarely looked cheaper versus the other major property sectors. Source: Green Street Advisors and UBS. UAV equals unlevered asset value Why multifamily (Valuation) 6 (CHART) Apartment REIT stocks look attractive when comparing the current spread between the premium/discount to UAV at which they trade to the premium/discount UAV at which the major property sector stocks trade against the long-term average spread of -285 bps. Valuation also appears attractive when comparing apartment REIT AFFO multiples to those of the other major property sectors. |
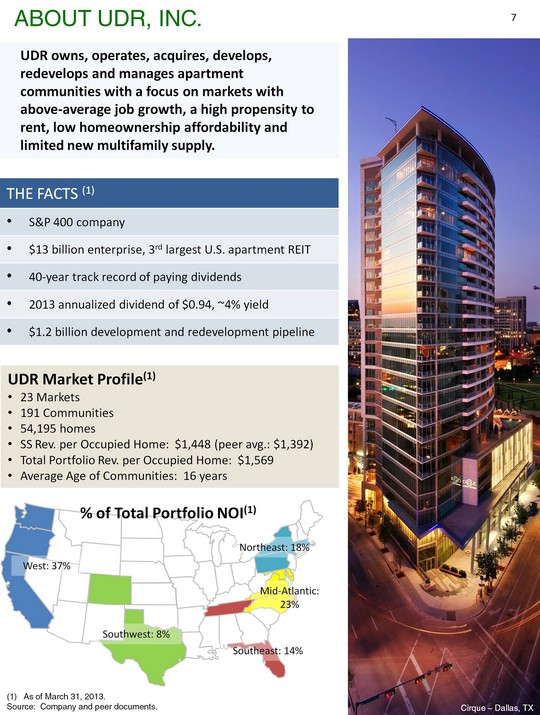
| About UDR, INC. 7 As of March 31, 2013. Source: Company and peer documents. The Facts (1) S&P 400 company $13 billion enterprise, 3rd largest U.S. apartment REIT 40-year track record of paying dividends 2013 annualized dividend of $0.94, ~4% yield $1.2 billion development and redevelopment pipeline West: 37% Southwest: 8% Southeast: 14% Mid-Atlantic: 23% Northeast: 18% UDR owns, operates, acquires, develops, redevelops and manages apartment communities with a focus on markets with above-average job growth, a high propensity to rent, low homeownership affordability and limited new multifamily supply. Cirque - Dallas, TX % of Total Portfolio NOI(1) |
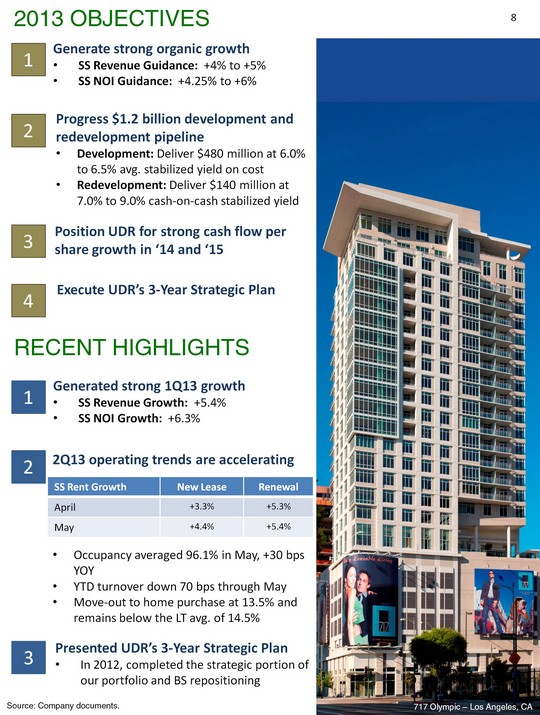
| 2013 objectives Generated strong 1Q13 growth SS Revenue Growth: +5.4% SS NOI Growth: +6.3% 1 2 3 8 Generate strong organic growth SS Revenue Guidance: +4% to +5% SS NOI Guidance: +4.25% to +6% 1 Recent Highlights Progress $1.2 billion development and redevelopment pipeline Development: Deliver $480 million at 6.0% to 6.5% avg. stabilized yield on cost Redevelopment: Deliver $140 million at 7.0% to 9.0% cash-on-cash stabilized yield 2 Position UDR for strong cash flow per share growth in '14 and '15 3 Execute UDR's 3-Year Strategic Plan 4 Presented UDR's 3-Year Strategic Plan In 2012, completed the strategic portion of our portfolio and BS repositioning 2Q13 operating trends are accelerating Occupancy averaged 96.1% in May, +30 bps YOY YTD turnover down 70 bps through May Move-out to home purchase at 13.5% and remains below the LT avg. of 14.5% 717 Olympic - Los Angeles, CA Source: Company documents. SS Rent Growth New Lease Renewal April +3.3% +5.3% May +4.4% +5.4% |
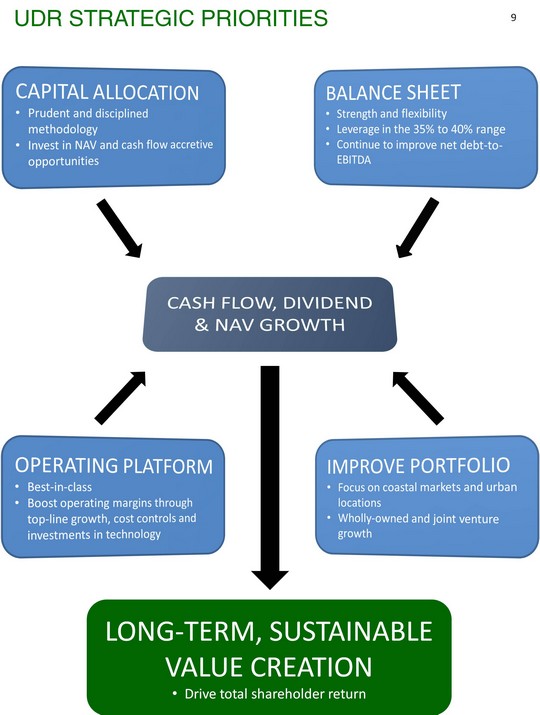
| UDR Strategic priorities 9 CAPITAL ALLOCATION Prudent and disciplined methodology Invest in NAV and cash flow accretive opportunities BALANCE SHEET Strength and flexibility Leverage in the 35% to 40% range Continue to improve net debt-to- EBITDA OPERATING PLATFORM Best-in-class Boost operating margins through top-line growth, cost controls and investments in technology IMPROVE PORTFOLIO Focus on coastal markets and urban locations Wholly-owned and joint venture growth CASH FLOW, DIVIDEND & NAV GROWTH LONG-TERM, SUSTAINABLE VALUE CREATION Drive total shareholder return |
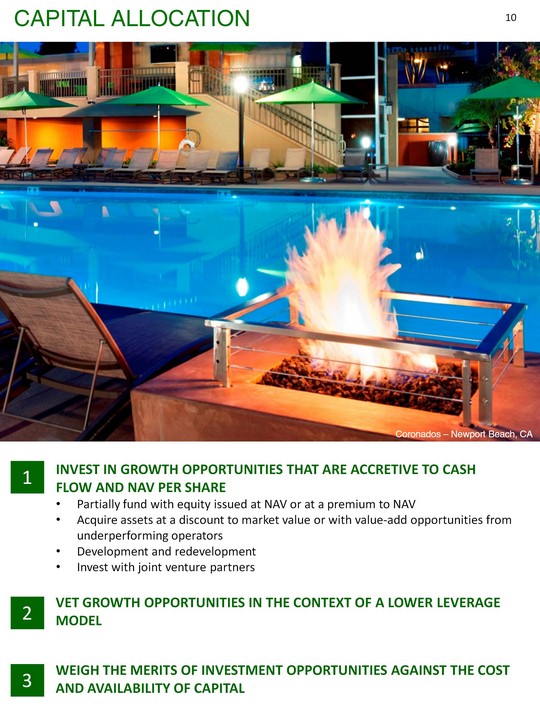
| Capital Allocation Invest in growth opportunities that are accretive to cash flow and NAV per share Partially fund with equity issued at NAV or at a premium to NAV Acquire assets at a discount to market value or with value-add opportunities from underperforming operators Development and redevelopment Invest with joint venture partners Vet growth opportunities in the context of a lower leverage model Weigh the merits of investment opportunities against the cost and availability of capital Coronados - Newport Beach, CA 10 |
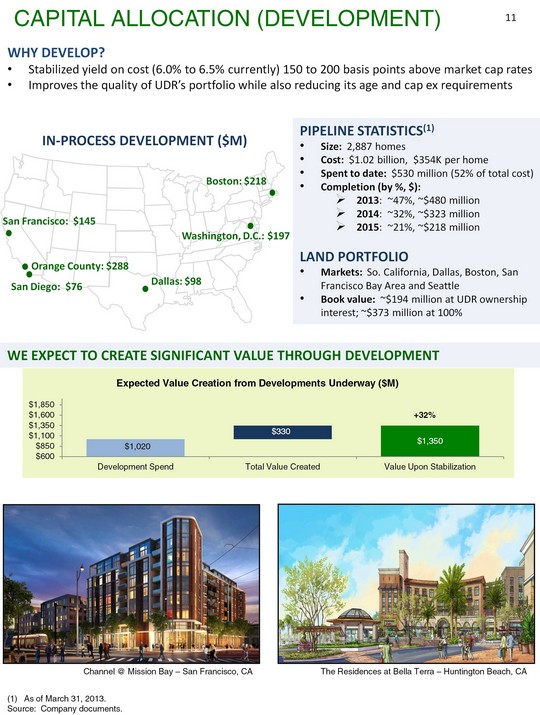
| As of March 31, 2013. Source: Company documents. (CHART) Pipeline statistics(1) Size: 2,887 homes Cost: $1.02 billion, $354K per home Spent to date: $530 million (52% of total cost) Completion (by %, $): 2013: ~47%, ~$480 million 2014: ~32%, ~$323 million 2015: ~21%, ~$218 million Land portfolio Markets: So. California, Dallas, Boston, San Francisco Bay Area and Seattle Book value: ~$194 million at UDR ownership interest; ~$373 million at 100% Capital Allocation (Development) 11 We expect to create significant value through development In-process development ($M) Boston: $218 Why develop? Stabilized yield on cost (6.0% to 6.5% currently) 150 to 200 basis points above market cap rates Improves the quality of UDR's portfolio while also reducing its age and cap ex requirements Channel @ Mission Bay - San Francisco, CA The Residences at Bella Terra - Huntington Beach, CA +32% |
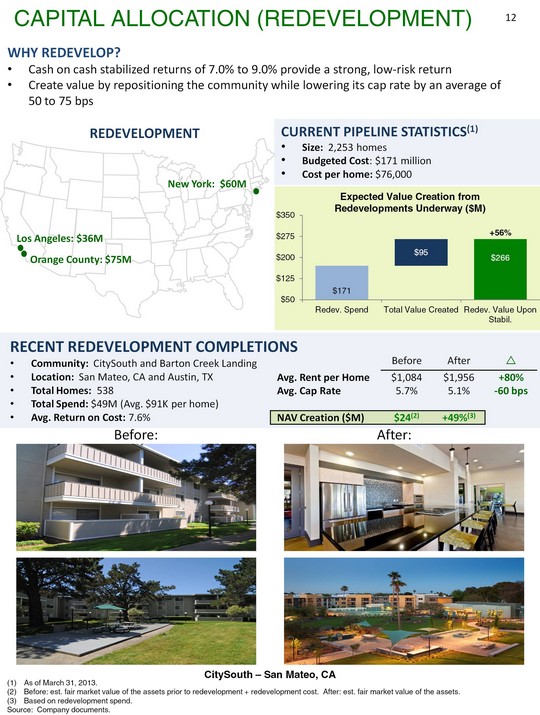
| As of March 31, 2013. Before: est. fair market value of the assets prior to redevelopment + redevelopment cost. After: est. fair market value of the assets. Based on redevelopment spend. Source: Company documents. (CHART) Capital Allocation (redevelopment) 12 Current Pipeline statistics(1) Size: 2,253 homes Budgeted Cost: $171 million Cost per home: $76,000 Redevelopment New York: $60M Los Angeles: $36M Orange County: $75M Why redevelop? Cash on cash stabilized returns of 7.0% to 9.0% provide a strong, low-risk return Create value by repositioning the community while lowering its cap rate by an average of 50 to 75 bps After: Before: Recent Redevelopment Completions Community: CitySouth and Barton Creek Landing Location: San Mateo, CA and Austin, TX Total Homes: 538 Total Spend: $49M (Avg. $91K per home) Avg. Return on Cost: 7.6% +56% Before After ? Avg. Rent per Home $1,084 $1,956 +80% Avg. Cap Rate 5.7% 5.1% -60 bps NAV Creation ($M) $24(2) +49%(3) CitySouth - San Mateo, CA |
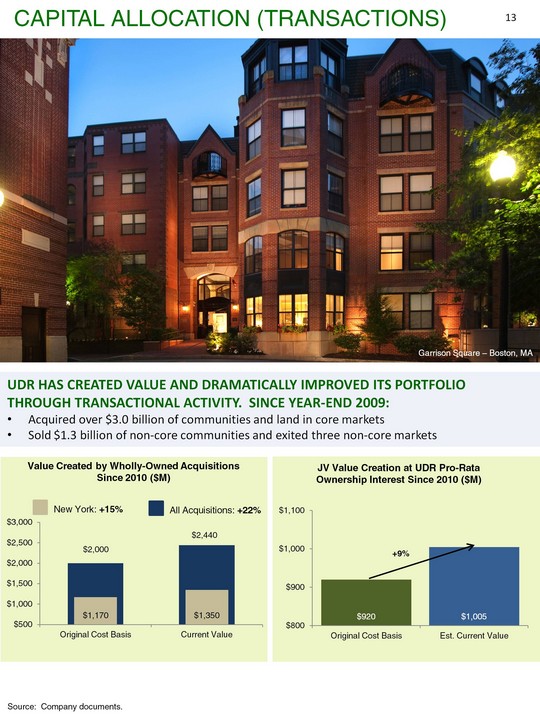
| Source: Company documents. Capital Allocation (Transactions) 13 UDR has created value and dramatically improved its portfolio through transactional activity. Since year-end 2009: Acquired over $3.0 billion of communities and land in core markets Sold $1.3 billion of non-core communities and exited three non-core markets Garrison Square - Boston, MA (CHART) New York: +15% All Acquisitions: +22% $2,000 $2,440 (CHART) +9% Value Created by Wholly-Owned Acquisitions Since 2010 ($M) |
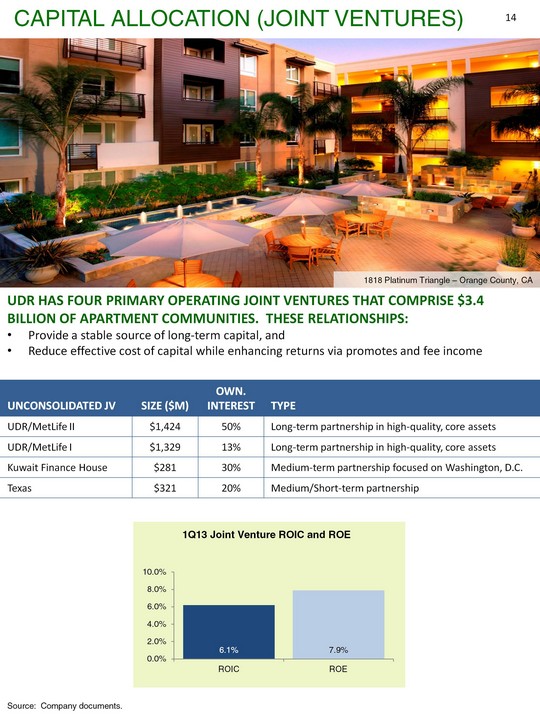
| (CHART) Source: Company documents. Columbus Square - New York, NY UNCONSOLIDATED JV SIZE ($M) OWN. INTEREST TYPE UDR/MetLife II $1,424 50% Long-term partnership in high-quality, core assets UDR/MetLife I $1,329 13% Long-term partnership in high-quality, core assets Kuwait Finance House $281 30% Medium-term partnership focused on Washington, D.C. Texas $321 20% Medium/Short-term partnership UDR has four primary operating joint ventures that comprise $3.4 billion of apartment communities. These relationships: Provide a stable source of long-term capital, and Reduce effective cost of capital while enhancing returns via promotes and fee income Capital Allocation (Joint Ventures) 14 1818 Platinum Triangle - Orange County, CA |
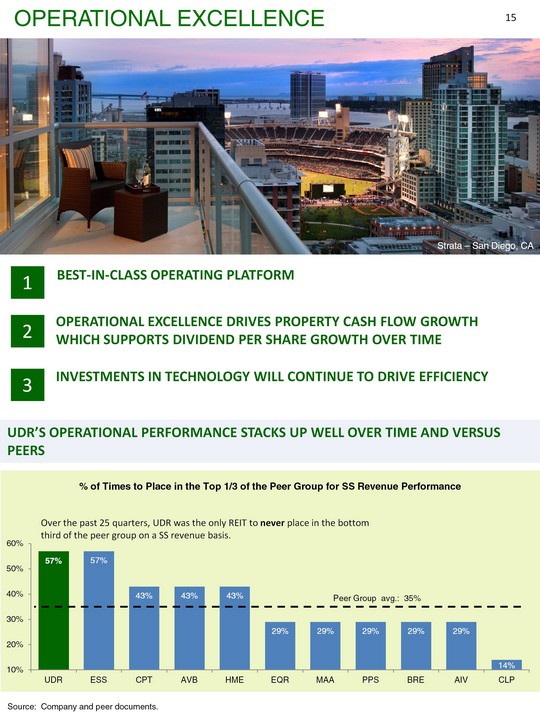
| Operational excellence drives property cash flow growth which supports dividend per share growth over time Investments in technology will continue to drive efficiency Best-in-class operating platform Operational Excellence 15 UDR's operational performance stacks up well over time and versus peers Source: Company and peer documents. Strata - San Diego, CA (CHART) Peer Group avg.: 35% |
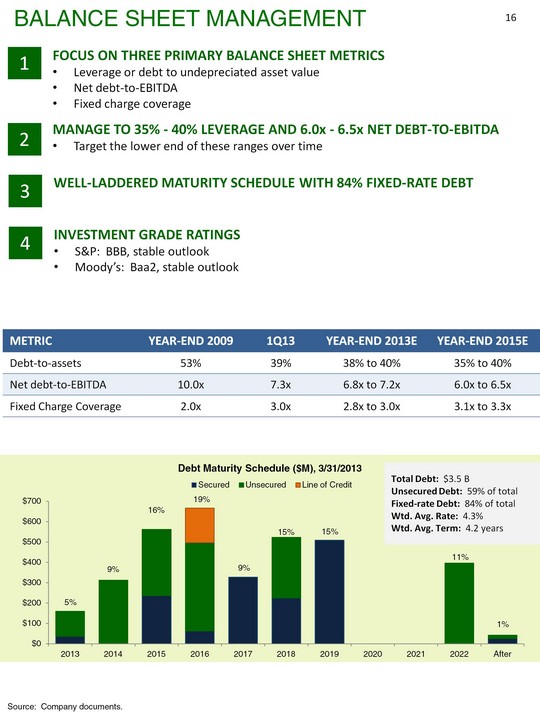
| METRIC YEAR-END 2009 1Q13 YEAR-END 2013E YEAR-END 2015E Debt-to-assets 53% 39% 38% to 40% 35% to 40% Net debt-to-EBITDA 10.0x 7.3x 6.8x to 7.2x 6.0x to 6.5x Fixed Charge Coverage 2.0x 3.0x 2.8x to 3.0x 3.1x to 3.3x Balance sheet management 16 3 Well-Laddered Maturity Schedule with 84% fixed-rate debt 4 Investment Grade Ratings S&P: BBB, stable outlook Moody's: Baa2, stable outlook (CHART) 5% 9% 16% 19% 9% 15% 15% 11% 1% Source: Company documents. |
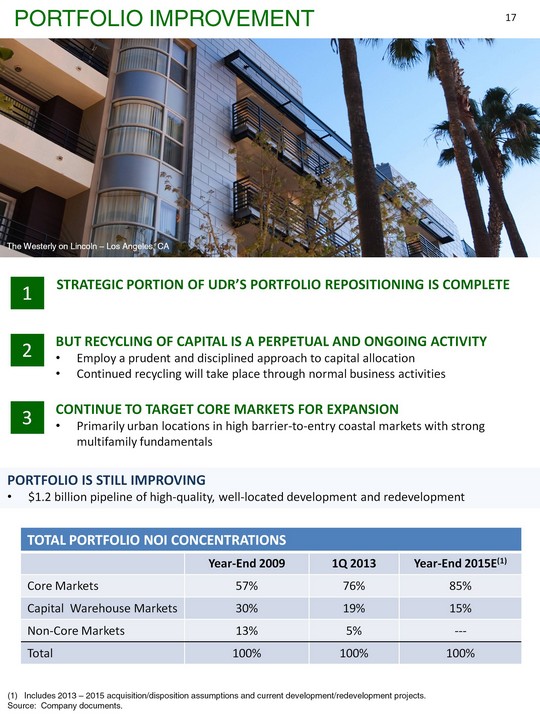
| The Westerly on Lincoln - Los Angeles, CA Portfolio is Still Improving $1.2 billion pipeline of high-quality, well-located development and redevelopment But recycling of capital is a Perpetual and ongoing activity Employ a prudent and disciplined approach to capital allocation Continued recycling will take place through normal business activities Continue to target core markets for expansion Primarily urban locations in high barrier-to-entry coastal markets with strong multifamily fundamentals Strategic portion of UDR's portfolio repositioning is complete Portfolio improvement 17 TOTAL PORTFOLIO NOI CONCENTRATIONS TOTAL PORTFOLIO NOI CONCENTRATIONS TOTAL PORTFOLIO NOI CONCENTRATIONS TOTAL PORTFOLIO NOI CONCENTRATIONS Year-End 2009 1Q 2013 Year-End 2015E(1) Core Markets 57% 76% 85% Capital Warehouse Markets 30% 19% 15% Non-Core Markets 13% 5% --- Total 100% 100% 100% Includes 2013 - 2015 acquisition/disposition assumptions and current development/redevelopment projects. Source: Company documents. |
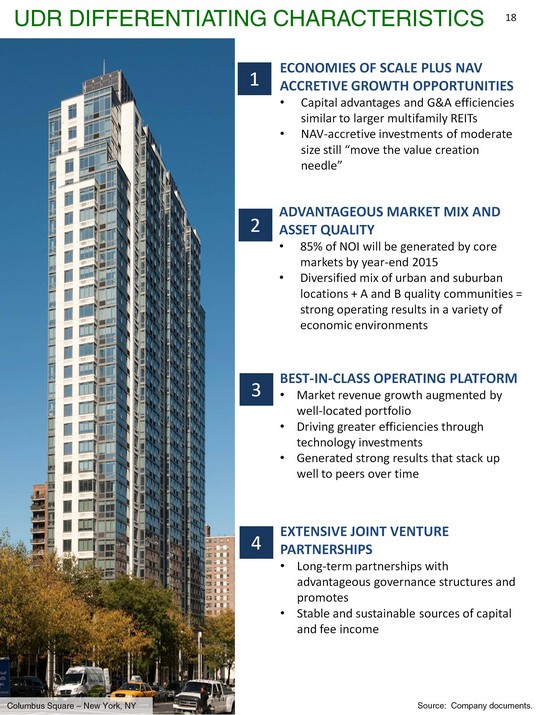
| 1 2 3 4 ECONOMIES OF SCALE plus NAV ACCRETIVE GROWTH OPPORTUNITIES Capital advantages and G&A efficiencies similar to larger multifamily REITs NAV-accretive investments of moderate size still "move the value creation needle" Advantageous market mix and asset quality 85% of NOI will be generated by core markets by year-end 2015 Diversified mix of urban and suburban locations + A and B quality communities = strong operating results in a variety of economic environments Best-in-class operating platform Market revenue growth augmented by well-located portfolio Driving greater efficiencies through technology investments Generated strong results that stack up well to peers over time Extensive Joint Venture partnerships Long-term partnerships with advantageous governance structures and promotes Stable and sustainable sources of capital and fee income UDR differentiating characteristics 18 Source: Company documents. Columbus Square - New York, NY |
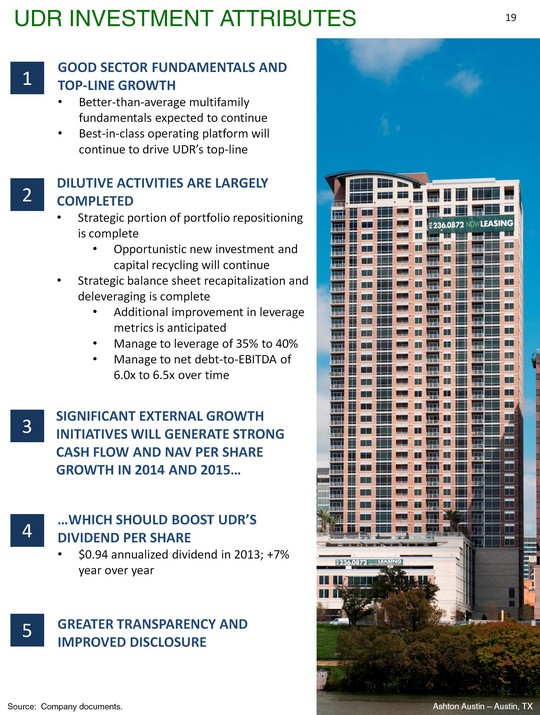
| 1 good sector Fundamentals and Top-line growth Better-than-average multifamily fundamentals expected to continue Best-in-class operating platform will continue to drive UDR's top-line Dilutive activities are largely completed Strategic portion of portfolio repositioning is complete Opportunistic new investment and capital recycling will continue Strategic balance sheet recapitalization and deleveraging is complete Additional improvement in leverage metrics is anticipated Manage to leverage of 35% to 40% Manage to net debt-to-EBITDA of 6.0x to 6.5x over time Significant external growth initiatives will generate strong cash flow and NAV per share Growth in 2014 and 2015... ...which should boost UDR's dividend per share $0.94 annualized dividend in 2013; +7% year over year Greater transparency and improved disclosure 2 3 4 5 UDR Investment attributes 19 Source: Company documents. Ashton Austin - Austin, TX |

| Ashton Westwood - Los Angeles, CA UDR, Inc. Appendix UDR, Inc. Appendix PAGE 2013 Earnings Guidance 21 2013 Market Growth Expectations 22 Definitions and Reconciliations 23 20 |
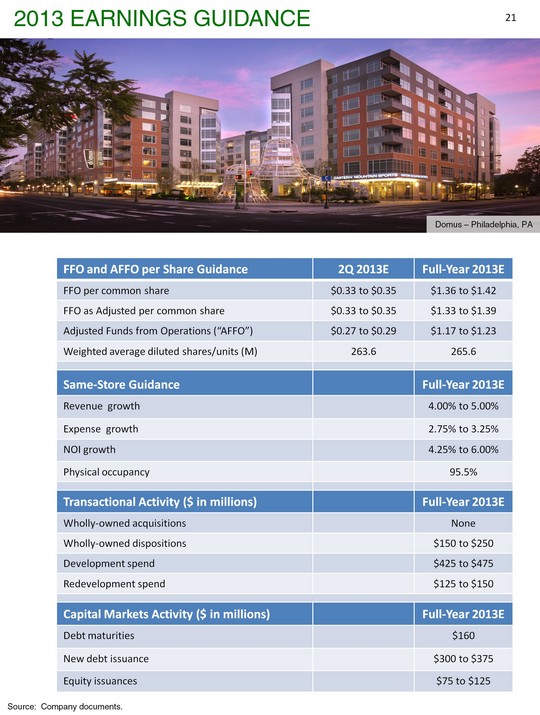
| 2013 Earnings Guidance 21 FFO and AFFO per Share Guidance 2Q 2013E Full-Year 2013E FFO per common share $0.33 to $0.35 $1.36 to $1.42 FFO as Adjusted per common share $0.33 to $0.35 $1.33 to $1.39 Adjusted Funds from Operations ("AFFO") $0.27 to $0.29 $1.17 to $1.23 Weighted average diluted shares/units (M) 263.6 265.6 Same-Store Guidance Full-Year 2013E Revenue growth 4.00% to 5.00% Expense growth 2.75% to 3.25% NOI growth 4.25% to 6.00% Physical occupancy 95.5% Transactional Activity ($ in millions) Full-Year 2013E Wholly-owned acquisitions None Wholly-owned dispositions $150 to $250 Development spend $425 to $475 Redevelopment spend $125 to $150 Capital Markets Activity ($ in millions) Full-Year 2013E Debt maturities $160 New debt issuance $300 to $375 Equity issuances $75 to $125 Source: Company documents. Domus - Philadelphia, PA |
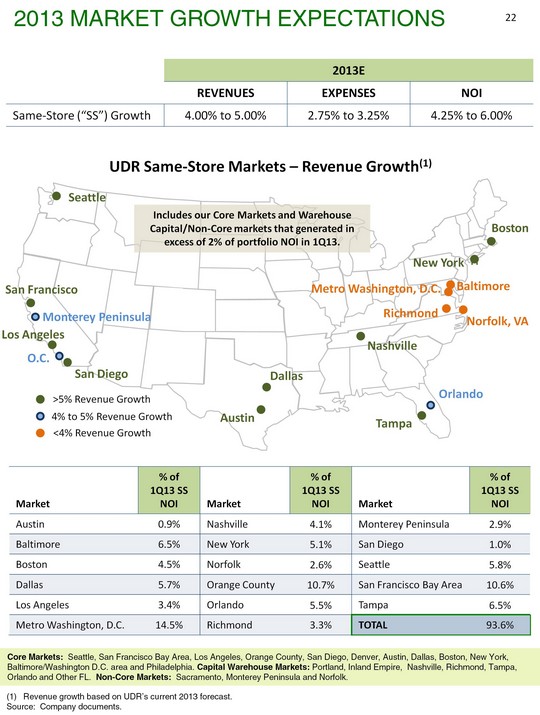
| 2013E 2013E 2013E REVENUES EXPENSES NOI Same-Store ("SS") Growth 4.00% to 5.00% 2.75% to 3.25% 4.25% to 6.00% Revenue growth based on UDR's current 2013 forecast. Source: Company documents. Core Markets: Seattle, San Francisco Bay Area, Los Angeles, Orange County, San Diego, Denver, Austin, Dallas, Boston, New York, Baltimore/Washington D.C. area and Philadelphia. Capital Warehouse Markets: Portland, Inland Empire, Nashville, Richmond, Tampa, Orlando and Other FL. Non-Core Markets: Sacramento, Monterey Peninsula and Norfolk. Includes our Core Markets and Warehouse Capital/Non-Core markets that generated in excess of 2% of portfolio NOI in 1Q13. 2013 Market Growth Expectations 22 Market % of 1Q13 SS NOI Market % of 1Q13 SS NOI Market % of 1Q13 SS NOI Austin 0.9% Nashville 4.1% Monterey Peninsula 2.9% Baltimore 6.5% New York 5.1% San Diego 1.0% Boston 4.5% Norfolk 2.6% Seattle 5.8% Dallas 5.7% Orange County 10.7% San Francisco Bay Area 10.6% Los Angeles 3.4% Orlando 5.5% Tampa 6.5% Metro Washington, D.C. 14.5% Richmond 3.3% TOTAL 93.6% |
| Please see the Company's most recent Earnings Supplement, available at www.udr.com, for a full list of definitions, reconciliations and details on the financial position and operating results of the Company. Adjusted Funds From Operations ("AFFO"): The Company defines AFFO as FFO As Adjusted less recurring capital expenditures. See page 27 for a reconciliation of AFFO. Management considers AFFO a useful metric for investors as it is more indicative of the Company's recurring operational cash flow than FFO As Adjusted. A reconciliation between FFO As Adjusted and AFFO is provided with this presentation. Current Value Net Income: Current value net income ("CVNI") is defined as the sum of common dividends paid by a company plus changes in NAV per share over time and was developed by Green Street Advisors. CVNI is calculated similarly to total returns, but it is designed to measure theoretical NAV growth if dividends are reinvested in the company when paid at coincident NAV per share (rather than investment growth). Additional information on CVNI growth is available in "Green Street's NAV-based Pricing Model" report published on October 3, 2005. This report is available at www.greenst.com. Management considers CVNI a useful metric for investors as it is highly correlated to Total Shareholder Returns over long periods of time and it is an indicator of portfolio value creation irrespective of dividend payout versus cash flow reinvestment policies. Earnings Accretion/Dilution/Drag from Development and Redevelopment: Earnings Accretion/Dilution/Drag from Development and Redevelopment is defined as the realized or expected positive (accretion) or negative (dilution/drag) effect on the Company's earnings from its underway development and redevelopment programs. Management considers earnings accretion/dilution/drag a useful metric for investors as it quantifies timing differences in the Company's earnings that result from its investment activities. Funds From Operations ("FFO"): The Company defines FFO as net income (computed in accordance with GAAP) excluding the impact of impairment write-downs of depreciable real estate or of investments in non-consolidated investees that are driven by measurable decreases in the fair value of depreciable real estate held by the investee, gains (or losses) from sales of depreciable property, plus real estate depreciation and amortization, and after adjustments for unconsolidated partnerships and joint ventures. This definition conforms with the National Association of Real Estate Investment Trust's definition issued in April 2002. See page 27 for a reconciliation of FFO. Management considers FFO a useful metric for investors as the Company uses FFO in evaluating property acquisitions and its operating performance and believes that FFO should be considered along with, but not as an alternative to, net income and cash flows as a measure of the Company's activities in accordance with generally accepted accounting principles and is not necessarily indicative of cash available to fund cash needs. A reconciliation between Net Income and FFO is provided with this presentation. Funds From Operations as Adjusted: The Company defines FFO as Adjusted as FFO excluding the impact of acquisition-related costs and other non-recurring items including, but not limited to, prepayment costs/benefits associated with early debt retirement, gains on sales of marketable securities and taxable REIT subsidiary property, storm-related expenses, severance costs and legal costs. See page 27 for a reconciliation of Funds From Operations as Adjusted. Management considers FFO As Adjusted a useful metric for investors as it is more indicative of the Company's recurring operational FFO than FFO. FFO As Adjusted excludes non-recurring items which, if included, result in less comparability between companies and across time periods. A reconciliation from FFO to FFO As Adjusted is provided with this presentation. Net Asset Value: Net Asset Value ("NAV") is defined as marked-to-market value of assets less marked-to-market value of liabilities and preferred equity, divided by total outstanding diluted shares and operating units. Management considers NAV a useful metric for investors as it provides context to portfolio value changes over time based on widely accepted market inputs. Definitions and reconciliations 23 |
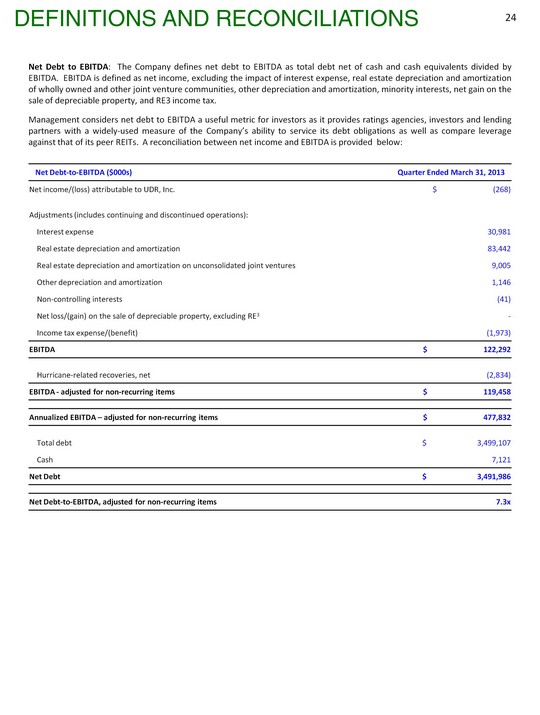
| Net Debt to EBITDA: The Company defines net debt to EBITDA as total debt net of cash and cash equivalents divided by EBITDA. EBITDA is defined as net income, excluding the impact of interest expense, real estate depreciation and amortization of wholly owned and other joint venture communities, other depreciation and amortization, minority interests, net gain on the sale of depreciable property, and RE3 income tax. Management considers net debt to EBITDA a useful metric for investors as it provides ratings agencies, investors and lending partners with a widely-used measure of the Company's ability to service its debt obligations as well as compare leverage against that of its peer REITs. A reconciliation between net income and EBITDA is provided below: Net Debt-to-EBITDA ($000s) Quarter Ended March 31, 2013 Net income/(loss) attributable to UDR, Inc. $ (268) Adjustments (includes continuing and discontinued operations): Interest expense 30,981 Real estate depreciation and amortization 83,442 Real estate depreciation and amortization on unconsolidated joint ventures 9,005 Other depreciation and amortization 1,146 Non-controlling interests (41) Net loss/(gain) on the sale of depreciable property, excluding RE3 - Income tax expense/(benefit) (1,973) EBITDA $ 122,292 Hurricane-related recoveries, net (2,834) EBITDA - adjusted for non-recurring items $ 119,458 Annualized EBITDA - adjusted for non-recurring items $ 477,832 Total debt $ 3,499,107 Cash 7,121 Net Debt $ 3,491,986 Net Debt-to-EBITDA, adjusted for non-recurring items 7.3x Definitions and reconciliations 24 |
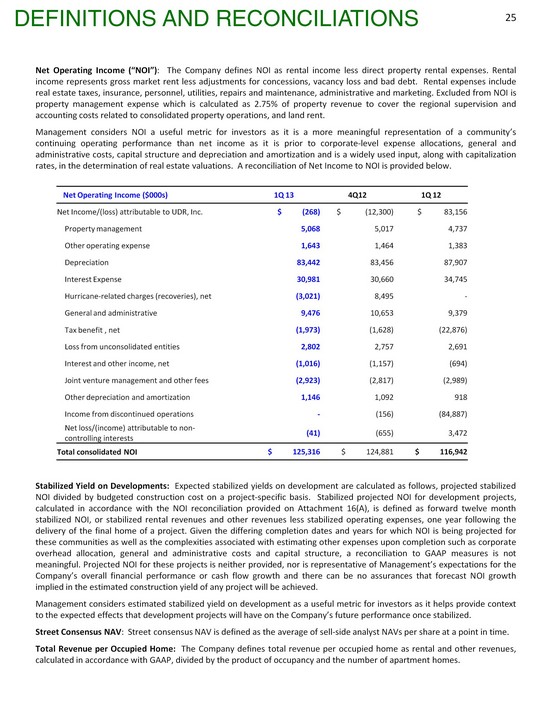
| Net Operating Income ("NOI"): The Company defines NOI as rental income less direct property rental expenses. Rental income represents gross market rent less adjustments for concessions, vacancy loss and bad debt. Rental expenses include real estate taxes, insurance, personnel, utilities, repairs and maintenance, administrative and marketing. Excluded from NOI is property management expense which is calculated as 2.75% of property revenue to cover the regional supervision and accounting costs related to consolidated property operations, and land rent. Management considers NOI a useful metric for investors as it is a more meaningful representation of a community's continuing operating performance than net income as it is prior to corporate-level expense allocations, general and administrative costs, capital structure and depreciation and amortization and is a widely used input, along with capitalization rates, in the determination of real estate valuations. A reconciliation of Net Income to NOI is provided below. Stabilized Yield on Developments: Expected stabilized yields on development are calculated as follows, projected stabilized NOI divided by budgeted construction cost on a project-specific basis. Stabilized projected NOI for development projects, calculated in accordance with the NOI reconciliation provided on Attachment 16(A), is defined as forward twelve month stabilized NOI, or stabilized rental revenues and other revenues less stabilized operating expenses, one year following the delivery of the final home of a project. Given the differing completion dates and years for which NOI is being projected for these communities as well as the complexities associated with estimating other expenses upon completion such as corporate overhead allocation, general and administrative costs and capital structure, a reconciliation to GAAP measures is not meaningful. Projected NOI for these projects is neither provided, nor is representative of Management's expectations for the Company's overall financial performance or cash flow growth and there can be no assurances that forecast NOI growth implied in the estimated construction yield of any project will be achieved. Management considers estimated stabilized yield on development as a useful metric for investors as it helps provide context to the expected effects that development projects will have on the Company's future performance once stabilized. Street Consensus NAV: Street consensus NAV is defined as the average of sell-side analyst NAVs per share at a point in time. Total Revenue per Occupied Home: The Company defines total revenue per occupied home as rental and other revenues, calculated in accordance with GAAP, divided by the product of occupancy and the number of apartment homes. Net Operating Income ($000s) 1Q 13 4Q12 1Q 12 Net Income/(loss) attributable to UDR, Inc. $ (268) $ (12,300) $ 83,156 Property management 5,068 5,017 4,737 Other operating expense 1,643 1,464 1,383 Depreciation 83,442 83,456 87,907 Interest Expense 30,981 30,660 34,745 Hurricane-related charges (recoveries), net (3,021) 8,495 - General and administrative 9,476 10,653 9,379 Tax benefit , net (1,973) (1,628) (22,876) Loss from unconsolidated entities 2,802 2,757 2,691 Interest and other income, net (1,016) (1,157) (694) Joint venture management and other fees (2,923) (2,817) (2,989) Other depreciation and amortization 1,146 1,092 918 Income from discontinued operations - (156) (84,887) Net loss/(income) attributable to non-controlling interests (41) (655) 3,472 Total consolidated NOI $ 125,316 $ 124,881 $ 116,942 Definitions and reconciliations 25 |
| Value Creation: Value creation is defined as UDR Management's best estimate of current or expected value of a community that is above and beyond its original purchase price or cost basis and could theoretically be realized upon monetization of that community. Underlying valuation estimates and model inputs are provided by UDR Management. Estimated value creation is not representative of Management's expectations for the Company's overall financial performance or cash flow growth and there can be no assurances that the value creation implied for any of the Company's communities will be achieved. Management considers value creation a useful metric for investors as it quantifies how successful the Company's past investments have been and current investments are expected to be. Unlevered Asset Value: Unlevered Asset Value ("UAV") is defined as marked-to-market value of assets divided by total outstanding diluted shares and operating units. Management considers UAV a useful metric for investors as it provides context to portfolio value changes over time based on widely accepted market inputs and irrespective of capital structure. YTD Same-store ("SS") Communities: The Company defines SS Communities as those communities stabilized for nine consecutive quarters. These communities were owned and had stabilized occupancy and operating expenses as of the beginning of the prior year, there is no plan to conduct substantial redevelopment activities, and the community is not held for disposition within the current year. Definitions and reconciliations 26 |

| FFO/AFFO Reconciliation ($000s except per share amounts) Quarter Ended March 31, 2013 Net (loss)/income attributable to UDR, Inc. $ (268) Distributions to preferred stockholders (931) Real estate depreciation and amortization, including discontinued operations 83,442 Non-controlling interest (41) Real estate depreciation and amortization on unconsolidated joint ventures 9,005 Funds from operations ("FFO") - basic $ 91,207 Distribution to preferred stockholders - Series E (Convertible) 931 FFO, diluted $ 92,138 FFO per common share, basic $ 0.35 FFO per common share, diluted $ 0.35 Weighted average number of common shares and OP Units outstanding - basic 259,298 Weighted average number of common shares, OP Units, and common stock equivalents outstanding - diluted 263,626 Impact of adjustments to FFO: Hurricane-related recoveries, net $ (2,834) FFO as Adjusted, diluted $ 89,304 FFO as Adjusted per common share, diluted $ 0.34 Recurring capital expenditures (6,762) AFFO $ 82,542 AFFO per common share, diluted $ 0.31 Definitions and reconciliations 27 |
| Certain statements made in this presentation may constitute "forward-looking statements." Words such as "expects," "intends," "believes," "anticipates," "plans," "likely," "will," "seeks," "estimates" and variations of such words and similar expressions are intended to identify such forward-looking statements. Forward-looking statements, by their nature, involve estimates, projections, goals, forecasts and assumptions and are subject to risks and uncertainties that could cause actual results or outcomes to differ materially from those expressed in a forward-looking statement, due to a number of factors, which include, but are not limited to, unfavorable changes in the apartment market, changing economic conditions, the impact of inflation/deflation on rental rates and property operating expenses, expectations concerning availability of capital and the stabilization of the capital markets, the impact of competition and competitive pricing, acquisitions, developments and redevelopments not achieving anticipated results, delays in completing developments, redevelopments and lease-ups on schedule, expectations on job growth, home affordability and demand/supply ratio for multifamily housing, expectations concerning development and redevelopment activities, expectations on occupancy levels, expectations concerning the Vitruvian Park(r) development, expectations concerning the joint ventures with third parties, expectations that automation will help grow net operating income, expectations on annualized net operating income and other risk factors discussed in documents filed by the Company with the Securities and Exchange Commission from time to time, including the Company's Annual Report on Form 10-K and the Company's Quarterly Reports on Form 10-Q. Actual results may differ materially from those described in the forward-looking statements. These forward-looking statements and such risks, uncertainties and other factors speak only as of the date of this presentation, and the Company expressly disclaims any obligation or undertaking to update or revise any forward-looking statement contained herein, to reflect any change in the Company's expectations with regard thereto, or any other change in events, conditions or circumstances on which any such statement is based, except to the extent otherwise required under the U.S. securities laws. This presentation and these forward-looking statements include UDR's analysis and conclusions and reflect UDR's judgment as of the date of these materials. UDR assumes no obligation to revise or update to reflect future events or circumstances. * Green Street Advisors ("GSA") is an independent research, trading and consulting firm. By referencing reports included on GSA's website, UDR does not intend to incorporate any of the information included on that website into this presentation, or to otherwise adopt or endorse any analysis, statements or communications made by GSA on its website or elsewhere. Forward Looking Statements 28 |

| Notes 29 |

| Notes 30 |

| Notes 31 |
| Investor Relations Contact: Chris Van Ens cvanens@udr.com 720.348.7762 |