Attached files
| file | filename |
|---|---|
| 8-K - FORM 8-K - CHOICE HOTELS INTERNATIONAL INC /DE | d547909d8k.htm |
 Investor Presentation
June 2013
Exhibit 99.1 |
 2
Investor Presentation
Disclaimer
Certain matters discussed throughout all of this presentation constitute
forward-looking statements within the meaning of the Private Securities
Litigation Reform Act of 1995. Generally, our use of words such as
“expect,” “estimate,”
“believe,”
“anticipate,”
"should,“
“will,”
“forecast,”
“plan,”
project,”
“assume”
or similar words of futurity
identify such forward-looking statements. These forward-looking statements
are based on management's current beliefs, assumption and expectations
regarding future events, which in turn are based on information currently
available to management. Such statements may relate to projections of the
company’s revenue, earnings and other financial and operational
measures, company debt levels, ability to repay outstanding indebtedness,
payment of dividends, and future operations, among other matters. We caution
you not to place undue reliance on any such forward-looking statements.
Forward-looking statements do not guarantee future performance and involve known
and unknown risks, uncertainties and other factors.
Several factors could cause actual results, performance or achievements of the
company to differ materially from those expressed in or contemplated by the
forward-looking statements. Such risks include, but are not limited to,
changes to general, domestic and foreign economic conditions; operating risks
common in the lodging and franchising industries; changes to the
desirability of our brands as viewed by hotel operators and customers;
changes to the terms or termination of our contracts with franchisees; our ability
to keep pace with improvements in technology utilized for reservations
systems and other operating systems; fluctuations in the supply and demand
for hotels rooms; the outcome of litigation; and our ability to effectively
manage our indebtedness. These and other risk factors are discussed in
detail in the Risk Factors section of the company’s Form 10-K for the year ended
December 31, 2012, filed with the Securities and Exchange Commission on February
28, 2013. We undertake no obligation to publicly update or revise any
forward-looking statement, whether as a result of new information, future
events or otherwise, except as required by law. |
 3
Investor Presentation
Company overview |
 4
Investor Presentation
Choice Hotels overview
Growing US hotel market share
–
9.7% share of branded US hotels (+60 basis points over
trailing 5 years)*
–
2 largest U.S. hotelier*
Well-known, diversified brands
Global pipeline of 476 hotels
Stable, profitable, long-term growth throughout economic cycles
Cumulative free cash flows of ~$1.5 billion since 1997
–
$2.1 billion returned to shareholders through share
repurchases and quarterly and special cash dividends
Capital “light”
model generates strong after-tax returns on invested
capital
Strong, growing, global hotel franchising
business
Highly attractive business model with strong
financial returns
Chain scale mix by rooms (Domestic Q1 2013)
Geographic property distribution by rooms (Q1 2013)
Source: Choice Internal Data as of March 31, 2013
* Based on number of hotels as March 31, 2013 (Smith Travel Research)
nd |
 5
Investor Presentation
Diversified global footprint*
Source: Choice internal data
*As of March 31, 2013. The Company includes its Caribbean properties within
domestic operating statistics. |
 6
Investor Presentation
Investor Presentation
Portfolio overview
Brand
Number of properties
Number of rooms
Occupancy (%)
Average daily room rate
(ADR)
RevPAR
Upscale
63
5,481
65.2%
$115.20
$75.09
19
2,221
NA
NA
NA
Upper
Midscale
1,332
104,159
59.7%
81.99
48.95
597
46,079
62.2%
85.88
53.43
190
27,268
50.1%
75.06
37.57
Midscale
382
27,685
57.0%
72.91
41.57
1,172
99,090
51.8%
69.51
36.00
Extended Stay
41
3,165
69.1%
70.22
48.52
63
7,241
70.0%
41.99
29.38
Economy
811
49,244
48.5%
56.05
27.19
421
24,269
50.9%
53.45
27.18
Total / Average
5,091
395,902
55.8%
$73.89
$41.19
International
1,173
104,474
Total
6,264
500,376
Note: Number of properties and rooms are as of March 31, 2013; Operating
statistics are for the trailing twelve months ended March 31, 2013. Source:
Company’s public filings, management data |
 7
Investor Presentation
Investor Presentation
Franchise portfolio growth
Worldwide hotels*
Domestic pipeline*
Worldwide unit growth has increased at a CAGR of
2.2% over the last 5 years
Executed a total of 492 new domestic hotel
franchise contracts during the trailing twelve
months ended March 31, 2013, a 45% increase
over the prior year
Current domestic pipeline consists of 395 hotels
representing 30,984 rooms
232 hotels under construction or awaiting
development
163 hotels awaiting conversion
* As of March 31, 2013
Source: Company’s public filings |
 8
Investor Presentation
Investor Presentation
Strategy for Choice’s brands, growth and shareholders
Improve and Grow Brands
–
Increase portfolio profitability of the Comfort brand family
–
Refresh Sleep Inn to improve long-term brand growth potential
–
Invest
in
and
expand
emerging
brands/segments
–
Cambria,
Ascend,
International
Capture Greater Share of Reservations Via Central Channels
–
Grow
Choice
Privileges
loyalty
program
–
target
2.0
million
new
members
in
2013
–
Continue to enhance ChoiceHotels.com to increase traffic and conversion
Allocate Free Cash Flows To “Best And Highest”
Use
–
Continue effective long-term capital allocation practices by optimizing
balance sheet leverage, share repurchase and dividend policy
–
Leverage financial capacity/strength to support expansion of emerging brands
–
Evaluate opportunities to enter new segments that leverage core competencies (i.e.
Sky Touch) –
Invest in IT infrastructure to shore up value proposition for international
properties |
 9
Investor Presentation
Investment highlights |
 10
Investor Presentation
Investor Presentation
Investment highlights |
 11
Investor Presentation
Investor Presentation
Established hotel franchising platform with global
scale
One of the largest hoteliers…
…
with a significant number of rooms in the portfolio
Source:
Various
public
companies’
filings
as
of
March
31,
2013,
except
for
Hilton,
Accor
and
Carlson
which
are
as
of
December
31,
2012. |
 12
Investor Presentation
Resilient fee-for-service business model with stable
cash flows
Source: Smith Travel Research, Management data, December 2012
|
 13
Investor Presentation
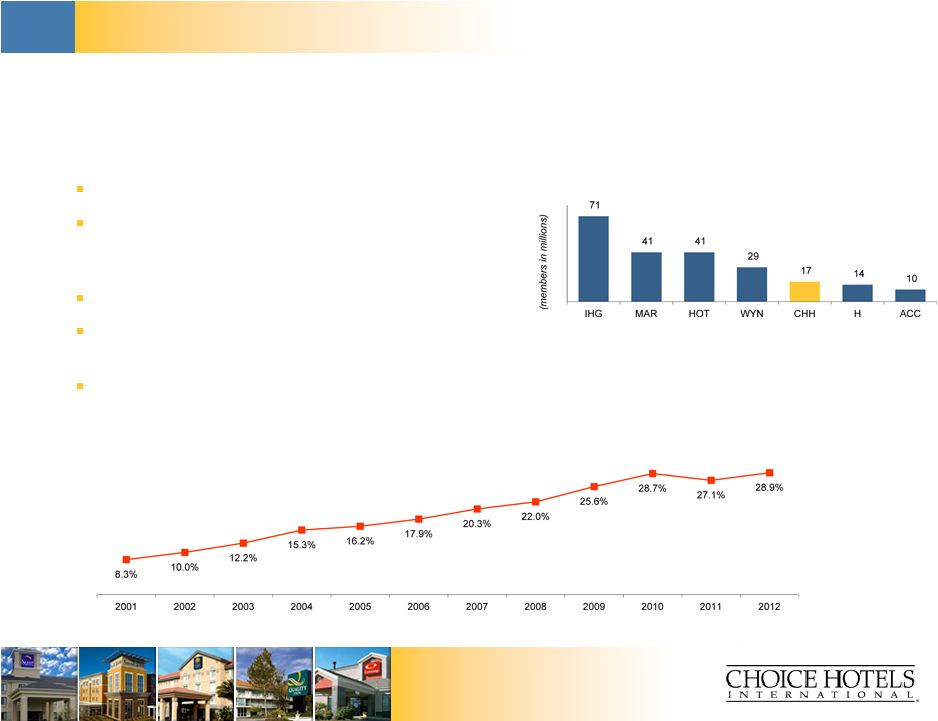
Strong, growing loyalty program
Choice Privileges revenue as percent
of domestic gross room revenues*
Source: Management Data, December 31, 2012, Company’s public filings
* 2001-2008 Data Excludes Econo Lodge and Rodeway Inn brands
Comprehensive loyalty rewards program
16.5 million members worldwide –
contribute over ¼
of domestic
gross room revenues
2.4 million new members added in 2012
Delivers incremental business to all Choice
brand hotels
Important selling point for franchise sales
Loyalty program |
 14
Investor Presentation
Investor Presentation
Effective marketing and central reservation system
Consists of the telephone reservation system,
proprietary internet site, mobile phone applications,
global distribution systems and other internet
reservation sites
Central Reservation System (“CRS”) provides a data
link to the Company’s franchised properties and to
airline reservation systems
Offers rooms for sale on the Company’s own internet
site, as well as other travel companies
Expertise and innovation in on-line, targeted interactive
marketing to influence guest hotel stay decisions
Powerful advertising campaigns
Focus on driving guests to Choice central channels
Facilitate “one-stop”
shopping
Reservation agents can match each caller with a
Choice-branded hotel
$300-plus million in annual marketing and reservation
spending
Description
Size, scale and distribution
Domestic franchise system
gross room revenue source
Domestic Choice CRS
net room revenue
Source: Company’s public filings as of December 31, 2012, Management
data |
 15
Investor Presentation
Investor Presentation
Strong pipeline expected to continue to grow as the
global economy improves
Historical international pipeline
Source: Company’s public filings, Management data as of December 31,
2012 Historical domestic pipeline |
 16
Investor Presentation
Investor Presentation
Asset light franchising model with strong returns on
investment
Capital light model generates strong after-tax returns on invested capital
Virtually 100% of the properties are franchised*
* The Company owns a limited number of hotels that it holds for strategic purposes.
Source: Company’s public filings, Management data as of December 31, 2012 |
 17
Investor Presentation
Strong and growing brand awareness
Source: Percentage of survey respondents. Millward Brown, December 2012.
* Econo Lodge, Rodeway Inn and Suburban Extended Stay measured among economy hotel
users. |
 18
Investor Presentation
Financial overview |
 19
Investor Presentation
Investor Presentation
Choice’s franchise business model provides stable, growing cash flows, driven
primarily through unit expansion, RevPAR growth and effective royalty rate
growth Recent performance
LTM Revenue
LTM Adjusted EBITDA
Choice has experienced consistent revenue growth
over the past eight quarters
Revenues have increased by 14% since Q1 2011
EBITDA margins have increased by 210 bps since
Q1 2011
Domestic and international unit growth and
improvement in operating performance continues
to drive profitability
($ in millions)
Source: Company’s public filings |
 20
Investor Presentation
Investor Presentation
Historical operating metrics
RevPAR & occupancy
Total worldwide rooms
Source: Company’s public filings |
 21
Investor Presentation
Investor Presentation
Historical financial overview
Revenue*
Adjusted EBITDA
*Excludes marketing and reservation revenues
Source: Company’s public filings
($ in millions) |
 22
Investor Presentation
Questions and answers |
 23
Investor Presentation
DISCLAIMER
Adjusted earnings before interest, taxes depreciation and amortization (EBITDA),
return on average invested capital (ROIC) and free cash flows are
non-GAAP financial measurements. These financial measurements are
presented as supplemental disclosures because they are used by management in
reviewing and analyzing the company’s performance. This information
should not be considered as an alternative to any measure of performance as
promulgated under accounting principles generally accepted in the United
States (GAAP), such as operating income, net income, diluted earnings per
share, total revenues or net cash
provided
by
operating
activities.
The
calculation
of
these
non-GAAP
measures may be different from the calculation by other companies and therefore
comparability may be limited. The company has included the following
appendix which reconcile these measures to the comparable GAAP
measurement. |
 24
Investor Presentation
FRANCHISING REVENUES
Source: Choice Internal Data, December 2012
($ amounts in thousands)
Year Ended
Year Ended
Year Ended
Year Ended
Year Ended
Year Ended
Year Ended
Year Ended
December 31,
December 31,
December 31,
December 31,
December 31,
December 31,
December 31,
December 31,
2012
2011
2010
2009
2008
2007
2006
2005
Total Revenues
691,509
$
638,793
$
596,076
$
564,178
$
641,680
$
615,494
$
539,903
$
472,098
$
Adjustments:
Marketing and Reservation
(384,784)
(349,036)
(329,246)
(305,379)
(336,477)
(316,827)
(273,267)
(237,822)
Product Sales
-
-
-
-
-
-
-
-
Hotel Operations
(4,573)
(4,356)
(4,031)
(4,140)
(4,936)
(4,692)
(4,505)
(4,293)
Franchising Revenues
302,152
$
285,401
$
262,799
$
254,659
$
300,267
$
293,975
$
262,131
$
229,983
$ |
  25
Investor Presentation
FRANCHISING REVENUES (Continued)
Source: Choice Internal Data, December 2012
($ amounts in thousands)
Year Ended
Year Ended
Year Ended
Year Ended
Year Ended
Year Ended
Year Ended
December 31,
December 31,
December 31,
December 31,
December 31,
December 31,
December 31,
2004
2003
2002
2001
2000
1999
1998
Total Revenues
428,208
$
385,866
$
365,562
$
341,428
$
352,841
$
324,203
$
165,474
$
Adjustments:
Marketing and Reservation
(220,732)
(195,219)
(190,145)
(168,170)
(185,367)
(162,603)
-
Product Sales
-
-
-
-
-
(3,871)
(20,748)
Hotel Operations
(3,729)
(3,565)
(3,331)
(3,215)
(1,249)
-
(1,098)
Franchising Revenues
203,747
$
187,082
$
172,086
$
170,043
$
166,225
$
157,729
$
143,628
$ |
 26
Investor Presentation
RETURN ON INVESTED CAPITAL
(a) Operating income and tax rate for the year ended December 31, 2001 have been
adjusted to exclude the effect of a $22.7 million impairment charge related
to the write-off of the company’s investment in Friendly Hotels.
Source: Choice Internal Data, December 2012
Year Ended
Year Ended
Year Ended
Year Ended
Year Ended
Year Ended
Year Ended
December 31,
December 31,
December 31,
December 31,
December 31,
December 31,
December 31,
($ in thousands)
2012
2011
2010
2009
2008
2007
2006
Operating Income (a)
$193.1
$171.9
$160.8
$148.1
$174.6
$185.2
$166.6
Tax Rate(a)
28.7%
30.1%
32.1%
34.8%
36.3%
36.0%
27.4%
After-Tax Operating Income
137.7
120.2
109.2
96.6
111.2
118.5
121.0
+ Depreciation & Amortization
8.2
8.0
8.3
8.3
8.2
8.6
9.7
- Maintenance CAPEX
8.2
8.0
8.3
8.3
8.2
8.6
9.7
Net Op. Profit After-tax (NOPAT)
$137.7
$120.2
$109.2
$96.6
$111.2
$118.5
$121.0
Total Assets
$510.8
$447.7
$411.7
$340.0
$328.2
$328.4
$303.3
- Current Liabilities
176.1
184.6
165.3
131.8
135.1
147.5
139.8
Invested Capital
$334.7
$263.1
$246.4
$208.2
$193.1
$180.9
$163.5
Return on Average Invested Capital
46.1%
47.2%
48.0%
48.1%
59.5%
68.8%
78.5% |
  27
Investor Presentation
RETURN ON INVESTED CAPITAL (Continued)
(a) Operating income and tax rate for the year ended December 31, 2001 have been
adjusted to exclude the effect of a $22.7 million impairment charge related
to the write-off of the company’s investment in Friendly Hotels.
Source: Choice Internal Data, December 2012
Year Ended
Year Ended
Year Ended
Year Ended
Year Ended
Year Ended
Year Ended
Year Ended
December 31,
December 31,
December 31,
December 31,
December 31,
December 31,
December 31,
December 31,
($ in thousands)
2005
2004
2003
2002
2001
2000
1999
1998
Operating Income (a)
$143.8
$125.0
$113.9
$104.7
$96.3
$92.4
$94.2
$85.2
Tax Rate(a)
33.0%
35.1%
36.1%
36.5%
35.0%
39.0%
39.5%
41.7%
After-Tax Operating Income
96.3
81.1
72.8
66.5
62.6
56.4
57.0
49.7
+ Depreciation & Amortization
9.1
9.9
11.2
11.3
12.5
11.6
7.7
6.7
- Maintenance CAPEX
9.1
9.9
11.2
11.3
12.5
11.6
7.7
6.7
Net Op. Profit After-tax (NOPAT)
$96.3
$81.1
$72.8
$66.5
$62.6
$56.4
$57.0
$49.7
Total Assets
$265.3
$263.4
$267.3
$316.8
$321.2
$484.1
$464.7
$398.2
- Current Liabilities
120.3
102.1
102.2
84.3
71.2
93.8
88.7
64.7
Invested Capital
$145.0
$161.3
$165.1
$232.5
$250.0
$390.3
$375.9
$333.6
Return on Average Invested Capital
62.9%
49.7%
36.7%
27.6%
19.5%
14.7%
16.1%
15.2% |
 28
Investor Presentation
FREE CASH FLOWS
Source: Choice Internal Data, March 31, 2013
Year to Date Ended
Year Ended
Year Ended
Year Ended
Year Ended
Year Ended
Year Ended
Year Ended
Year Ended
March 31,
December 31,
December 31,
December 31,
December 31,
December 31,
December 31,
December 31,
December 31,
($ in thousands)
2013
2012
2011
2010
2009
2008
2007
2006
2005
Net Cash Provided by Operating Activities
1,874
$
161,020
$
134,844
$
144,935
$
112,216
$
104,399
$
145,666
$
153,680
$
133,588
$
Net Cash Provided (Used) by Investing Activities
(13,816)
(57,999)
(23,804)
(32,155)
(3,349)
(20,265)
(21,284)
(17,244)
(24,531)
Free Cash Flows
(11,942)
$
103,021
$
111,040
$
112,780
$
108,867
$
84,134
$
124,382
$
136,436
$
109,057
$ |
  29
Investor Presentation
FREE CASH FLOWS (Continued)
Source: Choice Internal Data, March 31, 2013
Year Ended
Year Ended
Year Ended
Year Ended
Year Ended
Year Ended
Year Ended
December 31,
December 31,
December 31,
December 31,
December 31,
December 31,
December 31,
($ in thousands)
2004
2003
2002
2001
2000
1999
1998
Net Cash Provided by Operating Activities
108,908
$
115,304
$
99,018
$
101,712
$
53,879
$
65,040
$
38,952
$
Net Cash Provided (Used) by Investing Activities
(14,544)
27,784
(14,683)
87,738
(16,617)
(36,031)
(9,056)
Free Cash Flows
94,364
$
143,088
$
84,335
$
189,450
$
37,262
$
29,009
$
29,896
$ |
 30
Investor Presentation
Source: Choice Internal Data, March 31, 2013
ADJUSTED EBITDA
LTM
Year Ended
Year Ended
Year Ended
Year Ended
Year Ended
($ in thousands)
March 31,
December 31,
December 31,
December 31,
December 31,
December 31,
2013
2012
2011
2010
2009
2008
Operating Income
192,543
$
193,142
$
171,863
$
160,762
$
148,073
$
174,596
$
Adjustments
Acceleration of Management Succession Plan
-
-
-
-
-
6,605
Loss on Sublease of Office Space
-
-
-
-
1,503
-
Executive Termination Benefits
491
491
4,444
1,730
4,604
3,537
Curtailment and Settlement of SERP
1,818
1,818
-
-
1,209
-
Loan Reserves Related to Impaired Notes Receivable
-
-
-
-
-
7,555
Product Sales
-
-
-
-
-
-
Impairment of Friendly investment
-
-
-
-
-
-
Depreciation and Amortization
8,384
8,226
8,024
8,342
8,336
8,184
Adjusted EBITDA
203,236
$
203,677
$
184,331
$
170,834
$
163,725
$
200,477
$ |