Attached files
| file | filename |
|---|---|
| 8-K - 8-K - SIGMA ALDRICH CORP | investorpresentation8-kjun.htm |
© 2013 Sigma-Aldrich Co. All rights reserved. Sigma-Aldrich Corporation •June 2013 Investor Information

© 2013 Sigma-Aldrich Co. All rights reserved. 2 Cautionary Statements • This presentation contains “forward-looking statements” regarding future sales, earnings, return on invested capital, cost savings, process improvements, free cash flow, share repurchases, capital expenditures, acquisitions, dividends and other matters. Such statements can be identified by words such as: “potential,” “predicts,” “strengthen,” “leverage,” “may,” “expand,” “extend,” “expected,” “expects,” “expect,” “guidance,” “would,” “estimate,” “maintains,” “target,” “will,” or similar references to future periods. Forward-looking statements are neither historical facts nor assurances of future performance. Instead, they are based only on our current beliefs, expectations and assumptions regarding the future of our business, future plans and strategies, projections, anticipated events and trends, the economy and other future conditions. Because forward-looking statements relate to the future, they are subject to inherent uncertainties, risks and changes in circumstances that are difficult to predict and many of which are outside of our control. Actual results could differ materially from those stated or implied in the forward-looking statements. For a list of factors, risks and uncertainties which could make our actual results differ from expected results, please see our latest earnings release posted to the investor relations’ section of our website at www.sigma- aldrich.com and Item 1A of Part I of our latest Annual Report on Form 10-K. We undertake no obligation to publicly update any forward- looking statement, whether written or oral, as a result of new information, future developments or otherwise. • This presentation also contains non-GAAP financial information. Management uses this information in its internal analysis of results and believes this information may be informative to investors in gauging the quality of our financial performance, identifying trends in our results and providing meaningful period-to-period comparisons. For a reconciliation of non-GAAP measures presented in this presentation, see the Appendix to this presentation – Reconciliation of GAAP to Non-GAAP Financial Measures.
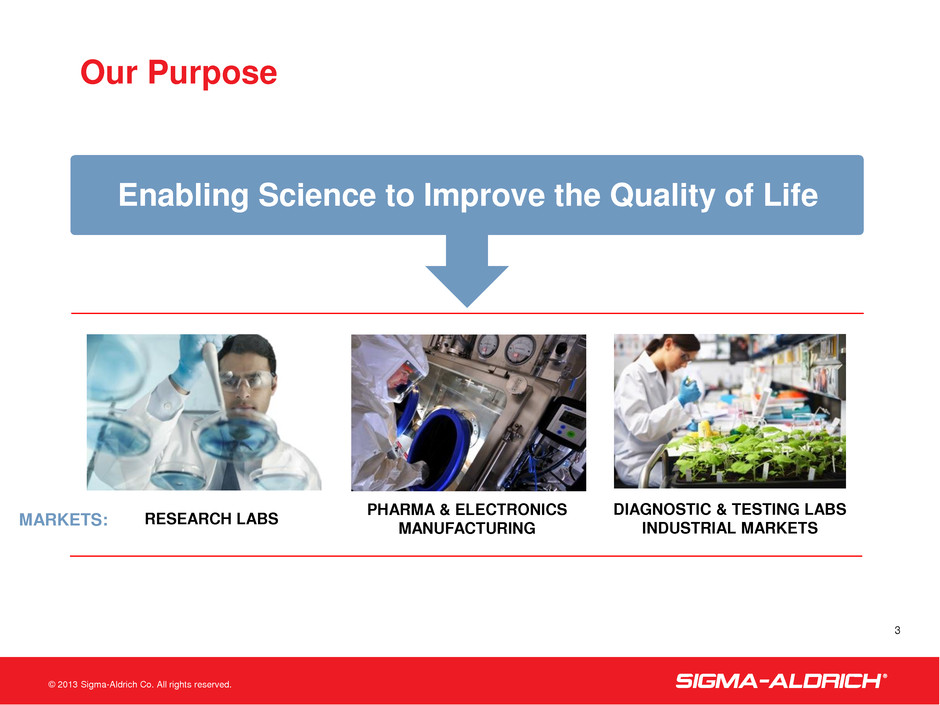
© 2013 Sigma-Aldrich Co. All rights reserved. Our Purpose 3 Enabling Science to Improve the Quality of Life PHARMA & ELECTRONICS MANUFACTURING RESEARCH LABS DIAGNOSTIC & TESTING LABS INDUSTRIAL MARKETS MARKETS:

© 2013 Sigma-Aldrich Co. All rights reserved. Sigma-Aldrich in 2012 GLOBALLY BALANCED 43% Total Americas 37% Europe, Middle East, Africa 20% Asia Pacific 43% 37% 20% $2.6 Billion 53% 24% 23% 21% 79% BROAD END-MARKETS 53% Research 23% Applied 24% SAFC Commercial QUALITY PRODUCTS >170,000 Reagents and Chemicals 45,000 Laboratory Equipment Items $2.6 Billion >215,000 Products • 9,000 employees • 1.4 million individual customers • Sales in 160 countries • Manufactured products generate approximately 60% of company sales FACTS AND FIGURES 4 KEY STATS No customer comprises more than 2% of sales, no product more than 1%

© 2013 Sigma-Aldrich Co. All rights reserved. APPLIED Market Focused Business Units 5 RESEARCH Reagents, Consumables, Kits, Workflow Solutions for Life Sciences and Industrial Research Customized Manufacturing and Services for Commercial Products in Life Sciences and Electronics Raw Materials and Solutions for Testing in Clinical and Industrial Applications • Academic/Government Research • Pharma/Biotech Research • Dealers • Life Science Products • Life Science Services • Hitech Electronics • Diagnostic & Testing • Industrial Applications SAFC COMMERCIAL $30 Billion Market $60 Billion Market $60 Billion Market Playing in Large and Rapidly Growing Markets

© 2013 Sigma-Aldrich Co. All rights reserved. RESEARCH Business Unit 6 53% Customer Focus • Academic • Pharma • Dealers Our Strategy • Innovate Solutions • Broaden Portfolio • Expand Geographic and Channel Reach % of 2012 overall sales
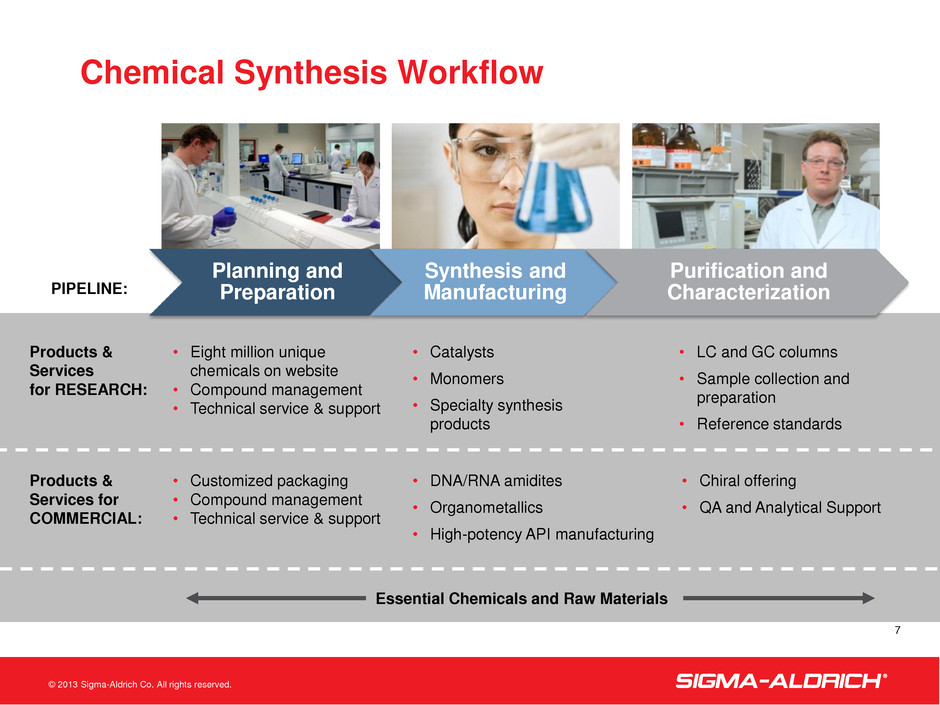
© 2013 Sigma-Aldrich Co. All rights reserved. Chemical Synthesis Workflow 7 Planning and Preparation Synthesis and Manufacturing Purification and Characterization • Catalysts • Monomers • Specialty synthesis products • LC and GC columns • Sample collection and preparation • Reference standards • DNA/RNA amidites • Organometallics • High-potency API manufacturing • Chiral offering • QA and Analytical Support Products & Services for RESEARCH: Products & Services for COMMERCIAL: • Eight million unique chemicals on website • Compound management • Technical service & support • Customized packaging • Compound management • Technical service & support PIPELINE: Essential Chemicals and Raw Materials

© 2013 Sigma-Aldrich Co. All rights reserved. Life Science Workflow DNA & RNA Proteins & Small Molecules Cells & Organisms • Protein depletion technology • SPME devices • LC and GC columns • LOPAC® small molecule library • Validated antibodies Products & Services for RESEARCH: • Reporter cell lines • Media • Expression systems • Vaccine development • Bioconjugation • LC and GC columns • Media & supplements • CHOZN™ platform • Contract manufacturing • Single-use technology • Specialized assays • RNAi • ZFN gene editing • Whole genome amplification • Oligonucleotides • PCR reagents • Oligonucleotides • Industrial enzymes Products & Services for COMMERCIAL: PIPELINE: 8 Essential Chemicals and Raw Materials

© 2013 Sigma-Aldrich Co. All rights reserved. SAFC COMMERCIAL Business Unit 9 24% Customer Focus • Life Science Products • Life Science Services • Hitech Electronics Our Strategy • Intense Focus on Top “100” Customers • Increase Capacity to Meet Market Demand • Add Strategic Capabilities to Meet Developing Customers’ Need % of 2012 overall sales

© 2013 Sigma-Aldrich Co. All rights reserved. Business Unit Segments Business Unit Initiatives Description 2012 SAFC Sales Customer Markets Biological Drugs Small Molecule Drugs LEDs Semiconductors Energy/Display Life Science Products Biopharma Materials Critical raw materials for biological drugs ~60% Pharma Materials Critical raw materials for small molecules Contract Manufacturing Services cGMP Intermediates and APIs for small molecules and biological drugs Life Science Services Biopharma Services Biologic testing services & Viral manufacturing services ~20% Early Development Services Genetic & mammalian toxicology Animal Health services Solid State services Hitech Electronics Hitech Electronics Precursors for LED & semiconductors Performance materials for Energy & Display ~20% SAFC Commercial 10 S A F C C O M M E R C IA L M A R K E T S

© 2013 Sigma-Aldrich Co. All rights reserved. 11 23% APPLIED Business Unit Customer Focus • Diagnostics/Testing • Industrial Applications Our Strategy • Engage and Expand Applied Customer Base • Develop Solutions Tailored to Customer Applications • Broaden Our Capabilities – Organic and Inorganic % of 2012 overall sales

© 2013 Sigma-Aldrich Co. All rights reserved. Applied Workflow 12 Sample Prep Detection Analysis • Reference standards • Oligonucleotides • LC and GC columns Products & Services Sigma-Aldrich Offers: • LC and GC columns • Reference standards • Protein depletion technology • Sampling devices • DNA/RNA extraction kits • Oligonucleotides • PCR reagents Potential Areas for Next Phase of Growth • LC and GC columns PIPELINE: Essential Chemicals and Raw Materials

© 2013 Sigma-Aldrich Co. All rights reserved. Industrial Applications • Specialty Chemicals • Petrochemicals • Healthcare, Med Device, Contact Lenses Focus Areas: • Agricultural Products • Food Processing • Broad Chemical Offer • Bench-to-Bulk Capabilities • Custom Manufacturing • Amplification Buffers and Enzymes • Sample Prep • Culture Media • Flavors and Fragrances • Food and Beverage • Cosmetics and Personal Care • Custom Manufacturing • Sterile Solutions Manufacturing • Aroma Raw Materials • Naturals/Essential Oils Products & Services Sigma-Aldrich Offers: Specialty Chemicals Consumer Products Agriculture INDUSTRY: 13 Essential Chemicals and Raw Materials

© 2013 Sigma-Aldrich Co. All rights reserved. Focusing on Where Our Customers are Going • Sales in ~160 countries • 103,000+ accounts • 1.4 million individual customers • Over 50 offices in 30 countries • Inventory staged within a day for >90% of customers • Working with customers to integrate their supply chains with Sigma-Aldrich • Focusing on eCommerce solutions • Added packaging and distribution capacity (Wuxi, China/Bangalore, India) ~160 Countries Served 55M Website Visits Annually 33 Distribution Centers 14

© 2013 Sigma-Aldrich Co. All rights reserved. Q1 2013 Results
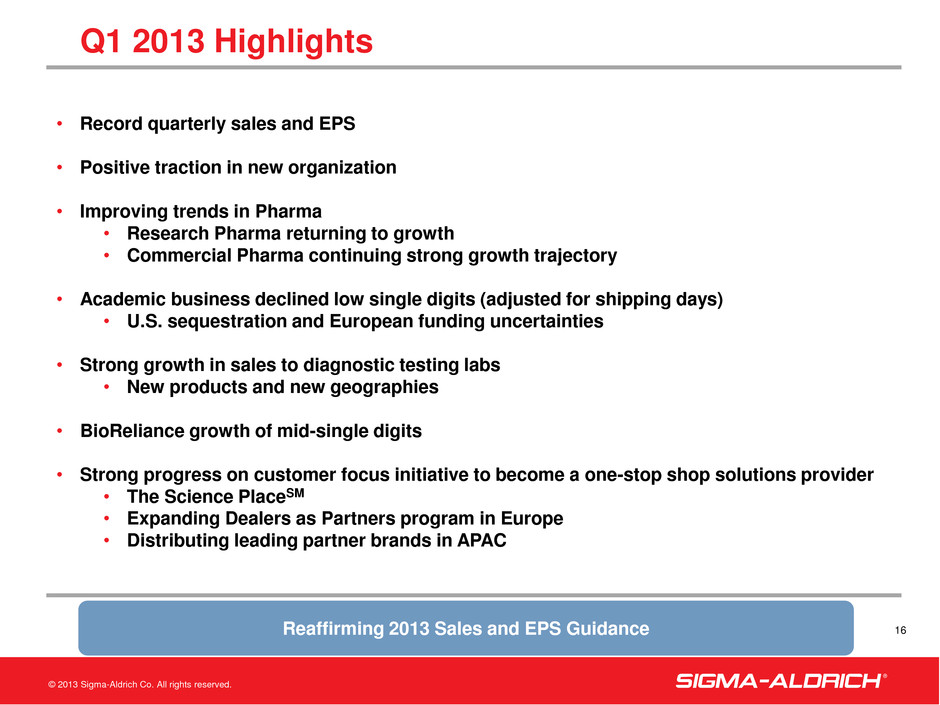
© 2013 Sigma-Aldrich Co. All rights reserved. • Record quarterly sales and EPS • Positive traction in new organization • Improving trends in Pharma • Research Pharma returning to growth • Commercial Pharma continuing strong growth trajectory • Academic business declined low single digits (adjusted for shipping days) • U.S. sequestration and European funding uncertainties • Strong growth in sales to diagnostic testing labs • New products and new geographies • BioReliance growth of mid-single digits • Strong progress on customer focus initiative to become a one-stop shop solutions provider • The Science PlaceSM • Expanding Dealers as Partners program in Europe • Distributing leading partner brands in APAC 16 Q1 2013 Highlights Reaffirming 2013 Sales and EPS Guidance

© 2013 Sigma-Aldrich Co. All rights reserved. (1) See Slide 28 for Reconciliation of Net Cash Provided by Operating Activities to Free Cash Flow. (2) Special items include acquisition transaction costs. 17 First Quarter 2013 Financial Results ($ in millions, except per share amounts) YEAR-OVER-YEAR Q1 2013 As Reported Excluding Currency and Acquisition Impacts Sales $ 675 2% 1 % As Reported Q1 2013 As Reported Excluding Special Items (2) Operating Income $ 166 3% 6% Net Income $ 122 4% 1% Diluted EPS $1.01 5% 2% Free Cash Flow (1) $129 15% Changes in FX Rates Reduced Operating Income by $4 Million, or $0.02 of Adjusted EPS

© 2013 Sigma-Aldrich Co. All rights reserved. 18 First Quarter 2013 Sales Growth Reconciliation 2013 Q1 Overall Organic Sales Growth of 1% Applied Q1 3 % (1)% 2 % 4 % Research Q1 (1) % (2)% - % (3)% Total Customer Sales Q1 1 % (1)% 2 % 2 % Sales Growth Organic FX Acquisitions Reported SAFC Commercial Q1 3 % (1)% 9 % 11 %

© 2013 Sigma-Aldrich Co. All rights reserved. 19 2013 Q1 Organic Sales Performance Highlight vs. PY Q1 Business Unit: Research: Academic/Govt/Hospitals (Mid-single digit) Pharma Flat Dealers Low-to-mid single digit Applied Diagnostics/Testing High-single digit Industrial (Low-single digit) SAFC Commercial Life Science Products & Services Mid-single digit Hitech Electronics (Low-double digits) Geographic: Total Americas Low-single digit EMEA Low-single digit APAC (Low-single digit) 2013

© 2013 Sigma-Aldrich Co. All rights reserved. 20 2013 Guidance Organic Sales Growth 2013 full-year adjusted EPS expected to be in a range of $4.10 to $4.20 1st Half 2nd Half Full Year Research Low-single digit Low-single digit Low-to-mid single digit Applied Mid-single digit Mid-single digit SAFC Commercial Mid-single digit Mid-to-high single digit

© 2013 Sigma-Aldrich Co. All rights reserved. Proven Formula for Value Creation 2 ,6 2 3 2 ,2 0 1 2 ,5 0 5 +5% CAGR 2012 2007 2 ,0 3 9 2 ,2 7 1 2 ,1 4 8 25.125.824.323.222.922.5 2012 2007 20.1 23.222.4 19.818.717.9 2012 2007 Sales Growth Strong ROIC GAAP Margin Expansion Peers: Life Technologies, Qiagen, Techne, Thermo-Fisher, Waters, Agilent, Becton Dickinson, Bio-Rad, PerkinElmer, Lonza +220bps +260bps 38 consecutive years of increasing annual EPS and dividends 21 $100.00 $78.32 $94.80 $126.02 $119.62 $142.45 $152.76 $0 $50 $100 $150 $200 FY2007 FY2008 FY2009 FY2010 FY2011 FY2012 30-Apr-13 SIAL-US PEERS Nasdaq 100 S&P 500 DJIA
© 2013 Sigma-Aldrich Co. All rights reserved. Sigma-Aldrich Corporation Q1 2013 Earnings Review Questions?

© 2013 Sigma-Aldrich Co. All rights reserved. Appendix •Reconciliation of GAAP to Non-GAAP Financial Measures
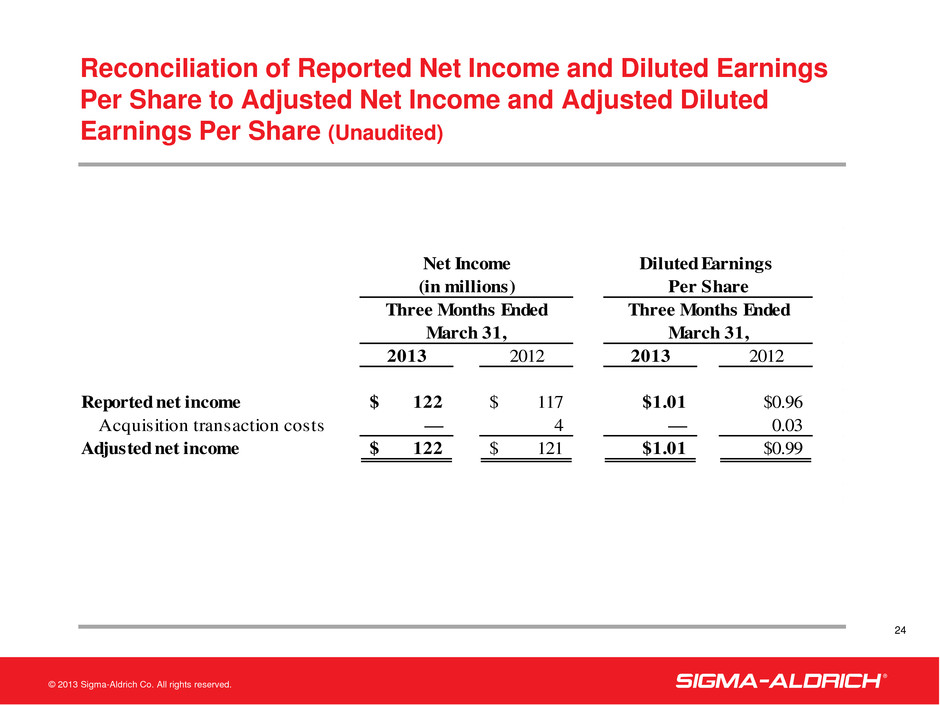
© 2013 Sigma-Aldrich Co. All rights reserved. 2013 2012 2013 2012 Reported net income 122$ 117$ $1.01 $0.96 Acquisition transaction costs — 4 — 0.03 Adjusted net income 122$ 121$ $1.01 $0.99 Three Months Ended Three Months Ended March 31, March 31, Net Income Diluted Earnings (in millions) Per ShareReconciliation of Reported Net Income and Diluted Earnings Per Share to Adjusted Net Income and Adjusted Diluted Earnings Per Share (Unaudited) 24

© 2013 Sigma-Aldrich Co. All rights reserved. Reconciliation of Reported Operating Income to Adjusted Operating Income (Unaudited) 25 2013 2012 Reported operating income 166$ 172$ Acquisition transaction costs — 5 Adjusted operating income 166$ 177$ Three Months Ended March 31, In millions

© 2013 Sigma-Aldrich Co. All rights reserved. 26 March 31, December 31, September 30, June 30, 2013 2012 2012 2012 Reported O perating Income Margin 24.6% 25.0% 24.4% 25.2% Restructuring cost —% 0.2% 0.6% 0.6% Adjusted O perating Income Margin 24.6% 25.2% 25.0% 25.8% Three Months Ended Reconciliation of Reported Operating Income Margin to Adjusted Operating Income Margin (Unaudited)

© 2013 Sigma-Aldrich Co. All rights reserved. Reconciliation of Reported Earnings Per Share to Adjusted Earnings Per Share (Unaudited) 27 2013 2012 Reported Earnings Per Share 1.01$ 0.96$ Currency 0.02 n/a Adjusted Earnings Per Share 1.03$ 0.96$ March 31, Three Months Ended
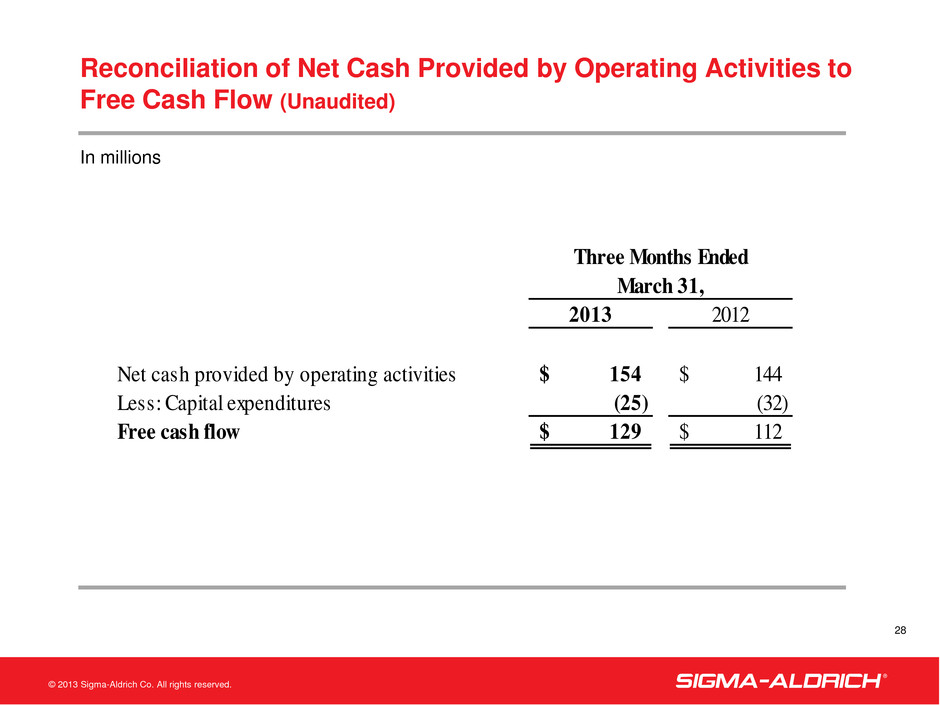
© 2013 Sigma-Aldrich Co. All rights reserved. Reconciliation of Net Cash Provided by Operating Activities to Free Cash Flow (Unaudited) 28 2013 2012 Net cash provided by operating activities 154$ 144$ Less: Capital expenditures (25) (32) Free cash flow 129$ 112$ March 31, Three Months Ended In millions
