Attached files
| file | filename |
|---|---|
| 8-K - 8-K - EQUITY LIFESTYLE PROPERTIES INC | d549266d8k.htm |
Exhibit 99.1

Equity LifeStyle Properties
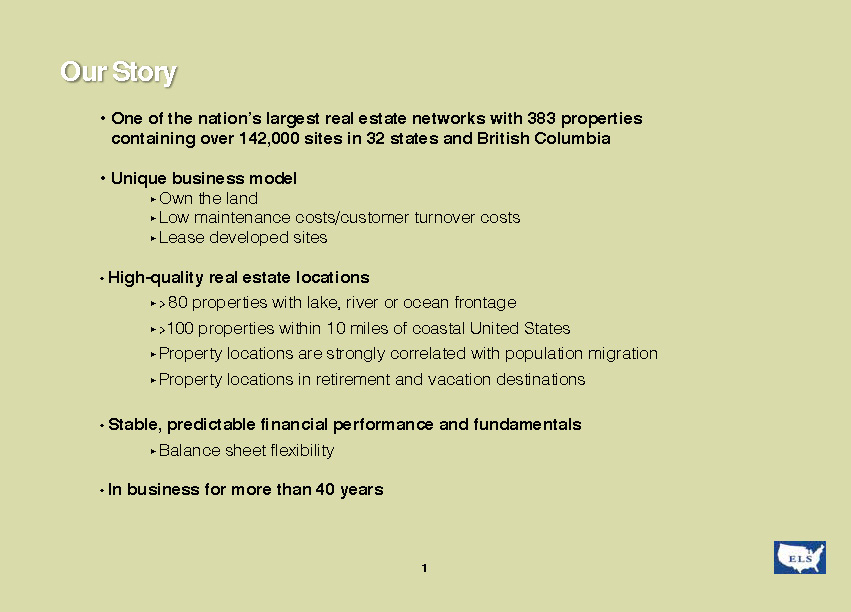
Our Story • One of the nation’s largest real estate networks with 383 properties containing over 142,000 sites in 32 states and British Columbia • Unique business model ? Own the land ? Low maintenance costs/customer turnover costs ? Lease developed sites • High-quality real estate locations ? > 80 properties with lake, river or ocean frontage ? >100 properties within 10 miles of coastal United States Property locations are strongly correlated with population migration Property locations in retirement and vacation destinations • Stable, predictable financial performance and fundamentals Balance sheet flexibility • In business for more than 40 years 1
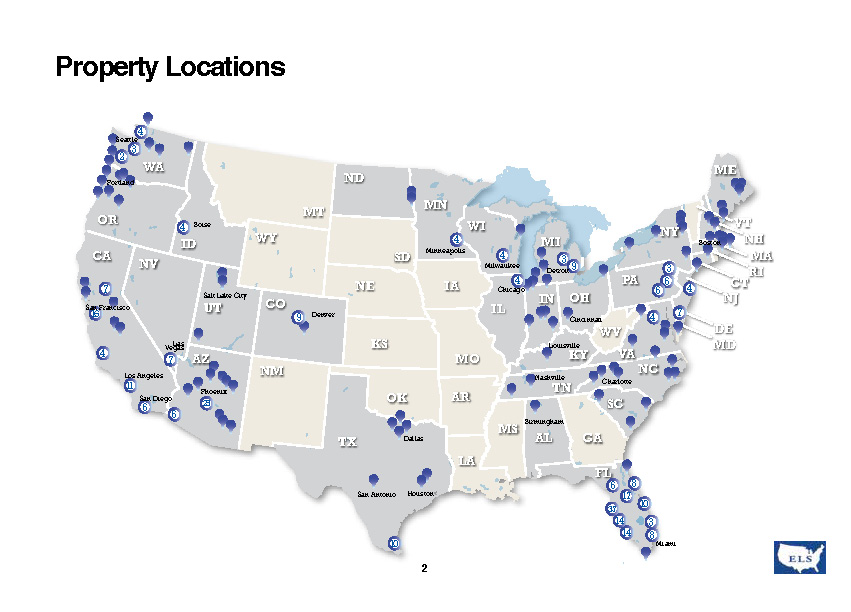
WA OR CA NV ID UT AZ NM TX OK LA AR MO IA MN WI IL OH MI PA WV KY TN MS AL GA FL SC NC MD DE NJ CT RI MA NH VT ME NY VA KS NE SD ND MT WY CO 4 4 4 4 4 4 4 4 7 7 16 11 10 25 2 6 6 3 3 9 3 9 6 8 3 8 17 10 14 14 37 6 7 6 Seattle Chicago Houston Dallas San Diego Phoenix Salt Lake City Boise Cincinnati Charlotte Milwaukee Portland San Antonio San Francisco VegLaass Denver Minneapolis Nashville Louisville Birmingham Detroit Miami Boston Los Angeles IN Property Locations 2
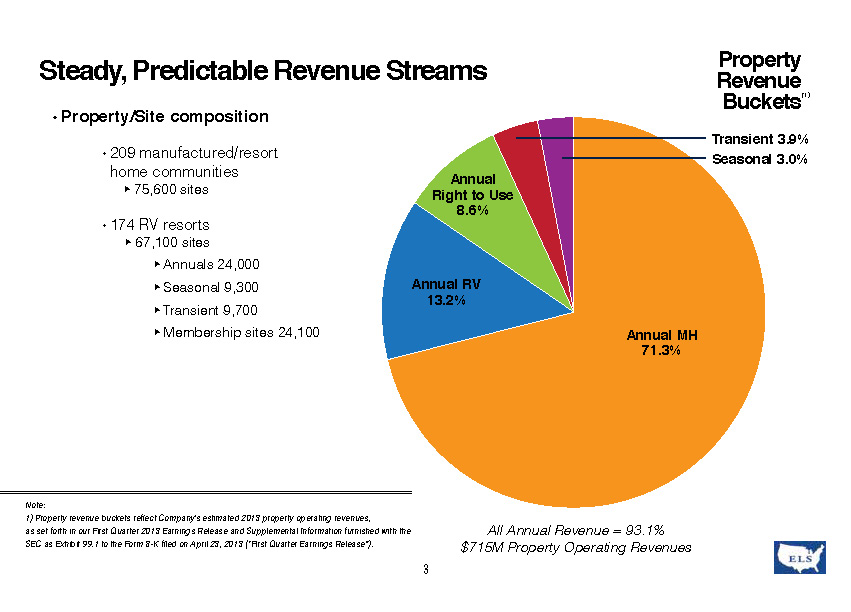
Steady, Predictable Revenue Streams All Annual Revenue = 93.1% $715M Property Operating Revenues Note: 1) Property revenue buckets reflect Company’s estimated 2013 property operating revenues, as set forth in our First Quarter 2013 Earnings Release and Supplemental Information furnished with the SEC as Exhibit 99.1 to the Form 8-K filed on April 23, 2013 (“First Quarter Earnings Release”). 3 • Property/Site composition • 209 manufactured/resort home communities ? 75,600 sites • 174 RV resorts ? 67,100 sites ? Annuals 24,000 ? Seasonal 9,300 ? Transient 9,700 ? Membership sites 24,100 Annual MH 71.3% Annual RV 13.2% Annual Right to Use 8.6% Seasonal 3.0% Transient 3.9% Property Revenue Buckets(1)

Manufactured Home RV Resort Cottage RV Site • Customers own the units they place on our sites ? Manufactured homes ? Resort cottages (park models) ? Recreational vehicles • We offer a lifestyle and a variety of product options to meet our customers’ needs • We seek to create long-term relationships with our customers 4 Our Customers
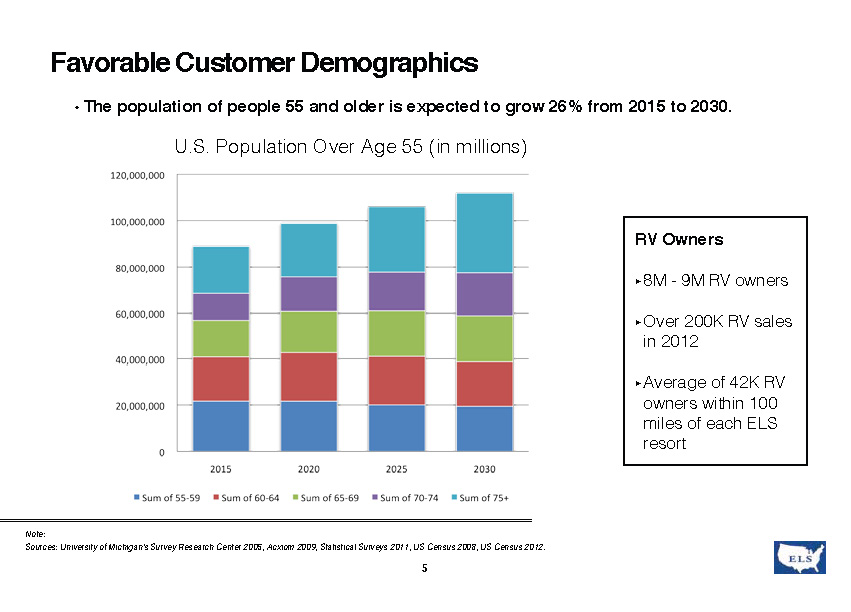
• The population of people 55 and older is expected to grow 26% from 2015 to 2030. U.S. Population Over Age 55 (in millions) Note: Sources: University of Michigan’s Survey Research Center 2005, Acxiom 2009, Statistical Surveys 2011, US Census 2008, US Census 2012. RV Owners ? 8M—9M RV owners ? Over 200K RV sales in 2012 ? Average of 42K RV owners within 100 miles of each ELS resort 5 Favorable Customer Demographics
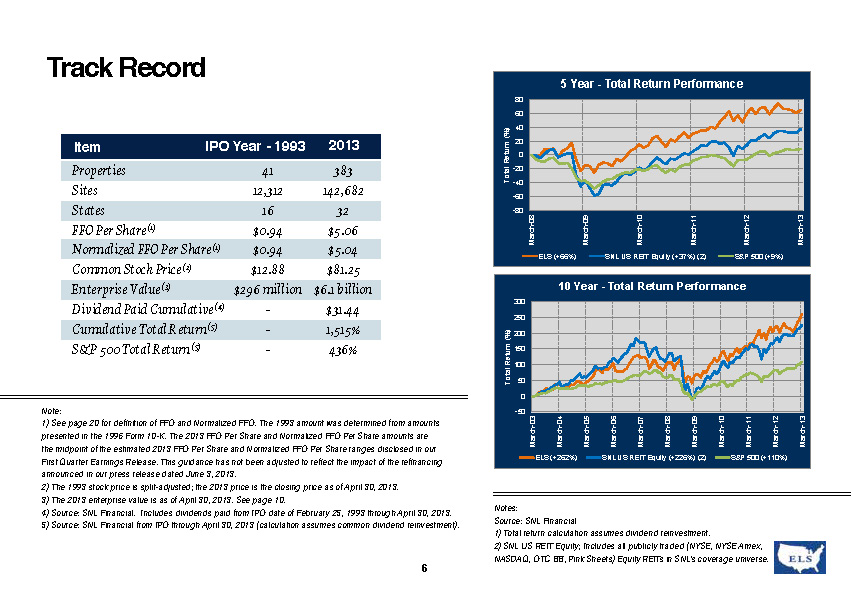
Note: 1) See page 20 for definition of FFO and Normalized FFO. The 1993 amount was determined from amounts presented in the 1996 Form 10-K. The 2013 FFO Per Share and Normalized FFO Per Share amounts are the midpoint of the estimated 2013 FFO Per Share and Normalized FFO Per Share ranges disclosed in our First Quarter Earnings Release. This guidance has not been adjusted to reflect the impact of the refinancing announced in our press release dated June 3, 2013. 2) The 1993 stock price is split-adjusted; the 2013 price is the closing price as of April 30, 2013. 3) The 2013 enterprise value is as of April 30, 2013. See page 10. 4) Source: SNL Financial. Includes dividends paid from IPO date of February 25, 1993 through April 30, 2013. 5) Source: SNL Financial from IPO through April 30, 2013 (calculation assumes common dividend reinvestment). Notes: Source: SNL Financial 1) Total return calculation assumes dividend reinvestment. 2) SNL US REIT Equity; Includes all publicly traded (NYSE, NYSE Amex, NASDAQ, OTC BB, Pink Sheets) Equity REITs in SNL’s coverage universe. Properties Sites States FFO Per Share (1) Normalized FFO Per Share (1) Common Stock Price (2) Enterprise Value (3) Dividend Paid Cumulative (4) Cumulative Total Return (5) S&P 500 Total Return (5) 41 12,312 16 $0.94 $0.94 $12.88 $296 million ——383 142,682 32 $5.06 $5.04 $81.25 $6.1 billion $31.44 1,515% 436% Item IPO Year—1993 2013 6 -80 -60 -40 -20 0 20 40 60 80 March-08 March-09 March-10 March-11 March-12 March-13 Total Return (%) 5 Year—Total Return Performance ELS (+66%) SNL US REIT Equity (+37%) (2) S&P 500 (+9%) -50 0 50 100 150 200 250 300 March-03 March-04 March-05 March-06 March-07 March-08 March-09 March-10 March-11 March-12 March-13 Total Return (%) 10 Year—Total Return Performance ELS (+262%) SNL US REIT Equity (+226%) (2) S&P 500 (+110%) Track Record
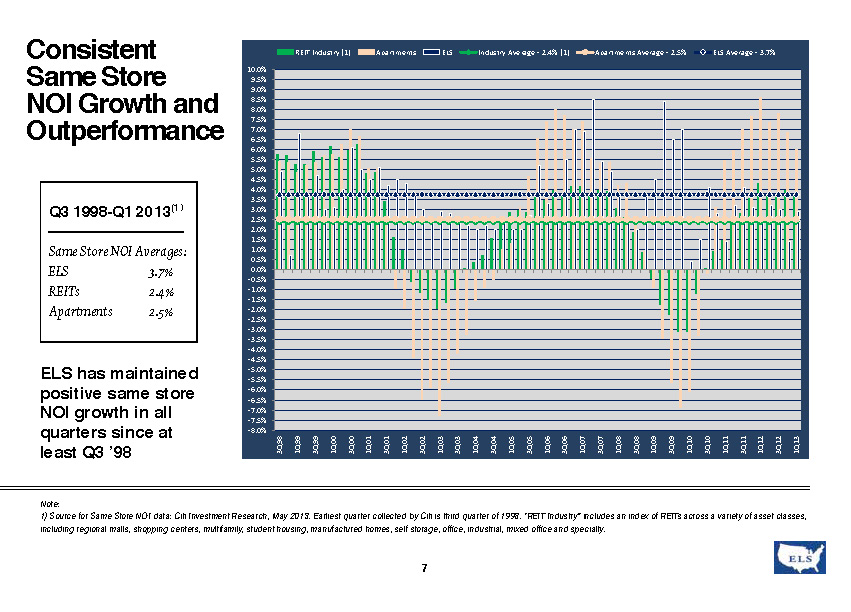
Consistent Same Store NOI Growth and Outperformance -8.0% -7.5% -7.0% -6.5% -6.0% -5.5% -5.0% -4.5% -4.0% -3.5% -3.0% -2.5% -2.0% -1.5% -1.0% -0.5% 0.0% 0.5% 1.0% 1.5% 2.0% 2.5% 3.0% 3.5% 4.0% 4.5% 5.0% 5.5% 6.0% 6.5% 7.0% 7.5% 8.0% 8.5% 9.0% 9.5% 10.0% 3Q98 1Q99 3Q99 1Q00 3Q00 1Q01 3Q01 1Q02 3Q02 1Q03 3Q03 1Q04 3Q04 1Q05 3Q05 1Q06 3Q06 1Q07 3Q07 1Q08 3Q08 1Q09 3Q09 1Q10 3Q10 1Q11 3Q11 1Q12 3Q12 1Q13 REIT Industry (1) Apartments ELS Industry Average—2.4% (1) Apartments Average—2.5% ELS Average—3.7% ELS has maintained positive same store NOI growth in all quarters since at least Q3 ’98 Q3 1998-Q1 2013(1) Same Store NOI Averages: ELS 3.7% REITs 2.4% Apartments 2.5% Note: 1) Source for Same Store NOI data: Citi Investment Research, May 2013. Earliest quarter collected by Citi is third quarter of 1998. “REIT Industry” includes an index of REITs across a variety of asset classes, including regional malls, shopping centers, multifamily, student housing, manufactured homes, self storage, office, industrial, mixed office and specialty. 7
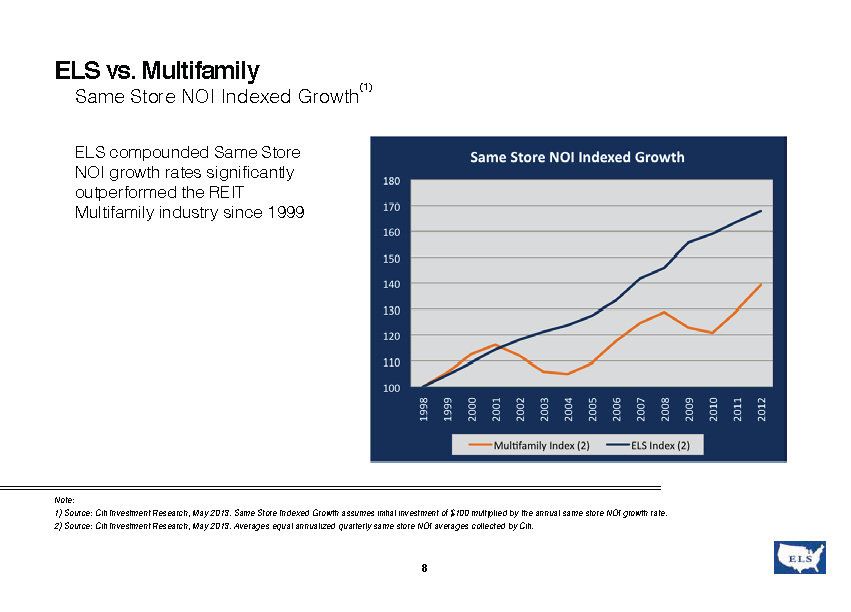
ELS vs. Multifamily ELS compounded Same Store NOI growth rates significantly outperformed the REIT Multifamily industry since 1999 Same Store NOI Indexed Growth(1) Note: 1) Source: Citi Investment Research, May 2013. Same Store Indexed Growth assumes initial investment of $100 multiplied by the annual same store NOI growth rate. 2) Source: Citi Investment Research, May 2013. Averages equal annualized quarterly same store NOI averages collected by Citi. 8
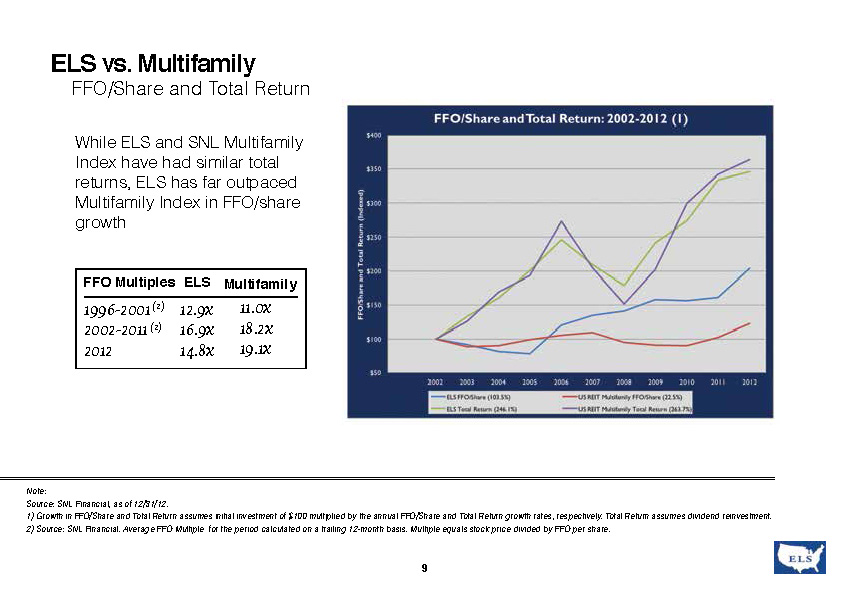
While ELS and SNL Multifamily Index have had similar total returns, ELS has far outpaced Multifamily Index in FFO/share growth Note: Source: SNL Financial, as of 12/31/12. 1) Growth in FFO/Share and Total Return assumes initial investment of $100 multiplied by the annual FFO/Share and Total Return growth rates, respectively. Total Return assumes dividend reinvestment. 2) Source: SNL Financial. Average FFO Multiple for the period calculated on a trailing 12-month basis. Multiple equals stock price divided by FFO per share. 9 1996-2001 (2) 2002-2011 (2) 2012 12.9x 16.9x 14.8x 11.0x 18.2x 19.1x FFO Multiples ELS Multifamily ELS vs. Multifamily FFO/Share and Total Return
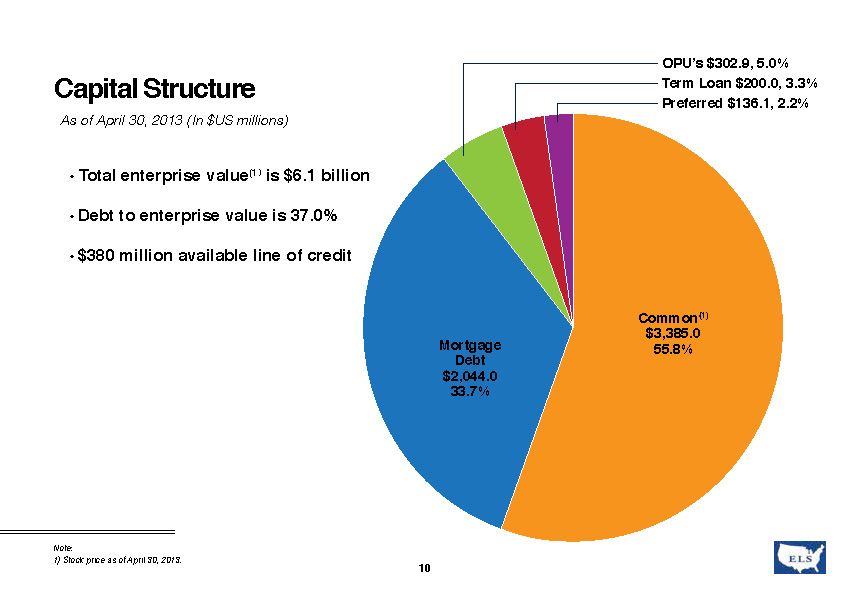
• Total enterprise value(1) is $6.1 billion • Debt to enterprise value is 37.0% • $380 million available line of credit Note: 1) Stock price as of April 30, 2013. 10 As of April 30, 2013 (In $US millions) Common(1) $3,385.0 55.8% Preferred $136.1, 2.2% Term Loan $200.0, 3.3% OPU’s $302.9, 5.0% Mortgage Debt $2,044.0 33.7% Capital Structure
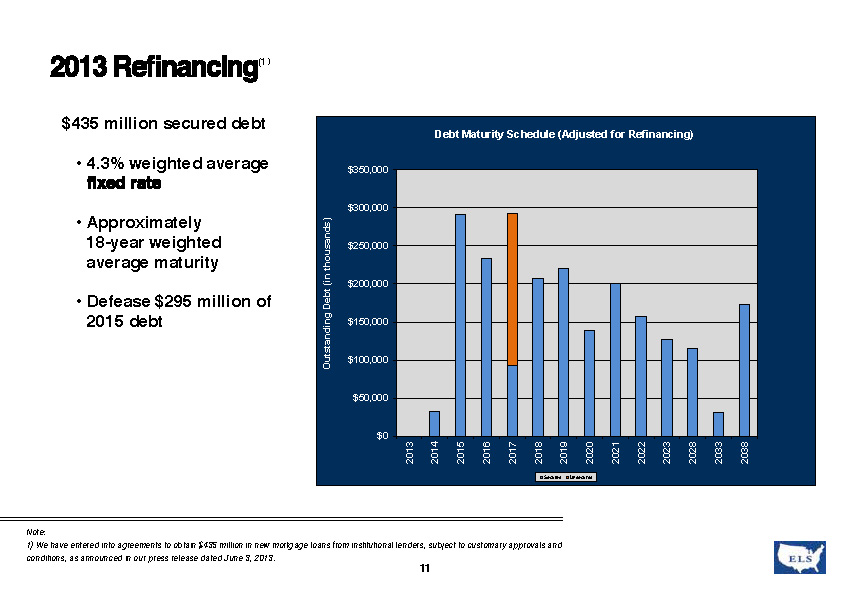
Note: 1) We have entered into agreements to obtain $435 million in new mortgage loans from institutional lenders, subject to customary approvals and conditions, as announced in our press release dated June 3, 2013. 11 $435 million secured debt • 4.3% weighted average • Approximately 18-year weighted average maturity • Defease $295 million of 2015 debt $0 $50,000 $100,000 $150,000 $200,000 $250,000 $300,000 $350,000 2013 2014 2015 2016 2017 2018 2019 2020 2021 2022 2023 2028 2033 2038 Outstanding Debt (in thousands) Debt Maturity Schedule (Adjusted for Refinancing) Secured Unsecured (1)
Note: 1) Excludes joint venture sites. 2) For 2013 Core Portfolio is defined for this presentation as properties acquired prior to December 31, 2011. The Core Portfolio may change from time-to-time depending on acquisitions, dispositions and significant transactions or unique situations. 3) Compared to the four months ended April 30, 2012. • 205 Manufactured Home Communities(1) ? Core(2) occupancy of 90.0% and up 78 sites since 12/31/12 ? Core occupancy has grown 14 consecutive quarters through 3/31/13 ? Core community base rental income growth for the four months ended 4/30/13 is 2.9%(3) • 173 RV Resorts(1) ? Core resort income growth for the four months ended 4/30/13 is 2.8%(3) ? Annual growth rate for the four months ended 4/30/13 is 3.7%(3) 12 Performance Update
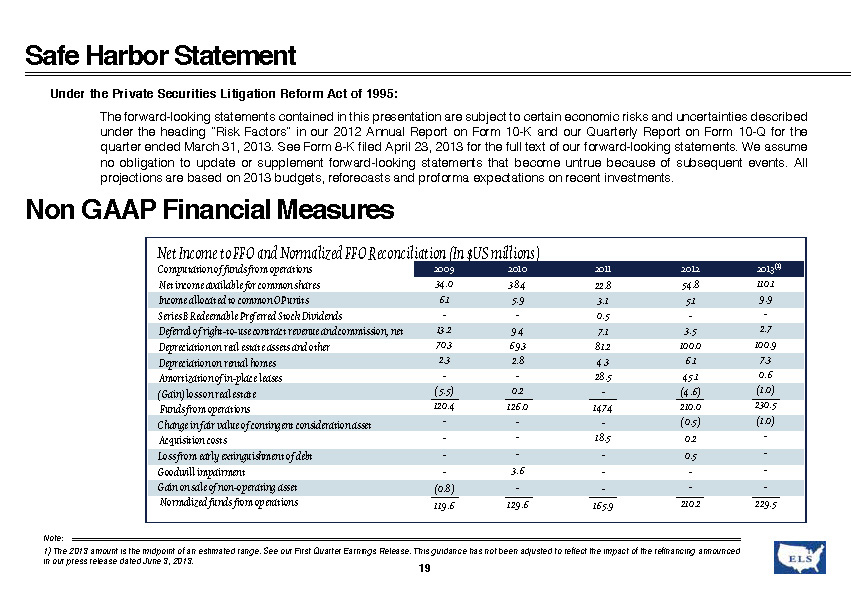
The forward-looking statements contained in this presentation are subject to certain economic risks and uncertainties described under the heading “Risk Factors” in our 2012 Annual Report on Form 10-K and our Quarterly Report on Form 10-Q for the quarter ended March 31, 2013. See Form 8-K filed April 23, 2013 for the full text of our forward-looking statements. We assume no obligation to update or supplement forward-looking statements that become untrue because of subsequent events. All projections are based on 2013 budgets, reforecasts and proforma expectations on recent investments. Under the Private Securities Litigation Reform Act of 1995: Note: 1) The 2013 amount is the midpoint of an estimated range. See our First Quarter Earnings Release. This guidance has not been adjusted to reflect the impact of the refinancing announced in our press release dated June 3, 2013. 19 Net Income to FFO and Normalized FFO Reconciliation (In $US millions) Net income available for common shares Computation of funds from operations Income allocated to common OP units Series B Redeemable Preferred Stock Dividends Deferral of right-to-use contract revenue and commission, net Depreciation on real estate assets and other Depreciation on rental homes Amortization of in-place leases (Gain) loss on real estate Funds from operations Change in fair value of contingent consideration asset Acquisition costs Loss from early extinguishment of debt Gain on sale of non-operating asset Goodwill impairment Normalized funds from operations 2009 2010 2011 2012 2013(1) 34.0 6.1—13.2 70.3 2.3—(5.5) 120.4 — — (0.8) 119.6 38.4 5.9—9.4 69.3 2.8—0.2 126.0 ——3.6—129.6 22.8 3.1 0.5 7.1 81.2 4.3 28.5—147.4—18.5 ——165.9 54.8 5.1—3.5 100.0 6.1 45.1 (4.6) 210.0 (0.5) 0.2 0.5 — 210.2 110.1 9.9—2.7 100.9 7.3 0.6 (1.0) 230.5 (1.0) — — 229.5 Safe Harbor Statement Non GAAP Financial Measures
Funds from Operations (“FFO”) is a non-GAAP financial measure. We believe FFO, as defined by the Board of Governors of the National Association of Real Estate Investment Trusts (“NAREIT”), is generally an appropriate measure of performance for an equity REIT. While FFO is a relevant and widely used measure of operating performance for equity REITs, it does not represent cash flow from operations or net income as defined by GAAP, and it should not be considered as an alternative to these indicators in evaluating liquidity or operating performance. We define FFO as net income, computed in accordance with GAAP, excluding gains or actual or estimated losses from sales of properties, plus real estate related depreciation and amortization, and after adjustments for unconsolidated partnerships and joint ventures. Adjustments for unconsolidated partnerships and joint ventures are calculated to reflect FFO on the same basis. We receive up-front non-refundable payments from the entry of right-to-use contracts. In accordance with GAAP, the up-front non-refundable payments and related commissions are deferred and amortized over the estimated customer life. Although the NAREIT definition of FFO does not address the treatment of non-refundable right-to-use payments, we believe that it is appropriate to adjust for the impact of the deferral activity in our calculation of FFO. We believe that FFO is helpful to investors as one of several measures of the performance of an equity REIT. We further believe that by excluding the effect of depreciation, amortization and gains or actual or estimated losses from sales of real estate, all of which are based on historical costs and which may be of limited relevance in evaluating current performance, FFO can facilitate comparisons of operating performance between periods and among other equity REITs. We believe that the adjustment to FFO for the net revenue deferral of up-front non-refundable payments and expense deferral of right-to-use contract commissions also facilitates the comparison to other equity REITs. Normalized Funds from Operations (“Normalized FFO”) is a non-GAAP measure. We define Normalized FFO as FFO excluding the following nonoperating income and expense items: a) the financial impact of contingent consideration; b) gains and losses from early debt extinguishment, including prepayment penalties; c) property acquisition and other transaction costs related to mergers and acquisitions; and d) other miscellaneous non-comparable items. Investors should review FFO and Normalized FFO, along with GAAP net income and cash flow from operating activities, investing activities and financing activities, when evaluating an equity REIT’s operating performance. We compute FFO in accordance with our interpretation of standards established by NAREIT, which may not be comparable to FFO reported by other REITs that do not define the term in accordance with the current NAREIT definition or that interpret the current NAREIT definition differently than we do. Normalized FFO presented herein is not necessarily comparable to Normalized FFO presented by other real estate companies due to the fact that not all real estate companies use the same methodology for computing this amount. FFO and Normalized FFO do not represent cash generated from operating activities in accordance with GAAP, nor do they represent cash available to pay distributions and should not be considered as an alternative to net income, determined in accordance with GAAP, as an indication of our financial performance, or to cash flow from operating activities, determined in accordance with GAAP, as a measure of our liquidity, nor is it indicative of funds available to fund our cash needs, including our ability to make cash distributions. NonGAAP Financial Measures 20

Equity LifeStyle Properties Two North Riverside Plaza, Chicago, Illinois 60606 800-247-5279 | www.EquityLifeStyle.com