Attached files
| file | filename |
|---|---|
| 8-K - FORM 8-K DATED MAY 28, 2013 - DAKOTA PLAINS HOLDINGS, INC. | dakota132478_8k.htm |
Exhibit 99.1
|
|
|
|
|
OTC: DAKP
CORPORATE PRESENTATION MAY 2013 WWW.DAKOTAPLAINS.COM |
|
|
|
|
|
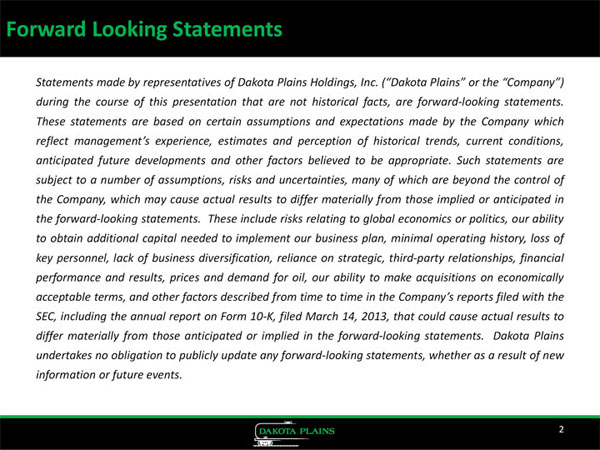
Forward
Looking Statements
Statements made by representatives of Dakota Plains Holdings, Inc. (“Dakota Plains” or the “Company”) during the course of this presentation that are not historical facts, are forward-looking statements. These statements are based on certain assumptions and expectations made by the Company which reflect management’s experience, estimates and perception of historical trends, current conditions, anticipated future developments and other factors believed to be appropriate. Such statements are subject to a number of assumptions, risks and uncertainties, many of which are beyond the control of the Company, which may cause actual results to differ materially from those implied or anticipated in the forward-looking statements. These include risks relating to global economics or politics, our ability to obtain additional capital needed to implement our business plan, minimal operating history, loss of key personnel, lack of business diversification, reliance on strategic, third-party relationships, financial performance and results, prices and demand for oil, our ability to make acquisitions on economically acceptable terms, and other factors described from time to time in the Company’s reports filed with the SEC, including the annual report on Form 10-K, filed March 14, 2013, that could cause actual results to differ materially from those anticipated or implied in the forward-looking statements. Dakota Plains undertakes no obligation to publicly update any forward-looking statements, whether as a result of new information or future events. 2 |
|
|
|
|
|
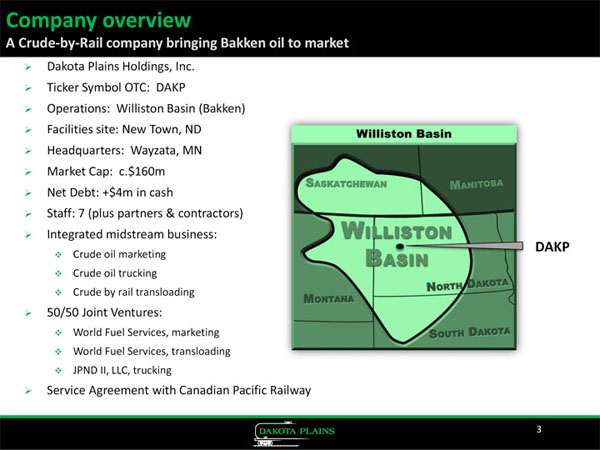
Company
overview
A Crude-by-Rail company bringing Bakken oil to market ~Dakota Plains Holdings, Inc. Ticker Symbol OTC: DAKP ~Operations: Williston Basin (Bakken) Facilities site: New Town, ND Headquarters: Wayzata, MN Market Cap: c.$160m Net Debt: +$4m in cash Staff: 7 (plus partners & contractors) Integrated midstream business: DAKP ~Crude oil marketing Crude oil trucking Crude by rail transloading ~50/50 Joint Ventures: ~World Fuel Services, marketing World Fuel Services, transloading JPND II, LLC, trucking ~Service Agreement with Canadian Pacific Railway ~3 2 |
|
|
|
|
|
Investment
proposition
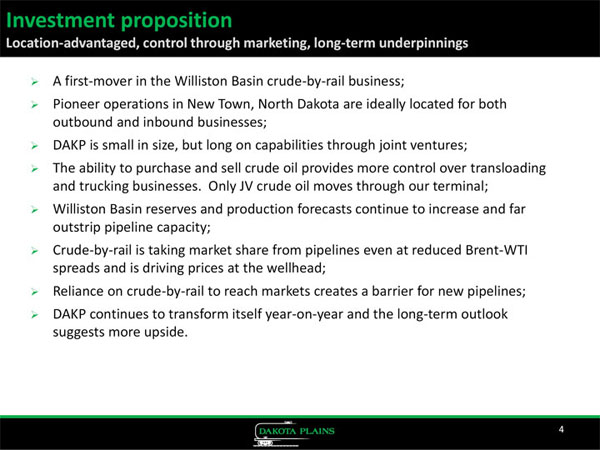
Location-advantaged, control through marketing, long-term underpinnings ~A first-mover in the Williston Basin crude-by-rail business; ~Pioneer operations in New Town, North Dakota are ideally located for both outbound and inbound businesses; DAKP is small in size, but long on capabilities through joint ventures; ~The ability to purchase and sell crude oil provides more control over transloading and trucking businesses. Only JV crude oil moves through our terminal; Williston Basin reserves and production forecasts continue to increase and far outstrip pipeline capacity; Crude-by-rail is taking market share from pipelines even at reduced Brent-WTI spreads and is driving prices at the wellhead; Reliance on crude-by-rail to reach markets creates a barrier for new pipelines; DAKP continues to transform itself year-on-year and the long-term outlook suggests more upside. 4 |
|
|
|
|
|
Supply
& Offtake customers
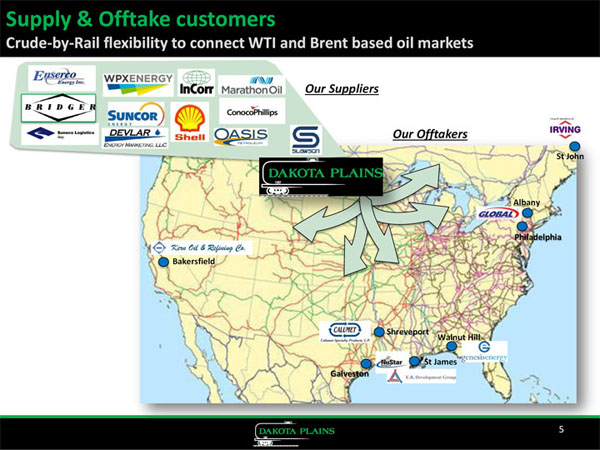
Crude-by-Rail flexibility to connect WTI and Brent based oil markets Our Suppliers Our Offtakers St John Albany Philadelphia Bakersfield Shreveport Walnut Hill St James Galveston 5 |
|
|
|
|
|
Business
segments
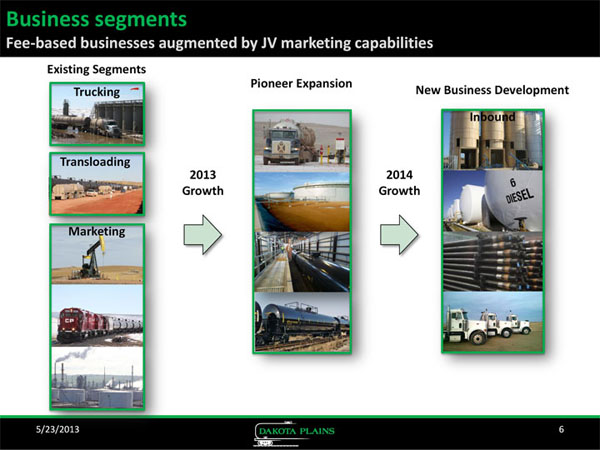
Fee-based businesses augmented by JV marketing capabilities Existing Segments Pioneer Expansion New Business Development Inbound 2013 2014 Growth Growth 6 |
|
|
|
|
|
Performance
review
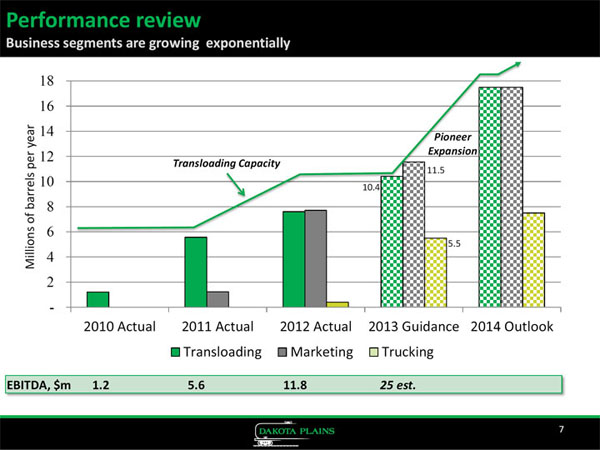
Business segments are growing exponentially ~18 16 14 Pioneer ~12 Expansion Transloading Capacity 11.5 ~10 10.4 ~8 6 5.5 Millions of barrels per year 4 ~2 - 2010 Actual 2011 Actual 2012 Actual 2013 Guidance 2014 Outlook Transloading Marketing Trucking EBITDA, $m 1.2 5.6 11.8 25 est. 7 |
|
|
|
|
|
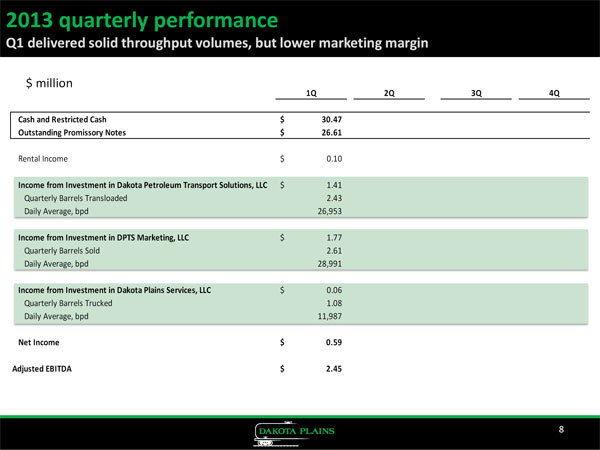
2013
quarterly performance
Q1 delivered solid throughput volumes, but lower marketing margin $ million 1Q 2Q 3Q 4Q Cash and Restricted Cash $ 30.47 Outstanding Promissory Notes $ 26.61 Rental Income $ 0.10 Income from Investment in Dakota Petroleum Transport Solutions, LLC $ 1.41 Quarterly Barrels Transloaded 2.43 Daily Average, bpd 26,953 Income from Investment in DPTS Marketing, LLC $ 1.77 Quarterly Barrels Sold 2.61 Daily Average, bpd 28,991 Income from Investment in Dakota Plains Services, LLC $ 0.06 Quarterly Barrels Trucked 1.08 Daily Average, bpd 11,987 Net Income $ 0.59 Adjusted EBITDA $ 2.45 8 |
|
|
|
|
|
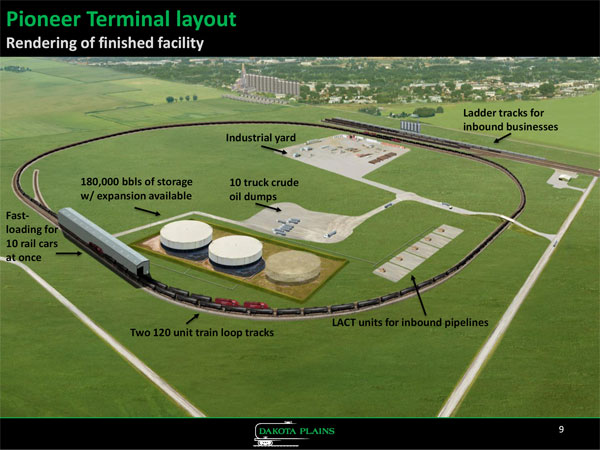
Pioneer
Terminal layout
Rendering of finished facility Ladder tracks for inbound businesses Industrial yard 180,000 bbls of storage 10 truck crude w/ expansion available oil dumps Fast-loading for 10 rail cars at once LACT units for inbound pipelines Two 120 unit train loop tracks 9 |
|
|
|
|
|
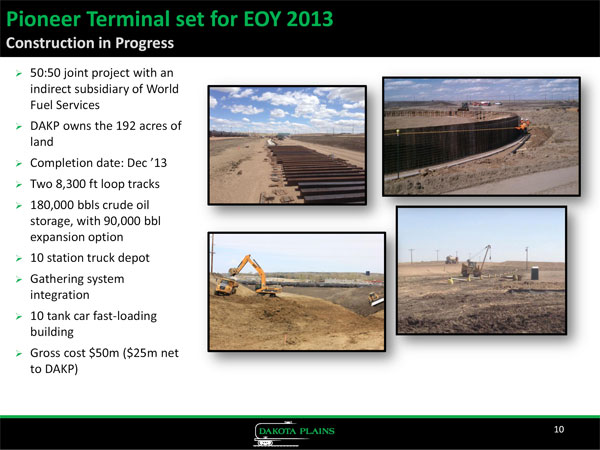
Pioneer
Terminal set for EOY 2013
Construction in Progress ~50:50 joint project with an indirect subsidiary of World Fuel Services DAKP owns the 192 acres of land ~Completion date: Dec ‘13 ~Two 8,300 ft loop tracks 180,000 bbls crude oil storage, with 90,000 bbl expansion option 10 station truck depot Gathering system integration 10 tank car fast-loading building Gross cost $50m ($25m net to DAKP) 10 |
|
|
|
|
|
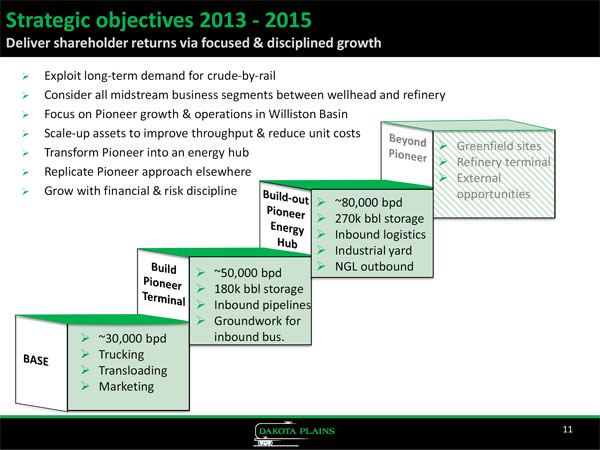
Strategic
objectives 2013 - 2015
Deliver shareholder returns via focused & disciplined growth ~Exploit long-term demand for crude-by-rail ~Consider all midstream business segments between wellhead and refinery Focus on Pioneer growth & operations in Williston Basin Scale-up assets to improve throughput & reduce unit costs ~Greenfield sites Transform Pioneer into an energy hub Refinery terminal Replicate Pioneer approach elsewhere External Grow with financial & risk discipline opportunities 80,000 bpd 270k bbl storage Inbound logistics Industrial yard NGL outbound 50,000 bpd 180k bbl storage Inbound pipelines Groundwork for 30,000 bpd inbound bus. Trucking Transloading Marketing 11 |
|
|
|
|
|
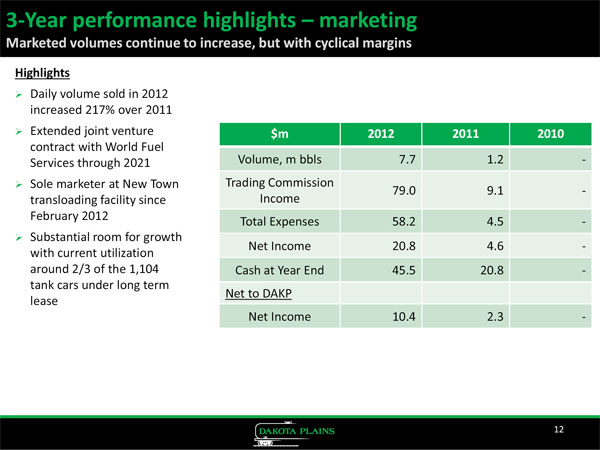
3-Year
performance highlights marketing
Marketed volumes continue to increase, but with cyclical margins Highlights ~Daily volume sold in 2012 increased 217% over 2011 ~Extended joint venture $m 2012 2011 2010 contract with World Fuel Services through 2021 Volume, m bbls 7.7 1.2 - Sole marketer at New Town Trading Commission 79.0 9.1 - transloading facility since Income February 2012 Total Expenses 58.2 4.5 - Substantial room for growth Net Income 20.8 4.6 - with current utilization around 2/3 of the 1,104 Cash at Year End 45.5 20.8 - tank cars under long term Net to DAKP lease Net Income 10.4 2.3 - 12 |
|
|
|
|
|
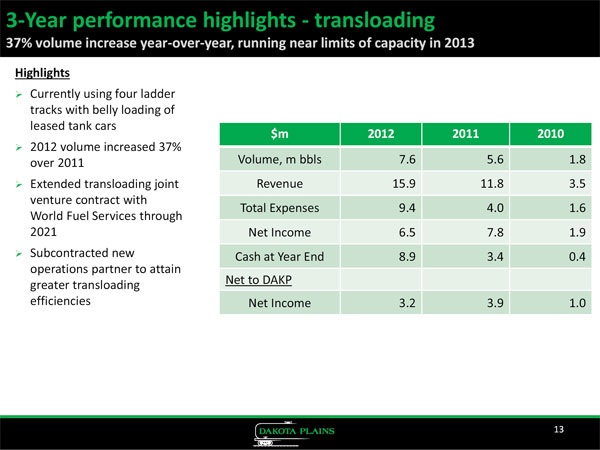
3-Year
performance highlights - transloading
37% volume increase year-over-year, running near limits of capacity in 2013 Highlights ~Currently using four ladder tracks with belly loading of leased tank cars $m 2012 2011 2010 ~2012 volume increased 37% over 2011 Volume, m bbls 7.6 5.6 1.8 Extended transloading joint Revenue 15.9 11.8 3.5 venture contract with Total Expenses 9.4 4.0 1.6 World Fuel Services through 2021 Net Income 6.5 7.8 1.9 Subcontracted new Cash at Year End 8.9 3.4 0.4 operations partner to attain Net to DAKP greater transloading efficiencies Net Income 3.2 3.9 1.0 13 |
|
|
|
|
|
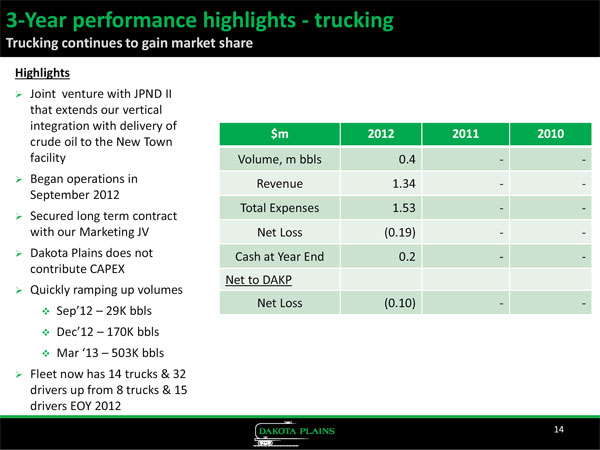
3-Year
performance highlights - trucking
Trucking continues to gain market share Highlights ~Joint venture with JPND II that extends our vertical integration with delivery of $m 2012 2011 2010 crude oil to the New Town facility Volume, m bbls 0.4 - - Began operations in Revenue 1.34 - - September 2012 Total Expenses 1.53 - - Secured long term contract with our Marketing JV Net Loss (0.19) - - Dakota Plains does not Cash at Year End 0.2 - - contribute CAPEX Net to DAKP Quickly ramping up volumes Net Loss (0.10) - - Sep’12 29K bbls Dec’12 170K bbls Mar ‘13 503K bbls Fleet now has 14 trucks & 32 drivers up from 8 trucks & 15 drivers EOY 2012 ~14 |
|
|
|
|
|
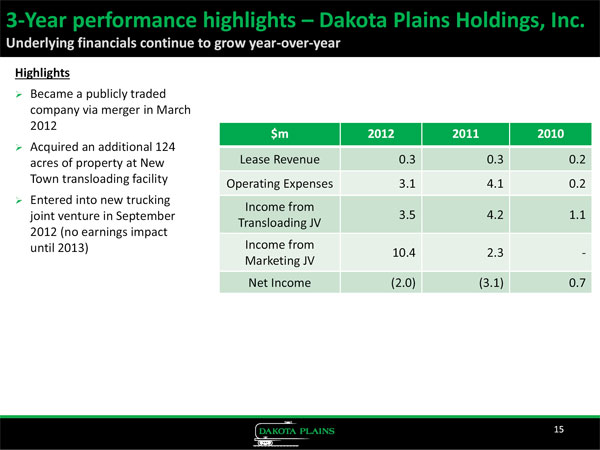
3-Year
performance highlights Dakota Plains Holdings, Inc.
Underlying financials continue to grow year-over-year Highlights ~Became a publicly traded company via merger in March 2012 $m 2012 2011 2010 ~Acquired an additional 124 acres of property at New Lease Revenue 0.3 0.3 0.2 Town transloading facility Operating Expenses 3.1 4.1 0.2 Entered into new trucking Income from joint venture in September 3.5 4.2 1.1 Transloading JV 2012 (no earnings impact until 2013) Income from 10.4 2.3 - Marketing JV Net Income (2.0) (3.1) 0.7 15 |
|
|
|
|
|
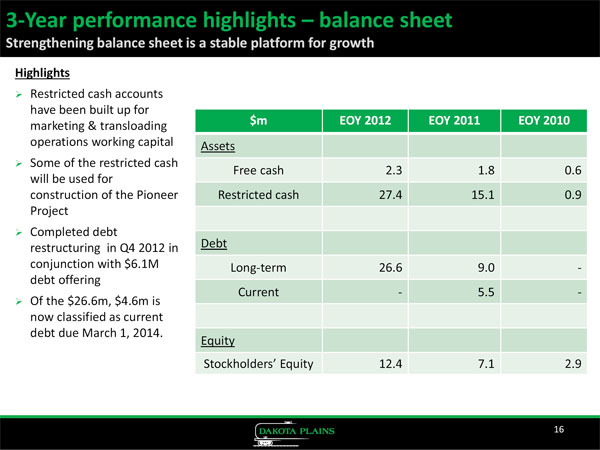
3-Year
performance highlights balance sheet
Strengthening balance sheet is a stable platform for growth Highlights ~Restricted cash accounts have been built up for $m EOY 2012 EOY 2011 EOY 2010 marketing & transloading operations working capital Assets Some of the restricted cash Free cash 2.3 1.8 0.6 will be used for construction of the Pioneer Restricted cash 27.4 15.1 0.9 Project Completed debt restructuring in Q4 2012 in Debt conjunction with $6.1M Long-term 26.6 9.0 - debt offering Current - 5.5 - Of the $26.6m, $4.6m is now classified as current debt due March 1, 2014. Equity Stockholders’ Equity 12.4 7.1 2.9 16 |
|
|
|
|
|
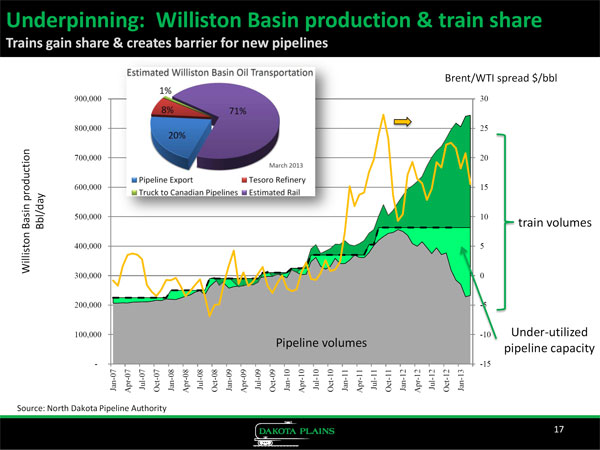
Underpinning:
Williston Basin production & train share
Trains gain share & creates barrier for new pipelines Brent/WTI spread $/bbl ~900,000 30 800,000 25 700,000 20 600,000 15 ~500,000 10 Bbl/day train volumes Williston Basin production 400,000 ~300,000 ~200,000 ~100,000 Under-utilized Pipeline volumes pipeline capacity ~- -15 Jan-07 Apr-07 Jul-07 Oct-07 Jan-08 Apr-08 Jul-08 Oct-08 Jan-09 Apr-09 Jul-09 Oct-09 Jan-10 Apr-10 Jul-10 Oct-10 Jan-11 Apr-11 Jul-11 Oct-11 Jan-12 Apr-12 Jul-12 Oct-12 Jan-13 Source: North Dakota Pipeline Authority 17 |
|
|
|
|
|
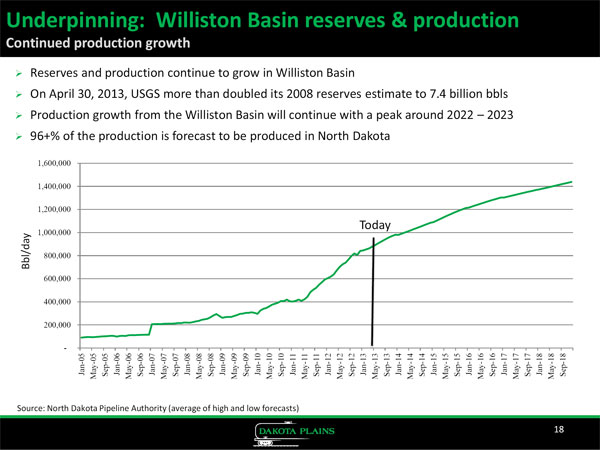
Underpinning:
Williston Basin reserves & production
Continued production growth ~Reserves and production continue to grow in Williston Basin ~On April 30, 2013, USGS more than doubled its 2008 reserves estimate to 7.4 billion bbls Production growth from the Williston Basin will continue with a peak around 2022 2023 96+% of the production is forecast to be produced in North Dakota ~1,600,000 ~1,400,000 ~1,200,000 Today ~1,000,000 Bbl/day 800,000 ~600,000 400,000 200,000 ~- Jan-05 May-05 Sep-05 Jan-06 May-06 Sep-06 Jan-07 May-07 Sep-07 Jan-08 May-08 Sep-08 Jan-09 May-09 Sep-09 Jan-10 May-10 Sep-10 Jan-11 May-11 Sep-11 Jan-12 May-12 Sep-12 Jan-13 May-13 Sep-13 Jan-14 May-14 Sep-14 Jan-15 May-15 Sep-15 Jan-16 May-16 Sep-16 Jan-17 May-17 Sep-17 Jan-18 May-18 Sep-18 Source: North Dakota Pipeline Authority (average of high and low forecasts) 18 |
|
|
|
|
|
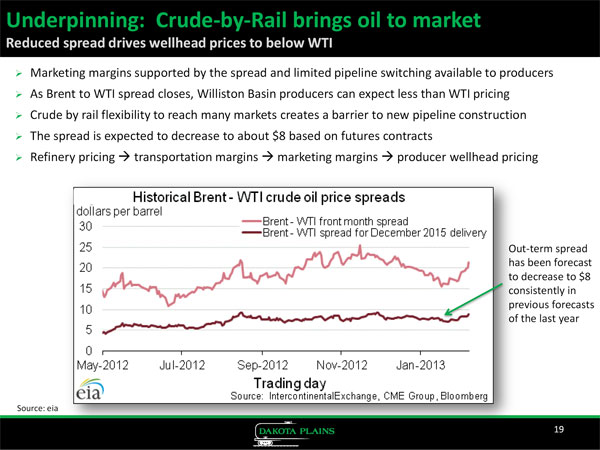
Underpinning:
Crude-by-Rail brings oil to market
Reduced spread drives wellhead prices to below WTI ~Marketing margins supported by the spread and limited pipeline switching available to producers As Brent to WTI spread closes, Williston Basin producers can expect less than WTI pricing Crude by rail flexibility to reach many markets creates a barrier to new pipeline construction The spread is expected to decrease to about $8 based on futures contracts Refinery pricing transportation margins marketing margins producer wellhead pricing Out-term spread has been forecast to decrease to $8 consistently in previous forecasts of the last year Source: eia 19 |
|
|
|
|
|
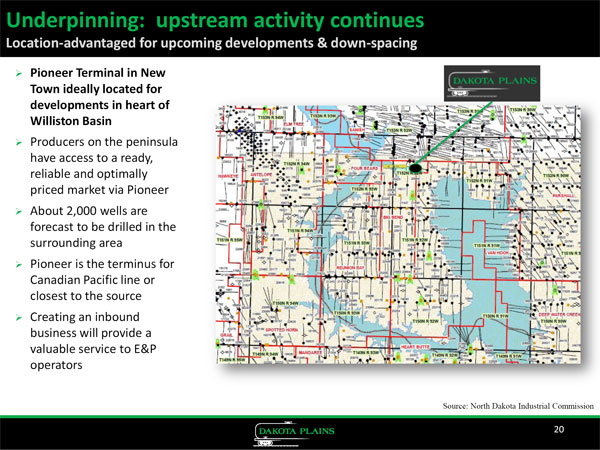
Underpinning:
upstream activity continues
Location-advantaged for upcoming developments & down-spacing ~Pioneer Terminal in New Town ideally located for developments in heart of Williston Basin ~Producers on the peninsula have access to a ready, reliable and optimally priced market via Pioneer About 2,000 wells are forecast to be drilled in the surrounding area Pioneer is the terminus for Canadian Pacific line or closest to the source Creating an inbound business will provide a valuable service to E&P operators ~Source: North Dakota Industrial Commission 20 |
|
|
|
|
|
Conclusions
~Dakota Plains has created a safe, reliable and cost-advantaged crude-by-rail market for oil producers in the heart of the Williston Basin Through the strength of its joint ventures and service agreements, Dakota Plains is poised to grow dramatically in the coming years ~With Pioneer construction underway, the operations will grow from 30,000 barrels per day of capacity to up to 80,000 barrels per day by year-end 2013 Our Pioneer terminal in New Town, ND, has a geographical and logistical advantage in the main fairway of the Bakken & Three Forks; ~Business segments that include trucking, transloading, and marketing today will expand in 2014 to include storage and inbound commodity logistics services to local producers Business and competitive dynamics underpin a consensus industry view that crude-by-rail is a long-term proposition 21 |
|
|
|
|
|
Appendix
|
|
|
|
|
|
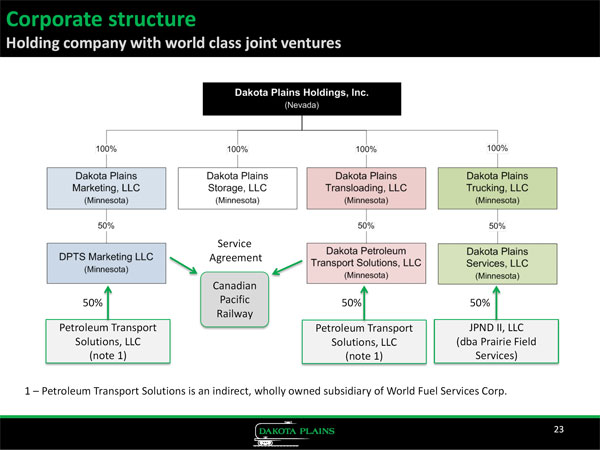
Corporate
structure
Holding company with world class joint ventures Service Agreement Canadian 50% Pacific 50% 50% Railway Petroleum Transport Petroleum Transport JPND II, LLC Solutions, LLC Solutions, LLC (dba Prairie Field (note 1) (note 1) Services) 1 Petroleum Transport Solutions is an indirect, wholly owned subsidiary of World Fuel Services Corp. 23 |
|
|
|
|
|
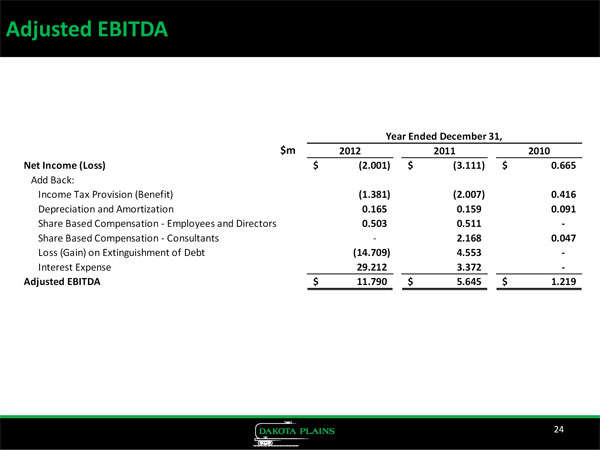
Adjusted
EBITDA
Year Ended December 31, $m 2012 2011 2010 Net Income (Loss) $ (2.001) $ (3.111) $ 0.665 Add Back: Income Tax Provision (Benefit) (1.381) (2.007) 0.416 Depreciation and Amortization 0.165 0.159 0.091 Share Based Compensation - Employees and Directors 0.503 0.511 - Share Based Compensation - Consultants - 2.168 0.047 Loss (Gain) on Extinguishment of Debt (14.709) 4.553 -Interest Expense 29.212 3.372 -Adjusted EBITDA $ 11.790 $ 5.645 $ 1.219 24 |
|
|
|
|
|
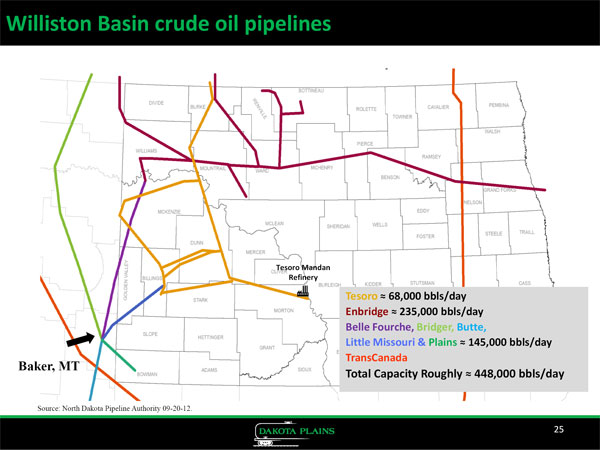
Williston
Basin crude oil pipelines
Tesoro Mandan Refinery Tesoro 68,000 bbls/day Enbridge 235,000 bbls/day Belle Fourche, Bridger, Butte, Little Missouri & Plains 145,000 bbls/day TransCanada Baker, MT Total Capacity Roughly 448,000 bbls/day ~Source: North Dakota Pipeline Authority 09-20-12. 25 |
|
|
|
|
|
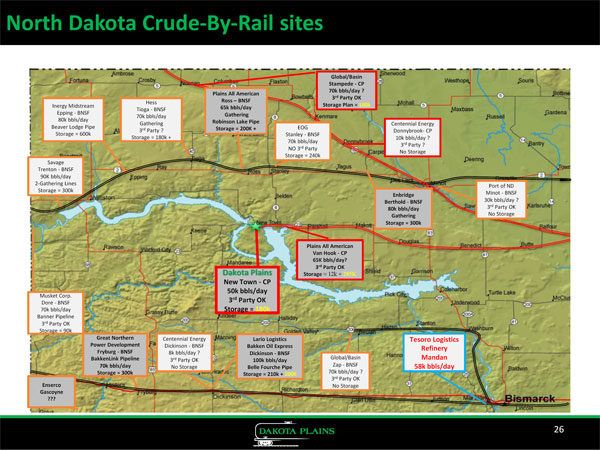
North
Dakota Crude-By-Rail sites
Plains All American Hess Ross BNSF Inergy Midstream 65k bbls/day Tioga - BNSF Epping - BNSF Gathering 70k bbls/day 80k bbls/day Robinson Lake Pipe Gathering Beaver Lodge Pipe Storage = 200K + EOG 3rd Party Storage = 600k Stanley - BNSF Storage = 70k bbls/day NO 3rd Party Storage = 240k Port of ND Enbridge Minot - BNSF Berthold - BNSF 30k bbls/day ? 80k bbls/day 3rd Party OK Gathering No Storage 65K bbls/day? 3rd Party OK Dakota Plains Storage 12k + 285K New Town - CP 50k bbls/day Musket Corp. Dore - BNSF 3rd Party OK 70k bbls/day Storage = 180k Banner Pipeline 3rd Party OK Storage = 90k Great Northern Centennial Energy Lario Logistics Tesoro Logistics Power Development Dickinson - BNSF Bakken Oil Express Refinery Fryburg - BNSF 8k bbls/day ? Dickinson - BNSF BakkenLink Pipeline 3rd Party OK Global/Basin Mandan 100k bbls/day 70k bbls/day No Storage Zap - 58k bbls/day Belle Fourche Pipe Enserco Gascoyne ??? 26 |
|
|
|
|
|
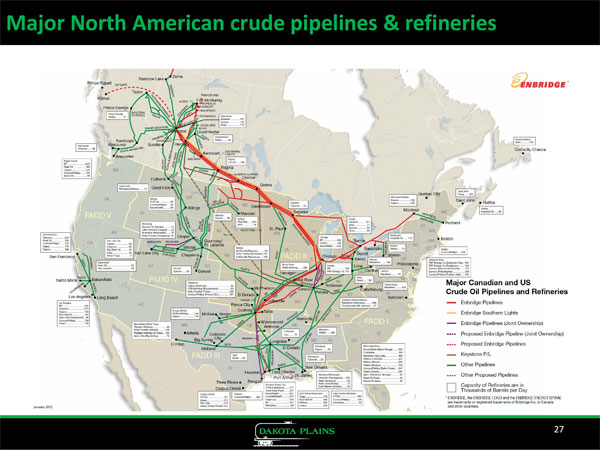
Major
North American crude pipelines & refineries
27 |