Attached files
| file | filename |
|---|---|
| 8-K - FORM 8-K - Independent Bank Group, Inc. | d544116d8k.htm |
 NASDAQ: IBTX
KBW Texas Field Trip
May 2013
Exhibit 99.1 |
 Safe
Harbor Statement 2
From time to time, our comments and releases may contain
“forward-looking statements” within the meaning of the Private Securities Litigation
Reform Act of 1995 (the “Act”). Forward-looking
statements can be identified by words such as “believes,” “anticipates,” “expects,” “forecast,”
“guidance,” “intends,” “targeted,”
“continue,” “remain,” “should,” “may,” “plans,” “estimates,” “will,” “will continue,” “will remain,” variations on
such words or phrases, or similar references to future occurrences or
events in future periods; however, such words are not the exclusive means of
identifying such statements. Examples of forward-looking statements
include, but are not limited to: (i) projections of revenues, expenses, income or
loss, earnings or loss per share, and other financial items; (ii)
statements of plans, objectives, and expectations of Independent Bank Group or its
management or Board of Directors; (iii) statements of future economic
performance; and (iv) statements of assumptions underlying such statements.
Forward-looking statements are based on Independent Bank
Group’s current expectations and assumptions regarding its business, the economy, and
other future conditions. Because forward-looking statements relate
to the future, they are subject to inherent uncertainties, risks, and changes in
circumstances that are difficult to predict. Independent Bank
Group’s actual results may differ materially from those contemplated by the forward-
looking statements, which are neither statements of historical fact nor
guarantees or assurances of future performance. Factors that could cause
actual results to differ from those discussed in the
forward-looking statements include, but are not limited to: (1) local, regional, national, and
international economic conditions and the impact they may have on us
and our customers and our assessment of that impact; (2) volatility and
disruption in national and international financial markets; (3)
government intervention in the U.S. financial system, whether through changes in the
discount rate or money supply or otherwise; (4) changes in the level of
non-performing assets and charge-offs; (5) changes in estimates of future
reserve requirements based upon the periodic review thereof under
relevant regulatory and accounting requirements; (6) adverse conditions in the
securities markets that lead to impairment in the value of securities
in our investment portfolio; (7) inflation, deflation, changes in market interest
rates, developments in the securities market, and monetary
fluctuations; (8) the timely development and acceptance of new products and services
and perceived overall value of these products and services by
customers; (9) changes in consumer spending, borrowings, and savings habits; (10)
technological changes; (11) the ability to increase market share and
control expenses; (12) changes in the competitive environment among banks,
bank holding companies, and other financial service providers; (13) the
effect of changes in laws and regulations (including laws and regulations
concerning taxes, banking, securities, and insurance) with which we and
our subsidiaries must comply; (14) the effect of changes in accounting
policies and practices, as may be adopted by the regulatory agencies,
as well as the Public Company Accounting Oversight Board, the Financial
Accounting Standards Board, and other accounting standard setters; (15)
the costs and effects of legal and regulatory developments including the
resolution of legal proceedings; and (16) our success at managing the
risks involved in the foregoing items and (17) the other factors that are
described in the Company’s Form S-1 Registration Statement, as
amended, which became effective April 2, 2013, under the heading “Risk Factors.”
Any forward-looking statement made by the Company in this release
speaks only as of the date on which it is made. Factors or events that could
cause the Company’s actual results to differ may emerge from time
to time, and it is not possible for the Company to predict all of them. The
Company undertakes no obligation to publicly update any
forward-looking statement, whether as a result of new information, future developments
or otherwise, except as may be required by law.
|
 Company Snapshot
3
Overview
Branch Map
Financial Highlights
•
Headquartered in McKinney, Texas
•
100+ years of operating history
•
30 banking offices in 26 communities
•
Dallas-Fort Worth metropolitan area
•
Greater Austin area
•
Focused on relationship-driven commercial banking
products
(1) Includes IPO proceeds of $86.7 million received April 8, 2013.
(2) Adjusted for C-Corp status. See Appendix for GAAP reconciliation.
Note: Financial data as of and for the quarter ended March 31, 2013.
Balance Sheet ($ in millions)
Total Assets
$1,764
Total Loans
1,422
Total Deposits
1,415
Pro Forma Equity
(1)
211
Pro Forma Equity
(1)
/ Assets
11.55%
Asset Quality
NPAs / Assets
1.35%
NPLs / Loans
0.40
Allowance / NPLs
209.73
Allowance / Loans
0.85
NCO Ratio (annualized)
0.15
Profitability
ROAA
(2)
0.89%
ROAE
(2)
12.43
Net Interest Margin
4.68
Efficiency Ratio
67.5 |
 First Quarter 2013 Highlights
4
•
Organic loan production grew for the twenty-first consecutive quarter.
•
Continued year over year balance sheet growth, reflecting not only organic growth
but also completed strategic acquisitions in the second and fourth quarters
of 2012, with an increase in total assets of $456 million, 34.9%.
•
Net interest margin increased to 4.68% for first quarter 2013 compared to 4.41% for
fourth quarter 2012 and
4.31%
for
first
quarter
2012.
Net
interest
margin,
excluding
the
impact
of
purchase
accounting
accretion, was 4.40% for first quarter 2013 compared to 4.35% for fourth quarter
2012 and 4.29% for first quarter 2012.
•
Average cost of interest bearing deposits declined by 10 basis points from fourth
quarter 2012 and by 37 basis points year over year.
•
The efficiency ratio improved to 67.5% compared to 73.9% for first quarter 2012. On
an adjusted basis, the core efficiency ratio improved to 66.8% for first
quarter 2013 compared to 70.3% for first quarter 2012.
•
Continued strong asset quality, as reflected by an annualized nonperforming assets
to total assets ratio of 1.35% and a nonperforming loans to total loans
ratio of 0.40%. |
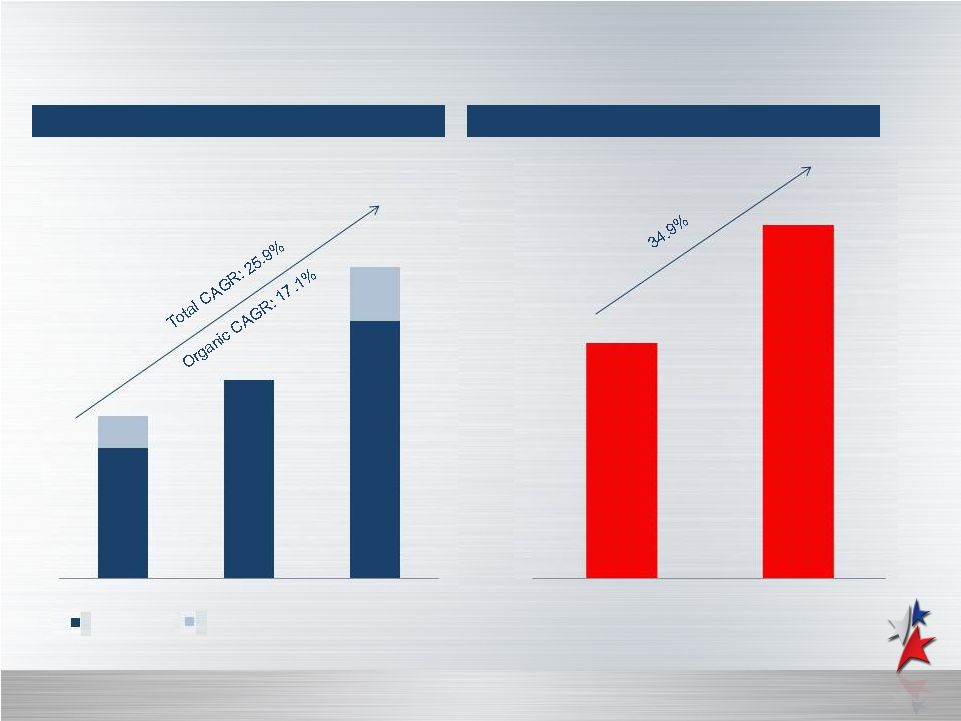 Demonstrated Growth
5
Total Assets Prior Years
Total Assets Q1 2013 v. Q1 2012
Note: Dollars in millions.
Total Assets Prior Years
Note: Dollars in millions.
$1,098
$1,254
$1,740
2010
2011
2012
Organic Growth
Impact of Acquisitions (In Year Acquired)
Q1 2012
Q1 2013
$1,764
$1,308 |
 Expanded Profitability
6
Core Pre-Tax Pre-Provision Earnings Income
(1)
Net Interest Margin
(1)
(1) Net interest margin adjusted to exclude accretion on acquired loans is 4.43%,
4.37%, 4.39% and 4.40% for 2010, 2011, 2012, and Q1 2013, respectively. (2)
See Appendix for reconciliation of GAAP and adjusted measures. Note: Dollars
in thousands. Core Efficiency Ratio
(2) |
 Continued Improvement in Deposit
Pricing
7
Deposit Composition at 3/31/13
Deposit Growth versus Average Rate
(1)
Rate on Interest-Bearing Deposits: 0.61%
(1) Annual average rate for total deposits.
Note: Dollars in millions. Financial data as of and for years ended through 2012
and YTD for 2013. |
 Solid Capital for Continued Growth
8
(dollars in thousands, except per share data)
As of March 31, 2013
Actual
As Adjusted
(1)
Stockholders' Equity
Common Stock, $0.01 Par Value
$83
$120
Additional Paid-In Capital
88,973
209,225
Retained Earnings
33,624
-
Treasury Stock, at Cost (8,647 Shares)
(232)
(232)
Accumulated Other Comprehensive Income
1,694
1,694
Total Stockholders' Equity
$124,142
$210,807
Capital Ratios
Tier 1 Capital to Average Assets
6.29%
11.33%
Tier 1 Capital to Risk-Weighted Assets
(2)
8.01
14.43
Total Capital to Risk-Weighted Assets
10.20
15.82
Total Equity to Assets
7.04
11.55
Tangible Common Equity to Tangible Assets
(2)
5.33
9.98
Per Share Data
Book Value
$15.01
$17.64
Tangible Book Value
(2)
11.16
14.98
(1) On an as adjusted basis after giving effect to (i) the receipt of
the net proceeds from the initial public offering on April 8, 2012 of 3.680 million shares of its common stock at an offering price of $26.00 per share,
after deducting the underwriting discounts and commissions and the offering expenses
payable by Independent ; (ii) repayment of $12.3 million of senior secured notes and $13.1 million of subordinated
debentures; and (iii) the reclassification of undistributed S corporation earnings of
$33.6 million from retained earnings to additional paid-in capital as a result of the Independent’s conversion to a C corporation.
(2) See Appendix for GAAP reconciliation. |
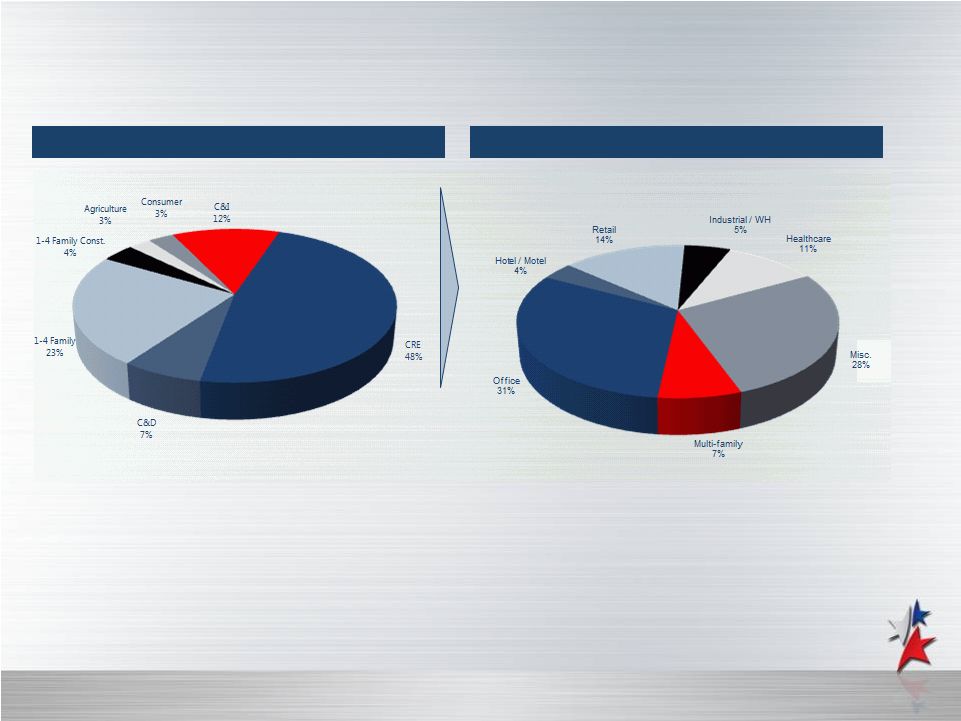 Diversified Loan Portfolio
9
Loan Composition at 3/31/13
CRE Loan Composition at 3/31/13
Q1 2013 Yield on Loans: 6.03%
Net of Acquired Loan Accretion: 5.72%
52% of CRE Loans are Owner-Occupied
Loan Composition at 3/31/13
CRE Loan Composition at 3/31/13 |
 Strong Credit Culture
10
NPLs / Loans
N
NPLs / Loans
NCOs / Average Loans
Source: U.S. and Texas Commercial Bank numbers from SNL Financial. Note: Prior year financial data as of and
for years ended, current year financial data as of and for the quarter ended 3/31/13. Q1 2013 charge-off information has been annualized. |
 APPENDIX
11 |
 Reconciliation of GAAP and Adjusted
Measures
12
($ in thousands)
2010
2011
2012
2012
2013
Net Interest Income -
Reported
$38,065
$46,281
$58,553
$12,302
$18,215
(a)
Income recognized on acquired loans
(45)
(477)
(233)
(58)
(1,068)
(b)
Net interest income less accretion on acquired loans
$38,020
$45,804
$58,320
$12,244
$17,147
(a + b = c)
Provision Expense -
Reported
$4,043
$1,650
$3,184
$575
$1,030
(d)
Noninterest Income -
Reported
(e)
Bargain Purchase Loss / (Gain)
($6,692)
$0
$0
$0
$0
Loss / (Gain) on Sale of Branch
0
0
(38)
0
0
Loss / (Gain) on Sale of OREO
(136)
(918)
(1,135)
53
(25)
Loss / (Gain) on Sale of Securities
0
0
3
3
0
Loss / (Gain) on Sale of PP&E
(1)
(21)
343
(1)
(1)
Adjusted Noninterest Income
$5,327
$6,769
$8,341
$1,946
$2,400
(f)
Noninterest Expense -
Reported
$33,062
$38,639
$47,160
$10,494
$13,923
(g)
Adriatica Expenses
$0
($871)
($832)
($300)
($197)
OREO Impairment
(805)
(184)
(94)
0
(541)
Acquisition Expense
(668)
0
(1,401)
(216)
(137)
Adjusted Noninterest Expense
$31,589
$37,584
$44,833
$9,978
$13,048
(h)
Pre-Tax Pre-Provision Earnings
$17,159
$15,350
$20,561
$3,699
$6,718
(a) + (e) -
(g)
Core Pre-Tax Pre-Provision Earnings
$11,758
$14,989
$21,828
$4,212
$6,499
(c) + (f) -
(h)
Reported Efficiency Ratio
65.8%
71.6%
69.6%
73.9%
67.5%
(g) / (a + e)
Adjusted Efficiency Ratio
72.9%
71.5%
67.3%
70.3%
66.8%
(h) / (c + f)
Year Ended December 31,
Quarter Ended March 31,
$2,426
$12,156
$7,708
$9,168
$1,891 |
 Reconciliation of GAAP and Adjusted
Measures
13
($ in thousands)
2010
2011
2012
2012
2013
Net Income -
Reported
$13,116
$13,700
$17,377
$3,124
$5,688
Effective Tax Rate
33.1%
31.7%
30.1%
30.1%
32.8%
Pro Forma Net Income
$8,775
$9,357
$12,147
$2,184
$3,822
Average Assets
$969,322
$1,180,693
$1,487,614
$1,271,901
$1,733,924
Average Stockholders' Equity
$68,350
$78,922
$105,055
$91,776
$124,731
Pro Forma ROAA
0.91%
0.79%
0.82%
0.70%
0.89%
Pro Forma ROAE
12.84%
11.86%
11.56%
9.65%
12.43%
Year Ended December 31,
Quarter Ended March 31, |
 ($ in thousands,
except per share data) As of
3/31/2013
Total Stockholders' Equity
$124,142
Goodwill
(28,742)
Core Deposit Intangibles
(3,075)
Tangible Common Equity
$92,325
Common Shares Outstanding
8,269,707
Book Value per Share
$15.01
Tangible Book Value per Share
$11.16
Reconciliation of GAAP and Adjusted
Measures
14
($ in thousands)
As of
3/31/2013
Total Stockholders' Equity
$124,142
Unrealized Gain on AFS Securities
(1,694)
Goodwill
(28,742)
Other Intangibles
(3,075)
Qualifying Restricted Core Capital
17,600
Tier 1 Capital
$108,231
Risk-Weighted Assets
On Balance Sheet
$1,339,808
Off Balance Sheet
10,623
Total Risk-Weighted Assets
$1,350,431
Tier 1 Capital to Risk-Weighted Capital Ratio
8.01% |
 Contact Information
15
Corporate Headquarters
Analysts/Investors:
Independent Bank
Torry Berntsen
1600 Redbud Blvd
President and Chief Operating Officer
McKinney, TX 75069
(972) 562-9004
tberntsen@independent-bank.com
972-562-9004 Telephone
972-562-7734 Fax
Michelle Hickox
independent-bank.com
Chief Financial Officer
(972) 562-9004
mhickox@independent-bank.com
Media:
Eileen Ponce
(469) 742-9437
eponce@independent-bank.com |