Attached files
| file | filename |
|---|---|
| 8-K - 8-K - ASSOCIATED BANC-CORP | d543391d8k.htm |
Exhibit 99.1
Associated
Associated Banc-Corp Investor Presentation
Second Quarter 2013
Forward-Looking Statements
Important note regarding forward-looking statements:
Statements made in this presentation which are not purely historical are forward-looking statements, as defined in the Private Securities Litigation Reform Act of 1995. This includes any statements regarding management’s plans, objectives, or goals for future operations, products or services, and forecasts of its revenues, earnings, or other measures of performance. Such forward-looking statements may be identified by the use of words such as “believe”, “expect”, “anticipate”, “plan”, “estimate”, “should”, “will”, “intend”,
“outlook”, or similar expressions. Forward-looking statements are based on current management expectations and, by their nature, are subject to risks and uncertainties. Actual results may differ materially from those contained in the forward-looking statements. Factors which may cause actual results to differ materially from those contained in such forward-looking statements include those identified in the company’s most recent Form 10-K and subsequent SEC filings. Such factors are incorporated herein by reference.
1
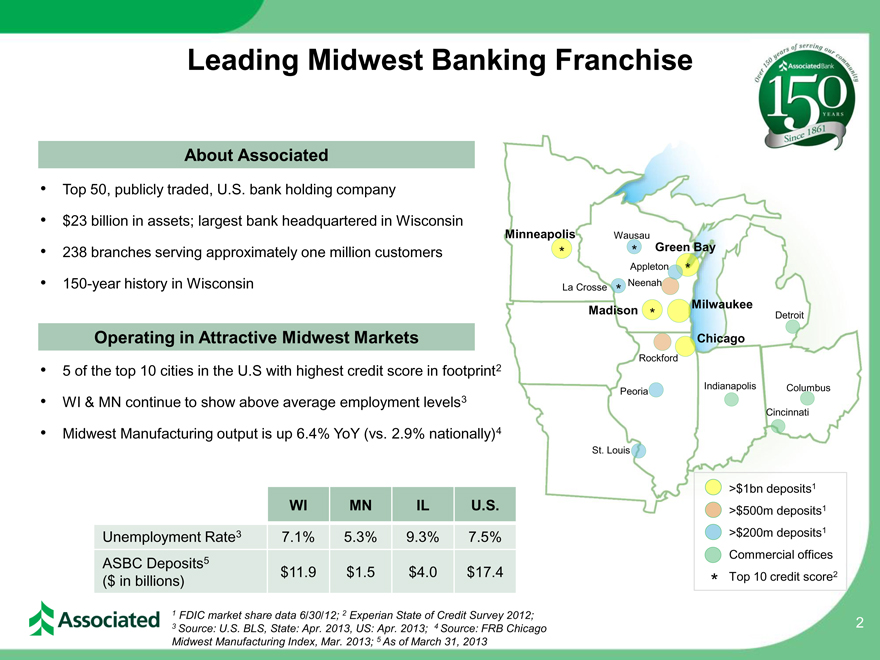
Leading Midwest Banking Franchise
About Associated
• Top 50, publicly traded, U.S. bank holding company
• $23 billion in assets; largest bank headquartered in Wisconsin
Minneapolis Wausau
• 238 branches serving approximately one million customers * * Green Bay
Appleton *
• 150-year history in Wisconsin Neenah
La Crosse *
Milwaukee
Madison * Detroit
Operating in Attractive Midwest Markets Chicago
Rockford
• 5 of the top 10 cities in the U.S with highest credit score in footprint
Indianapolis Columbus
WI & MN continue to show above employment levels3 Peoria
• average Cincinnati
• Midwest Manufacturing output is up 6.4% YoY (vs. 2.9% nationally)4
St. Louis
>$1bn deposits1
WI MN IL U.S.
>$500m deposits1
Unemployment Rate3 7.1% 5.3% 9.3% 7.5% >$200m deposits1
Commercial offices
ASBC Deposits5 $11.9 $1.5 $4.0 $17.4
($ in billions) * Top 10 credit score2
1 FDIC market share data 6/30/12; 2 Experian State of Credit Survey 2012;
3 Source: U.S. BLS, State: Apr. 2013, US: Apr. 2013; 4 Source: FRB Chicago 2 Midwest Manufacturing Index, Mar. 2013; 5 As of March 31, 2013
2
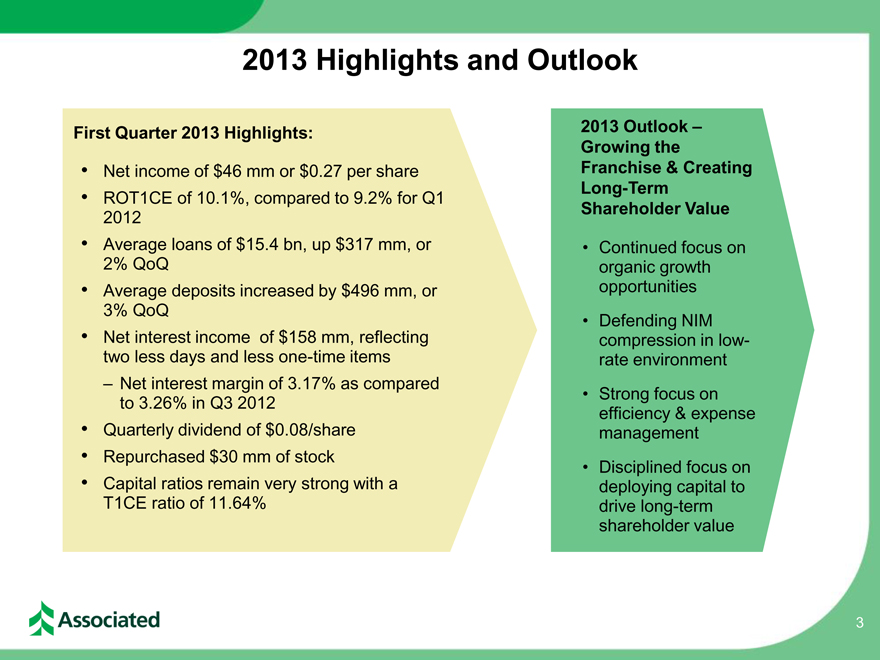
2013 Highlights and Outlook
First Quarter 2013 Highlights: 2013 Outlook –
Growing the
• Net income of $46 mm or $0.27 per share Franchise & Creating
• ROT1CE of 10.1%, compared to 9.2% for Q1 Long-Term
2012 Shareholder Value
• Average loans of $15.4 bn, up $317 mm, or • Continued focus on
2% QoQ organic growth
• Average deposits increased by $496 mm, or opportunities
3% QoQ • Defending NIM
• Net interest income of $158 mm, reflecting compression in low-
two less days and less one-time items rate environment
– Net interest margin of 3.17% as compared
to 3.26% in Q3 2012 • Strong focus on
efficiency & expense
• Quarterly dividend of $0.08/share management
• Repurchased $30 mm of stock • Disciplined focus on
• Capital ratios remain very strong with a deploying capital to
T1CE ratio of 11.64% drive long-term
shareholder value
3
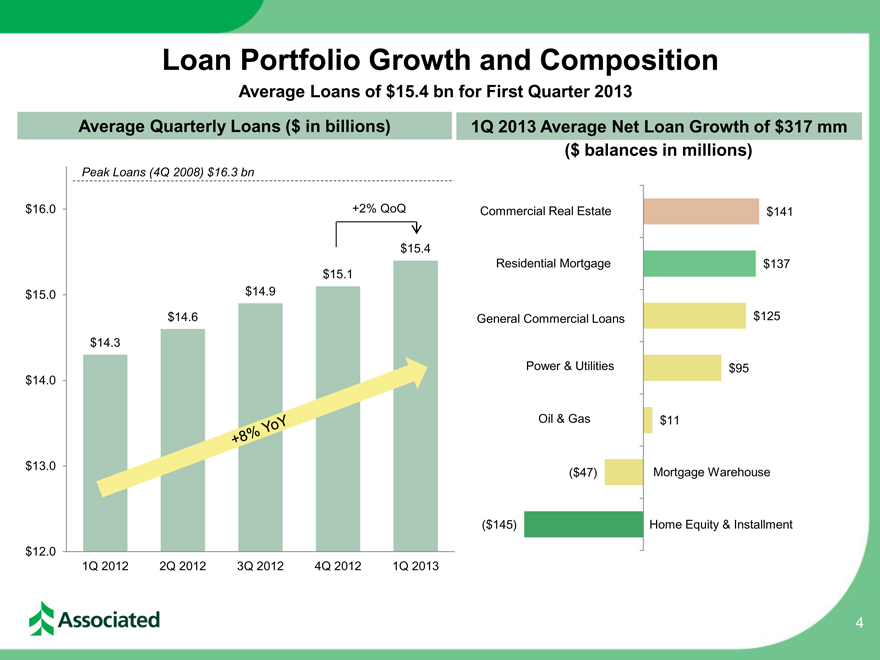
Loan Portfolio Growth and Composition
Average Loans of $15.4 bn for First Quarter 2013
Average Quarterly Loans ($ in billions) 1Q 2013 Average Net Loan Growth of $317 mm
($ balances in millions)
Peak Loans (4Q 2008) $16.3 bn
$16.0 +2% QoQ Commercial Real Estate $141
$15.4
Residential Mortgage $137
$15.1
$15.0 $14.9
$ 14.6 General Commercial Loans $125
$ 14.3
Power & Utilities $95
$14.0
Oil & Gas $11
$13.0 ($47) Mortgage Warehouse
($145) Home Equity & Installment
$12.0
1Q 2012 2Q 2012 3Q 2012 4Q 2012 1Q 2013
4
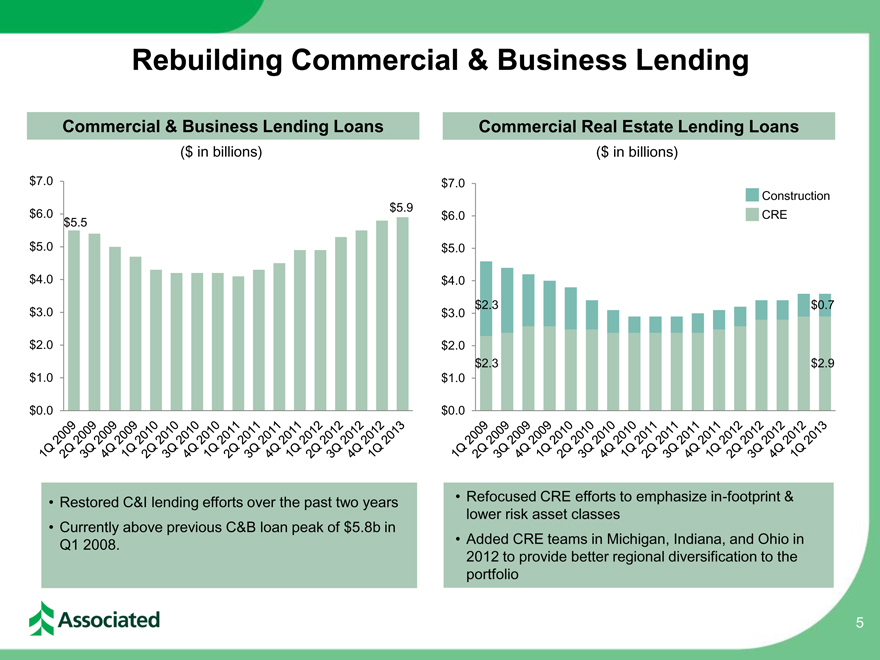
Rebuilding Commercial & Business Lending
Commercial & Business Lending Loans Commercial Real Estate Lending Loans
($ in billions) ($ in billions)
$7.0 $7.0
Construction
$5.9
$6.0 $6.0 CRE
$5.5
$5.0 $5.0
$4.0 $4.0
$3.0 $3.0 $ 2.3 $0.7
$2.0 $2.0
$ 2.3 $2.9
$1.0 $1.0
$0.0 $0.0
• Restored C&I lending efforts over the past two years • Refocused CRE efforts to emphasize in-footprint &
lower risk asset classes
• Currently above previous C&B loan peak of $5.8b in
Q1 2008. • Added CRE teams in Michigan, Indiana, and Ohio in
2012 to provide better regional diversification to the
portfolio
1Q 2009 2Q 2009 3Q 2009 1Q 2009
1Q 2010 2Q 2010 3Q 2010 1Q 2010
1Q 2011 2Q 2011 3Q 2011 1Q 2011
1Q 2012 2Q 2012 3Q 2012 1Q 2012
1Q 2013
1Q 2009 2Q 2009 3Q 2009 1Q 2009
1Q 2010 2Q 2010 3Q 2010 1Q 2010
1Q 2011 2Q 2011 3Q 2011 1Q 2011
1Q 2012 2Q 2012 3Q 2012 1Q 2012
1Q 2013
5
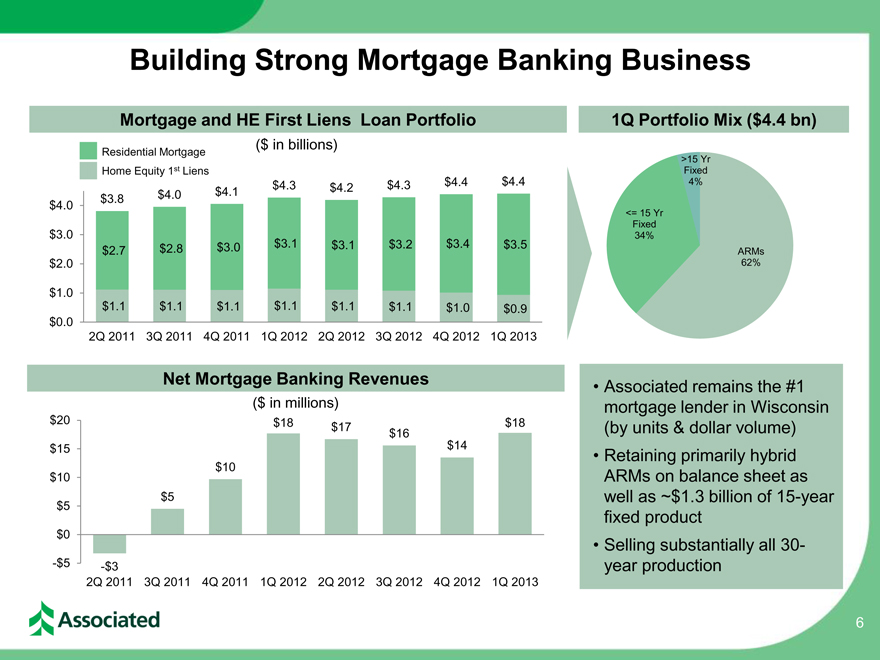
Building Strong Mortgage Banking Business
Mortgage and HE First Liens Loan Portfolio 1Q Portfolio Mix ($4.4 bn)
Residential Mortgage ($ in billions)
>15 Yr
Home Equity 1st Liens Fixed
$4.0 $4.1 $4.3 $4.2 $4.3 $4.4 $4.4 4%
$4.0 $3.8
<= 15 Yr
Fixed
$3.0 34%
$3.1
$2.7 $2.8 $3.0 $3.1 $3.2 $3.4 $3.5 ARMs
$2.0 62%
$1.0
$1.1 $1.1 $1.1 $1.1 $1.1 $1.1 $1.0 $0.9
$0.0
2Q 2011 3Q 2011 4Q 2011 1Q 2012 2Q 2012 3Q 2012 4Q 2012 1Q 2013
Net Mortgage Banking Revenues • Associated remains the #1
($ in millions) mortgage lender in Wisconsin
$20 $18 $17 $18 (by units & dollar volume)
$16
$15 $14 • Retaining primarily hybrid
$10
$10 ARMs on balance sheet as
$5 $5 well as ~$1.3 billion of 15-year
fixed product
$0
• Selling substantially all 30-
-$5 -$3 year production
2Q 2011 3Q 2011 4Q 2011 1Q 2012 2Q 2012 3Q 2012 4Q 2012 1Q 2013
6
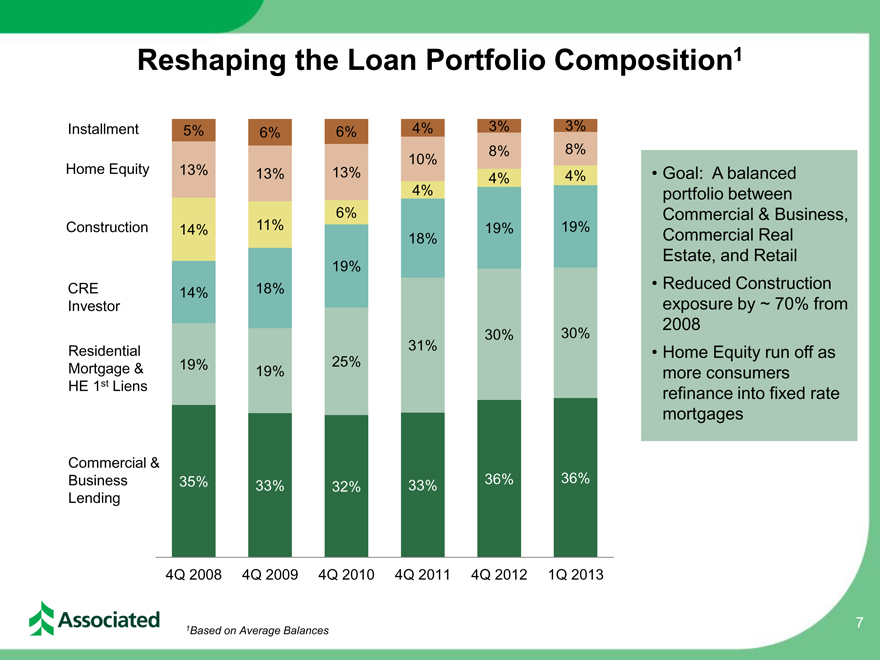
Reshaping the Loan Portfolio Composition1
Installment 5% 6% 6% 4% 3% 3%
10% 8% 8%
Home Equity 13% 13% 13% 4% 4% • Goal: A balanced
4% portfolio between
6% Commercial & Business,
Construction 14% 11% 18% 19% 19% Commercial Real
Estate, and Retail
19%
CRE 14% 18% • Reduced Construction
Investor exposure by ~ 70% from
30% 30% 2008
Residential 31% • Home Equity run off as
Mortgage & 19% 19% 25% more consumers
HE 1st Liens refinance into fixed rate
mortgages
Commercial &
Business 35% 33% 32% 33% 36% 36%
Lending
4Q 2008 4Q 2009 4Q 2010 4Q 2011 4Q 2012 1Q 2013
1Based on Average Balances 7
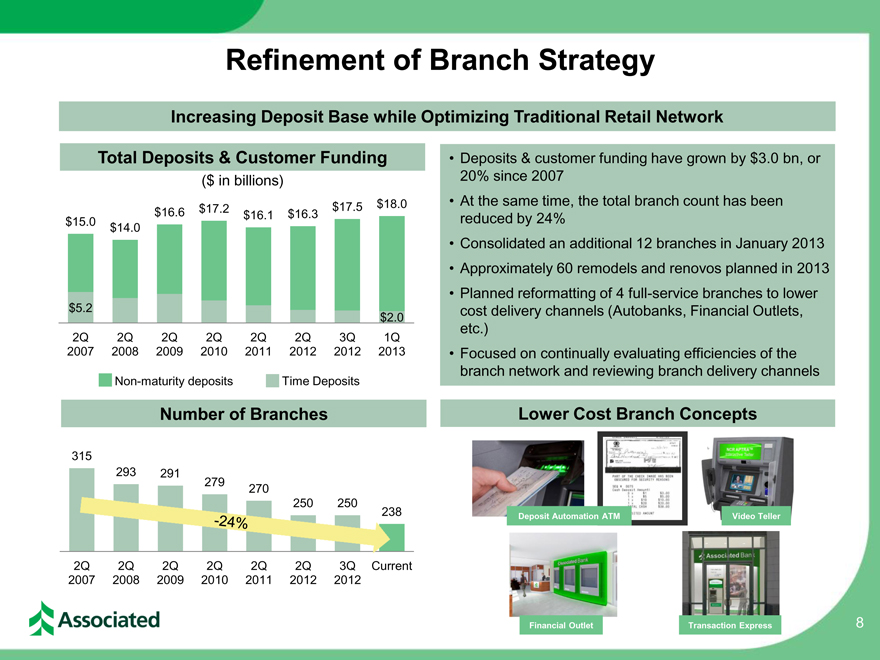
Refinement of Branch Strategy
Increasing Deposit Base while Optimizing Traditional Retail Network
Total Deposits & Customer Funding • Deposits & customer funding have grown by $3.0 bn, or
($ in billions) 20% since 2007
$16.6 $17.2 $17.5 $18.0 • At the same time, the total branch count has been
$15.0 $16.1 $16.3 reduced by 24%
$14.0
• Consolidated an additional 12 branches in January 2013
• Approximately 60 remodels and renovos planned in 2013
• Planned reformatting of 4 full-service branches to lower
$5.2 cost delivery channels (Autobanks, Financial Outlets,
$2.0
etc.)
2Q 2Q 2Q 2Q 2Q 2Q 3Q 1Q
2007 2008 2009 2010 2011 2012 2012 2013 • Focused on continually evaluating efficiencies of the
branch network and reviewing branch delivery channels
Non-maturity deposits Time Deposits
Number of Branches Lower Cost Branch Concepts
315
293 291
279 270
Deposit Automation ATM Video Teller
2Q 2Q 2Q 2Q 2Q 2Q 3Q Current
2007 2008 2009 2010 2011 2012 2012
Financial Outlet Transaction Express 8
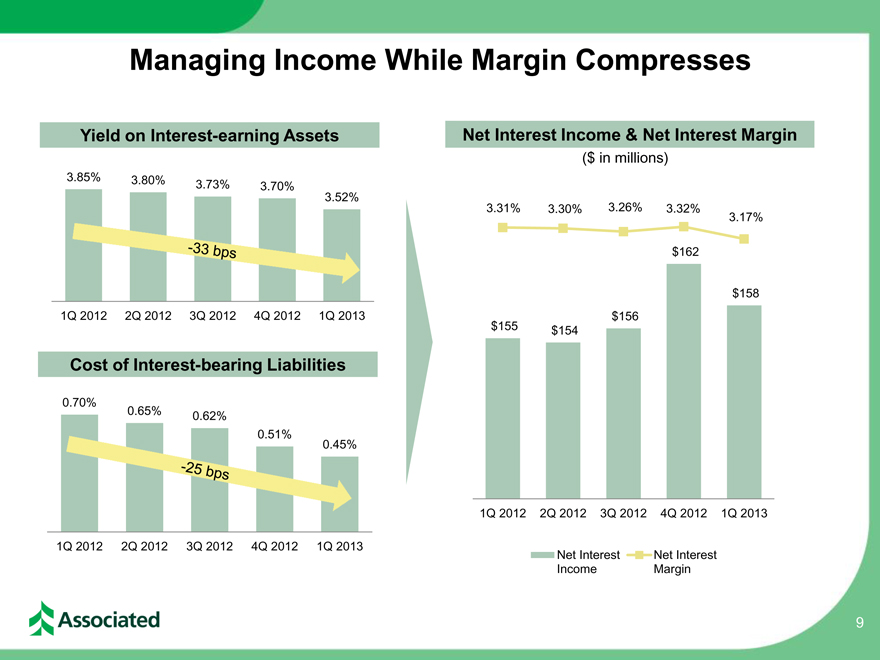
Managing Income While Margin Compresses
Yield on Interest-earning Assets Net Interest Income & Net Interest Margin
($ in millions)
4.00%
3.85% 3.80% 3.73% 3.70%
3.52% $168
3.31% 3.30% 3.26% 3.32% 3.17% 3.50%
$164
$162 3.00%
$160
$158 2.50%
1Q 2012 2Q 2012 3Q 2012 4Q 2012 1Q 2013 $156
$156 $155
$154 2.00%
Cost of Interest-bearing Liabilities $152
1.50%
0.70%
0.65% 0.62% 0.51% 0.45% $148 1.00%
$144 0.50%
$140 0.00%
1Q 2012 2Q 2012 3Q 2012 4Q 2012 1Q 2013
1Q 2012 2Q 2012 3Q 2012 4Q 2012 1Q 2013
Net Interest Net Interest
Income Margin
9
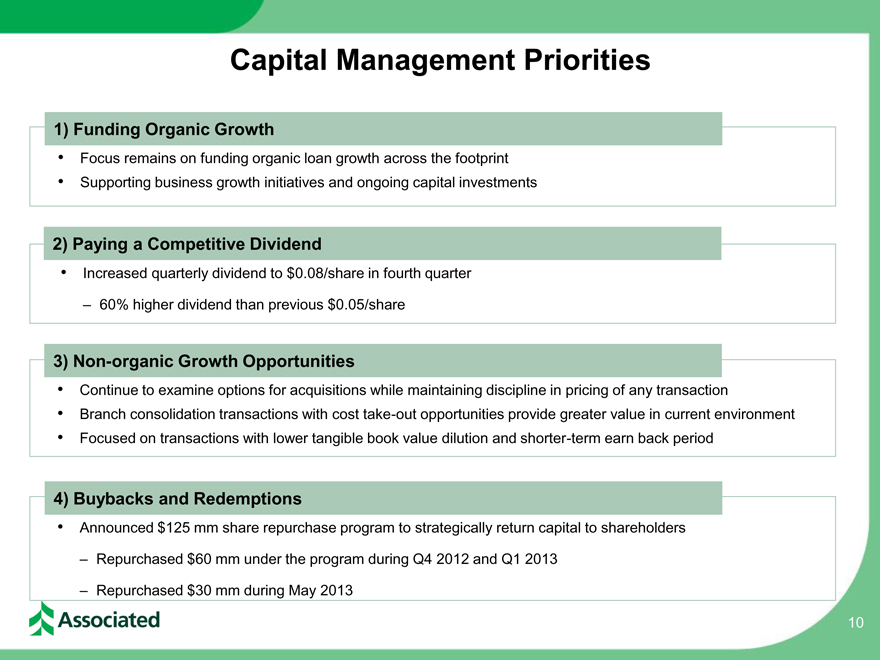
Capital Management Priorities
1) Funding Organic Growth
• Focus remains on funding organic loan growth across the footprint
• Supporting business growth initiatives and ongoing capital investments
2) Paying a Competitive Dividend
• Increased quarterly dividend to $0.08/share in fourth quarter
– 60% higher dividend than previous $0.05/share
3) Non-organic Growth Opportunities
• Continue to examine options for acquisitions while maintaining discipline in pricing of any transaction
• Branch consolidation transactions with cost take-out opportunities provide greater value in current environment
• Focused on transactions with lower tangible book value dilution and shorter-term earn back period
4) Buybacks and Redemptions
• Announced $125 mm share repurchase program to strategically return capital to shareholders
– Repurchased $60 mm under the program during Q4 2012 and Q1 2013
Repurchased $30 mm during May 2013
10
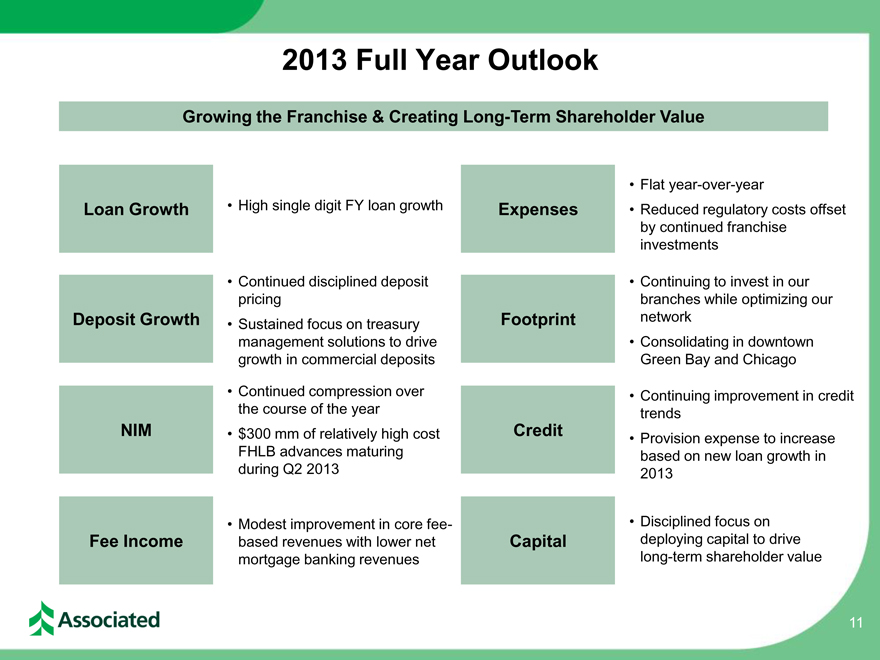
2013 Full Year Outlook
Growing the Franchise & Creating Long-Term Shareholder Value
• Flat year-over-year
Loan Growth • High single digit FY loan growth Expenses • Reduced regulatory costs offset
by continued franchise
investments
• Continued disciplined deposit • Continuing to invest in our
pricing branches while optimizing our
Deposit Growth • Sustained focus on treasury Footprint network
management solutions to drive • Consolidating in downtown
growth in commercial deposits Green Bay and Chicago
• Continued compression over • Continuing improvement in credit
the course of the year trends
NIM • $300 mm of relatively high cost Credit • Provision expense to increase
FHLB advances maturing based on new loan growth in
during Q2 2013 2013
• Modest improvement in core fee- • Disciplined focus on
Fee Income based revenues with lower net Capital deploying capital to drive
mortgage banking revenues long-term shareholder value
11
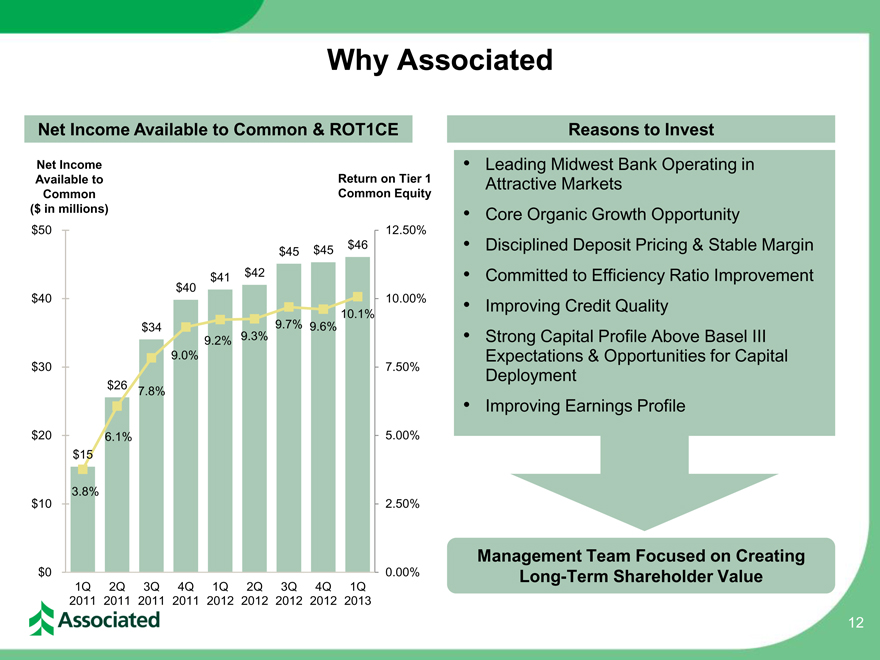
Why Associated
Net Income Available to Common & ROT1CE Reasons to Invest
Net Income • Leading Midwest Bank Operating in
Available to Return on Tier 1 Attractive Markets
Common Common Equity
($ in millions) • Core Organic Growth Opportunity
$50 12.50%
$45 $45 $46 • Disciplined Deposit Pricing & Stable Margin
$41 $42 • Committed to Efficiency Ratio Improvement
$40
$40 10.00% • Improving Credit Quality
10.1%
34 9.7% 9.6%
$ 9.2% 9.3% • Strong Capital Profile Above Basel III
9.0% Expectations & Opportunities for Capital
$30 7.50% Deployment
$26 7.8%
• Improving Earnings Profile
$20 6.1% 5.00%
$15
3.8%
$10 2.50%
Management Team Focused on Creating
$0 0.00% Long-Term Shareholder Value
1Q 2Q 3Q 4Q 1Q 2Q 3Q 4Q 1Q
2011 2011 2011 2011 2012 2012 2012 2012 2013
12
Associated Banc-Corp will be the most admired Midwestern financial services company, distinguished by sound, value-added financial solutions with personal service for our customers, built upon a strong commitment to our colleagues and the communities we serve, resulting in exceptional value for our shareholders.
Appendix
14
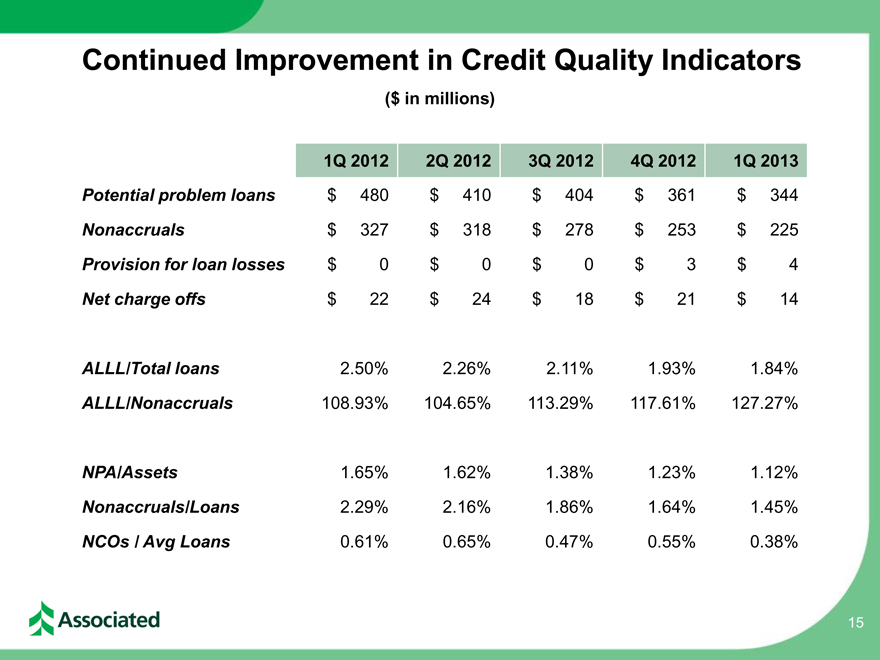
Continued Improvement in Credit Quality Indicators
($ in millions)
1Q 2012 2Q 2012 3Q 2012 4Q 2012 1Q 2013
Potential problem loans $ 480 $ 410 $ 404 $ 361 $ 344
Nonaccruals $ 327 $ 318 $ 278 $ 253 $ 225
Provision for loan losses $ 0 $ 0 $ 0 $ 3 $ 4
Net charge offs $ 22 $ 24 $ 18 $ 21 $ 14
ALLL/Total loans 2.50% 2.26% 2.11% 1.93% 1.84%
ALLL/Nonaccruals 108.93% 104.65% 113.29% 117.61% 127.27%
NPA/Assets 1.65% 1.62% 1.38% 1.23% 1.12%
Nonaccruals/Loans 2.29% 2.16% 1.86% 1.64% 1.45%
NCOs / Avg Loans 0.61% 0.65% 0.47% 0.55% 0.38%
15
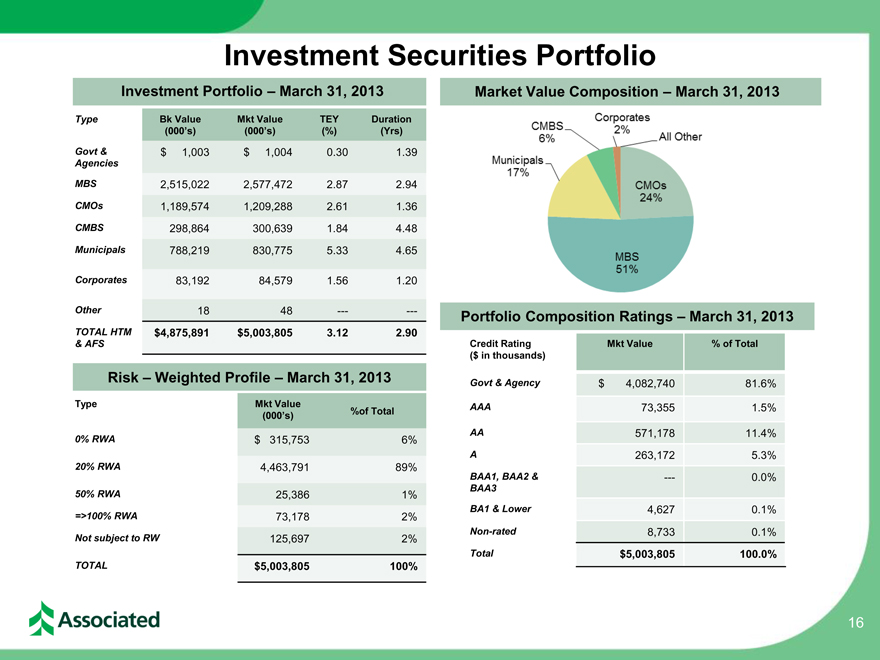
Investment Securities Portfolio
Investment Portfolio – March 31, 2013 Market Value Composition – March 31, 2013
Municipals 17% CMBS 6% Corporates 2% All Other CMOs 24% MBS 51%
Type Bk Value Mkt Value TEY Duration
(000’s) (000’s) (%) (Yrs)
Govt & $ 1,003 $ 1,004 0.30 1.39
Agencies
MBS 2,515,022 2,577,472 2.87 2.94
CMOs 1,189,574 1,209,288 2.61 1.36
CMBS 298,864 300,639 1.84 4.48
Municipals 788,219 830,775 5.33 4.65
Corporates 83,192 84,579 1.56 1.20
Other 18 48 —- —- Portfolio Composition Ratings – March 31, 2013
TOTAL HTM $4,875,891 $5,003,805 3.12 2.90
& AFS Credit Rating Mkt Value % of Total
($ in thousands)
Risk – Weighted Profile – March 31, 2013 Govt & Agency $ 4,082,740 81.6%
Type Mkt Value %of Total AAA 73,355 1.5%
(000’s)
0% RWA $ 315,753 6% AA 571,178 11.4%
A 263,172 5.3%
20% RWA 4,463,791 89%
BAA1, BAA2 & —- 0.0%
50% RWA 25,386 1% BAA3
=>100% RWA 73,178 2% BA1 & Lower 4,627 0.1%
Not subject to RW 125,697 2% Non-rated 8,733 0.1%
Total $5,003,805 100.0%
TOTAL $5,003,805 100%
16
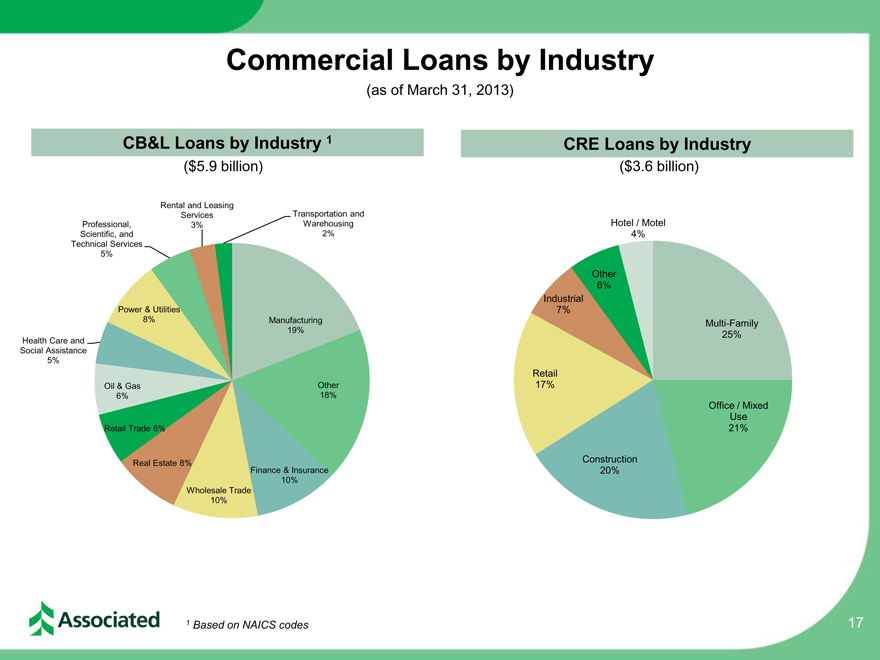
Commercial Loans by Industry
(as of March 31, 2013)
CB&L Loans by Industry 1 CRE Loans by Industry
($5.9 billion) ($3.6 billion)
Rental and Leasing
Services Transportation and
Professional, 3% Warehousing Hotel / Motel
Scientific, and 2% 4%
Technical Services
5%
Other
6%
Industrial
Power & Utilities 7%
8% Manufacturing Multi-Family
19% 25%
Health Care and
Social Assistance
5%
Retail
Oil & Gas Other 17%
6% 18%
Office / Mixed
Use
Retail Trade 6% 21%
Real Estate 8% Construction
Finance & Insurance 20%
10%
Wholesale Trade
10%
1 Based on NAICS codes 17
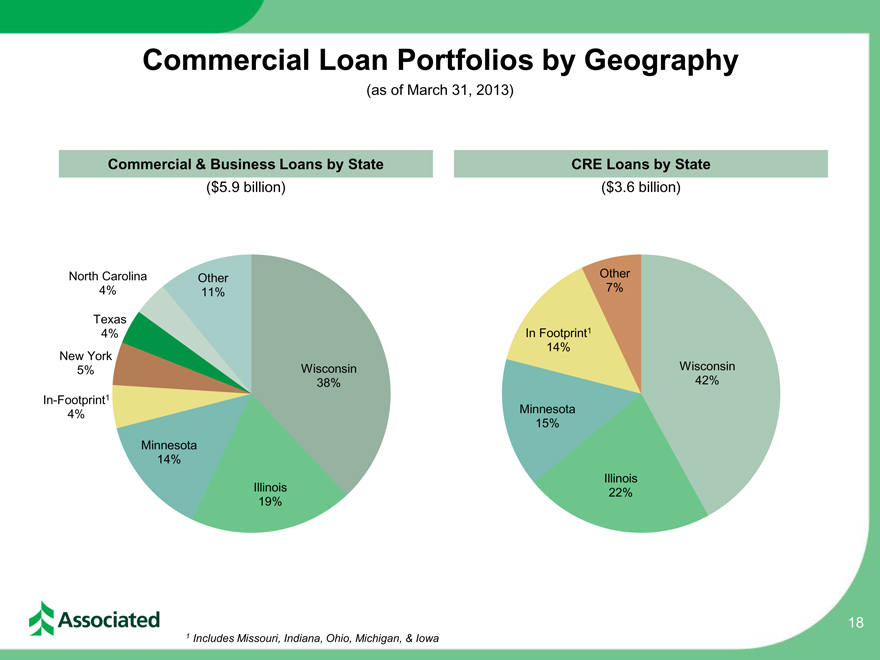
Commercial Loan Portfolios by Geography
(as of March 31, 2013)
Commercial & Business Loans by State CRE Loans by State
($5.9 billion) ($3.6 billion)
North Carolina Other Other
4% 11% 7%
Texas
4% In Footprint1
14%
New York
5% Wisconsin Wisconsin
38% 42%
In-Footprint1
4% Minnesota
15%
Minnesota
14%
Illinois
Illinois 22%
19%
18
1 Includes Missouri, Indiana, Ohio, Michigan, & Iowa
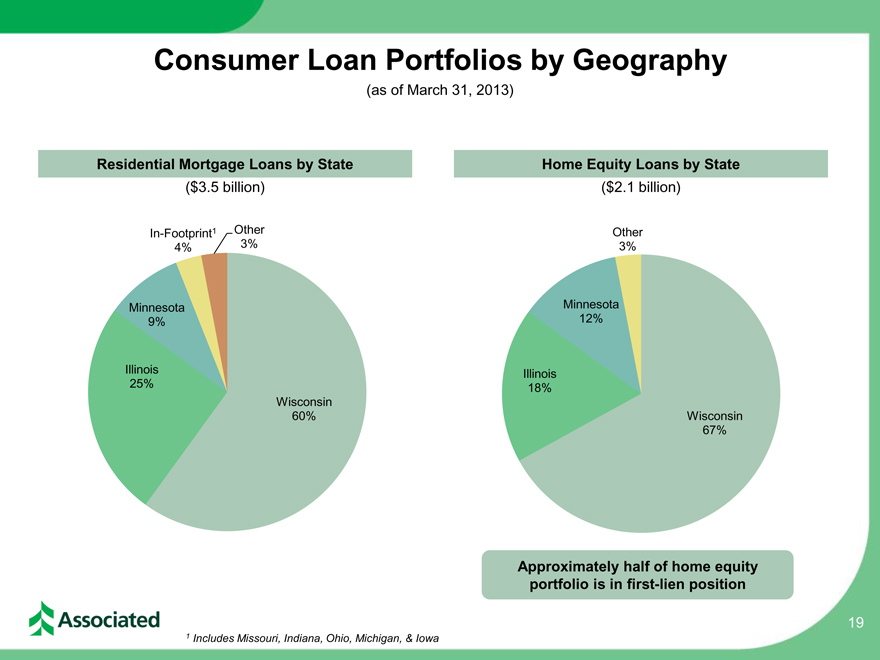
Consumer Loan Portfolios by Geography
(as of March 31, 2013)
Residential Mortgage Loans by State Home Equity Loans by State
($3.5 billion) ($2.1 billion)
In-Footprint1 Other Other
4% 3% 3%
Minnesota Minnesota
9% 12%
Illinois Illinois
25% 18%
Wisconsin
60% Wisconsin
67%
Approximately half of home equity
portfolio is in first-lien position
19
1 Includes Missouri, Indiana, Ohio, Michigan, & Iowa