Attached files
| file | filename |
|---|---|
| 8-K - ZALE CORP. 8-K - ZALE CORP | a50637728.htm |
| EX-99.1 - EXHIBIT 99.1 - ZALE CORP | a50637728ex99_1.htm |
Exhibit 99.2
Third Quarter Fiscal 2013 Earnings Call May 22, 2013 1
Forward‐Looking Statements and Use of Non‐GAAP Financial Measures This presentation contains forward‐looking statements, including statements regarding future sales, expected operating performance, expenses, margins, profitability, earnings, interest expense, effective tax rate, merchandising and marketing initiatives and industry growth forecasts. Forward‐looking statements are not guarantees of future performance and a variety of factors could cause the Company's actual results to differ materially from the results expressed in the forward-looking statements. These factors include, but are not limited to: if the general economy performs poorly, discretionary spending on goods that are, or are perceived to be, “luxuries” may decrease; the concentration of a substantial portion of the Company’s sales in three, relatively brief selling seasons means that the Company’s performance is more susceptible to disruptions; if the Company does not achieve targeted sales growth its operating results and earnings will be adversely impacted; most of the Company’s sales are of products that include diamonds, precious metals and other commodities, and fluctuations in the availability and pricing of commodities could impact the Company’s ability to obtain and produce products at favorable prices; the Company’s sales are dependent upon mall traffic; the Company operates in a highly competitive industry; the financing market remains difficult, and if we are unable to meet the financial commitments in our current financing arrangements it will be difficult to replace or restructure these arrangements; and changes in regulatory requirements may increase the cost or adversely affect the Company’s operations and its ability to provide consumer credit and write credit insurance. For other factors, see the Company's filings with the Securities and Exchange Commission, including its Annual Report on Form 10K for the fiscal year ended July 31, 2012, and subsequent reports on Forms 10‐Q and 8‐K. The Company disclaims any obligation to update or revise publicly or otherwise any forward‐looking statements to reflect subsequent events, new information or future circumstances, except as required by law. This presentation contains certain non‐GAAP measures as defined by SEC rules. One of these non‐GAAP measures is EBITDA, which is defined as earnings before interest, taxes, depreciation and amortization. A second non‐GAAP measure is adjusted EBITDA, which is further adjusted to exclude charges related to store closures. We use these measurements as part of our evaluation of the performance of the Company. In addition, we believe these measures provide useful information to investors. Please refer to the appendix at the back of this presentation for a reconciliation of these non‐GAAP measures to the most comparable GAAP financial measures. 2
Q3 Fiscal Year 2013…Continued Progress Towards Profitability Comparable store sales Up 1.4%...follows an 8.0% rise in Q3 FY12 (1) Reflects sales acceleration in March and April following a slow start to February Up 2.6% at constant exchange rates and excluding the impact of February 29 in Fiscal 2012 Zales branded stores up 3.0% Up 3.9% excluding the impact of February 29 in Fiscal 2012 Tenth consecutive quarter of positive comps Continued improvement in margin and profitability Gross margin of 52.6%, up 130 basis points Operating margin of 2.2%, up 80 basis points Net earnings of $5 million, up $10 million Year‐to‐date net earnings of $18 million, up $26 million from prior year period while making targeted investments (1) Comparable Store Sales exclude revenue recognized from warranties. The sales results of new stores are included beginning with the thirteenth full month of operations, and the sales results of closed stores are excluded from the calculation. 3
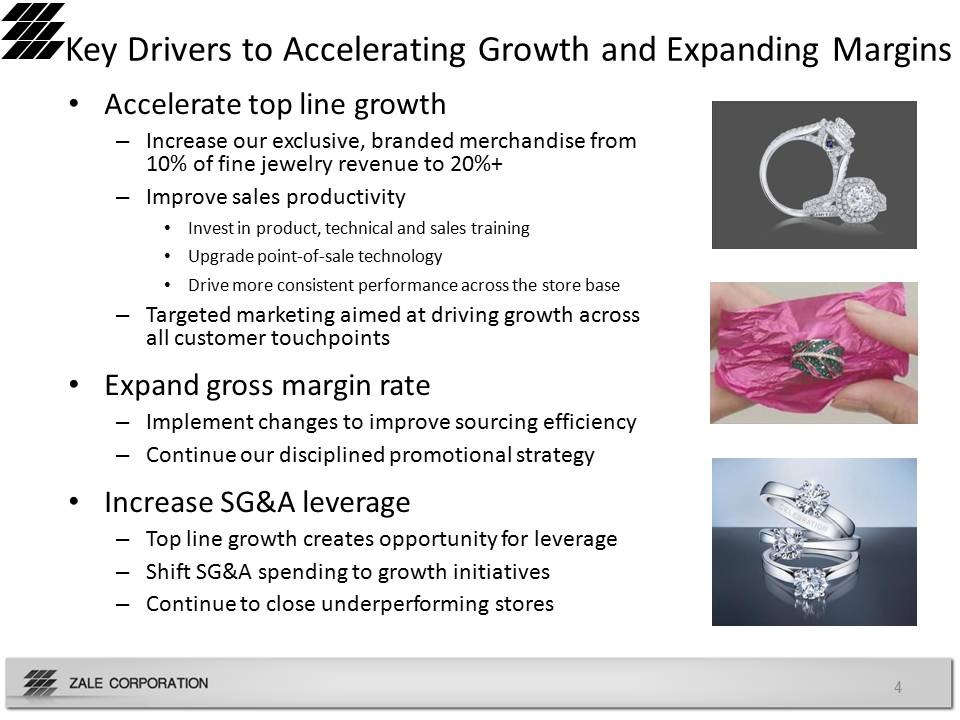
Key Drivers to Accelerating Growth and Expanding Margins Accelerate top line growth Increase our exclusive, branded merchandise from 10% of fine jewelry revenue to 20%+ Improve sales productivity Invest in product, technical and sales training Upgrade point‐of‐sale technology Drive more consistent performance across the store base Targeted marketing aimed at driving growth across all customer touchpoints Expand gross margin rate Implement changes to improve sourcing efficiency Continue our disciplined promotional strategy Increase SG&A leverage Top line growth creates opportunity for leverage Shift SG&A spending to growth initiatives Continue to close underperforming stores 4
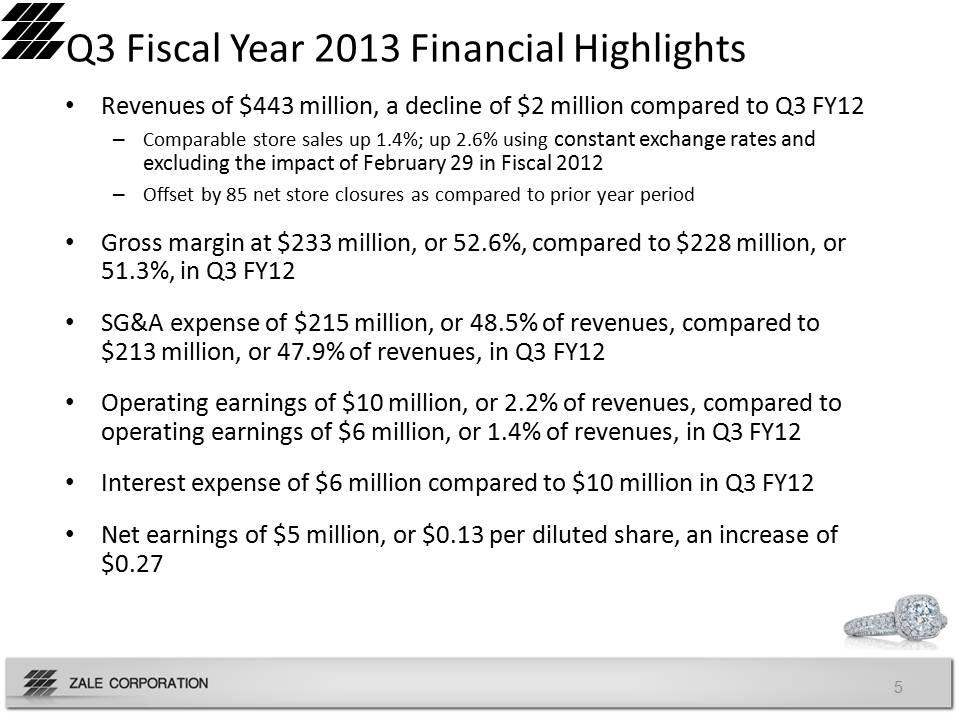
Q3 Fiscal Year 2013 Financial Highlights Revenues of $443 million, a decline of $2 million compared to Q3 FY12 Comparable store sales up 1.4%; up 2.6% using constant exchange rates and excluding the impact of February 29 in Fiscal 2012 Offset by 85 net store closures as compared to prior year period Gross margin at $233 million, or 52.6%, compared to $228 million, or 51.3%, in Q3 FY12 SG&A expense of $215 million, or 48.5% of revenues, compared to $213 million, or 47.9% of revenues, in Q3 FY12 Operating earnings of $10 million, or 2.2% of revenues, compared to operating earnings of $6 million, or 1.4% of revenues, in Q3 FY12 Interest expense of $6 million compared to $10 million in Q3 FY12 Net earnings of $5 million, or $0.13 per diluted share, an increase of $0.27 5
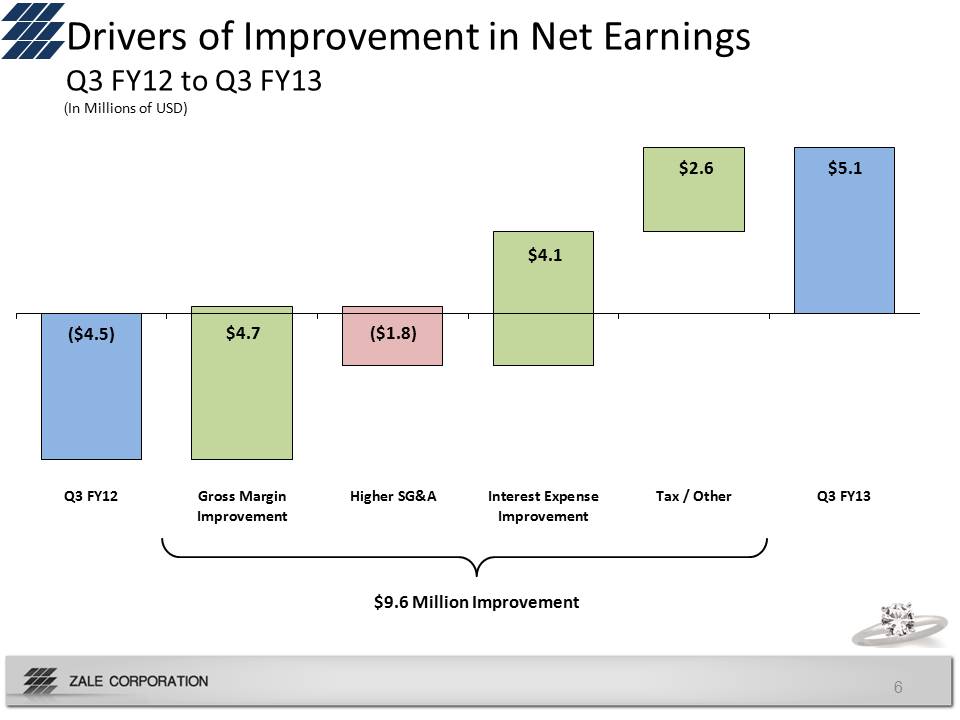
Drivers of Improvement in Net Earnings Q3 FY12 to Q3 FY13 (In Millions of USD) ($4.5) $4.7 ($1.8) $4.1 $2.6 $5.1 Q3 FY12 Gross Margin Improvement Higher SG&A Interest Expense Improvement Tax / Other Q3 FY13 $9.6 Million Improvement 6
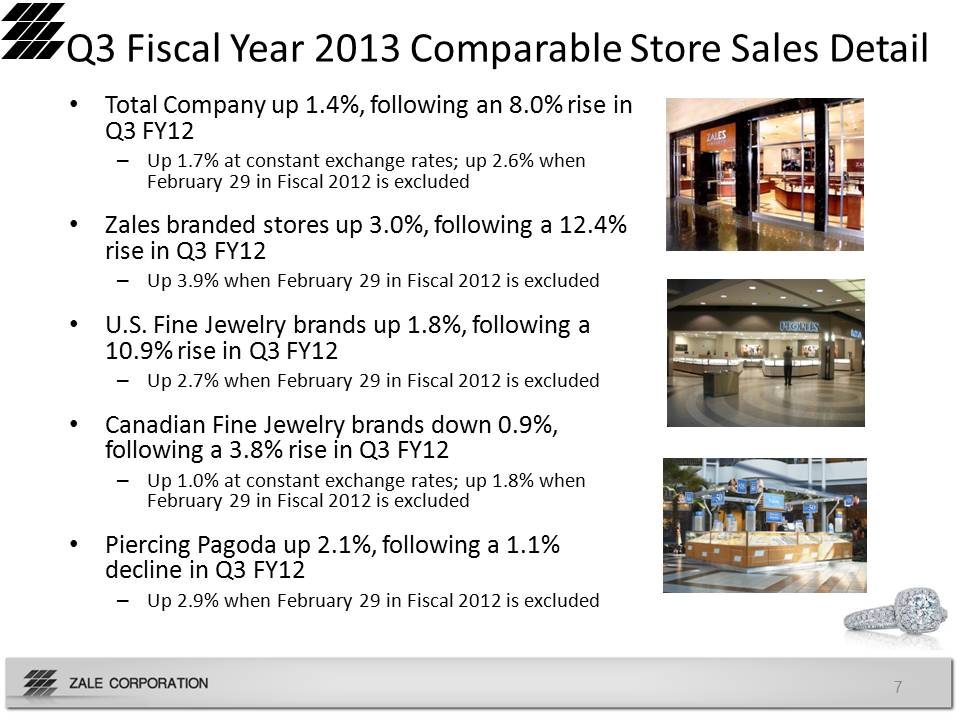
Q3 Fiscal Year 2013 Comparable Store Sales Detail Total Company up 1.4%, following an 8.0% rise in Q3 FY12 Up 1.7% at constant exchange rates; up 2.6% when February 29 in Fiscal 2012 is excluded Zales branded stores up 3.0%, following a 12.4% rise in Q3 FY12 Up 3.9% when February 29 in Fiscal 2012 is excluded U.S. Fine Jewelry brands up 1.8%, following a 10.9% rise in Q3 FY12 Up 2.7% when February 29 in Fiscal 2012 is excluded Canadian Fine Jewelry brands down 0.9%, following a 3.8% rise in Q3 FY12 Up 1.0% at constant exchange rates; up 1.8% when February 29 in Fiscal 2012 is excluded Piercing Pagoda up 2.1%, following a 1.1% decline in Q3 FY12 Up 2.9% when February 29 in Fiscal 2012 is excluded 7
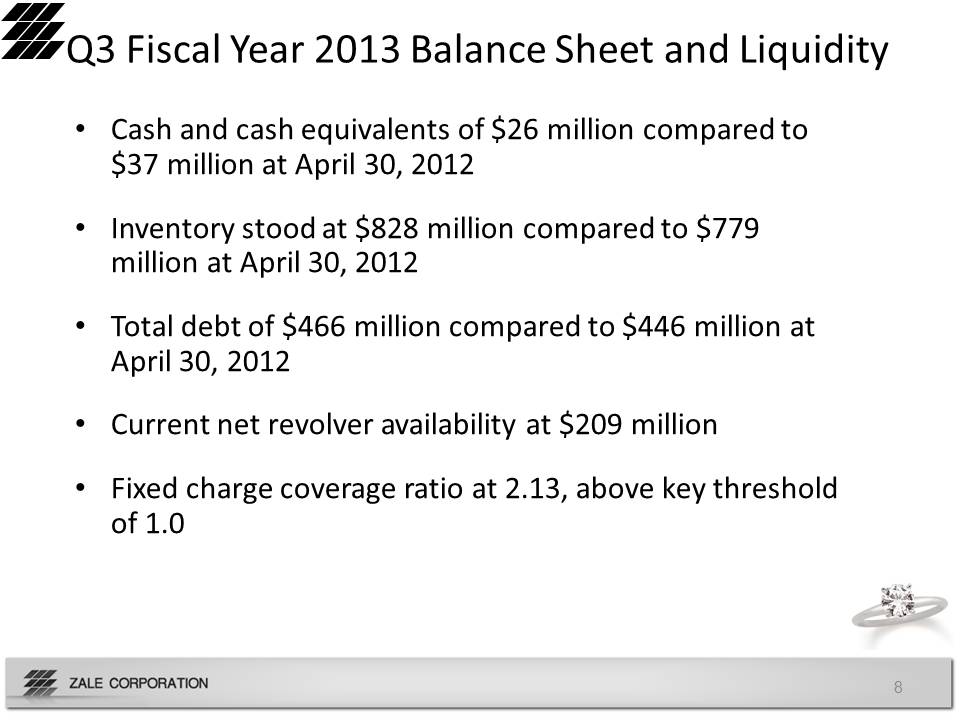
Q3 Fiscal Year 2013 Balance Sheet and Liquidity Cash and cash equivalents of $26 million compared to $37 million at April 30, 2012 Inventory stood at $828 million compared to $779 million at April 30, 2012 Total debt of $466 million compared to $446 million at April 30, 2012 Current net revolver availability at $209 million Fixed charge coverage ratio at 2.13, above key threshold of 1.0 8
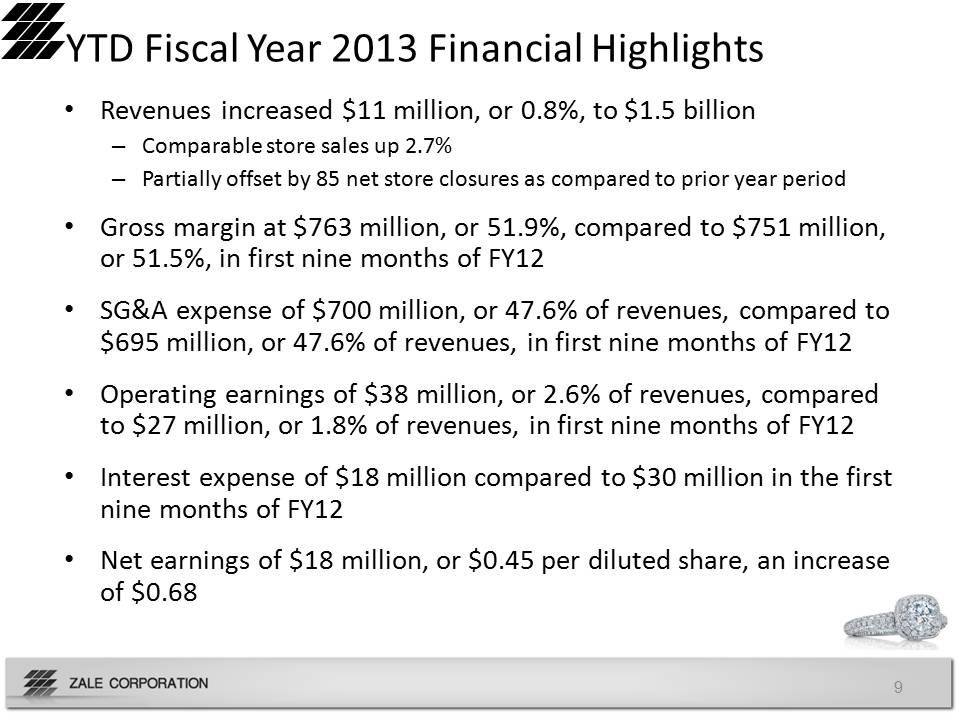
YTD Fiscal Year 2013 Financial Highlights Revenues increased $11 million, or 0.8%, to $1.5 billion Comparable store sales up 2.7% Partially offset by 85 net store closures as compared to prior year period Gross margin at $763 million, or 51.9%, compared to $751 million, or 51.5%, in first nine months of FY12 SG&A expense of $700 million, or 47.6% of revenues, compared to $695 million, or 47.6% of revenues, in first nine months of FY12 Operating earnings of $38 million, or 2.6% of revenues, compared to $27 million, or 1.8% of revenues, in first nine months of FY12 Interest expense of $18 million compared to $30 million in the first nine months of FY12 Net earnings of $18 million, or $0.45 per diluted share, an increase of $0.68 9
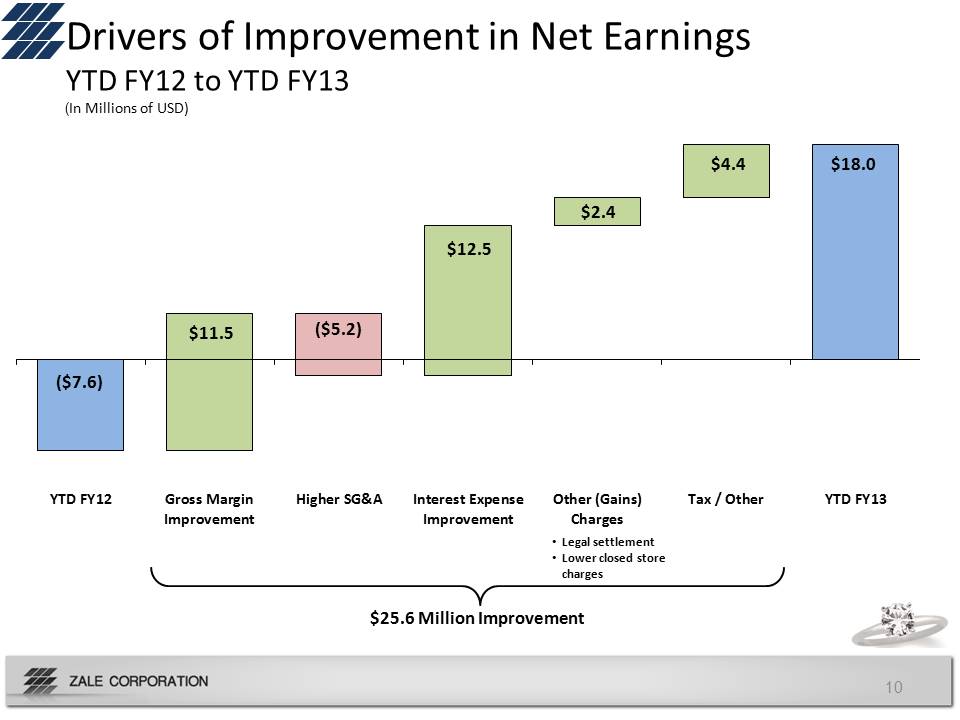
Drivers of Improvement in Net Earnings YTD FY12 to YTD FY13 (In Millions of USD) ($7.6) $11.5 ($5.2) $12.5 $2.4 $4.4 $18.0 YTD FY12 Gross Margin Improvement Higher SG&A Interest Expense Improvement Other (Gains) Charges Tax / Other YTD FY13 Legal settlement Lower closed store charges $25.6 Million Improvement 10
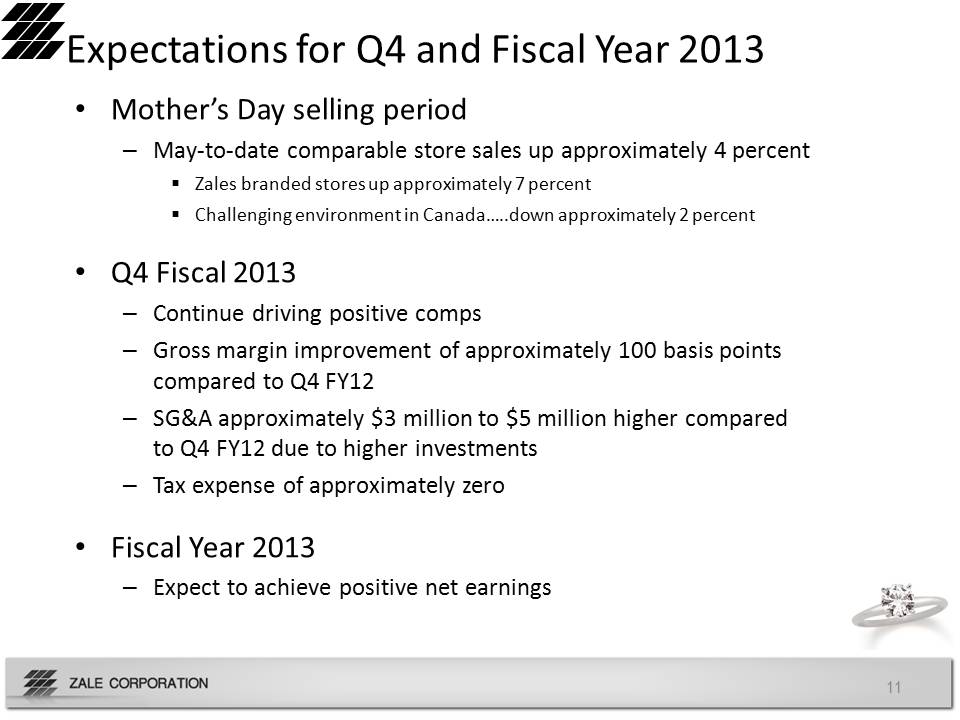
Expectations for Q4 and Fiscal Year 2013 Mother’s Day selling period May‐to‐date comparable store sales up approximately 4 percent Zales branded stores up approximately 7 percent Challenging environment in Canada…..down approximately 2 percent Q4 Fiscal 2013 Continue driving positive comps Gross margin improvement of approximately 100 basis points compared to Q4 FY12 SG&A approximately $3 million to $5 million higher compared to Q4 FY12 due to higher investments Tax expense of approximately zero Fiscal Year 2013 Expect to achieve positive net earnings 11
Appendix 12
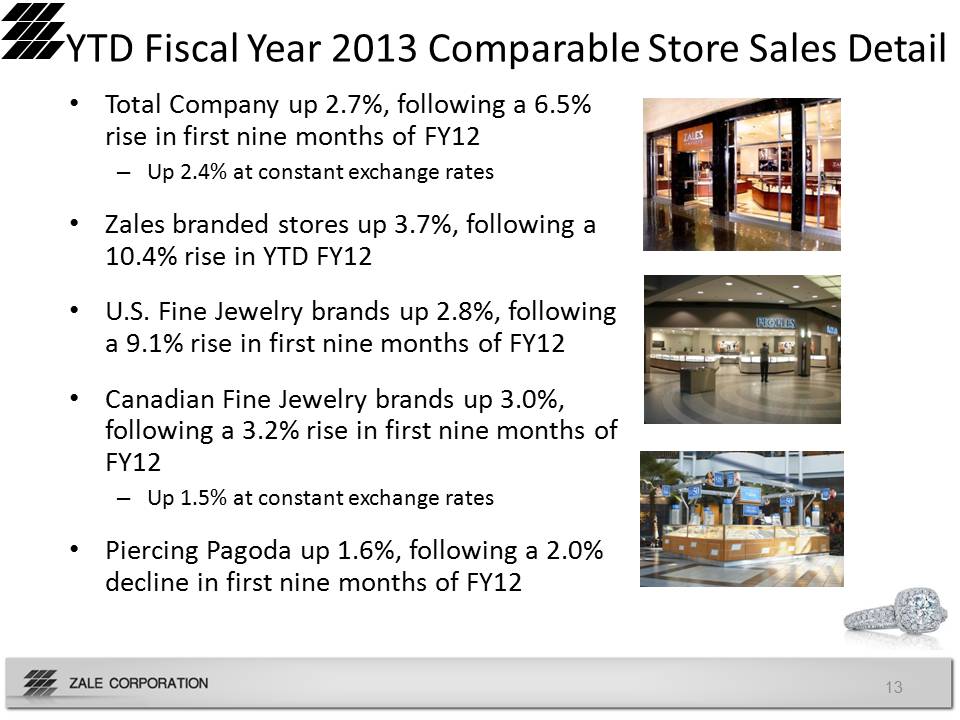
YTD Fiscal Year 2013 Comparable Store Sales Detail Total Company up 2.7%, following a 6.5% rise in first nine months of FY12 Up 2.4% at constant exchange rates Zales branded stores up 3.7%, following a 10.4% rise in YTD FY12 U.S. Fine Jewelry brands up 2.8%, following a 9.1% rise in first nine months of FY12 Canadian Fine Jewelry brands up 3.0%, following a 3.2% rise in first nine months of FY12 Up 1.5% at constant exchange rates Piercing Pagoda up 1.6%, following a 2.0% decline in first nine months of FY12 13

Trailing Twelve Months Adjusted EBITDA (1) (2) (In Millions of USD) ($ in Millions) -$90 -$55 -$42 -$3 $14 $14 $32 $31 $42 $57 $55 $63 $66 Q3 FY10 Q4 FY10 Q1 FY11 Q2 FY11 Q3 FY11 Q4 FY11 Q1 FY12 Q2 FY12 Q3 FY12 Q4 FY12 Q1 FY13 Q2 FY13 Q3 FY13 (1) Adjusted EBITDA is a non‐GAAP measure defined as earnings before interest, taxes, depreciation and amortization, adjusted to exclude charges related to store closures. Please refer to the appendix at the back of this presentation for a reconciliation of this non‐GAAP measure to the most comparable GAAP financial measure. (2) Beginning in the first quarter of fiscal 2012, we changed the method of recognizing revenue related to lifetime warranties. The change positively impacted fiscal 2012 revenues by approximately $35 million. 14
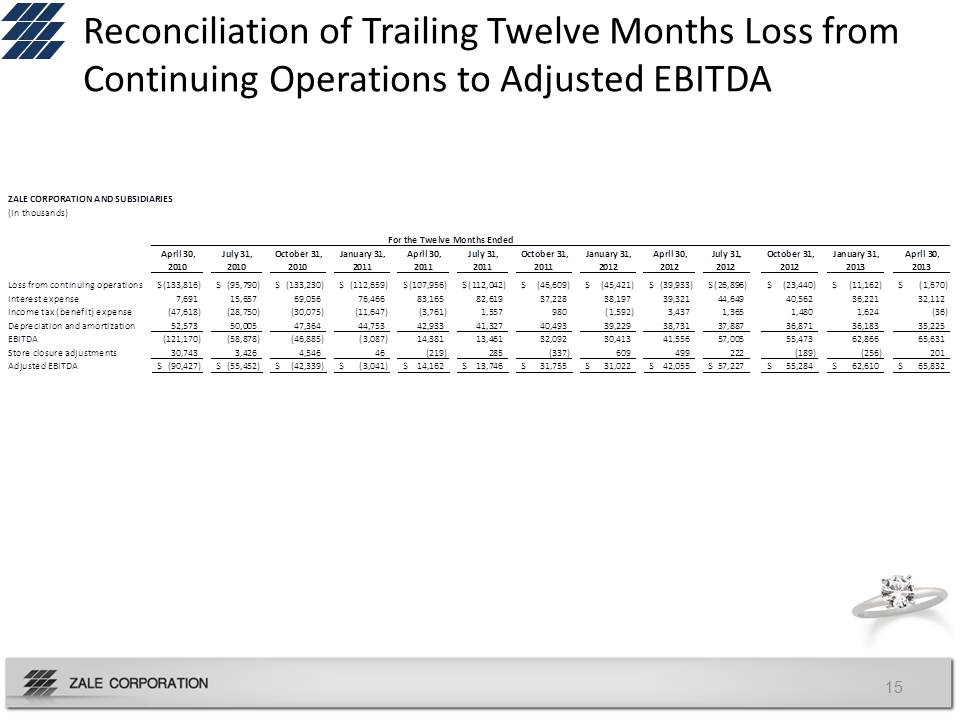
Reconciliation of Trailing Twelve Months Loss from Continuing Operations to Adjusted EBITDA ($ in Millions) ZALE CORPORATION AND SUBSIDIARIES (In thousands) For the Twelve Months Ended April 30, 2010 July 31, 2010 October 31, 2010 January 31, 2011 April 30, 2011 July 31, 2011 October 31, 2011 January 31, 2012 April 30, 2012 July 31, 2012 October 31, 2012 January 31, 2013 April 30, 2013 Loss from continuing operations $ (133,816) $ (95,790) $ (133,230) $ (112,659) $ (107,956) $ (112,042) $ (46,609) $ (45,421) $ (39,933) $ (26,896) $ (23,440) $ (11,162) $ (1,670) Interest expense 7,691 15,657 69,056 76,466 83,165 82,619 37,228 38,197 39,321 44,649 40,562 36,221 32,112 Income tax (benefit) expense (47,618) (28,750) (30,075) (11,647) (3,761) 1,557 980 (1,592) 3,437 1,365 1,480 1,624 (36) Depreciation and amortization 52,573 50,005 47,364 44,753 42,933 41,327 40,493 39,229 38,731 37,887 36,871 36,183 35,225 EBITDA (121,170) (58,878) (46,885) (3,087) 14,381 13,461 32,092 30,413 41,556 57,005 55,473 62,866 65,631 Store closure adjustments 30,743 3,426 4,546 46 (219) 285 (337) 609 499 222 (189) (256) 201 Adjusted EBITDA $ (90,427) $ (55,452) $ (42,339) $ (3,041) $ 14,162 $ 13,746 $ 31,755 $ 31,022 $ 42,055 $ 57,227 $ 55,284 $ 62,610 $ 65,832 15
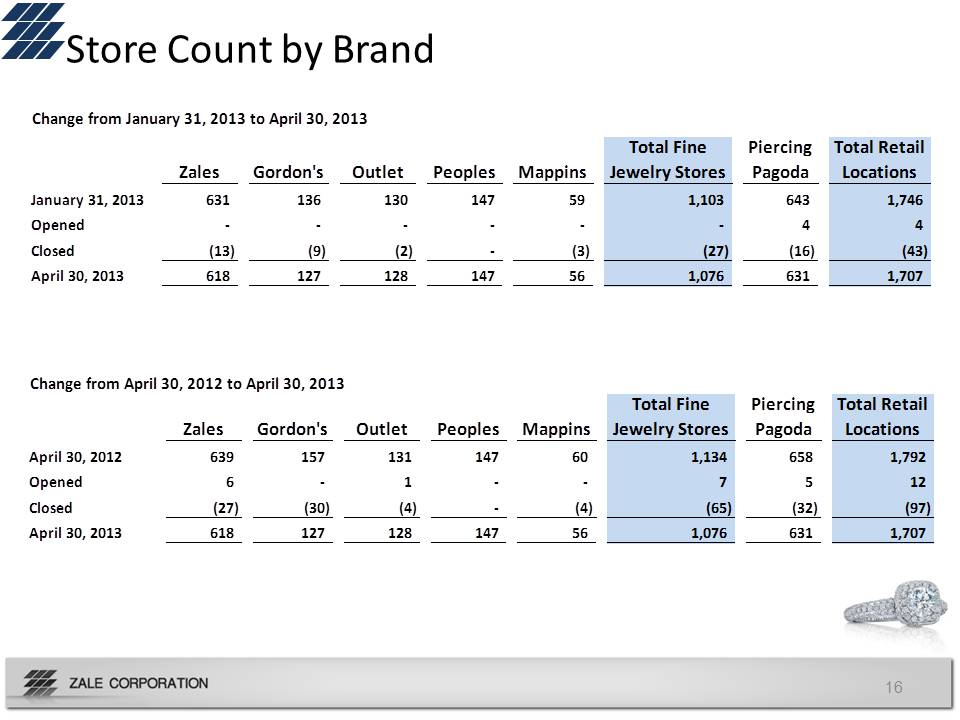
Store Count by Brand Change from January 31, 2013 to April 30, 2013 Zales Gordon's Outlet Peoples Mappins Total Fine Jewelry Stores Piercing Pagoda Total Retail Locations January 31, 2013 631 136 130 147 59 1,103 643 1,746 Opened ‐ ‐ ‐ ‐ ‐ ‐ 4 4 Closed (13) (9) (2) ‐ (3) (27) (16) (43) April 30, 2013 618 127 128 147 56 1,076 631 1,707 Change from April 30, 2012 to April 30, 2013 Zales Gordon's Outlet Peoples Mappins Total Fine Jewelry Stores Piercing Pagoda Total Retail Locations April 30, 2012 639 157 131 147 60 1,134 658 1,792 Opened 6 ‐ 1 ‐ ‐ 7 5 12 Closed (27) (30) (4) ‐ (4) (65) (32) (97) April 30, 2013 618 127 128 147 56 1,076 631 1,707 16