Attached files
| file | filename |
|---|---|
| 8-K - FORM 8-K - FIFTH THIRD BANCORP | d541509d8k.htm |
 Barclays Capital
2013 Americas Select Franchise Conference
Daniel T. Poston
Executive Vice President & Chief Financial Officer
May 22, 2013
Please refer to earnings release dated April 18, 2013 and
10-Q dated May 9, 2013 for further information
Exhibit 99.1
©
Fifth Third Bank | All Rights Reserved |
 2
©
Fifth Third Bank | All Rights Reserved
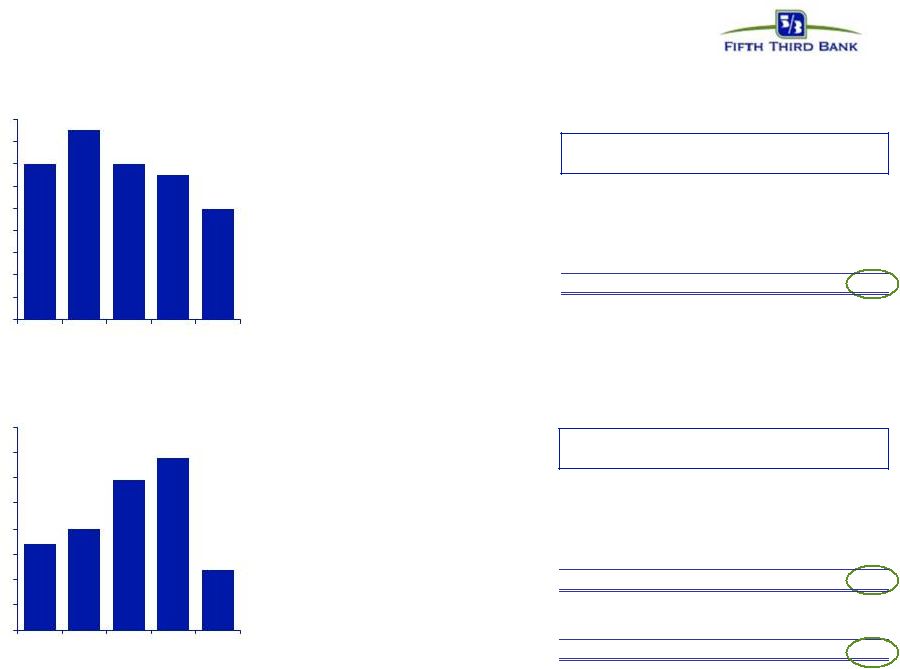
A strong franchise with strong momentum
Return on avg. assets
Net charge-off ratio
Net income available to
common shareholders ($MM)
Generated highest level of net income
to common shareholders since 2005.
Improving profitability approaching
target for normalized environment.
Problem assets are at the lowest
levels in five years.
Tier 1 common ratio*
Total payout ratio
ALLL / NPLs
Coverage levels more than adequate
to protect against potential losses.
Capital ratios continue to be strong
and grow to record levels.
Payouts to shareholders
approached $1B in 2012.
31%
63%
11%
Vantiv
Other
* Non-GAAP measure; see Reg. G reconciliation in appendix.
|
 ©
Fifth Third Bank | All Rights Reserved
Fifth Third franchise
$121 billion assets (#12)
$92 billion total deposits (#13)
$14 billion market cap (#12)
18 affiliates in 12 states
1,320 banking centers
2,426 ATMs
Leading market share in mature
Midwest market; strong presence in
higher growth Southeastern markets
Source: SNL Financial. Rankings based on U.S. headquartered commercial banks.
Data as of 3/31/13
Kentucky
Tennessee
Georgia
Florida
North
Carolina
West
Virginia
Pennsylvania
Ohio
Michigan
Illinois
Indiana
Missouri
3 |
 4
©
Fifth Third Bank | All Rights Reserved
—
Return on assets of 1.41%; return on average common equity of 12.5%; return on
average tangible common equity** of 15.5%
Credit trends remain favorable
—
Net charge-offs (NCOs) of $133MM (0.63% of loans and leases) down $14MM (7 bps)
vs. 4Q12 —
Total NPAs of $1.2B including loans held-for-sale (HFS) down $86MM, or 7%,
from 4Q12; NPA ratio of 1.41% down 8 bps from 4Q12, NPL ratio of 1.11% down 8
bps from 4Q12 —
Total
delinquencies
(loans
30-89
days
past
due
and
90
days
past
due)
lowest
since
1Q01
Strong capital ratios*
—
Tier 1 common ratio 9.70%**, up 19 bps sequentially (Basel III pro forma estimate of
~8.9%) —
Tier 1 capital ratio 10.83%, Total capital ratio 14.35%, Leverage ratio 10.03%
—
Tangible common equity ratio** of 9.03% excluding unrealized gains/losses; 9.29%
including them
—
Repurchased ~8MM common shares in 1Q13; new 100MM share repurchase authorization in
March
1Q13 highlights
Net income available to common shareholders of $413MM ($0.46 per diluted
share), vs. $390MM ($0.43 per share) in 4Q12 and $421MM ($0.45 per share) in 1Q12 * Capital ratios presented under
current U.S. capital regulations. The pro forma Tier I common equity ratio is management’s estimate based upon its current
interpretation of the three draft Federal Register notices proposing enhancements to regulatory
capital requirements published in June 2012. The actual impact to the Bancorp’s Tier I
common equity ratio may change significantly due to revisions to the agencies’ final rules.
** Non-GAAP measure; see Reg. G reconciliation in appendix. |
 ©
Fifth Third Bank | All Rights Reserved
5
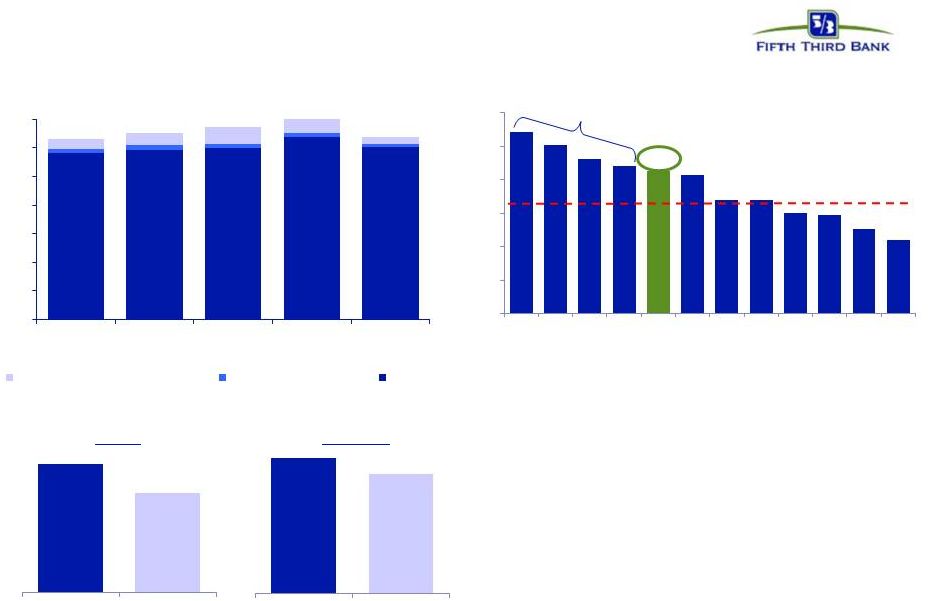
Strong revenue and profit generation
Peer med. 1.7%
2.1%
1Q13 returns strong relative to peers
ROAA
ROATCE
•
Business mix provides higher than
average diversity among spread and fee
revenues (45+% of revenue)
•
Relatively strong margin and relatively
high fee income contribution drives
strong profitability despite interest rate
environment
Pre-provision net revenue (PPNR) trend
1Q13 PPNR* / Average Assets
Source: SNL Financial and Company Reports. Data as of 1Q13. Peer median includes:
BBT, CMA, HBAN, KEY, MTB, PNC, RF, STI, USB, WFC, and ZION.PPNR and ROATCE
are Non-GAAP measures. See Reg. G reconciliation in the Appendix to the presentation.
^ See Page 18 in the Appendix for adjustments
* Excludes securities gains / losses for FITB and peers. Also excludes goodwill
impairment charge for peers as applicable. Significant purchase
accounting
benefit
PPNR
$694 $636
$568
$616
$653 583
593
598
638
602
14
17
14
13
10
34
40
59
68
24
$0
$100
$200
$300
$400
$500
$600
$700
1Q12
2Q12
3Q12
4Q12
1Q13
Noninterest Expense Credit Items
Fee Income Credit Items
Adjusted^
15.5%
13.7%
FITB
Peer Median
1.41%
1.09%
FITB
Peer Median
0.0%
0.5%
1.0%
1.5%
2.0%
2.5%
3.0%
USB
WFC
MTB
BBT
FITB
PNC
HBAN
STI
RF
KEY
CMA
ZION |
 6
©
Fifth Third Bank | All Rights Reserved
NII results reflect continued moderate NIM
pressure offset by balance sheet growth
* Represents purchase accounting adjustments included in net interest income.
^ Estimate; funding (DDAs + interest-bearing liabilities); liabilities
attributed to fixed or floating using terms and expected beta Fixed / Floating
Portfolio •
Negative impact of lower rates on net interest
income generally offset by loan growth
•
Spreads on new originations of variable rate
assets consistent with historical spreads
–
Emphasis on variable rate C&I lending
•
Coupons on new fixed rate loan originations
converging with portfolio average coupons
Interest-Earning
Assets
Funding^
Fixed
~55-60%
NII and NIM (FTE)
($MM)
Loans
52%
Loans
32%
Investment
Portfolio 3%
Trend: fixed rate loan origination coupons
relative to fixed portfolio weighted avg
Larger portfolio repricing effects
3.61%
3.56%
3.56%
3.49%
3.42%
903
899
907
903
893
$450
$550
$650
$750
$850
$950
2.0%
2.5%
3.0%
3.5%
4.0%
1Q12
2Q12
3Q12
4Q12
1Q13
Net Interest Income (right axis)
PAA*
NIM
0.00
0.50
1.00
1.50
2.00
Fixed
45%
Floating
55%
Investment
Portfolio
13%
Floating
Fixed
Floating
~40-45% |
 7
©
Fifth Third Bank | All Rights Reserved
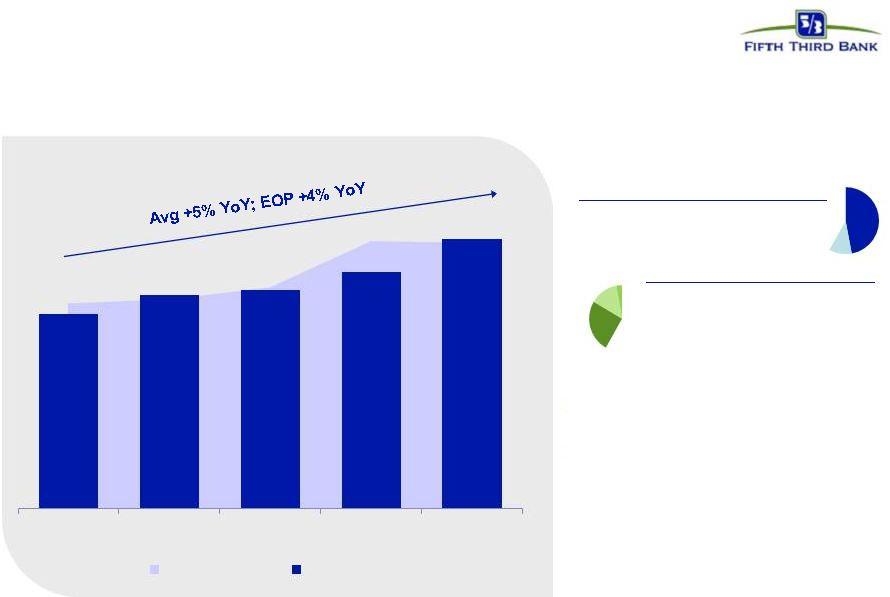
Strong loan growth,
ample opportunities for ongoing growth
Loan balances ($B)
Loan composition (EOP HFI)
47% C&I / lease
11% Commercial real estate
Commercial
25% Resi. mtg. / home equity
14% Auto
3% Card / other
Consumer
•
Solid loan growth with
disciplined lending standards
•
C&I and residential mortgage
balance growth more than
offset run-off in both home
equity and commercial real
estate loans (CRE run-off
continues to slow)
$82.1
$85.7
$81.5
$82.6
$82.9
$83.9
$85.9
1Q12
2Q12
3Q12
4Q12
1Q13
EOP loans HFI
Avg loans HFI |
 8
©
Fifth Third Bank | All Rights Reserved
Strengthened deposit profile
and increased value proposition to customers
Average deposit balances ($B)
Simplified deposit products
•
Straightforward,
easy
to
use
accounts
•
Reduced complexity
•
Elimination of certain fees
•
Total relationship earns better
rates and lower costs
•
Compatible with Fifth Third’s
strategic direction and new
regulatory landscape
Deposit growth benefited
from focus on
full customer relationship
$77.1
$77.6
$77.5
$80.2
$80.9
$81.7
$84.9
1Q12
2Q12
3Q12
4Q12
1Q13
Transaction deposits
Other time deposits |
 9
©
Fifth Third Bank | All Rights Reserved
Diverse revenue stream
45% Fee income
NII
Fee income as % of 1Q13 revenue
1Q13 Fee income distribution
Economic trends should support long-term improvement in results through
balance sheet growth and higher business activity
Strong momentum in key businesses:
•
Corporate banking: recent investments in capital markets capabilities, increased
syndication and business lending fees
•
Investment advisors: 1Q13 strongest in company history due to increased brokerage
production, seasonal trust tax preparation fees and higher market values
•
Retail banking: listening to voice of customer and enhancing channels and products to
meet consumer preferences
•
Consumer lending: record mortgage originations and strong auto lending supporting
business Deposit
Fees
18%
Corporate
Banking
13%
Investment
Advisors
13%
Other^
17%
Mortgage
30%
Card and
Processing
9%
55%
^ Includes other noninterest income and securities gains. |
 10
©
Fifth Third Bank | All Rights Reserved
Disciplined expense management
•
Long-term target for mid-50% efficiency
ratio in normalized environment (with
higher interest rate environment)
Expense trend ($MM)
* Non-recurring items listed on page 18 in the appendix.
Managing expenses carefully in response to revenue
environment; continuous process of expense evaluation
Efficiency ratio trend
Reported expense
$973
$937
$1,006
$1,163
$978
Non-recurring items*:
Decreasing Expense
$23
$18
$5
--
$9
Increasing Expense
($29)
--
($55)
($173)
($9)
Adjusted Expense
$967
$955
$956
$990
$978
$600
$700
$800
$900
$1,000
$1,100
$1,200
1Q12
2Q12
3Q12
4Q12
1Q13
58%
59%
64%
65%
60%
62%
62%
61%
60%
62%
1Q12
2Q12
3Q12
4Q12
1Q13
Efficiency Ratio
Adjusted*
–
Current impact of credit costs on
revenue and expenses; impact of
regulatory reforms not fully mitigated
–
Reflects below-capacity balance sheet
and lower revenue than we expect and
can support longer term
–
~ 60% for year end 2013 |
 11
©
Fifth Third Bank | All Rights Reserved
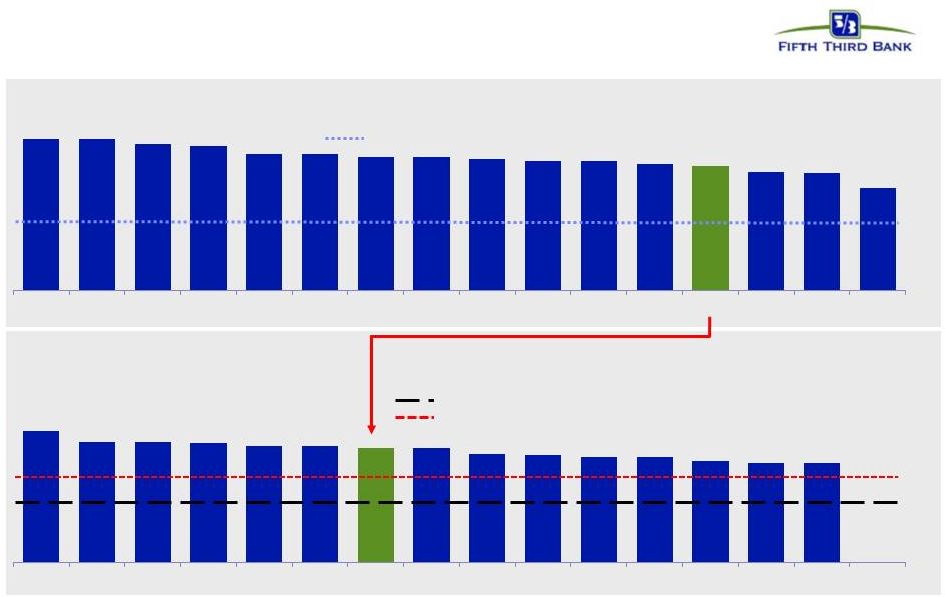
Continued improvement in credit trends
Peer average includes: BBT, CMA, HBAN, KEY, MTB, PNC, RF, STI, USB, WFC, and
ZION. Source: SNL Financial and Company Reports. Data as of 1Q13. All ratios
exclude loans held-for-sale and covered assets for peers where appropriate.
* 4Q08 NCOs included $800MM in NCOs related to commercial loans moved to
held-for-sale, NCO ratio of 7.5%, 3.8% before credit actions; 3Q10 NCOs included $510MM
in NCOs related to loans sold or moved to held-for-sale.
NPA ratio vs. peers
Net charge-off ratio vs. peers
Loans 90+ days delinquent % vs. peers
Loans 30-89 days delinquent % vs. peers
5.0%*
2.3%
before credit
actions
FITB credit metrics are in line with or better than peers
0.5%
1.5%
2.5%
3.5%
4.5%
4Q08
1Q09
2Q09
3Q09
4Q09
1Q10
2Q10
3Q10
4Q10
1Q11
2Q11
3Q11
4Q11
1Q12
2Q12
3Q12
4Q12
1Q13
FITB
Peer Average
0.0%
0.5%
1.0%
1.5%
2.0%
2.5%
3.0%
3.5%
4.0%
4.5%
5.0%
4Q08*
1Q09
2Q09
3Q09
4Q09
1Q10
2Q10
3Q10
4Q10
1Q11
2Q11
3Q11
4Q11
1Q12
2Q12
3Q12
4Q12
1Q13
FITB
Peer Average
0.0%
0.2%
0.4%
0.6%
0.8%
1.0%
1.2%
1.4%
4Q08
1Q09
2Q09
3Q09
4Q09
1Q10
2Q10
3Q10
4Q10
1Q11
2Q11
3Q11
4Q11
1Q12
2Q12
3Q12
4Q12
1Q13
FITB
Peer Average
0.0%
0.2%
0.4%
0.6%
0.8%
1.0%
1.2%
1.4%
1.6%
1.8%
2.0%
4Q08
1Q09
2Q09
3Q09
4Q09
1Q10
2Q10
3Q10
4Q10
1Q11
2Q11
3Q11
4Q11
1Q12
2Q12
3Q12
4Q12
1Q13
FITB
Peer Average |
 12
©
Fifth Third Bank | All Rights Reserved
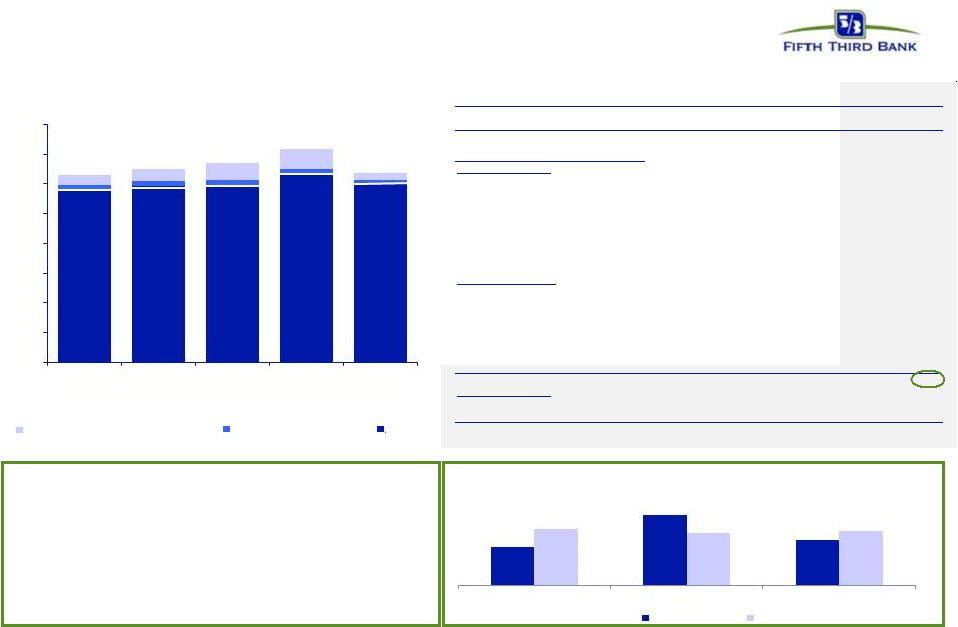
Strong reserve position
Peer median includes: BBT, CMA, HBAN, KEY, MTB, PNC, RF,STI, USB, WFC, and
ZION. Source: SNL Financial and Company Reports. Data as of 1Q13. NPAs
/
NPLs exclude held-for-sale portion for all banks as well as covered assets
for BBT, USB, and ZION. 1Q13 coverage ratios strong
relative to peers
Industry leading reserve levels
Fifth Third
Peer Median
187%
137%
Reserves / NPLs
$220
$181
$156
$147
$133
($129)
($110)
($91)
($71)
($71)
2.59%
2.45%
2.32%
2.16%
2.08%
($150)
($100)
($50)
$0
$50
$100
$150
$200
$250
0.00%
0.50%
1.00%
1.50%
2.00%
2.50%
3.00%
3.50%
1Q12
2Q12
3Q12
4Q12
1Q13
Net Charge-offs
Additional Provision
Reserves
147%
126%
Reserves / NPAs
331%
290%
Reserves / Annualized NCOs |
 13
©
Fifth Third Bank | All Rights Reserved
Fifth Third’s balance sheet and business model
relatively advantaged under new capital standards
Fifth Third’s capital position already well in excess of any established
standards, likely standards, and most peers 5.0%
7.0%
4.5%
Unofficial CCAR supervisory reference minimum
1Q13 Pro forma Tier 1 common / RWA
U.S. proposed Basel III**
1Q13 Tier 1 common / RWA
Basel I
2019 Basel III buffered minimum
2015 Basel III minimum
Not
disclosed
~9.1%
11.8%
11.8%
11.4%
11.2%
10.6%
10.6%
10.4%
10.4%
10.2%
10.1%
10.1%
9.8%
9.7%
9.2%
9.1%
7.9%
C
COF
KEY
RF
HBAN
BAC
CMA
WFC
JPM
STI
ZION
PNC
FITB
BBT
USB
MTB
10.3%
9.4%
9.4%
9.3%
9.1%
8.9%
8.9%
8.5%
8.4%
8.2%
8.2%
7.9%
7.8%
7.8%
0
KEY
BAC
CMA
C
RF
HBAN*
FITB
JPM
COF
WFC
STI
USB
PNC
BBT
ZION*
MTB
Source: SNL Financial and Company Reports. Data as of 1Q13.
* In 2Q12, HBAN stated Basel III Tier 1 common ratio would be negatively impacted by approximately 150
basis points and in their 1Q13 Earning Conference Call, they stated this again. In 2Q12, ZION
stated Tier 1 common ratio would be in the 7.75% area. ** Note: Fifth Third’s pro forma
Tier I common equity ratio is management’s estimate based upon its current interpretation of the three draft Federal Register notices proposing
enhancements to regulatory capital requirements published in June 2012. The actual impact to the
Bancorp’s Tier I common equity ratio may change significantly due to further clarification
of the agencies proposals or revisions to the agencies final rules, which remain subject to public comment. Not adjusted for potential mitigation efforts.
|
 14
©
Fifth Third Bank | All Rights Reserved
Capital management philosophy
* Subject to Board of Directors and regulatory approval
Organic growth opportunities
•
Support growth of core banking franchise
•
Continued loan growth despite sluggish
economy
Strategic opportunities
*
•
Prudently evaluate opportunities to increase
density of franchise via disciplined
acquisitions or selective de novos
•
Expect future acquisition opportunities
although activity likely to remain muted in
near-term
•
Attain top 3 market position in 65% of
markets or more longer term
Dividends*
•
As previously indicated, move towards levels
more consistent with Fed’s near-term payout
ratio guidance of 30%
•
Strong levels of profitability would support
higher dividend than current level
•
Quarterly dividend increased to $0.11 in 1Q13
(increase to $0.12 not objected to in 2013 CCAR)
Repurchases / Redemptions
*
•
Common share repurchases to limit / manage
growth of excess capital levels
•
2013 CCAR included:
–
Potential conversion of $398MM in outstanding
Series G 8.5% convertible preferred stock into
~35.5MM common shares
–
Potential repurchase of up to $984MM common
shares including any issued in a Series G
preferred stock conversion (up to $550MM)
–
Potential issuance of $500MM in preferred stock
Consistent and prudent capital management philosophy
Capital Deployment
Capital Return
–
Other considerations: regulatory environment,
alternatives, maintenance of desired / required
buffers, stock price |
 15
©
Fifth Third Bank | All Rights Reserved
Well-positioned for the future
•
Cash currently sufficient to satisfy all fixed obligations in a stressed
environment for approximately 2 years (debt maturities, common and preferred
dividends, interest and other expenses) without accessing capital markets; relying
on dividends from subsidiaries or any other discretionary actions
•
Fifth Third has completely exited all crisis-era government support
programs Superior capital and liquidity position
•
NCOs of 0.63%; 3.3x reserves / annualized NCOs
•
Substantial reduction in exposure to CRE since 1Q09; relatively low CRE exposure
versus peers •
Very low relative exposure to areas of concern, e.g. European financials, mortgage
repurchase risk Proactive approach to risk management
•
Traditional commercial banking franchise built on customer-oriented localized
operating model •
Strong market share in key markets with focus on further improving density
•
Fee income ~45% of total revenue
Diversified traditional banking platform
•
PPNR has remained strong throughout the credit cycle
•
PPNR substantially exceeds annual net charge-offs (491% PPNR / NCOs^ in
1Q13) •
1.4% ROAA; 15.5% return on average tangible common equity^
Industry leader in earnings power
^ Non-GAAP measure. See Reg. G reconciliation in Appendix.
|
 16
©
Fifth Third Bank | All Rights Reserved
Cautionary statement
This report contains statements that we believe are “forward-looking statements” within
the meaning of Section 27A of the Securities Act of 1933, as amended, and Rule 175 promulgated
thereunder, and Section 21E of the Securities Exchange Act of 1934, as amended, and Rule
3b-6 promulgated thereunder. These statements relate to our financial condition, results of operations, plans, objectives, future
performance or business. They usually can be identified by the use of forward-looking language
such as “will likely result,” “may,” “are expected to,” “is
anticipated,” “estimate,” “forecast,” “projected,” “intends to,” or may include other similar words or phrases such as
“believes,” “plans,” “trend,” “objective,”
“continue,” “remain,” or similar expressions, or future or conditional verbs such as “will,” “would,”
“should,” “could,” “might,” “can,” or similar verbs. You
should not place undue reliance on these statements, as they are subject to risks and
uncertainties, including but not limited to the risk factors set forth in our most recent Annual Report on Form 10-K. When considering
these forward-looking statements, you should keep in mind these risks and uncertainties, as well
as any cautionary statements we may make. Moreover, you should treat these statements as
speaking only as of the date they are made and based only on information then actually known to
us. There are a number of important factors that could cause future results to differ
materially from historical performance and these forward- looking statements. Factors that
might cause such a difference include, but are not limited to: (1) general economic conditions and
weakening in the economy, specifically the real estate market, either nationally or in the states in
which Fifth Third, one or more acquired entities and/or the combined company do business, are
less favorable than expected; (2) deteriorating credit quality; (3) political developments,
wars or other hostilities may disrupt or increase volatility in securities markets or other economic conditions; (4) changes in
the interest rate environment reduce interest margins; (5) prepayment speeds, loan origination and
sale volumes, charge-offs and loan loss provisions; (6) Fifth Third’s ability to
maintain required capital levels and adequate sources of funding and liquidity; (7) maintaining
capital requirements may limit Fifth Third’s operations and potential growth; (8) changes and
trends in capital markets; (9) problems encountered by larger or similar financial institutions
may adversely affect the banking industry and/or Fifth Third; (10) competitive pressures among
depository institutions increase significantly; (11) effects of critical accounting policies and judgments; (12) changes in
accounting policies or procedures as may be required by the Financial Accounting Standards Board
(FASB) or other regulatory agencies; (13) legislative or regulatory changes or actions, or
significant litigation, adversely affect Fifth Third, one or more acquired entities and/or the
combined company or the businesses in which Fifth Third, one or more acquired entities and/or the combined company are engaged,
including the Dodd-Frank Wall Street Reform and Consumer Protection Act; (14) ability to maintain
favorable ratings from rating agencies; (15) fluctuation of Fifth Third’s stock price;
(16) ability to attract and retain key personnel; (17) ability to receive dividends from its
subsidiaries; (18) potentially dilutive effect of future acquisitions on current shareholders’
ownership of Fifth Third; (19) effects of accounting or financial results of one or more
acquired entities; (20) difficulties from the separation of or the results of operations of Vantiv,
LLC from Fifth Third; (21) loss of income from any sale or potential sale of businesses that could
have an adverse effect on Fifth Third’s earnings and future growth; (22) ability to secure
confidential information and deliver products and services through the use of computer systems
and telecommunications networks; and (23) the impact of reputational risk created by these developments on such matters as
business generation and retention, funding and liquidity.
You should refer to our periodic and current reports filed with the Securities and Exchange
Commission, or “SEC,” for further information on other factors, which could cause
actual results to be significantly different from those expressed or implied by these forward-looking
statements.
|
 ©
Fifth Third Bank | All Rights Reserved
Appendix |
  18
©
Fifth Third Bank | All Rights Reserved
($ in millions)
1Q12
2Q12
3Q12
4Q12
1Q13
Income before income taxes (U.S. GAAP) (a)
$603
$565
$503
$540
$591
Add: Provision expense (U.S. GAAP) (b)
91
71
65
76
62
PPNR (a) + (b)
$694
$636
$568
$616
$653
Adjustments to remove (benefit) / detriment^:
In noninterest income:
Gain from Vantiv IPO (1Q12) and sale of shares (4Q12)
(115)
-
-
(157)
-
Vantiv debt refinancing
34
-
-
-
-
Valuation of 2009 Visa total return swap
19
11
1
15
7
Vantiv warrant & puts
(46)
(56)
16
19
(34)
Valuation of bank premises moved to HFS
-
17
-
-
-
Litigation reserve additions in revenue
-
6
-
-
-
Sale of certain Fifth Third funds
-
-
(13)
-
(7)
Securities (gains) / losses
(9)
(3)
(2)
(2)
(17)
In noninterest expense:
Debt extinguishment (gains) / losses
9
-
26
134
-
Non-income tax related assessment resolution
(23)
-
-
-
-
Sale of certain Fifth Third funds
-
-
2
-
-
Severance expense
6
-
-
-
-
FDIC insurance expense
-
(9)
-
-
-
Gain on sale of affordable housing
-
(8)
(5)
-
(9)
Litigation reserve additions in expense
14
(1)
5
13
9
Adjusted PPNR
$583
$593
$598
$638
$602
Credit-related items^^:
In noninterest income
14
17
14
13
10
In noninterest expense
34
40
59
68
24
Credit-adjusted PPNR**
$631
$650
$671
$719
$636
Pre-tax pre-provision earnings*
PPNR trend
* Non-GAAP measure. See Reg. G reconciliation on page 21.
^ Prior quarters include similar adjustments.
^^ See Slide 19 for detailed breakout of credit-related items.
# 60% also excluding 4Q12 mortgage repurchase reserve build
•
PPNR of $653MM up 6% from 4Q12 levels and down 6% from
prior year
•
Adjusted PPNR of $602MM, down 6% sequentially and up 3%
from prior year
–
Sequential change due primarily to lower mortgage
revenue and seasonal increase in FICA and
unemployment expense, partially offset by lower credit
costs
PPNR reconciliation
Efficiency ratio
583
593
598
638
602
14
17
14
13
10
34
40
59
68
24
$0
$100
$200
$300
$400
$500
$600
$700
$800
1Q12
2Q12
3Q12
4Q12
1Q13
Noninterest Expense Credit Items
Fee Income Credit Items
Adjusted
PPNR
$694 $636 $568
$616 $653
58%
65%
60%
62%
61%
#
62%
1Q12
4Q12
1Q13
Efficiency Ratio
Adjusted
** There are limitations on the usefulness of credit-adjusted PPNR, including the significant
degree to which changes in credit and fair value are integral, recurring components of the
Bancorp’s core operations as a financial institution. This measure has been included herein to
facilitate a greater understanding of the Bancorp’s financial condition. |
 19
©
Fifth Third Bank | All Rights Reserved
Credit-related costs
In noninterest income ($MM)
In noninterest expense ($MM)
Note: Numbers may not sum due to rounding
Total credit-related costs
$48
$57
$73
$81
$34
34
40
59
68
24
$0
$10
$20
$30
$40
$50
$60
$70
$80
1Q12
2Q12
3Q12
4Q12
1Q13
14
17
14
13
10
$0
$2
$4
$6
$8
$10
$12
$14
$16
$18
1Q12
2Q12
3Q12
4Q12
1Q13
Actual
($ in millions)
1Q12
2Q12
3Q12
4Q12
1Q13
Gain / (loss) on sale of loans
$5
$8
$2
$4
$2
Commercial loans HFS FV adjustment
(1)
(5)
(3)
(3)
(1)
Gain / (loss) on sale of OREO
properties
(17)
(19)
(11)
(10)
(10)
Mortgage repurchase costs
(2)
(2)
(2)
(3)
(2)
Total credit-related revenue impact
($14)
($17)
($14)
($13)
($10)
Actual
($ in millions)
1Q12
2Q12
3Q12
4Q12
1Q13
Mortgage
repurchase expense
$15
$18
$36
$44
$20
Provision for unfunded commitments
(2)
(1)
(2)
3
(11)
Derivative valuation adjustments
(4)
(0)
(2)
(2)
(1)
OREO expense
5
5
6
5
4
Other problem asset related expenses
19
19
21
19
12
Total credit-related operating expenses
$34
$40
$59
$68
$24 |
 20
©
Fifth Third Bank | All Rights Reserved
Regulation G Non-GAAP reconciliation
Fifth Third Bancorp and Subsidiaries
Regulation G Non-GAAP Reconcilation
$ and shares in millions
(unaudited)
March
December
September
June
March
2013
2012
2012
2012
2012
Income before income taxes (U.S. GAAP)
$591
$540
$503
$565
$603
Add:
Provision expense (U.S. GAAP)
62
76
65
71
91
Pre-provision net revenue (a)
653
616
568
636
694
Net income available to common shareholders (U.S. GAAP)
413
390
354
376
421
Add:
Intangible amortization, net of tax
1
2
2
2
3
Tangible net
income available to common shareholders 414
392
356
378
424
Tangible net income available to common
shareholders (annualized) (b) 1,679
1,559
1,416
1,520
1,705
Average Bancorp shareholders' equity (U.S. GAAP)
13,779
13,855
13,887
13,628
13,366
Less:
Average preferred stock
(398)
(398)
(398)
(398)
(398)
Average goodwill
(2,416)
(2,417)
(2,417)
(2,417)
(2,417)
Average intangible assets
(26)
(28)
(31)
(34)
(38)
Average tangible common equity
(c) 10,939
11,012
11,041
10,779
10,513
Total Bancorp shareholders' equity (U.S. GAAP)
13,882
13,716
13,718
13,773
13,560
Less:
Preferred stock
(398)
(398)
(398)
(398)
(398)
Goodwill
(2,416)
(2,416)
(2,417)
(2,417)
(2,417)
Intangible assets
(25)
(27)
(30)
(33)
(36)
Tangible common equity, including
unrealized gains / losses (d) 11,043
10,875
10,873
10,925
10,709
Less: Accumulated other comprehensive income / loss
(333)
(375)
(468)
(454)
(468)
Tangible common equity, excluding unrealized gains /
losses (e) 10,710
10,500
10,405
10,471
10,241
Total assets (U.S. GAAP)
121,382
121,894
117,483
117,543
116,747
Less:
Goodwill
(2,416)
(2,416)
(2,417)
(2,417)
(2,417)
Intangible assets
(25)
(27)
(30)
(33)
(36)
Tangible assets, including
unrealized gains / losses (f) 118,941
119,451
115,036
115,093
114,294
Less: Accumulated other comprehensive income / loss, before tax
(512)
(577)
(720)
(698)
(720)
Tangible assets, excluding unrealized gains / losses
(g) 118,429
118,874
114,316
114,395
113,574
Common shares outstanding (h)
875
882
897
919
920
Net charge-offs (i)
133
147
156
181
220
Ratios:
Return on average tangible common equity (b) / (c)
15.5%
14.1%
12.8%
14.1%
16.2%
Tangible common equity (excluding unrealized gains/losses) (e) / (g)
9.03%
8.83%
9.10%
9.15%
9.02%
Tangible common equity (including unrealized gains/losses) (d) / (f)
9.29%
9.10%
9.45%
9.49%
9.37%
Tangible book value per share (d) / (h)
12.63
12.33
12.12
11.89
11.64
PPNR / NCOs (a) / (i)
491%
419%
364%
351%
315%
For the Three Months Ended |
 21
©
Fifth Third Bank | All Rights Reserved
Regulation G Non-GAAP reconciliation
Fifth Third Bancorp and Subsidiaries
Regulation G Non-GAAP Reconcilation
$ and shares in millions
(unaudited)
March
December
September
June
March
2013
2012
2012
2012
2012
Total Bancorp shareholders' equity (U.S. GAAP)
$13,882
$13,716
$13,718
$13,773
$13,560
Goodwill and certain other intangibles
(2,504)
(2,499)
(2,504)
(2,512)
(2,518)
Unrealized gains
(333)
(375)
(468)
(454)
(468)
Qualifying trust preferred securities
810
810
810
2,248
2,248
Other
23
33
38
38
38
Tier I capital
11,878
11,685
11,594
13,093
12,860
Less:
Preferred stock
(398)
(398)
(398)
(398)
(398)
Qualifying trust preferred securities
(810)
(810)
(810)
(2,248)
(2,248)
Qualifying noncontrolling interest in consolidated subsidiaries
(38)
(48)
(51)
(51)
(50)
Tier I common equity (a)
10,632
10,429
10,335
10,396
10,164
Risk-weighted assets, determined in accordance with
prescribed regulatory requirements (b)
109,626
109,699
106,858
106,398
105,412
Ratio:
Tier I common equity (a) / (b)
9.70%
9.51%
9.67%
9.77%
9.64%
Basel III - Estimates
March
December
September
June
2013
2012
2012
2012
Tier 1 common equity (Basel I)
$10,632
$10,429
$10,335
$10,396
Add:
Adjustment related to AOCI for AFS securities
397
429
506
551
Estimated Tier 1 common equity under Basel III rules (c)
$11,029
$10,858
$10,841
$10,947
Estimated risk-weighted assets under Basel III rules (d)
$123,696
$123,725
$120,308
$119,428
Estimated Tier 1 common equity ratio under Basel III rules
8.91%
8.78%
9.01%
9.17%
(c)
(d)
Tier 1 common equity under Basel III includes the unrealized gains and losses for AFS securities.
Other adjustments include mortgage servicing rights and deferred tax assets subject to threshold
limitations and deferred tax liabilities related to intangible assets.
Key differences under Basel III in the calculation of risk-weighted assets compared to Basel I
include: (1) Risk weighting for commitments under 1 year; (2) Higher risk weighting for exposures to
residential mortgage, home equity, past due loans, foreign banks and certain commercial real estate;
(3) Higher risk weighting for mortgage servicing rights and deferred tax assets that are under
certain thresholds as a percent of Tier 1 capial; (4) Incremental capital requirements for stress VaR;
and (5) Derivatives are differentiated between exchange clearing and over-the-counter and the
50% risk-weight cap is removed. The estimated Basel III risk-weighted assets are based upon
the Bancorp’s interpretations of the three draft Federal Register notices proposing enhancements to
the regulatory capital requirements that were published in June of 2012. These amounts are preliminary
and subject to change depending on the adoption of final Basel III capital rules by the
Regulatory Agencies.
For the Three Months Ended
For the Three Months Ended |
 22
©
Fifth Third Bank | All Rights Reserved
Regulation G Non-GAAP reconciliation
Fifth Third Bancorp and Subsidiaries
Regulation G Non-GAAP Reconcilation
$ and shares in millions
(unaudited)
2012
2011
2010
2009
Total Bancorp shareholders' equity (U.S. GAAP)
$13,716
$13,201
$14,051
$13,497
Goodwill and certain other intangibles
(2,499)
(2,514)
(2,546)
(2,565)
Unrealized gains
(375)
(470)
(314)
(241)
Qualifying trust preferred securities
810
2,248
2,763
2,763
Other
33
38
11
(26)
Tier I capital
11,685
12,503
13,965
13,428
Less:
Preferred stock
(398)
(398)
(3,654)
(3,609)
Qualifying trust preferred securities
(810)
(2,248)
(2,763)
(2,763)
Qualifying noncontrolling interest in consolidated subsidiaries
(48)
(50)
(30)
-
Tier I common equity (a)
10,429
9,807
7,518
7,056
Risk-weighted assets, determined in accordance with
prescribed regulatory requirements (b)
109,699
104,945
100,561
100,933
Ratio:
Tier I common equity (a) / (b)
9.51%
9.35%
7.48%
6.99%
For the Year Ended |