Attached files
| file | filename |
|---|---|
| 8-K - FORM 8-K - Ameris Bancorp | d542163d8k.htm |
 1
Quarter 2013
Investor Presentation
st
Exhibit 99.1 |
 2
Cautionary Statements
This presentation contains certain performance measures
determined by methods other than in accordance with
accounting principles generally accepted in the United States of
America (“GAAP”). Management of Ameris Bancorp (the
“Company”) uses these non-GAAP measures in its analysis of
the Company’s performance. These measures are useful when
evaluating the underlying performance and efficiency of the
Company’s operations and balance sheet. The Company’s
management believes that these non-GAAP measures provide a
greater understanding of ongoing operations, enhance
comparability of results with prior periods and demonstrate the
effects of significant gains and charges in the current period.
The Company’s management believes that investors may use
these non-GAAP financial measures to evaluate the Company’s
financial performance without the impact of unusual items that
may obscure trends in the Company’s underlying performance.
These disclosures should not be viewed as a substitute for
financial measures determined in accordance with GAAP, nor
are they necessarily comparable to non-GAAP performance
measures that may be presented by other companies. Tangible
common equity and Tier 1 capital ratios are non-GAAP
measures. The Company calculates the Tier 1 capital using
current call report instructions. The Company’s management
uses these measures to assess the quality of capital and believes
that investors may find them useful in their evaluation of the
Company. These capital measures may, or
may not be necessarily comparable to similar capital measures
that may be presented by other companies.
This presentation may contain statements that constitute
“forward-looking
statements”
within
the
meaning
of
Section
27A of the Securities Act of 1933, as amended, and
Section
21E
of
the
Securities
Exchange
Act
of
1934,
as
amended. The words “believe”, “estimate”, “expect”,
“intend”, “anticipate”
and similar expressions and variations thereof
identify certain of such forward-looking statements, which speak
only as of the dates which they were made. The Company
undertakes no obligation to publicly update or revise any
forward-looking statements, whether as a result of new
information, future events or otherwise. Readers are cautioned
that any such forward-looking statements are not guarantees of
future performance and involve risks and uncertainties and that
actual results may differ materially from those indicated in the
forward-looking statements as a result of various factors.
Readers are cautioned not to place undue reliance on these
forward-looking statements and are referred to the Company’s
periodic filings with the Securities and Exchange Commission for
a summary of certain factors that may impact the Company’s
results of operations and financial condition. |
 Corporate
Profile •
Headquartered in Moultrie, Georgia
•
Founded in 1971 as American Banking
Company
•
Historically grown through acquisitions of
smaller banks in areas close to existing
operations
•
Recent growth through de novo expansion
strategy and 10 FDIC-assisted transactions
•
Four state footprint with 57 offices
•
Approximately 820 FTEs managing 200,000
core customer accounts
•
Assets –
$2.9 billion
Loans –
$2.0 billion
Deposits –
$2.5 billion
3 |
 4
Management and Board Ownership of Approximately 7%
Experienced Management Team
Name, Position
Experience
(Banking / Ameris)
Previous Experience
Edwin W. Hortman Jr.
Chief Executive Officer
Andrew B. Cheney
EVP & Chief Operating Officer
Dennis J. Zember Jr.
EVP & Chief Financial Officer
Jon S. Edwards
EVP & Chief Credit Officer
Stephen A. Melton
EVP, Chief Risk Officer
Cindi H. Lewis
EVP, Chief Administrative Officer
T. Stan Limerick
EVP, Chief Information Officer
32/14
36/3
19/7
28/13
32/2
36/36
7/1
Colony Bankcorp, Inc.
Barnett Bank, Mercantile Bank
Flag Financial Corporation
NationsBank, Federal Reserve
Columbus Bank & Trust (lead bank SNV)
Officer at Ameris Bank since 1987
Whitney National Bank |
 Realize the
positive impacts of our Earnings Strategies •
Continue to drive double digit growth in loans and low-cost/no-cost funding.
•
Design and implement strategies to build more efficient banking platform. Rationalize
branch network and position Bank for faster growth in assets.
•
Build
additional
non-interest
income
lines
of
businesses
to
drive
revenue
towards
the
top
quartile of our peer group. Leverage premier mortgage platform for better
profitability. •
Recognize a reduction in credit related expenses commensurate with the significant reduction
in classified and non-accrual assets.
Position Ameris Bank as a Consolidator in our 4 Southeastern States
•
Complete
Integration
of
Prosperity
Bank
by
end
of
3Q
2013
and
be
at
a
full
run
rate
on
forecasted accretion by January 1, 2014.
•
Traditional
M&A
–
Continue
to
build
relationships
with
potential
merger
partners
as
the
pipeline of opportunities in our footprint grows.
•
FDIC
Assisted
acquisitions
–
Slowing
pipeline
of
opportunities with mostly non-loss share
opportunities. Markets still have troubled and weakened institutions that will fail but
our interest is shifting to more traditional M&A.
5
Current Focus |
 6
(1)
Excludes covered assets, where applicable
First Quarter Update
dollars in millions, except per share data
Q1 '12
Q2 '12
Q3 '12
Q4 '12
Q1 '13
Change
BALANCE SHEET
Assets
$3,043
$2,920
$2,949
$3,019
$2,862
(5.95)%
Loans, net
1,949
1,941
2,015
2,007
1,996
2.41
Tang Common Equity / Assets
7.95%
8.41%
8.27%
8.23%
8.83%
11.07
Tangible Book Value
$10.15
$10.29
$10.23
$10.39
$10.57
4.14
PERFORMANCE
Pre-tax, pre-credit earnings
$13,634
$14,700
$13,728
$13,728
$14,281
4.75 %
as a percentage of average assets
1.84%
1.99%
1.86%
1.82%
2.00%
Revenue (ex acquisition gains)
$34,954
$37,756
$38,069
$40,672
$39,698
13.57
as a percentage of average assets
4.59%
5.17%
5.16%
5.39%
5.55%
OPEX (ex credit costs)
$21,507
$23,200
$25,104
$24,993
$24,040
11.78
as a percentage of average assets
2.83%
3.18%
3.41%
3.31%
3.36%
Diluted earnings per share
0.19
0.07
0.04
0.15
0.20
5.26
Net interest margin (TE)
4.48 %
4.66 %
4.52 %
4.72 %
4.79 %
6.92
Efficiency ratio (ex credit costs)
61.53%
61.45%
75.68%
65.70%
60.56%
(1.58)
CREDIT QUALITY
(1)
NPAs / Assets
3.03%
2.89%
2.58%
2.61%
2.72%
(10.23)%
Classified Assets / Capital
35.07
32.05
31.44
33.45
31.7
(9.61)
Reserves / Loans
2.17
1.92
1.80
1.63
1.57
(27.65)
Reserves / NPLs
54.90
58.98
67.76
60.67
62.39
13.64 |
 •
Diversified loan portfolio across five regions
–
Inland Georgia –
51%
–
Coastal Georgia –
15%
–
Alabama –
8%
•
In-house lending limit of $7.5 million versus $75 million legal limit
–
5 loans greater than $5 million
•
Loan participations less than 1.00% of total loans
•
Aggressive management of concentrations of credit
•
Top 25 relationships
are only 9.6% of total loans
7
–
South Carolina –
13%
–
Florida –
13%
Loan Type
Average Loan
Size
Average Rate
Investor CRE
$ 425,335
5.15 %
C&D
100,350
5.25
Residential
71,248
5.64
C&I
59,384
4.98
O/O CRE
306,921
5.50
Covered loans
143,720
5.38
Consumer
6,579
6.56
Agriculture
110,196
5.70
Total
$ 80,464
5.44 %
Loan Portfolio Detail
Loan Portfolio Detail –
3/31/13
Covered
28%
Agriculture
9%
Construction
6%
Non-owner
occupied CRE
15%
Owner
Occupied CRE
15%
Consumer
Installment &
Residential
20%
C&I
7% |
 •
Leveraging presence in new markets (top five markets
account for 70% of pipeline: Atlanta, Jacksonville,
Columbia, Savannah, Charleston
•
Upgrading production positions in key markets: limited
changes to expense base but higher levels of quality
production
•
Expanding Mortgage Strategy: Jumbo mortgages,
wholesale, warehouse LOC
•
Leveraging Agricultural expertise: better yields than in
CRE due to limited competition
•
Specialty lines of business that would diversify loan
portfolio
•
Yields on current production approximately
5.13%
•
2/3
rds
of production is with existing customers –
higher rates (40bps-50bps from relationships)
•
Diversified loan types –
not solely chasing CRE
or competing with low rates that do not
compensate for term or quality
8
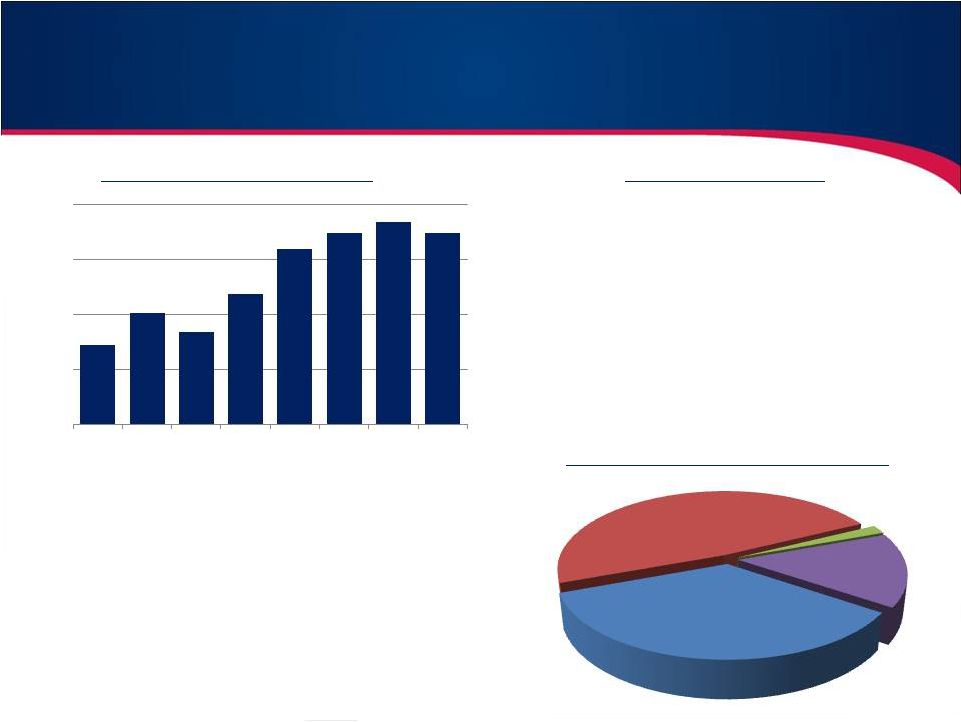
Loan Portfolio –
strong loan pipelines
Growth in Loan Pipelines¹
Lending Strategies
Pipeline Opportunities by Type
1 –
Loan pipeline amounts consist of all loans management has deemed a 75% or better likelihood of
closing. $160
$120
$80
$40
$0
Loan Pipeline EOQ
(in millions)
2Q 11
3Q 11
4Q 11
1Q 12
2Q 12
3Q 12
4Q 12
1Q 13
$57.9
$80.8
$67.2
$95.0
$127.4
$139.0
$147.2
$139.2
Commercial
R/E 48.3%
Comm’l Finc’l
& Agriculture,
34.9%
Residential
R/E 15.0%
Construction,
1.8% |
 9
•
$11.5 million
-
Largest Relationship has over 3.0x debt coverage, backed by taxing authority of one of
our local markets.
•
1.75x
–
Weighted average debt coverage of our 25 largest relationships.
•
64% -
Weighted average loan to value on our 25 largest relationships.
Loan Portfolio
Diversified through smaller relationships as well
Portfolio comprised of smaller relationships
Relationship Totals in Legacy Portfolio (in millions)
Rank
Total O/S
% of total
Top 10
$ 81.81
5.64%
Top 50
$ 242.53
16.72%
Top 100
$ 376.12
25.93%
Top 200
$ 544.95
37.57%
Top 300
$ 659.13
45.44%
$12
$8
$4
$0
25
50
75
100
125
150
Number of Loan Relationships
$11.53
$4.23
$3.11
$2.24
$1.69 |
 10
•
$0.44 per share –
Additional earnings embedded in today’s Balance Sheet vs. 2008.
Today’s deposit mix would have reduced interest expense by 30% in 2008, or $16.0
million. •
Built significant value in our core deposit base
•
Focused largely on “Non-Rate Sensitive”
deposits
Significant Value in Deposit Portfolio
Future revenue opportunity is large, and growing
Deposit Composition –
3/31/13
Deposit Composition –
12/31/08
mmda,
13%
Brokered
CDs, 10%
Retail
CDs, 46%
now/sav,
20%
nib, 10%
NOW &
Savings, 29%
MMDA, 23%
Retail Time,
27%
DDA, 19%
Brokered, 1% |
   11
FDIC Indemnification Asset
Managing towards the end of loss share protection
I/A
–
Indemnification
Asset
for
reimbursement
on
expected
losses
from
the
FDIC
1-
Months
remaining
to
collect
remainder
of
indemnification
asset
is
a
weighted
average
based
on
the
indemnification
asset
at
12/31/2012.
2
-
Current
Estimate
of
losses
includes
all
losses
incurred
to
date
as
well
as
reimbursable
expenses
plus
expected
losses
not
incurred
for
which
there
is
a
corresponding
indemnification
asset.
Original
estimate
of
losses
includes
gross
losses
identified
in
due
diligence
and
7.5%
for
workout
expenses.
Bank
Original I/A
Current
I/A
% of
Original
Remaining
Months to
Collect
Original
Estimate of
Losses
Current
Estimate of
Losses
% of
Original
NBV
I/A
NBV
I/A on
Loans
AUB
24,200
2,088
8.6%
17.9
32,519
26,362
81.1%
953
48
22,493
2,007
USB
21,640
2,015
9.3%
18.9
29,079
40,887
140.6%
3
0
22,042
2,015
SCB
22,400
2,789
12.5%
24.9
30,100
29,957
99.5%
647
19
36,819
2,551
FBJ
11,307
4,602
40.7%
30.9
15,194
11,029
72.6%
423
66
25,806
4,529
TBC
22,807
5,012
22.0%
31.9
30,647
28,613
93.4%
213
77
37,719
3,560
DBT
112,404
28,223
25.1%
31.9
172,620
146,529
84.9%
1,477
361
110,634
26,907
HTB
49,485
14,009
28.3%
38.8
66,495
56,105
84.4%
180
29
68,085
11,254
OGB
45,488
15,217
33.5%
38.8
61,125
38,949
63.7%
316
100
58,275
11,901
CBG
52,664
25,951
49.3%
45.9
70,767
55,646
78.6%
2,705
912
78,851
24,484
362,395
99,906
27.6%
36.6
508,546
434,077
85.4%
6,917
1,611
460,724
89,208
All Loans
Classifieds Maturing
After L/S |
 •
2012
revenue
gains
boosted
by
growing
loan
portfolio
and
success
in
non-
interest income strategies.
•
2013-2015 strategy demands:
•
Diversification of revenue with more emphasis on highly profitable
non-interest income LOB’s that enhance ROA and reduce burden on
capital leverage
•
Protect our advantage from strong net interest margins with emphasis on
creating a highly favorable funding mix
12
Earnings –
Continued Growth in Revenue
Revenue growth through this cycle with
opportunistic strategies:
•
15%+ compounded annual growth rate in total
revenue over the last three years
•
Revenue has grown faster than earning assets
•
Significant amount of assets that will be
deployed over the next 3 years that will
significantly boost revenue and earnings
•
>30% -
CGR for mortgage related
revenue
•
>21% -
CGR for debit interchange
fees
•
>8% -
CGR for analysis and
overdraft fees |
 13
(1)
Maturity and Repricing Opportunity are amounts and yields maturing in the designated
quarter (2)
Ameris Bank net interest margin on a fully taxable-equivalent basis, excludes H/C level
TRUPs .
Loans
CDs
Quarter
Yield
Quarter
Yield
Q4 '11
5.38%
Q4 '11
0.67%
Q1 '12
5.48%
Q1 '12
0.65%
Q2 '12
5.45%
Q2 '12
0.54%
Q3 '12
5.28%
Q3 '12
0.51%
Q4 '12
5.11%
Q4 '12
0.44%
Q1 '13
5.13%
Q1 '13
0.49%
•
79.6% of lost revenue from loan repricing covered by CD renewal savings.
•
Management expects limited dilution (5-10bps) in NIM from balance sheet repricing and
believes volume expansion can more than offset revenue impacts.
Earnings -
Net Interest Margin
Net Interest Margin
(2)
(%)
“Acquisition Yields” |
 Significant
growth
in
mortgage
revenue
–
currently
all
from
retail
activities
•
Still hiring highly experienced, high volume teams
•
Current retail production is $35mm per month, potential
and platform to double in 12-18 months
Wholesale activities gaining traction
•
Hiring experienced relationship managers from large
wholesale players
•
Larger volume opportunity in wholesale relative to retail
activities
14
Serious about building strength and diversification in non-
interest income sources
•
Moving away from deposit charges
•
Researching unique lines of business
•
Momentum in our numbers coming from mortgage
revenue; we believe we can duplicate that strategy
with other LOBs by hiring expertise
Peer group comparison are banks greater than $3 billion
•
BOLI income expected to incr by $1mm in 2013
Earnings –
Non-Interest Income |
 15
Details regarding the recently announced Corporate Restructuring:
Branch Rationalization –
Closing 20% of our retail branch locations, either in smaller markets or areas where our
market share is not sufficient to drive desired profitability.
“At-risk”
loans and non-CD deposits in these branches are $59.4 million and $104 million. We
expect to retain 71% of the loans and 35% of the deposits.
Total OPEX for these 13 branches in 2012 were $6.45 million. Non-interest income
totaled $1.39 million. Total expected improvement in operating expenses is $4.9
million in 2013 and $6.5 million in 2014.
Restructuring line divisions –
Restructuring sales and sales efforts in the bank to focus on larger, longer tenured
commercial clients Expected savings of $3.6 million resulting mainly from consolidation
of 50 positions. Re-distribution of corporate functions –
Re-distributing certain clerical & support functions to the field
Restructuring credit administration and approval process to streamline approval and support
of smaller credits.
Expected savings of $2.4 million resulting mainly from consolidation of 38 positions.
Earnings -
Corporate Restructure & Improved Efficiency |
 16
M&A Opportunities
(Significant opportunity building in our 4-State Footprint)
Southeast Banking Statistics show positive and
negative trends.
(Data
for
563
banks
smaller
than
Ameris
Bank
in
our
four
states)
Improving Ratios:
20%
–
Banks with Texas ratios still over 75%. Down from 28%
one year ago.
18%
–
Banks with capital ratios below 8.00% T1 Leverage.
Down
from
22%
one
year
ago.
(virtually
all
from
deleveraging)
8%
–
Improvement in the median ROAA (from 0.53% to
0.57%)
Indicators that Consolidation is necessary:
60%
–
Banks with less revenue in 1Q 2013 compared to 1Q
2012.
58%
–
Banks with worse efficiency ratios in 1Q 2013
compared to 1Q 2012.
59%
–
Banks with smaller loan books today than in 1Q
2012.
62%
–
Banks that failed to expand the distance between
net interest income and non-interest expense.
•
Improvement in credit quality and capital levels
of targets and the earnings and multiples of
acquirers should produce continued ramp in
M&A.
•
More banks are shrinking than growing. Fierce
competition for higher quality assets being won
by those that can afford it (those with better
efficiency and funding sources)
•
Too few banks have come to grips with need for
better efficiency. Because growth is constrained,
M&A is evaluated positively against branch
closures, reduction in force strategies, etc. |
 |