Attached files
| file | filename |
|---|---|
| 8-K - FORM 8-K - Xylem Inc. | d540767d8k.htm |
 XYLEM
INC. ELECTRICAL PRODUCTS GROUP CONFERENCE
MAY 21, 2013
Exhibit 99.1 |
 XYLEM PROPRIETARY / CONFIDENTIAL
FORWARD-LOOKING STATEMENTS
2
This document contains information that may constitute “forward-looking
statements.” Forward-looking statements by their nature address matters that
are, to different degrees, uncertain. Generally, the words “anticipate,” “estimate,” “expect,”
“project,” “intend,” “plan,” “believe,”
“target” and similar expressions identify forward-looking statements, which generally are
not historical in nature. However, the absence of these words or similar expressions does not
mean that a statement is not forward-looking.
These forward-looking statements include, but are not limited to, statements about the
separation of Xylem Inc. (the “Company”) from ITT Corporation in 2011,
capitalization of the Company, future strategic plans and other statements that describe the
Company’s business strategy, outlook, objectives, plans, intentions or goals, and any
discussion of future operating or financial performance. All statements that address
operating performance, events or developments that we expect or anticipate will occur in
the future — including statements relating to orders, revenues, operating margins and earnings per share growth, and
statements expressing general views about future operating results — are
forward-looking statements. Caution should be taken not to place undue reliance on any such forward-looking statements
because they involve risks, uncertainties and other factors that could cause actual
results to differ materially from those expressed or implied in, or reasonably inferred
from, such statements. The Company undertakes no obligation to publicly update or revise any forward-
looking statements, whether as a result of new information, future events or otherwise, except
as required by law. In addition, forward-looking statements are subject to certain
risks and uncertainties that could cause actual results to differ materially from the
Company’s historical experience and our present expectations or projections. These risks and uncertainties include, but are
not limited to, those set forth in Item 1A of our Annual Report on Form 10-K, and those
described from time to time in subsequent reports filed with the Securities and Exchange
Commission. |
 XYLEM PROPRIETARY / CONFIDENTIAL
3
•
Pure Water Play
•
Leading Market Positions
•
Fortress Brands & World Class
Distribution
•
Diverse Geographic & End
Market Exposure
•
Large Installed Base -
Recurring Revenue ~37%
•
Strong Cash Flow Generation
$3.8B
WHAT MAKES XYLEM UNIQUE?
GLOBAL LEADER IN WATER APPLICATION SOLUTIONS
ABILITY TO DELIVER CONSISTENT FINANCIAL PERFORMANCE |
 XYLEM PROPRIETARY / CONFIDENTIAL
4
WATER IS ONE OF THE MOST COMPLEX,
CHALLENGING AND INCREASINGLY VISIBLE
ISSUES FACING SOCIETY
UNIQUELY POSITIONED TO SOLVE THE WORLD’S GROWING WATER CHALLENGES
|
 XYLEM PROPRIETARY / CONFIDENTIAL
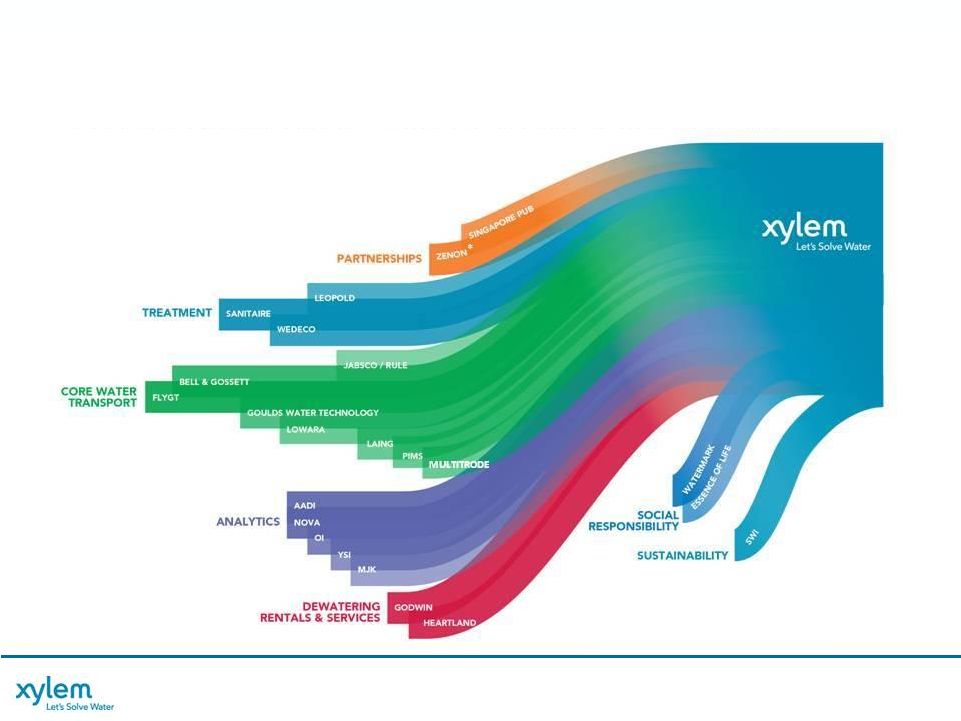
EVOLUTION TO A LEADING
GLOBAL WATER TECHNOLOGY PROVIDER
5
MULTITRODE
* Zenon is a registered trademark of GE |
 XYLEM PROPRIETARY / CONFIDENTIAL
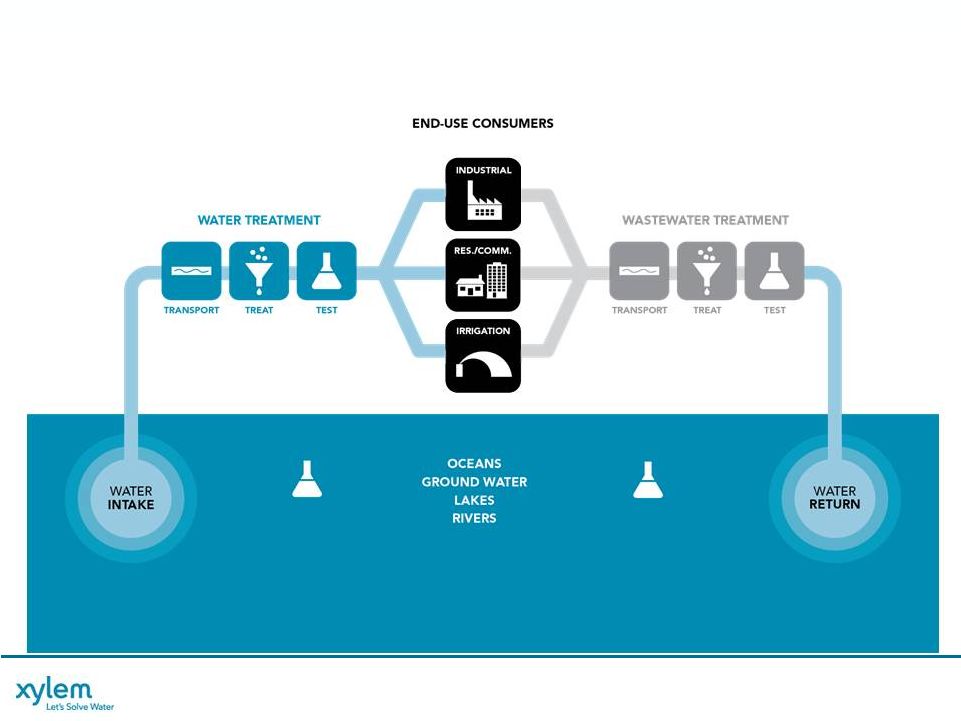
SPECIALIZED BREADTH IN THE WATER CYCLE
6
WE
WORK
TO
ANTICIPATE
OUR
CUSTOMERS’
NEEDS
WITH
OUR
BROAD PRODUCT OFFERING & OUR APPLICATIONS EXPERTISE
TEST
TEST |
 XYLEM PROPRIETARY / CONFIDENTIAL
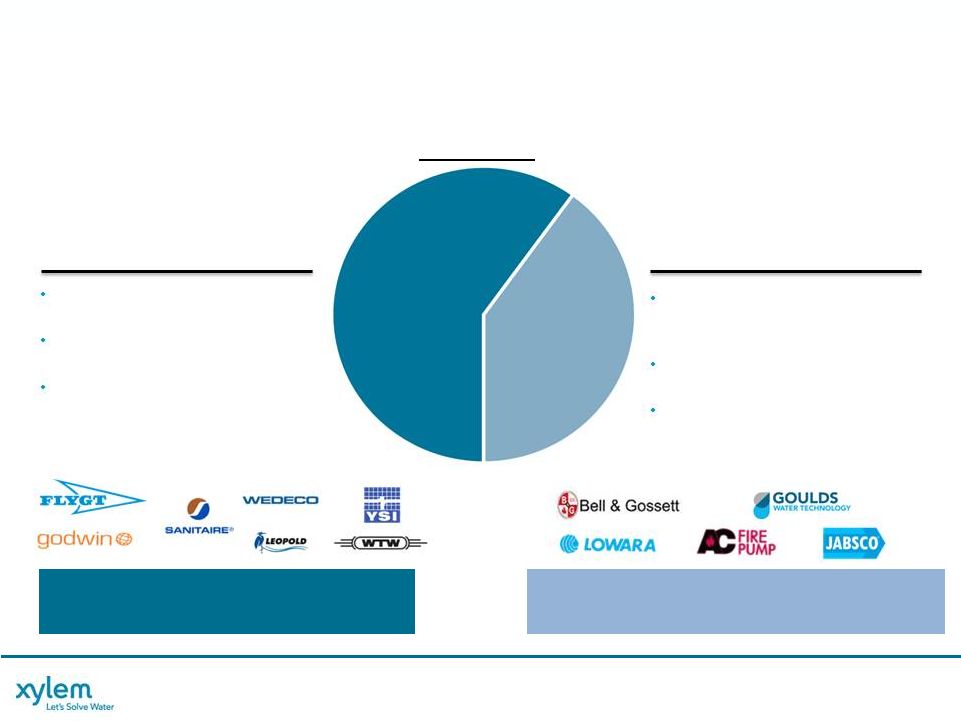
WATER INFRASTRUCTURE
Market Size: $20B
2012 Revenues: $2.4B
2012 Op Margin*: 15.1%
APPLIED WATER
Market Size: $15B
2012 Revenues: $1.4B
2011 Op Margin*: 12.4%
7
SEGMENT OVERVIEW
64%
64%
36%
Segment Split
UNIQUE PORTFOLIO PROVIDES FOR
UNIQUE PORTFOLIO PROVIDES FOR
INNOVATIVE SOLUTIONS
INNOVATIVE SOLUTIONS
BROAD PRODUCT PORTFOLIO BACKED BY
BROAD PRODUCT PORTFOLIO BACKED BY
APPLICATION EXPERTISE
APPLICATION EXPERTISE
* See Appendix for Non-GAAP Reconciliations
Industry-Leading Water &
Environment Analytics Platform
Broad Portfolio of Filtration, Biological
and Disinfection Technologies
World’s Largest Waste Water Pump &
Dewatering Services Provider
U.S. Leader in Industrial Water
Technologies
U.S. Leader in Building Services
Equipment & Solutions
Leading Global Provider of a Broad
Range of Energy-Efficient Solutions
with a Large & Diverse Customer Base |
 XYLEM PROPRIETARY / CONFIDENTIAL
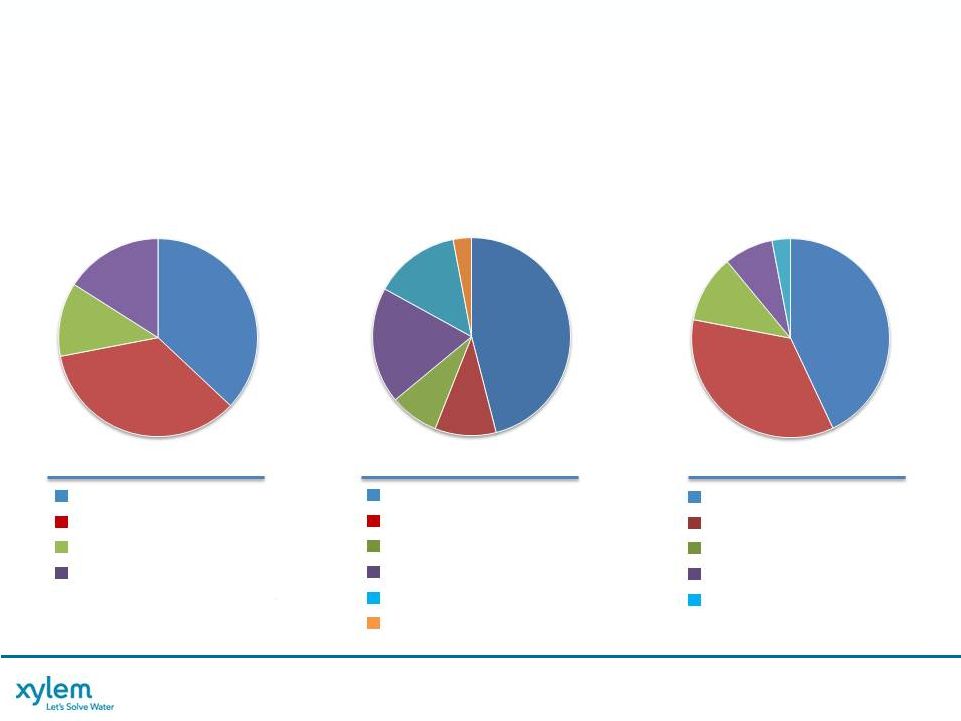
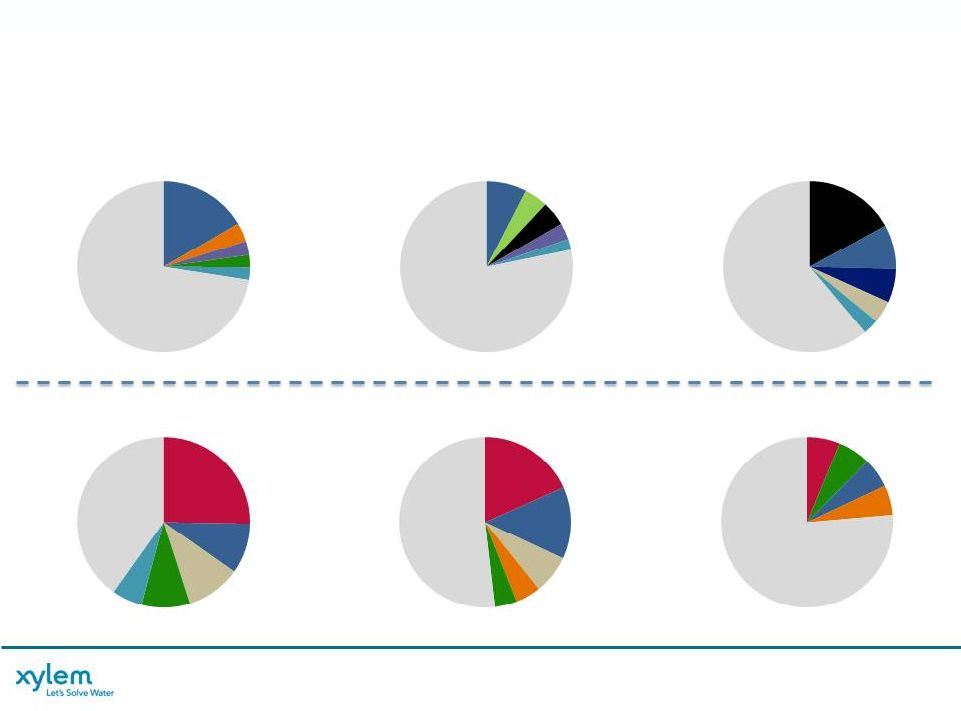
BALANCED PORTFOLIO
8
DIVERSE
CUSTOMER
BASE
SERVING
CRITICAL
NEEDS
GLOBAL
MARKET
BALANCE
BY END MARKET
Industrial
43%
Public Utility
35%
Commercial
11%
Residential
8%
Agriculture
3%
BY APPLICATION
Transport
46%
Treatment
10%
Test
8%
Building Svcs
19%
Industrial Water
14%
Irrigation
3%
BY GEOGRAPHY
United States
37%
Europe
35%
Asia Pac
12%
Rest of World
16%
A Growing Emerging Market
Presence …
Today ~20%
(2012 Revenue) |
 XYLEM PROPRIETARY / CONFIDENTIAL
9
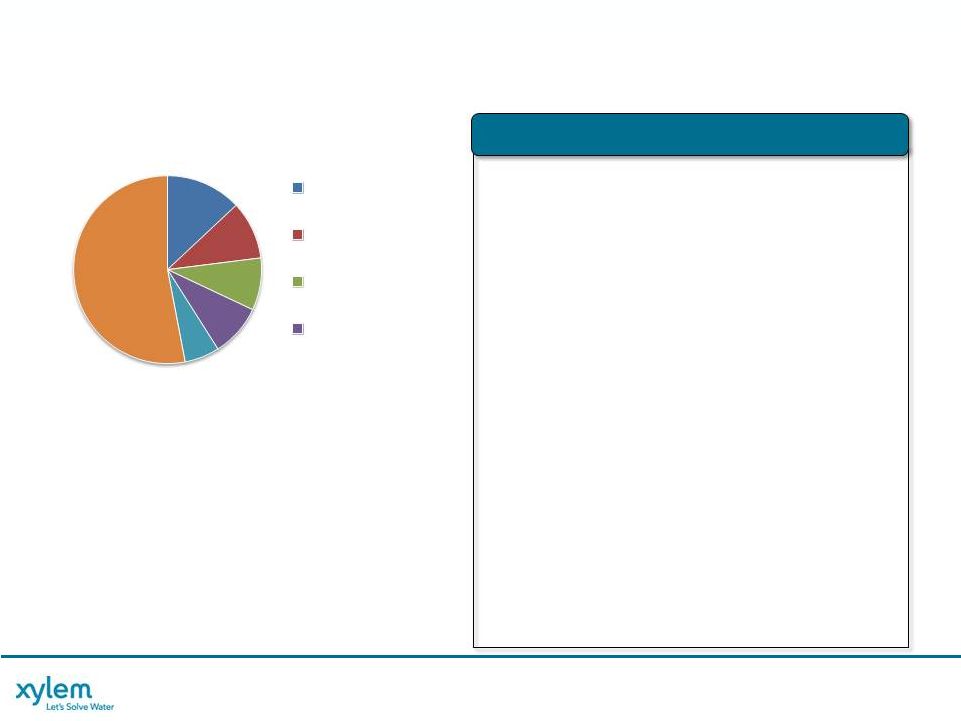
KEY END MARKETS
INDUSTRIAL
•
Strong Brands
•
Deep Application Knowledge
•
Broad Product Portfolio
•
Improving Vitality Index
•
Expansion of Existing Products in
Adjacent Markets
MINING
•
Commodity Demand
OIL & GAS
•
Natural Gas Fracking Activity
CONSTRUCTION
•
Commercial & Residential Construction
•
Weather
FOOD & BEVERAGE
•
Changing Dietary Habits
•
Emergence of Middle Class in EM
GENERAL INDUSTRY
•
Paper
•
Power
•
Manufacturing
Xylem 2012 Revenue: $1.6B
•
Chemicals
•
Pharma
DIVERSE MARKET DRIVERS
DIVERSE MARKET DRIVERS
13%
10%
9%
9%
6%
53%
Mining
Oil & Gas
Construction
Food &
Beverage |
 XYLEM PROPRIETARY / CONFIDENTIAL
10
KEY END MARKETS
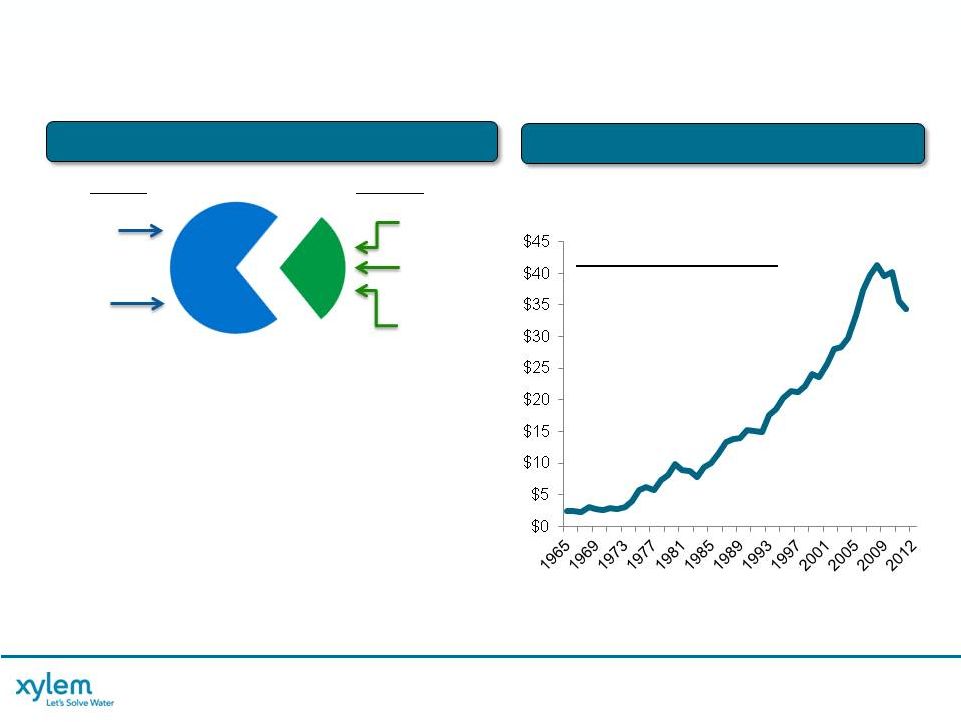
PUBLIC UTILITY
•
Large Installed Base with Loyal Customers
•
Consistent Tariff Increases
•
70-80% of Revenues from Opex
•
Capex Spending Below Historical Levels but
Bid Activity Remains Strong
~70%
~70%
~30%
~30%
Opex
Capex
Connection
Fees
Tariffs
Bonds
Gov’t
Financing
Private
Funding
•
Stable
•
Health & Economic
Necessity
•
Cyclical
•
Capacity &
Regulation Driven
Source: Strategic Analytics Inc.
U.S. Water and Sewer Construction
Spending
-
$B
Source: U.S. Census Bureau (April 2013)
PUBLIC UTILITY DYNAMICS
PUBLIC UTILITY DYNAMICS
U.S. CAPEX SPENDING
U.S. CAPEX SPENDING
•
Residential & Commercial
Real Estate Development
•
Industrial Expansion
•
Increasing Regulation
General Growth Drivers: |
 XYLEM PROPRIETARY / CONFIDENTIAL
11
KEY END MARKETS
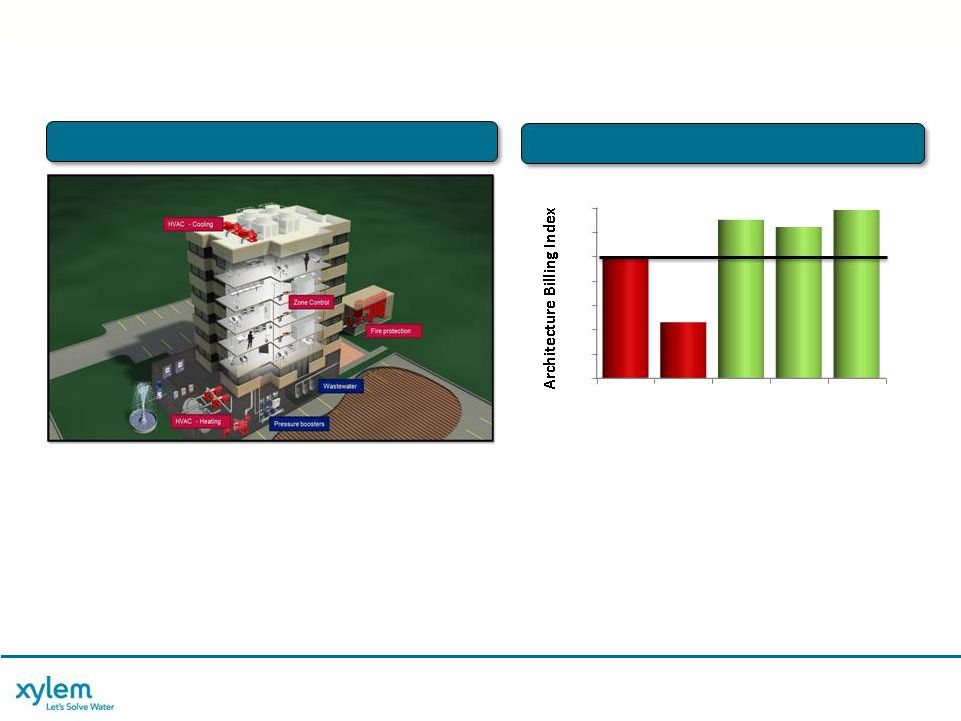
COMMERCIAL BUILDINGS
•
Products for the Heating, Cooling and Protection of Commercial Buildings
•
Broadest Offering Allows for Optimizing Interaction of Key Building Components
•
Demand for Energy Efficient Solutions has Driven Retrofit Activity During the
Recent Multi-Year New Building Construction Slowdown
•
Application Expertise Makes Xylem a Strong Partner for Specifying Engineers
INTEGRATED SOLUTIONS
ARCHITECTURE BILLING INDEX
Source: AIA. Index Value of 50=No change from previous period.
45
46
47
48
49
50
51
52
Mar '12
Jun '12
Sept '12
Dec '12
Mar '13
49.9
47.3
51.5
51.2
51.9 |
 XYLEM PROPRIETARY / CONFIDENTIAL
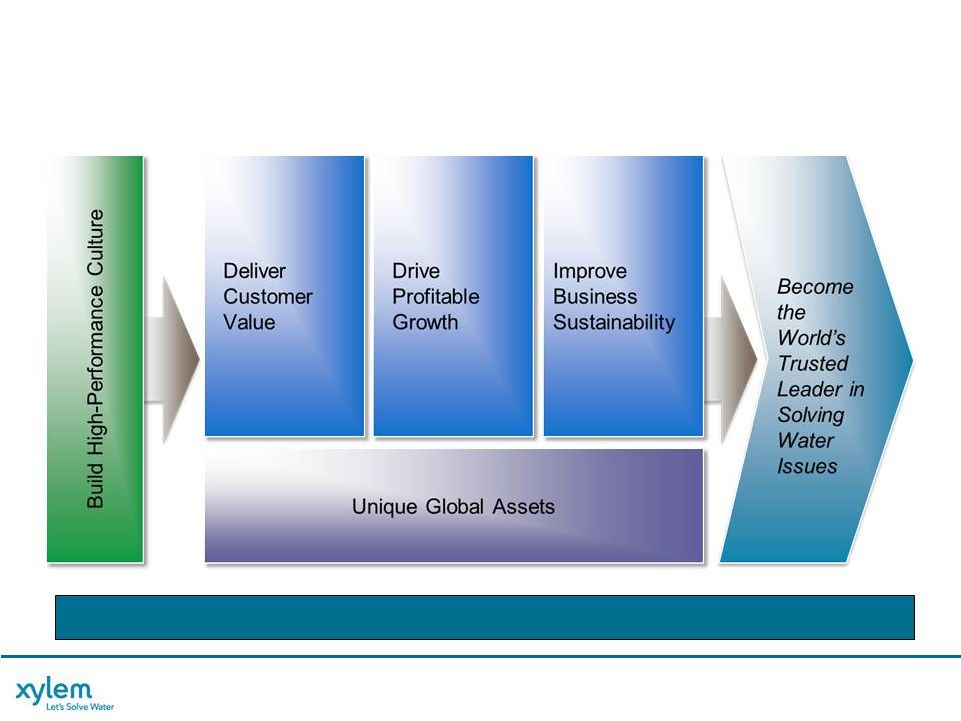
OUR STRATEGIC FRAMEWORK
12
DISCIPLINE TO ACHIEVE KEY OBJECTIVES AND INCREASE SHAREHOLDER VALUE
|
 XYLEM PROPRIETARY / CONFIDENTIAL
13
GROWING AFTERMARKET PARTS & SERVICES
INSTALLED BASE DRIVES REPLACEMENT SALES
•
Brand Loyalty Driven
•
Like-for-Like Replacement
•
Opportunity for Upgrades
•
Next-Generation Installations
INCREASING PROFITABLE
AFTERMARKET OPPORTUNITIES
DELIVER CUSTOMER VALUE
ENHANCING AFTERMARKET CAPABILITIES
INTRODUCING XYLEM TOTALCARE
•
Comprehensive Integrated Services Portfolio
•
Systems Knowledge & Application Expertise
•
Leverages World’s Largest Installed Base
•
Provides Customers with Operational Security,
Cost Savings Opportunities, and Improved
Operating Efficiencies
ACCELERATING OPPORTUNITIES THROUGH
ACQUISITIONS
~37% RECURRING REVENUE BASE
$M
2008
2012
$396
$581 |
 XYLEM PROPRIETARY / CONFIDENTIAL
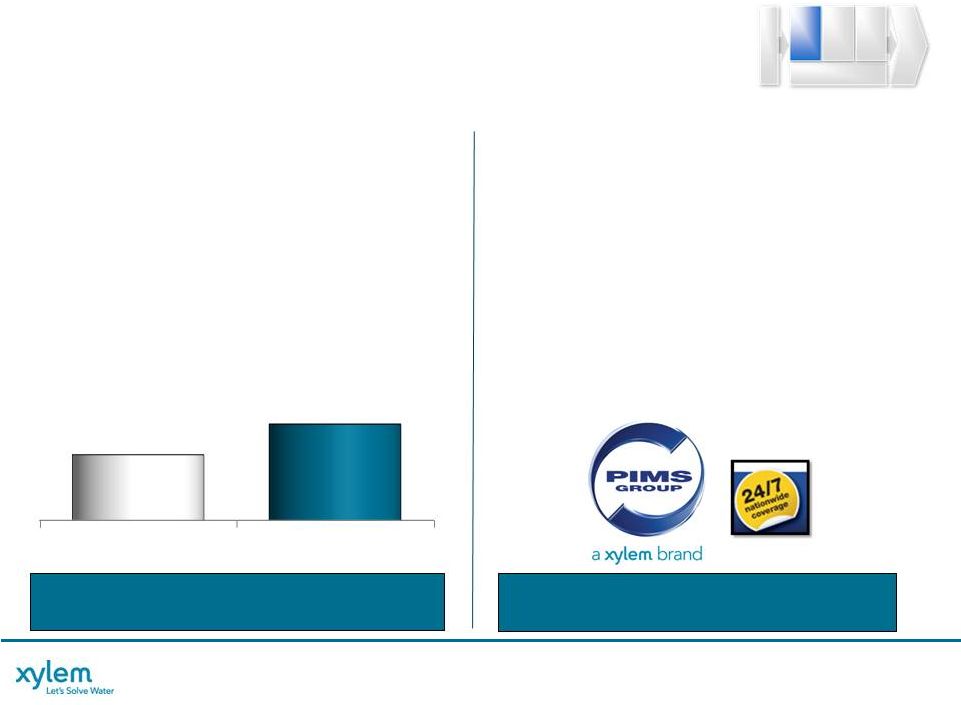
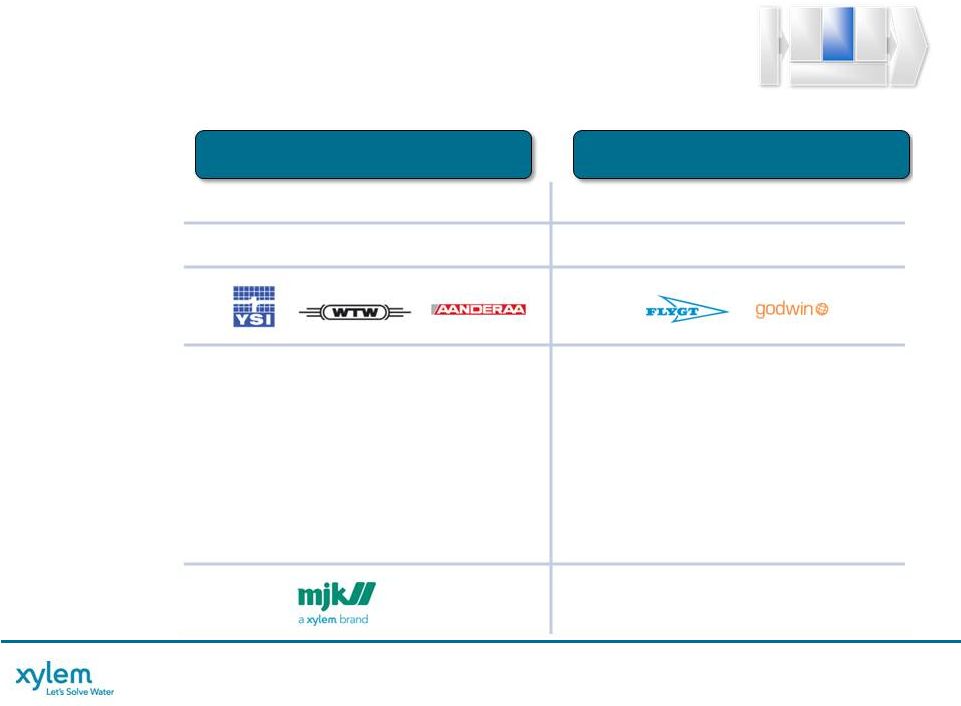
DRIVE PROFITABLE GROWTH
EXECUTING ACQUISITION STRATEGY
14
ANALYTICS
DEWATERING
Opportunity
Recent
Transactions
•
Heartland Pump
•
High ROIC Business When
Operating With Scale Advantage
•
Leverage Xylem’s Footprint and
Replicate 24/7 Service Expertise
•
International Expansion
•
Products have Higher Market
Growth Rates and Margins
•
Fill Product or Technology Gaps
and Sell Through Existing Channels
•
Drive Sustainable Water Projects
•
International Expansion
Revenue (2012)
$298M
$659M
Capital Deployed*
$732M
$614M
*Cumulative capital deployed through M&A from 2010 to Q1’13. Excludes CAPEX
expenditures. Key Brands |
 XYLEM PROPRIETARY / CONFIDENTIAL
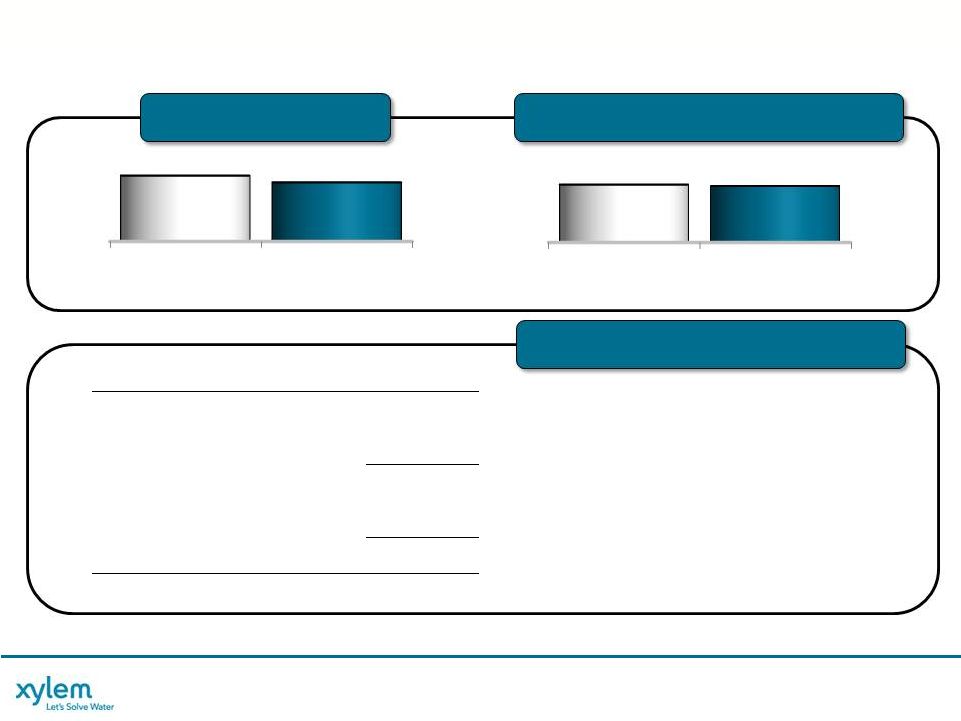
IMPROVE BUSINESS SUSTAINABILITY
OPTIMIZING OUR COST STRUCTURE
15
Complex
Structure
ONE
Organization
SUMMARY
•
Unified Xylem in Europe –
Growth & Cost Synergies
–
HQ: Schaffhausen,
Switzerland
•
Efficient Tax Structure
2013 FINANCIAL IMPACTS*
•
Restructuring & Realignment
Costs of $60M to $70M
Primarily Focused on Europe
–
Restructuring Savings of
$13M to $15M
–
Additional Net EPS Impact
of $0.03 From Realignment
EUROPEAN REALIGNMENT
ENABLING
•
Vertical Market Alignment
–
Sales Synergies & Future
Growth Opportunities
•
Sales Office Consolidations
•
Sales Administrative and
Functional Back-Office
Standardization & Synergies
•
Factory Realignments
•
Shared Services & Centers of
Excellence
* 2013 ESTIMATE BASED ON GUIDANCE AS OF APRIL 30, 2013 |
 XYLEM PROPRIETARY / CONFIDENTIAL
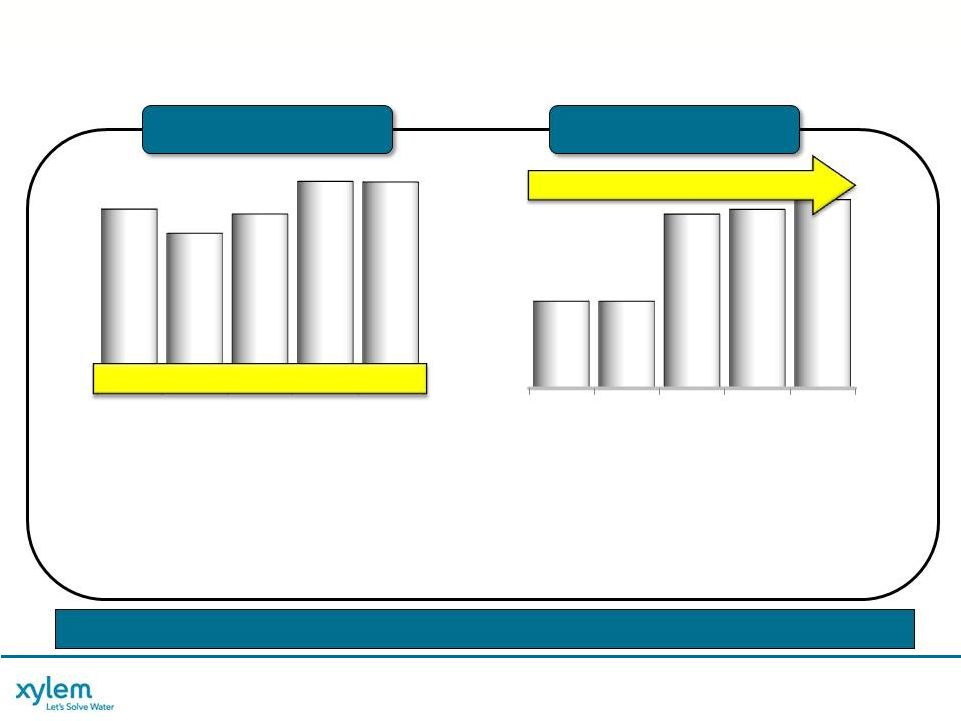
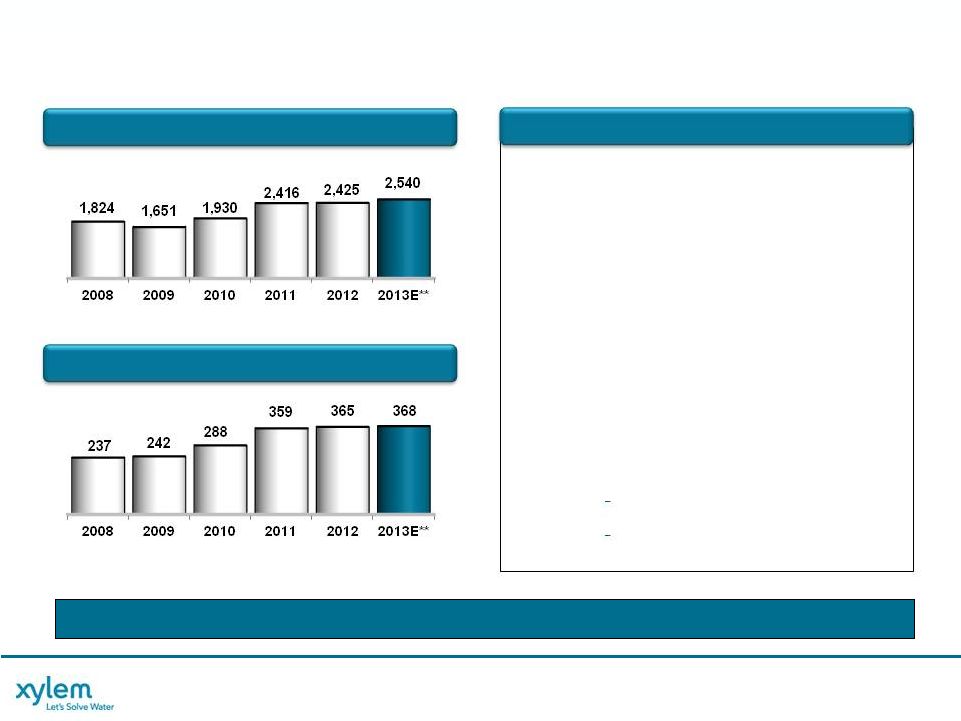
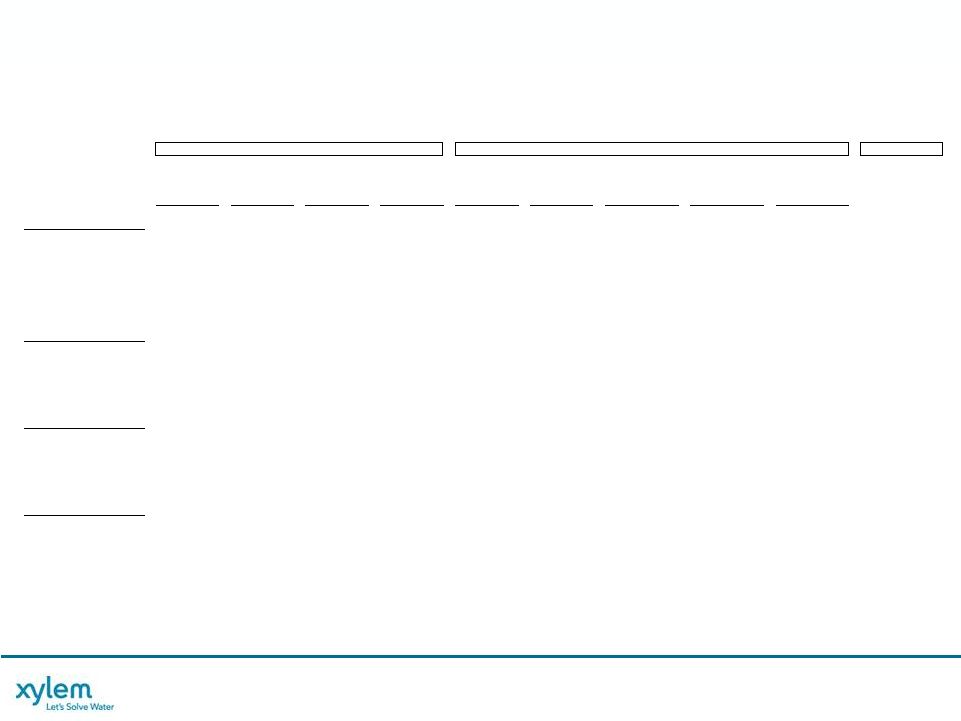
XYLEM FINANCIAL SUMMARY
STRONG TRACK RECORD OF FINANCIAL PERFORMANCE
* See Appendix for Non-GAAP Reconciliations.
** Margin expansion includes $33M of additional Stand-Alone costs.
16
•
Resilient Portfolio …
Despite Challenging End Market Conditions
•
Continued Investment Driving Growth in Core Business
•
Key Acquisitions …
Transitioning Portfolio to Higher Profitability Levels
•
Management Discipline …
Proactive Actions
•
Operational Excellence …
Driving Productivity Initiatives
+210 Bps with Stand-Alone Costs**
Revenue Up $500M …
+15%
$M
Growth:
-13%
12% 19%
0%
Organic*:
-9%
3%
0%
REVENUE
OPERATING MARGIN *
2008
2009
2010
2011
2012
10.8%
10.8%
10.8%
10.8%
12.6%
12.6%
12.7%
12.7%
12.9%
12.9%
2008
2009
2010
2011
2012
3,291
3,291
2,849
2,849
3,202
3,202
3,803
3,803
3,791
3,791
7% |
 XYLEM PROPRIETARY / CONFIDENTIAL
FINANCIAL POSITION
17
•
Strong Cash Position
•
No Significant Debt Maturities Until 2016
•
1.3x Net Debt/Adj. TTM EBITDA
•
$600M
Revolving
Credit
Facility
-
Unutilized
•
Access
to
Commercial
Paper
-
Unutilized
March 31, 2013
Cash
375
Debt
1,205
Net Debt
830
Shareholders’
Equity
2,040
Net Capital
2,870
Net Debt to Net Capital
29%
(Dollars, In Millions)
* See Appendix for Non-GAAP Reconciliations
** (AR+INV-AP-Customer Advances) / Revenue (Adjusted for Acquisitions)
*** See Xylem March 7, 2013 Investor & Analyst Day Presentation for further details.
Conversion:
100%
95%
$M
FREE CASH FLOW *
WORKING CAPITAL AS % REVENUE **
CAPITAL SUMMARY/LIQUIDITY
2012
2013E***
312
280
2012
2013E***
22.5%
22.0% |
 XYLEM PROPRIETARY / CONFIDENTIAL
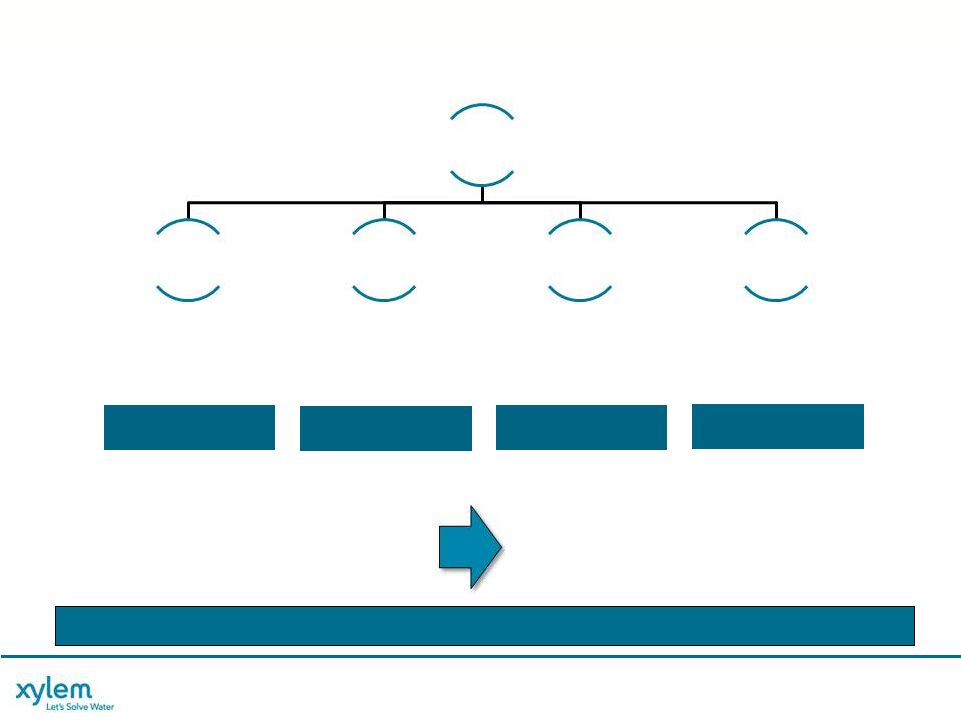
DISCIPLINED CAPITAL DEPLOYMENT
18
•
2.5% to 3.5% of
Revenue
•
$0.1164/share In-line
with Peers
•
Stock Buybacks to
Offset Dilution
•
$150M -
350M in 2013
•
Contributes 2% to 4%
to Revenue/Yr. on
Average
Capital Deployment Strategy
•
Balanced Organic & Inorganic Investment
•
Return Value to Shareholders
•
Maintain Solid Investment Grade Metrics
•
Debt & Pension
Organic Growth
World Class Facilities
Cash Return to
Shareholders
Cash to Meet Key
Obligations
Inorganic Investment
to Fuel Growth
Capital Deployment Evaluation
•
Fold Targeted Performance into Operating Plans
•
Quarterly / Annual Investment Review
•
Ensure Targeted Returns Achieved
FOCUSED ON LONG TERM SHAREHOLDER RETURN
FOCUSED ON LONG TERM SHAREHOLDER RETURN
Cash from
Operations
Capex
Return to
Shareholders
Financial
Obligations
Acquisition
Strategy |
 XYLEM PROPRIETARY / CONFIDENTIAL
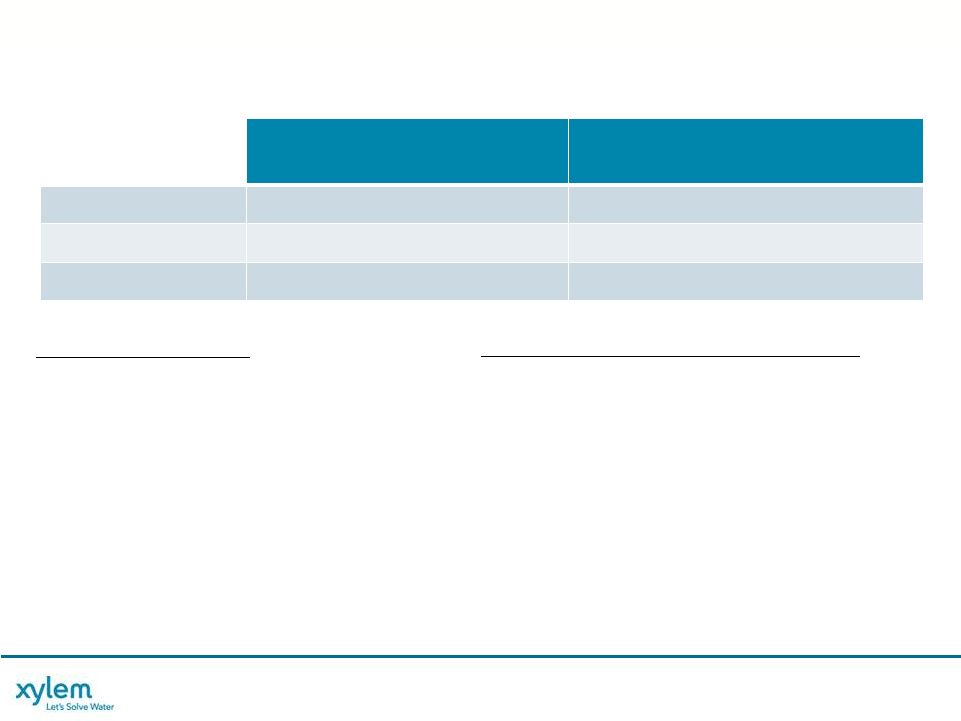
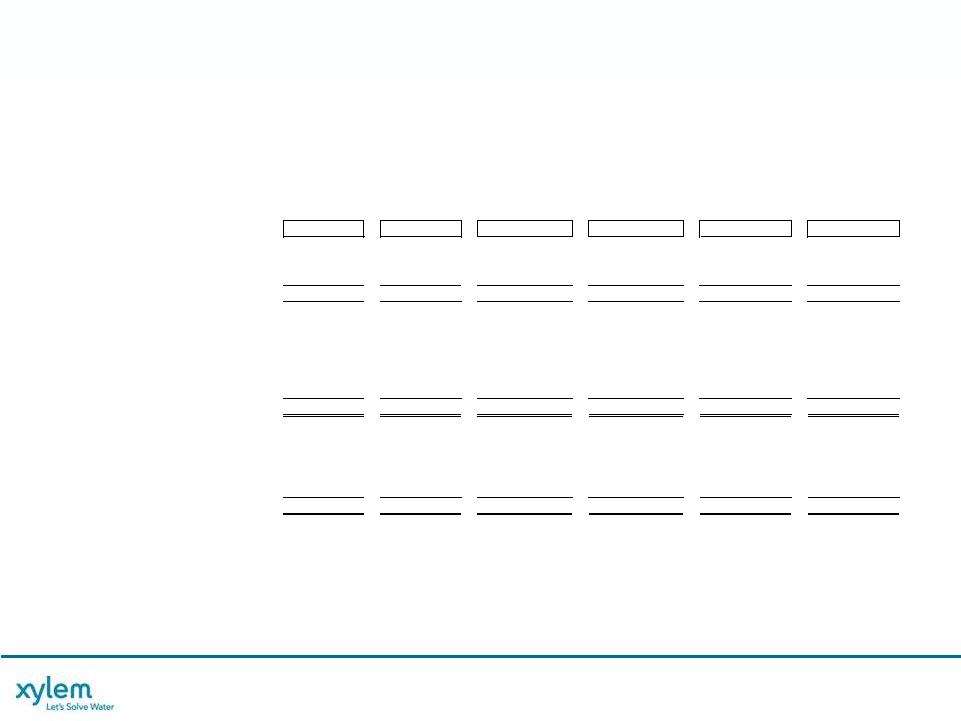
KEY FINANCIAL PROJECTIONS
19
LONG-TERM PERFORMANCE TARGETS**
•
2013-2017
Revenue
CAGR
of
5-9%
•
Core
Operating
Margin
Expands
50-75
Bps/Yr
Partially Offset by 1x Acquisition Impacts
•
2013-2017 EPS CAGR of 7-14%
•
Strong
Free
Cash
Flow
(100%
Conversion)
•
Disciplined
Capital
Deployment
•
ROIC
Accelerates
from
10.8%
in
2012
to
13%
-
14% by 2017
2013 FY Guidance
As of April 30, 2013 *
2017
Long-Term Targets **
Revenues
~$3.925B
(mid-point)
$4.7B to $5.5B
Op. Margin*
12.2% to 12.7%
14% to 15%
EPS*
$1.79 to $1.89
$2.50 to $3.40
* See Appendix for 2013 Financial Guidance Summary and non-GAAP
reconciliations. ** See Xylem March 7, 2013 Investor & Analyst Day Presentation
for further details. 2013 KEY OBJECTIVES
•
Strong Free Cash Flow (95% Conversion)
•
European
Realignment
Actions
to
Best
Position for Recovery …
$0.03 Net EPS
Benefit in ’13 …
Tax Rate Reduction to 21%
•
Restructuring
Actions
Drive
$26M
to
$30M
in
Annual Cost Savings ($13M to $15M in 2013)
•
Continuing to Invest in New Product
Launches
•
Execution
of
Acquisition
Strategy
Targeting
Deployment of $150M to $350M |
 XYLEM PROPRIETARY / CONFIDENTIAL
THANK YOU FOR YOUR INTEREST
THANK YOU FOR YOUR INTEREST
20
CLOSING REMARKS |
 APPENDIX |
 XYLEM PROPRIETARY / CONFIDENTIAL
* See Appendix for Non-GAAP Reconciliations
22
2013 FINANCIAL GUIDANCE SUMMARY
2013 FY Guidance
2013 FY Guidance
As of April 30, 2013
As of April 30, 2013
Growth
Growth
2013E vs. 2012
2013E vs. 2012
Revenue
Xylem Consolidated
Water Infrastructure
Applied Water
Segment Margin *
Operating Margin *
EPS *
Free Cash Flow Conversion
Guidance Assumptions:
Operating Tax Rate
Share Count
Items Excluded from EPS:
Restructuring &
Realignment Costs
(Mid-Point)
~$3,925M
~$2,540M
~$1,450M
13.7% -
14.2%
12.2% -
12.7%
$1.79 -
$1.89
~95%
~21%
~186.4M
~$60M -
$70M
Restructuring Costs: ~$40M to $50M
Share Repurchase Program to Maintain Current Share Count
1H’13 Rate: ~22%; 2H’13 Rate: ~20%
Restructuring Payments, Realignment Capex, & CHQ
Relocation
$1.84 Mid Point
-70 bps to -20 bps
-60 bps to -10 bps
Total Growth
Organic
Acquisition
FX
~3 to
4% 0 to 1%
2% 1%
~4 to
5% 0 to 1%
3% 1%
~1 to
2% 0 to 1%
0% 1%
|
 XYLEM PROPRIETARY / CONFIDENTIAL
23
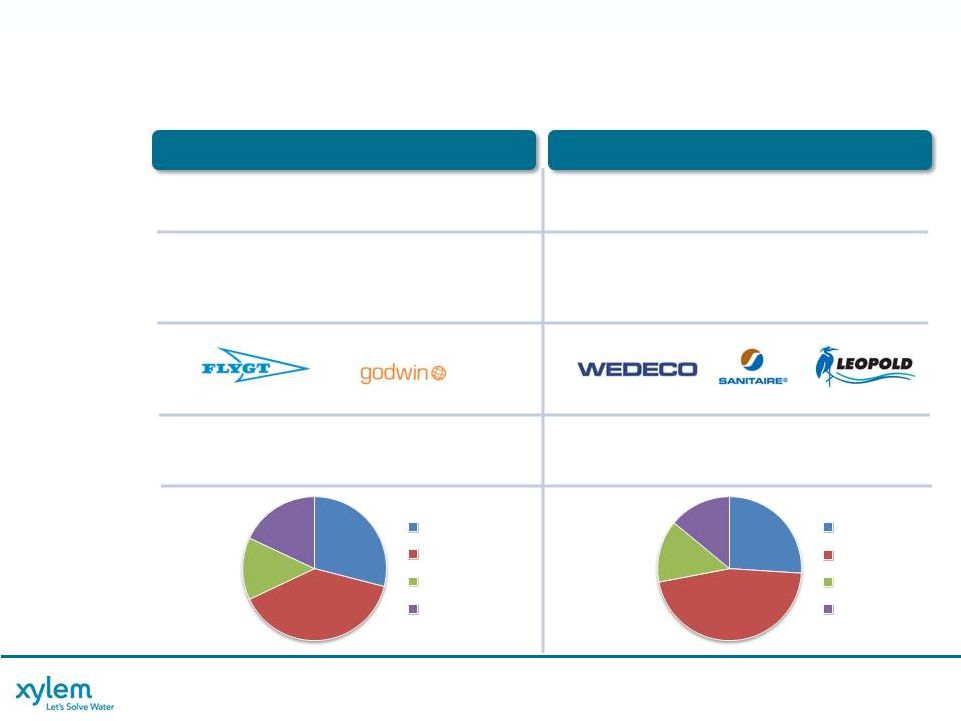
WATER INFRASTRUCTURE
BUSINESS OVERVIEW
TRANSPORT
TRANSPORT
TREATMENT
TREATMENT
Market Size:
2012 Revenues:
Key Products
& Services:
2012 Revenues
by Geography:
Key Facilities:
Key Brands:
$11B
$1,745M
$5B
$366M
Waste Water Pumps
Dewatering (Sales & Rentals)
Aftermarket Parts & Services
Emmaboda, Sweden; Baroda, India;
Shenyang, China; Bridgeport, NJ
Herford, Germany; Brown Deer, WI;
Zelienople, PA
Biological
U.V. and Ozone Disinfection
Filtration
29%
39%
14%
18%
U.S.
Europe
Asia Pacific
26%
46%
14%
14%
U.S.
Europe
Asia Pacific
Other
Other |
 XYLEM PROPRIETARY / CONFIDENTIAL
Bridgeport, NJ; Emmaboda, Sweden;
Quenington, UK
Sales & Rentals
Dry Prime, Submersible & Slurry Pumps
Aftermarket Parts & Services
24
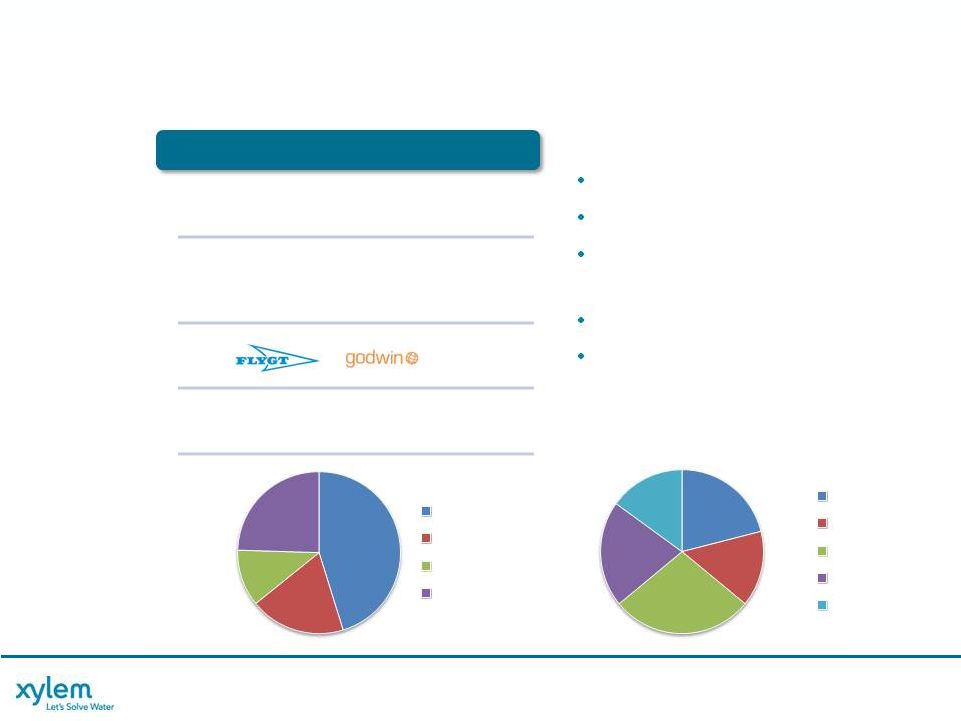
WATER INFRASTRUCTURE
BUSINESS OVERVIEW
DEWATERING
DEWATERING
Market Size:
2012 Revenues:
Key Products
& Services:
2012 Revenues
by Geography &
End Market:
Key Facilities:
Key Brands:
$3B
$659M
24/7 Service Capabilities
Leverages Xylem’s Footprint
High ROIC Business When
Operating with Scale Advantage
Diverse End Markets
~40% Rental Revenue
45%
19%
11%
25%
U.S.
Europe
Asia Pacific
Other
21%
15%
28%
21%
15%
Public Utilities
Oil & Gas
Mining
Construction
Oth. Industrial |
 XYLEM PROPRIETARY / CONFIDENTIAL
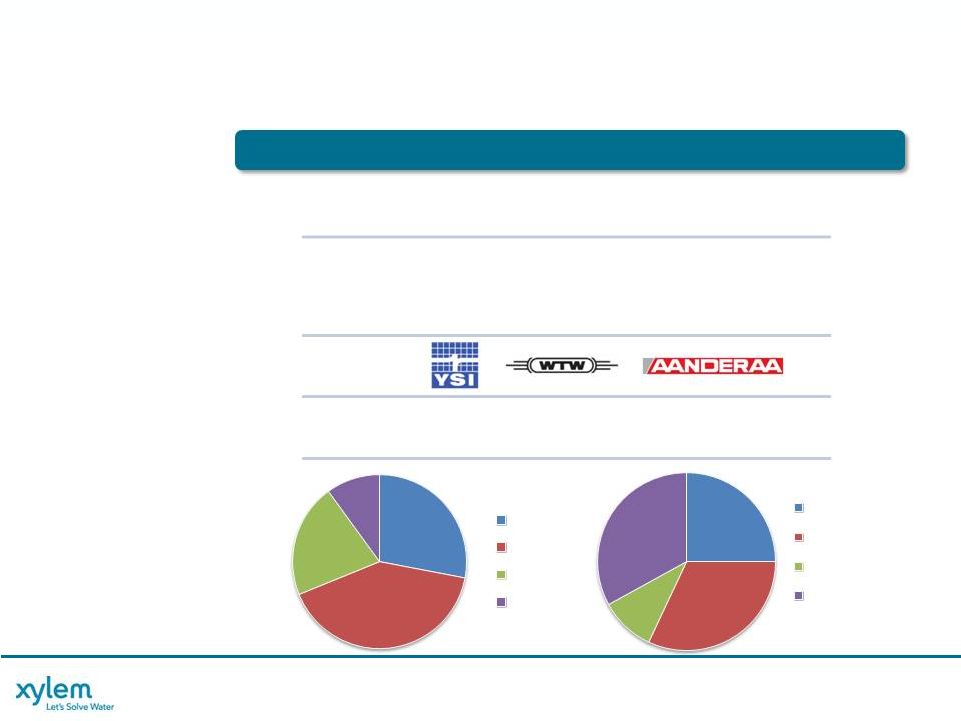
Yellow Springs, OH; Weilheim, Germany; Bergen, Norway
Field, Online, and Laboratory Analytical Instrumentation
Meters, Sensors, Spectrophotometers, and Refractometers
Temperature, Data Loggers, Doppler and Level Measurement
Water Quality and Environmental Monitoring Systems
25
WATER INFRASTRUCTURE
BUSINESS OVERVIEW
TEST
TEST
Market Size:
2012 Revenues:
Key Products
& Services:
2012 Revenues
by Geography &
Segment:
Key Facilities:
Key Brands:
$4B
$298M
28%
41%
21%
10%
U.S.
Europe
Asia Pacific
Other
25%
32%
33%
Field Sampling
Field Monitoring
Online
Lab
10% |
 XYLEM PROPRIETARY / CONFIDENTIAL
26
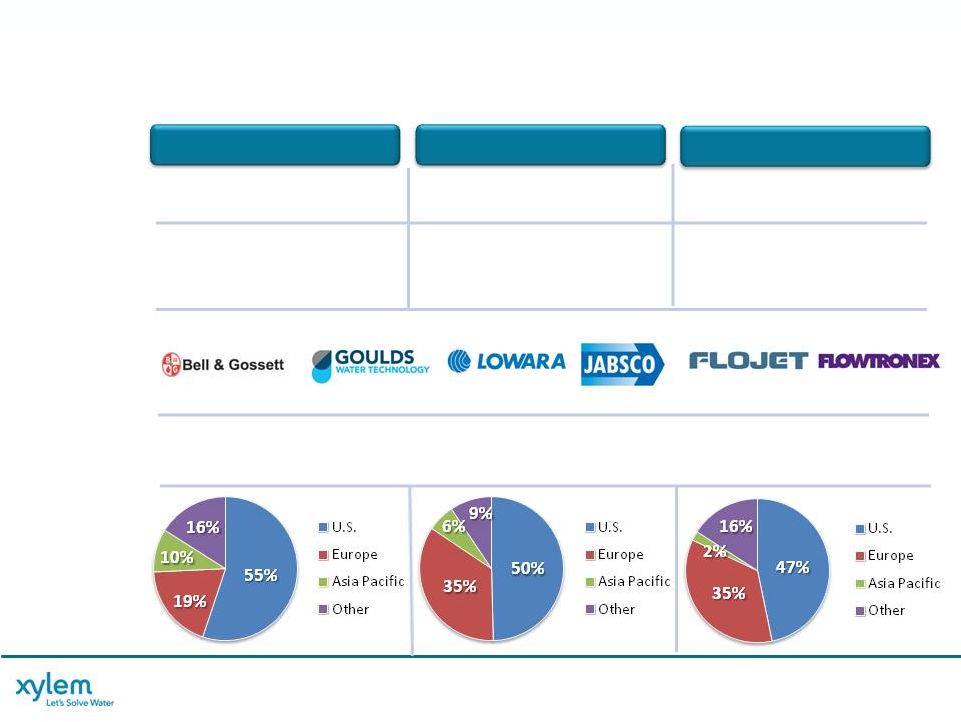
APPLIED WATER SYSTEMS
BUSINESS OVERVIEW
Market Size:
2012 Revenues:
Key Products
& Services:
2012 Revenues
by Geography:
Key Facilities:
Key Brands:
$9B
$736M
$4B
$550M
HVAC Pumps, Valves & Heat
Exchangers, Drives & Controls,
Waste Water Pumps, Pressure
Boosters, Fire Protection
Auburn, NY; Buffalo, NY; Cegled, Hungary; Chihuahua, Mexico; Dallas, TX; Hoddesdon, UK;
Montecchio, Italy; Morton Grove, IL; Nanjing, China; Stockerau, Austria; Strzelin,
Poland; Wolverhampton, UK Pumps & Pumping Systems
Heat Exchangers, Drives & Controls
Membrane Filtration
Fire Protection
$2B
$96M
Groundwater & Surface Pumps
Packaged Systems, Drives &
Controls
BUILDING SERVICES
BUILDING SERVICES
INDUSTRIAL WATER
INDUSTRIAL WATER
IRRIGATION
IRRIGATION |
 XYLEM PROPRIETARY / CONFIDENTIAL
27
COMPETITIVE LANDSCAPE
LEADING POSITIONS IN KEY APPLICATIONS
TRANSPORT
TREATMENT
TEST
BUILDING SERVICES
INDUSTRIAL WATER
IRRIGATION
Xylem
KSB
Sulzer (ABS)
Pentair
Tsurumi
Others
Others
Grundfos
Xylem
Danaher
(Hach)
Grundfos
Xylem
Siemens
Danaher (Trojan)
Sulzer (ABS)
Ozonia
Others
Xylem
Thermo
E+H
Mettler
Others
Xylem
Wilo
Pentair
Franklin
Grundfos
Wilo
KSB
Pentair
Others
Others
Pentair
Xylem
KSB
Market: $11B
Position: 1st
Market: $5B
Position: 1st
Market: $4B
Position: 2nd
Market: $9B
Position: 2nd
Market: $4B
Position: 2nd
Market: $2B
Position: 3rd |
 XYLEM PROPRIETARY / CONFIDENTIAL
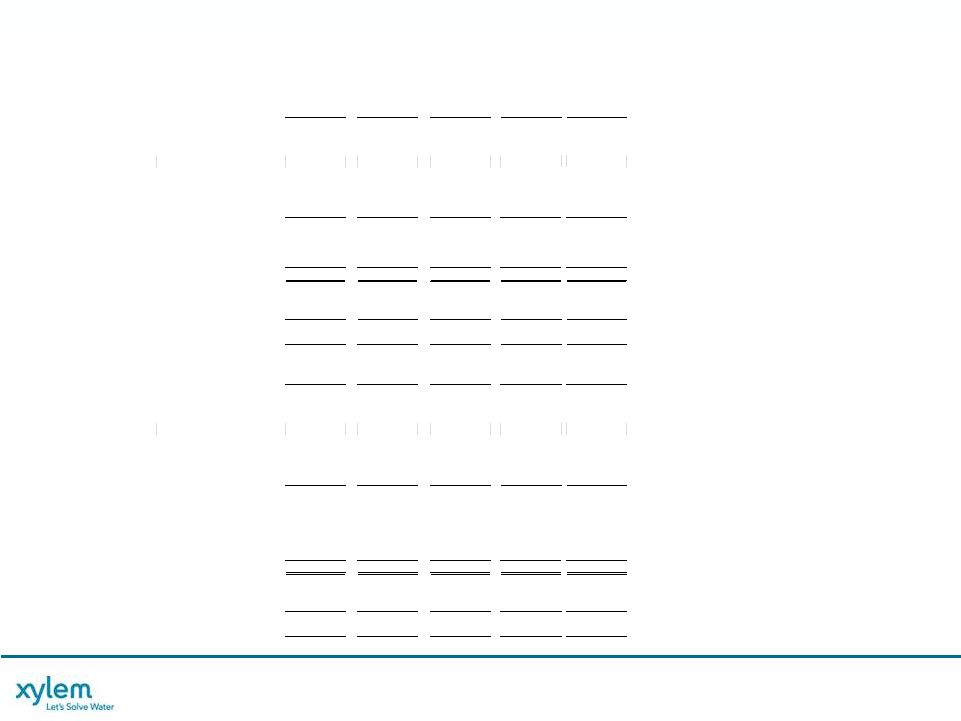
WATER INFRASTRUCTURE
Growth:
-10%
17%
25%
0%
4.7%
Organic*:
-4%
2%
7%
0%
0.5%
OM%:
13.0%
14.7%
14.9%
14.9%
15.1%
14.5%
STRONG TOP LINE GROWTH, OP MARGIN +210 BPS
STRONG TOP LINE GROWTH, OP MARGIN +210 BPS
‘08-’12 Revenue up 33%; 7% CAGR
•
Resilient Through the Downturn
•
Growth Driven by Acquisitions,
Emerging Markets & Product
Launches
•
Public Utility CAPEX Slowdown
•
European Crisis
Strong Operating Margin Expansion
•
Operating Productivity Funds
Incremental Strategic Investments
•
’13 Margin Impacts
European Realignment
FX/Acquisition Impact
* See Appendix for Non-GAAP Reconciliations
$M
$M
28
REVENUE
REVENUE
HIGHLIGHTS
HIGHLIGHTS
OP INCOME & MARGIN*
OP INCOME & MARGIN*
** 2013 ESTIMATE BASED ON GUIDANCE AS OF MARCH 7, 2013 |
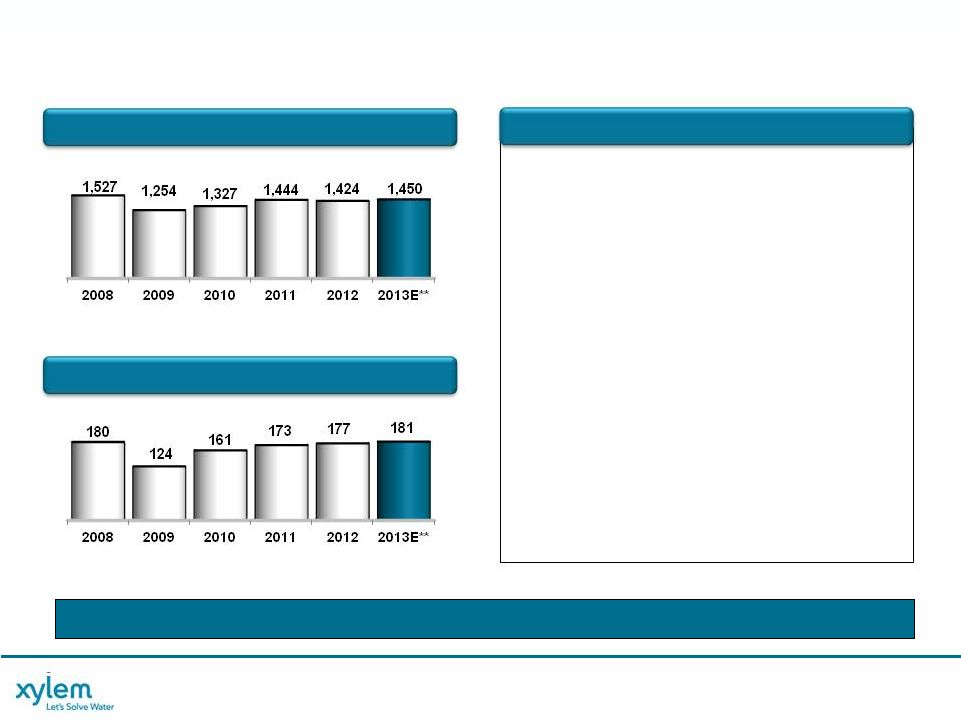 XYLEM PROPRIETARY / CONFIDENTIAL
APPLIED WATER
Growth:
-18%
6%
9%
-1%
1.8%
Organic*:
-15%
6%
7%
1%
0.5%
OM%:
11.8%
9.9%
12.1%
12.0%
12.4%
12.5%
STRONG OPERATING PERFORMANCE
STRONG OPERATING PERFORMANCE
‘08-’12 Revenue Down 7%
•
Residential & Commercial Building
Decline
•
Growth Driven By New Product
Launches
–
Energy-Efficient Solutions
–
Emerging Markets Penetration
Strong Operating Performance
•
Margin Expansion Driven by Customer
& Operational Excellence Initiatives
•
Continued to Fund Future Growth
Investments
$M
$M
29
* See Appendix for Non-GAAP Reconciliations
** 2013 ESTIMATE BASED ON GUIDANCE AS OF MARCH 7, 2013
OP INCOME & MARGIN*
OP INCOME & MARGIN*
REVENUE
REVENUE
HIGHLIGHTS
HIGHLIGHTS |
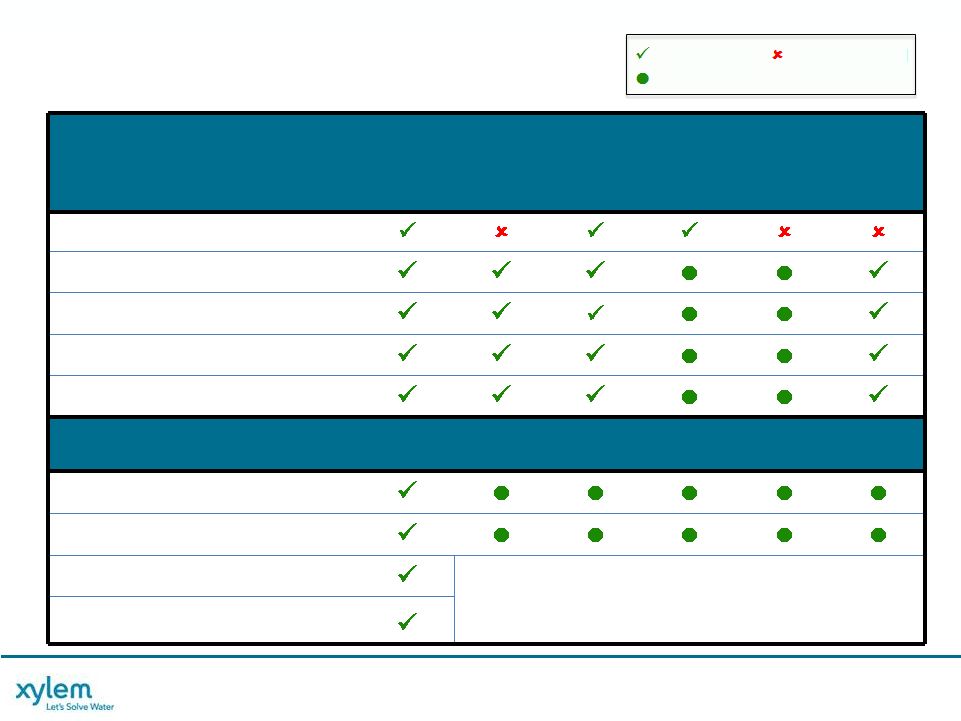 XYLEM PROPRIETARY / CONFIDENTIAL
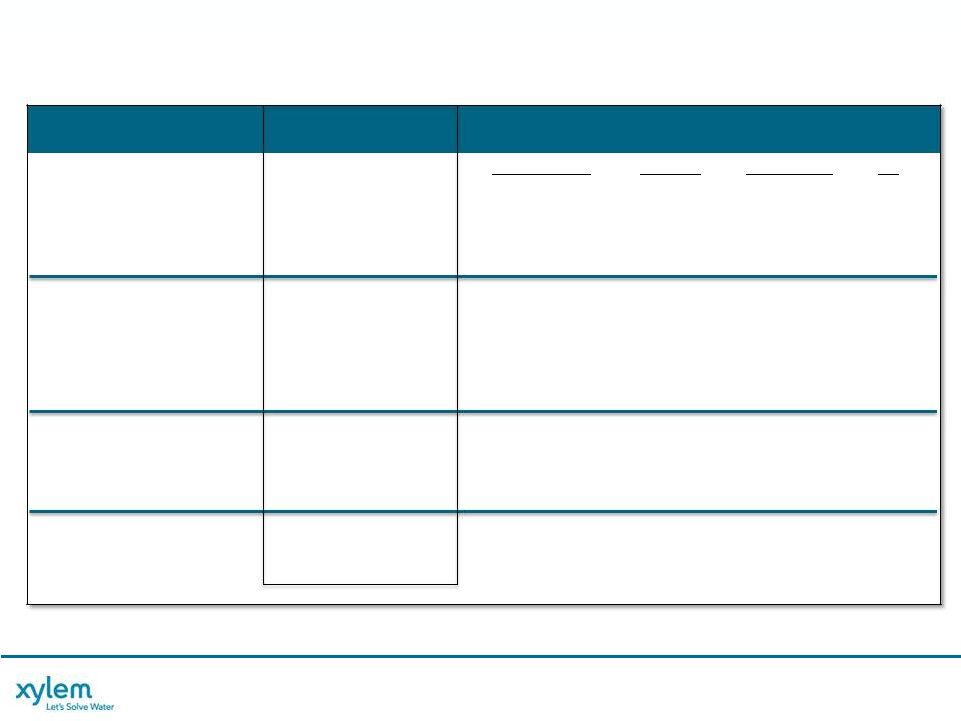
ACQUISITION SCORECARD
Acquisition
Invested
$M
Year
Completed
Strategic
Fit
Gross
Margin
Accretive
IRR >
Risk Adj.
Cost of
Capital
Mid-
Teens
ROIC
Cash
Return
7-9 Years
EPS
Accretive
After Yr 1
Laing
$30
2009
Nova
$384
2010
Godwin
$585
2010
OI
$25
2010
YSI
$310
2011
Through
2012
Added
~200 Bps
Added
~$0.45
MJK
$13
2012
Heartland
$29
2012
PIMS
$57
2013
RECENTLY ACQUIRED
MultiTrode
$26
2013
Completed
On Track
Not Achieved
30 |
 XYLEM PROPRIETARY / CONFIDENTIAL
31
NON-GAAP MEASURES
Management views key performance indicators including revenue, gross margins, segment
operating income and margins, orders growth, free cash flow, working capital, and
backlog, among others. In addition, we consider certain measures to be useful to management and investors
evaluating our operating performance for the periods presented, and provide a tool for
evaluating our ongoing operations, liquidity and management of assets. This
information can assist investors in assessing our financial performance and measures our ability to generate capital
for deployment among competing strategic alternatives and initiatives. These metrics,
however, are not measures of financial performance under GAAP and should not be
considered a substitute for revenue, operating income, net income, earnings per share (basic and diluted) or net
cash from operations as determined in accordance with GAAP. We consider the following
non-GAAP measures, which may not be comparable to similarly titled measures reported
by other companies, to be key performance indicators:
defined as revenue and orders, respectively, excluding the impact of foreign currency fluctuations,
intercompany transactions, and contributions from acquisitions and divestitures.
Divestitures include sales of portions of our business that did not meet the criteria
for classification as a discontinued operation or insignificant portions of our business that we did not classify as a
discontinued operation. The period-over-period change resulting from foreign
currency fluctuations assumes no change in exchange rates from the prior period.
defined as financial results adjusted for currency translation impacts by translating current period and
prior period activity using the same currency conversion rate. This approach is
used for countries whose functional currency is not the U.S. dollar.
“EBITDA” defined as earnings before interest, taxes, depreciation, amortization expense, and share-based compensation. “Adjusted EBITDA”
reflects the adjustment to EBITDA to exclude for non-recurring separation costs associated
with the Xylem spin-off from ITT Corporation (not excluded for 2013) as well as
non-recurring restructuring and realignment costs.
defined as operating income and
earnings per share, adjusted to exclude non-recurring separation costs associated
with the Xylem spin-off from ITT Corporation (not excluded for 2013), non-
recurring restructuring and realignment costs and tax-related special items.
defined as net cash from operating activities, as reported in the Statement of Cash Flow, less capital expenditures as well as
adjustments for other significant items that impact current results which management believes
are not related to our ongoing operations and performance. Our definition of free
cash flows does not consider non-discretionary cash payments, such as debt.
“Organic revenue" and "Organic orders”
“Constant currency” "Adjusted
Operating Income", "Adjusted Segment Operating Income", and “Adjusted EPS”
“Free Cash
Flow” |
 XYLEM PROPRIETARY / CONFIDENTIAL
32
Constant Currency
(A)
(B)
(C)
(D)
(E)
(F) = B+C+D+E
(G) = F/A
(H) = (B + D) / A
Change
% Change
Change
% Change
Revenue
Revenue
CY v. PY
CY v. PY
FX Contribution
Eliminations
Adj. CY v. PY
Adj. CY v. PY
Current Year
Prior Year
Year Ended December 31, 2012
Xylem Inc.
3,791
3,803
(12)
-0.3%
(94)
108
-
2
0.1%
2.5%
Water infrastructure
2,425
2,416
9
0.4%
(94)
80
(1)
(6)
-0.2%
3.7%
Applied Water
1,424
1,444
(20)
-1.4%
-
32
(3)
9
0.6%
0.8%
Year Ended December 31, 2011
Xylem Inc.
3,803
3,202
601
18.8%
(264)
(111)
-
226
7.1%
15.3%
Water Infrastructure
2,416
1,930
486
25.2%
(264)
(87)
2
137
7.1%
20.7%
Applied Water
1,444
1,327
117
8.8%
-
(28)
(1)
88
6.6%
6.7%
Year Ended December 31, 2010
Xylem Inc.
3,202
2,849
353
12.4%
(263)
6
-
96
3.4%
12.6%
Water infrastructure
1,930
1,651
279
16.9%
(247)
(8)
-
24
1.5%
16.4%
Applied Water
1,327
1,254
73
5.8%
(16)
15
-
72
5.7%
7.0%
Year Ended December 31, 2009
Xylem Inc.
2,849
3,291
(442)
-13.4%
(7)
158
-
(291)
-8.8%
-8.6%
Water infrastructure
1,651
1,824
(173)
-9.5%
-
109
(1)
(65)
-3.6%
-3.5%
Applied Water
1,254
1,527
(273)
-17.9%
(7)
53
-
(227)
-14.9%
-14.4%
Note: Due to rounding the sum of segment amounts may not agree to Xylem totals.
Acquisitions /
Divestitures
Xylem Inc. Non-GAAP Reconciliation
Reported vs. Organic & Constant Currency Revenue
($ Millions)
(As Reported - GAAP)
(As Adjusted - Organic) |
 XYLEM PROPRIETARY / CONFIDENTIAL
33
Mid Point Guidance
2008
2009
2010
2011
2012
2013E
Revenue
3,291
2,849
3,202
3,803
3,791
3,925
Operating Income
315
276
388
395
443
425
Operating Margin
9.6%
9.7%
12.1%
10.4%
11.7%
10.8%
Restructuring & Realignment
41
31
15
-
24
65
Separation Costs
-
-
-
87
22
-
Adjusted Operating Income
356
307
403
482
489
490
Adjusted Operating Margin
10.8%
10.8%
12.6%
12.7%
12.9%
12.5%
Standalone Costs
-
-
-
5
28
-
Adj. Operating Income, excl. Standalone
Costs 356
307
403
487
517
490
Adjusted Operating Margin, excl.
Standalone Costs 10.8%
10.8%
12.6%
12.8%
13.6%
12.5%
Xylem Inc. Non-GAAP Reconciliation
Adjusted Operating Income
($ Millions) |
 XYLEM PROPRIETARY / CONFIDENTIAL
34
2013
2012
2011
2010
2009
2008
Total Revenue
• Total Xylem
3,925
3,791
3,803
3,202
2,849
3,291
• Water Infrastructure
2,540
2,425
2,416
1,930
1,651
1,824
• Applied Water
1,450
1,424
1,444
1,327
1,254
1,527
Operating Income
• Total Xylem
425
443
395
388
276
315
• Water Infrastructure
318
342
343
276
227
220
• Applied Water
166
170
160
158
109
162
Operating Margin
• Total Xylem
10.8%
11.7%
10.4%
12.1%
9.7%
9.6%
• Water Infrastructure
12.5%
14.1%
14.2%
14.3%
13.7%
12.1%
• Applied Water
11.4%
11.9%
11.1%
11.9%
8.7%
10.6%
Separation Costs
• Total Xylem
-
22
87
-
-
-
• Water Infrastructure
-
4
16
-
-
-
• Applied Water
-
2
13
-
-
-
Restructuring & Realignment Costs
• Total Xylem
65
24
-
15
31
41
• Water Infrastructure
50
19
-
12
15
17
• Applied Water
15
5
-
3
15
18
Adjusted Operating Income*
• Total Xylem
490
489
482
403
307
356
• Water Infrastructure
368
365
359
288
242
237
• Applied Water
181
177
173
161
124
180
Adjusted Operating Margin*
• Total Xylem
12.5%
12.9%
12.7%
12.6%
10.8%
10.8%
• Water Infrastructure
14.5%
15.1%
14.9%
14.9%
14.7%
13.0%
• Applied Water
12.5%
12.4%
12.0%
12.1%
9.9%
11.8%
*Adjusted Operating Income excludes non-recurring separation, restructuring &
realignment costs Xylem Inc. Non-GAAP Reconciliation
Adjusted Operating Income
($ Millions) |
 XYLEM PROPRIETARY / CONFIDENTIAL
35
Q1
Q2
Q3
Q4
Total
Pre-Tax Net Income
51
Interest Expense (Income), net
12
Depreciation
25
Amortization
12
Stock Compensation
6
EBITDA
106
Restructuring & Realignment
12
Adjusted EBITDA
118
Revenues
879
Adjusted EBITDA Margin
13.4%
Q1
Q2
Q3
Q4
Total
Pre-Tax Net Income
84
115
100
89
388
Interest Expense (Income), net
13
13
12
13
51
Depreciation
23
21
24
26
94
Amortization
11
12
12
13
48
Stock Compensation
5
5
6
6
22
EBITDA
136
166
154
147
603
Separation Costs
5
6
4
7
22
Restructuring & Realignment
-
-
5
19
24
Adjusted EBITDA
141
172
163
173
649
Revenues
925
966
931
969
3,791
Adjusted EBITDA Margin
15.2%
17.8%
17.5%
17.9%
17.1%
2013
2012
Xylem Inc. Non-GAAP Reconciliation
EBITDA and Adjusted EBITDA by Quarter
($ Millions) |
 XYLEM PROPRIETARY / CONFIDENTIAL
36
Illustration of Mid Point Guidance
2013 Guidance
FY '12
FY '13
As Reported
Adjustments
Adjusted
As Projected
Adjustments
Adjusted
Total Revenue
3,791
3,791
3,925
3,925
Segment Operating Income
512
30
a
542
484
65
d
549
Segment Operating Margin
13.5%
14.3%
12.3%
14.0%
Corporate Expense
69
(16)
b
53
59
-
59
Operating Income
443
46
489
425
65
490
Operating Margin
11.7%
12.9%
10.8%
12.5%
Interest Expense
(55)
(55)
(55)
(55)
Other Non-Operating Income (Expense)
-
-
(2)
(2)
Income before Taxes
388
46
434
368
65
433
Provision for Income Taxes
(91)
(13)
c
(104)
(72)
(19)
c
(91)
Net Income
297
33
330
296
46
342
Diluted Shares
186.2
186.2
186.4
186.4
Diluted EPS
1.59
$
0.18
$
1.77
$
1.59
$
0.25
$
1.84
$
a
One time separation, restructuring and realignment costs incurred at the segment level
b
One time separation, restructuring and realignment costs incurred at the corporate level
c
Net tax impact of above items, plus the addition of special tax items
d
Restructuring and realignment costs incurred at the segment level
Xylem Inc. Non-GAAP Reconciliation
Guidance
($ Millions, except per share amounts) |
 XYLEM PROPRIETARY / CONFIDENTIAL
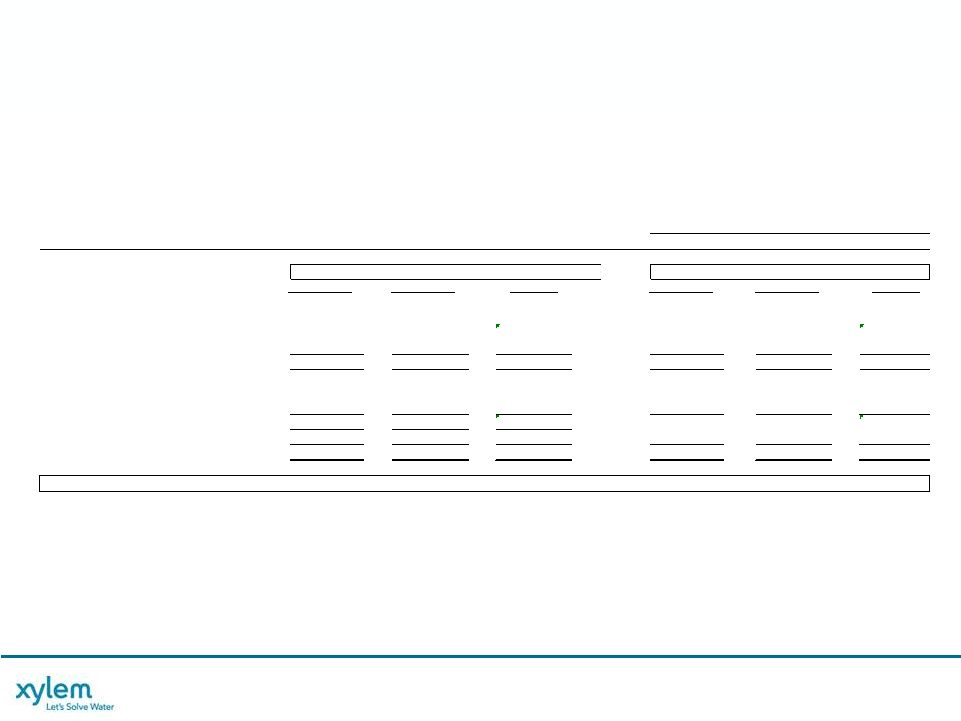
37
2013E
2012
Net Cash - Operating Activities
410
396
Capital Expenditures
(130)
(112)
Free Cash Flow, including separation costs
280
284
Cash Paid for Separation Costs (incl. Capex)
-
28
Free Cash Flow, excluding separation costs
280
312
Net Income
296
297
Separation Costs, net of tax (incl. tax friction)
-
16
Net Income, excluding separation costs
296
313
Free Cash Flow Conversion
95%
100%
Xylem Inc. Non-GAAP Reconciliation
Net Cash - Operating Activities vs. Free Cash Flow
($ Millions)
Year Ended |
 XYLEM PROPRIETARY / CONFIDENTIAL
38 |