Attached files
| file | filename |
|---|---|
| 8-K - RAMCO-GERSHENSON PROPERTIES TRUST 8-K - RPT Realty | a50635626.htm |
Exhibit 99.1
Investor Presentation May/June 2013
Table of Contents Table of Contents Page I.Corporate Overview 2 II.Investment Strategy 4 III.Operating Strategy 17 IV.Balance Sheet Strategy 23 V.Conclusion 27 1
Corporate Overview Ramco-Gershenson Properties Trust (“RPT”, “Ramco-Gershenson”, or the “Company”) owns and manages interests in approximately $1.9 billion of shopping center assets in 13 states. The Company’s portfolio consists primarily of high-quality, multi-anchored shopping centers in major metropolitan markets. At March 31, 2013, its core portfolio was 94.5% leased. The Company’s top tenant line-up features best-in-class national and regional retailers including, TJ Maxx/Marshalls, Bed Bath & Beyond, Home Depot, Publix, Jo-Ann Stores, and Michaels. Over 51% of RPT’s total annualized base rent comes from shopping centers with a grocery component. Grocery retailers in RPT’s portfolio generate annual sales averaging $488 per square foot. The Company maintains a strong balance sheet, with ample liquidity and access to capital to support its growth initiatives. 2
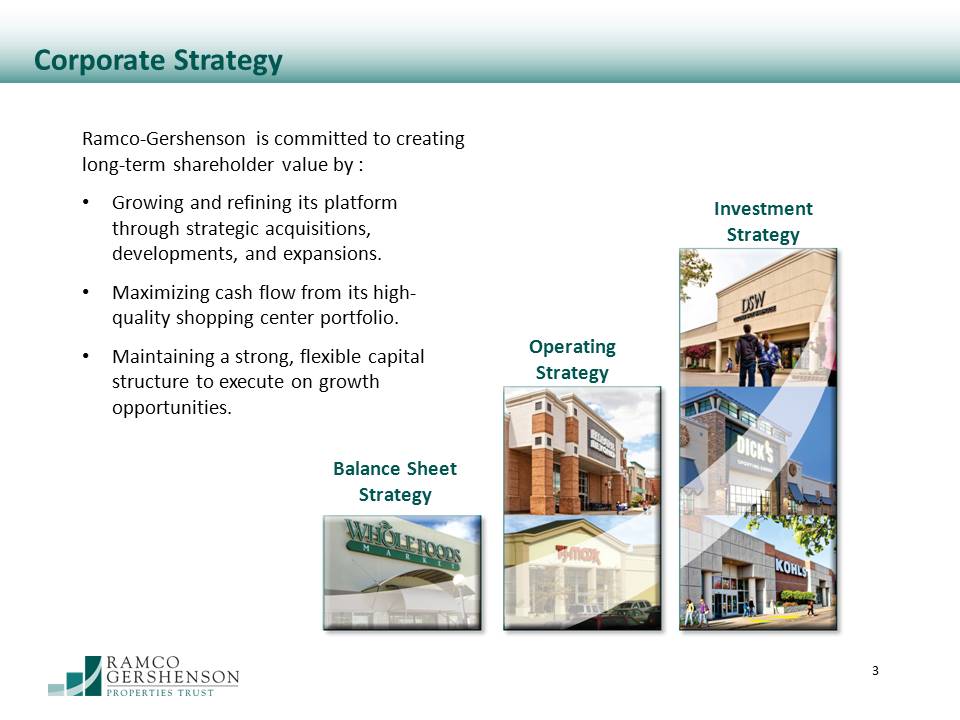
Corporate Strategy Balance Sheet Strategy Operating Strategy Investment Strategy Ramco-Gershenson is committed to creating long-term shareholder value by : Growing and refining its platform through strategic acquisitions, developments, and expansions. Maximizing cash flow from its high-quality shopping center portfolio. Maintaining a strong, flexible capital structure to execute on growth opportunities. 3

Investment Strategy 4
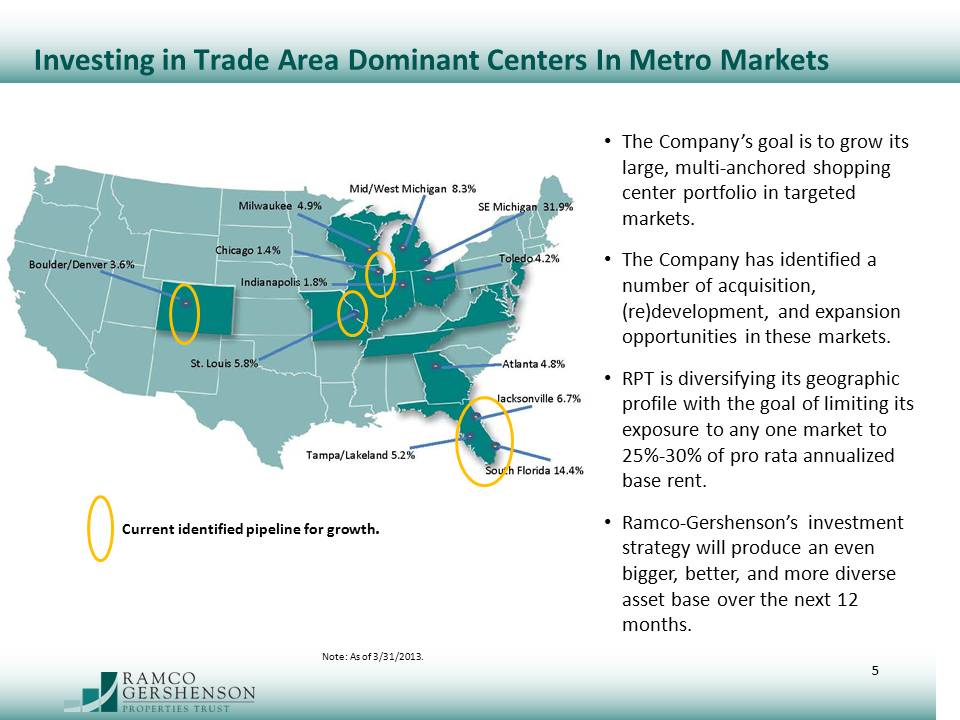
Investing in Trade Area Dominant Centers In Metro Markets The Company’s goal is to grow its large, multi-anchored shopping center portfolio in targeted markets. The Company has identified a number of acquisition, (re)development, and expansion opportunities in these markets. RPT is diversifying its geographic profile with the goal of limiting its exposure to any one market to 25%-30% of pro rata annualized base rent. Ramco-Gershenson’s investment strategy will produce an even bigger, better, and more diverse asset base over the next 12 months. Current identified pipeline for growth. Note: As of 3/31/2013. 5
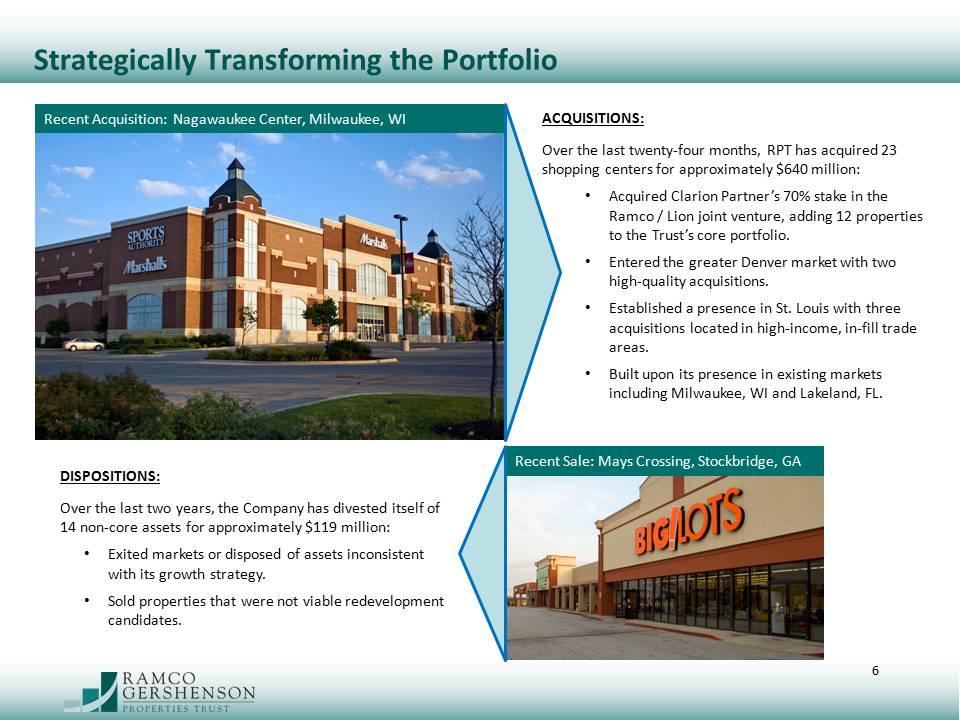
Strategically Transforming the Portfolio ACQUISITIONS: Over the last twenty-four months, RPT has acquired 23 shopping centers for approximately $640 million: Acquired Clarion Partner’s 70% stake in the Ramco / Lion joint venture, adding 12 properties to the Trust’s core portfolio. Entered the greater Denver market with two high-quality acquisitions. Established a presence in St. Louis with three acquisitions located in high-income, in-fill trade areas. Built upon its presence in existing markets including Milwaukee, WI and Lakeland, FL. DISPOSITIONS: Over the last two years, the Company has divested itself of 14 non-core assets for approximately $119 million: Exited markets or disposed of assets inconsistent with its growth strategy. Sold properties that were not viable redevelopment candidates. Recent Acquisition: Nagawaukee Center, Milwaukee, WI Recent Sale: Mays Crossing, Stockbridge, GA 6
Strategic Acquisition-Clarion Portfolio Acquired Clarion Partners’ ownership interest in 12 market dominant shopping centers for approximately $257 million, which was funded with 65% equity and 35% debt. As a result of the acquisition, RPT now has a total market capitalization of approximately $1.9 billion and an equity market capitalization of approximately $1.1 billion. Assumed 100% ownership of over 2.2 million square feet of high-quality shopping center GLA in Florida (60%) and Michigan (40%), including five shopping centers greater than 200,000 square feet. The top three tenants, based on annualized base rents, for the portfolio are Bed Bath & Beyond, TJX Companies and LA Fitness. 7
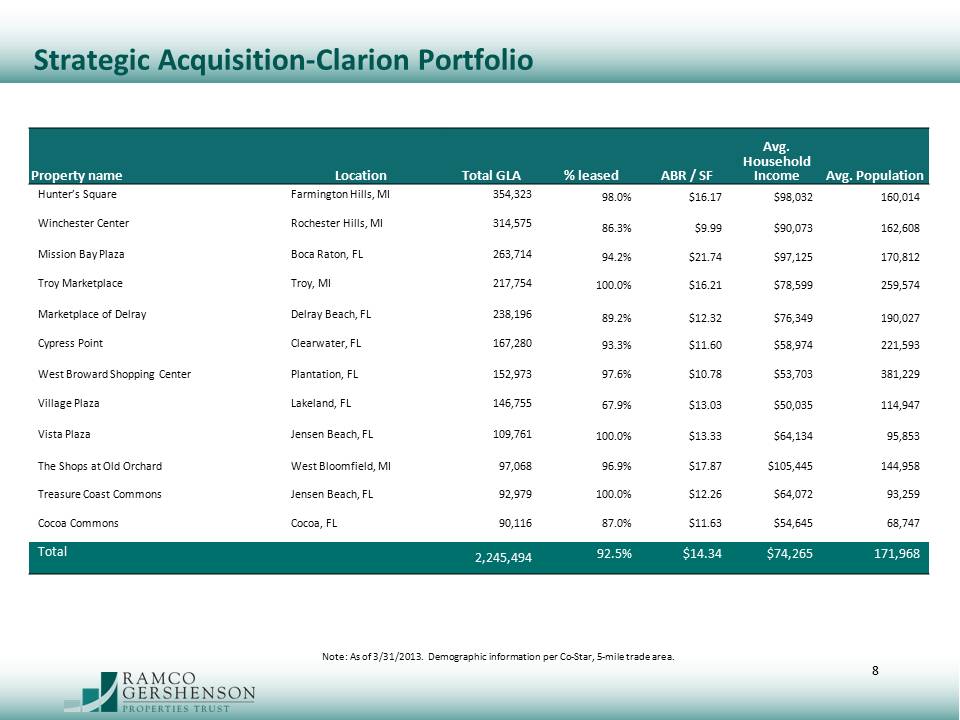
Strategic Acquisition-Clarion Portfolio Property name Location Total GLA % leased ABR / SF Avg. Household Income Avg. Population Hunter’s Square Farmington Hills, MI 354,323 98.0% $16.17 $98,032 160,014 Winchester Center Rochester Hills, MI 314,575 86.3% $9.99 $90,073 162,608 Mission Bay Plaza Boca Raton, FL 263,714 94.2% $21.74 $97,125 170,812 Troy Marketplace Troy, MI 217,754 100.0% $16.21 $78,599 259,574 Marketplace of Delray Delray Beach, FL 238,196 89.2% $12.32 $76,349 190,027 Cypress Point Clearwater, FL 167,280 93.3% $11.60 $58,974 221,593 West Broward Shopping Center Plantation, FL 152,973 97.6% $10.78 $53,703 381,229 Village Plaza Lakeland, FL 146,755 67.9% $13.03 $50,035 114,947 Vista Plaza Jensen Beach, FL 109,761 100.0% $13.33 $64,134 95,853 The Shops at Old Orchard West Bloomfield, MI 97,068 96.9% $17.87 $105,445 144,958 Treasure Coast Commons Jensen Beach, FL 92,979 100.0% $12.26 $64,072 93,259 Cocoa Commons Cocoa, FL 90,116 87.0% $11.63 $54,645 68,747 Total 2,245,494 92.5% $14.34 $74,265 171,968 Note: As of 3/31/2013. Demographic information per Co-Star, 5-mile trade area. 8
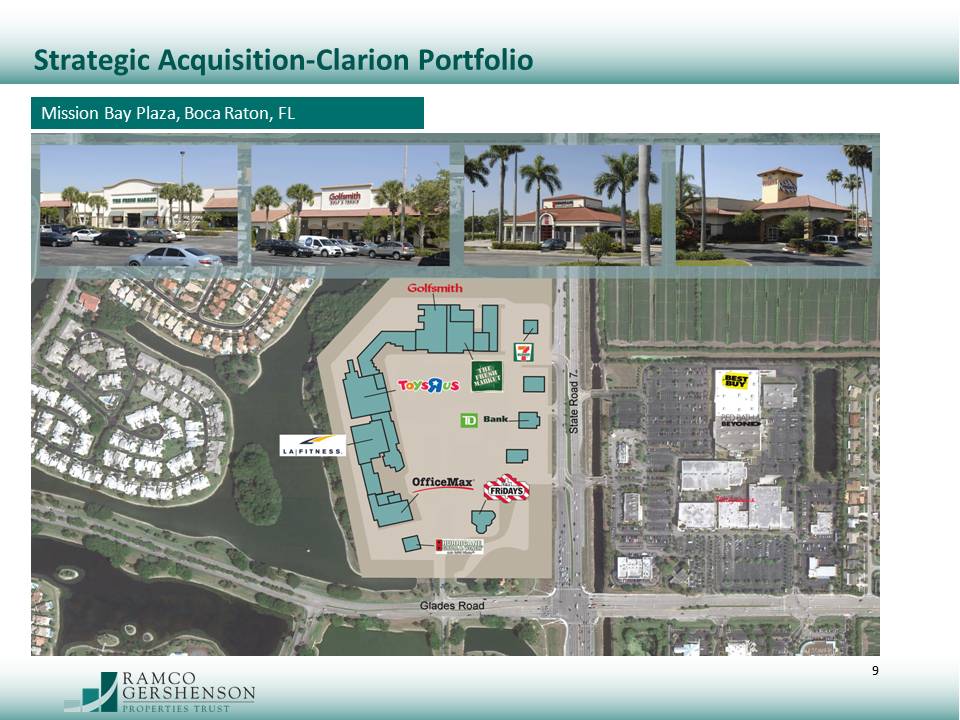
Strategic Acquisition-Clarion Portfolio Mission Bay Plaza, Boca Raton, FL 9
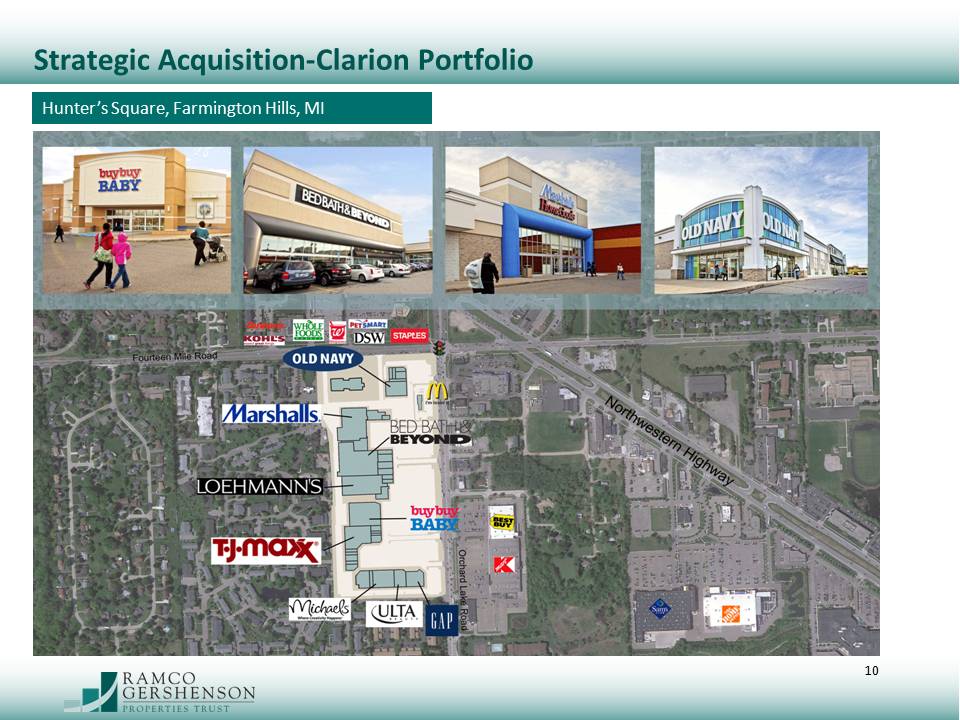
Strategic Acquisition-Clarion Portfolio Hunter’s Square, Farmington Hills, MI 10
Acquisition Pipeline-Opportunity for Growth The Company plans to continue to grow its portfolio of high-quality shopping centers through strategic acquisitions in attractive metropolitan markets. In 2013, the Company expects to acquire an additional $100 -$150 million of market dominant shopping centers. Dispositions of non-core properties should be $20-30 million. Growth markets for acquisitions in which the Company has identified opportunities include Chicago, St. Louis, SE Florida, and Denver. Additional acquisitions can also be realized through existing joint venture partnerships. RPT’s acquisition criteria, which supports its goal of enhancing the quality and performance of its shopping center portfolio include: Located in metropolitan markets with superior household incomes and high education levels. In close proximity to thriving business and industry. Multi-anchor centers with exciting retail concepts. Value-add component through expansion, retenanting and/or lease-up. 11
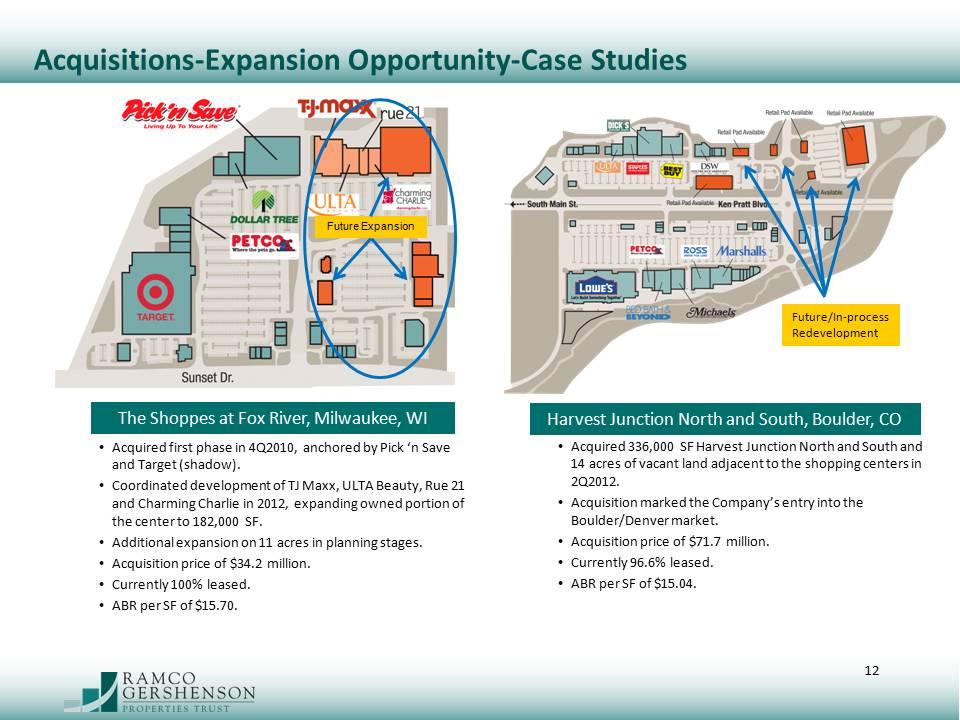
Acquisitions-Expansion Opportunity-Case Studies The Shoppes at Fox River, Milwaukee, WI Acquired first phase in 4Q2010, anchored by Pick ‘n Save and Target (shadow). Coordinated development of TJ Maxx, ULTA Beauty, Rue 21 and Charming Charlie in 2012, expanding owned portion of the center to 182,000 SF. Additional expansion on 11 acres in planning stages. Acquisition price of $34.2 million. Currently 100% leased. ABR per SF of $15.70. Harvest Junction North and South, Boulder, CO Acquired 336,000 SF Harvest Junction North and South and 14 acres of vacant land adjacent to the shopping centers in 2Q2012. Acquisition marked the Company’s entry into the Boulder/Denver market. Acquisition price of $71.7 million. Currently 96.6% leased. ABR per SF of $15.04. 12
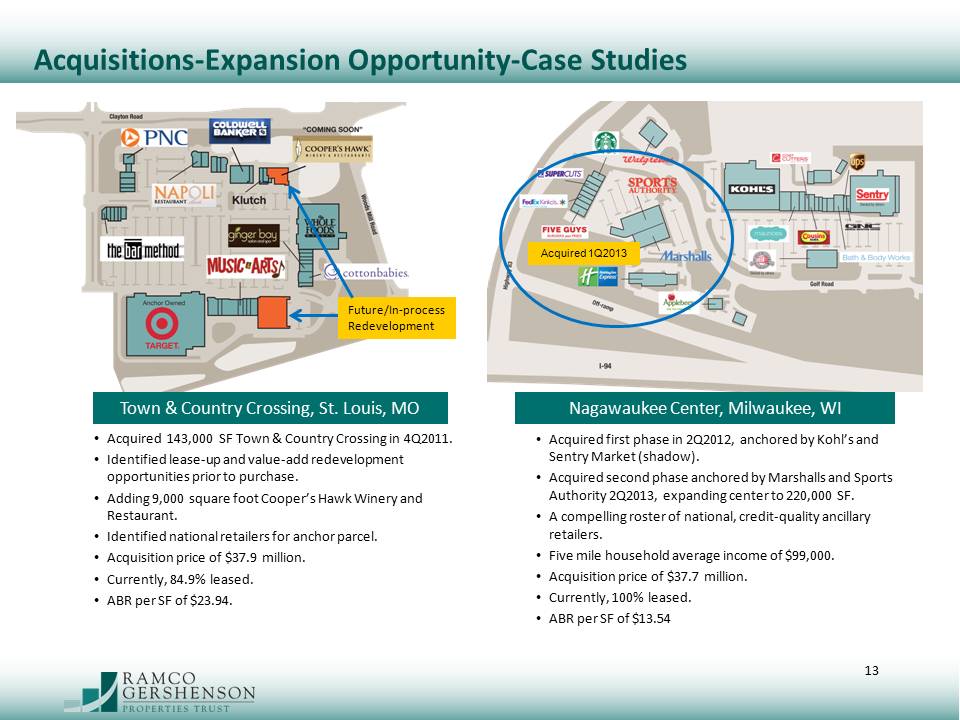
Acquisitions-Expansion Opportunity-Case Studies Town & Country Crossing, St. Louis, MO Acquired 143,000 SF Town & Country Crossing in 4Q2011. Identified lease-up and value-add redevelopment opportunities prior to purchase. Adding 9,000 square foot Cooper’s Hawk Winery and Restaurant. Identified national retailers for anchor parcel. Acquisition price of $37.9 million. Currently, 84.9% leased. ABR per SF of $23.94. Nagawaukee Center, Milwaukee, WI Acquired first phase in 2Q2012, anchored by Kohl’s and Sentry Market (shadow). Acquired second phase anchored by Marshalls and Sports Authority 2Q2013, expanding center to 220,000 SF. A compelling roster of national, credit-quality ancillary retailers. Five mile household average income of $99,000. Acquisition price of $37.7 million. Currently, 100% leased. ABR per SF of $13.54 13
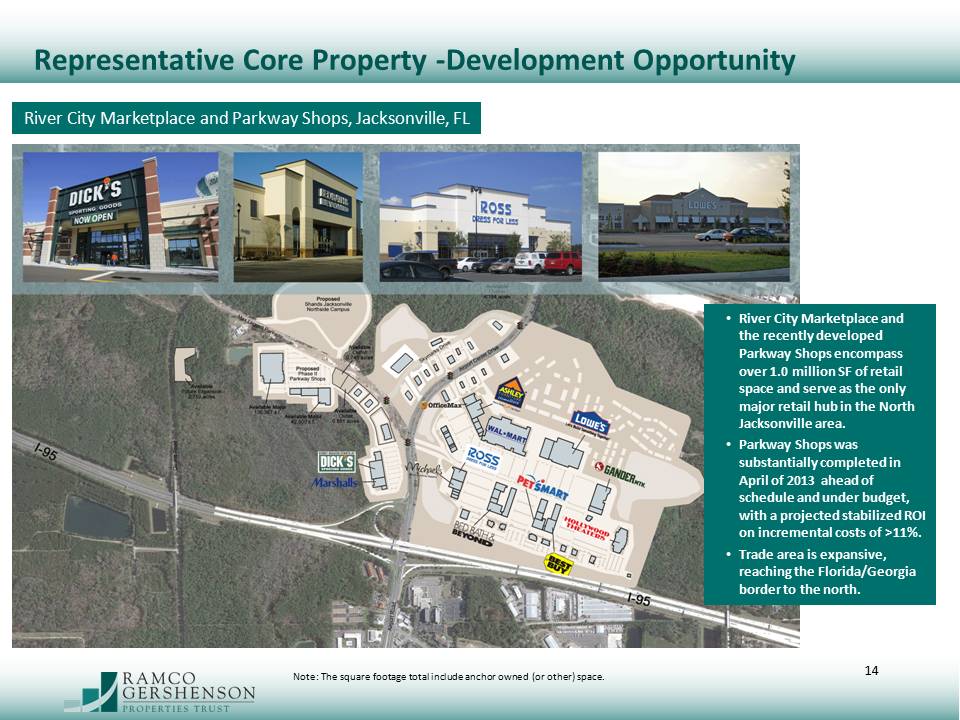
Representative Core Property -Development Opportunity River City Marketplace and Parkway Shops, Jacksonville, FL River City Marketplace and the recently developed Parkway Shops encompass over 1.0 million SF of retail space and serve as the only major retail hub in the North Jacksonville area. Parkway Shops was substantially completed in April of 2013 ahead of schedule and under budget, with a projected stabilized ROI on incremental costs of >11%. Trade area is expansive, reaching the Florida/Georgia border to the north. Note: The square footage total include anchor owned (or other) space. 14
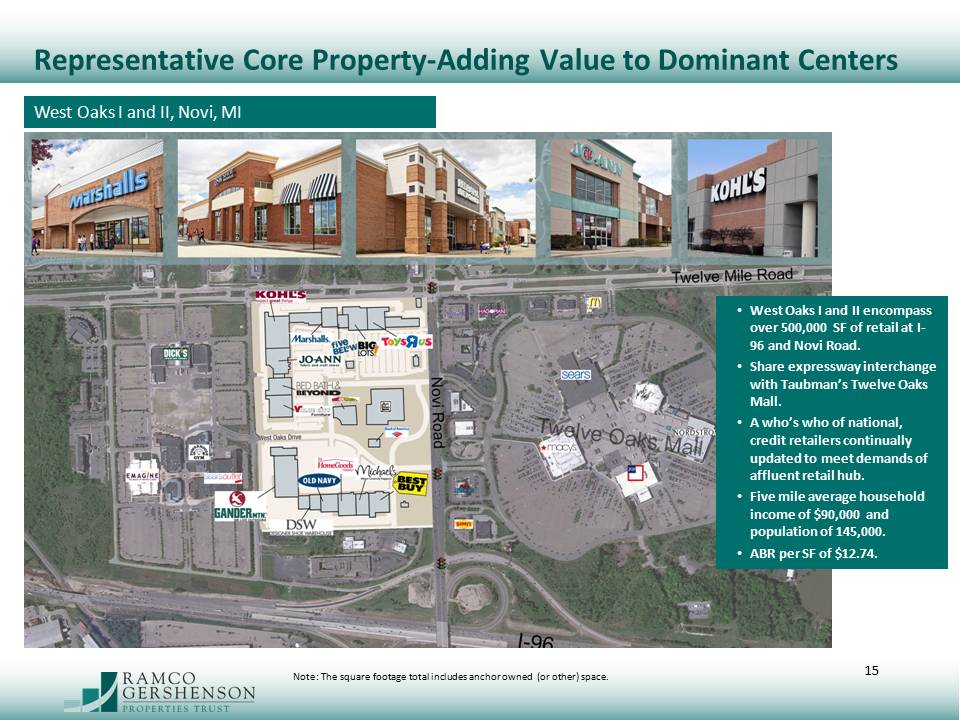
Representative Core Property-Adding Value to Dominant Centers West Oaks I and II, Novi, MI West Oaks I and II encompass over 500,000 SF of retail at I-96 and Novi Road. Share expressway interchange with Taubman’s Twelve Oaks Mall. A who’s who of national, credit retailers continually updated to meet demands of affluent retail hub. Five mile average household income of $90,000 and population of 145,000. ABR per SF of $12.74. Note: The square footage total includes anchor owned (or other) space. 15
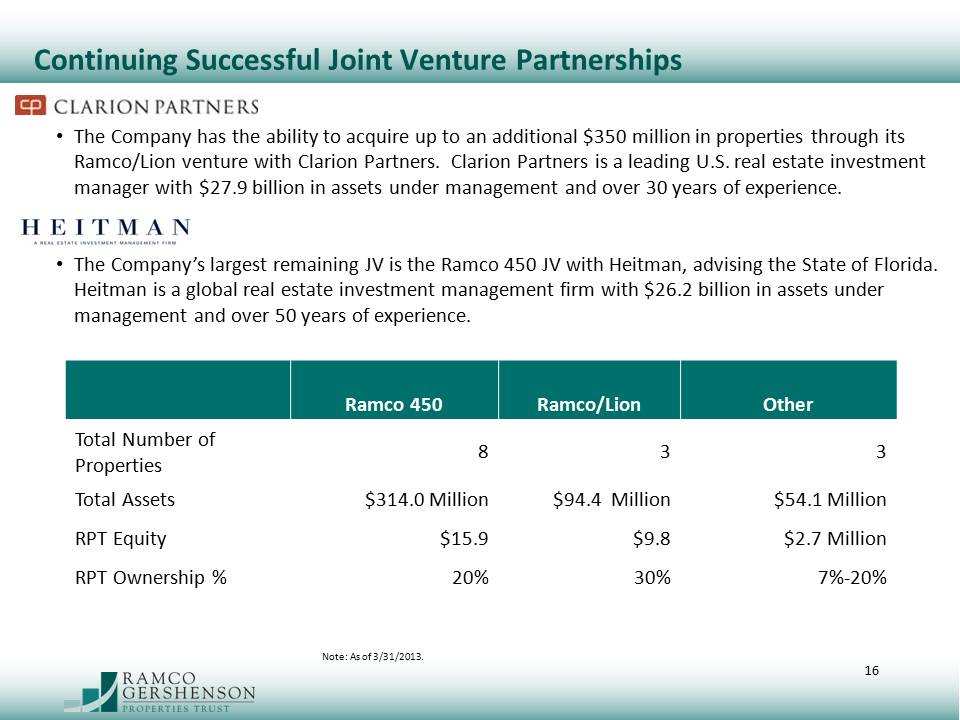
Continuing Successful Joint Venture Partnerships The Company has the ability to acquire up to an additional $350 million in properties through its Ramco/Lion venture with Clarion Partners. Clarion Partners is a leading U.S. real estate investment manager with $27.9 billion in assets under management and over 30 years of experience. The Company’s largest remaining JV is the Ramco 450 JV with Heitman, advising the State of Florida. Heitman is a global real estate investment management firm with $26.2 billion in assets under management and over 50 years of experience. Ramco 450 Ramco/Lion Other Total Number of Properties 8 3 3 Total Assets $314.0 Million $94.4 Million $54.1 Million RPT Equity $15.9 $9.8 $2.7 Million RPT Ownership % 20% 30% 7%-20% Note: As of 3/31/2013. 16

Operating Strategy 17
Disciplined Operating Strategy The Company is committed to continually increasing net operating income by driving occupancy and rental rates in its high-quality shopping center portfolio. Leasing to best-in-class, national retailers that contribute to a predictable and sustainable income stream. Focused on value enhancing strategies such as high tenant retention, risk mitigation, and cost containment initiatives. Continually refine and improve the portfolio by accommodating the latest retail prototypes through retenanting, downsizing, or consolidation. 18
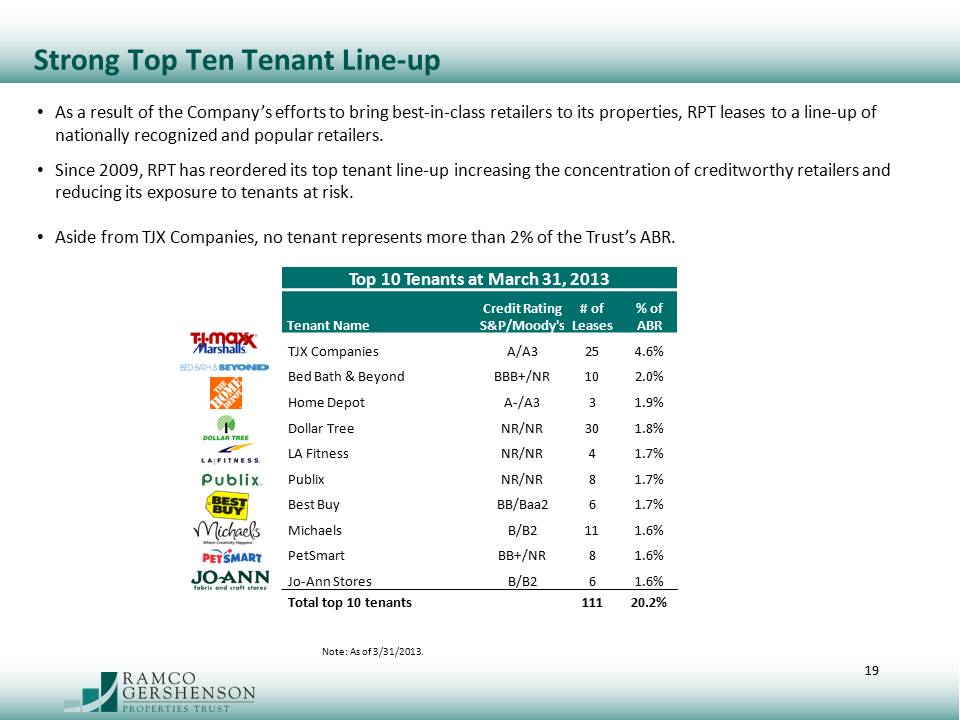
Strong Top Ten Tenant Line-up As a result of the Company’s efforts to bring best-in-class retailers to its properties, RPT leases to a line-up of nationally recognized and popular retailers. Since 2009, RPT has reordered its top tenant line-up increasing the concentration of creditworthy retailers and reducing its exposure to tenants at risk. Aside from TJX Companies, no tenant represents more than 2% of the Trust’s ABR. Top 10 Tenants at March 31, 2013 Tenant Name Credit Rating S&P/Moody's # of Leases % of ABR TJX Companies A/A3 25 4.6% Bed Bath & Beyond BBB+/NR 10 2.0% Home Depot A-/A3 3 1.9% Dollar Tree NR/NR 30 1.8% LA Fitness NR/NR 4 1.7% Publix NR/NR 8 1.7% Best Buy BB/Baa2 6 1.7% Michaels B/B2 11 1.6% PetSmart BB+/NR 8 1.6% Jo-Ann Stores B/B2 6 1.6% Total top 10 tenants 111 20.2% Note: As of 3/31/2013. 19
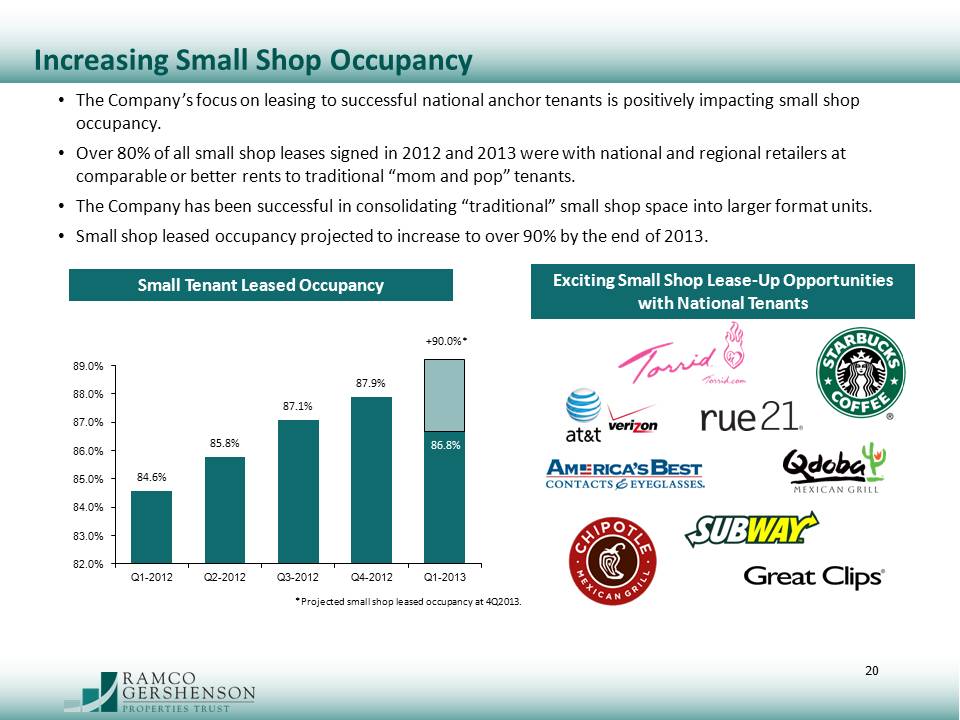
Increasing Small Shop Occupancy The Company’s focus on leasing to successful national anchor tenants is positively impacting small shop occupancy. Over 80% of all small shop leases signed in 2012 and 2013 were with national and regional retailers at comparable or better rents to traditional “mom and pop” tenants. The Company has been successful in consolidating “traditional” small shop space into larger format units. Small shop leased occupancy projected to increase to over 90% by the end of 2013. Small Tenant Leased Occupancy Exciting Small Shop Lease-Up Opportunities with National Tenants Q1-2012 Q2-2012 Q3-2012 Q4-2012 Q1-2013 84.6% 85.8% 87.1% 87.9% 86.8% +90.0% *Projected small shop leased occupancy at 4Q2013. 20
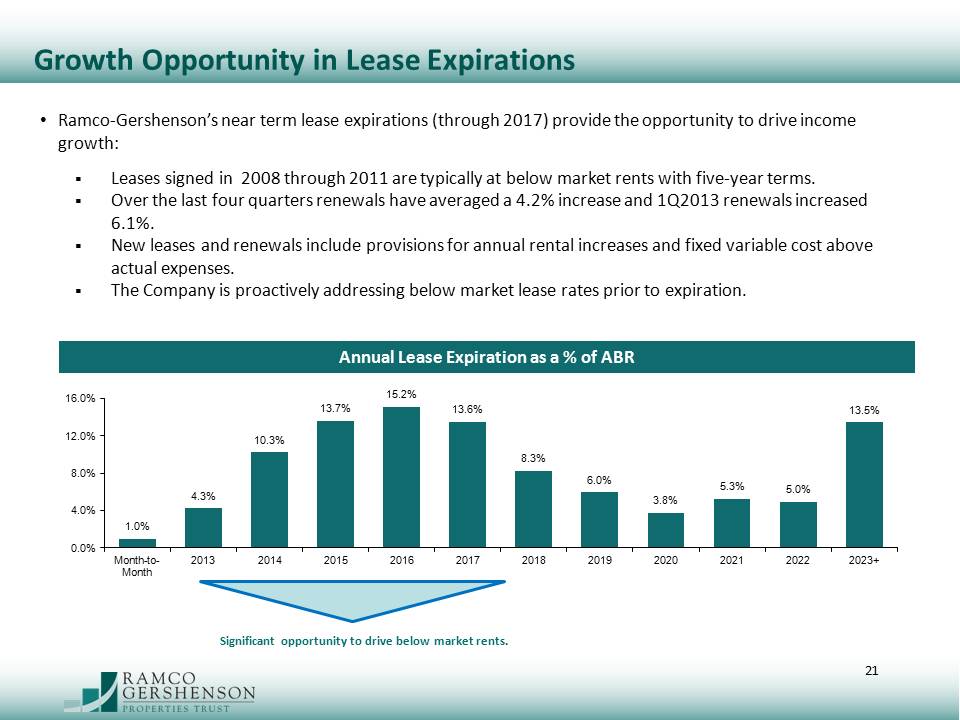
Growth Opportunity in Lease Expirations Ramco-Gershenson’s near term lease expirations (through 2017) provide the opportunity to drive income growth: Leases signed in 2008 through 2011 are typically at below market rents with five-year terms. Over the last four quarters renewals have averaged a 4.2% increase and 1Q2013 renewals increased 6.1%. New leases and renewals include provisions for annual rental increases and fixed variable cost above actual expenses. The Company is proactively addressing below market lease rates prior to expiration. Annual Lease Expiration as a % of ABR Month-to-Month 2013 2014 2015 2016 2017 2018 2019 2020 2021 2022 2023+ 1.0% 4.3% 10.3% 13.7% 15.2% 13.6% 8.3% 6.0% 3.8% 5.3% 5.0% 13.5% Significant opportunity to drive below market rents. 21
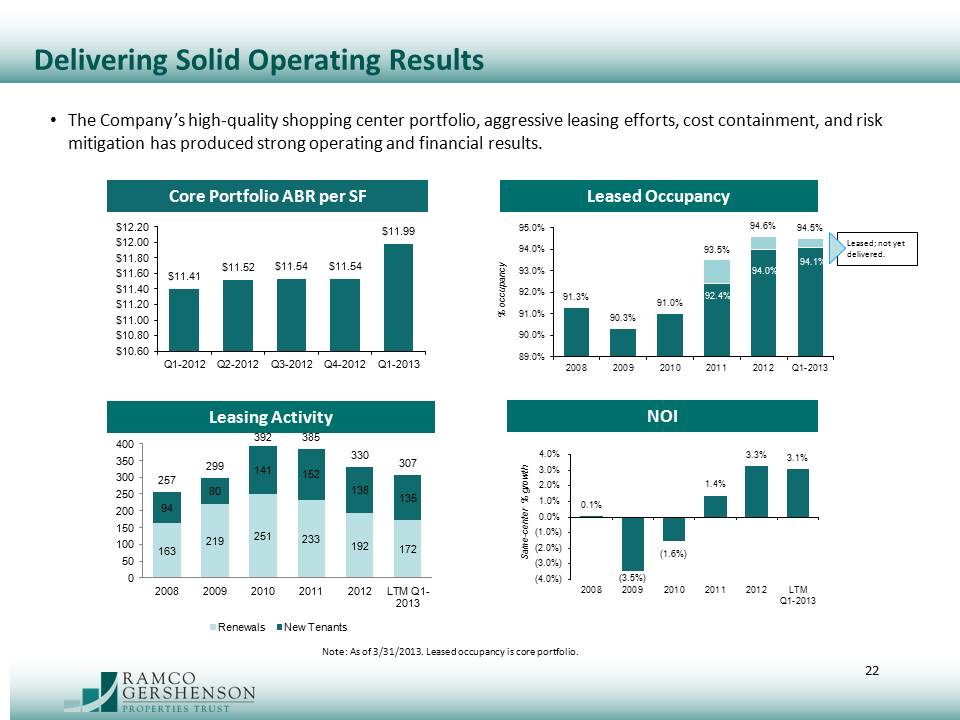
Delivering Solid Operating Results The Company’s high-quality shopping center portfolio, aggressive leasing efforts, cost containment, and risk mitigation has produced strong operating and financial results. Core Portfolio ABR per SF Leased Occupancy Leased; not yet delivered. Leasing Activity NOI Q1-2012 Q2-2012 Q3-2012 Q4-2012 Q1-2013 $11.41 $11.52 $11.54 $11.54 $11.99 % occupancy Same center % growth 2008 2009 2010 2011 2012 Q1-2013 91.3% 90.3% 91.0% 92.4% 93.5% 94.0% 94.6% 94.1% 94.5% 2008 2009 2010 2011 2012 LTM Q1-2013 163 94 257 219 80 299 251 141 392 233 152 385 192 138 330 172 135 307 2008 2009 2010 2011 2012 LTM Q1-2013 0.1% (3.5%) (1.6%) 1.4% 3.3% 3.1% Renewals New Tenants Note: As of 3/31/2013. Leased occupancy is core portfolio. 22
Balance Sheet Strategy 23
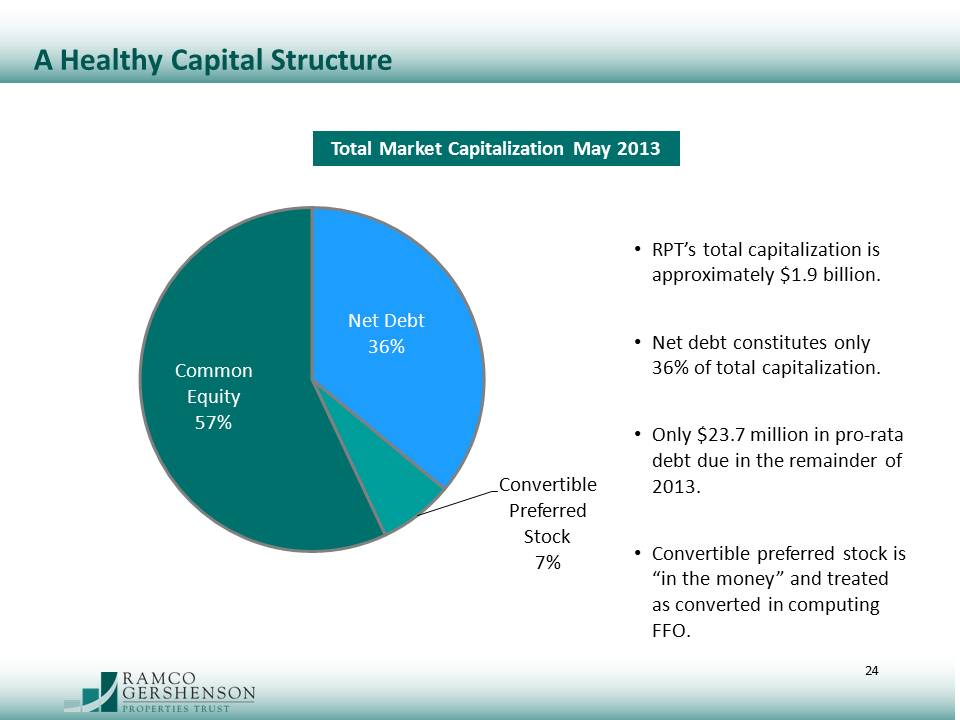
A Healthy Capital Structure Total Market Capitalization May 2013 RPT’s total capitalization is approximately $1.9 billion. Net debt constitutes only 36% of total capitalization. Only $23.7 million in pro-rata debt due in the remainder of 2013. Convertible preferred stock is “in the money” and treated as converted in computing FFO. Net Debt 36% Convertible Preferred Stock 7% Common Equity 57% 24
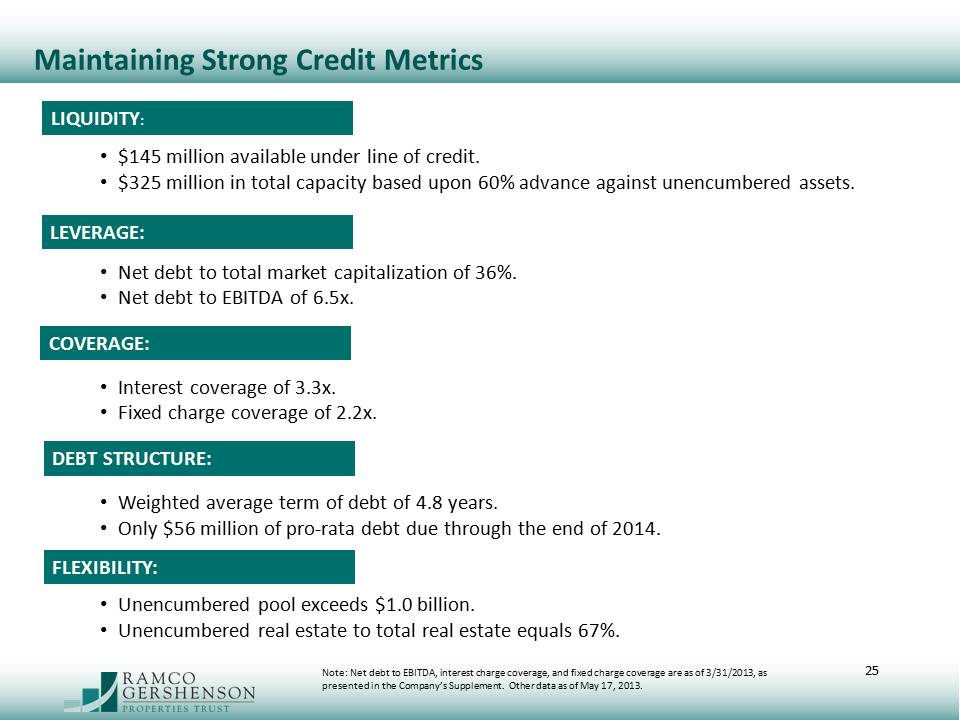
Maintaining Strong Credit Metrics LIQUIDITY: $145 million available under line of credit. $325 million in total capacity based upon 60% advance against unencumbered assets. LEVERAGE: Net debt to total market capitalization of 36%. Net debt to EBITDA of 6.5x. COVERAGE: Interest coverage of 3.3x. Fixed charge coverage of 2.2x. DEBT STRUCTURE: Weighted average term of debt of 4.8 years. Only $56 million of pro-rata debt due through the end of 2014. FLEXIBILITY: Unencumbered pool exceeds $1.0 billion. Unencumbered real estate to total real estate equals 67%. Note: Net debt to EBITDA, interest charge coverage, and fixed charge coverage are as of 3/31/2013, as presented in the Company’s Supplement. Other data as of May 17, 2013. 25
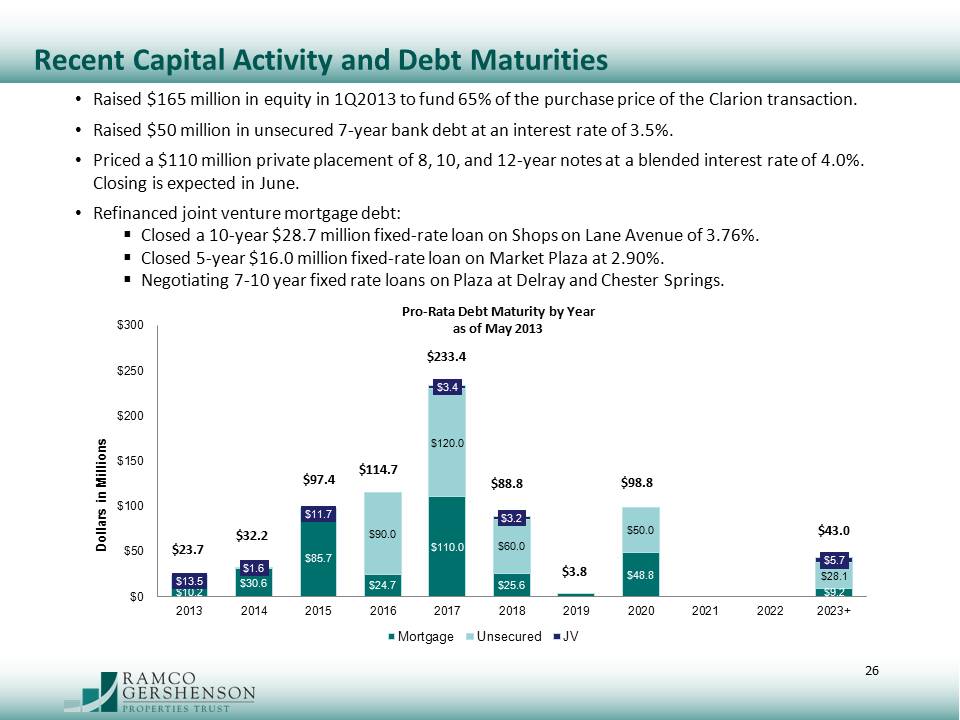
Recent Capital Activity and Debt Maturities Raised $165 million in equity in 1Q2013 to fund 65% of the purchase price of the Clarion transaction. Raised $50 million in unsecured 7-year bank debt at an interest rate of 3.5%. Priced a $110 million private placement of 8, 10, and 12-year notes at a blended interest rate of 4.0%. Closing is expected in June. Refinanced joint venture mortgage debt: Closed a 10-year $28.7 million fixed-rate loan on Shops on Lane Avenue of 3.76%. Closed 5-year $16.0 million fixed-rate loan on Market Plaza at 2.90%. Negotiating 7-10 year fixed rate loans on Plaza at Delray and Chester Springs. Pro-Rata Debt Maturity by Year as of May 2013 2013 2014 2015 2016 2017 2018 2019 2020 2021 2022 2023+ $23.7 $13.5 $10.2 $32.2 $1.6 $30.6 $97.4 $11.7 $85.7 $114.7 $90.0 $24.7 $233.4 $3.4 $120.0 $110.0 $88.8 $3.2 $60.0 $25.6 $3.8 $98.8 $50.0 $48.8 $43.0 $5.7 $28.1 $9.2 Dollars in Millions Mortgage Unsecured JV 26
Conclusion 27
Key Takeaways Ramco-Gershenson Properties Trust: A shopping center REIT with an experienced, dedicated management team, and a proven track record of success through all economic cycles. Committed to growing, diversifying, and enhancing the quality of its shopping center portfolio in major metropolitan markets. Maintains a strong balance sheet, staggered debt maturities, a growing unencumbered asset pool, and ample liquidity to support the Company’s growth initiatives. Generates a predictable and sustainable income stream from best-in-class retailers. Pays a secure, competitive dividend. 28
Safe Harbor Statement 29 Information included herein contains forward‐looking statements within the meaning of Section 27A of the Securities Act of 1933, as amended, or the “Securities Act”, and Section 21E of the Securities Exchange Act of 1934, as amended, or the “Exchange Act.” You can identify these forward‐looking statements by our use of the words “believe,” “anticipate,” “plan,” “expect,” “may,” “might,” “should,” “will,” “intend,” “estimate,” “predict” and similar expressions, whether in the negative or affirmative. These forward‐looking statements represent our expectations or beliefs concerning future events, including: statements regarding future developments and joint ventures, rents, returns, and earnings; statements regarding the continuation of trends; and any statements regarding the sufficiency of our cash balances and cash generated from operating, investing, and financing activities for our future liquidity and capital resource needs. We caution that although forward‐looking statements reflect our good faith beliefs and reasonable judgment based upon current information, these statements are not guarantees of future performance and are qualified by important factors that could cause actual results to differ materially from those in the forward‐looking statements, because of risks, uncertainties, and factors including, but not limited to: our success or failure in implementing our business strategy; economic conditions generally and in the commercial real estate and finance markets specifically; our cost of capital, which depends in part on our asset quality, our relationships with lenders and other capital providers; our business prospects and outlook; changes in governmental regulations, tax rates and similar matters; and our continuing to qualify as a REIT. Further, we have included important factors under the heading “Risk Factors” and elsewhere in our Annual Report on Form 10‐K for the year ended December 31, 2012, and other periodic reports, that we believe could cause our actual results to differ materially from the forward‐looking statements that we make. All forward‐looking statements are made as of the date hereof or the date specified herein, based on information available to us as of such date. Except as required by law, we do not undertake any obligation to update our forward‐looking statements or the risk factors contained herein to reflect new information or future events or otherwise. You are cautioned not to place undue reliance on forward‐looking statements.