Attached files
| file | filename |
|---|---|
| 8-K - FORM 8-K - JUNIATA VALLEY FINANCIAL CORP | v345732_8k.htm |

Annual Shareholders Meeting 2013
The presentation may contain “forward looking” information as defined by the Private Securities Litigation Reform Act of 1995 . When words such as “believes”, “expects”, “anticipates” or similar expressions are used in this release, Juniata Valley is making forward - looking statements . Such information is based on Juniata Valley’s current expectations, estimates and projections about future events and financial trends affecting the financial condition of its business . These statements are not historical facts or guarantees of future performance, events or results . Such statements involve potential risks and uncertainties and, accordingly, actual results may differ materially from this “forward looking” information . Many factors could affect future financial results . Juniata Valley undertakes no obligation to publicly update or revise forward looking information, whether as a result of new or updated information, future events, or otherwise . For a more complete discussion of certain risks and uncertainties affecting Juniata Valley, please see the sections entitled “Risk Factors” and “Management’s Discussion and Analysis of Financial Condition and Results of Operations – Forward - Looking Statements” set forth in the Juniata Valley’s filings with the Securities and Exchange Commission .
Chairman of the Board of Directors Philip E. Gingerich, Jr.

President and Chief Executive Officer Marcie A. Barber

Positioning for Prosperity

“2012 was a very good year….”

“Despite continued challenges in credit quality and earning asset growth, our management team furthered efforts to position your franchise for prosperity.” What did we do?

Executive Vice President and Chief Financial Officer JoAnn N. McMinn

Key Financial Ratios For Year 2011 For Year 2012 Q1 2013 Return on Average Assets 1.05% 0.80% 0.90% Return on Average Equity 9.29% 7.33% 8.05% Net Interest Margin (fully tax equivalent) 3.97% 3.68% 3.50% Loan Loss Provision as % of Average Assets 0.08% 0.31% 0.07% Non - Interest Income as % of Average Assets (excludes securities gains) 0.89% 1.00% 0.97% Non - Interest Expense as % of Average Assets 2.87% 2.88% 2.73% Earnings per Share (Fully Diluted) $1.10 $0.86 $0.24

Quarterly Net Income Results - 200 400 600 800 1,000 1,200 1,400 2011 2012 2013 Qtr 1 Qtr 2 Qtr 3 Qtr 4
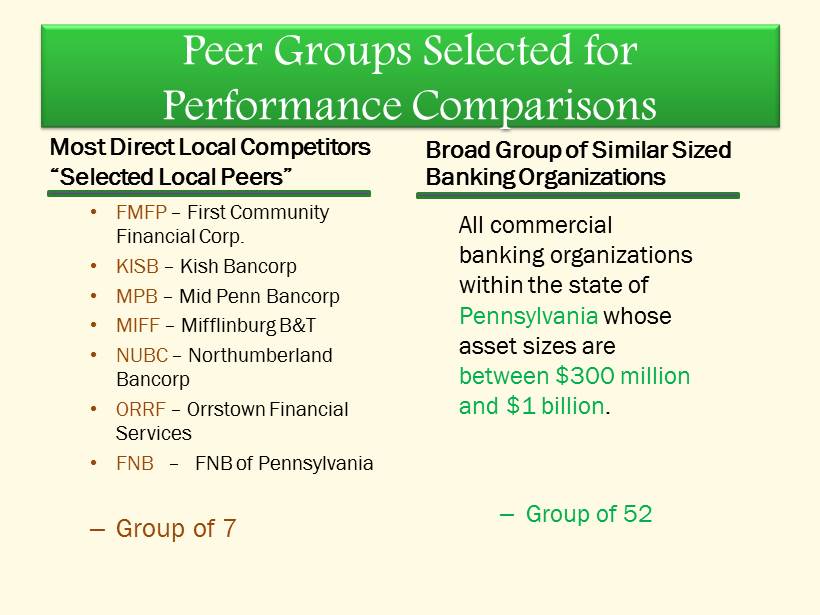
Most Direct Local Competitors “Selected Local Peers” • FMFP – First Community Financial Corp. • KISB – Kish Bancorp • MPB – Mid Penn Bancorp • MIFF – Mifflinburg B&T • NUBC – Northumberland Bancorp • ORRF – Orrstown Financial Services • FNB – FNB of Pennsylvania – Group of 7 Broad Group of Similar Sized Banking Organizations All commercial banking organizations within the state of Pennsylvania whose asset sizes are between $300 million and $1 billion . – Group of 52 Peer Groups Selected for Performance Comparisons

Quarterly Performance Comparison Return on Average Assets (0.60) (0.40) (0.20) - 0.20 0.40 0.60 0.80 1.00 1.20 2011Q4 2012Q1 2012Q2 2012Q3 2012Q4 2013Q1 JUVF Average Local Peers Average Group PA Banks 300M to 1Billion

Quarterly Performance Comparison Return on Average Equity (4.00) (2.00) - 2.00 4.00 6.00 8.00 10.00 12.00 2011Q4 2012Q1 2012Q2 2012Q3 2012Q4 2013Q1 JUVF Average Local Peers Average Group PA Banks 300M to 1Billion

Quarterly Performance Comparison Net Interest Margin (fully tax equivalent) 2.00 2.50 3.00 3.50 4.00 4.50 2011Q4 2012Q1 2012Q2 2012Q3 2012Q4 2013Q1 JUVF Average Local Peers Average Group PA Banks 300M to 1Billion

Quarterly Performance Comparison Loan Loss Provision as % of Average Assets - 0.20 0.40 0.60 0.80 1.00 1.20 1.40 2011Q4 2012Q1 2012Q2 2012Q3 2012Q4 2013Q1 JUVF Average Local Peers Average Group PA Banks 300M to 1Billion

Quarterly Performance Comparison Non - Interest Income as % of Average Assets 0.40 0.50 0.60 0.70 0.80 0.90 1.00 1.10 1.20 2011Q4 2012Q1 2012Q2 2012Q3 2012Q4 2013Q1 JUVF Average Local Peers Average Group PA Banks 300M to 1Billion
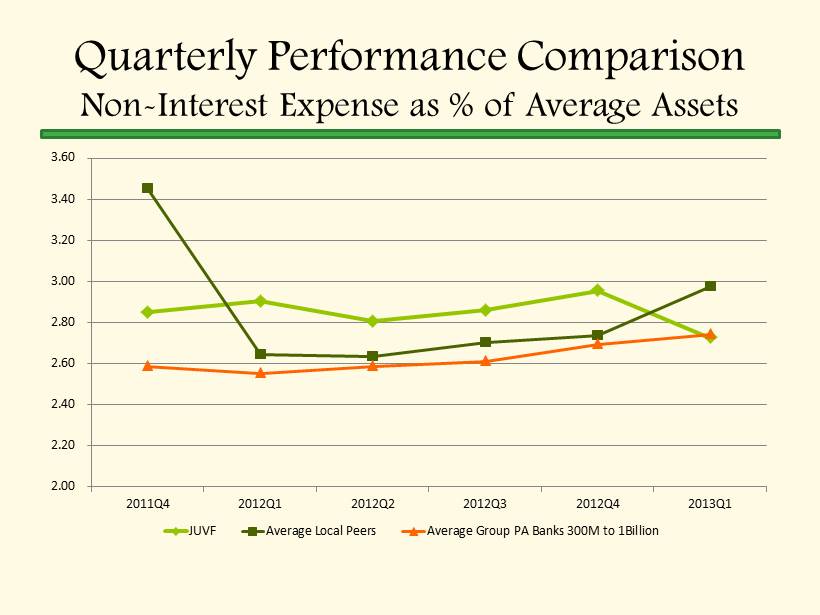
Quarterly Performance Comparison Non - Interest Expense as % of Average Assets 2.00 2.20 2.40 2.60 2.80 3.00 3.20 3.40 3.60 2011Q4 2012Q1 2012Q2 2012Q3 2012Q4 2013Q1 JUVF Average Local Peers Average Group PA Banks 300M to 1Billion

Credit Quality Statistics • High Focus on Reduction and Prevention of Non - Performing Assets. • Definition of Non - Performing Asset – Loan that has been placed in non - accrual status. – Loan that is accruing but is more than 90 days delinquent in scheduled payments. – Performing loan that is a troubled - debt restructure (TDR). – Properties owned by the Bank as a result of loan foreclosures (Other Real Estate Owned – OREO).

Quarterly Comparison Non - Performing Assets as % of Equity (includes Non - Accrual, OREO, TDR and 90 Day Delinquencies still Accruing) 5.00 7.00 9.00 11.00 13.00 15.00 17.00 19.00 21.00 23.00 25.00 2011Q4 2012Q1 2012Q2 2012Q3 2012Q4 2013Q1 JUVF Average Local Peers Average Group PA Banks 300M to 1Billion

Capital Strength • Regulatory Measurement of Capital Adequacy • JUVF Capital levels support the level of dividends being maintained. The dividend yield is among the highest, as depicted on a slide to follow • Total Return on Investment continues to be strong in comparison to both peer groups.

Quarterly Comparison Risk Based Capital Ratio 10.00 12.50 15.00 17.50 20.00 2011Q4 2012Q1 2012Q2 2012Q3 2012Q4 2013Q1 JUVF Average Local Peers Average Group PA Banks 300M to 1Billion

Stockholder Total Return – 5 Year Assumptions • Investment made on 12/31/2007 • Selected Local Peers Include: – FMFP – First Community Financial Corp. – KISB – Kish Bancorp – MPB – Mid Penn Bancorp – MIFF – Mifflinburg B&T – NUBC – Northumberland Bancorp – ORRF – Orrstown Financial Services – FNB – FNB of Pennsylvania Definition • Total return of a security over a period, including price appreciation and the reinvestment of dividends. Dividends are assumed to be reinvested at the closing price of the security on the ex - date of the dividend .

Five Year Historical Comparison Dividend Yield 0.00 1.00 2.00 3.00 4.00 5.00 6.00 2008 2009 2010 2011 2012 2013 Q1 Juniata Valley Financial Corp. Average Local Peers Average Group PA Banks 300M to 1Billion

12/31/2007 – 12/31/2012 Stock – Five Year Total Return Performance Compared to National Index and Selected Local Peers

12/31/2007 – 12/31/2012 Stock – Five Year Total Return Performance Compared to All Banks in United States and Selected Local Peers

12/31/2007 – 12/31/2012 Stock – Five Year Total Return Performance Compared to Similar Sized Banks in United States and Selected Local Peers

President and Chief Executive Officer Marcie A. Barber

“We grow the franchise by committing to our clients through the horizontal integration of financial products and services.”

Products and Services Loans Deposits Wealth Management Trust Services Retirement Planning Debt Management Financial Recordkeeping Electronic Services Business Valuation

“We grow the franchise by first connecting to our markets and then meeting their needs.”


“ We grow the franchise by offering services valued by our present and future customers .”


I overheard a conversation……

“We grow the franchise by investing in our people.”

We grow the franchise by refining and re - defining who we are and by sharing it with you.


Positioning for Prosperity