Attached files
| file | filename |
|---|---|
| 8-K - 8-K - Guaranty Bancorp | a13-12792_18k.htm |
Exhibit 99.1
|
|
Investor Presentation May 2013 |
|
|
2 This presentation contains forward-looking statements, which are included in accordance with the “safe harbor” provisions of the Private Securities Litigation Reform Act of 1995. In some cases, you can identify forward-looking statements by terminology such as “may,” “will,” “should,” “could,” “can,” “expects,” “plans,” “intends,” “anticipates,” “believes,” “estimates,” “predicts,” “potential,” or “continue,” or the negative of such terms and other comparable terminology. These forward-looking statements involve known and unknown risks, uncertainties and other factors that may cause the Company’s actual results, performance or achievements to be materially different from any future results, performance or achievements expressed or implied by such forward-looking statements. Such factors include, among others, the following: failure to maintain adequate levels of capital and liquidity to support Company’s operations; general economic and business conditions in those areas in which the Company operates; success or lack of success of any future acquisitions; demographic changes; competition; fluctuations in interest rates; continued ability to attract and employ qualified personnel; ability to receive regulatory approval for our bank subsidiary to declare dividends to the Company; adequacy of our allowance for loan losses, changes in credit quality and the effect of credit quality on our provision for credit losses and allowance for loan losses; changes in governmental legislation or regulation, including, but not limited to, any increase in FDIC insurance premiums and regulatory capital standards; changes in accounting policies and practices; changes in business strategy or development plans; changes in the securities markets; changes in consumer spending, borrowing and savings habits; the availability of capital from private or government sources; competition for loans and deposits and failure to attract or retain loans and deposits; changes in the financial performance and/or condition of our borrowers and the ability of our borrowers to perform under the terms of their loans and other terms of credit agreements; political instability, acts of war or terrorism and natural disasters; and additional “Risk Factors” referenced in the Company’s most recent Annual Report on Form 10-K filed with the Securities and Exchange Commission, as supplemented from time to time. When relying on forward-looking statements to make decisions with respect to the Company, investors and others are cautioned to consider these and other risks and uncertainties. The Company can give no assurance that any goal or plan or expectation set forth in forward-looking statements can be achieved and readers are cautioned not to place undue reliance on such statements, which speak only as of the date made. The forward-looking statements are made as of the date of these materials, and the Company does not intend, and assumes no obligation, to update the forward-looking statements or to update the reasons why actual results could differ from those projected in the forward-looking statements. Investors and security holders are urged to read the Company’s Annual Report on Form 10-K, quarterly reports on Form 10-Q and other documents filed by the Company with the SEC. The documents filed by the Company with the SEC may be obtained at the Company’s website at www.gbnk.com or at the SEC's website at www.sec.gov. These documents may also be obtained free of charge from the Company by directing a request to: Guaranty Bancorp, 1331 Seventeenth St., Suite 345, Denver, CO 80202, Attention: Christopher Treece/Investor Relations; Telephone 303-675-1194. Forward Looking Statements |
|
|
1 Closing Price on May 16, 2013, which pre-dates the 1-for-5 reverse stock split effected after the market close on May 20, 2013. 2 See the accompanying reconciliation of non-GAAP measurements to GAAP. 3 After the close of market on May 20, 2013, the company effected a 1-for-5 reverse stock split and the common stock will begin to trade on a split-adjusted basis at the opening of the trading market on May 21, 2013. 4 Based on 106,914,333 Shares Outstanding (Voting and Non-Voting) on March 31, 2013. 3 Recent Price (pre 1-for-5 reverse stock split on 5-20-2013) $ 2.111 Tangible Book Value (pre reverse stock split) $ 1.692 First Quarter 2013 EPS $ 0.02 Pro-Forma First Quarter 2013 EPS (split adjusted) $ 0.113 May 31, 2013 Quarterly Per Share Dividend Payment (post reverse split) $ 0.0253 Market Capitalization: $225.6 million 1, 4 About Us - GBNK |
|
|
4 Guaranty Bancorp is uniquely positioned in the Colorado market: Strategically located on the thriving Colorado Front Range, which encompasses 85% of the state’s population Asset Size: $1.8 billion Gross Loans: $1.2 billion Total Deposits: $1.4 billion Well positioned for anticipated market consolidation About Us - GBNK |

|
|
5 Positive pre-tax earnings trend Will pay first ever quarterly cash dividend of 2.5 cents per share, post-reverse stock split, on May 31, 20131 A 1-for-5 reverse stock split effective after the close of market on May 20, 2013 Loan growth momentum 2012 net loan growth of 6% Q1 2013 net loan growth of 8% annualized Q1 2013 commercial net loan growth of 17% annualized Strong asset quality (ratios at March 31, 2013) Classified asset ratio of 23.8% Texas ratio of 18.17% Nonperforming loans to total loans of 2.67% Nonperforming assets to total assets of 2.18% Allowance to total loans of 2.04% Investment Considerations 1 Dividend paid to Stockholders of record as of May 28, 2013. |
|
|
6 Strong core deposit mix Noninterest bearing deposits comprised 36% of total deposits at March 31, 2013 Time deposits only comprised 13% of total deposits at March 31, 2013 First quarter 2013 cost of deposits of 0.18% Noninterest income growth Acquisition of Private Capital Management, a fee-based investment management firm, in July 2012 As of March 31, 2013, assets under management have grown 29% since acquisition Investment management fees bolstered by both organic growth and bank referrals Purchase of $15 million of Bank-owned Life Insurance in April 2013 Earnings are reflected as noninterest income and are tax-exempt Anticipated tax-equivalent earnings of approximately $1.0 million annually Implemented deposit and treasury management fee increases on April 1, 2013 Focused on SBA guaranteed loans and premium fee income from sales Focused on customer back-to-back interest rate swaps Investment Considerations |
|
|
7 Strong capital structure supportive of future growth (ratios at March 31, 2013) Tangible Common Equity Ratio of 9.90%1 Total Risk-Based Capital Ratio of 15.20% GAAP Equity Ratio of 10.32% Focus on expense management Q1 2013 redemption of 10.47% Trust Preferred Securities to save approximately $1.6 million annually Closed six branches in 2012 Reduced troubled asset related expenses Review of all significant cost areas of the bank including information technology, communication, processing and occupancy to identify cost saving opportunities Investment Considerations 1 See accompanying reconciliation of non-GAAP measurements to GAAP. |
|
|
8 Deposits by Product Deposits by Business Line Deposit Composition March 31, 2013 |
|
|
9 Deposit Trends |
|
|
10 March 31, 2013 Loans by Type Loans by Business Line Loan Composition |
|
|
11 1 Excludes Loans Held for Sale 2010 2011 2012 Q1 2013 YTD Loans - Beginning Balance $1,519,608 $1,204,580 $1,098,140 $1,158,749 New Credit Extended and Advances on Existing Lines 276,604 388,088 522,679 133,319 Net Paydowns & Maturities (505,078) (457,442) (450,623) (108,373) Net Loan Charge-Offs (39,322) (17,408) (7,519) (1,082) Transfers to OREO (47,232) (19,678) (3,928) (2,006) Loans - Ending Balance1 $1,204,580 $1,098,140 $1,158,749 $1,180,607 Annualized Loan (Shrinkage) Growth (9%) 6% 8% Loan Portfolio Activity ($ in thousands) |
|
|
12 Net Interest Margin 4.07% 3.61% 0.18% 0.72% |
|
|
13 Note: Classified Assets / Tier 1 Capital + ALLL is computed for our subsidiary bank, Guaranty Bank and Trust Company. Classified Asset Trend 23.8% |
|
|
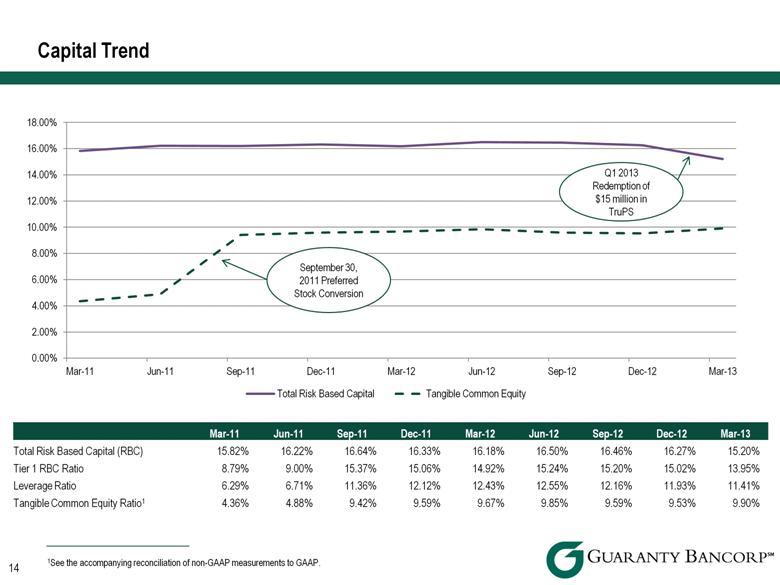
14 Mar-11 Jun-11 Sep-11 Dec-11 Mar-12 Jun-12 Sep-12 Dec-12 Mar-13 Total Risk Based Capital (RBC) 15.82% 16.22% 16.64% 16.33% 16.18% 16.50% 16.46% 16.27% 15.20% Tier 1 RBC Ratio 8.79% 9.00% 15.37% 15.06% 14.92% 15.24% 15.20% 15.02% 13.95% Leverage Ratio 6.29% 6.71% 11.36% 12.12% 12.43% 12.55% 12.16% 11.93% 11.41% Tangible Common Equity Ratio1 4.36% 4.88% 9.42% 9.59% 9.67% 9.85% 9.59% 9.53% 9.90% 1See the accompanying reconciliation of non-GAAP measurements to GAAP. September 30, 2011 Preferred Stock Conversion Q1 2013 Redemption of $15 million in TruPS Capital Trend |
|
|
15 Income Statement 1Q11 2Q11 3Q11 4Q11 1Q12 2Q12 3Q12 4Q12 1Q13 Net Interest Income $ 14,710 $ 14,747 $ 15,112 $ 15,325 $ 15,300 $ 15,383 $ 14,511 $ 15,217 $ 15,378 Provision for Loan Losses 2,000 1,000 1,000 1,000 1,000 500 - (3,500) - Noninterest Income 3,280 2,336 5,529 2,800 3,099 2,911 3,815 3,766 2,950 Noninterest Expense 15,476 14,674 17,488 14,849 14,482 17,516 14,194 17,922 15,192 Tax Expense (Benefit) - - - - - (5,914) 1,302 1,441 864 Net Income $ 514 $ 1,409 $ 2,153 $ 2,276 $ 2,917 $ 6,192 $ 2,830 $ 3,120 $ 2,272 Balance Sheet 3/31/11 6/30/11 9/30/11 12/31/11 3/31/12 6/30/12 9/30/12 12/31/12 3/31/13 Cash and Equivalents $ 184,777 $ 134,896 $ 93,226 $ 109,225 $ 105,273 $ 142,133 $ 167,823 $ 171,217 $ 60,891 Investments 409,126 408,806 314,420 386,141 401,357 398,151 436,386 458,927 512,188 Loans 1,126,083 1,091,132 1,088,358 1,098,140 1,109,897 1,110,161 1,118,968 1,158,749 1,180,607 Allowance for Loan Losses (46,879) (38,855) (35,852) (34,661) (30,075) (29,307) (28,597) (25,142) (24,060) Other Assets 161,350 151,081 232,216 130,823 129,992 129,401 140,398 123,187 107,214 Total Assets $1,834,457 $1,747,060 $1,692,368 $1,689,668 $1,716,444 $1,750,539 $1,834,978 $1,886,938 $1,836,840 Deposits $1,438,320 $1,346,183 $1,330,661 $1,313,786 $1,338,928 $1,378,937 $1,395,096 $1,454,756 $1,442,317 Other Liabilities 236,217 235,143 192,257 204,871 203,243 191,481 254,809 243,982 204,981 Total Liabilities $1,674,537 $1,581,326 $1,522,918 $1,518,657 $1,542,171 $1,570,418 $1,649,905 $1,698,738 $1,647,298 Stockholders’ Equity $159,920 $165,734 $169,450 $171,011 $174,273 $180,121 $185,073 $188,200 $188,542 Total Liabilities and Stockholders’ Equity $1,834,457 $1,747,060 $1,692,368 $1,689,668 $1,716,444 $1,750,539 $1,834,978 $1,886,938 $1,836,840 Quarterly Financial Statement Summary Trends ($ in thousands) |
|
|
16 Colorado Market |

|
|
1US Census Bureau 2 Bureau of Labor Statistics 17 Demographics Colorado National Current Population (2012 estimate)1 5,187,582 313,914,040 Historical Population Change (April 2010-July 2012)1 3.1% 1.7% Projected Population Change (2010-2015)1 7.8% 3.9% Median Household Income (2007-2011)1 $57,685 $52,762 Projected Household Income Change (2010-2015)1 14.6% 12.4% Current Unemployment Rate (March 2013)2 7.1% 7.6% Market Data |
|
|
18 Business Climate Colorado is the third top state for business – CNBC 2012 Colorado is the nation’s third-most economically competitive state – Beacon Hill Institute 2012 Denver is 3rd best city for startups – Venture Beat 2012 Denver’s employment forecast is 5th best in the nation – Manpower 2012 Growth Metro Denver has a population of 2.8 million people, and has a growth rate that has consistently outpaced the national rate every decade since the 1930s – Metro Denver Economic Development Corporation Metro Denver ranked first among 337 metro areas for absolute increase in construction employment from Feb. 2011 to Feb. 2012 – Associated General Contractors of America 2012 Denver attracted the most relocating adults aged 25 to 34 of any large U.S. metropolitan area from 2008 to 2010 - Brookings Institution: U.S. Census Bureau, 2010 American Community Survey Current Downtown Denver development projects include: 16th Street mall renovation, Union Station redevelopment, Ralph L. Carr Judicial Complex Market Statistics |
|
|
19 Economy In the first quarter of 2013, results from the Manpower Employment Outlook Survey show that the percent of employers planning to hire new workers has jumped to the highest point since 2008 – Metro Denver Economic Development Corporation Home resale activity in Metro Denver increased 20.3 percent year-over-year in November 2012 – Metro Denver Economic Development Corporation Denver is one of the top 10 national cities to watch, according to the Urban Land Institute / Price Waterhouse Cooper’s 2011 Emerging Trends in Real Estate report, marking the fourth year in a row the report has highlighted Denver among top-tier cities – 2011 Urban Land Institute & PWC Emerging Trends in Real Estate Highly Educated Workforce Colorado is the best state for labor supply – Forbes 2012 Of Colorado’s adult population, 36 percent have a bachelor’s degree or higher, making Colorado the second-most highly educated state in the country behind only Massachusetts - U.S. Census Bureau; 2010 American Community Survey Colorado has the third highest concentration of scientists and engineers in the nation - Milken Institute, 2010 Market Statistics |

|
|
20 Reconciliation of Non-GAAP Measures |
|
|
21 Tangible Book Value as of March 31, 2013 Stockholders’ Equity $189,542 Less Intangible Assets (8,641) Tangible Stockholders’ Equity $180,901 Shares Outstanding (pre 1-for-5 reverse stock split) 106,914,333 Book Value per common share (pre 1-for-5 reverse stock split) $1.77 Tangible Book Value per common share (pre 1-for-5 reverse stock split) $1.69 Tangible Common Equity Ratio at March 31, 2013 Stockholders’ Equity $189,542 Less Intangible Assets (8,641) Tangible Stockholders’ Equity $180,901 Total Assets $1,836,840 Less Intangible Assets (8,641) Total Tangible Assets $1,828,199 Equity Ratio – GAAP1 10.32% Tangible Common Equity/ Tangible Assets 9.90% 1 Total stockholders’ equity / total assets Non-GAAP Measure Reconcilements ($ in thousands, share data excepted) |