Attached files
| file | filename |
|---|---|
| EX-23.2 - EX-23.2 - GLOBAL BRASS & COPPER HOLDINGS, INC. | d367030dex232.htm |
Table of Contents
As filed with the Securities and Exchange Commission on May 20, 2013
Registration No. 333-177594
UNITED STATES
SECURITIES AND EXCHANGE COMMISSION
WASHINGTON, D.C. 20549
Amendment No. 8
to
FORM S-1
REGISTRATION STATEMENT
UNDER
THE SECURITIES ACT OF 1933
GLOBAL BRASS AND COPPER HOLDINGS, INC.
(Exact name of registrant as specified in its charter)
| Delaware | 3350 | 06-1826563 | ||
| (State or other jurisdiction of incorporation or organization) |
(Primary Industrial Classification Code Number) |
(I.R.S. Employer Identification Number) |
475 N. Martingale Road Suite 1050
Schaumburg, IL 60173
(847) 240-4700
(Address, including zip code, and telephone number, including area code, of registrant’s principal executive offices)
Scott B. Hamilton
General Counsel
Global Brass and Copper Holdings, Inc.
475 N. Martingale Road Suite 1050
Schaumburg, IL 60173
(847) 240-4700
(Name, address, including zip code, and telephone number, including area code, of agent for service)
Copies to:
| Lawrence G. Wee Paul, Weiss, Rifkind, Wharton & Garrison LLP 1285 Avenue of the Americas New York, New York 10019 (212) 373-3000 |
LizabethAnn R. Eisen Andrew J. Pitts Cravath, Swaine & Moore LLP 825 Eighth Avenue New York, New York 10019-7475 (212) 474-1000 |
Approximate date of commencement of proposed sale to the public: As promptly as practicable after the effective date of this registration statement.
If any of the securities being registered on this Form are to be offered on a delayed or continuous basis pursuant to Rule 415 under the Securities Act of 1933, as amended, check the following box. ¨
If this Form is filed to register additional securities for an offering pursuant to Rule 462(b) under the Securities Act, please check the following box and list the Securities Act registration statement number of the earlier effective registration statement for the same offering. ¨
If this Form is a post-effective amendment filed pursuant to Rule 462(c) under the Securities Act, check the following box and list the Securities Act registration statement number of the earlier effective registration statement for the same offering. ¨
Indicate by check mark whether the registrant is a large accelerated filer, an accelerated filer, a non-accelerated filer, or a smaller reporting company. See the definitions of “large accelerated filer,” “accelerated filer” and “smaller reporting company” in Rule 12b-2 of the Exchange Act.
| Large accelerated filer ¨ | Accelerated filer ¨ | Non-accelerated filer þ | Smaller reporting company ¨ |
(Do not check if a smaller reporting company)
CALCULATION OF REGISTRATION FEE
|
| ||||||||
| Title of Each Class of Securities to be Registered |
Amount to be |
Proposed Offering Price Per Share |
Proposed Maximum Aggregate Offering Price(1)(2) |
Amount of Registration Fee(2)(3) | ||||
| Common Stock, $0.01 par value per share |
10,781,000 | $17.00 | $183,277,000 | $24,992.16 | ||||
|
| ||||||||
|
| ||||||||
| (1) | Estimated solely for the purpose of computing the registration fee pursuant to Rule 457(a) under the Securities Act. |
| (2) | Includes 1,406,000 shares which the underwriters have the right to purchase pursuant to their option to purchase additional shares. |
| (3) | Previously paid. |
The registrant hereby amends this registration statement on such date or dates as may be necessary to delay its effective date until the registrant shall file a further amendment which specifically states that this registration statement shall thereafter become effective in accordance with Section 8(a) of the Securities Act of 1933 or until the registration statement shall become effective on such date as the Commission, acting pursuant to said Section 8(a), may determine.
Table of Contents
The information in this preliminary prospectus is not complete and may be changed. These securities may not be sold until the registration statement filed with the Securities and Exchange Commission is effective. This preliminary prospectus is not an offer to sell nor does it seek an offer to buy these securities in any jurisdiction where the offer or sale is not permitted.
Subject to Completion. May 20, 2013.
9,375,000 Shares

GLOBAL BRASS AND COPPER HOLDINGS, INC.
Common Stock
This is an initial public offering of shares of common stock of Global Brass and Copper Holdings, Inc. All of the 9,375,000 shares to be sold in this public offering will be sold by the selling stockholder identified in this prospectus. Global Brass and Copper Holdings, Inc. will not receive any proceeds from this offering.
Prior to this offering, there has been no public market for the common stock. It is currently estimated that the initial public offering price per share will be between $15.00 and $17.00. We have been approved to list our common stock on the New York Stock Exchange under the symbol “BRSS”.
See “Risk Factors” on page 23 to read about factors you should consider before buying shares of the common stock.
Neither the Securities and Exchange Commission nor any other regulatory body has approved or disapproved of these securities or passed upon the accuracy or adequacy of this prospectus. Any representation to the contrary is a criminal offense.
| Per Share | Total | |||||
| Initial public offering price |
$ | $ | ||||
| Underwriting discount |
$ | $ | ||||
| Proceeds, before expenses, to the selling stockholder |
$ | $ | ||||
To the extent that the underwriters sell more than 9,375,000 shares of common stock, the underwriters have the option to purchase up to an additional 1,406,000 shares from the selling stockholder at the initial public offering price less the underwriting discount.
The underwriters expect to deliver the shares against payment in New York, New York on , 2013.
| Goldman, Sachs & Co. | Morgan Stanley |
| William Blair | KeyBanc Capital Markets | |||
Prospectus dated , 2013.
Table of Contents
Prospectus
| Page | ||||
| 1 | ||||
| 16 | ||||
| 23 | ||||
| 51 | ||||
| 53 | ||||
| 54 | ||||
| 55 | ||||
| 56 | ||||
| 57 | ||||
| MANAGEMENT’S DISCUSSION AND ANALYSIS OF FINANCIAL CONDITION AND RESULTS OF OPERATIONS |
60 | |||
| 113 | ||||
| 138 | ||||
| 147 | ||||
| 174 | ||||
| 177 | ||||
| 179 | ||||
| 185 | ||||
| 187 | ||||
| MATERIAL UNITED STATES FEDERAL INCOME TAX CONSEQUENCES FOR NON-U.S. HOLDERS |
189 | |||
| 193 | ||||
| 198 | ||||
| 198 | ||||
| 198 | ||||
| F-1 | ||||
Through and including , 2013 (the 25th day after the date of this prospectus), all dealers effecting transactions in these securities, whether or not participating in this offering, may be required to deliver a prospectus. This is in addition to a dealer’s obligation to deliver a prospectus when acting as an underwriter and with respect to an unsold allotment or subscription.
We have not authorized anyone to provide any information or to make any representations other than those contained in this prospectus or in any free writing prospectuses we have prepared. We take no responsibility for, and can provide no assurance as to the reliability of, any other information that others may give you. This prospectus is an offer to sell only the shares offered hereby, but only under circumstances and in jurisdictions where it is lawful to do so. The information contained in this prospectus is current only as of its date.
i
Table of Contents
Unless otherwise specified or the context requires otherwise:
The term “Global Brass and Copper Holdings” refers to Global Brass and Copper Holdings, Inc. and not to any of its subsidiaries;
The term “Global Brass and Copper” refers to Global Brass and Copper, Inc., the principal operating subsidiary of Global Brass and Copper Holdings, and not to any of its subsidiaries or direct or indirect parent companies;
The terms “we,” “us,” “our,” “GBC” and the “Company” refer collectively to Global Brass and Copper Holdings, its subsidiaries and its predecessors;
The term “KPS” refers to KPS Capital Partners, LP; and
The term “Halkos” refers to Halkos Holdings, LLC, the current owner and direct parent of Global Brass and Copper Holdings. Halkos is the selling stockholder in this offering.
The use of these terms is not intended to imply that Halkos, Global Brass and Copper Holdings and Global Brass and Copper or its predecessors are not separate and distinct legal entities.
Amounts and percentages appearing in this prospectus have been rounded to the amounts shown for convenience of presentation. Accordingly, the total of each column of amounts may not be equal to the total of the relevant individual items.
Industry and Market Data
This prospectus includes industry data that we obtained from periodic industry publications and internal company surveys. Industry publications and surveys generally state that the information contained therein has been obtained from sources believed to be reliable. In addition, this prospectus includes market share and industry data that we prepared primarily based on our knowledge of the industry and industry data. We have not independently verified any of the data from third-party sources nor have we ascertained the underlying economic assumptions relied upon therein. Statements as to our market position relative to our competitors are approximated and based on the above-mentioned third-party data and internal analysis and estimates and have not been verified by independent sources. Unless otherwise noted, all information regarding our market share is based on the latest available data. Information herein based on management’s belief or estimate is based upon management’s experience working in, and knowledge of, the metals industry, as well as management’s review of public disclosure of other participants in the metals industry and information provided by industry associations.
Trademarks
This prospectus contains references to our trademarks and service marks and to those belonging to other entities. Solely for convenience, trademarks and trade names referred to in this prospectus may appear without the ® or TM symbols, but such references are not intended to indicate, in any way, that we will not assert, to the fullest extent under applicable law, our rights or the rights of the applicable licensor to these trademarks and trade names. We do not intend our use or display of other companies’ trade names, trademarks or service marks to imply a relationship with, or endorsement or sponsorship of us by, any other companies.
ii
Table of Contents
This summary highlights material information appearing elsewhere in this prospectus. Because this is a summary, it may not contain all of the information that you should consider before investing in the common stock of Global Brass and Copper Holdings, par value $0.01 per share, which we refer to as the “common stock”, and you should carefully read this entire prospectus, including our consolidated financial statements and related notes and the information presented under the caption “Risk Factors”.
Our Company
We are a leading, value-added converter, fabricator, distributor and processor of specialized copper and brass products in North America. We engage in metal melting and casting, rolling, drawing, extruding and stamping to fabricate finished and semi-finished alloy products from processed scrap, copper cathode and other refined metals. Our products include a wide range of sheet, strip, foil, rod, tube and fabricated metal component products that we sell under the Olin Brass, Chase Brass and A.J. Oster brand names. Our products are used in a variety of applications across diversified end markets, including the building and housing, munitions, automotive, transportation, coinage, electronics/electrical components, industrial machinery and equipment and general consumer end markets. We access these end markets through direct mill sales, our captive distribution network and third-party distributors. We believe the diversity of our product portfolio, the breadth of our value-added customer services, our vertical integration and our technical expertise underpin the long-standing relationships we have with our broad customer base. Over the past three years, we have significantly enhanced our profitability and operational flexibility, which we believe positions us to benefit from growth in customer demand across the majority of the key end markets we service as macroeconomic conditions improve. In addition, we expect to capitalize on new market and product growth opportunities, which we are currently pursuing.
We service over 1,700 customers in 28 countries across 5 continents. We employ approximately 1,900 people and operate 11 manufacturing facilities and distribution centers across the United States, Puerto Rico and Mexico to service our North American customers. Through our 80% owned joint venture in China and our 50/50 joint venture in Japan, together with sales offices in China and Singapore, we supply our products in China and throughout Asia, where we believe we are positioned to take advantage of the region’s expanding copper, brass strip and foil market. We service our European customers through distribution arrangements in the United Kingdom and Germany.
Our leading market positions in each of our operating segments allow us to achieve attractive operating margins. Our strong operating margins are a function of four key characteristics of our business: (1) we earn a premium margin over the cost of metal because of our value-added processing capabilities, patent-protected technologies, and first-class service; (2) we have strategically shifted our product portfolio toward value-added, higher margin products; (3) we are driving a lean cost structure through fixed and variable cost reductions, process improvements, and workforce flexibility initiatives; and (4) we employ our “balanced book” approach to substantially reduce the financial impact of metal price volatility on our earnings and operating margins. We have undertaken substantial cost reduction activities since our formation in 2007, which have reduced our fixed costs, improved our net working capital balances, and improved our competitive positioning which has increased operating margins.
Our financial performance is primarily driven by metal conversion economics, not by the underlying movements in the price of copper and the other metal we use. Through our balanced book
1
Table of Contents
approach, we match the timing, quantity and price of our metal sales with the timing, quantity and price of our replacement metal purchases. This practice substantially reduces the financial impact of metal price movements on our earnings and operating margins.
For the year ended December 31, 2012, we shipped 503.2 million pounds of products, and we generated net sales of $1,650.5 million, adjusted sales (as defined in note 4 under “Summary Historical Consolidated Financial Data”) of $524.9 million, net income attributable to Global Brass and Copper Holdings, Inc. of $12.5 million and Consolidated Adjusted EBITDA (as defined in note 5 under “Summary Historical Consolidated Financial Data”) of $115.4 million. Our U.S. operations generated 94% of our total net sales in the year ended December 31, 2012. The following charts show our pounds shipped by our three operating segments and our pounds shipped by key end market for the year ended December 31, 2012.
For the year ended December 31, 2012:
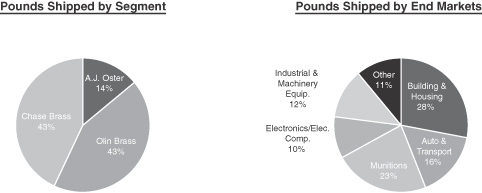
| Note: | For the Chase Brass segment, pounds shipped by end markets in the above chart reflects management’s allocation among end markets of pounds shipped by Chase Brass to distributors, job shops and forging shops. In addition, management estimates that approximately 50% of the Company’s pounds shipped to the electronics/electrical components end market are directly associated with the building sector. |
2
Table of Contents
Segments Overview
We have three operating segments: Olin Brass, Chase Brass and A.J. Oster.

|

|

| ||||
| Description |
• Leading manufacturer, fabricator and converter of specialized copper and brass sheet, strip, foil, tube and fabricated products |
• Leading manufacturer and supplier of brass rod |
• Leading distributor and processor of copper and brass products | |||
| • #1 North American Position (by 2012 pounds shipped) |
• #1 or #2 North American Position (by 2012 pounds shipped) |
• #1 North American Position (by 2012 pounds shipped) | ||||
| Key Products / Services |
• Produces 55 copper-based alloys, including 15 high performance alloys (“HPAs”), which provide superior strength, conductivity and formability |
• Produces nine brass alloys which provide superior strength and corrosion resistance, sold under the Blue Dot® brass rod brand name |
• Network of strategically located distribution centers, providing inventory management, distribution and value-added metal processing services to customers | |||
| • Over the past 3 years, approximately 14-18% of Olin Brass’s copper-based products have been sold to A.J. Oster |
• Holds exclusive rights for the production and sale of lead-free brass rod in North America, sold under the Green Dot™ rod and Eco Brass® alloy brand names |
• Over the past 3 years, approximately 70% to 80% of A.J. Oster’s copper-based products have been sourced from Olin Brass | ||||
| • Products sold throughout the U.S., Puerto Rico, Mexico, Asia and Europe |
• Products sold throughout the U.S., Mexico and Canada |
• Products sold throughout the U.S., Puerto Rico and Mexico | ||||
| Key End Markets |
• Munitions, Automotive, Coinage, Building and Housing, Electronics/Electrical Components |
• Building and Housing, Transportation, Electronics/Electrical Components, Industrial Machinery and Equipment and Distribution |
• Building and Housing, Automotive, Electronics/Electrical Components | |||
| Operations |
• 4 strategically located sites in the U.S. and 1 in China |
• 1 strategically located manufacturing site and 1 warehouse facility in the U.S. |
• 4 strategically located sites in the U.S., 1 in Puerto Rico and 1 in Mexico | |||
| • Marketing and sales joint venture office in Japan
• Sales office in Singapore
• 1,382 employees; 1,344 in the U.S. and 38 in Asia each as of December 31, 2012 |
• 316 employees as of December 31, 2012 |
• 268 employees as of December 31, 2012 | ||||
3
Table of Contents
Our Competitive Strengths
Market Leader in Key Industrial Segments. We believe we have leading market positions in the industry sectors served by each of our three operating segments. Management estimates that our strategically located plants represent approximately 40% of North American capacity for copper and copper-alloy sheet, strip and plate (“SSP”) and brass rod production, supplying over 1,700 customers with over 15,000 stock keeping units (“SKUs”), with approximately 10%, 24% and 66% of those SKUs being sold by Chase Brass, Olin Brass and A.J. Oster, respectively. We believe our customers value our ability to provide a diverse range of products, many of which are exclusively offered by us. For example, at Olin Brass, we produce 55 alloys (including 15 HPAs), which, management estimates, based on available market information, is nearly twice as many types of alloys as produced by our closest competitor. Our ability to provide high quality product in varying quantities at attractive prices and in a timely manner to meet the product needs of our customers has resulted in long-standing customer relationships, many of whom we have served for more than 30 years. Our leading market positions and scale also enable us to negotiate favorable arrangements with our suppliers. During 2012, we operated at approximately 57-65% capacity utilization across our portfolio of facilities. As a result, we believe it would require a significant investment to become a substantial new participant in the industry, and any such investment might not yield attractive returns for a significant period of time.
Exposure to Cyclical, End Market and New Product Growth. In 2012, approximately 49% of our pounds shipped served end markets principally influenced by new residential construction, repair and remodeling activity and light vehicle sales in the United States. Our operations are well-positioned to take advantage of the recovery that we believe is underway in the U.S. housing market. According to management estimates, U.S. housing starts are expected to grow from 740,000 in 2012 at a compound annual growth rate (“CAGR”) of 13.1% through 2015. According to management estimates, U.S. existing home sales are expected to grow from 4.1 million in 2012 at a CAGR of 6.1% through 2015. We also believe there is considerable growth potential in the U.S. automotive sector. According to management estimates, North American light vehicle production is forecast to grow from 14.9 million in 2012 at a CAGR of 4.5% through 2015. Additionally, we believe further growth will be driven by demand for our new products. We hold exclusive production and sales rights for “lead-free” Eco Brass® rod and control the licensing of Eco Brass® ingot in North America. This “lead-free” alloy can be used to make products that comply with recently enacted Federal legislation that will require a reduction of lead content in all drinking water and plumbing devices in January 2014. In addition, we believe that the Company is well positioned to become an industry leader in anti-microbial copper products through its CuVerro product line. In 2011, Olin Brass completed the Federal and state registration processes necessary to market its CuVerro™ materials as having anti-microbial properties and has licensed more than a dozen exclusive component manufacturers to market CuVerro™ products to the healthcare industry. We believe there is significant opportunity for us to expand our customer base to include companies that develop copper products for use in the healthcare, food service and other industries, replacing stainless steel and aluminum. We also anticipate a significant increase in the size of the coinage market if the U.S. transitions to the $1 coin and eliminates the dollar bill. As a certified supplier to the United States Mint, we expect to capture a material portion of this new demand. Finally, we currently believe that demand levels for rod and strip products in the U.S. are significantly below historical averages and that with the expected continued recovery in our key end-markets, we will observe significant increases in demand for our products. Given our current installed operating capacity and associated utilization rates, we believe we can meet this increase in demand with very low capital investment.
4
Table of Contents
Significant Expected Profit Growth through Volume Increases. Since our formation in 2007, we have implemented various cost reduction initiatives and workforce flexibility programs focused on reducing our fixed and non-metal variable costs. We believe the largely automated nature of our operations at our Chase Brass facility and the absence of defined benefit pension obligations or retiree healthcare obligations have contributed to a lean, flexible cost structure, which should position us to achieve strong operating margins going forward. Specifically:
| • | During 2012, we operated at approximately 57-65% capacity utilization across our portfolio of facilities. As such, we have available operating capacity that we can bring online quickly to respond to increased demand for our products and value-added services; |
| • | We believe we can increase production at our facilities with minimal change in our fixed costs and without significant additional capital investment; and |
| • | We believe we have the financial capacity and balance sheet strength to meet the working capital requirements that would accompany production increases in response to growing customer demand. |
Since our formation in 2007, we have consistently improved our Consolidated Adjusted EBITDA per pound, a metric that management monitors to assess our profitability and operating efficiency, from $0.10 per pound for the year ended December 31, 2008 to $0.23 per pound for the year ended December 31, 2012.
Margin and Cash Flow Profile Insulated from Metal Price Volatility. Approximately 70%-75% of our cost structure consists of variable metal costs, for which we use our balanced book approach to substantially reduce the financial impact of metal price volatility on our earnings and operating margins. Our business model is principally based on the conversion and fabrication of the metal we purchase into finished and semi-finished alloy products. Our financial performance is driven by metal conversion economics (i.e., the prices we charge for our products and value-added services and our ability to control our operating costs); we do not seek to profit from movements in underlying metal prices. Through our balanced book approach, we match the timing, quantity and price of our metal sales with the timing, quantity and price of our replacement metal purchases. Our balanced book approach allows us to substantially reduce the financial impact of metal price volatility on our earnings and operating margins. Our balanced book approach and low fixed cost position has allowed us to generate substantial cash flows. For the three months ended March 31, 2013, net cash used in operating activities was $5.1 million, and in the three months ended March 31, 2012, we generated net cash provided by operating activities of $31.8 million. For the fiscal years ended December 31, 2012, 2011 and 2010, we generated net cash provided by operating activities of $81.9 million, $64.8 million and $69.4 million, respectively. In addition, we have low capital expenditure requirements. We estimate annual capital expenditures from 2013 to 2017 to range between $25 million to $30 million per annum, of which $20 million to $24 million per annum will consist of capital improvements or replacement of existing capital items. Our total capital expenditures as a percentage of our adjusted sales have ranged from approximately 2% to 4% for the last three fiscal years.
Net income attributable to Global Brass and Copper Holdings, Inc. per pound was $0.09 and $0.11 for the three months ended March 31, 2013, and 2012, respectively. Net income (loss) attributable to Global Brass and Copper Holdings, Inc. per pound was $0.02, $0.11, $0.08, $0.02 and $(0.11) for the years ended December 31, 2012, 2011, 2010, 2009 and 2008, respectively. Net income attributable to Global Brass and Copper Holdings, Inc. per pound was $1.02 for the successor period from October 10, 2007 to December 31, 2007, and net income per pound of our predecessor was $0.07 for the predecessor period from January 1, 2007 to November 18, 2007.
5
Table of Contents
As illustrated in the following chart, we have increased our historical Consolidated Adjusted EBITDA(1) per pound over the period from 2007 to the first quarter 2013, despite relatively volatile underlying copper prices:
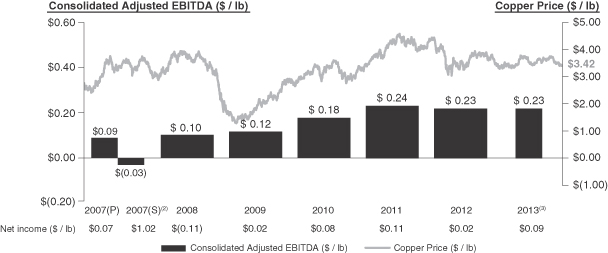
Source: Copper prices from the London Metal Exchange reported by Bloomberg
(1) See note 5 to “Summary Historical Consolidated Financial Data” for the calculation of Consolidated Adjusted EBITDA and a reconciliation to net income (loss) attributable to Global Brass and Copper Holdings, Inc., which is the most directly comparable U.S. GAAP financial measure to Consolidated Adjusted EBITDA.
(2) We acquired the worldwide metals business of Olin Corporation on November 19, 2007. As a result, the 2007 fiscal year is composed of a predecessor period from January 1, 2007 to November 18, 2007 (represented by “2007(P)” in the chart above), and a successor period from the date of our formation, October 10, 2007, to December 31, 2007 (represented by “2007(S)” in the chart above). We had no material operations or assets prior to November 19, 2007. Data for the period from January 1, 2007 to November 18, 2007 are based on books and records provided to us by Olin Corporation in connection with the acquisition, we believe were prepared on a basis consistent with Olin Corporation’s accounting policies and procedures and have not been subject to an audit or review. Data for the predecessor period of 2007 are not prepared using our accounting policies and procedures, do not reflect the application of purchase accounting (which has been applied to the successor period financial statements) and also do not reflect the allocation of Olin Corporation selling, general and administrative expenses to the metals business unit. We believe that the unaudited financial information for the predecessor period of 2007 may be useful to investors for purposes of illustrating trends in our business. Although we have no reason to believe that the unaudited financial information for the predecessor period of 2007 is materially deficient, there is a risk that this unaudited financial information may contain errors that might have been detected in a review or audit process or might have been different if prepared in accordance with our policies and procedures instead of those of Olin Corporation. See note 5 to “Summary Historical Consolidated Financial Data” and note (a) to the reconciliation table contained in such note and “Risk Factors—Risks Related to Our Business—You should not place undue reliance on the selected financial and other information of our predecessor as of November 18, 2007 and for the period from January 1, 2007 to November 18, 2007, which are summarized in this prospectus”.
(3) For the three months ended March 31, 2013.
Over the past three years, we have demonstrated the ability to generate significant operating cash flow despite the relatively difficult operating environment. Our strong cash flow generation has enabled us to significantly reduce our leverage from approximately 7.9x gross debt to Consolidated Adjusted EBITDA upon formation in 2007 to 3.4x as of December 31, 2012. Our debt reduction achievements have also been delivered while distributing dividends to our shareholders. We believe we will continue to generate significant operating cash flow, which will provide us the opportunity to deploy future excess cash flow to fund dividends or value-enhancing acquisitions. We will continue to manage our capital with financial discipline with the objective of maximizing value for our shareholders.
Highly Experienced Management Team. Since our formation in 2007, we have assembled a highly experienced management team, which combines our predecessor’s legacy experience with new team members who have many years of relevant industry experience. The members of our senior
6
Table of Contents
management team have, on average, over 26 years of metals industry experience. Since our formation, our senior management team has implemented a new business strategy and successfully transformed the cost structure and operating strategy of the business. Our management team has also instilled a culture that promotes performance excellence with a strong focus on driving profitability and, as a direct result, our operational and financial performance has improved significantly since 2007.
Our Growth Strategy
Participate in Demand Recovery as Economic Conditions Strengthen. Our premium products and services have allowed us to achieve leading positions across a number of attractive end markets. In addition, we maintain strong relationships with a diverse set of customers across those end markets. As U.S. macroeconomic conditions continue to improve, we expect to see increased activity in many of our key end markets, especially building and housing, automotive, coinage and industrial machinery and equipment, which we expect will drive increased demand for our products and services. In the beginning of 2013, the U.S. housing market has experienced a recovery from the sharp downturn that began in 2007. We believe that our available production capacity will allow us to effectively and efficiently respond to increasing demand.
Capitalize on Growth Opportunities for Our Existing Products and Services. We believe there are opportunities to expand the supply of our existing products and services in several key high-value end markets. Examples include:
| • | Lead-free and Low-lead Plumbing Products. New regulations designed to reduce lead content in drinking water plumbing devices provide a key opportunity for future growth. Chase Brass is a premier provider of specialized lead-free products and low-lead alloys. Recently enacted Federal legislation in the United States (the Reduction of Lead in Drinking Water Act, which was patterned after legislation enacted in California and Vermont) will require the reduction of lead content in all drinking water plumbing devices beginning in January 2014. This legislation presents a significant growth opportunity for Chase Brass. Our Eco Brass® products meet Federal, California and Vermont standards and can be used to produce cast, machined and forged faucet parts. We currently supply major faucet, valve and fitting manufacturers who produce multiple products using machined Eco Brass® parts. |
| • | Transition to the Dollar Coin. On September 20, 2011, the Currency Optimization Innovation and National Savings Act, or “COINS Act”, was introduced in the U.S. House of Representatives, which is intended to modernize the U.S. currency system by replacing $1 notes with $1 coins and result in average savings of $184 million per year (based on 2011 Government Accountability Office estimates). On January 31, 2012, the COINS Act was also introduced in the U.S. Senate. Despite a recently announced substantial reduction in $1 coin production over the next couple of years, we anticipate a significant increase in the size of the coinage market if the U.S. transitions to the $1 coin and eliminates the dollar bill. As a certified supplier to the United States Mint, we expect to capture a material portion of this new demand. |
Pursue New Growth Opportunities. We have identified a number of important trends in key growth markets which we believe will drive significant incremental growth for our company, including:
| Ÿ | Anti-microbial Applications. Olin Brass is well positioned to become a leader in commercializing anti-microbial copper products through its CuVerro™ anti-microbial product line. The U.S. Environmental Protection Agency (“EPA”) recently recognized that copper is inherently capable of neutralizing potentially harmful viruses and bacteria and began accepting registrations of copper-alloys with anti-microbial properties. Olin Brass manufactures several such alloys, which were |
7
Table of Contents
| EPA-registered in 2011, and we believe there is significant opportunity for us to expand our customer base to include companies that develop copper products for use in the healthcare, food service, heating, ventilation and air conditioning industries, replacing stainless steel and aluminum. Olin Brass has completed the Federal and state registration processes necessary to market its CuVerro™ materials as having anti-microbial properties. |
| • | Renewable Energy Applications: Renewable energy is a fast growing and attractive sector, with significant long-term growth potential. Copper, copper-alloy and brass products are used in renewable energy technologies, including lithium batteries and solar power applications such as photovoltaic cells. We believe increasing demand for renewable energy applications will be a key opportunity for further growth. |
In addition, we plan to continue to identify opportunities to extend our existing range of products and services through ongoing investment in technology research and development through our Materials Research Laboratory. The Materials Research Laboratory is a world-renowned copper-alloy research, manufacturing and production innovation lab and is responsible for numerous patents held by our Company and also by our customers. The Materials Research Laboratory was instrumental in developing patented products such as CopperBond®, CopperBond® XTF, and other unique foil products such as C7025 for computer disk drives.
Pursue Strategic Opportunities to Expand Our Business. The North American copper and brass distribution industry includes numerous small, regional players. We believe future industry consolidation and possible strategic acquisitions in key growth markets, notably Asia, will provide opportunities to increase our presence in these markets and to create shareholder value. In addition, we may pursue, strategic acquisition and/or partnership opportunities to increase the breadth and distribution of our product portfolio and metal distribution services in the future.
8
Table of Contents
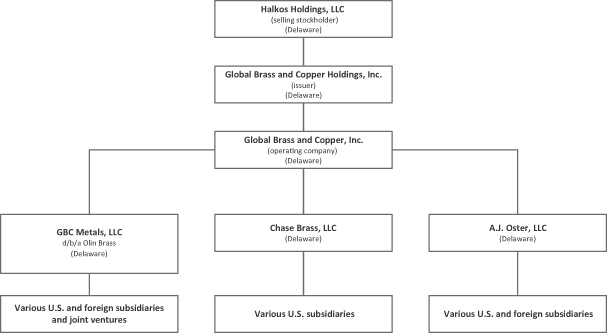
Organizational Structure
The chart below is a summary of our organizational structure as of March 31, 2013. All entities depicted are currently (and will be following this offering) 100% owned subsidiaries, except for Global Brass and Copper Holdings which is currently a wholly-owned subsidiary of Halkos. Halkos is selling all of the Global Brass and Copper Holdings shares that will be sold in this offering.
Industry Overview
North American Copper and Copper-alloy SSP and Rod. Improvements in the financial and economic markets since 2008 and 2009 have encouraged a rebound in demand for copper and copper-alloy SSP and rod, primarily driven by greater activity in the building and housing and automotive end markets. During the softening housing market in 2007 and the ensuing economic downturn in 2008 and 2009, demand for SSP and rod products deteriorated significantly. However, prior to the economic downturn, demand for SSP and rod products in North America had been relatively stable over the period from 2001 to 2007.
While the recovery from the recent economic downturn has been uneven and at times slower than desired, as economic conditions improve and activity in key end markets strengthens, we anticipate that demand for copper and copper-alloy SSP and rod products will increase. We also expect to see a greater shift in demand toward low-lead and lead-free copper and brass products driven by new government regulation, such as the Reduction of Lead in Drinking Water Act. This regulatory shift represents a significant growth opportunity for North American manufacturers of lead-free materials, many of whom, including us, are already experiencing increased demand for high quality, lead-free and low-lead products. In addition, we believe that there are a number of growth opportunities that could create significant incremental demand for copper and copper-alloy SSP products, including coinage, anti-microbial fixtures, and renewable energy applications (such as lithium batteries and solar applications).
9
Table of Contents
Distribution Centers. Metal distribution centers and processors play a critical supply-chain role between metal production mills and end-users, especially between mills that manufacture large volumes and end-users who require smaller volumes, inventory management and processing services. The North American copper and brass distribution industry includes several large players, including us, and many smaller participants. We believe a large distribution business with a low fixed-cost structure will generally benefit from economies of scale, a more robust distribution network, a more diversified product portfolio and the ability to provide higher-quality, value-added services relative to smaller competitors. In addition, a distribution center with greater scale can typically operate on shorter lead times and provide on-time delivery and smaller quantities of a wide variety of products. Over the longer term, we believe the role of the metal distribution industry will become increasingly important as both primary metal producers and end-users look to outsource their metal processing and inventory management needs to value-added metal distribution centers. We anticipate smaller competitors will consolidate over time in order to remain competitive.
Global Supply of SSP and Alloy Rod Products. North American SSP and alloy rod consumers have historically developed long-term supply relationships with domestic SSP and alloy rod manufacturers and suppliers that offer a broad range of high quality products, that are able to respond quickly to product orders, and that provide on-time, frequent delivery in small batch sizes. Accordingly, our management believes North American consumer demand has largely been satisfied by North American SSP and alloy rod producers. Offshore supply of SSP and alloy rod products has historically contributed a small proportion of total North American supply.
Competition. We compete with other companies on price, service, quality and product breadth and availability of products both domestically and internationally. We believe we have been able to compete effectively because of our high levels of service, breadth of product offering, knowledgeable and trained sales force, modern equipment, strategically located facilities, geographic dispersion, operational economies of scale and sales volume.
The North American market for brass and copper strip and sheet and brass rod consists of a few large participants and a few smaller competitors for Olin Brass and Chase Brass and a number of smaller competitors for A.J. Oster.
Based on available market data, we believe the largest competitors to each of our operating segments in the markets in which we operate are the following:
| • | Olin Brass: Aurubis and PMX Industries, Inc. (manufacturing of copper and copper-alloys in the form of strip, sheet and plate). |
| • | Chase Brass: Mueller Industries, Inc. (manufacturing of brass rod). |
| • | A.J. Oster: ThyssenKrupp Materials NA, Copper and Brass Sales Division (distribution and processing of copper, brass, stainless and aluminum products); and Wieland Metals, Inc. (re-roll mill and service center for copper and copper-alloy strip). |
Based on the data published by Copper Development Association Inc., Copper and Brass Servicenter Association, Inc. (both independent industry associations) and management estimates, as of December 31, 2012, the Olin Brass segment accounted for 35.2% of North American shipments (including shipments to A.J. Oster) of copper and brass alloys in the form of sheet, strip and plate; the Chase Brass segment accounted for 47.7% of North American domestic shipments of brass rod; and the A.J. Oster segment accounted for 33.3% of North American shipments of copper and brass, sheet and strip products from distribution centers and rerolling facilities.
10
Table of Contents
Recent Transactions
Issuance of the Senior Secured Notes and the Refinancing of the Term Loan Facility
On June 1, 2012, we completed a refinancing, which included the issuance of $375.0 million in aggregate principal amount of 9.50% Senior Secured Notes due 2019 (the “Senior Secured Notes”) by Global Brass and Copper, Inc. The Senior Secured Notes are guaranteed by Global Brass and Copper Holdings, Inc. and substantially all of Global Brass and Copper’s existing and future wholly-owned U.S. subsidiaries. The Senior Secured Notes are secured by a senior-priority security interest in our fixed assets and by a junior-priority security interest in our accounts receivable and inventory.
We used a portion of the proceeds from the Senior Secured Notes to repay in full the $266.5 million of principal outstanding under our prior $315.0 million five-year senior term loan facility (the “Term Loan Facility”), which we refer to as the “Term Loan Refinancing.” In the Term Loan Refinancing, we paid our lenders a total of $275.5 million, including the $266.5 million of principal, an early repayment premium of $8.0 million and accrued and unpaid interest of $1.0 million, and we recognized a $19.6 million loss on extinguishment of debt.
Amendment of the ABL Facility
Concurrently with the issuance of the Senior Secured Notes and the Term Loan Refinancing on June 1, 2012, we amended the agreement governing our $150.0 million asset-based revolving loan facility (the “2010 ABL Facility”, and, as currently amended, the “ABL Facility”) to:
| • | increase the commitments under the facility to $200.0 million; |
| • | extend the maturity of the ABL Facility to June 1, 2017; |
| • | permit the Transactions (as defined below); |
| • | lower the applicable margin and unused line fee under the ABL Facility; |
| • | permit us to make additional acquisitions, investments, restricted payments, asset sales and debt incurrences if certain conditions are satisfied; |
| • | increase the inventory loan limit for the borrowing base; |
| • | adjust certain reporting requirements and collateral audit requirements to make them less restrictive; and |
| • | reduce the excess availability threshold which requires us to test our fixed charge coverage ratio covenant. |
We refer to these amendments collectively as the “ABL Amendment”.
Distribution to Halkos
In connection with the offering of the Senior Secured Notes, the Term Loan Refinancing and the ABL Amendment, we used a portion of the net proceeds of the issuance of the Senior Secured Notes, together with cash on hand, to make a cash distribution of $160.0 million to Halkos, which we refer to as the “Parent Distribution”. Halkos distributed the proceeds of the Parent Distribution pro rata to its equityholders (which include certain of our officers and directors) in accordance with the terms of its operating agreement.
We refer to the Term Loan Refinancing, the ABL Amendment and the Parent Distribution collectively as the “Transactions”.
11
Table of Contents
Risk Factors
An investment in shares of our common stock involves risks. Below is a summary of certain key risk factors that you should consider in evaluating an investment in shares of our common stock. This list is not exhaustive. Please read the full discussion of these risks and other risks described under the caption “Risk Factors” beginning on page 23 of this prospectus.
| • | downturns or cyclical economic conditions affecting the markets in which our products are sold, including the housing and commercial construction markets; |
| • | our ability to continue implementing our balanced book approach to substantially reduce the impact of fluctuations in metal prices on our earnings and operating margins; |
| • | shrinkage from processing operations and metal price fluctuations, particularly copper; |
| • | limitations on our ability to access raw materials, particularly copper; |
| • | fluctuations in commodity and energy prices and costs; |
| • | our ability to maintain sufficient liquidity as commodity and energy prices rise; |
| • | our ability to continue our operations internationally and the risks applicable to international operations; |
| • | our ability to continue to comply with the covenants in our debt agreements and service our indebtedness; |
| • | government regulations relating to our products and services, including new legislation relating to derivatives and the elimination of the dollar bill; and |
| • | our ability to remediate any material weaknesses in our internal control over financial reporting as we become subject to public company requirements. |
Global Brass and Copper Holdings
Global Brass and Copper Holdings was incorporated in Delaware on October 10, 2007. Global Brass and Copper Holdings acquired the worldwide metals business of Olin Corporation on November 19, 2007. The principal executive offices of Global Brass and Copper Holdings are located at 475 N. Martingale Road, Suite 1050, Schaumburg, IL 60173, and the telephone number is (847) 240-4700.
We also maintain an internet site at http://www.gbcholdings.com. Our website and the information contained in that website or connected to that website will not be deemed to be incorporated into this prospectus or the registration statement of which this prospectus forms a part, and you should not consider it part of this prospectus or rely on any such information in making your decision whether to purchase our common stock.
KPS Capital Partners, LP and Halkos Holdings, LLC
KPS Capital Partners, LP is a leading middle market private equity firm with $6.0 billion of assets under management. KPS seeks to realize significant capital appreciation through controlling equity investments in manufacturing and industrial companies going through a period of transition. The KPS investment strategy is based upon partnering with top management teams to materially and permanently improve the operations of a company, and then growing the company, either organically or through strategic acquisitions. The KPS investment strategy and its portfolio companies are
12
Table of Contents
described in detail at the KPS website: www.kpsfund.com. The KPS website and the information contained in that website or connected to that website will not be deemed to be incorporated into this prospectus or the registration statement of which this prospectus forms a part, and you should not consider it part of this prospectus or rely on any such information in making your decision whether to purchase our common stock.
KPS Special Situations Fund II, L.P., KPS Special Situations Fund II (A), L.P., KPS Special Situations Fund III, L.P. and KPS Special Situations Fund III (A), L.P. (collectively, the “KPS Funds”) are affiliates of KPS and are the majority members of Halkos Holdings, LLC. Halkos owns all of the outstanding shares of Global Brass and Copper Holdings prior to this offering and is the selling stockholder.
13
Table of Contents
The Offering
| Common stock offered |
9,375,000 shares, all of which are being offered by the selling stockholder. | |
| Underwriters’ option to purchase additional common stock from the selling stockholder |
Up to 1,406,000 shares. | |
| Shares of our common stock to be outstanding immediately following this offering |
21,110,000 shares. | |
| Use of proceeds |
All of the shares being offered in this offering are being offered by the selling stockholder. We will not receive any proceeds in this offering. | |
| Dividends |
Following this offering, we intend to pay quarterly cash dividends. Any dividends or changes to our dividend policy will be made at the discretion of the Board of Directors and will depend on many factors, including those enumerated in the section entitled “Dividend Policy”. | |
| Principal Stockholders |
Upon consummation of this offering, Halkos will own approximately 55.6% of the voting stock of Global Brass and Copper Holdings (48.9% if the underwriters exercise in full their option to purchase additional shares). If Halkos beneficially owns more than 50% of such voting stock after the completion of this offering, we will avail ourselves of the “controlled company” exemptions under the rules of the New York Stock Exchange. Otherwise, we expect to comply with such NYSE rules, subject to the prescribed phase-in provisions. | |
| Lock-up Agreements |
The selling stockholder and the officers and directors of Global Brass and Copper Holdings will be subject to customary lockup agreements with a duration of 180 days. See “Underwriting”. | |
| Listing |
We have been approved to list our common stock on the New York Stock Exchange under the trading symbol “BRSS”. | |
Other Information About This Prospectus
Except as otherwise indicated, all information in this prospectus (including the information set forth under “—The Offering” above):
| • | assumes no exercise of the underwriters’ option to purchase additional shares; |
| • | reflects a 211,100 to-1 stock split, which we refer to as the “stock split,” which will become effective after the effective date of this registration statement and prior to the completion of this offering; |
| • | does not give effect to 1,111,053 shares of common stock reserved for future issuance under our Global Brass and Copper Holdings, Inc. 2013 Omnibus Equity Incentive Plan, which we refer to as the “2013 Plan”; and |
| • | does not give effect to 338,979 shares of our common stock issuable under equity awards granted in connection with this offering under the 2013 Plan. |
14
Table of Contents
In connection with this offering, 104,444 non-qualified stock options, 74,219 shares of restricted stock and 98,441 performance shares will be granted to certain members of management and our board. Of these grants, an aggregate of 69,629 non-qualified stock options, 32,812 shares of restricted stock and 65,627 performance shares will be granted to our named executive officers and an aggregate of 34,815 non-qualified stock options, 16,407 shares of restricted stock and 32,814 performance shares will be granted to other members of our management. An aggregate of 25,000 shares of restricted stock will be granted to four of our directors. In addition, an aggregate of 61,875 shares of restricted stock will be granted to certain other executive officers and other employees. None of the equity awards to be granted in connection with this offering will be vested or exercisable within 60 days after the date of the completion of this offering. Unless otherwise noted specifically, all percentage ownership statistics in this prospectus and as-adjusted or pro forma share outstanding amounts do not give effect to such awards.
The 104,444 non-qualified stock options vest over a three-year period on the first through third anniversaries of the closing date of this offering. The total estimated fair value is $0.8 million, and we estimate that the amount amortized to selling, general and administrative (“SG&A”) expense during any one year will be $0.3 million. Fair value is estimated using the Black-Scholes option pricing model. We used the following inputs for the option pricing model:
| • | The grant price and market value for these non-qualified stock options was assumed to be $16.00, the mid-point of the range set forth on the cover page of this prospectus. |
| • | Volatility and expected term assumptions were estimated using an average of 10 publicly traded peers (AK Steel, Allegheny Technologies, Carpenter Technology, Commercial Metals, Encore Wire, Kaiser Aluminum, Materion, Mueller Industries, Reliance Steel & Aluminum and Worthington Industries). We assumed the volatility to be 55% and the expected term to be six years. |
| • | We selected a U.S. Treasury bond rate of 0.93% consistent with the expected term assumption. |
| • | A dividend rate of $0.0375 per quarter was assumed. |
Of the 136,094 total shares of restricted stock, 49,219 shares of restricted stock issued to management will vest over three years after the closing date of this offering, 61,875 shares issued to certain executive officers and other employees will vest on the first anniversary of the closing date of this offering and 25,000 shares issued to four of our directors will vest 218 days after the closing date of this offering. The fair value was determined by multiplying the midpoint of the price range for this offering set forth on the cover page of this prospectus, $16.00, by the 136,094 shares of restricted stock issued, resulting in an estimated aggregate fair value of $2.2 million. The annual amount estimated to be amortized to SG&A expense in respect of the three-year vesting shares of restricted stock will be $0.3 million per year. The entire $1.0 million value of the one-year vesting shares to employees will be amortized to SG&A expense during the year after the closing date of this offering. The estimated $0.4 million value of the shares issued to the four directors will be amortized during the 218-day vesting period.
The 98,441 performance shares will vest over three years based on our achievement of return on net assets targets by the end of the 2013 fiscal year, as described in more detail under “Compensation Discussion and Analysis—IPO Equity Grants.” For purposes of calculating the amount of SG&A expense, we have assumed a 100% vesting amount based on the performance criterion, yielding an aggregate estimated fair value for the performance shares (based on the $16.00 midpoint of the price range) of $1.6 million. We estimate the amount amortized to SG&A during the first, second and third years will be $1.0 million, $0.4 million and $0.2 million, respectively.
15
Table of Contents
SUMMARY HISTORICAL CONSOLIDATED FINANCIAL DATA
Set forth below is summary historical consolidated financial data of our business, as of the dates and for the periods indicated. The summary historical consolidated financial data as of March 31, 2013 and for the three months ended March 31, 2013 and 2012 have been derived from our unaudited consolidated financial statements included elsewhere in this prospectus. The unaudited consolidated financial statements have been prepared on the same basis as our audited consolidated financial statements, and in the opinion of our management, reflect all adjustments, including normal recurring adjustments, necessary for a fair presentation of the results for those periods. The results for any interim period are not necessarily indicative of the results that may be expected for a full year. The summary historical consolidated financial data as of December 31, 2012 and 2011 and for the years ended December 31, 2012, 2011 and 2010 have been derived from our audited consolidated financial statements included elsewhere in this prospectus. The summary historical consolidated financial data as of December 31, 2010 has been derived from our audited consolidated financial statements not included in this prospectus.
The number of common shares used in the calculation of historical net income attributable to Global Brass and Copper Holdings, Inc. per common share in the summary historical consolidated financial data below does not give effect to the planned 211,100-to-1 stock split to be effected after the effective date of this registration statement and prior to the completion of this offering. The number of common shares used in the calculation of pro forma net income attributable to Global Brass and Copper Holdings, Inc. per common share does give effect to the planned 211,100-to-1 stock split to be effected after the effective date of this registration statement and prior to the completion of this offering, but does not give effect to the 338,979 shares issuable under the equity awards to be granted in connection with this offering, since as of the date of this offering none of those awards will be vested or exercisable within 60 days after the date of the completion of this offering.
The summary historical consolidated financial data should be read in conjunction with the information about the limitations on comparability of our financial results, including as a result of acquisitions. See “Selected Historical Consolidated Financial Data”, “Management’s Discussion and Analysis of Financial Condition and Results of Operations”, “Risk Factors” and the consolidated financial statements and related notes included elsewhere in this prospectus.
16
Table of Contents
| Three Months Ended March 31, | Year Ended December 31, | |||||||||||||||||||
| 2013 | 2012(7) | 2012 | 2011(7) | 2010(7) | ||||||||||||||||
|
(in millions, except share, per share and per pound data) |
||||||||||||||||||||
| Statements of Operations Data: |
||||||||||||||||||||
| Net sales |
$ | 445.0 | $ | 443.4 | $ | 1,650.5 | $ | 1,779.1 | $ | 1,658.7 | ||||||||||
| Cost of sales |
398.1 | 393.4 | 1,467.3 | 1,583.5 | 1,496.7 | |||||||||||||||
|
|
|
|
|
|
|
|
|
|
|
|||||||||||
| Gross profit |
46.9 | 50.0 | 183.2 | 195.6 | 162.0 | |||||||||||||||
| Selling, general and administrative expenses |
19.7 | 17.9 | 92.7 | 69.4 | 68.9 | |||||||||||||||
|
|
|
|
|
|
|
|
|
|
|
|||||||||||
| Operating income |
27.2 | 32.1 | 90.5 | 126.2 | 93.1 | |||||||||||||||
| Third party interest expense(1) |
9.9 | 9.8 | 39.7 | 40.0 | 22.6 | |||||||||||||||
| Related party interest expense(2) |
— | — | — | — | 2.5 | |||||||||||||||
| Loss on extinguishment of debt |
— | — | 19.6 | — | — | |||||||||||||||
| Other expense, net |
0.2 | 0.3 | 0.1 | 0.4 | 0.8 | |||||||||||||||
|
|
|
|
|
|
|
|
|
|
|
|||||||||||
| Income before provision for income taxes and equity income |
17.1 | 22.0 | 31.1 | 85.8 | 67.2 | |||||||||||||||
| Provision for income taxes |
6.0 | 8.2 | 19.2 | 31.4 | 26.6 | |||||||||||||||
|
|
|
|
|
|
|
|
|
|
|
|||||||||||
| Income before equity income |
11.1 | 13.8 | 11.9 | 54.4 | 40.6 | |||||||||||||||
| Equity income, net of tax |
0.4 | 0.3 | 1.0 | 0.9 | 1.5 | |||||||||||||||
|
|
|
|
|
|
|
|
|
|
|
|||||||||||
| Net income |
11.5 | 14.1 | 12.9 | 55.3 | 42.1 | |||||||||||||||
| Less: Net income attributable to noncontrolling interest |
0.1 | 0.1 | 0.4 | 0.2 | 0.5 | |||||||||||||||
|
|
|
|
|
|
|
|
|
|
|
|||||||||||
| Net income attributable to Global Brass and Copper Holdings, Inc.(1) |
$ | 11.4 | $ | 14.0 | $ | 12.5 | $ | 55.1 | $ | 41.6 | ||||||||||
|
|
|
|
|
|
|
|
|
|
|
|||||||||||
| Historical Per Share Data (Pre-Stock Split): |
||||||||||||||||||||
| Historical net income attributable to Global Brass and Copper Holdings, Inc. per common share(3) |
$ | 113,880 | $ | 139,930 | $ | 125,210 | $ | 551,320 | $ | 416,330 | ||||||||||
| Number of common shares used in historical calculation |
100 | 100 | 100 | 100 | 100 | |||||||||||||||
| Pro Forma Per Share Data (Post-Stock Split): |
||||||||||||||||||||
| Pro forma net income attributable to Global Brass and Copper Holdings, Inc. per common share(1)(3) |
$ | 0.54 | $ | 0.55 | $ | 0.40 | $ | 2.61 | $ | 1.97 | ||||||||||
| Number of common shares used in pro forma calculation |
21,110,000 | 21,110,000 | 21,110,000 | 21,110,000 | 21,110,000 | |||||||||||||||
17
Table of Contents
| Three Months Ended March 31, |
Year Ended December 31, | |||||||||||||||||||
| 2013 | 2012(7) | 2012 | 2011(7) | 2010(7) | ||||||||||||||||
|
(in millions, except share, per share and per pound data) |
||||||||||||||||||||
| Cash flow data: |
||||||||||||||||||||
| Cash flows (used in) provided by operating activities |
$ | (5.1 | ) | $ |
31.8 |
|
$ | 81.9 | $ | 64.8 | $ | 69.4 | ||||||||
| Cash flows used in investing activities |
(2.9 | ) | (3.7 | ) | (20.4 | ) | (22.3 | ) | (11.9 | ) | ||||||||||
| Cash flows provided by (used in) financing activities |
|
10.2 |
|
|
(1.1 |
) |
(96.8 | ) | (8.3 | ) | (49.6 | ) | ||||||||
| Other data: |
||||||||||||||||||||
| Pounds shipped |
131.5 | 132.9 | 503.2 | 510.0 | 554.1 | |||||||||||||||
| Adjusted sales(4) |
$ | 139.6 | $ | 137.1 | $ | 524.9 | $ | 530.5 | $ | 538.5 | ||||||||||
| Adjusted sales per pound shipped |
$ | 1.06 | $ | 1.03 | $ |
1.04 |
|
$ | 1.04 | $ | 0.97 | |||||||||
| Consolidated Adjusted EBITDA(5) |
$ | 30.1 | $ | 32.8 | $ | 115.4 | $ | 122.6 | $ | 99.0 | ||||||||||
| Consolidated Adjusted EBITDA per pound shipped |
$ | 0.23 | $ | 0.25 | $ | 0.23 | $ | 0.24 | $ | 0.18 | ||||||||||
| Total capital expenditures |
$ | 3.1 | $ | 3.7 | $ | 20.4 | $ | 22.4 | $ | 11.9 | ||||||||||
| As of March 31, | As of December 31, | |||||||||||||||||||
| 2013 | 2012 | 2011(7) | 2010(7) | |||||||||||||||||
| (in millions) |
||||||||||||||||||||
| Balance Sheet Data: |
||||||||||||||||||||
| Cash |
|
$ | 15.8 | $ | 13.9 | $ | 49.5 | $ | 15.5 | |||||||||||
| Total assets |
|
576.5 | 502.7 | 548.7 | 537.7 | |||||||||||||||
| Total debt(6) |
|
400.0 | 389.5 | 303.6 | 306.2 | |||||||||||||||
| Total liabilities |
|
613.5 | 550.5 | 466.0 | 509.2 | |||||||||||||||
| Total (deficit) equity |
|
(37.0 | ) | (47.8 | ) | 82.7 | 28.5 | |||||||||||||
| (1) | We used a portion of the net proceeds of the Senior Secured Notes offering that we completed on June 1, 2012 to make the Parent Distribution. Our pro forma net income attributable to Global Brass and Copper Holdings, Inc. per common share reflects a reduction in our net income attributable to the interest expense incurred on the portion of the Senior Secured Notes that were used to fund the Parent Distribution. Assuming an interest rate of 9.50%, which is the actual interest rate of the Senior Secured Notes, and a statutory U.S. federal income tax rate of 35%, had the Parent Distribution been completed on January 1, 2012, our net income attributable to Global Brass and Copper Holdings, Inc. would have decreased by $2.5 million to $11.5 million for the three months ended March 31, 2012 and $4.1 million to $8.4 million for the year ended December 31, 2012. The effect of the issuance of the Senior Secured Notes and the Parent Distribution is fully reflected in the results presented for the three months ended March 31, 2013. |
| (2) | Represents interest on the related party term loan credit facility described in “Certain Relationships and Related Party Transactions”. |
| (3) | The number of common shares used in the calculation of historical net income attributable to Global Brass and Copper Holdings, Inc. per common share does not give effect to the planned 211,100-to-1 stock split to be effected after the effective date of this registration statement and prior to the completion of this offering. The number of common shares used in the calculation of pro forma net income attributable to Global Brass and Copper Holdings, Inc. per common share does give effect to such stock split, but does not give effect to the 338,979 shares issuable under the equity awards to be granted in connection with this offering, since as of the date of this offering none of those awards will be vested or exercisable within 60 days after the date of the completion of this offering. |
| (4) | Adjusted sales is a non-GAAP financial measure. For more information regarding adjusted sales, see “Management’s Discussion and Analysis of Financial Condition and Results of Operations—Non-GAAP Measures—Adjusted Sales”. Adjusted sales is defined as net sales less the metal component of net sales. Adjusted sales represents the value-added revenue we derive from our conversion and fabrication operations. Management uses adjusted sales on a consolidated basis to monitor the revenues that are generated from our value-added conversion and fabrication processes excluding the |
18
Table of Contents
| effects of fluctuations in metal costs, reflecting our toll sales and our balanced book approach for other sales. We believe that presenting adjusted sales is informative to investors because it shows our ability to generate revenue from conversion and fabrication. The following table shows a reconciliation of net sales to adjusted sales: |
| Three Months Ended March 31, |
Year Ended December 31, | |||||||||||||||||||
| 2013 | 2012(7) | 2012 | 2011(7) | 2010(7) | ||||||||||||||||
| (in millions) |
||||||||||||||||||||
| Net sales |
$ | 445.0 | $ | 443.4 | $ | 1,650.5 | $ | 1,779.1 | $ | 1,658.7 | ||||||||||
| Metal component of net sales |
305.4 | 306.3 | 1,125.6 | 1,248.6 | 1,120.2 | |||||||||||||||
|
|
|
|
|
|
|
|
|
|
|
|||||||||||
| Adjusted sales |
$ | 139.6 | $ | 137.1 | $ | 524.9 | $ | 530.5 | $ | 538.5 | ||||||||||
|
|
|
|
|
|
|
|
|
|
|
|||||||||||
| (5) | Consolidated EBITDA and Consolidated Adjusted EBITDA are non-GAAP financial measures. For more information regarding our EBITDA-based measures, including their limitations, see “Management’s Discussion and Analysis of Financial Condition and Results of Operations—Non-GAAP Measures—EBITDA-Based Measures”. |
We define Consolidated EBITDA as net income (loss) attributable to Global Brass and Copper Holdings, Inc., adjusted to exclude interest expense, provision for (benefit from) income taxes and depreciation and amortization expense. We also present Segment EBITDA elsewhere in this prospectus.
We use Consolidated EBITDA only to calculate Consolidated Adjusted EBITDA. Consolidated Adjusted EBITDA is Consolidated EBITDA, further adjusted to exclude extraordinary gains from the bargain purchase that occurred in the acquisition of the worldwide metals business of Olin Corporation, realized and unrealized gains and losses related to the collateral hedge contracts that were required under the asset-based revolving loan facility that we entered into at the time we acquired the worldwide metals business of Olin Corporation in November 2007 (the “2007 ABL Facility”), unrealized gains and losses on derivative contracts in support of our balanced book approach, unrealized gains and losses associated with derivative contracts related to electricity and natural gas costs, non-cash gains and losses due to lower of cost or market adjustments to inventory, non-cash LIFO-based gains and losses due to the depletion of a LIFO layer of metal inventory with lower base year costs, non-cash compensation expense related to payments made to members of our management by our parent, Halkos, loss on extinguishment of debt, non-cash income accretion related to the joint venture with Dowa Holdings Co. Ltd. (“Dowa”), KPS management fees, restructuring and other business transformation charges, specified legal and professional expenses and certain other items. We also present Segment Adjusted EBITDA elsewhere in this prospectus.
We present the above-described EBITDA-based measures because we consider them important supplemental measures and believe they are frequently used by securities analysts, investors and other interested parties in the evaluation of companies in our industry. Nevertheless, our EBITDA based measures may not be comparable to similarly titled measures presented by other companies.
We present Consolidated Adjusted EBITDA as a supplemental measure of our performance because we believe it represents a meaningful presentation of the financial performance of our core operations, without the impact of the various items excluded, in order to provide period-to-period comparisons that are more consistent and more easily understood. Measures similar to Consolidated Adjusted EBITDA, including “EBITDA” (as defined in the agreement governing the ABL Facility) and “Adjusted EBITDA” (as defined in the indenture governing the Senior Secured Notes), are used to determine compliance with various financial covenants and tests.
Management uses Consolidated Adjusted EBITDA per pound in order to measure the effectiveness of the balanced book approach in reducing the financial impact of metal price volatility on earnings and operating margins, and to measure the effectiveness of our business transformation initiatives in improving earnings and operating margins. In addition, Segment Adjusted EBITDA is the key metric used by our chief operating decision maker to evaluate the business performance of our company in comparison to budgets, forecasts and prior year financial results, providing a measure that management believes reflects our core operating performance. For a full description of Segment Adjusted EBITDA, see “Management’s Discussion and Analysis of Financial Condition and Results of Operations—Non-GAAP Measures”.
19
Table of Contents
Below is a reconciliation of net income (loss) attributable to Global Brass and Copper Holdings, Inc. to Consolidated EBITDA and Consolidated Adjusted EBITDA:
| Successor | Predecessor | |||||||||||||||||||||||||||||||||||
| Three Months Ended March 31, |
Year Ended December 31, | Period from October 10 to December 31, |
Period from January 1 to November 18, |
|||||||||||||||||||||||||||||||||
| 2013 | 2012(7) | 2012 | 2011(7) | 2010(7) | 2009(7) | 2008(7) | 2007(a)(7) | 2007(a) | ||||||||||||||||||||||||||||
| (in millions) |
||||||||||||||||||||||||||||||||||||
| Net income (loss) attributable to Global Brass and Copper Holdings, Inc. |
$ | 11.4 | $ | 14.0 | $ | 12.5 | $ | 55.1 | $ | 41.6 | $ | 10.2 | $ | (69.1 | ) | $ | 60.3 | $ | 44.0 | |||||||||||||||||
| Interest expense |
9.9 | 9.8 | 39.7 | 40.0 | 25.1 | 18.1 | 20.0 | 1.2 | — | |||||||||||||||||||||||||||
| Provision for (benefit from) income taxes |
6.0 | 8.2 | 19.2 | 31.4 | 26.6 | 2.2 | (45.4 | ) | (0.3 | ) | 0.4 | |||||||||||||||||||||||||
| Depreciation expense |
1.9 | 1.5 | 6.8 | 4.5 | 2.8 | 1.7 | 0.4 | — | 30.6 | |||||||||||||||||||||||||||
| Amortization expense |
— | — | 0.1 | 0.2 | 0.2 | 0.2 | 0.2 | — | — | |||||||||||||||||||||||||||
|
|
|
|
|
|
|
|
|
|
|
|
|
|
|
|
|
|
|
|||||||||||||||||||
| Consolidated EBITDA |
$ | 29.2 | $ | 33.5 | $ | 78.3 | $ | 131.2 | $ | 96.3 | $ | 32.4 | $ | (93.9 | ) | $ | 61.2 | $ | 75.0 | |||||||||||||||||
| Extraordinary gain from bargain purchase(b) |
— | — | — | — | — | — | (2.9 | ) | (60.7 | ) | — | |||||||||||||||||||||||||
| Loss (gain) on derivative contracts(c) |
— | (1.3 | ) | (1.6 | ) | 1.1 | 12.0 | 22.0 | (19.9 | ) | (2.4 | ) | 0.5 | |||||||||||||||||||||||
| Loss from lower of cost or market adjustment(d) |
— | — | 0.3 | — | — | — | 170.9 | — | — | |||||||||||||||||||||||||||
| Impact of inventory basis adjustment(e) |
— | — | — | — | — | (4.1 | ) | — | — | — | ||||||||||||||||||||||||||
| (Gain) loss from LIFO layer depletion(f) |
— | — | (4.8 | ) | (15.2 | ) | (21.0 | ) | 0.5 | — | — | (22.2 | ) | |||||||||||||||||||||||
| Non-cash accretion of income of Dowa joint venture(g) |
(0.2 | ) | (0.2 | ) | (0.7 | ) | (0.7 | ) | (0.7 | ) | (0.7 | ) | (0.7 | ) | — | — | ||||||||||||||||||||
| Loss on extinguishment of debt(h) |
— | — | 19.6 | — | — | — | — | — | — | |||||||||||||||||||||||||||
| Non-cash Halkos profits interest compensation expense(i) |
— | — | 19.5 | 0.9 | 3.5 | — | — | — | — | |||||||||||||||||||||||||||
| Management fees(j) |
0.3 | 0.3 | 1.0 | 1.0 | 1.0 | 1.0 | 1.0 | — | — | |||||||||||||||||||||||||||
| Restructuring and other business transformation charges(k) |
— | |
— |
|
— | — | 6.1 | 1.9 | 5.0 | — | — | |||||||||||||||||||||||||
| Specified legal/professional expenses(l) |
0.8 | 0.5 |
|
3.3 |
|
4.3 | 1.8 | 3.1 | 0.4 | — | — | |||||||||||||||||||||||||
| Other adjustments(m) |
— | — | 0.5 | — | — | — | — | — | — | |||||||||||||||||||||||||||
|
|
|
|
|
|
|
|
|
|
|
|
|
|
|
|
|
|
|
|||||||||||||||||||
| Consolidated Adjusted EBITDA |
$ | 30.1 | $ |
32.8 |
|
$ | 115.4 | $ | 122.6 | $ | 99.0 | $ | 56.1 | $ | 59.9 | $ | (1.9 | ) | $ | 53.3 | ||||||||||||||||
|
|
|
|
|
|
|
|
|
|
|
|
|
|
|
|
|
|
|
|||||||||||||||||||
| (a) | We acquired the worldwide metals business of Olin Corporation on November 19, 2007. As a result, the 2007 fiscal year is composed of a predecessor period from January 1, 2007 to November 18, 2007, and a successor period from the date of our formation, October 10, 2007, to December 31, 2007. We had no material operations or assets prior to November 19, 2007. Data for the period from January 1, 2007 to November 18, 2007 are based on books and records provided to us by Olin Corporation in connection with the acquisition, which we believe were prepared on a basis consistent with Olin Corporation’s accounting policies and procedures and have not been subject to an audit or review. Data for the predecessor period of 2007 are not prepared using our accounting policies and procedures, do not reflect the application of purchase accounting (which has been applied to the successor period financial statements) and also do not reflect the allocation of Olin Corporation selling, general and administrative expenses to the metals business unit. We believe that the unaudited financial information for the predecessor period of 2007 may be useful to investors for purposes of illustrating trends in our business. Although we have no reason to believe that the unaudited financial information for the predecessor period of 2007 is materially deficient, there is a risk that this unaudited financial information may contain errors that might have been detected in a review or audit process or might have been different if prepared in accordance with our policies and procedures instead of those of Olin Corporation. See “Risk Factors—Risks Related to Our Business—You should not place undue reliance on the selected financial and other information of our predecessor as of November 18, 2007 and for the period from January 1, 2007 to November 18, 2007, which are summarized in this prospectus”. The allocation of Olin Corporation selling, general and administrative expenses to the metals business unit would decrease EBITDA for 2007 by the amount of such allocation. |
20
Table of Contents
| (b) | The fair market value of the net assets acquired in our acquisition of the worldwide metals business of Olin Corporation exceeded the purchase price, resulting in a bargain purchase event. In accordance with GAAP, the excess fair value was allocated as a reduction to the amounts that otherwise would have been assigned to all of the acquired long-term assets. The remaining excess fair value was recorded as a one-time non-taxable extraordinary gain of $60.7 million in the successor period from October 10, 2007 (inception) to December 31, 2007 and $2.9 million in the year ended December 31, 2008. |
| (c) | Represents realized and unrealized gains and losses related to the collateral hedge that was required under our 2007 ABL Facility and is no longer required under the ABL Facility, unrealized gains and losses on derivative contracts in support of our balanced book approach and unrealized gains and losses associated with derivative contracts with respect to electricity and natural gas costs. No additional gains and losses with respect to the collateral hedge will be incurred in any subsequent periods. The following table summarizes the loss (gain) on derivative contracts: |
| Successor | Predecessor | |||||||||||||||||||||||||||||||||||
| Three Months Ended March 31, |
Year Ended December 31, | Period from October 10 to December 31, |
Period from January 1 to November 18, |
|||||||||||||||||||||||||||||||||
| 2013 | 2012(7) | 2012 | 2011(7) | 2010(7) | 2009(7) | 2008(7) | 2007(a)(7) | 2007(a) | ||||||||||||||||||||||||||||
| Collateral hedge |
$ | — | $ | — | $ | — | $ | — | $ | 4.6 | $ | 30.8 | $ | (26.6 | ) | $ | (5.2 | ) | $ | — | ||||||||||||||||
| Other |
— | (1.3) | (1.6 | ) | 1.1 | 7.4 | (8.8 | ) | 6.7 | 2.8 | 0.5 | |||||||||||||||||||||||||
|
|
|
|
|
|
|
|
|
|
|
|
|
|
|
|
|
|
|
|||||||||||||||||||
| Loss (gain) on derivative contracts |
$ | — | $ | (1.3 | ) | $ | (1.6 | ) | $ | 1.1 | $ | 12.0 | $ | 22.0 | $ | (19.9 | ) | $ | (2.4 | ) | $ | 0.5 | ||||||||||||||
|
|
|
|
|
|
|
|
|
|
|
|
|
|
|
|
|
|
|
|||||||||||||||||||
| (d) | In the year ended December 31, 2012, we reduced the recorded value of inventory by $0.3 million related to a lower of cost or market adjustment. |
In the year ended December 31, 2008, we recorded a $170.9 million non-cash charge for the revaluation of inventory from the prevailing metal prices at the time of the acquisition in November 2007 (reflecting a copper price of $3.00 per pound), to the significantly lower metal prices as of December 31, 2008 (reflecting a copper price of $1.52 per pound).
| (e) | Our foreign operations are accounted for on a FIFO basis. The $4.1 million adjustment represents the difference between our foreign entities’ replacement cost of metal included in net sales in the year ended December 31, 2009 and the carrying value of our metal inventory at December 31, 2008 that was recognized in cost of sales in 2009 in accordance with the FIFO basis cost recognition. |
| (f) | Calculated based on the difference between the base year LIFO carrying value and the metal prices prevailing in the market at the time of inventory depletion. |
| (g) | As a result of the application of purchase accounting in connection with the November 19, 2007 acquisition, no carrying value was initially assigned to our equity investment in our joint venture with Dowa. This adjustment represents the accretion of equity in our joint venture with Dowa at the date of the acquisition over a 13-year period (which represents the estimated useful life of the technology and patents of the joint venture). See note 7 to our audited consolidated financial statements, which are included elsewhere in this prospectus. |
| (h) | Represents the loss on extinguishment of debt recognized in connection with the Term Loan Refinancing. See “Prospectus Summary—Recent Transactions—Issuance of the Senior Secured Notes and the Refinancing of the Term Loan Facility”. |
| (i) | Non-cash Halkos profits interest compensation expense for the year ended December 31, 2012 represents dividend payments made by Halkos to members of our management that resulted in a non-cash compensation charge in connection with the Parent Distribution in June 2012. See “Prospectus Summary—Recent Transactions—Distribution to Halkos” and “Certain Relationships and Related Party Transactions”. |
Non-cash Halkos profits interest compensation expense for the year ended December 31, 2011 and the year ended December 31, 2010 represents a portion of the dividend payments made by Halkos to members of our management that resulted in a non-cash compensation charge in connection with the refinancing transaction that occurred in August 2010. See note 17 to our audited consolidated financial statements, which are included elsewhere in this prospectus.
| (j) | Represents annual management fees payable to affiliates of KPS. We expect to pay KPS or its affiliates an amount in cash equal to $4.5 million, the aggregate amount of the remaining payments due under the management agreement upon termination of the agreement at the closing of this offering. See “Certain Relationships and Related Party Transactions”. |
21
Table of Contents
| (k) | Restructuring and other business transformation charges for the year ended December 31, 2010 included $3.2 million in severance charges to certain employees at Olin Brass, $0.5 million incurred for labor and productivity consultants in connection with operations at the Somers Thin Strip facility and $2.4 million in charges for excess and obsolete material associated with our exit and our share reduction in negative and low-margin product lines. |
Restructuring and other business transformation charges for the year ended December 31, 2009 included $0.7 million in fees incurred for labor and productivity consultants in connection with operations at the Olin Brass East Alton, Illinois casting plant, rolling mill and fabrication and cupping operation and $1.2 million in severance charges associated with the reorganization of Olin Brass’s senior management.
Restructuring and other business transformation charges for the year ended December 31, 2008 included $5.0 million in fees incurred for labor and productivity consultants in connection with operations at the Olin Brass East Alton, Illinois casting plant, rolling mill and fabrication and cupping operation and $1.4 million in integration expenses associated with the January 2008 asset acquisition from Bolton Metal Products Company, partially offset by a $1.4 million gain associated with the sale of a redundant A.J. Oster distribution facility.
| (l) | Specified legal/professional expenses for the three months ended March 31, 2013 and 2012 included $0.8 million and $0.5 million, respectively, of professional fees for accounting, tax, legal and consulting services related to this offering and certain regulatory and compliance matters. |
Specified legal/professional expenses for the year ended December 31, 2012 included $3.3 million of professional fees for accounting, tax, legal and consulting services related to this offering.
Specified legal/professional expenses for the year ended December 31, 2011 included $3.9 million of professional fees for accounting, tax, legal and consulting services related to this offering and $0.9 million of expense incurred relating to a waiver obtained from our lenders under the Term Loan Facility and the 2010 ABL Facility, $0.9 million of expense related to an abandoned contemplated acquisition, and $0.6 million of expense related to the October 2011 amendment of our Term Loan Facility and 2010 ABL Facility. Partly offsetting this was income of $2.0 million from a favorable legal settlement related to a products liability lawsuit in which we were named as a third-party defendant. The waiver fee paid related to a waiver from lenders under our Term Loan Facility and the 2010 ABL Facility for a technical restatement of the financial statements of Global Brass and Copper, Inc. previously delivered and an additional waiver because the consolidated financial statements of Global Brass and Copper, Inc. for the year ended December 31, 2010 could not be delivered within the prescribed time period as a result of the restatement. For more information, see “Management’s Discussion and Analysis of Financial Condition and Results of Operations—Liquidity and Capital Resources—Outstanding Indebtedness—The ABL Facility” and “Management’s Discussion and Analysis of Financial Condition and Results of Operations—Internal Control over Financial Reporting”.
Specified legal/professional expenses for the year ended December 31, 2010 included legal and consulting fees of $0.8 million associated with the successful defense of two assumed predecessor company liabilities, $0.9 million of professional fees incurred in connection with preparations for the August 18, 2010 refinancing of our 2007 ABL Facility and other future financings and $0.1 million associated with regulatory and compliance matters.
Specified legal/professional expenses for the year ended December 31, 2009 included legal and consulting fees of $2.4 million associated with a proposed acquisition that was not completed and $0.7 million associated with regulatory and compliance matters.
Specified legal/professional expenses for the year ended December 31, 2008 included legal and consulting fees of $0.4 million associated with a proposed acquisition that was not completed.
| (m) | Represents a call premium of $0.5 million as a result of a voluntary prepayment of $15.0 million on the Term Loan Facility in April 2012. |
| (6) | Consists of long-term debt, related party debt and current maturities of long-term debt. |
| (7) | For the three months ended March, 31 2012, the above data have been adjusted for prior year revisions discussed in note 1, “Basis of Presentation and Principles of Consolidation” to our unaudited consolidated financial statements included elsewhere in this prospectus. For 2011 and 2010, the above data have been adjusted for prior year revisions discussed in note 2, “Summary of Significant Accounting Policies” to our audited consolidated financial statements included elsewhere in this prospectus. We also revised figures for 2009, 2008 and the period from October 10, 2007 to December 31, 2007. |
22
Table of Contents
Investing in our common stock involves a high degree of risk. You should carefully consider the risk factors set forth below as well as the other information contained in this prospectus before investing in our common stock or deciding whether you will or will not participate in this offering. Any of the following risks could materially and adversely affect our business, financial condition, results of operations or cash flows. In such a case, you may lose all or part of your original investment.
Risks Related to Our Business
Our business, financial condition and results of operations or cash flows could be negatively affected by downturns in economic cycles in general or cyclicality in our end markets, both inside and outside of the U.S. Our future growth also depends, to a significant extent, on improvements in general economic conditions and in conditions in our end markets.
Many of our products are used in industries that are, to varying degrees, cyclical and have historically experienced periodic downturns due to factors such as economic conditions, energy prices, the availability of credit, consumer sentiment, demand and other factors beyond our control. These economic and industry downturns have resulted in diminished product demand and excess capacity for our products. The significant deterioration in economic conditions that occurred during the second half of 2008 resulted in disruptions in a number of our end markets, and prospects for improvements in U.S. and global economic conditions as well as in those end markets remain uncertain. Any future economic disruptions may also negatively impact our end markets or the consumers served by those end markets, which would adversely affect our operating results.
Future disruptions in the commercial credit markets may impact liquidity in the global credit market as greatly as, or even more than, in recent years, and we are not able to predict the impact any such worsening conditions would have on our customers in general, and our results of operations specifically. Businesses in one or more of the end markets that we serve, or consumers in one or more of the end markets that our customers serve, may postpone or choose not to make purchases in response to economic uncertainty, tighter credit, negative financial news, unemployment, interest rates, adverse consumer sentiment and declines in housing prices or other asset values.
In particular, the historically cyclical and volatile building and housing sector in the U.S. has not yet recovered from the downturn that began in 2007. If the housing, remodeling and residential and commercial construction markets continue to stagnate or deteriorate further, demand from such markets for our products, especially our brass rod products, is expected to continue to be adversely affected.
Similarly, the automotive end market has experienced significant downturns in connection with, or in anticipation of, declines in general economic conditions. Demand for vehicles depends largely on the strength of the economy, employment levels, consumer confidence levels, the availability and cost of credit and the cost of fuel. Negative economic developments could reduce demand for new vehicles, causing our customers to reduce their vehicle and automotive component part production in North America.
The coinage and general consumer end markets are also affected by economic cycles. Demand for coinage-related products generally increases with the number of cash transactions that occur, and the number of cash transactions generally increases during periods of economic growth. Demand for consumer goods is also very sensitive to economic conditions and drives demand in our electronics/electrical components end market.
23
Table of Contents
As a result, cyclicality in economic conditions and in the end markets that we serve could have a material adverse effect on our business, financial condition, results of operations and cash flows. Our growth prospects also depend, to a significant extent, on the degree by which general economic conditions and conditions in the end markets that we serve improve in the future.
Failure to maintain our balanced book approach would cause increased volatility in our profitability and our operating results and may result in significant losses.
Copper scrap and cathode are subject to significant cyclical price fluctuations. The availability and price of copper scrap and cathode depend on a number of factors outside our control, including general economic conditions, international demand for metal and internal recycling activities by primary copper producers and other consumers of copper. The cost of copper scrap and cathode represents the largest component of our cost of sales.
We use our balanced book approach to substantially reduce the impact of metal price movements on operating margins from our non-toll sales, which are sales for which we assume responsibility for metal procurement and then recover the metal replacement cost from the customer. Non-toll sales represented 75.9% of our unit sales volume during the year ended December 31, 2012. Under our balanced book approach, we seek to match the timing, quantity and price of the metal component of net sales with the timing, quantity and price of replacement metal purchases on all of our non-toll sales. We use a combination of matching price date of shipment terms, firm price terms and derivatives transactions to achieve our balanced book. See “Management’s Discussion and Analysis of Financial Condition and Results of Operations—Key Factors Affecting Our Results of Operations—Balanced Book”.
We may not be able to maintain our balanced book if our customers become unwilling to bear metal price risk through the matching of price date of shipment terms. We may also not be able to find counterparties for the derivatives transactions entered into in connection with firm price terms, and the cost of those derivatives transactions may increase such that entering into such transactions is no longer cost-effective to us. Those risks may increase during periods of very high copper prices or increased volatility in those prices.
If we fail to effectively maintain our balanced book, our profitability will be significantly affected by fluctuations in metal costs and our ability to recoup metal costs through product pricing. As a result, the volatility of our results of operations would increase dramatically. Furthermore, if we are unable to maintain our balanced book approach, we will potentially replace metal at a different price than the price recovered from the customer, generating a loss in circumstances where the replacement price is higher than the price recovered from the customer.
Although we maintain our balanced book approach, metal costs still affect our profitability through “shrinkage” and inventory valuation adjustments.
Shrinkage loss, which is primarily the loss of raw metal that occurs in the melting and casting operations, is an inherent part of a metal fabrication and conversion business. Despite our use of our balanced book approach to mitigate the impact of metal price fluctuations, we must bear the cost of any shrinkage during production, which may increase the volatility of our results of operations. Because we process a large amount of metal in our operations, a small increase in our shrinkage rates can have a significant effect on our margins and profitability. In addition, if metal prices increase, the same amount of shrinkage will have a greater effect on our manufacturing costs and have a more significant negative impact on our margins and profitability.
The market price of metals used in production and related scrap is subject to significant volatility. During periods when open-market prices decline below net book value, we may need to record a
24
Table of Contents
provision to reduce the carrying value of our inventory and increase cost of sales. Additionally, the cost of our inventories is primarily determined using the last-in, first-out (“LIFO”) method. Under the LIFO inventory valuation method, changes in the cost of raw materials and production activities are recognized in cost of sales in the current period. In a period of rising prices, cost of sales expense recognized under LIFO is generally higher than the cash costs incurred to acquire the inventory sold. Conversely, in a period of declining raw material prices, cost of sales recognized under LIFO is generally lower than cash costs incurred to acquire the inventory sold. The impact of LIFO accounting on our financial results may be significant with respect to period-to-period comparisons. During 2012 and 2011 inventory quantities were reduced, resulting in a liquidation of LIFO inventory layers carried at lower costs prevailing in prior years as compared with current costs. While the effect of this reduction of inventory decreased cost of sales by $4.8 million and $15.2 million during 2012 and 2011, respectively, the benefit of such depletion may not continue in future periods. See “Management’s Discussion and Analysis of Operating Results and Financial Condition—Key Factors Affecting Our Results of Operations—Metal Cost”.
Because our balanced book approach does not reduce the effects of fluctuations in metal prices on our working capital requirements, higher metal prices could have a negative effect on our liquidity.
Our balanced book approach does not reduce the impact of the volatility in metal prices on our working capital requirements. Metal prices impact our investment in working capital because our collection terms with our customers are longer than our payment terms to our suppliers. In 2012, the spread between our receivable collection cycle and purchase payment cycle was approximately 20 days. As a result, when metal prices are rising, even if the number of pounds of metal we process does not change, we tend to use more cash or draw more on the ABL Facility to cover the cash flow delay from material replacement purchase to cash collection. Thus, when metal prices increase, our working capital may be negatively affected as we are required to draw more on our cash or available financing sources to pay for raw materials. As a result, our liquidity may be negatively affected by increasing metal prices. Metal price volatility may also require us to draw on working capital sources more quickly and unpredictably, and therefore at higher cost. See “Management’s Discussion and Analysis of Operating Results and Financial Condition—Key Factors Affecting Our Results of Operations—Metal Cost”.
Limited access to raw materials or fuel could negatively affect our business, financial condition or results of operations or cash flows.
Our ability to fulfill our customer orders in a timely and cost-effective manner depends on our ability to secure a sufficient and constant supply of raw materials and fuel. Although we often seek to source our copper from scrap, including internally generated scrap and repurchases of our customers’ scrap, where scrap is either not available or is not appropriate for use, we use virgin raw materials such as copper cathode, which are generally more expensive than scrap. We depend on natural gas for our manufacturing operations and source natural gas through open-market purchases.
We depend on scrap for our operations and acquire our scrap inventory from numerous sources. These suppliers generally are not bound by long-term contracts and have no obligation to sell scrap metals to us. In periods of low metal prices, suppliers may elect to hold scrap waiting for higher prices. In addition, the slowdown in industrial production and consumer consumption in the U.S. during the economic crisis reduced, and is expected to continue to reduce, the supply of scrap metal available to us, and the scrap supply may be subject to the activities of speculators. If an adequate supply of scrap metal is not available to us, we would be unable to recycle metals at desired volumes, forcing us to use a larger amount of more expensive virgin raw materials and our results of operations and financial condition would be materially and adversely affected. Furthermore, with the rapid growth of the
25
Table of Contents
economy of China, the demand for certain raw materials has increased significantly while the supply of such raw materials may not have increased correspondingly. In addition, the Securities and Exchange Commission has recently issued an order amending a rule to allow shares of a physically backed copper exchange traded fund (“ETF”) to be listed and publicly traded. Such fund and other copper ETFs like it hold copper cathode as collateral against their shares. The acquisition of copper cathode by copper ETFs and other similar entities may materially decrease or interrupt the availability of copper for immediate delivery in the United States, which could materially increase our cost of copper and copper scrap, result in potential supply shortages, and increase price volatility for copper and copper scrap. All of the above factors may affect our ability to secure the necessary raw materials in a cost-effective manner for production of our products.
We may experience disruptions in the supply of natural gas as a result of delivery curtailments to industrial customers due to extremely cold weather. We may also experience other delays or shortages in the supply of raw materials. If we are unable to obtain adequate, cost efficient or timely deliveries of required raw materials and fuel, we may be unable to manufacture sufficient quantities of products on a timely basis. This could cause us to lose sales, incur additional costs, delay new product introductions or harm our reputation in the end markets that we serve. In addition, our ability to find metal is dependent on an adequate and timely supply of raw materials. An inability to find an adequate and timely supply of raw materials could have a material adverse effect on our profit margin, and in turn on our business, financial condition, results of operations or cash flows.
Increases in the cost of energy could cause our cost of sales to increase, thereby reducing operating results and limiting our operating flexibility.
In 2012, the cost of energy and utilities represented approximately 6% of our non-metal cost of sales. The prices of natural gas and electricity can be particularly volatile. As a result, our natural gas and electricity costs may fluctuate dramatically, and we may not be able to mitigate the effect of higher natural gas and electricity costs on our cost of sales. A substantial increase in energy costs could cause our operating costs to increase and our business, financial condition, results of operations and cash flows may be materially and adversely affected. Although we attempt to mitigate short-term volatility in natural gas and electricity costs through the use of derivatives contracts, we may not be able to eliminate the long-term effects of such cost volatility. Furthermore, in an effort to offset the effect of increasing costs, we may have also limited our potential benefit from declining costs.
Our substantial leverage and debt service obligations may adversely affect our financial condition and restrict our operating flexibility, including our ability to raise additional capital to fund our operations, limit our ability to react to changes in the economy or our industry and prevent us from meeting our obligations under our indebtedness.
We are highly leveraged. As of March 31, 2013, our total indebtedness was $400.0 million. We also had an additional $174.5 million available for borrowing under the ABL Facility as of that date. Based on the amount of indebtedness outstanding and applicable interest rates at March 31, 2013, our annualized cash interest expense would be $36.7 million, $1.1 million of which represents interest expense on floating-rate obligations (and thus is subject to increase in the event interest rates were to rise), prior to any consideration of the impact of interest rate derivative contracts.
Our substantial indebtedness and debt service obligations could have important consequences for investors, including:
| • | they may impose, along with the financial and other restrictive covenants under our credit agreements, significant operating and financial restrictions, including our ability to borrow money, dispose of assets or raise equity for our working capital, capital expenditures, dividend payments, debt service requirements, strategic initiatives or other purposes; |
26
Table of Contents
| • | they may limit our flexibility in planning for, or reacting to, changes in our operations or business; |
| • | we may be more highly leveraged than some of our competitors, which may place us at a competitive disadvantage; and |
| • | they may make us more vulnerable to downturns in our business or the economy. |
Any of these consequences could have a material adverse effect on our business, financial condition, results of operations, prospects and ability to satisfy our obligations under our indebtedness. In addition, there would be a material adverse effect on our business, financial condition, results of operations and cash flows if we were unable to service our indebtedness or obtain additional financing, as needed.
Covenants under our debt agreements impose significant operating and financial restrictions. Failure to comply with these covenants could have a material adverse effect on our business, financial condition, results of operations or cash flows.
The agreement governing the ABL Facility and the indenture governing the Senior Secured Notes contain various covenants that limit or prohibit our ability, among other things, to:
| • | incur or guarantee additional indebtedness; |
| • | pay dividends on our capital stock or redeem, repurchase, retire or make distributions in respect of our capital stock or subordinated indebtedness or make certain other restricted payments; |
| • | make certain loans, acquisitions, capital expenditures or investments; |
| • | sell certain assets, including stock of our subsidiaries; |
| • | enter into certain sale and leaseback transactions; |
| • | create or incur certain liens; |
| • | consolidate, merge, sell, transfer or otherwise dispose of all or substantially all of our assets; |
| • | enter into certain transactions with our affiliates; and |
| • | engage in certain business activities. |
The agreement governing the ABL Facility also contains a financial covenant that requires us to maintain a fixed charge coverage ratio that is tested whenever excess availability, as defined in such agreement, falls below a certain level. The fixed charge coverage ratio, as defined in the agreement, requires us to maintain a minimum ratio of “EBITDA” (as defined in the agreement governing the ABL Facility) to the amount of our fixed charges for the twelve consecutive months prior to the date on which the ratio is tested. The agreement governing the ABL Facility also requires excess availability to remain above a certain level to avoid default. For more information regarding these covenants, please see “Management’s Discussion and Analysis of Financial Condition and Results of Operations—Liquidity and Capital Resources—Covenant Compliance” and “Description of Certain Indebtedness—ABL Facility”.
As of March 31, 2013, we were in compliance with all of the covenants contained in our debt agreements. A violation of covenants may result in default or an event of default under our debt agreements. Upon the occurrence of an event of default under the agreement governing the ABL Facility or the indenture governing the Senior Secured Notes, the requisite lenders under the ABL Facility or the requisite noteholders under the indenture could elect to declare all amounts of such indebtedness outstanding to be immediately due and payable and, in the case of the ABL Facility, terminate any commitments to extend further credit. If we are unable to repay those amounts, the lenders under such facilities may proceed against the collateral granted to them to secure such
27
Table of Contents
indebtedness. Substantially all of our assets are pledged as collateral under the ABL Facility and to secure the Senior Secured Notes. If the lenders or noteholders, as applicable, accelerate the repayment of borrowings, such acceleration would have a material adverse effect on our business, financial condition, results of operations or cash flows. Furthermore, cross-default provisions in the ABL Facility mean that any default under the indenture governing the Senior Secured Notes or other significant debt agreements could trigger a cross-default under the ABL Facility. If we are unable to repay the amounts outstanding under these agreements or obtain replacement financing on acceptable terms, which ability will depend in part upon the impact of economic conditions on the liquidity of credit markets, our creditors may exercise their rights and remedies against us and the assets that serve as collateral for the debt, including initiating a bankruptcy proceeding.
Although the terms of the credit agreement governing the ABL Facility and the indenture governing the Senior Secured Notes contain restrictions on our ability to incur additional indebtedness, these restrictions are subject to a number of important qualifications and exceptions, which would allow us to borrow additional indebtedness. Additional leverage could have a material adverse effect on our business, financial condition and results of operations and could increase other risks harmful to our financial condition and results of operations and could increase the risks described in “—Our substantial leverage and debt service obligations may adversely affect our financial condition and restrict our operating flexibility, including our ability to raise additional capital to fund our operations, limit our ability to react to changes in the economy or our industry and prevent us from meeting our obligations under our indebtedness”.
For a more detailed description on the limitations on our ability to incur additional indebtedness and our compliance with financial covenants, please see “Management’s Discussion and Analysis of Financial Condition and Results of Operations—Liquidity and Capital Resources—Covenant Compliance” and “Description of Certain Indebtedness”.
To service our indebtedness, we will require a significant amount of cash. Our ability to generate cash and the availability of our cash to service our indebtedness depends on many factors beyond our control, and any failure to meet our debt service obligations could harm our business, financial condition and results of operations.
Our ability to satisfy our debt obligations will primarily depend upon our future operating performance. As a result, prevailing economic conditions and financial, business and other factors, many of which are beyond our control, will affect our ability to generate cash to satisfy our debt obligations. Included in such factors are the requirements, under certain scenarios, of our counterparties that we post cash collateral to maintain our hedging positions. In addition, metal price declines, by reducing our borrowing base, could limit availability under the ABL Facility and further constrain our liquidity.
If we do not generate sufficient cash flow from operations to satisfy our debt service obligations, including payments required to be made on the ABL Facility and the Senior Secured Notes, we may have to undertake alternative financing plans, such as refinancing or restructuring our indebtedness, selling assets, reducing or delaying capital investments or seeking to raise additional capital. Our ability to restructure or refinance our indebtedness will depend on the condition of the capital markets and our financial condition at such time. Any refinancing of our indebtedness could be at higher interest rates and may require us to comply with more onerous covenants, which could further restrict our business operations. The terms of existing or future debt instruments (including the ABL Facility and the Senior Secured Notes) may restrict us from adopting some of these alternatives, which in turn could exacerbate the effects of any failure to generate sufficient cash flow to satisfy our debt service obligations. In addition, any failure to make payments of interest and principal on our outstanding indebtedness on a timely basis would likely result in a reduction of our credit ratings, which could harm our ability to incur additional indebtedness or refinance our indebtedness on acceptable terms.
28
Table of Contents
Our inability to generate sufficient cash flow to satisfy our debt service obligations, or to refinance our obligations at all or on commercially reasonable terms, would have an adverse effect, which could be material, on our business, financial condition and results of operations, may restrict our current and future operations, particularly our ability to respond to business changes or to take certain actions, as well as on our ability to satisfy our obligations in respect of the ABL Facility and the Senior Secured Notes.
Because some of our indebtedness bears interest at rates that fluctuate with changes in certain prevailing short-term interest rates, we are vulnerable to interest rate increases.
As of March 31, 2013, we had $25.0 million outstanding under the ABL Facility, which amount bears interest at rates that fluctuate with changes in certain prevailing short-term interest rates. Assuming a consistent level of debt, a 100 basis point change in the interest rate on the indebtedness under our ABL Facility would have increased or decreased the annual interest payments required to be made by us under the ABL Facility by $0.3 million. We use derivative financial instruments, mainly interest rate caps, to manage a portion of the potential impact of our interest rate risk. To some extent, derivative financial instruments can protect against increases in interest rates, but they do not provide complete protection over the long term. If interest rates increase dramatically, we could be unable to service our debt, which could have a material adverse effect on our business, financial condition, results of operations or cash flows.
If we were to lose order volumes from any of our largest customers, our sales volumes, revenues and cash flows could be reduced.
Our business is exposed to risks related to customer concentration. Our five largest customers were responsible for 21% of our net sales for the year ended December 31, 2012. No one customer accounted for more than 7% of those net sales. A loss of order volumes from, or a loss of industry share by, any major customer could negatively affect our business, financial condition or results of operations by lowering sales volumes, increasing costs and lowering profitability. In addition, during the economic downturn since 2008, 20 of our approximately 1,700 customers have become involved in bankruptcy or insolvency proceedings and have defaulted on their obligations to us. Our balance sheet reflected an allowance for doubtful accounts totaling $1.4 million at December 31, 2012 and $2.1 million at December 31, 2011. Similar incidents in the future could materially and adversely affect our financial condition and results of operations.
We do not have long-term contractual arrangements with a substantial number of our customers, and our sales volumes and net sales could be reduced if our customers switch some or all of their business with us to other suppliers.
During the fiscal year ended December 31, 2012, a majority of our net sales were generated from customers who do not have long-term contractual arrangements with us. These customers purchase products and services from us on a purchase order basis and may choose not to continue to purchase our products and services. A significant loss of these customers or a significant reduction in their purchase orders could have a material negative impact on our sales volume and business, or cause us to reduce our prices, which could have a material adverse effect on our business, financial condition, results of operations and cash flows.
Our business could be disrupted if our customers shift their manufacturing offshore.
Much of our business depends on maintaining close geographical proximity to our customers because the costs of transporting metals across large distances can be prohibitive. If the general trend in relocating manufacturing capacity to foreign countries continues, especially those in the automotive parts and electrical connectors industries, such relocations may disrupt or end our relationships with some customers and could lead to losing business to foreign competitors. These risks would increase to the extent we are unable to expand internationally when our customers do so.
29
Table of Contents
Decreased demand from the United States Mint could have a material adverse effect on our business, financial condition and results of operations.
The United States Mint is a significant customer of Olin Brass, accounting for 16.3% of Olin Brass’s net sales in 2012. Olin Brass has a contractual arrangement to supply nickel and brass coinage strip to the two United States Mint locations. Our supply agreement with the United States Mint runs through 2017. The United States Mint can also terminate the contract in whole or in part for convenience, and the damages payable to us by the United States Mint for such a termination do not include lost profits. The loss or reduction of any authorized supplier arrangement with the United States Mint for coin manufacture could have a material adverse effect on our business, financial condition and results of operations. In addition, the United States Government contracting and procurement cycle can be affected by the timing of, and delays in, the legislative process. As a result, our net sales and operating income may fluctuate, causing us to occasionally experience declines in net sales or earnings as compared to the immediately preceding quarter, and comparisons of our operating results on a period-to-period basis may not be meaningful. Further, it is uncertain whether the COINS Act will be adopted, and if it would be adopted, when and how it would be implemented. As a result, even if the COINS Act is adopted, we may not benefit if its implementation is delayed.
Additionally, the U.S. Treasury department announced in December 2011 a halt in the production of Presidential $1 coins for circulation due to a lack of demand (which is primarily the result of the U.S. continuing the use of the dollar bill). Although their production will continue for the collectibles market, it is uncertain when their production for circulation will be resumed. This action has adversely impacted our business in 2012 and is expected to adversely impact our business over the next several years. Further actions to curtail coin production could have an adverse effect on our business, financial condition or results of operations.
Following trends in electronic commerce, the United States Mint in the future may reduce its output of coinage and thus reduce its demand for coinage strip. A reduction in demand for coinage strip could have a material adverse effect on our business, financial condition and results of operations.
Decreased demand from Alliant Techsystems (“ATK”) could have a material adverse effect on our business, financial condition and results of operations.
Currently, a sizeable share of the production of our Olin Brass segment supports ATK, a supplier of munitions to the U.S. Army. ATK uses our product to service its contract with the U.S. Army to supply the U.S. Army’s arsenal located at Independence, Missouri. ATK is under contract with the U.S. Army to supply small-caliber ammunition through September 2019, and Olin Brass is under contract to supply ATK. In spite of these contractual arrangements, any decrease in demand from ATK or other disruption of our relationship with ATK could have a material adverse effect on our business, financial condition and results of operations.
Competition in our industry could adversely affect our business, financial condition and results of operations.
We are engaged in a highly competitive industry. Each of our segments competes with a limited number of companies. The Olin Brass segment competes with domestic and foreign manufacturers of copper and brass alloys in the form of strip, sheet, foil and plate. The Chase Brass segment competes with domestic as well as foreign manufacturers of brass rod (and in recent months has encountered increased competition from foreign rod suppliers). The A.J. Oster segment primarily competes with distributors, mills and processors of copper and brass products. Furthermore, we believe that domestic sales to customers that are not made by major companies, including us, are fragmented among many smaller companies. In the future, these smaller companies may choose to combine, creating a more significant domestic competitor against our business. We may be required to explore additional
30
Table of Contents
initiatives in each of our segments in order to maintain our sales volume at a competitive level. Increased competition in any of the fields in which our segments operate could adversely affect our business, financial condition and results of operations.
Currently, anti-dumping orders impose import duties on copper and brass products from France, Germany, Italy and Japan, which allows us and our domestic competitors to compete more fairly against French, German, Italian and Japanese producers in the U.S. copper and brass product market. On March 21, 2012, the ITC Commissioners voted to continue anti-dumping orders for brass sheet and strip from Germany, Italy, France and Japan. While domestic manufacturers lobby for the continued extension of these orders, if they expire, import duties on metal products from these countries will be significantly reduced, increasing the ability of such foreign producers to compete with our products domestically. Additionally, on March 15, 2012, the United States-Korea Free Trade Agreement (“KORUS FTA”) became effective, which largely eliminates tariffs on Korean industrial products imported to the United States. The reduction in prices of Korean products resulting from the KORUS FTA has increased the ability of Korean manufacturers to compete with our products. The increased competition resulting from the KORUS FTA, the termination of any anti-dumping orders or other changes to international trade regimes could adversely affect our business, financial condition and results of operations.
Adverse developments in our relationship with our employees could have a material adverse effect on our business, financial condition, results of operations and cash flows.
As of December 31, 2012, we had 1,986 employees, 1,118, or approximately 56%, of whom at various sites were members of unions. We have generally maintained good relationships with all unions and employees, which has been an important aspect of our ability to be competitive in our industry. As of December 31, 2012, there were nine unions representing employees in the Olin Brass segment (eight representing employees at the East Alton, Illinois facility and one representing employees of Bryan Metals, LLC), two representing employees of the A.J. Oster segment (one representing employees of A.J. Oster Foils, LLC and another representing employees of A.J.O. Global Services Mexico S.A. de C.V.) and one representing employees of the Chase Brass segment. In July 2012, employees at the Olin Brass Somers Thin Strip facility elected a union representative, and the election was certified by the National Labor Relations Board on July 27, 2012. On April 2, 2013, Somers Thin Strip employees ratified a collective bargaining agreement. That agreement took effect on April 3, 2013 and expires on December 15, 2015. The collective bargaining agreement with the eight unions that represent employees at the East Alton facility of Olin Brass expires in November 2013. The collective bargaining agreement covering union-represented employees of Chase Brass expires in June 2013, and Chase Brass will soon begin negotiations with the union over terms and conditions of a collective bargaining agreement. The collective bargaining agreement covering union-represented employees of A.J. Oster Foils expires in January 2014. The collective bargaining agreement covering union-represented employees of A.J.O. Global Services Mexico S.A. de C.V. has an indeterminate term, with a review of wages every year and a review of benefits every other year. The collective bargaining agreement with the union-represented employees of Bryan Metals, LLC is effective through September 30, 2014. The current collective bargaining agreements that are in place are a meaningful determinant of our labor costs and are very important to our ability to maintain flexibility to fulfill our customers’ needs. As we attempt to renew our collective bargaining agreements, labor negotiations may not conclude successfully and, in that case, may result in a significant increase in the cost of labor or may result in work stoppages or labor disturbances, disrupting our operations. Any such cost increases, stoppages or disturbances could have a material adverse effect on our business, financial condition, results of operations and cash flows by limiting plant production, sales volumes and profitability. See “Business—Employees” for a discussion of our collective bargaining agreements.
31
Table of Contents
Our operations are subject to risks of natural disasters, acts of war, terrorism or widespread illness at our domestic and international locations, any one of which could result in a business stoppage and negatively affect our business, financial condition or results of operations.
Our business operations depend on our ability to maintain and protect our facilities, computer systems and personnel. Our facilities and transportation for our employees are susceptible to damage from earthquakes and other natural disasters such as fires, floods, hurricanes, tornadoes and similar events. We have facilities located throughout North America, including in Illinois, Ohio, Connecticut, Rhode Island, Missouri, California, Puerto Rico and Mexico, as well as in China and Japan. We take precautions to safeguard our facilities, including obtaining insurance and maintaining health and safety protocols. However, a natural disaster, such as a tornado, fire, flood, hurricane or earthquake, could cause a substantial interruption in our operations, damage or destroy our facilities or inventory and cause us to incur additional expenses. The insurance we maintain against natural disasters may not be adequate to cover our losses in any particular case, which would require us to expend significant resources to replace any destroyed assets, thereby harming our financial condition and prospects significantly.
For example, Olin Brass’s manufacturing facilities and A.J. Oster’s California facility are located near geologic fault zones, and therefore are subject to greater risk of earthquakes which could result in increased costs and a disruption in our operations, which could harm our operating results and financial condition significantly. Our facility in East Alton, Illinois is located in a flood zone, and all of our facilities in the Midwestern United States are subject to the risk of tornadoes and damaging winds. Should earthquakes or other catastrophes, such as fires, tornadoes, hurricanes, floods, power outages, communication failures or similar events disable our facilities, we do not have readily available alternative facilities from which we could continue our operations, and any resulting stoppage could have a negative effect on our operating results. Acts of terrorism, widespread illness and war could also have a negative effect at our international and domestic facilities.
Any prolonged disruptions at or failures of our manufacturing facilities and equipment could have a material adverse effect on our business, financial condition, results of operations and cash flows.
Our ability to satisfy our customers’ orders in an efficient manner and to effectively manage inventory levels is dependent on the proper operation of our facilities and equipment. On-time delivery and accurate order fulfillment are essential to maintaining customer satisfaction and generating repeat business. To the extent we experience prolonged equipment failures, quality control incidents or other disruptions such as a major fire at our manufacturing facilities, our ability to satisfy our customers could be negatively impacted, and if, as a result, customer satisfaction decreased, this would have a material adverse effect on our business, financial condition, results of operations and cash flows.
In addition, we do not have redundancy in our operations on certain critical pieces of equipment, including the Olin Brass hot and cold mills and Chase Brass extruders. If this equipment were damaged, we would have to make alternative arrangements to replicate these processes, which could be costly and result in manufacturing delays, which could materially adversely affect our business, financial condition and results of operations.
Failure to meet the capital expenditure requirements for the introduction of new products or substantial further increases in the production of existing products could have a material adverse effect on our business, financial condition and results of operations.
Certain of our existing products, such as Eco Brass® and other potential “green portfolio” products, require separate production streams from those used for our other products in order to comply with applicable standards. As a result, in order to meet expected increased demand for such products, we will be required to make additional capital expenditures to modify or expand our facilities.
32
Table of Contents
In addition, if we introduce new products in the future, those products may also require modification or expansion of our production facilities. To accommodate any such production changes, we will be required to make additional capital expenditures to expand or modify our facilities. If we are unable to meet our capital expenditure requirements, we may not be able to timely respond to our customers’ needs and may lose their business to our competitors who may be better equipped to meet these needs, which could have a material adverse effect on our business, financial condition and results of operations.
The increased use of substitute materials and miniaturization may adversely affect our business.
In many applications, copper and other commodities may be replaced by other materials such as aluminum, stainless steel, plastic and other materials and the use of copper and other commodities may be reduced by the miniaturization of components. Increased prices of copper could encourage our customers to use substitute materials and/or miniaturization to limit the amount of copper in their products and applications in an attempt to control their overall product costs. For example, historically, there has been discussion over reducing or eliminating copper content in coins in reaction to the rising prices of copper. Such increased use of substitute materials and/or miniaturization could have a material adverse effect on prices and demand for our products.
In order to operate our business successfully, we must meet evolving customer requirements for copper and copper-alloy products and invest in the development of new products.
If we fail to develop or enhance our products to satisfy evolving customer demands, our business, operating results, financial condition and prospects may be harmed significantly. The market for copper and copper-alloy products is characterized by changing technologies, periodic new product introductions and evolving customer and industry standards. Eco Brass® and other products in our “green portfolio” are examples of new products based on new technologies that have been developed as a result of evolving customer and industry standards. Our competitors are continuously searching for more cost-effective alloys and substitutes for copper and copper-alloys, including products in our “green portfolio”. Our current and prospective customers may choose products that might be offered at a lower price than our products. To achieve market acceptance for our products, we must effectively and timely anticipate and adapt to customer requirements and offer products and services that meet customer demands. This strategy may cause us to pursue other technologies or capabilities through acquisitions or strategic alliances. We may experience design, engineering and other difficulties that could delay or prevent the development, introduction or marketing of new products and services. Our failure to successfully develop and offer products or services that satisfy customer requirements may significantly weaken demand for our products and services, which would likely cause a decrease in our net sales and harm our operating results. In addition, if our competitors introduce products and/or services based on new or alternative technologies, our existing and future products and/or services could become obsolete, which would also weaken demand for our products or services, thereby decreasing our net sales and harming our operating results.
If we fail to implement our business strategy, including our growth initiatives, our business, financial condition, results of operations or cash flows could be adversely affected.
Our future financial performance and success depend in large part on our ability to successfully implement our business strategy. We may not be able to successfully implement our business strategy or be able to continue improving our operating results. In particular, we may not be able to continue to achieve all operating cost savings, further enhance our product mix, expand into selected targeted regions or continue to mitigate our exposure to metal price fluctuations.
33
Table of Contents
The implementation of our business strategy may be affected by a number of factors beyond our control, such as increased competition, legal and regulatory developments, general economic conditions, the increase of operating costs or our ability to introduce new products and end-use applications. Any failure to successfully implement our business strategy could adversely affect our business, financial condition, results of operations or cash flows. We may, in addition, decide to alter or discontinue certain aspects of our business strategy at any time.
Furthermore, we may not be successful in our growth initiatives and may not be able to effectively manage expanded or acquired operations. See “—We face a number of risks related to future acquisitions and joint ventures”.
A portion of our net sales is derived from our international operations, which exposes us to certain risks inherent in doing business abroad.
In the aggregate, our international operations accounted for 6% of our net sales in 2012. We have operations in China through Olin Luotong Metals (GZ) Corporation (“Olin Luotong Metals”), an 80%-owned joint venture with Chinalco Luoyang Copper Co. Ltd. (“Chinalco”) in Singapore through our subsidiary, GBC Metals Asia Pacific PTE, and in Japan through our 50/50 joint venture with Dowa Holdings Co. Ltd (“Dowa”). We also have distribution arrangements in the United Kingdom and Germany. In addition, we have various licensing agreements around the world and our products are distributed globally. We plan to continue to explore opportunities to expand our international operations. Our international operations generally are subject to risks, including:
| • | changes in U.S. and international governmental regulations, trade restrictions and laws, including tax laws and regulations; |
| • | currency exchange rate fluctuations; |
| • | tariffs and other trade barriers; |
| • | the potential for nationalization of enterprises or government policies favoring local production; |
| • | interest rate fluctuations; |
| • | high rates of inflation; |
| • | currency restrictions and limitations on repatriation of profits; |
| • | differing protections for intellectual property and enforcement thereof; |
| • | divergent environmental laws and regulations; |
| • | political, economic and social instability; |
| • | unfamiliarity with foreign laws and regulations and ability to enforce obligations of foreign counterparties; |
| • | difficulties in staffing and managing international operations; |
| • | language and cultural barriers; |
| • | natural disasters and widespread illness; |
| • | geopolitical conditions, such as terrorist attacks, war, or other military action; and |
| • | a divergence between the price of copper on the copper exchange in China and the London Metal Exchange, or LME, and the Commodity Exchange, or COMEX. |
The occurrence of any of these events could cause our costs to rise, limit growth opportunities or have a negative effect on our operations and our ability to plan for future periods, and subject us to risks not generally prevalent in North America.
34
Table of Contents
New governmental regulations or legislation, or changes in existing regulations or legislation, may subject us to significant costs, taxes and restrictions on our operations.
Our operations are subject to a wide variety of U.S. Federal, state, local and non-U.S. laws and regulations, including those relating to taxation, international trade and competition and firearms.
For example, the Olin Brass segment provides strip and cups to both the military and commercial munitions markets. In the fiscal year ended December 31, 2012, the shipments by Olin Brass to the munitions end market accounted for 42% of its total shipments. The private use of firearms is subject to extensive regulation. Recent U.S. Federal legislative activities generally seek either to restrict or ban the sale and, in some cases, the ownership of various types of firearms. Several states currently have laws in effect similar to that legislation. Any restriction on the use of firearms could affect the demand for munitions, and in turn could negatively affect our business, financial condition or results of operations. Moreover, any changes in the government budget or policy over military spending may adversely affect our contracts with customers in the munitions end market.
Changes in U.S. or foreign tax laws, including possibly with retroactive effect, and audits by tax authorities could result in unanticipated increases in our tax expense and affect profitability and cash flows. For example, recent proposals to lower the U.S. corporate tax rate would require us to reduce our net deferred tax assets upon enactment of the related tax legislation, with a corresponding material, one-time increase to income tax expense, but our income tax expense and payments would be materially reduced in subsequent years. The cost of our inventories is primarily determined using the LIFO. Under the LIFO inventory valuation method, changes in the cost of raw materials and production activities are recognized in cost of sales in the current period. Generally in a period of rising prices, LIFO recognizes higher costs of goods sold, which both reduces current income and assigns a lower value to the year-end inventory. There have been legislative proposals to repeal the election to use the LIFO method for U.S. Federal income tax purposes. According to these proposals, taxpayers that currently use the LIFO method would be required to revalue their beginning LIFO inventory to its first-in, first-out (“FIFO”) value. As of March 31, 2013, if the FIFO method had been used instead of the LIFO method, our inventories would have been $141.8 million higher than the value reflected in our March 31, 2013 balance sheet. This increase in the carrying value of inventory would result in a one-time increase in taxable income of $89.0 million after taking into consideration total current differences in book-to-tax valuations of inventory. The repeal of the election to use the LIFO method could result in a substantial cash tax liability, which could adversely impact our liquidity and financial condition. Furthermore, a transition to the FIFO method could result in an increase in the volatility of our earnings, a greater disparity between our earnings and net sales in our financial statements, and an increase in the costs associated with our derivative transactions to mitigate metal price fluctuations.
In addition, any termination or expiration of trade restrictions imposed on copper products by foreign governments could adversely affect our business as such products become freely tradable into the U.S. This may increase competition against our products and adversely affect our business, financial condition or results of operations. See “—Competition from foreign manufacturers will increase if current anti-dumping orders expire and our sales volumes and profit margins could be adversely affected”.
We may not be able to sustain the annual cost savings realized as part of our recent cost- reduction initiatives.
Since our formation in 2007, we have undertaken, and will continue to undertake, productivity and cost-reduction initiatives intended to improve performance and improve operating cash flow. See “Management’s Discussion and Analysis of Financial Condition and Results of Operations—Financial Information, Acquisition, Business Transformation and Refinancing”. Although we believe that the cost savings we have realized through our efforts so far are permanent reductions, we may not be able to
35
Table of Contents
sustain some or all of these cost savings on an annual basis in the future, which could have an adverse effect on our business, financial condition, results of operations and cash flows. Moreover, there can be no assurance that any new initiatives undertaken in the future will be completed or beneficial to us or that any estimated cost savings from such activities will be realized.
Our operations expose our employees to risk of injury or death. We may be subject to claims that are not covered by, or exceed, our insurance. Additional safety measures or rules imposed by regulatory agencies may reduce productivity, require additional capital expenditure or reduce profitability.
Because of the manufacturing activities conducted at our facilities, there exists a risk of injury or death to our employees or other visitors, notwithstanding the safety precautions we take. Our operations are subject to regulation by Federal, state and local agencies responsible for employee health and safety, including the Occupational Safety and Health Administration, which has from time to time taken various actions with respect to our facilities, including imposing fines for certain isolated incidents. Despite policies and standards that are designed to minimize such risks, we may nevertheless be unable to avoid material liabilities for any employee death or injury that may occur in the future. These types of incidents may not be covered by or may exceed our insurance coverage and may have a material adverse effect on our results of operations and financial condition.
In addition, various regulatory agencies may impose additional safety measures or other rules designed to increase workplace safety. Compliance with such requirements could require additional capital expenditure or cause process changes that could reduce the productivity of the affected facilities, which could increase our costs and reduce our profitability.
Our ability to retain our senior management team is critical to the success of our business, and failure to do so could materially adversely affect our business, financial condition, results of operations and cash flows.
We are dependent on our senior management team to remain competitive in our industry. We have employment contracts or severance agreements with members of our senior management team, including John Walker, Robert Micchelli, John Wasz, Devin Denner and Daniel Becker. Failure to renew the employment contracts or other agreements of a significant portion of our senior management team could have a material adverse effect on our business, financial condition, results of operations and cash flows. Members of our senior management team are subject to employment conditions or arrangements that permit the employees to terminate their employment without notice. See “Compensation Discussion and Analysis—Employment Arrangements with Named Executive Officers”. We do not maintain any life insurance policies for our benefit covering our key employees.
If our senior management team were not able to dedicate adequate time to our business, due to personal or other factors, if we lose or suffer an extended interruption in the services of a significant portion of our senior management team, or if a significant portion of our senior management team were to terminate employment within a short period it could have a material adverse effect on our business, financial condition, results of operations and cash flows. In addition, the market for qualified individuals may be highly competitive and we may not be able to attract and retain qualified personnel to replace or succeed members of our senior management team, should the need arise.
Rising employee medical costs may adversely affect operating results.
The potential of rising employee medical costs are difficult to assess at this time. During the year ended December 31, 2012, our expenses related to employee health benefits were an aggregate of $15.9 million. Because the implementation of various laws regarding employee medical costs and health insurance, including the Patient Protection and Affordable Care Act of 2010 and other related
36
Table of Contents
regulations, is currently in progress, there is significant uncertainty as to how these current and future laws and regulations will affect our employee medical and other benefit costs. Therefore, we may incur significant increases in these costs that could reduce operating results.
Environmental costs could decrease our net cash flow and adversely affect our profitability.
Our operations are subject to extensive regulations governing the creation, use, transportation and disposal of wastes and hazardous substances, air and water emissions, remediation, workplace exposure and other environmental matters. The costs of complying with such laws and regulations, including participation in assessments and clean-ups of sites, as well as internal voluntary programs, can be significant and will continue to be so for the foreseeable future. Future environmental regulations could impose stricter compliance requirements on us and the end markets that we serve. Additional pollution control equipment, process changes, or other environmental control measures may be needed at some of our facilities to meet future requirements. Additionally, evolving regulatory standards and expectations could result in increased litigation and/or increased costs of compliance with environmental laws, all of which could have a material and adverse effect on our business, financial condition, results of operations and cash flows.
Environmental matters for which we may be liable may arise in the future at our present sites, at previously owned sites, sites previously operated by us, sites owned by our predecessors or sites that we may acquire in the future. Our operations or liquidity in a particular period could be affected by certain health, safety or environmental matters, including remediation costs and damages related to several sites. The properties we own or lease are located in areas with a history of heavy industrial use. See “Business—Government Regulation and Environmental Matters”. The Comprehensive Environmental Response, Compensation, and Liability Act, or CERCLA, established responsibility for clean-up without regard to fault for persons who have released or arranged for disposal of hazardous substances at sites that have become contaminated and for persons who own or operate contaminated facilities. In many cases, courts have imposed joint and several liability on parties at CERCLA clean-up sites. Because a number of our properties are located in or near industrial or light industrial use areas, they may have been contaminated by pollutants which may have migrated from neighboring facilities or have been released by prior occupants. Some of our properties have been affected by releases of cutting oils and similar materials, and we are investigating and remediating such known contamination pursuant to applicable environmental laws. The costs of these clean-ups have not been material in the past. We are not currently subject to any claims or notices with respect to clean-up or remediation under CERCLA or similar laws for contamination at our leased or owned properties or at any off-site location. However, we cannot rule out the possibility that we could be notified of such claims in the future. It is also possible that we could be identified by the Environmental Protection Agency, a state agency or one or more third parties as a potentially responsible party under CERCLA or under analogous state laws.
On November 19, 2007, we acquired the assets and operations relating to the worldwide metals business of Olin Corporation. Olin Corporation agreed to retain liability arising out of then existing conditions on certain of our properties for any remedial actions required by environmental laws, and agreed to indemnify us for all or part of a number of other environmental liabilities. Since 2007, Olin Corporation has been performing remedial actions at the facilities in East Alton, Illinois and Waterbury, Connecticut, and has been participating in remedial actions at our other properties as well. If Olin Corporation were to stop its environmental remedial activities at our properties, we could be required to assume responsibility for these activities, the cost of which could be material. For additional information concerning the indemnity granted to us by Olin Corporation for environmental liabilities, see “Business—Government Regulation and Environmental Matters”.
37
Table of Contents
New governmental regulation of greenhouse gas emissions may subject us to significant new costs and restrictions on our operations.
Recently, Congress has considered legislation that would regulate greenhouse gas emissions through a cap-and-trade system under which emitters would be required to buy allowances to offset emissions of greenhouse gas. In addition, several states, including states where we have manufacturing plants, are considering various greenhouse gas registration and reduction programs. The EPA has also proposed several comprehensive regulations that would require reductions in greenhouse gas emissions by several types of sources. Certain of our manufacturing plants use significant amounts of energy, including electricity and natural gas, and certain of our plants emit amounts of greenhouse gas above certain minimum thresholds that are likely to be regulated. Greenhouse gas regulation could increase the price of the electricity we purchase, increase costs for our use of natural gas, potentially restrict access to, or the use of, natural gas, require us to purchase allowances to offset our own emissions, require operational changes or the use of new equipment or result in an overall increase in our costs of raw materials, any one of which could significantly increase our costs or capital expenditures, reduce our competitiveness or otherwise negatively affect our business, financial condition or results of operations. While future greenhouse gas regulation appears likely, it is too early to predict how this regulation may affect us.
We may be subject to litigation that could strain our resources and distract management.
From time to time, we are involved in a variety of claims, lawsuits and other disputes arising in the ordinary course of business. These suits concern issues including product liability, contract disputes, employee-related matters and personal injury matters. It is not feasible to predict the outcome of all pending suits and claims, and the ultimate resolution of these matters as well as future lawsuits could have a material adverse effect on our business, financial condition, results of operations, cash flows or reputation.
We may face product liability claims that are costly and create adverse publicity.
If any of the products that we sell cause harm to any of our customers, we could be exposed to product liability lawsuits. If we were found liable under product liability claims, we could be required to pay substantial monetary damages and see a decrease in demand for our products. Further, even if we successfully defended ourselves against this type of claim, we could be forced to spend a substantial amount of money in litigation expenses, our management could be required to spend time and resources to defend against these claims, we could face negative publicity or our reputation could otherwise suffer, any of which could result in a decrease in demand for our products or otherwise harm our business.
New derivatives legislation could have an adverse impact on our ability to use derivative contracts to manage risks associated with our business and on the cost of our derivative contracts.
We use over-the-counter, or OTC, derivatives products to manage our metal commodity price risks and our interest rate risks. Recent legislation adopted by Congress increases regulatory oversight of OTC derivatives markets and imposes restrictions on certain derivative transactions, which could affect the use of derivatives in hedging transactions. Final regulations defining the scope of this legislation and the extent to which different types of market participants will be subject to the legislation have not yet been adopted. If final regulations subject us to heightened capital or margin requirements or otherwise increase our costs, directly or indirectly through costs passed on to us by our trading counterparties, of entering into OTC derivatives transactions, they could have an adverse effect on our ability to hedge risks associated with our business and on the cost of maintaining our derivative contracts.
38
Table of Contents
We have had material weaknesses in the past. If we fail to establish and maintain effective internal control over financial reporting, our ability to accurately report our financial results could be adversely affected.
As a public company, we will be required to comply with the standards adopted by the Public Company Accounting Oversight Board in compliance with the requirements of Section 404 of the Sarbanes-Oxley Act of 2002, as amended, regarding internal control over financial reporting. Prior to becoming a public company, we have not been required to comply with the requirements of Section 404. We will not be required to make our first annual assessment of our internal control over financial reporting pursuant to Section 404 until the year following our first annual report required to be filed with the SEC. Further, our independent registered public accounting firm is not yet required to formally attest to the effectiveness of our internal control over financial reporting until the year following our first annual report required to be filed with the SEC. Once it is required to do so, our independent registered public accounting firm may issue an adverse report in the event that they conclude that our internal control over financial reporting is not effective.
The process of becoming compliant with Section 404 may divert internal resources and will take a significant amount of time and effort to complete. We may experience higher than anticipated operating expenses, as well as increased independent registered public accounting firm fees during the implementation of these changes and thereafter. Completing documentation of our internal control system and financial processes, remediation of control deficiencies and management testing of internal controls will require substantial effort by us. While we have begun the process of evaluating our internal control over financial reporting, we may not be able to complete our review until after this offering is completed.
In connection with the 2011 and 2010 audits of our financial statements, we and our independent auditor identified four material weaknesses in our internal control over financial reporting. A material weakness is a deficiency, or combination of deficiencies, in internal control over financial reporting, such that there is a reasonable possibility that a material misstatement of the annual or interim financial statements will not be prevented or detected on a timely basis. These material weaknesses related to our accounting for joint ventures, income tax matters, physical inventory quantity record keeping, and allowance for doubtful accounts. The material weaknesses related to our accounting for joint ventures, income tax matters, and physical inventory quantity record keeping were remediated as of December 31, 2011. The material weakness related to our allowance for doubtful accounts was remediated as of December 31, 2012.
We have begun the process of evaluating our internal control over financial reporting. We cannot predict the outcome of our review at this time. During the course of the review, we may identify additional control deficiencies, which could give rise to other material weaknesses in addition to those previously identified. We may also find that our previous and planned remediation measures have not been successful to the extent we expected, if at all. As a result, our ability to report our financial results on a timely and accurate basis may be adversely affected, we may be subject to sanctions or investigations by regulatory authorities, and investors may lose confidence in our financial information, which in turn could adversely affect the market price of Global Brass and Copper Holdings’ common stock.
You should not place undue reliance on the summary financial and other information of our predecessor as of November 18, 2007 and for the period from January 1, 2007 to November 18, 2007, which are summarized in this prospectus.
The summary financial and other information of our predecessor as of November 18, 2007 and for the period from January 1, 2007 to November 18, 2007 has been derived from books and records that were provided to us by Olin Corporation in the acquisition of the worldwide metals business of Olin
39
Table of Contents
Corporation and has not been subject to a review or audit by us or any independent registered public accounting firm. There is a risk that this unaudited financial information may contain errors that might have been detected in a review or audit process or might have been different if prepared in accordance with our policies and procedures instead of those of Olin Corporation. Therefore, all of the predecessor financial information contained in this prospectus may not be reflective of our predecessor’s true historical financial information as of the dates presented and for the periods presented. Any differences between the financial information presented as of such dates and for the periods presented in this prospectus and the relevant actual historical financial information may be material.
In addition, the summary financial and other information of our predecessor for the period from January 1, 2007 to November 18, 2007 and as of November 18, 2007 was prepared using an accounting basis that is different from that used to prepare the successor’s consolidated financial statements. The predecessor financial and other information for the period from January 1, 2007 to November 18, 2007 do not reflect the application of purchase accounting for our November 19, 2007 acquisition of the worldwide metals business from Olin Corporation, and such information for the period from January 1, 2007 to November 18, 2007 also does not reflect the allocation of Olin Corporation selling, general and administrative expenses to the metals business unit. We have only limited knowledge regarding the predecessor financial information, including the accounting policies under which the predecessor financial information was prepared. As is customary in such circumstances, we relied on contractual representations, warranties and indemnities of Olin Corporation, as seller, relating to the predecessor financial information. Based on these representations and warranties, we believe that the predecessor financial information was prepared on a GAAP basis and consistent with Olin Corporation’s accounting policies and procedures, but do not have access to records or personnel of Olin Corporation that would confirm this or provide the basis for any greater detail about the accounting basis used to prepare the predecessor financial information. Such information may not be comparable to the successor’s consolidated financial statements. Accordingly, you are cautioned not to place undue reliance on the summary financial and other information of our predecessor included in this prospectus.
Increasing costs of insurance may adversely impact our results of operations.
While we are insured against certain claims, including in respect of general liability, property damage (including natural disasters and fire), equipment damage and injury to our personnel, our insurance may not cover all of the claims to which we may become subject, and future coverage of such claims may not be available on commercially reasonable terms, if at all. If we are unable to obtain adequate insurance coverage, substantial property or equipment damage, personal injury or other claims could materially impact our earnings and cash flows. Continued increases in insurance costs, additional coverage restrictions or unavailability of certain insurance products and other factors could increase our operating costs and further increase our exposure to natural disasters and other causes of catastrophic loss, as well as personal injury and other claims.
Failure to protect, or uncertainty regarding the validity, enforceability or scope of, our intellectual property rights could impair our competitive position.
Our products are covered by a variety of proprietary rights that are important to our competitive position and success. Because the intellectual property associated with our products, including Eco Brass® technology is evolving and rapidly changing, our current intellectual property rights may not protect us adequately. We rely on a combination of patents, trademarks, trade secrets and other intellectual property rights, in addition to contractual rights, to protect the intellectual property we use in our business. However, it is possible that our intellectual property rights could be challenged, invalidated or violated. Our pending patent applications may not be granted or, if granted, the resulting patent may be challenged or invalidated by our competitors or by other third parties. Despite our efforts
40
Table of Contents
to protect our proprietary rights, third parties may attempt to copy or otherwise obtain and use our intellectual property without our authorization. In addition, monitoring unauthorized use of our intellectual property is difficult, and we cannot be certain the steps we take to protect our intellectual property will prevent infringement or identify all unauthorized users of our intellectual property.
Because the extent to which any new technologies will enjoy intellectual property protection is uncertain, there can be no assurance that we will be able to maintain our competitive position by enforcing intellectual property rights in the future. Furthermore, our competitors independently may develop similar or improved technologies that limit the value of our intellectual property or design around patents issued to us. If competitors or third parties are able to use our intellectual property or are able to successfully challenge, circumvent, invalidate or render unenforceable our intellectual property, we likely would lose a significant portion of our competitive advantage in the market for products covered by such intellectual property. We may not be successful in securing or maintaining proprietary or patent protection for the technology used in our products and services, and protection that is secured may be challenged and possibly lost. We may have to prosecute unauthorized uses of our intellectual property and the expense, time, delay and burden on management of such litigation could prevent us from maintaining or increasing our business. Our inability to protect our intellectual property adequately for these and other reasons could result in weakened demand for our products and services, which could result in a material adverse effect on our business, financial condition, results of operations or cash flows.
In addition, we have entered into agreements with Mitsubishi Shindoh pursuant to which we have access to and the right to use certain of its technologies. To the extent that Mitsubishi Shindoh faces challenges to its intellectual property rights in its technologies or fails to protect or enforce such intellectual property rights, it could have an adverse effect on our ability to market our products and/or services that incorporate those technologies or could permit competitors using infringing or similar technology to compete more effectively against us, which would result in a decline in our net sales.
We could become subject to litigation regarding intellectual property rights, which could harm our business significantly.
Our commercial success will continue to depend in part on our ability to make and sell our products or provide our services without infringing the patents or proprietary rights of third parties. We face these risks with respect to intellectual property that we have developed internally, as well as with respect to intellectual property rights we have acquired from third parties. For example, pursuant to a license agreement, we have access to and the right to use certain technologies owned by Mitsubishi Shindoh. To the extent that Mitsubishi Shindoh has failed to adequately protect the technologies upon which we rely or if these technologies infringe upon the patents or proprietary rights of third parties, we may be unable to continue using such technologies or we may face lawsuits related to our past use of these technologies. In addition, our competitors, who have made significant investments in competing technologies or products, may seek to apply for and obtain patents that will prevent, limit or interfere with our ability to make or sell our products or provide our services.
If we are unsuccessful in defending against any challenge to our rights to market and sell our products, our rights to use third-party technologies or to provide our services, we may, among other things, be required to:
| • | pay actual damages, royalties, lost profits and/or increased damages and the third party’s attorneys’ fees, which may be substantial; |
| • | cease the development, manufacture and/or marketing of our products or services that use the intellectual property in question through a court-imposed injunction or settlement agreement; |
41
Table of Contents
| • | expend significant resources to modify or redesign our products or other technology or services so that they do not infringe the intellectual property rights of others or to develop or acquire non-infringing technology, which may not be possible; or |
| • | obtain licenses to the disputed rights, which could require us to pay substantial upfront fees and future royalty payments and may not be available to us on acceptable terms, if at all. |
Even if we successfully defend any infringement claims, the expense, time, delay and burden on management of litigation could prevent us from maintaining or increasing our business. Further, negative publicity could decrease demand for our products and services and cause our revenues to decline, thus harming our operating results significantly.
If we are unable to protect the confidentiality of our proprietary information and know-how, the value of our technology, products and services could be harmed significantly.
We rely on trade secrets, know-how and other proprietary information in operating our business. We seek to protect this information, in part, through the use of confidentiality agreements with employees, consultants, advisors and others who may have access to such proprietary information upon commencement of their relationships with us. These agreements require that all confidential information developed by the individual or made known to the individual by us during the course of the individual’s relationship with us be kept confidential and not disclosed to third parties. Our agreements with employees also provide that any inventions conceived by the individual in the course of rendering services to us are our exclusive property. Nonetheless, those agreements may not provide adequate protection for our trade secrets, know-how or other proprietary information and prevent their unauthorized use or disclosure. In the event of unauthorized use or disclosure of our trade secrets or proprietary information, these agreements may not provide meaningful protection, particularly for our trade secrets or other confidential information.
To the extent that consultants, key employees or other third parties apply technological information independently developed by them or by others to our proposed products, disputes may arise as to the proprietary rights to such information, which may not be resolved in our favor. The risk that other parties may breach confidentiality agreements or that our trade secrets become known or independently discovered by competitors, could harm us by enabling our competitors, who may have greater experience and financial resources, to copy or use our trade secrets and other proprietary information in the advancement of their products, methods or technologies. The disclosure of our trade secrets would impair our competitive position, thereby weakening demand for our products or services and harming our ability to maintain or increase our customer base.
In addition, to the extent that we do not fulfill our contractual or other obligations to adequately protect the technologies to which we have been granted access by Mitsubishi Shindoh, we could be liable for any resulting harm to its business or could lose further access to this technology, which could harm our business, operating results or financial condition.
Disruption or failures of our information technology systems could have a material adverse effect on our business.
Our information technology systems have not been updated for many years. As a result, our information technology systems are more susceptible to security breaches, operational data loss, general disruptions in functionality, and may not be compatible with new technology. We depend on our information technology systems for the effectiveness of our operations and to interface with our customers, as well as to maintain financial records and accuracy. Disruption or failures of our information technology systems could impair our ability to effectively and timely provide our services and products and maintain our financial records, which could damage our reputation and have a material adverse effect on our business.
42
Table of Contents
Our liquidity, financial condition and ability to operate our business could be adversely affected by the failure of financial institutions to fulfill their commitments under committed credit facilities.
The ABL Facility is an asset-based revolving loan facility with a maximum availability of $200.0 million, subject to a borrowing base calculation. We may request an increase in the maximum commitments, at our option and under certain circumstances, of up to $50.0 million (but the lenders are not obligated to grant such an increase). If one or more of the financial institutions that are lenders under the ABL Facility were to default on its obligations to provide available borrowings under the ABL Facility, such a default could have a material adverse effect on our liquidity, and we might not be able to fulfill our cash needs using other sources, which could have a material and adverse effect on our financial condition and ability to operate our business.
Global Brass and Copper Holdings is a holding company and relies on future dividends and other payments, advances and transfers of funds from its subsidiaries to meet its financial obligations and provide cash for any dividends it might pay in the future.
Global Brass and Copper Holdings has no direct operations and derives all of its cash flow from its subsidiaries. Because Global Brass and Copper Holdings conducts its operations through its subsidiaries, Global Brass and Copper Holdings depends on those entities for dividends and other payments to generate the funds necessary to meet its financial obligations, and to pay any dividends with respect to its common stock. Legal and contractual restrictions in the credit agreement governing the ABL Facility, the indenture governing the Senior Secured Notes and other debt agreements governing current and future indebtedness of Global Brass and Copper Holdings’ subsidiaries, as well as the financial condition and operating requirements of Global Brass and Copper Holdings’ subsidiaries, may limit the ability of Global Brass and Copper Holdings to obtain cash from its subsidiaries. The earnings from, or other available assets of, Global Brass and Copper Holdings’ subsidiaries may not be sufficient to pay dividends or make distributions or loans to enable Global Brass and Copper Holdings to pay any dividends on our common stock. See “Risks Related to an Investment in our Common Stock and this Offering—Our ability to pay regular dividends to our shareholders is subject to the discretion of our Board of Directors and may be limited by our debt agreements and limitations in Delaware law.”
We face a number of risks related to future acquisitions and joint ventures.
We have made investments to expand and streamline our business, including our acquisition in January 2008 of the North American order book, customer list and certain other assets of Bolton Metal Products Company. We will continue to seek opportunities for further acquisitions to supplement our operations and for expansion of our international presence, particularly in Asia, through joint ventures.
Acquisitions and joint ventures involve a number of risks which could have an adverse effect on our business, financial condition, results of operations and cash flows, including the following:
| • | we may experience adverse short-term effects on our operating results; |
| • | we may be unable to successfully and rapidly integrate the new businesses, personnel and products with our existing business, including financial reporting, management and information technology systems; |
| • | we may experience higher than anticipated costs of integration and unforeseen operating difficulties and expenditures, including potential disruption of our ongoing business and distraction of management; |
| • | an acquisition may be in a market or geographical area in which we have little experience and could increase the scope, geographic diversity and complexity of our operations; |
43
Table of Contents
| • | the acquisition or joint venture formation process may require significant attention by our senior management and the engagement of outside advisors (and the payment of related fees), and proposed acquisitions and joint ventures may not be successfully completed; |
| • | we may lose key employees or customers of the acquired company; and |
| • | we may encounter unknown contingent liabilities that could be material. |
In addition, we may require additional debt or equity financing for future acquisitions, and such financing may not be available on favorable terms, if available at all. We may not be able to successfully integrate or profitably operate any new business we acquire, and we cannot assure you that any such acquisition will meet our expectations. The process of integrating acquired operations into our existing operations may result in unforeseen operating difficulties and may require significant financial resources that would otherwise be available for the ongoing development or expansion of existing operations. Finally, in the event we decide to discontinue pursuit of a potential acquisition, we will be required to immediately expense all costs incurred in pursuit of the possible acquisition, which may have an adverse effect on our results of operations in the period in which the expense is recognized.
Risks Related to an Investment in Our Common Stock and this Offering
Our controlling stockholder may have interests that conflict with the interests of other stockholders.
Halkos will own 55.6% of our common stock (48.9% if the underwriters’ option to purchase additional shares is exercised in full) after this initial public offering. Through Halkos, KPS will have the ability to elect substantially all of the members of the board of directors of Global Brass and Copper Holdings (the “Board of Directors”) and make decisions relating to fundamental corporate actions. The directors generally will have the authority to make decisions affecting our capital structure, including the issuance of additional shares of stock, additional debt and declaration of dividends, will be able to select our management team, determine our corporate and management policies and authorize or prevent transactions that require approval of the Board of Directors or majority of stockholders of Global Brass and Copper Holdings, such as joint ventures or acquisitions, subject to certain restrictions as set forth in the agreement governing the ABL Facility or the indenture governing the Senior Secured Notes or future credit facilities. These decisions could enhance KPS’s equity investment while involving risks to the interests of other stockholders. In addition, KPS has engaged, and may in the future continue to engage, in transactions with us. See “Certain Relationships and Related Party Transactions”.
We may be a “controlled company” within the meaning of the NYSE’s corporate governance rules, after giving effect to this offering. If we are a controlled company, we will qualify for, and intend to rely on, exemptions from certain NYSE corporate governance requirements. As a result, holders of our common stock may not have the same degree of protection as that afforded to stockholders of companies that are subject to all of the NYSE’s corporate governance requirements.
Following this offering, we may be a “controlled company” within the meaning of the NYSE’s corporate governance rules as a result of the ownership position and voting rights of KPS, through Halkos, upon completion of this offering. A “controlled company” is a company of which more than 50% of the voting power is held by an individual, group or another company. More than 50% of our voting power may be held by KPS, through Halkos, after completion of this offering. Halkos will own 55.6% of our common stock if the underwriters do not exercise their option to purchase additional shares in full and 48.9% if the underwriters exercise such option in full. As a controlled company we may elect not to
44
Table of Contents
comply with certain NYSE corporate governance rules that would otherwise require the Board of Directors to have a majority of independent directors and our compensation and nominating and governance committees to be comprised entirely of independent directors, have written charters addressing such committee’s purpose and responsibilities and perform an annual evaluation of such committee. Accordingly, holders of our common stock may not have the same protection afforded to stockholders of companies that are subject to all of the NYSE corporate governance requirements and the ability of our independent directors to influence our business policies and affairs may be reduced. If we do not qualify for the controlled company exemption, we will comply with the NYSE corporate governance rule requirements within the applicable phase-in periods for companies completing initial public offerings.
Our directors who have relationships with KPS may have conflicts of interest with respect to matters involving our company.
Following this offering, five of our eight non-executive directors will be affiliated with KPS (though if we do not qualify for the controlled company exemption, we will comply with the NYSE corporate governance rule requirements applicable to director independence within the applicable phase-in periods for companies completing initial public offerings). Our KPS-affiliated directors have fiduciary duties to Global Brass and Copper Holdings and in addition will have duties to KPS. In addition, our amended and restated certificate of incorporation will provide that no officer or director of us who is also an officer, director, employee or other affiliate of KPS or an officer, director or employee of an affiliate of KPS will be liable to us or our stockholders for breach of any fiduciary duty by reason of the fact that any such individual directs a corporate opportunity to KPS or its affiliates instead of us, or does not communicate information regarding a corporate opportunity to us that such person or affiliate has directed to KPS or its affiliates. As a result, such circumstances may entail real or apparent conflicts of interest with respect to matters affecting both us and KPS, whose interests, in some circumstances, may be adverse to ours. In addition, as a result of KPS’ indirect ownership interest, conflicts of interest could arise with respect to transactions involving business dealings between us and KPS or its affiliates, including potential business transactions, potential acquisitions of businesses or properties, the issuance of additional securities, the payment of dividends by us and other matters.
There has been no prior public market for our common stock, and the trading price of our common stock may be adversely affected if an active trading market in our common stock does not develop. Our stock price may be volatile, and you may be unable to resell your shares at or above the offering price or at all.
Prior to this offering, there has been no public market for our common stock, and an active trading market may not develop or be sustained upon the completion of this offering. We cannot predict the extent to which investor interest will lead to the development of an active trading market in shares of our common stock or whether such a market will be sustained. The initial public offering price of our common stock offered in this prospectus will be determined through our negotiations with the underwriters and may not be indicative of the market price of the common stock after this offering. See “Underwriting”. The market price of our common stock after this offering will be subject to significant fluctuations in response to, among other factors, variations in our operating results and market conditions specific to our industry. If an active public market does not develop or is not sustained, it may be difficult for you to sell your shares at a price that is attractive to you, or at all.
The price of our common stock may fluctuate significantly and you could lose all or part of your investment.
Our stock price may be volatile. Volatility in the market price of our common stock may prevent you from being able to sell your common stock at or above the price you paid for your common stock. The market price for our common stock could fluctuate for various reasons, including:
| • | our operating and financial performance and prospects; |
45
Table of Contents
| • | the price outlook for copper and copper-alloys; |
| • | our quarterly or annual earnings or those of other companies in our or other industries; |
| • | conditions that impact demand for our products and services; |
| • | future announcements concerning our business or our competitors’ businesses; |
| • | our results of operations that vary from those of our competitors; |
| • | shrinkage from our processing operations; |
| • | the public’s reaction to our press releases, other public announcements and filings with the Securities and Exchange Commission; |
| • | changes in earnings estimates or recommendations by securities analysts who track our common stock; |
| • | market and industry perception of our success, or lack thereof, in pursuing our growth strategy; |
| • | general market, economic and political conditions; |
| • | strategic actions by us or our competitors, such as acquisitions or restructurings; |
| • | changes in government and environmental regulation; |
| • | changes in accounting standards, policies, guidance, interpretations or principles; |
| • | arrival and departure of key personnel; |
| • | the number of shares to be publicly traded after this offering; |
| • | sales of common stock by us, Halkos, members of our management team or other holders; |
| • | adverse resolution of new or pending litigation against us; |
| • | any announcements by third parties of significant claims or proceedings against us; |
| • | changes in general market, economic and political conditions and their effects on global economies or financial markets, including those resulting from natural disasters, terrorist attacks, acts of war, widespread illness and responses to such events; or |
| • | any material weakness in our internal control over financial reporting. |
See “—Risks Related to Our Business”. These and other factors may lower the market price of our common stock, regardless of our actual operating performance. As a result, our common stock may trade at prices significantly below the public offering price.
Furthermore, in recent years the stock market has experienced significant price and volume fluctuations. This volatility has had a significant impact on the market price of securities issued by many companies, including companies in our industry. The changes frequently appear to occur without regard to the operating performance of the affected companies. Hence, the price of our common stock could fluctuate based upon factors that have little or nothing to do with us, and these fluctuations could materially reduce our share price and materially affect the value of your investment.
Future sales of shares of our common stock in the public market could cause our stock price to fall significantly even if our business is profitable.
Upon the completion of this offering, and after giving effect to the planned 211,100-to-1 stock split to be effected after the effective date of this registration statement and prior to the completion of this offering, we will have 21,110,000 outstanding shares of common stock. Of these shares, the shares of common stock offered in this prospectus will be freely tradable without restriction in the public market, unless purchased by our affiliates. We expect that the remaining outstanding shares of our common stock will become available for resale in the public market as shown in the chart below. Our officers,
46
Table of Contents
directors, Halkos and the holders of substantially all of our outstanding shares of common stock have signed lock-up agreements pursuant to which they have agreed not to sell, transfer or otherwise dispose of any of their shares for 180 days after the date of this prospectus, subject to specified exceptions. The underwriters may, in their sole discretion and without notice, release the restrictions on all or any portion of the common stock subject to lock-up agreements. The underwriters are entitled to waive the lock-up provisions at their discretion prior to the expiration dates of such lock-up agreements.
Immediately following the completion of this offering, and after giving effect to the planned 211,100-to-1 stock split to be effected after the effective date of this registration statement and prior to the completion of this offering, shares of our common stock will become available for resale in the public market as follows (assuming the underwriters exercise their option to purchase additional shares in full):
| Number of Shares |
Percentage | Date of Availability for Resale into the Public Market | ||||||
| 10,781,000 | 51.1 | % | Upon effectiveness of this prospectus and after giving effect to the planned 211,100-to-1 stock split to be effected after the effective date of this registration statement and prior to the completion of this offering | |||||
| 10,329,000 | 48.9 | % | 180 days after the date of this prospectus, of which all shares are subject to volume and other restrictions under Rule 144 | |||||
As restrictions on resale end, the market price of our common stock could drop significantly if the holders of these restricted shares sell them or are perceived by the market as intending to sell them. These factors could also make it more difficult for us to raise additional funds through future offerings of our common stock or other securities. Following this offering, we intend to file a registration statement under the Securities Act of 1933, registering shares of our common stock reserved for issuance under our 2013 Plan, and we will enter into an investor rights agreement under which we will grant demand, shelf and piggyback registration rights to KPS and certain members of management. See “Shares Eligible for Future Sale” for a more detailed description of the shares that will be available for future sale upon completion of this offering.
We may issue shares of our common stock or other securities from time to time as consideration for future acquisitions or investments. If any such acquisition or investment is significant, the number of shares of our common stock, or the number or aggregate principal amount, as the case may be, of other securities that we may issue may in turn be substantial. We may also grant registration rights covering those shares of our common stock or other securities in connection with any such acquisitions or investments.
We cannot predict the size of future issuance of our common stock or the effect, if any, that future issuances and sales of our common stock will have on the market price of our common stock. Sales of substantial amounts of our common stock (including shares of our common stock issued in connection with an acquisition or investment), or the perception that such sales could occur, may adversely affect prevailing market prices for our common stock.
Our ability to pay regular dividends to our shareholders is subject to the discretion of our Board of Directors and may be limited by our debt agreements and limitations in Delaware law.
Following the completion of this offering, we intend to pay dividends to our shareholders on a quarterly basis, beginning in the fourth quarter of 2013. However, any determination to pay dividends will be at the discretion of the Board of Directors and will be dependent on then-existing conditions, including our financial condition, earnings, legal requirements including limitations in Delaware law, restrictions in our debt agreements, including those governing the ABL Facility and the Senior Secured Notes, that limit our ability to pay dividends to stockholders and other factors the Board of Directors
47
Table of Contents
deems relevant. The Board of Directors may, in its sole discretion, change the amount or frequency of dividends or discontinue the payment of dividends entirely. At this time, the agreement governing the ABL Facility and the indenture governing the Senior Secured Notes generally restrict or limit the payment of dividends to shareholders. The indenture governing the Senior Secured Notes includes a “restricted payments” basket based on Consolidated Net Income (as defined in the indenture). It increases based on 50% of Consolidated Net Income (as so defined) and decreases by 100% of Consolidated Net Loss (as so defined). The basket may be negative or insufficient to pay dividends. See “Dividend Policy”, “Description of Certain Indebtedness” and “Description of Capital Stock—Capital Stock—Common Stock”. For the foregoing reasons, you will not be able to rely on dividends to receive a return on your investment. Accordingly, if you purchase shares in this offering, realization of a gain on your investment may depend on the appreciation of the price of our common stock, which may never occur.
Provisions in our charter and bylaws and provisions of Delaware law may delay or prevent our acquisition by a third party, which might diminish the value of our common stock.
The amended and restated certificate of incorporation and amended and restated bylaws of Global Brass and Copper Holdings, which we intend to adopt prior to the completion of this offering, will contain several provisions that may make it more difficult or expensive for a third party to acquire control of us without the approval of the Board of Directors. These provisions also may delay, prevent or deter a merger, acquisition, tender offer, proxy contest or other transaction that might otherwise result in our stockholders receiving a premium over the market price for their common stock. The provisions include, among others:
| • | a prohibition on actions by written consent of the stockholders; |
| • | a classified board consisting of three classes; |
| • | removal of directors only for cause; |
| • | vacancies on the Board of Directors may be filled only by the Board of Directors; |
| • | no cumulative voting; |
| • | advance notice requirements for stockholder proposals and director nominations; and |
| • | supermajority approval requirement for an amendment of the amended and restated certificate of incorporation or amended and restated bylaws. |
Section 203 of the Delaware General Corporation Law may affect the ability of an “interested stockholder” to engage in certain business combinations, including mergers, consolidations or acquisitions of additional shares, for a period of three years following the time that the stockholder becomes an “interested stockholder.” An “interested stockholder” is defined to include persons owning directly or indirectly 15% or more of the outstanding voting stock of a corporation. Global Brass and Copper Holdings has elected in its amended and restated certificate of incorporation not to be subject to Section 203 of the Delaware General Corporation Law. Nevertheless, the amended and restated certificate of incorporation will contain provisions that have the same effect as Section 203 of the Delaware General Corporation Law, except that they provide that KPS, investment funds affiliated with KPS and their respective successors and affiliates (and transferees of any of them) will not be deemed to be “interested stockholders,” regardless of the percentage of voting stock of Global Brass and Copper Holdings owned by them, and accordingly will not be subject to such restrictions.
For more information, see “Description of Capital Stock”. The provisions of the amended and restated certificate of incorporation and amended and restated bylaws of Global Brass and Copper Holdings, the significant common stock ownership of Halkos and the ability of the Board of Directors to
48
Table of Contents
create and issue a new series of preferred stock or implement a stockholder rights plan could discourage potential takeover attempts and reduce the price that investors might be willing to pay for shares of our common stock in the future, which could reduce the market price of our common stock.
If securities analysts do not publish research or reports about our company, or if they issue unfavorable commentary about us or our industry or downgrade our common stock, the price of our common stock could decline.
The trading market for our common stock will depend in part on the research and reports that third-party securities analysts publish about our company and our industry. One or more analysts could downgrade our common stock or issue other negative commentary about our company or our industry. In addition, we may be unable or slow to attract research coverage. Alternatively, if one or more of these analysts cease coverage of our company, we could lose visibility in the market. As a result of one or more of these factors, the trading price of our common stock could decline.
The requirements of being a public company may strain our resources, divert management’s attention and affect our ability to attract and retain qualified board members.
As a public company, we will incur significant legal, accounting and other expenses that we have not incurred as a private company, including costs associated with public company reporting requirements. We also have incurred and will incur costs associated with the Sarbanes-Oxley Act, the Dodd-Frank Wall Street Reform and Consumer Protection Act and related rules implemented or to be implemented by the SEC and the NYSE. The expenses incurred by public companies generally for reporting and corporate governance purposes have been increasing and the costs we incur for such purposes may strain our resources. We expect these rules and regulations to increase our legal and financial compliance costs, divert management’s attention to ensuring compliance and to make some activities more time-consuming and costly, although we are currently unable to estimate these costs with any degree of certainty. We have hired a number of people to assist with the enhanced requirements of being a public company but still need to hire more people for that purpose. In addition, these laws and regulations could make it more difficult or costly for us to obtain certain types of insurance, including director and officer liability insurance, and we may be forced to accept reduced policy limits and coverage or incur substantially higher costs to obtain the same or similar coverage. In addition, these laws and regulations could make it more difficult for us to attract and retain qualified persons to serve on the Board of Directors, its board committees or as its executive officers and may divert management’s attention. Furthermore, if Global Brass and Copper Holdings is unable to satisfy its obligations as a public company, we could be subject to delisting of our common stock, fines, sanctions and other regulatory action.
Any issuance of preferred stock could make it difficult for another company to acquire us or could otherwise adversely affect holders of our common stock, which could depress the price of our common stock.
The Board of Directors has the authority to issue preferred stock and to determine the preferences, limitations and relative rights of shares of preferred stock and to fix the number of shares constituting any series and the designation of such series, without any further vote or action by its stockholders. Such preferred stock could be issued with voting, liquidation, dividend and other rights superior to the rights of common stock. The potential issuance of preferred stock may delay or prevent a change in control of Global Brass and Copper Holdings, discouraging bids for our common stock at a premium over the market price, and adversely affect the market price and the voting and other rights of the holders of our common stock.
49
Table of Contents
We may recognize substantial non-cash compensation charges, and such charges could have a negative impact on our reported net income, earnings per share and the trading price of Global Brass and Copper Holdings common stock.
As of March 31, 2013, Halkos owned 100% of the common stock of Global Brass and Copper Holdings. Halkos has granted non-voting membership interests to select members of our management in the form of Profits Interest Shares. The Profits Interest Shares represent the right of the holder to share in distributions from Halkos after KPS has received certain returns on its investment. See “Compensation Discussion and Analysis—Equity-Based Compensation—Profits Interest Shares.” The Profits Interest Shares are accounted for as a profit-sharing arrangement under the relevant accounting guidance. Expense on the Profits Interest Shares is recorded in the period in which distributions from Halkos to holders of Profits Interest Shares are determined to be probable. We account for these distributions as non-cash compensation expense, with a corresponding increase in additional paid-in capital.
During the years ended December 31, 2012 and 2011, we recorded non-cash compensation charges of $19.5 million and $0.9 million, respectively, as a component of selling, general and administrative expenses in our consolidated statements of operations. Distributions to the holders of Profits Interest Shares are expected to be made by Halkos in future periods (including in connection with this offering), which will result in additional non-cash compensation charges being recorded by us. Any such charges will have a negative impact on our reported net income and earnings per share and may therefore have a negative effect on the trading price of the common stock of Global Brass and Copper Holdings.
50
Table of Contents
CAUTIONARY STATEMENT CONCERNING FORWARD-LOOKING STATEMENTS
This prospectus contains “forward-looking statements” that involve risks and uncertainties. You can identify forward-looking statements because they contain words such as “believes”, “expects”, “projects”, “may”, “would”, “should”, “seeks”, “approximately”, “intends”, “plans”, “estimates”, “anticipates” or similar expressions that relate to our strategy, plans or intentions. All statements we make relating to our estimated and projected earnings, margins, costs, expenditures, cash flows, growth rates and financial results or to our expectations regarding future industry trends are forward-looking statements. In addition, we, through our senior management, from time to time make forward-looking public statements concerning our expected future operations and performance and other developments. These forward-looking statements are subject to known and unknown risks, uncertainties and other factors that may change at any time, and, therefore, our actual results may differ materially from those that we expected. We derive many of our forward-looking statements from our operating budgets and forecasts, which are based upon many detailed assumptions. While we believe that our assumptions are reasonable, we caution that it is very difficult to predict the impact of known factors, and, of course, it is impossible for us to anticipate all factors that could affect our actual results. All forward-looking statements contained in this prospectus are based upon information available to us on the date of this prospectus.
Important factors that could cause actual results to differ materially from our expectations, which we refer to as “cautionary statements”, are disclosed under “Risk Factors” and elsewhere in this prospectus, including, without limitation, in conjunction with the forward-looking statements included in this prospectus. All forward-looking information in this prospectus and subsequent written and oral forward-looking statements attributable to us, or persons acting on our behalf, are expressly qualified in their entirety by the cautionary statements. Some of the factors that we believe could affect our results include:
| • | general economic conditions affecting the markets in which our products are sold; |
| • | our ability to implement our business strategies, including acquisition activities; |
| • | our ability to continue implementing our balanced book approach to substantially reduce the impact of fluctuations in metal prices on our earnings and operating margins; |
| • | shrinkage from processing operations and metal price fluctuations, particularly copper; |
| • | the condition of various markets in which our customers operate, including the housing and commercial construction industries; |
| • | our ability to maintain business relationships with our customers on favorable terms; |
| • | our ability to compete effectively with existing and new competitors; |
| • | limitations on our ability to purchase raw materials, particularly copper; |
| • | fluctuations in commodity and energy prices and costs; |
| • | our ability to maintain sufficient liquidity as commodity and energy prices rise; |
| • | the effects of industry consolidation or competition in our business lines; |
| • | operational factors affecting the ongoing commercial operations of our facilities, including technology failures, catastrophic weather-related damage, regulatory approvals, permit issues, unscheduled blackouts, outages or repairs or unanticipated changes in energy costs; |
| • | supply, demand, prices and other market conditions for our products; |
| • | our ability to accommodate increases in production to meet demand for our products; |
51
Table of Contents
| • | our ability to continue our operations internationally and the risks applicable to international operations; |
| • | government regulations relating to our products and services, including new legislation relating to derivatives and the elimination of the dollar bill; |
| • | our ability to maintain effective internal control over financial reporting as we become subject to public company requirements; |
| • | our ability to realize the planned cost savings and efficiency gains as part of our various initiatives; |
| • | workplace safety issues; |
| • | our ability to retain key employees; |
| • | adverse developments in our relationship with our employees or the future terms of our collective bargaining agreements; |
| • | rising employee medical costs; |
| • | environmental costs; |
| • | our exposure to product liability claims; |
| • | our ability to maintain cost-effective insurance policies; |
| • | our ability to maintain the confidentiality of our proprietary information and to protect the validity, enforceability or scope of our intellectual property rights; |
| • | our limited experience managing and operating a public company; |
| • | our ability to service our substantial indebtedness; |
| • | fluctuations in interest rates; and |
| • | restrictive covenants in our indebtedness that may adversely affect our operational flexibility. |
We caution you that the foregoing list of factors may not contain all of the material factors that are important to you. In addition, in light of these risks and uncertainties, the matters referred to in the forward-looking statements contained in this prospectus may not in fact occur. Accordingly, investors should not place undue reliance on those statements. We undertake no obligation to publicly update or revise any forward-looking statement as a result of new information, future events or otherwise, except as otherwise required by law.
52
Table of Contents
All of the shares of common stock to be sold in this offering, including those subject to the underwriters’ option to purchase additional shares, will be sold by the selling stockholder. We will not receive any proceeds from this offering. We expect that $16.4 million of the proceeds from this offering (based on an assumed initial public offering price of $16.00 per share, the midpoint of the price range set forth on the cover of this prospectus) will be paid to members of our management ($18.9 million if the underwriters’ option to purchase additional shares is exercised in full). For additional information, see “Certain Relationships and Related Party Transactions”.
53
Table of Contents
Following this offering, we intend to pay quarterly cash dividends. Any dividends or changes to dividend policy will be made at the discretion of the Board of Directors and will depend upon many factors, including our financial condition, earnings, legal requirements, including limitations imposed by Delaware law, restrictions in our debt agreements, including those governing the ABL Facility and the Senior Secured Notes, that limit our ability to pay dividends to stockholders and other factors the Board of Directors deems relevant. We currently expect that our first dividend will be paid in the fourth quarter of 2013 (in respect to the third quarter of 2013) and will be approximately $0.0375 per share of our common stock (after giving effect to the planned 211,100-to-1 stock split to be effected after the effective date of this registration statement and prior to the completion of this offering), subject to the factors mentioned above. Furthermore, because we are a holding company with no operations of our own, any dividend payments depend on the cash flow of our subsidiaries. The terms of our credit agreement governing the ABL Facility and the indenture governing the Senior Secured Notes generally restrict or limit our subsidiaries’ ability to pay cash dividends to us, so the amount of cash that will be available to us to pay dividends may be limited. The indenture governing the Senior Secured Notes includes a “restricted payments” basket based on Consolidated Net Income (as defined in the indenture). It increases based on 50% of Consolidated Net Income (as so defined) and decreases by 100% of Consolidated Net Loss (as so defined). The basket may be negative or insufficient to pay dividends. We have made dividend payments to shareholders within the past two years. See “Risk Factors—Risks Related to an Investment in Our Common Stock and this Offering—Our ability to pay regular dividends to our shareholders is subject to the discretion of our Board of Directors and may be limited by our debt agreements and limitations in Delaware law” and “Certain Relationships and Related Party Transactions” for details on our recent dividend payments.
54
Table of Contents
The following table sets forth cash and capitalization of Global Brass and Copper Holdings, Inc. as of March 31, 2013:
| • | on an historical basis; and |
| • | on an as-adjusted basis to give effect to this offering. |
This table should be read together with “The Offering”, “Use of Proceeds”, “Selected Historical Consolidated Financial Data”, “Risk Factors”, “Management’s Discussion and Analysis of Financial Condition and Results of Operations” and our consolidated financial statements and related notes, in each case, included elsewhere in this prospectus.
| As of March 31, 2013 | ||||||||
| Historical | As-Adjusted | |||||||
| (in millions) | ||||||||
| Cash(1) |
$ | 15.8 | $ | 16.5 | ||||
|
|
|
|
|
|||||
| Total long-term debt: |
||||||||
| ABL Facility(2) |
$ | 25.0 | $ | 25.0 | ||||
| Senior Secured Notes |
375.0 | 375.0 | ||||||
|
|
|
|
|
|||||
| Total debt |
$ | 400.0 | $ | 400.0 | ||||
|
|
|
|
|
|||||
| Stockholders’ deficit: |
||||||||
| Common stock(3)(4) |
$ | — | $ | 0.2 | ||||
| Preferred stock(5) |
— | — | ||||||
| Additional paid-in capital(6) |
— | 16.4 | ||||||
| Accumulated deficit(7) |
(36.6 | ) | (57.7 | ) | ||||
| Accumulated other comprehensive income, net of tax |
1.1 | 1.1 | ||||||
| Receivable from stockholder(1) |
(5.2 | ) | — | |||||
|
|
|
|
|
|||||
| Total Global Brass and Copper Holdings, Inc. stockholders’ deficit |
(40.7 | ) | (40.0 | ) | ||||
| Noncontrolling interest |
3.7 | 3.7 | ||||||
|
|
|
|
|
|||||
| Total deficit |
$ | (37.0 | ) | $ | (36.3 | ) | ||
|
|
|
|
|
|||||
| Total capitalization |
$ | 363.0 | $ | 363.7 | ||||
|
|
|
|
|
|||||
| (1) | As-adjusted cash reflects the receipt of $5.2 million at the closing of this offering from the KPS Funds in respect of the reimbursement of specific incremental costs related to this offering and a $4.5 million payment to affiliates of the KPS Funds in connection with the termination of a management agreement at the closing of this offering. See “Certain Relationships and Related Party Transactions.” |
| (2) | The ABL Facility matures in June 2017 and has a maximum committed principal amount of $200.0 million, for which we may request an increase at our option under certain circumstances by up to $50.0 million. Outstanding borrowings under the ABL Facility bear interest at a rate equal to LIBOR plus a margin of 2.0% to 2.5% or the prime rate plus a margin of 1.0% to 1.5%. As of March 31, 2013, outstanding borrowings under the ABL Facility accrued interest at a rate of 4.25%. Availability under the ABL Facility is based on a formula that is based on inventory and accounts receivable, subject to various adjustments and capped at the committed principal amount. As of March 31, 2013, maximum availability under the ABL Facility was $200.0 million, and remaining availability was $174.5 million, giving effect to $25.0 million of outstanding borrowings and to $0.5 million of outstanding letters of credit. For more information, please see “Description of Certain Indebtedness—ABL Facility”. |
| (3) | On an historical basis, reflects 200 shares of common stock authorized and 100 shares of common stock issued and outstanding. On an as-adjusted basis, reflects 80,000,000 shares of common stock authorized and 21,110,000 shares of common stock issued and outstanding with a par value of $0.01 per share, after giving effect to the 211,100 to-1 stock split to be effected after the effective date of this registration statement and prior to the completion of this offering but without giving effect to the 338,979 shares issuable under equity awards to be granted in connection with this offering (none of which will be vested or exercisable within 60 days after the date of the completion of this offering). |
| (4) | Upon consummation of this offering, there will be 104,444 non-qualified stock options, 136,094 shares of restricted stock and 98,441 performance shares (none of which will be vested or exercisable within 60 days after the date of the completion of this offering) under the 2013 Plan. |
| (5) | On an historical basis, reflects no shares of preferred stock authorized, issued or outstanding. On an as-adjusted basis, reflects 20,000,000 shares of preferred stock authorized, with a par value of $0.01 per share, with no shares issued and outstanding. |
| (6) | In connection with this offering, non-cash compensation expense of $16.4 million will be recorded as a component of selling, general and administrative expenses, with a corresponding increase in additional paid-in capital. The non-cash compensation charge represents the proceeds from this offering that will be received by certain members of management that have Profits Interest Shares. See “Compensation Discussion and Analysis—Equity-Based Compensation—Profits Interest Shares”. |
| (7) | As-adjusted amount reflects the impact of the $16.4 million non-cash compensation expense, the $4.5 million expense associated with the termination of the management agreement with affiliates of the KPS Funds and $0.2 million charge to reflect the 211,100 to-1 stock split to be effected after the effective date of this registration statement and prior to the completion of this offering without a change in par value. |
55
Table of Contents
All of the shares of common stock to be sold in this offering, including those subject to the underwriters’ option to purchase additional shares, will be sold by the selling stockholder. The common stock to be sold by the selling stockholder is common stock that is currently issued and outstanding. Accordingly, there will not be any dilution to our existing stockholder or new investors.
56
Table of Contents
SELECTED HISTORICAL CONSOLIDATED FINANCIAL DATA
Set forth below is selected historical consolidated financial data of our business as of the dates and for the periods indicated. The selected historical consolidated financial data as of March 31, 2013 and for the three months ended March 31, 2013 and 2012 have been derived from our unaudited consolidated financial statements included elsewhere in this prospectus. The unaudited consolidated financial statements have been prepared on the same basis as our audited consolidated financial statements, and in the opinion of our management, reflect all adjustments, including normal recurring adjustments, necessary for a fair presentation of the results for those periods. The results for any interim period are not necessarily indicative of the results that may be expected for a full year. The selected historical consolidated financial data for the years ended December 31, 2012, 2011 and 2010 and as of December 31, 2012 and 2011 have been derived from our audited consolidated financial statements included elsewhere in this prospectus. The selected historical consolidated financial data as of December 31, 2010, 2009 and 2008 and for the years ended December 31, 2009 and 2008 have been derived from our audited consolidated financial statements not included in this prospectus.
The number of common shares used in the calculation of historical net income (loss) attributable to Global Brass and Copper Holdings, Inc. per common share in the selected historical consolidated financial data below does not give effect to the planned 211,100-to-1 stock split to be effected after the effective date of this registration statement and prior to the completion of this offering. The number of common shares used in the calculation of pro forma net income (loss) attributable to Global Brass and Copper Holdings, Inc. per common share does give effect to the planned 211,100-to-1 stock split to be effected after the effective date of this registration statement and prior to the completion of this offering, but does not give effect to the 338,979 shares issuable under the equity awards to be granted in connection with this offering, since as of the date of this offering none of those awards will be vested or exercisable within 60 days after the date of the completion of this offering.
57
Table of Contents
The selected historical consolidated financial data should be read in conjunction with the information about the limitations on comparability of our financial results, including as a result of acquisitions. See “Management’s Discussion and Analysis of Financial Condition and Results of Operations”, “Risk Factors”, and our consolidated financial statements and related notes included elsewhere in this prospectus.
| (in millions, except share and per share data) |
|
Three Months Ended March 31, |
|
|
Year Ended December 31, |
| ||||||||||||||||||||||
| 2013 | 2012(1) | 2012 | 2011(1) | 2010(1) | 2009(1) | 2008(1) | ||||||||||||||||||||||
| Statements of Operations Data: |
||||||||||||||||||||||||||||
| Net sales |
$ | 445.0 | $ | 443.4 | $ | 1,650.5 | $ | 1,779.1 | $ | 1,658.7 | $ | 1,140.9 | $ | 2,008.3 | ||||||||||||||
| Cost of sales |
398.1 | 393.4 | 1,467.0 | 1,583.5 | 1,496.7 | 1,048.1 | 1,876.4 | |||||||||||||||||||||
| Lower of cost or market adjustment |
— | — | 0.3 | — | — | — | 170.9 | |||||||||||||||||||||
|
|
|
|
|
|
|
|
|
|
|
|
|
|
|
|||||||||||||||
| Total cost of sales |
398.1 | 393.4 | 1,467.3 | 1,583.5 | 1,496.7 | 1,048.1 | 2,047.3 | |||||||||||||||||||||
|
|
|
|
|
|
|
|
|
|
|
|
|
|
|
|||||||||||||||
| Gross profit (loss) |
46.9 | 50.0 | 183.2 | 195.6 | 162.0 | 92.8 | (39.0 | ) | ||||||||||||||||||||
| Selling, general and administrative expenses |
19.7 | 17.9 | 92.7 | 69.4 | 68.9 | 62.1 | 60.9 | |||||||||||||||||||||
|
|
|
|
|
|
|
|
|
|
|
|
|
|
|
|||||||||||||||
| Operating income (loss) |
27.2 | 32.1 | 90.5 | 126.2 | 93.1 | 30.7 | (99.9 | ) | ||||||||||||||||||||
| Third party interest expense(2) |
9.9 | 9.8 | 39.7 | 40.0 | 22.6 | 11.3 | 15.9 | |||||||||||||||||||||
| Related party interest expense(3) |
— | — | — | — | 2.5 | 6.8 | 4.1 | |||||||||||||||||||||
| Loss on extinguishment of debt |
— | — | 19.6 | — | — | — | — | |||||||||||||||||||||
| Other (income) expense, net |
0.2 | 0.3 | 0.1 | 0.4 | 0.8 | 0.1 | (1.9 | ) | ||||||||||||||||||||
|
|
|
|
|
|
|
|
|
|
|
|
|
|
|
|||||||||||||||
| Income (loss) before provision for (benefit from) income taxes and equity income |
17.1 | 22.0 | 31.1 | 85.8 | 67.2 | 12.5 | (118.0 | ) | ||||||||||||||||||||
| Provision for (benefit from) income taxes |
6.0 | 8.2 | 19.2 | 31.4 | 26.6 | 2.2 | (45.4 | ) | ||||||||||||||||||||
|
|
|
|
|
|
|
|
|
|
|
|
|
|
|
|||||||||||||||
| Income (loss) before equity income |
11.1 | 13.8 | 11.9 | 54.4 | 40.6 | 10.3 | (72.6 | ) | ||||||||||||||||||||
| Equity income, net of tax |
0.4 | 0.3 | 1.0 | 0.9 | 1.5 | — | 0.6 | |||||||||||||||||||||
|
|
|
|
|
|
|
|
|
|
|
|
|
|
|
|||||||||||||||
| Income (loss) before extraordinary item |
11.5 | 14.1 | 12.9 | 55.3 | 42.1 | 10.3 | (72.0 | ) | ||||||||||||||||||||
| Extraordinary item: Gain on valuation of assets in excess of purchase price |
— | — | — | — | — | — | 2.9 | |||||||||||||||||||||
|
|
|
|
|
|
|
|
|
|
|
|
|
|
|
|||||||||||||||
| Net income (loss) |
11.5 | 14.1 | 12.9 | 55.3 | 42.1 | 10.3 | (69.1 | ) | ||||||||||||||||||||
|
|
|
|
|
|
|
|
|
|
|
|
|
|
|
|||||||||||||||
| Less: Net income attributable to noncontrolling interest |
0.1 | 0.1 | 0.4 | 0.2 | 0.5 | 0.1 | — | |||||||||||||||||||||
|
|
|
|
|
|
|
|
|
|
|
|
|
|
|
|||||||||||||||
| Net income (loss) attributable to Global Brass and Copper Holdings, Inc.(2) |
$ | 11.4 | $ | 14.0 | $ | 12.5 | $ | 55.1 | $ | 41.6 | $ | 10.2 | $ | (69.1 | ) | |||||||||||||
|
|
|
|
|
|
|
|
|
|
|
|
|
|
|
|||||||||||||||
| Historical Per Share Data (Pre-Stock Split): |
||||||||||||||||||||||||||||
| Historical net cash dividends declared per common share |
$ | — | $ | — | $ | 1,600,000 | $ | — | $ | 425,000 | $ | — | $ | — | ||||||||||||||
| Historical net income (loss) attributable to Global Brass and Copper Holdings, Inc. per common share(2)(4) |
$ | 113,880 | $ | 139,930 | $ | 125,210 | $ | 551,320 | $ | 416,330 | $ | 102,160 | $ | (690,940 | ) | |||||||||||||
| Number of common shares used in historical share calculation |
100 | 100 | 100 | 100 | 100 | 100 | 100 | |||||||||||||||||||||
| Pro-Forma Per Share Data (Post-Stock Split): |
||||||||||||||||||||||||||||
| Pro forma net cash dividends declared per common share |
$ | — | $ | — | $ | 7.58 | $ | — | $ | 2.01 | $ | — | $ | — | ||||||||||||||
| Pro forma net income attributable to Global Brass and Copper Holdings, Inc. per common share(4) |
$ | 0.54 | $ | 0.55 | $ | 0.40 | $ | 2.61 | $ | 1.97 | $ | 0.48 | $ | (3.27 | ) | |||||||||||||
| Number of common shares used in pro forma share calculation |
21,110,000 | 21,110,000 | 21,110,000 | 21,110,000 | 21,110,000 | 21,110,000 | 21,110,000 | |||||||||||||||||||||
58
Table of Contents
| (in millions) | As of March 31, | As of December 31, | ||||||||||||||||||||||
| 2013 | 2012 | 2011(1) | 2010(1) | 2009(1) | 2008(1) | |||||||||||||||||||
| Balance Sheet Data: |
||||||||||||||||||||||||
| Cash |
$ | 15.8 | $ | 13.9 | $ | 49.5 | $ | 15.5 | $ | 7.8 | $ | 8.0 | ||||||||||||
| Total assets |
576.5 | 502.7 | 548.7 | 537.7 | 495.8 | 436.4 | ||||||||||||||||||
| Total debt(5) |
400.0 | 389.5 | 303.6 | 306.2 | 295.4 | 290.8 | ||||||||||||||||||
| Total liabilities |
613.5 | 550.5 | 466.0 | 509.2 | 470.9 | 422.1 | ||||||||||||||||||
| Total (deficit) equity |
(37.0 | ) | (47.8 | ) | 82.7 | 28.5 | 24.9 | 14.3 | ||||||||||||||||
| (1) | For the three months ended March 31, 2012, the above data have been adjusted for prior year revisions discussed in note 1, “Basis of Presentation and Principles of Consolidation” to our unaudited consolidated financial statements included elsewhere in this prospectus. For 2011, 2010, 2009 and 2008, the above data have been adjusted for prior year revisions discussed in note 2, “Summary of Significant Accounting Policies” to our audited consolidated financial statements included elsewhere in this prospectus. |
| (2) | We used a portion of the net proceeds of the Senior Secured Notes offering that we completed on June 1, 2012 to make the Parent Distribution. Our pro forma net income (loss) attributable to Global Brass and Copper Holdings, Inc. per common share reflects a reduction in our net income attributable to the interest expense incurred on the portion of the Senior Secured Notes that were used to fund the Parent Distribution. Assuming an interest rate of 9.50%, which is the actual interest rate of the Senior Secured Notes, and a statutory U.S. federal income tax rate of 35%, had the Parent Distribution been completed on January 1, 2012, our net income attributable to Global Brass and Copper Holdings, Inc. would have decreased by $2.5 million to $11.5 million for the three months ended March 31, 2012 and $4.1 million to $8.4 million for the year ended December 31, 2012. The effect of the issuance of the Senior Secured Notes and the Parent Distribution is fully reflected in the results presented for the three months ended March 31, 2013. |
| (3) | Represents interest on the related party term loan credit facility described in “Certain Relationships and Related Party Transactions.” |
| (4) | The number of common shares used in the calculation of historical net income attributable to Global Brass and Copper Holdings, Inc. per common share does not give effect to the planned 211,100-to-1 stock split to be effected after the effective date of this registration statement and prior to the completion of this offering. The number of common shares used in the calculation of pro forma net income attributable to Global Brass and Copper Holdings, Inc. per common share does give effect to the planned 211,100-to-1 stock split to be effected after the effective date of this registration statement and prior to the completion of this offering, but does not give effect to the 338,979 shares issuable under the equity awards to be granted in connection with this offering, since as of the date of this offering none of those awards will be vested or exercisable within 60 days after the date of the completion of this offering. |
| (5) | Consists of long-term debt, related party debt and current maturities of long-term debt. |
59
Table of Contents
MANAGEMENT’S DISCUSSION AND ANALYSIS OF FINANCIAL CONDITION
AND RESULTS OF OPERATIONS
Readers should refer to the information presented under the caption “Risk Factors” for risk factors that may affect our future performance. The following discussion and analysis of financial condition and results of operations should be read in conjunction with “Selected Historical Consolidated Financial Data”, “Summary Historical Consolidated Financial Data” and our consolidated financial statements and related notes included elsewhere in this prospectus. In addition to historical data, this discussion contains forward-looking statements about our business, operations and financial performance based on current expectations that involve risks, uncertainties and assumptions. Our actual results may differ materially from those discussed in the forward-looking statements as a result of various factors, including but not limited to those discussed in the sections entitled “Risk Factors” and “Cautionary Statements Concerning Forward-Looking Statements” included elsewhere in this prospectus.
Overview
Our Business
We are a leading value-added converter, fabricator, distributor and processor of specialized copper and brass products in North America. We offer a broad range of products, and we sell our products to multiple distinct end markets including the building and housing, munitions, automotive, transportation, coinage, electronics/electrical components, industrial machinery and equipment and general consumer end markets. Unlike other metals companies who may engage in mining, smelting and refining activities, we are purely a metal converter, fabricator, distributor and processor and do not attempt to generate profits from fluctuations in metal prices. We engage in melting and casting, rolling, drawing, extruding and stamping to manufacture finished and semi-finished alloy products from processed scrap, copper cathode and other refined metals. We participate in two distinct segments of the fabrication value chain: sheet, strip, foil, tube and plate and alloy rod.
For the three months ended March 31, 2013, we sold 131.5 million pounds of products, compared to 132.9 million pounds for the three months ended March 31, 2012, and we generated net sales of $445.0 million and adjusted sales of $139.6 million. For the three months ended March 31, 2012, we generated net sales of $443.4 million and adjusted sales of $137.1 million.
For the year ended December 31, 2012, we sold 503.2 million pounds of products, compared to 510.0 million pounds and 554.1 million pounds in 2011 and 2010, respectively, and we generated net sales of $1,650.5 million and adjusted sales of $524.9 million. In 2011, we generated net sales of $1,779.1 million and adjusted sales of $530.5 million and in 2010, we generated net sales of $1,658.7 million and adjusted sales of $538.5 million.
Our leading market positions in each of our operating segments allow us to achieve attractive operating margins. Our strong operating margins are a function of four key characteristics of our business: (1) we earn a premium margin over the cost of metal because of our value-added processing capabilities, patent-protected technologies, and first-class service; (2) we have strategically shifted our product portfolio toward value-added, higher margin products; (3) we are driving a lean cost structure through fixed and variable cost reductions, process improvements, and workforce flexibility initiatives; and (4) we employ our balanced book approach to substantially reduce the financial impact of metal price volatility on our earnings and operating margins. We have undertaken substantial cost reduction activities since our formation in 2007, which have reduced our fixed costs, improved our net working capital balances and improved our competitive positioning while increasing operating margins.
60
Table of Contents
Our Operating Segments
We operate through three reportable operating segments: Olin Brass, Chase Brass and A.J. Oster.
Our Olin Brass segment is the leading manufacturer and converter of copper and copper-alloy sheet, strip, foil, tube and fabricated components in North America. While primarily processing copper and copper-alloys, the segment also rerolls and forms other metals such as stainless and carbon steel. Olin Brass’s products are used in five primary end markets: building and housing, munitions, automotive, coinage, and electronics/electrical components. For each of the past three years ended December 31, 2012, between 14% and 18% of Olin Brass’s products have been sold to A.J. Oster.
Chase Brass is a leading North American manufacturer of brass rod. The segment principally produces brass rod in sizes ranging from 1/4 inch to 4.5 inches in diameter. The key attributes of brass rod include its machinability, corrosion resistance and moderate strength, making it ideal for forging and machining products such as valves and fittings. Chase Brass produces brass rod used in production applications which can be grouped into four end markets: building and housing, transportation, electronics/electrical components and industrial machinery and equipment.
Our A.J. Oster segment is a leading copper-alloy distributor and processor. The segment, through its family of metal service centers, is strategically focused on satisfying its customers’ needs for brass and copper strip and other products, with a high level of service, quality and flexibility by offering customization and just-in-time delivery. Our value-added processing services include precision slitting and traverse winding to provide greater customer press up-time, hot air level tinning for superior corrosion resistance and product enhancements such as edging and cutting. Important A.J. Oster end markets include building and housing, automotive and electronics/electrical components (primarily for housing and commercial construction). For each of the past three years ended December 31, 2012, between 70% and 80% of A.J. Oster’s material requirements have been supplied by our Olin Brass segment.
All three segments generate revenue from product sales and earn a premium margin over the cost of metal as a result of our value-added processing and metal conversion capabilities and first-class service. Our financial performance is driven by metal conversion economics, not by the underlying movements in the price of copper and the other metal we use. In all three segments, most of the risk of changes in the metal cost of the products we make is borne by our customers or third parties rather than by us.
We also have a Corporate and Other segment, which includes certain administrative costs and expenses that management has not allocated to our operating segments. These costs include compensation for corporate executives and officers, corporate office and administrative salaries, and professional fees for accounting, tax and legal services. The Corporate and Other segment also includes interest expense, and state and federal income taxes.
Financial Information, Acquisition, Business Transformation and Refinancing
On October 10, 2007, Global Brass and Copper Holdings was formed by affiliates of KPS as an acquisition vehicle to acquire the worldwide metals business of Olin Corporation. Prior to the date of acquisition, Global Brass and Copper Holdings had no material assets or operations. Post–acquisition, Global Brass and Copper Holdings has been a holding company and has had no business operations or material assets other than its ownership of 100% of the outstanding equity interests of Global Brass and Copper.
61
Table of Contents
Acquisition of the Worldwide Metals Business of Olin Corporation
On November 19, 2007, we acquired Olin Corporation’s worldwide metals business. The transaction was accounted for under the purchase method of accounting, and the assets and liabilities of the business were recorded at fair value at the acquisition date.
The fair market value of the net assets acquired exceeded the purchase price in the acquisition, resulting in a bargain purchase event. In accordance with GAAP at the time of the transaction, the excess fair value was allocated as a reduction to the amounts that otherwise would have been assigned to all of the acquired long-term assets. The remaining excess fair value was recorded as a one-time non-taxable extraordinary gain of $2.9 million in the year ended December 31, 2008.
As a result of the bargain purchase event, all identified intangible assets and other non-current assets, including the acquired property, plant and equipment, were recorded at a zero value on our opening balance sheet as of the acquisition date. Accordingly, our fixed assets reflect only post-acquisition capital investments, and our cost of sales includes depreciation only on capital investments made after the acquisition date. As we execute on our growth strategy and additional capital investment is made, we expect that the depreciation component of our cost of sales will increase.
Business Transformation
After the acquisition in November 2007, we implemented a series of transformative initiatives, which have resulted in a significant improvement in our financial performance despite the economic downturn that began in late 2008. Compared to 2007, our unit volume has declined from 650.8 million pounds to 503.2 million pounds in 2012, a decrease of 147.6 million pounds or 22.7%. Despite this decline in volume and associated loss of revenue, we generated $12.5 million of net income attributable to Global Brass and Copper Holdings, Inc. (which reflects a non-cash profits interest compensation charge of $19.5 million and a loss on extinguishment of debt of $19.6 million) and $115.4 million of Consolidated Adjusted EBITDA (which adjusts to exclude the non-cash profits interest compensation charge and the loss on extinguishment of debt) for the year ended December 31, 2012, compared to $104.3 million of net income attributable to Global Brass and Copper Holdings, Inc. (which includes a $60.7 million extraordinary gain related to purchase accounting) and $51.4 million of Consolidated Adjusted EBITDA (which adjusts to exclude the extraordinary gain) for the combined year ended December 31, 2007. The improvements in Consolidated Adjusted EBITDA have been primarily driven by the following:
| • | a new five-and-one-half year collective bargaining agreement ratified by eight of the unions at Olin Brass’s principal facility in June 2008, which significantly reduced the number of job classifications, and provided Olin Brass with the ability to adjust staffing levels in line with production volume. We do not have any defined benefit pension and retiree health care obligations under the collective bargaining agreement and we do not offer a defined benefit pension or retiree health care benefits to our salaried workforce; |
| • | establishment of three independent business units with clear objectives and accountability for financial performance; |
| • | cash cost reductions from an approximately 20% reduction of salaried employee headcount; |
| • | acquisition of the order book, customer list and other assets of Bolton’s North American operations in January 2008; |
| • | increased margins from price increases and rationalization of our product mix to focus resources on products that provide attractive margins and growth opportunities; |
| • | inventory reductions of 62.9 million pounds, or 42.7%, from 147.2 million at November 19, 2007 to 84.3 million pounds at December 31, 2012, reducing working capital needs; and |
62
Table of Contents
| • | closing certain facilities at A.J. Oster and consolidating operations. |
The net result of the transformation is a company with higher margins, lower costs and lower working capital requirements. As of December 31, 2012, we had reduced our breakeven point by approximately 45% since the acquisition date. Breakeven is defined as the volume level at which contribution margin (adjusted sales less variable conversion costs) equals the total of fixed manufacturing overhead and selling, general and administrative expenses (excluding the various items that are excluded from Consolidated Adjusted EBITDA). In an economic upturn, these factors in combination with our available production capacity should enable us to capitalize on increased demand for our products and services, which will drive profitable growth.
Since December 31, 2007, we have reduced our long-term debt by 4.7% from $408.6 million to $389.5 million at December 31, 2012, paid dividends to Halkos of an aggregate of $202.5 million through December 31, 2012 and reduce our leverage from approximately 7.9x gross debt to Consolidated Adjusted EBITDA at December 31, 2007 to 3.4x as of December 31, 2012.
Refinancing Activities
On August 18, 2010, we completed a refinancing in which we replaced a then-existing $380.0 million asset-based revolving loan facility, which we refer to as the “2007 ABL Facility,” with a new $150.0 million four-year asset-based revolving loan facility, which we refer to as the “2010 ABL Facility,” and the $315.0 million Term Loan Facility. We used a portion of the proceeds from the refinancing to repay an existing $60.0 million collateralized term loan from an affiliate of KPS and fund a $42.5 million dividend to Halkos. In June 2012, in the ABL Amendment, we amended and extended the 2010 ABL Facility to mature on June 1, 2017 and increased the commitments under the facility to $200.0 million, which we refer to as the “ABL Facility.” On June 1, 2012, we completed a refinancing, which included the issuance of $375.0 million in aggregate principal amount of the Senior Secured Notes by Global Brass and Copper, Inc. The Senior Secured Notes are guaranteed by Global Brass and Copper Holdings, Inc. and substantially all of Global Brass and Copper’s existing and future wholly-owned U.S. subsidiaries. The Senior Secured Notes are secured by a senior-priority security interest in our fixed assets and by a junior-priority security interest in our accounts receivable and inventory. We used a portion of the proceeds from the Senior Secured Notes to repay in full the $266.5 million of principal outstanding under our Term Loan Facility. In the Term Loan Refinancing, we paid our lenders a total of $275.5 million, including the $266.5 million of principal, an early repayment premium of $8.0 million and accrued and unpaid interest of $1.0 million, and we recognized a $19.6 million loss on extinguishment of debt. See also “Summary—Recent Transactions.”
Our refinancing activity has significantly reduced our reliance on asset-based borrowing for long-term financing, and reduced the risk to our ability to borrow in support of long-term financing requirements due to a decline in metal prices. The 2007 ABL Facility served two purposes—first, to finance the acquisition of the worldwide metals business of Olin Corporation in November 2007 and second, to finance subsequent working capital requirements. Under this prior financing structure, a drop in metal prices could have reduced the borrowing base to a level that would have required us to repay and refinance borrowings related to the initial acquisition. Following the August 2010 refinancing, our long-term asset investment has been financed by term debt (first the Term Loan Facility and now the Senior Secured Notes), the size of which is fixed and therefore independent of metal prices, and the ABL Facility is used primarily to finance working capital requirements.
63
Table of Contents
Key Factors Affecting Our Results of Operations
Metal Cost
We are a leading, value-added converter, fabricator, distributor and processor of specialized copper and brass products in North America. Our profitability is primarily driven by the value added from the manufacturing and fabrication of metal products, and not by fluctuations in the price of copper and metal. Our business model uses various methods to substantially reduce the financial impact of fluctuations in metal prices, such that our operating margins are largely unaffected by metal price trends. Nevertheless, metal price fluctuations will impact the total amount of our net sales, the cost of shrinkage loss, the impact of LIFO liquidations and our working capital requirements.
Shrinkage loss, which is primarily the loss of raw material that occurs in the melting and casting operations, is an inherent part of our metal casting process. While the shrinkage loss rate is very low relative to the total volume of metal casting, the cost of the shrinkage loss and its impact on financial performance increases as metal prices increase.
We sell our products on a “toll” and “non-toll” basis. For sales on a toll basis, our customer is responsible for metal procurement. For sales on a non-toll basis, we assume responsibility for metal procurement and then recover the metal replacement cost from the customer. During the year ended December 31, 2012, 75.9% of our unit sales volume was on a non-toll basis. For sales on a non-toll basis, we use our balanced book approach, discussed below, to substantially reduce the impact of metal price movements on earnings and operating margins.
The raw materials component of inventories that is valued on a LIFO basis comprises approximately 71% and 70% of total inventory at March 31, 2013 and December 31, 2012, respectively. Under the LIFO inventory valuation method, changes in the cost of raw materials and production activities are recognized in cost of sales in the current period. The impact of LIFO accounting on our financial results may be significant with respect to period-to-period comparisons. During 2012 and 2011 inventory quantities were reduced, resulting in a liquidation of LIFO inventory layers carried at lower costs prevailing in prior years as compared with current costs. The effect of this reduction of inventory decreased cost of sales by $4.8 million and $15.2 million during 2012 and 2011, respectively.
Metal prices will also impact our investment in working capital because our collection terms with our customers are longer than our payment terms to our suppliers, so when metal prices increase, even if the number of pounds processed does not change, our working capital requirements will also increase. In 2012, the spread between our receivable collection cycle and purchase payment cycle was approximately 20 days. As a result, when metal prices are rising, we tend to draw more on the ABL Facility to cover the cash flow delay between material replacement purchase and cash collection. When metal prices fall, we replace our metal at a lower cost than the metal content of cash collections and generally reduce our use of the ABL Facility. We believe that our cash flow from operations, supplemented with cash available under the ABL Facility, will provide sufficient liquidity to meet our needs in the current metal price environment.
Balanced Book
Most of our sales volume is from non-toll customers. During the fiscal year ended December 31, 2012, non-toll sales accounted for 75.9% of our volume. To substantially reduce the financial impact of metal price volatility on earnings and operating margins, we use our balanced book approach for non-toll sales to offset forward metal sales with forward metal purchases. Using our balanced book approach, we seek to minimize the financial impact of metal price movements in the period between date of order and date of shipment by matching the timing, quantity and price of the metal component
64
Table of Contents
of net sales made on a non-toll basis with the timing, quantity and price of the replacement metal purchases. Our balanced book approach has improved the consistency of our margins despite underlying copper price volatility.
For any non-toll sale we achieve our balanced book through one of the following three mechanisms:
| • | Metal sales and replacement purchases on “price date of shipment” terms, meaning that metal sale prices and the metal replacement prices are set on the date of shipment. The customer bears the risk of metal price changes from the date of order to the date of shipment, so all fluctuations in metal costs are passed through to the customer. |
| • | Metal sales and replacement purchases on a “firm price basis”, meaning that metal sale prices are fixed on the order date, and a matching replacement purchase at a fixed price is established with a metal supplier. The supplier therefore bears the risk of metal price changes from the date of order to the date of shipment. |
| • | Metal sales on a firm price basis in circumstances where a matching firm price purchase is unavailable. In this situation, we execute a forward purchase on “price date of shipment” terms and enter into a financial derivative transaction in the form of a forward purchase contract. The impact of price changes from date of order to the date of shipment on the previously required metal replacement purchase is offset by gains or losses on the derivative contract. The derivative counterparty bears the risk of metal price changes from the date of order to the date of shipment. |
Price date of shipment transactions accounted for approximately 65% of non-toll unit sales volume in the year ended December 31, 2012. Firm price basis transactions that are supported with either firm price replacement purchases or price date of shipment replacement purchases plus a derivative contract accounted for the remaining approximate 35% of non-toll volume for the year ended December 31, 2012.
Metal Cost Hedging
In the ordinary course of business, we use derivative contracts in support of our balanced book approach. These derivative contracts are not accounted for as hedges but are recorded at fair value in accordance with ASC Topic 820. Unrealized and realized gains and losses are reported in cost of sales.
Other Initiatives
We have also implemented the following initiatives to improve margins, increase profitability and reduce working capital requirements:
| • | market-driven product mix improvements; |
| • | management-led product portfolio enhancements; |
| • | development of dedicated supply chain organizations in each business unit which have begun the implementation of robust sales and operations planning systems across the business units; |
| • | management-led productivity and production enhancements; and |
| • | establishment of more rigid business rules resulting in reduced customer optionality and improved pricing across our product portfolio. |
65
Table of Contents
Company Outlook
Prior to the economic downturn beginning in 2007, demand for SSP and rod products in North America had been relatively stable, with the SSP market averaging consumption of 1.1 billion pounds per annum from 2001 to 2007, and the rod market averaging 835 million pounds per annum from 2001 to 2007. Compared to 2010, total industry demand for brass strip decreased in 2011 by 6% from 864 million pounds to 808 million pounds, and total industry demand for brass rod remained constant at 549 million pounds in 2010 and 2011. Most recently, total North American demand for brass strip increased by 2% from 808 million pounds in 2011 to 824 million pounds in 2012. Total industry demand for North American shipments of copper and brass, sheet and strip products from distribution centers and rerolling facilities decreased by 5% from 186 million pounds in 2011 to 177 million pounds in 2012. Total industry demand for brass rod decreased by 3% from 549 million pounds to 533 million pounds. While the 2012 total demand statistics reflect some recovery from 2009 levels, they still do not match levels of demand prior to the recession. The recovery from the recent economic downturn has been uneven and at times slower than desired, but when general U.S. economic conditions improve, we expect to see growth in demand for copper and copper-alloy SSP products increase from 2012 levels toward pre-recession historic levels. A return to pre-recession historic levels would provide us with significant growth opportunities and increased profitability given our much lower breakeven point.
Demand for our product is driven predominantly by five sectors: building and housing, munitions, automotive, electrical/electronic and coinage. The building and housing sector, as measured by new housing starts, has been very depressed since 2008, with an average of approximately 659,000 units annually during 2010-2012 compared to an average of 1,760,000 per annum from 2001-2007. The sector improved in 2012 but remained weak as compared to historical build rates. Beginning in 2013, we have seen a positive trend in leading market indicators related to housing. Munitions demand continues to be solid as military demand remains stable at healthy levels and commercial demand is robust. In addition, Olin Brass renewed a long-term contract in 2012 with ATK, who is under contract with the U.S. Army to supply small-caliber ammunition through September 2019. Olin Brass is under contract to supply ATK with certain materials required by ATK to meet its contract obligations to the U.S. Army. The automotive sector is dependent on the level of consumer spending and replacement needs. Automotive demand is also below historical averages, with average automobile sales of 12.9 million units per annum during 2010-2012 compared to an average of 16.7 million per annum from 2001-2007. The sector improved in 2012 but remained weak as compared to historical automobile sales as the average age of automobiles continues to rise. Electrical/electronic end uses include a wide range of applications, from medical to computers to aviation, and demand is largely correlated to general economic activity. Coinage is directly tied to consumer transactions and has been at historical low levels in 2008-2010. In 2011, coinage volumes began to increase, and with the exception of volumes related to the $1 coin (whose production was suspended at the end of 2011), coinage demand improved further in 2012. In addition, Olin Brass renewed a long-term contract with the U.S. Mint in 2012 to extend the supply agreement through 2017.
We believe that in addition to the growth that we expect to experience upon a return to more normalized levels of demand, there are a number of growth opportunities that could create a considerable increase in demand, for copper and copper-alloy SSP products, including CuVerro™ anti-microbial products and fixtures and renewable energy applications (such as lithium batteries and solar applications). Olin Brass has completed the Federal and state registration processes necessary to market its CuVerro™ materials as having anti-microbial properties and have licensed more than a dozen exclusive component manufacturers to market CuVerro™ products to the healthcare industry. Additionally, on September 20, 2011, the COINS Act was introduced in the U.S. House of Representatives, which is intended to modernize the U.S. currency system by replacing $1 notes with $1 coins. We anticipate a significant increase in the size of the coinage market if the U.S. transitions to the $1 coin.
66
Table of Contents
For brass rod demand, we anticipate a slow, gradual recovery influenced by increasing demand in building and construction. The Federal Reduction of Lead in Drinking Water Act has mandated the use of lead-free and low-lead conduits to supply drinking water, beginning in January 2014. This regulatory shift represents a significant growth opportunity for North American manufacturers of lead-free and low-lead materials made from brass rod. Management anticipates this regulatory change to accelerate the increasing demand for high-quality, lead-free and low-lead products occurring because of existing state regulations.
In our distribution business, we anticipate further consolidation and rationalization to occur given the amount of excess processing capacity that exists across the United States. Management also anticipates that distributors will continue to be an important supply-channel alternative as end users work to mitigate the increased costs associated with financing their working capital needs (which are driven, in part, by high metal prices). Finally, management believes North American consumer demand has largely been satisfied by North American SSP. Offshore supply of a narrow range of SSP has historically represented a small proportion of total North American supply. On March 21, 2012, the ITC Commissioners voted to continue antidumping orders for brass sheet and strip from Germany, Italy, France, and Japan. The brass rod market has been affected recently by increased foreign competition including increased imports due to the United States – Korean Free Trade Agreement (“KORUS FTA”) which became effective on March 15, 2012. Future levels of imported rod will be influenced by factors including domestic capacity and pricing levels, as well as costs in the import supply chain.
Non-GAAP Measures
In addition to the results reported in accordance with U.S. GAAP, we have provided information regarding “Consolidated EBITDA”, “Segment EBITDA”, “Consolidated Adjusted EBITDA”, “Segment Adjusted EBITDA”, and “Adjusted sales”.
EBITDA-Based Measures
We define Consolidated EBITDA as net income (loss) attributable to Global Brass and Copper Holdings, Inc., adjusted to exclude interest expense, provision for (benefit from) income taxes and depreciation and amortization expense. Segment EBITDA is defined by us as income (loss) before provision for (benefit from) income taxes and equity income, adjusted to exclude interest expense and depreciation and amortization expense, in each case, to the extent such items are attributable to such segment.
We use Consolidated EBITDA only to calculate Consolidated Adjusted EBITDA. Consolidated Adjusted EBITDA is Consolidated EBITDA, further adjusted to exclude extraordinary gains from the bargain purchase that occurred in the acquisition of the worldwide metals business of Olin Corporation, realized and unrealized gains and losses related to the collateral hedge contracts that were required under our 2007 ABL Facility, unrealized gains and losses on derivative contracts in support of our balanced book approach, unrealized gains and losses associated with derivative contracts related to electricity and natural gas costs, non-cash gains and losses due to lower of cost or market adjustments to inventory, non-cash LIFO-based gains and losses due to the depletion of a LIFO layer of metal inventory, non-cash compensation expense related to payments made to members of our management by our parent, Halkos, loss on extinguishment of debt, non-cash income accretion related to the joint venture with Dowa, KPS management fees, restructuring and other business transformation charges, specified legal and professional expenses and certain other items.
We use Segment EBITDA only to calculate Segment Adjusted EBITDA. Segment Adjusted EBITDA is Segment EBITDA, further adjusted to exclude unrealized gains and losses on derivative contracts in support of our balanced book approach, unrealized gains and losses associated with
67
Table of Contents
derivative contracts related to electricity and natural gas costs, non-cash gains and losses due to lower of cost or market adjustments to inventory, non-cash LIFO-based gains and losses due to the depletion of a LIFO layer of metal inventory, non-cash compensation expense related to payments made to certain employees by our parent, Halkos, loss on extinguishment of debt, and non-cash income accretion related to the joint venture with Dowa, in each case, to the extent such items are attributable to the relevant segment.
We present the above-described EBITDA-based measures because we consider them important supplemental measures and believe they are frequently used by securities analysts, investors and other interested parties in the evaluation of companies in our industry. Nevertheless, our EBITDA-based measures may not be comparable to similarly titled measures presented by other companies.
We present Consolidated Adjusted EBITDA as a supplemental measure of our performance because we believe it represents a meaningful presentation of the financial performance of our core operations, without the impact of the various items excluded, in order to provide period-to-period comparisons that are more consistent and more easily understood. Management uses Consolidated Adjusted EBITDA per pound in order to measure the effectiveness of the balanced book approach in reducing the financial impact of metal price volatility on earnings and operating margins, and to measure the effectiveness of our business transformation initiatives in improving earnings and operating margins. In addition, Segment Adjusted EBITDA is the key metric used by our chief operating decision-maker to evaluate the business performance of our segments in comparison to budgets, forecasts and prior-year financial results, providing a measure that management believes reflects our core operating performance. Measures similar to Consolidated Adjusted EBITDA, namely “EBITDA” (as defined in the agreement governing the ABL Facility) and “Adjusted EBITDA” (as defined in the indenture governing the Senior Secured Notes), are used in the agreements governing the ABL Facility and the Senior Secured Notes to determine compliance with various financial covenants and tests.
Our EBITDA-based measures have limitations as analytical tools, and you should not consider them in isolation or as substitutes for analysis of our results as reported under U.S. GAAP. Some of these limitations are:
| • | they do not reflect every expenditure, future requirements for capital expenditures or contractual commitments; |
| • | they do not reflect the significant interest expense or the amounts necessary to service interest or principal payments on our debt; |
| • | they do not reflect income tax expense, and because the payment of taxes is part of our operations, tax expense is a necessary element of our costs and ability to operate; |
| • | although depreciation and amortization are eliminated in the calculation of EBITDA-based measures, the assets being depreciated and amortized will often have to be replaced or require improvements in the future, and our EBITDA-based measures do not reflect any costs of such replacements or improvements; |
| • | they do not reflect the impact of earnings or charges resulting from matters we consider not to be indicative of our ongoing operations; |
| • | segment-based measures do not reflect the elimination of intercompany transactions, including those between Olin Brass and A.J. Oster; |
| • | they do not reflect limitations on our costs related to transferring earnings from our subsidiaries to us; and |
| • | other companies in our industry may calculate these measures differently from the way we do, limiting their usefulness as comparative measures. |
68
Table of Contents
We compensate for these limitations by using our EBITDA-based measures along with other comparative tools, together with GAAP measurements, to assist in the evaluation of operating performance. Such GAAP measurements include operating income (loss), net income (loss), cash flows from operations and other cash flow data. We have significant uses of cash, including capital expenditures, interest payments, debt principal repayments, taxes and other non-recurring charges, which are not reflected in our EBITDA-based measures.
Our EBITDA-based measures are not intended as alternatives to net income (loss) as indicators of our operating performance, as alternatives to any other measure of performance in conformity with GAAP or as alternatives to cash flow provided by operating activities as measures of liquidity. You should therefore not place undue reliance on our EBITDA-based measures or ratios calculated using those measures. Our GAAP-based measures can be found in our consolidated financial statements and the related notes thereto included elsewhere in this prospectus.
Adjusted Sales
Adjusted sales is defined as net sales less the metal component of net sales. Net sales is the most directly comparable GAAP measure to adjusted sales. Adjusted sales represents the value-added premium we earn over our conversion and fabrication costs. Management uses adjusted sales on a consolidated basis to monitor the revenues that are generated from our value-added conversion and fabrication processes excluding the effects of fluctuations in metal costs, reflecting our toll sales and our balanced book approach for non-toll sales. We believe that adjusted sales supplements our GAAP results to provide a more complete understanding of the results of our business, and we believe it is useful to our investors and other parties for these same reasons. Adjusted sales may not be comparable to similarly titled measures presented by other companies and is not a measure of operating performance or liquidity defined by GAAP.
Revision of Prior Period Financial Statements
Our financial information as of and for the three months ended March 31, 2012 in this discussion and analysis reflects those revisions disclosed in note 1, “Basis of Presentation and Principles of Consolidation” to our unaudited consolidated financial statements included elsewhere in this prospectus. Our financial information as of December 31, 2011 and 2010 and for the years ended December 31, 2011 and 2010 discussed in this discussion and analysis reflects those revisions discussed in note 2, “Summary of Significant Accounting Policies” to our audited consolidated financial statements included elsewhere in this prospectus.
69
Table of Contents
Results of Operations
Consolidated Results of Operations for the Three Months Ended March 31, 2013, Compared to the Three Months Ended March 31, 2012.
| Three Months Ended March 31, | Change: 2013 vs. 2012 |
|||||||||||||||||||||||
| (in millions) | 2013 | % of Net Sales | 2012 | % of Net Sales | Amount | Percent | ||||||||||||||||||
| Net sales |
$ | 445.0 | 100.0 | % | $ | 443.4 | 100.0 | % | $ | 1.6 | 0.4 | % | ||||||||||||
| Cost of sales |
398.1 | 89.5 | % | 393.4 | 88.7 | % | 4.7 | 1.2 | % | |||||||||||||||
|
|
|
|
|
|
|
|||||||||||||||||||
| Gross profit |
46.9 | 10.5 | % | 50.0 | 11.3 | % | (3.1 | ) | (6.2 | %) | ||||||||||||||
| Selling, general and administrative expenses |
19.7 | 4.4 | % | 17.9 | 4.0 | % | 1.8 | 10.1 | % | |||||||||||||||
|
|
|
|
|
|
|
|||||||||||||||||||
| Operating income |
27.2 | 6.1 | % | 32.1 | 7.2 | % | (4.9 | ) | (15.3 | %) | ||||||||||||||
| Interest expense |
9.9 | 2.2 | % | 9.8 | 2.2 | % | 0.1 | 1.0 | % | |||||||||||||||
| Other expense, net |
0.2 | 0.0 | % | 0.3 | 0.1 | % | (0.1 | ) | (33.3 | %) | ||||||||||||||
|
|
|
|
|
|
|
|||||||||||||||||||
| Income before provision for income taxes and equity income |
17.1 | 3.8 | % | 22.0 | 5.0 | % | (4.9 | ) | (22.3 | %) | ||||||||||||||
| Provision for income taxes |
6.0 | 1.3 | % | 8.2 | 1.8 | % | (2.2 | ) | (26.8 | %) | ||||||||||||||
|
|
|
|
|
|
|
|||||||||||||||||||
| Income before equity income |
11.1 | 2.5 | % | 13.8 | 3.1 | % | (2.7 | ) | (19.6 | %) | ||||||||||||||
| Equity income, net of tax |
0.4 | 0.1 | % | 0.3 | 0.1 | % | 0.1 | 33.3 | % | |||||||||||||||
|
|
|
|
|
|
|
|||||||||||||||||||
| Net income |
11.5 | 2.6 | % | 14.1 | 3.2 | % | (2.6 | ) | (18.4 | %) | ||||||||||||||
| Less: Net income attributable to noncontrolling interest |
0.1 | 0.0 | % | 0.1 | 0.0 | % | — | 0.0 | % | |||||||||||||||
|
|
|
|
|
|
|
|||||||||||||||||||
| Net income attributable to Global Brass and Copper Holdings, Inc. |
$ | 11.4 | 2.6 | % | $ | 14.0 | 3.2 | % | $ | (2.6 | ) | (18.6 | %) | |||||||||||
|
|
|
|
|
|
|
|||||||||||||||||||
| Consolidated Adjusted EBITDA |
$ | 30.1 | 6.8 | % | $ | 32.8 | 7.4 | % | (2.7 | ) | (8.2 | %) | ||||||||||||
Net Sales
Net sales increased by $1.6 million, or 0.4%, from $443.4 million for the three months ended March 31, 2012 to $445.0 million for the three months ended March 31, 2013. Higher average sales prices increased net sales by $3.4 million. In addition, net sales increased by $10.2 million as a result of the sales of unprocessed metal in the three months ended March 31, 2013, as well as the change in customer mix, partially offset by lower metal prices, which increased net sales by $0.1 million. These increases were partially offset by a decrease in volume, which decreased net sales by $12.1 million. Metal prices reflect the replacement cost recovery from the customer, whereas the sales prices represent the pricing component of adjusted sales, which we define as the excess of net sales over the metal component of net sales.
Volume decreased by 1.4 million pounds, or 1.1%, from 132.9 million pounds for the three months ended March 31, 2012 to 131.5 million pounds for the three months ended March 31, 2013. The decrease in volume was the result of lower demand for brass rod in the building and housing and electronics/electrical components end markets due primarily to increased competition from foreign imports. These decreases were partially offset by increased demand for brass strip in the coinage and munitions end markets.
The metal cost recovery component of net sales decreased by $0.9 million, or 0.3%, from $306.3 million for the three months ended March 31, 2012 to $305.4 million for the three months ended March 31, 2013.
70
Table of Contents
Lower volume decreased the metal cost recovery component of net sales by $11.2 million. Partially offsetting the decrease were sales of unprocessed metal, which increased the metal cost recovery component of net sales by $10.2 million in the three months ended March 31, 2013. The metal component of net sales per pound of finished product shipped increased by 0.4%, due primarily to the inclusion of the sale of unprocessed metal, the quantity of which is not included in pounds shipped. The metal component of net sales per pound of finished product sold excluding the sale of unprocessed metal (the quantity of which is not included in pounds shipped) decreased by 2.6%, primarily as a result of a 4.8% decrease in average daily copper prices reported by COMEX. The change in customer mix, partially offset by lower metal prices, increased the metal cost recovery component of net sales by $0.1 million.
Adjusted Sales
Adjusted sales, the excess of net sales over the metal component of net sales, increased by $2.5 million, or 1.8%, from $137.1 million for the three months ended March 31, 2012 to $139.6 million for the three months ended March 31, 2013. Higher average sales prices contributed $3.4 million to the increase, which was partially offset by a decrease of $0.9 million related to lower volume. Adjusted sales per pound increased in the three months ended March 31, 2013 by 2.9% compared to the same period in 2012 which was the result of a net increase in average sales prices at the segment level, partially offset by the effect of changes in the mix of sales by segment relative to our consolidated sales as a whole.
Adjusted sales is a non-GAAP financial measure. See “—Non-GAAP Measures—Adjusted Sales”. The following table presents a reconciliation of net sales to adjusted sales and net sales per pound to adjusted sales per pound:
| Three Months Ended March 31, |
Change: 2013 vs. 2012 |
|||||||||||||||
| (in millions, except per pound values) | 2013 | 2012 | Amount | Percent | ||||||||||||
| Pounds shipped |
131.5 | 132.9 | (1.4 | ) | (1.1 | %) | ||||||||||
| Net sales |
$ | 445.0 | $ | 443.4 | $ | 1.6 | 0.4 | % | ||||||||
| Metal component of net sales |
305.4 | 306.3 | (0.9 | ) | (0.3 | %) | ||||||||||
|
|
|
|
|
|
|
|||||||||||
| Adjusted sales |
$ | 139.6 | $ | 137.1 | $ | 2.5 | 1.8 | % | ||||||||
|
|
|
|
|
|
|
|||||||||||
| $ per pound shipped |
||||||||||||||||
| Net sales per pound |
$ | 3.38 | $ | 3.34 | $ | 0.04 | 1.2 | % | ||||||||
| Metal component of net sales per pound |
2.32 | 2.31 | 0.01 | 0.4 | % | |||||||||||
|
|
|
|
|
|
|
|||||||||||
| Adjusted sales per pound |
$ | 1.06 | $ | 1.03 | $ | 0.03 | 2.9 | % | ||||||||
|
|
|
|
|
|
|
|||||||||||
| Average reported copper price per pound |
$ | 3.60 | $ | 3.78 | $ | (0.18 | ) | (4.8 | %) | |||||||
Gross Profit
Gross profit decreased by $3.1 million, or 6.2%, from $50.0 million for the three months ended March 31, 2012 to $46.9 million for the three months ended March 31, 2013. Gross profit per pound decreased from $0.38 for the three months ended March 31, 2012 to $0.36 for the three months ended March 31, 2013.
Gross profit for the three months ended March, 31, 2013 included a loss of $21 thousand related to net unrealized losses on derivative contracts. Gross profit for the three months ended March 31, 2012 included a gain of $1.3 million related to net unrealized gains on derivative contracts. We exclude all such gains and losses in calculating Segment Adjusted EBITDA and Consolidated Adjusted EBITDA. See “—Non-GAAP Measures—EBITDA-Based Measures”.
71
Table of Contents
Depreciation expense included in gross profit increased from $1.4 million for the three months ended March 31, 2012 to $1.8 million for the three months ended March 31, 2013. The increase is attributable to an increase in our depreciable asset base from $70.7 million at March 31, 2012 to $90.2 million at March 31, 2013.
Several other factors contributed to the remaining $1.4 million decrease in gross profit. Lower volume and higher manufacturing conversion costs in the three months ended March 31, 2013 contributed $1.9 million and $2.3 million, respectively, to the decrease in gross profit. The increase in manufacturing conversion costs was due to product mix and operational issues which adversely impacted product flow and yield at Olin Brass. In addition, the three months ended March 31, 2012 included a favorable settlement of a workers compensation claim of $0.7 million. These factors were partially offset by higher average sales prices of $3.4 million and lower shrinkage costs due to lower metal costs of $0.1 million.
Selling, General and Administrative Expenses
Selling, general and administrative expenses increased by $1.8 million, or 10.1%, from $17.9 million for the three months ended March 31, 2012 to $19.7 million for the three months ended March 31, 2013. The increase in selling, general and administrative expenses was due primarily to an increase of $0.9 million in salaries, benefits and incentive compensation and $0.6 million in outside services both of which were in support of our business strategy, and an increase of $0.5 million in professional fees for legal, consulting and accounting services, which were partially offset by a decrease of $0.2 million in other miscellaneous expenses.
Operating Income
Operating income decreased by $4.9 million, or 15.3%, from $32.1 million for the three months ended March 31, 2012 to $27.2 million for the three months ended March 31, 2013 due to the changes in gross profit and selling, general and administrative expenses described above.
Interest Expense
Interest expense increased by $0.1 million from $9.8 million for the three months ended March 31, 2012 to $9.9 million for the three months ended March 31, 2013. The increase was primarily due to higher average borrowings on our debt facilities of $386.2 million as compared to $310.9 million in 2012, partially offset by lower interest rates (a weighted average of 9.35% per annum during 2013 compared to 10.26% per annum during 2012) and a decrease in amortization of debt discount and debt issuance costs.
The following table summarizes the components of interest expense:
| Three Months Ended March 31, |
||||||||
| (in millions) | 2013 | 2012 | ||||||
| Interest on principal |
$ | 9.0 | $ | 8.1 | ||||
| Interest rate cap agreements |
— | 0.1 | ||||||
| Amortization of debt discount and issuance costs |
0.6 | 1.3 | ||||||
| Other borrowing costs (1) |
0.3 | 0.3 | ||||||
|
|
|
|
|
|||||
| Interest expense |
$ | 9.9 | $ | 9.8 | ||||
|
|
|
|
|
|||||
| (1) | Includes fees related to letters of credit and unused line of credit fees. |
72
Table of Contents
Other Expense, Net
We recorded other expense, net of $0.2 million for the three months ended March 31, 2013 compared to $0.3 million for the three months ended March 31, 2012.
Provision for Income Taxes
Income tax expense decreased $2.2 million, from $8.2 million for the three months ended March 31, 2012 to $6.0 million for the three months ended March 31, 2013. The decrease was due to lower income before provision for income taxes and equity income of $17.1 million for the three months ended March 31, 2013 as compared to $22.0 million for the three months ended March 31, 2012. The effective income tax rate decreased from 37.3% for the three months ended March 31, 2012 to 35.2% for the three months ended March 31, 2013. The following table summarizes the effective income tax rate components for the three months ended March 31, 2013 and 2012, respectively.
| Three Months Ended March 31, |
||||||||
| 2013 | 2012 | |||||||
| Statutory provision rate |
35.0 | % | 35.0 | % | ||||
| Permanent differences and other items |
||||||||
| State tax provision |
3.3 | % | 3.9 | % | ||||
| Section 199 manufacturing credit |
(2.7 | %) | (2.8 | %) | ||||
| Re-rate of deferred taxes |
0.4 | % | — | |||||
| Other |
(0.8 | %) | 1.2 | % | ||||
|
|
|
|
|
|||||
| Effective income tax rate |
35.2 | % | 37.3 | % | ||||
|
|
|
|
|
|||||
Equity Income
Equity income, net of tax, increased $0.1 million from $0.3 million for the three months ended March 31, 2012 to $0.4 million for the three months ended March 31, 2013.
Net Income Attributable to Global Brass and Copper Holdings, Inc.
Net income attributable to Global Brass and Copper Holdings, Inc. decreased by $2.6 million, or 18.6%, from $14.0 million for the three months ended March 31, 2012 to $11.4 million for the three months ended March 31, 2012 due to the decrease in operating income, partially offset by the decrease in the provision for income taxes, as described above.
Consolidated Adjusted EBITDA
Consolidated Adjusted EBITDA decreased by $2.7 million, or 8.2%, from $32.8 million for the three months ended March 31, 2012 to $30.1 million for the three months ended March 31, 2013. The decrease was due to lower volume of $1.9 million, higher manufacturing conversion costs of $2.3 million, a favorable settlement of a workers compensation claim of $0.7 million in the three months ended March 31, 2012, an increase in salaries, benefits and incentive compensation of $0.9 million and outside services of $0.5 million both of which were in support of our business strategy, and an increase in professional fees for legal, consulting and accounting services of $0.5 million. Partially offsetting the decrease were higher average sales prices of $3.4 million and lower shrinkage costs due to lower metal costs of $0.1 million, a decrease in other miscellaneous selling, general and administrative costs of $0.3 million and a decrease in other adjustments included in the calculation of Consolidated Adjusted EBITDA of $0.2 million.
73
Table of Contents
Consolidated EBITDA and Consolidated Adjusted EBITDA are non-GAAP financial measures. See “—Non-GAAP Measures—EBITDA-Based Measures”.
Below is a reconciliation of net income attributable to Global Brass and Copper Holdings, Inc. to Consolidated EBITDA and Consolidated Adjusted EBITDA for the three months ended March 31, 2013 and 2012:
| Three Months Ended March 31, |
||||||||
| (in millions) | 2013 | 2012 | ||||||
| Net income attributable to Global Brass and Copper Holdings, Inc. |
$ | 11.4 | $ | 14.0 | ||||
| Interest expense |
9.9 | 9.8 | ||||||
| Provision for income taxes |
6.0 | 8.2 | ||||||
| Depreciation expense |
1.9 | 1.5 | ||||||
| Amortization expense |
— | — | ||||||
|
|
|
|
|
|||||
| Consolidated EBITDA |
$ | 29.2 | $ | 33.5 | ||||
| Gain on derivative contracts (a) |
— | (1.3 | ) | |||||
| Non-cash accretion of income of Dowa joint venture (b) |
(0.2 | ) | (0.2 | ) | ||||
| Management fees (c) |
0.3 | 0.3 | ||||||
| Specified legal/professional expenses (d) |
0.8 | 0.5 | ||||||
|
|
|
|
|
|||||
| Consolidated Adjusted EBITDA |
$ | 30.1 | $ | 32.8 | ||||
|
|
|
|
|
|||||
| (a) | Represents unrealized gains and losses on derivative contracts in support of our balanced book approach and unrealized gains and losses associated with derivative contracts with respect to electricity and natural gas costs. |
| (b) | As a result of the application of purchase accounting in connection with the November 2007 acquisition, no carrying value was initially assigned to our equity investment in our joint venture with Dowa. This adjustment represents the accretion of equity in our joint venture with Dowa at the date of the acquisition over a 13-year period (which represents the estimated useful life of the technology and patents of the joint venture). See note 5 to our unaudited consolidated financial statements, which are included elsewhere in this prospectus. |
| (c) | Represents annual management fees payable to affiliates of KPS. See note 12 to our unaudited consolidated financial statements, which are included elsewhere in this prospectus. |
| (d) | Specified legal/professional expenses for the three months ended March 31, 2013 and 2012 included $0.8 million and $0.5 million, respectively, of professional fees for accounting, tax, legal and consulting services related to this offering and certain regulatory and compliance matters. |
74
Table of Contents
Segment Results of Operations
Segment Results of Operations for the Three Months ended March 31, 2013, Compared to the Three Months Ended March 31, 2012.
| (in millions) | Three Months Ended March 31, |
Change 2013 vs. 2012 |
||||||||||||||
| 2013 | 2012 | Amount | Percent | |||||||||||||
| Pounds shipped |
||||||||||||||||
| Olin Brass |
66.5 | 66.0 | 0.5 | 0.8 | % | |||||||||||
| Chase Brass |
58.0 | 61.8 | (3.8 | ) | (6.1 | %) | ||||||||||
| A.J. Oster |
17.2 | 18.2 | (1.0 | ) | (5.5 | %) | ||||||||||
| Corporate & other (1) |
(10.2 | ) | (13.1 | ) | 2.9 | (22.1 | %) | |||||||||
|
|
|
|
|
|
|
|||||||||||
| Total |
131.5 | 132.9 | (1.4 | ) | (1.1 | %) | ||||||||||
|
|
|
|
|
|
|
|||||||||||
| Net Sales |
||||||||||||||||
| Olin Brass |
$ | 200.9 | $ | 178.7 | $ | 22.2 | 12.4 | % | ||||||||
| Chase Brass |
174.5 | 188.8 | (14.3 | ) | (7.6 | %) | ||||||||||
| A.J. Oster |
84.0 | 88.4 | (4.4 | ) | (5.0 | %) | ||||||||||
| Corporate & other (1) |
(14.4 | ) | (12.5 | ) | (1.9 | ) | 15.2 | % | ||||||||
|
|
|
|
|
|
|
|||||||||||
| Total |
$ | 445.0 | $ | 443.4 | $ | 1.6 | 0.4 | % | ||||||||
|
|
|
|
|
|
|
|||||||||||
| Segment Adjusted EBITDA |
||||||||||||||||
| Olin Brass |
$ | 11.5 | $ | 10.7 | $ | 0.8 | 7.5 | % | ||||||||
| Chase Brass |
18.9 | 19.9 | (1.0 | ) | (5.0 | %) | ||||||||||
| A.J. Oster |
4.5 | 5.2 | (0.7 | ) | (13.5 | %) | ||||||||||
|
|
|
|
|
|
|
|||||||||||
| Total for operating segments |
$ | 34.9 | $ | 35.8 | $ | (0.9 | ) | (2.5 | %) | |||||||
|
|
|
|
|
|
|
|||||||||||
| (1) | Amounts represent intercompany eliminations |
Below is a reconciliation of income before provision for income taxes and equity income to Segment EBITDA and Segment Adjusted EBITDA:
| Three Months Ended March 31, 2013 |
Three Months Ended March 31, 2012 |
|||||||||||||||||||||||
| ($ in millions) | Olin Brass |
Chase Brass |
AJ Oster |
Olin Brass |
Chase Brass |
AJ Oster |
||||||||||||||||||
| Income before provision for income taxes and equity income: |
$ | 10.3 | $ | 18.3 | $ | 4.4 | $ | 9.9 | $ | 19.4 | $ | 5.1 | ||||||||||||
| Interest expense |
— | — | — | — | — | — | ||||||||||||||||||
| Depreciation expense |
1.1 | 0.6 | 0.1 | 0.8 | 0.5 | 0.1 | ||||||||||||||||||
| Amortization expense |
— | — | — | — | — | — | ||||||||||||||||||
|
|
|
|
|
|
|
|
|
|
|
|
|
|||||||||||||
| Segment EBITDA (1) |
$ | 11.4 | $ | 18.9 | $ | 4.5 | $ | 10.7 | $ | 19.9 | $ | 5.2 | ||||||||||||
| Equity income, net of tax |
0.4 | — | — | 0.3 | — | — | ||||||||||||||||||
| Net income attributable to non-controlling interest |
(0.1 | ) | — | — | (0.1 | ) | — | — | ||||||||||||||||
| Non-cash accretion of income of Dowa joint venture (2) |
(0.2 | ) | — | — | (0.2 | ) | — | — | ||||||||||||||||
|
|
|
|
|
|
|
|
|
|
|
|
|
|||||||||||||
| Segment Adjusted EBITDA (1) |
$ | 11.5 | $ | 18.9 | $ | 4.5 | $ | 10.7 | $ | 19.9 | $ | 5.2 | ||||||||||||
|
|
|
|
|
|
|
|
|
|
|
|
|
|||||||||||||
| (1) | Segment EBITDA and Segment Adjusted EBITDA are non-GAAP financial measures. See “—Non-GAAP Measures EBITDA-Based Measures”. |
| (2) | As a result of the application of purchase accounting in connection with the November 2007 acquisition, no carrying value was initially assigned to our equity investment in our joint venture with Dowa. This adjustment represents the accretion of equity in our joint venture with Dowa over a 13-year period (which represents the estimated useful life of the technology and patents of the joint venture). See note 5 to our unaudited consolidated financial statements, which are included elsewhere in this prospectus. |
75
Table of Contents
Olin Brass
Olin Brass net sales increased by $22.2 million, or 12.4%, from $178.7 million for the three months ended March 31, 2012 to $200.9 million for the three months ended March 31, 2013. The increase was due to the sale of unprocessed metal, higher volume, and higher average sales prices, partially offset by lower metal prices.
Volume increased by 0.5 million pounds, or 0.8%, from 66.0 million pounds for the three months ended March 31, 2012 to 66.5 million pounds for the three months ended March 31, 2013. The increase in volume, which contributed $1.3 million to the increase in net sales, was the result of increased demand in the coinage and munitions end markets, partially offset by lower demand in the electronics/electrical components end market and lower volume to A.J. Oster. In the first quarter of 2013, A.J. Oster reduced purchases from Olin Brass and increased purchases from third party suppliers by approximately 2.8 million pounds compared to the same period in 2012. Excluding sales to A.J. Oster, Olin Brass volumes increased by 3.3 million pounds, or 6.3% in the first quarter of 2013 compared to the same period in 2012.
The sale of unprocessed metal and higher average sales prices, partially offset by lower metal prices for the three months ended March 31, 2013 contributed $20.9 million to the increase in net sales as compared to the same period in 2012.
Segment Adjusted EBITDA of Olin Brass increased by $0.8 million, from $10.7 million for the three months ended March 31, 2012 to $11.5 million for the three months ended March 31, 2013. The increase was due primarily to higher average sales prices in 2013 compared to 2012 and lower shrinkage costs due to lower metal costs, partially offset by higher selling, general and administrative expenses and higher manufacturing conversion costs.
Chase Brass
Chase Brass net sales decreased by $14.3 million, or 7.6%, from $188.8 million for the three months ended March 31, 2012 to $174.5 million for the three months ended March 31, 2013. The decrease was due primarily to lower volume and lower metal prices, partially offset by higher average sales prices.
Volume decreased by 3.8 million pounds, or 6.1%, from 61.8 million pounds for the three months ended March 31, 2012 to 58.0 million pounds for the three months ended March 31, 2013. The decrease in volume, which contributed $11.6 million to the decrease in net sales, was the result of lower demand for brass rod in the building and housing and electronics/electrical components end markets due primarily to increased competition from foreign imports.
Lower metal prices, partially offset by higher average sales prices for the three months ended March 31, 2013, contributed $2.7 million to the decrease in net sales as compared to the same period in 2012.
Segment Adjusted EBITDA of Chase Brass decreased by $1.0 million, from $19.9 million for the three months ended March 31, 2012 to $18.9 million for the three months ended March 31, 2013. The decrease was due primarily to lower volume and higher manufacturing conversion costs, partially offset by higher average sales prices.
A.J. Oster
A.J. Oster net sales decreased by $4.4 million, or 5.0%, from $88.4 million for the three months ended March 31, 2012 to $84.0 million for the three months ended March 31, 2013. The decrease was due primarily to lower volume in the three months ended March 31, 2013 compared to the same period in 2012 and lower metal prices, partially offset by higher average sales prices.
76
Table of Contents
Volume decreased 1.0 million pounds, or 5.5%, from 18.2 million pounds for the three months ended March 31, 2012 to 17.2 million pounds for the three months ended March 31, 2013. The decrease in volume, which contributed $4.6 million to the decrease in net sales, was primarily the result of lower demand in the building and housing and electronics/electrical components end markets.
Higher average sales prices, partially offset by lower metal prices, offset the decrease in net sales by $0.2 million in the three months ended March 31, 2013 as compared to the same period in 2012.
Segment Adjusted EBITDA of A.J. Oster decreased by $0.7 million, from $5.2 million for the three months ended March 31, 2012 to $4.5 million for the three months ended March 31, 2013. The decrease was due to higher manufacturing conversion costs and lower volume, which was partially offset by higher average sales prices.
Consolidated Results of Operations for the Year Ended December 31, 2012, Compared to the Year Ended December 31, 2011.
The statement of operations data presented below for the years ended December 31, 2012 and 2011 are derived from our audited consolidated financial statements.
| For the Year Ended December 31, | Change: 2012 vs. 2011 |
|||||||||||||||||||||||
| (in millions) | 2012 | % of Net Sales | 2011 | % of Net Sales | Amount | Percent | ||||||||||||||||||
| Net sales |
$ | 1,650.5 | 100.0 | % | $ | 1,779.1 | 100.0 | % | $ | (128.6 | ) | (7.2 | %) | |||||||||||
| Cost of sales |
1,467.3 | 88.9 | % | 1,583.5 | 89.0 | % | (116.2 | ) | (7.3 | %) | ||||||||||||||
|
|
|
|
|
|
|
|||||||||||||||||||
| Gross profit |
183.2 | 11.1 | % | 195.6 | 11.0 | % | (12.4 | ) | (6.3 | %) | ||||||||||||||
| Selling, general and administrative expenses |
92.7 | 5.6 | % | 69.4 | 3.9 | % | 23.3 | 33.6 | % | |||||||||||||||
|
|
|
|
|
|
|
|||||||||||||||||||
| Operating income |
90.5 | 5.5 | % | 126.2 | 7.1 | % | (35.7 | ) | (28.3 | %) | ||||||||||||||
| Interest expense |
39.7 | 2.4 | % | 40.0 | 2.2 | % | (0.3 | ) | (0.8 | %) | ||||||||||||||
| Loss on extinguishment of debt |
19.6 | 1.2 | % | — | 0.0 | % | 19.6 | N/A | ||||||||||||||||
| Other expense, net |
0.1 | 0.0 | % | 0.4 | 0.0 | % | (0.3 | ) | (75.0 | %) | ||||||||||||||
|
|
|
|
|
|
|
|||||||||||||||||||
| Income before provision for income taxes and equity income |
31.1 | 1.9 | % | 85.8 | 4.8 | % | (54.7 | ) | (63.8 | %) | ||||||||||||||
| Provision for income taxes |
19.2 | 1.2 | % | 31.4 | 1.8 | % | (12.2 | ) | (38.9 | %) | ||||||||||||||
|
|
|
|
|
|
|
|||||||||||||||||||
| Income before equity income |
11.9 | 0.7 | % | 54.4 | 3.1 | % | (42.5 | ) | (78.1 | %) | ||||||||||||||
| Equity income, net of tax |
1.0 | 0.1 | % | 0.9 | 0.1 | % | 0.1 | 11.1 | % | |||||||||||||||
|
|
|
|
|
|
|
|||||||||||||||||||
| Net income |
12.9 | 0.8 | % | 55.3 | 3.1 | % | (42.4 | ) | (76.7 | %) | ||||||||||||||
| Less: Net income attributable to noncontrolling interest |
0.4 | 0.0 | % | 0.2 | 0.0 | % | 0.2 | 100.0 | % | |||||||||||||||
|
|
|
|
|
|
|
|||||||||||||||||||
| Net income attributable to Global Brass and Copper Holdings, Inc. |
$ | 12.5 | 0.8 | % | $ | 55.1 | 3.1 | % | $ | (42.6 | ) | (77.3 | %) | |||||||||||
|
|
|
|
|
|
|
|||||||||||||||||||
| Consolidated Adjusted EBITDA |
$ | 115.4 | 7.0 | % | $ | 122.6 | 6.9 | % | $ | (7.2 | ) | (5.9 | %) | |||||||||||
Net Sales
Net sales decreased by $128.6 million, or 7.2%, from $1,779.1 million for the year ended December 31, 2011 to $1,650.5 million for the year ended December 31, 2012. Decreases in metal prices, volume and sales prices decreased net sales by $97.8 million, $29.5 million, and $1.3 million,
77
Table of Contents
respectively for the year ended December 31, 2012 compared to the year ended December 31, 2011. Metal prices reflect the replacement cost recovery from the customer, whereas the sales prices represent the pricing component of adjusted sales, which we define as the excess of net sales over the metal component of net sales.
Volume decreased 6.8 million pounds, or 1.3%, from 510.0 million pounds for the year ended December 31, 2011 to 503.2 million pounds for the year ended December 31, 2012. The decrease in volume was the result of our continued efforts to optimize our product mix, increased competition from foreign imports, and the suspension in $1 coin production by the United States Mint, partially offset by the increase in demand in the munitions, coinage (other than volumes associated with the $1 coin), building and housing and automotive end markets.
The metal cost recovery component of net sales decreased by $123.0 million, or 9.9%, from $1,248.6 million for the year ended December 31, 2011 to $1,125.6 million for the year ended December 31, 2012. Per unit metal costs decreased 8.6% and contributed $97.8 million to the decrease in net sales, primarily as a result of a 9.8% decrease in average daily copper prices as reported by COMEX, during the year ended December 31, 2012 as compared to the same period in 2011. Furthermore, lower volume decreased the metal cost recovery component of net sales by $25.2 million.
Adjusted Sales
Adjusted sales, the excess of net sales over the metal component of net sales, decreased by $5.6 million, or 1.1%, from $530.5 million for the year ended December 31, 2011 to $524.9 million for the year ended December 31, 2012. Lower volume and lower average selling prices contributed $4.3 million and $1.3 million to the decrease in adjusted sales. Adjusted sales per pound remained flat in 2012 compared to 2011, which was the result of a net decrease in average selling prices at the segment level, offset by the effect of changes in the mix of sales by segment relative to the company as a whole.
Adjusted sales is a non-GAAP financial measure. See “—Non-GAAP Measures—Adjusted Sales”. The following table presents a reconciliation of net sales to adjusted sales and net sales per pound to adjusted sales per pound:
| For the Year Ended December 31, |
Change: 2012 vs. 2011 |
|||||||||||||||
| (in millions, except per pound values) | 2012 | 2011 | Amount | Percent | ||||||||||||
| Pounds shipped |
503.2 | 510.0 | (6.8 | ) | (1.3 | %) | ||||||||||
| Net sales |
$ | 1,650.5 | $ | 1,779.1 | $ | (128.6 | ) | (7.2 | %) | |||||||
| Metal component of net sales |
1,125.6 | 1,248.6 | (123.0 | ) | (9.9 | %) | ||||||||||
|
|
|
|
|
|
|
|||||||||||
| Adjusted sales |
$ | 524.9 | $ | 530.5 | $ | (5.6 | ) | (1.1 | %) | |||||||
|
|
|
|
|
|
|
|||||||||||
| $ per pound shipped |
||||||||||||||||
| Net sales per pound |
$ | 3.28 | $ | 3.49 | $ | (0.21 | ) | (6.0 | %) | |||||||
| Metal component of net sales per pound |
2.24 | 2.45 | (0.21 | ) | (8.6 | %) | ||||||||||
|
|
|
|
|
|
|
|||||||||||
| Adjusted sales per pound |
$ | 1.04 | $ | 1.04 | $ | — | 0.0 | % | ||||||||
|
|
|
|
|
|
|
|||||||||||
| Average copper price per pound reported by COMEX |
$ | 3.61 | $ | 4.00 | $ | (0.39 | ) | (9.8 | %) | |||||||
78
Table of Contents
Gross Profit
Gross profit decreased by $12.4 million, or 6.3%, from $195.6 million for the year ended December 31, 2011 to $183.2 million for the year ended December 31, 2012. Gross profit per pound decreased from $0.38 for the year ended December 31, 2011 to $0.36 for the year ended December 31, 2012.
Gross profit for the year ended December 31, 2012 included a gain of $1.6 million related to net unrealized gains on derivative contracts. Gross profit for the year ended December 31, 2011 included a loss of $1.1 million related to net unrealized losses on derivative contracts. We exclude all such gains and losses in calculating Segment Adjusted EBITDA and Consolidated Adjusted EBITDA. See “—Non-GAAP Measures—EBITDA-Based Measures”.
Gross profit in the years ended December 31, 2012 and 2011 also reflects the reduction of inventory quantities and a decrement in the base LIFO layer, which is carried at a copper price of $1.52 per pound and is significantly below weighted-average replacement costs of $3.61 and $4.00 per pound for the years ended December 31, 2012 and 2011, respectively. Gross profit for the year ended December 31, 2012 included a LIFO gain of $4.8 million, compared to a LIFO gain of $15.2 million in the year ended December 31, 2011. We also reduced the recorded value of inventory by $0.3 million in the year ended December 31, 2012 related to a lower of cost or market adjustment, which is reflected in gross profit as a component of cost of sales. We exclude the above items in calculating Segment Adjusted EBITDA and Consolidated Adjusted EBITDA. See “—Non-GAAP Measures—EBITDA-Based Measures”.
Depreciation expense included in gross profit increased from $4.5 million for the year ended December 31, 2011 to $6.5 million for the year ended December 31, 2012. The increase is attributable to an increase in our depreciable asset base from $67.1 million at December 31, 2011 to $87.4 million at December 31, 2012.
Several other offsetting factors contributed to the remaining $2.4 million decrease in gross profit in 2012. Lower volume and lower average sales prices, in the year ended December 31, 2012 contributed $3.2 million and $1.3 million, respectively, to the decrease in gross profit. These factors were partially offset by lower manufacturing conversion costs and lower shrinkage costs due to lower metal costs of $1.1 million and $1.0 million, respectively, in the year ended December 31, 2012.
Selling, General and Administrative Expenses
Selling, general and administrative expenses increased by $23.3 million, or 33.6%, from $69.4 million for the year ended December 31, 2011 to $92.7 million for the year ended December 31, 2012.
Non-cash compensation charges for vested profits interest shares included in selling, general and administrative expenses were $19.5 million and $0.9 million for the years ended December 31, 2012 and 2011, respectively.
In 2012, we decreased the allowance for doubtful accounts by $0.8 million compared to $4.2 million in 2011, which in both cases was due to management’s change in the estimate of the recoverability of accounts receivable.
Several other offsetting factors contributed to the remaining $1.3 million increase in selling, general and administrative expenses in 2012. Professional fees for accounting, tax, legal and consulting services increased by $2.0 million and operating lease rental expenses increased by $0.4 million in 2012 as compared to 2011. Partially offsetting the increase was a decrease of $1.0 million in incentive compensation, and $0.1 million in other miscellaneous expenses.
79
Table of Contents
Operating Income
Operating income decreased by $35.7 million, or 28.3%, from $126.2 million for the year ended December 31, 2011 to $90.5 million for the year ended December 31, 2012 due to the changes in gross profit and selling, general and administrative expenses described above.
Interest Expense
Interest expense decreased by $0.3 million from $40.0 million for the year ended December 31, 2011 to $39.7 million for the year ended December 31, 2012. The decrease was primarily due to lower non-cash interest expense associated with an interest rate cap agreements and lower interest rates (a weighted average of 9.59% per annum during 2012 compared to 10.26% per annum during 2011) and a net decrease in amortization of debt discount and debt issuance costs, partially offset by higher average borrowings on our debt facilities of $355.4 as compared to $319.0 million in 2011.
The following table summarizes the components of interest expense:
| For the Year Ended December 31, |
||||||||
| (in millions) | 2012 | 2011 | ||||||
| Interest on principal |
$ | 34.0 | $ | 32.7 | ||||
| Interest rate cap agreements |
0.2 | 1.9 | ||||||
| Amortization of debt discount and issuance costs |
4.6 | 4.7 | ||||||
| Capitalized interest |
— | (0.6 | ) | |||||
| Other borrowing costs (1) |
0.9 | 1.3 | ||||||
|
|
|
|
|
|||||
| Interest expense |
$ | 39.7 | $ | 40.0 | ||||
|
|
|
|
|
|||||
| (1) | Includes interest on capital lease obligations and fees related to letters of credit and unused line of credit fees. |
Loss on Extinguishment of Debt
In connection with the Term Loan Refinancing, we recognized $19.6 million as loss from extinguishment of debt for the year ended December 31, 2012. The loss on extinguishment of debt includes the write-off of $7.1 million of unamortized debt issuance costs and $4.9 million of unamortized debt discount as well as $6.4 million of call premium and $0.1 million of professional service fees related to the early termination. Additionally, $1.1 million of costs associated with the issuance of the Senior Secured Notes was expensed as incurred in accordance with ASC 470-50, Modifications and Extinguishments.
Other Expense, Net
We recorded other expense, net of $0.1 million for the year ended December 31, 2012 compared to $0.4 million for the year ended December 31, 2011.
Provision for Income Taxes
Income tax expense decreased by $12.2 million, from $31.4 million for the year ended December 31, 2011 to $19.2 million for the year ended December 31, 2012. The decrease was due to a decrease in income before provision for income taxes and equity income of $54.7 million. The effective income tax rate increased from 36.6% for the year ended December 31, 2011 to 61.7% for the year ended December 31, 2012. The year over year increase was due to an increase in the non-deductible non-cash compensation, a higher state effective tax rate as well as higher return to provision adjustments.
80
Table of Contents
The following table summarizes the effective income tax rate components for the years ended December 31, 2012 and 2011:
| For the Year Ended December 31, |
||||||||
| 2012 | 2011 | |||||||
| Statutory provision rate |
35.0 | % | 35.0 | % | ||||
| Permanent differences and other items |
||||||||
| State tax provision |
6.7 | % | 3.9 | % | ||||
| Section 199 manufacturing credit |
(3.2 | %) | (2.3 | %) | ||||
| Incremental tax effects of foreign earnings |
1.8 | % | 0.2 | % | ||||
| Return to provision adjustments |
1.2 | % | (0.7 | %) | ||||
| Re-rate of deferred taxes |
(0.8 | %) | (0.3 | %) | ||||
| Non-deductible non-cash compensation (1) |
22.0 | % | 0.4 | % | ||||
| Other |
(1.0 | %) | 0.4 | % | ||||
|
|
|
|
|
|||||
| Effective income tax rate |
61.7 | % | 36.6 | % | ||||
|
|
|
|
|
|||||
| (1) | Reflects the increase in effective income tax rate resulting from non-cash compensation expense that was recognized by us in connection with $19.5 million of distributions made to certain of our executives and other employees by Halkos in June 2012 from the proceeds it received from us as a result of the Term Loan Refinancing. For the year ended December 31, 2011, non-cash compensation expense totaled $0.9 million. The additional selling, general and administrative expense lowered our income before provision for income taxes and equity income, which resulted in our effective tax rate being higher in the 2012 and 2011 periods. Because even larger distributions to certain of our executives and other employees are expected to be made by Halkos from the net proceeds of this offering, a similar (and proportionally larger) effect is expected to occur in the fiscal periods during which such distributions are recorded. |
Equity Income
Equity income, net of tax, remained relatively flat from $0.9 million for the year ended December 31, 2011 to $1.0 million for the year ended December 31, 2012.
Net Income Attributable to Global Brass and Copper Holdings, Inc.
Net income attributable to Global Brass and Copper Holdings, Inc. decreased by $42.6 million, or 77.3%, from $55.1 million for the year ended December 31, 2011 to $12.5 million for the year ended December 31, 2012 due to the loss on extinguishment of debt, non-cash compensation charges for vested profits interest shares and other changes in operating income, partially offset by the decrease in provision for income taxes, as described above.
Consolidated Adjusted EBITDA
Consolidated Adjusted EBITDA decreased by $7.2 million, or 5.9%, from $122.6 million for the year ended December 31, 2011 to $115.4 million for the year ended December 31, 2012. The decrease was due to lower volume of $3.2 million, lower average sales prices of $1.3 million, the change in the accounts receivable recoverability estimate resulting in the decrease in the allowance for doubtful accounts of $0.8 million in 2012 (compared to $4.2 million in 2011) and increases in legal, audit and professional fees of $2.8 million. Partially offsetting the decrease were lower manufacturing conversion costs of $1.1 million, lower shrinkage costs of $1.0 million due to lower metal costs, lower incentive compensation costs of $1.0 million and a decrease in other adjustments included in the calculation of Consolidated Adjusted EBITDA of $0.4 million.
81
Table of Contents
Consolidated EBITDA and Consolidated Adjusted EBITDA are non-GAAP financial measures. See “—Non-GAAP Measures—EBITDA-Based Measures”. Below is a reconciliation of net income attributable to Global Brass and Copper Holdings, Inc. to Consolidated EBITDA and Consolidated Adjusted EBITDA for the years ended December 31, 2012 and 2011:
| For the Year Ended December 31, |
||||||||
| (in millions) | 2012 | 2011 | ||||||
| Net income attributable to Global Brass and Copper Holdings, Inc. |
$ | 12.5 | $ | 55.1 | ||||
| Interest expense |
39.7 | 40.0 | ||||||
| Provision for income taxes |
19.2 | 31.4 | ||||||
| Depreciation expense |
6.8 | 4.5 | ||||||
| Amortization expense |
0.1 | 0.2 | ||||||
|
|
|
|
|
|||||
| Consolidated EBITDA |
$ | 78.3 | $ | 131.2 | ||||
| (Gain) loss on derivative contracts (a) |
(1.6 | ) | 1.1 | |||||
| Gain from LIFO layer depletion (b) |
(4.8 | ) | (15.2 | ) | ||||
| Loss on extinguishment of debt (c) |
19.6 | — | ||||||
| Non-cash accretion of income of Dowa joint venture (d) |
(0.7 | ) | (0.7 | ) | ||||
| Non-cash Halkos profits interest compensation expense (e) |
19.5 | 0.9 | ||||||
| Management fees (f) |
1.0 | 1.0 | ||||||
| Specified legal/professional expenses (g) |
3.3 | 4.3 | ||||||
| Lower of cost or market adjustment to inventory (h) |
0.3 | — | ||||||
| Other adjustments (i) |
0.5 | — | ||||||
|
|
|
|
|
|||||
| Consolidated Adjusted EBITDA |
$ | 115.4 | $ | 122.6 | ||||
|
|
|
|
|
|||||
| (a) | Represents unrealized gains and losses on derivative contracts in support of our balanced book approach and unrealized gains and losses associated with derivative contracts with respect to electricity and natural gas costs. |
| (b) | Calculated based on the difference between the base year LIFO carrying value and the metal prices prevailing in the market at the time of inventory depletion. |
| (c) | Represents the loss on the extinguishment of debt recognized in connection with the Term Loan Refinancing. |
| (d) | As a result of the application of purchase accounting in connection with the November 2007 acquisition, no carrying value was initially assigned to our equity investment in our joint venture with Dowa. This adjustment represents the accretion of equity in our joint venture with Dowa at the date of the acquisition over a 13-year period (which represents the estimated useful life of the technology and patents of the joint venture). See note 7 to our audited consolidated financial statements, which are included elsewhere in this prospectus. |
| (e) | The 2012 amount represents dividend payments made by Halkos to members of our management that resulted in a non-cash compensation charge in connection with the Parent Distribution in June 2012. |
| The 2011 amount represents a portion of the dividend payments made by Halkos to members of our management that resulted in a non-cash compensation charge in connection with the refinancing transaction that occurred in August 2010. See note 17 to our audited consolidated financial statements, which are included elsewhere in this prospectus. |
| (f) | Represents annual management fees payable to affiliates of KPS. See note 15 to our audited consolidated financial statements, which are included elsewhere in this prospectus. |
| (g) | Specified legal/professional expenses for the year ended December 31, 2012 included $3.3 million of professional fees for accounting, tax, legal and consulting services related to a contemplated initial public offering and certain regulatory and compliance matters. |
| Specified legal/professional expenses for the year ended December 31, 2011 included $3.9 million of professional fees for accounting, tax, legal and consulting services related to a contemplated initial public offering and $0.9 million of expense incurred relating to a waiver obtained from our lenders under the Term Loan Facility and the 2010 ABL Facility, $0.9 million of expense related to an abandoned contemplated acquisition, and $0.6 million of expense related to the October 2011 amendment of the Term Loan Facility and the 2010 ABL Facility. Partly offsetting this was income of $2.0 million from a favorable legal settlement related to a products liability lawsuit in which we were named as a third-party defendant. The waiver fee paid related to a waiver from the lenders under the Term Loan Facility and the 2010 ABL Facility for a technical |
82
Table of Contents
| restatement of the financial statements of Global Brass and Copper, Inc. previously delivered and an additional waiver because the consolidated financial statements of Global Brass and Copper, Inc. for the year ended December 31, 2010 could not be delivered within the prescribed time period as a result of the restatement. For more information, see “—Liquidity and Capital Resources—Outstanding Indebtedness—The ABL Facility” and “—Internal Control over Financial Reporting”. |
| (h) | Represents a non-cash lower of cost or market charge for the write down of inventory. |
| (i) | Represents a call premium of $0.5 million as a result of a voluntary prepayment of $15.0 million on our Term Loan Facility in April 2012. |
Segment Results of Operations
Segment Results of Operations for the Year Ended December 31, 2012, Compared to the Year Ended December 31, 2011
See note 18 of our audited consolidated financial statements included elsewhere in this prospectus for additional information regarding our segment reporting.
| For the Year Ended December 31, |
Change 2012 vs. 2011 |
|||||||||||||||
| (in millions) | 2012 | 2011 | Amount | Percent | ||||||||||||
| Pounds shipped |
||||||||||||||||
| Olin Brass |
266.2 | 261.9 | 4.3 | 1.6 | % | |||||||||||
| Chase Brass |
216.9 | 225.8 | (8.9 | ) | (3.9 | %) | ||||||||||
| A.J. Oster |
67.2 | 70.2 | (3.0 | ) | (4.3 | %) | ||||||||||
| Corporate & other (1) |
(47.1 | ) | (47.9 | ) | 0.8 | 1.7 | % | |||||||||
|
|
|
|
|
|
|
|||||||||||
| Total |
503.2 | 510.0 | (6.8 | ) | (1.3 | %) | ||||||||||
|
|
|
|
|
|
|
|||||||||||
| Net Sales |
||||||||||||||||
| Olin Brass |
$ | 722.9 | $ | 766.5 | $ | (43.6 | ) | (5.7 | %) | |||||||
| Chase Brass |
648.0 | 705.6 | (57.6 | ) | (8.2 | %) | ||||||||||
| A.J. Oster |
326.4 | 356.2 | (29.8 | ) | (8.4 | %) | ||||||||||
| Corporate & other (1) |
(46.8 | ) | (49.2 | ) | 2.4 | 4.9 | % | |||||||||
|
|
|
|
|
|
|
|||||||||||
| Total |
$ | 1,650.5 | $ | 1,779.1 | $ | (128.6 | ) | (7.2 | %) | |||||||
|
|
|
|
|
|
|
|||||||||||
| Segment Adjusted EBITDA |
||||||||||||||||
| Olin Brass |
$ | 45.1 | $ | 45.3 | $ | (0.2 | ) | (0.4 | %) | |||||||
| Chase Brass |
66.6 | 73.7 | (7.1 | ) | (9.6 | %) | ||||||||||
| A.J. Oster |
19.5 | 17.9 | 1.6 | 8.9 | % | |||||||||||
|
|
|
|
|
|
|
|||||||||||
| Total for operating segments |
$ | 131.2 | $ | 136.9 | $ | (5.7 | ) | (4.2 | %) | |||||||
|
|
|
|
|
|
|
|||||||||||
| (1) | Amounts represent intercompany eliminations |
83
Table of Contents
Below is a reconciliation of income before provision for income taxes and equity income to Segment EBITDA and Segment Adjusted EBITDA:
| For the Year Ended December 31, 2012 |
For the Year Ended December 31, 2011 |
|||||||||||||||||||||||
| (in millions) | Olin Brass |
Chase Brass |
AJ Oster |
Olin Brass |
Chase Brass |
AJ Oster |
||||||||||||||||||
| Income before provision for income taxes and equity income: |
$ | 41.6 | $ | 65.7 | $ | 23.7 | $ | 51.0 | $ | 71.8 | $ | 24.8 | ||||||||||||
| Interest expense |
— | — | — | 0.1 | — | — | ||||||||||||||||||
| Depreciation expense |
3.8 | 2.4 | 0.3 | 2.6 | 1.7 | 0.2 | ||||||||||||||||||
| Amortization expense |
— | 0.1 | — | — | 0.2 | — | ||||||||||||||||||
|
|
|
|
|
|
|
|
|
|
|
|
|
|||||||||||||
| Segment EBITDA (1) |
$ | 45.4 | $ | 68.2 | $ | 24.0 | $ | 53.7 | $ | 73.7 | $ | 25.0 | ||||||||||||
| Equity income, net of tax |
1.0 | — | — | 0.9 | — | — | ||||||||||||||||||
| Net income attributable to non-controlling interest |
(0.4 | ) | — | — | (0.2 | ) | — | — | ||||||||||||||||
| Gain from LIFO layer depletion (2) |
(0.2 | ) | (1.6 | ) | (4.5 | ) | (8.4 | ) | — | (7.1 | ) | |||||||||||||
| Non-cash accretion of income of Dowa joint venture (3) |
(0.7 | ) | — | — | (0.7 | ) | — | — | ||||||||||||||||
|
|
|
|
|
|
|
|
|
|
|
|
|
|||||||||||||
| Segment Adjusted EBITDA (1) |
$ | 45.1 | $ | 66.6 | $ | 19.5 | $ | 45.3 | $ | 73.7 | $ | 17.9 | ||||||||||||
|
|
|
|
|
|
|
|
|
|
|
|
|
|||||||||||||
| (1) | Segment EBITDA and Segment Adjusted EBITDA are non-GAAP financial measures. See “—Non-GAAP Measures—EBITDA-Based Measures”. |
| (2) | Calculated based on the difference between the base year LIFO carrying value and the metal prices prevailing in the market at the time of inventory depletion. |
| (3) | As a result of the application of purchase accounting in connection with the November 2007 acquisition, no carrying value was initially assigned to our equity investment in our joint venture with Dowa. This adjustment represents the accretion of equity in our joint venture with Dowa over a 13-year period (which represents the estimated useful life of the technology and patents of the joint venture). See note 7 to our audited consolidated financial statements, which are included elsewhere in this prospectus. |
Olin Brass
Olin Brass net sales decreased by $43.6 million, or 5.7%, from $766.5 million for the year ended December 31, 2011 to $722.9 million for the year ended December 31, 2012. The decrease was due to lower average sales prices primarily due to product mix changes and lower metal prices, partially offset by higher volume.
Volume increased by 4.3 million pounds, or 1.6%, from 261.9 million pounds for the year ended December 31, 2011 to 266.2 million pounds for the year ended December 31, 2012. The increase in volume, which partially offset the decrease in net sales by $12.5 million, was the result of increased demand in the munitions, coinage (other than volumes associated with the $1 coin), and automotive end markets, which was partially offset by lower $1 coin demand by the United States Mint due to the suspension of the $1 coin production.
Lower metal prices combined with lower average sales prices contributed $56.1 million to the decrease in net sales. The lower average sales prices were primarily the result of product mix changes, substantially due to lower demand from the United States Mint as a result of the suspension of the $1 coin production.
Olin Brass’s Segment Adjusted EBITDA decreased slightly to $45.1 million in 2012 as compared to $45.3 million in 2011, which was the result of lower average selling prices, which were partially offset by lower manufacturing conversion costs and higher volume.
84
Table of Contents
Chase Brass
Chase Brass net sales decreased by $57.6 million, or 8.2%, from $705.6 million for the year ended December 31, 2011 to $648.0 million for the year ended December 31, 2012. The decrease was due to lower metal prices and lower volume, partially offset by higher average sales prices.
Volume decreased by 8.9 million pounds, or 3.9%, from 225.8 million pounds for the year ended December 31, 2011 to 216.9 million pounds for the year ended December 31, 2012. The decrease in volume, which contributed $27.8 million to the decrease in net sales, was the result of increased competition from foreign imports, partially offset by increased demand in the building and housing end markets.
Lower metal prices, partially offset by improved pricing, contributed $29.8 million to the decrease in net sales.
Segment Adjusted EBITDA of Chase Brass decreased by $7.1 million, from $73.7 million for the year ended December 31, 2011 to $66.6 million for the year ended December 31, 2012. The decrease was due primarily to lower volume, higher manufacturing conversion costs and a change in management’s estimate of the recoverability of accounts receivable resulting in a reversal of the provision for bad debt, partially offset by lower shrinkage costs due to lower metal costs and higher average selling prices.
A.J. Oster
A.J. Oster net sales decreased by $29.8 million, or 8.4%, from $356.2 million for the year ended December 31, 2011 to $326.4 million for the year ended December 31, 2012. The decrease was due primarily to lower volume as we continue to optimize our product mix and lower metal costs, partially offset by higher average sales prices.
Volume decreased by 3.0 million pounds, or 4.3%, from 70.2 million pounds for the year ended December 31, 2011 to 67.2 million pounds for the year ended December 31, 2012. The decrease in volume, which decreased net sales by $15.1 million, was primarily the result of our continued efforts to optimize our product mix, partially offset by increased demand in the building and housing and automotive end markets.
Lower metal prices, partially offset by improved pricing, contributed $14.7 million to the decrease in net sales.
Segment Adjusted EBITDA of A.J. Oster increased by $1.6 million, from $17.9 million for the year ended December 31, 2011 to $19.5 million for the year ended December 31, 2012. The increase was due to higher average sales prices, partially offset by the impact of lower volume and higher manufacturing conversion costs.
85
Table of Contents
Consolidated Results of Operations for the Year Ended December 31, 2011, Compared to the Year Ended December 31, 2010.
The statement of operations data presented below for the years ended December 31, 2011 and 2010 are derived from our audited consolidated financial statements.
| For the Year Ended December 31, |
Change: 2011 vs. 2010 |
|||||||||||||||||||||||
| (in millions) | 2011 | % of Net Sales | 2010 | % of Net Sales | Amount | Percent | ||||||||||||||||||
| Net sales |
$ | 1,779.1 | 100.0 | % | $ | 1,658.7 | 100.0 | % | $ | 120.4 | 7.3 | % | ||||||||||||
| Cost of sales |
1,583.9 | 89.0 | % | 1,496.7 | 90.2 | % | 86.8 | 5.8 | % | |||||||||||||||
|
|
|
|
|
|
|
|||||||||||||||||||
| Gross profit |
195.6 | 11.0 | % | 162.0 | 9.8 | % | 33.6 | 20.7 | % | |||||||||||||||
| Selling, general and administrative expenses |
69.4 | 3.9 | % | 68.9 | 4.2 | % | 0.5 | 0.7 | % | |||||||||||||||
|
|
|
|
|
|
|
|||||||||||||||||||
| Operating income |
126.2 | 7.1 | % | 93.1 | 5.6 | % | 33.1 | 35.6 | % | |||||||||||||||
| Third party interest expense |
40.0 | 2.2 | % | 22.6 | 1.4 | % | 17.4 | 77.0 | % | |||||||||||||||
| Related party interest expense |
— | 0.0 | % | 2.5 | 0.2 | % | (2.5 | ) | -100.0 | % | ||||||||||||||
| Other expense, net |
0.4 | 0.0 | % | 0.8 | 0.0 | % | (0.4 | ) | -50.0 | % | ||||||||||||||
|
|
|
|
|
|
|
|||||||||||||||||||
| Income before provision for income taxes and equity income |
85.8 | 4.8 | % | 67.2 | 4.1 | % | 18.6 | 27.7 | % | |||||||||||||||
| Provision for income taxes |
31.4 | 1.8 | % | 26.6 | 1.6 | % | 4.8 | 18.0 | % | |||||||||||||||
|
|
|
|
|
|
|
|||||||||||||||||||
| Income before equity income |
54.4 | 3.1 | % | 40.6 | 2.4 | % | 13.8 | 34.0 | % | |||||||||||||||
| Equity income, net of tax |
0.9 | 0.1 | % | 1.5 | 0.1 | % | (0.6 | ) | -40.0 | % | ||||||||||||||
|
|
|
|
|
|
|
|||||||||||||||||||
| Net income |
55.3 | 3.1 | % | 42.1 | 2.5 | % | 13.2 | 31.4 | % | |||||||||||||||
| Less: Net income attributable to noncontrolling interest |
0.2 | 0.0 | % | 0.5 | 0.0 | % | (0.3 | ) | -60.0 | % | ||||||||||||||
|
|
|
|
|
|
|
|||||||||||||||||||
| Net income attributable to Global Brass and Copper Holdings, Inc. |
$ | 55.1 | 3.1 | % | $ | 41.6 | 2.5 | % | $ | 13.5 | 32.5 | % | ||||||||||||
|
|
|
|
|
|
|
|||||||||||||||||||
| Consolidated Adjusted EBITDA |
$ | 122.6 | 6.9 | % | $ | 99.0 | 6.0 | % | $ | 23.6 | 23.8 | % | ||||||||||||
Net Sales
Net sales increased by $120.4 million, or 7.3%, from $1,658.7 million for the year ended December 31, 2010 to $1,779.1 million for the year ended December 31, 2011. Increases in metal prices and sales average prices increased net sales by $225.2 million and $46.0 million, respectively, which were partially offset by a decrease in volume which decreased net sales by $150.8 million. Metal prices reflect the replacement cost recovery from the customer, whereas the sales prices represent the pricing component of adjusted sales, which we define as the excess of net sales over the metal component of net sales.
Volume decreased by 44.1 million pounds, or 8.0%, from 554.1 million pounds for the year ended December 31, 2010 to 510.0 million pounds for the year ended December 31, 2011. The decrease in
86
Table of Contents
volume was the result of our continued efforts to rationalize our product mix in order to provide optimal margins and growth opportunities and lower demand in the building and housing end market, partially offset by higher demand in the automotive end market.
The metal cost recovery component of net sales increased by $128.4 million, or 11.5%, from $1,120.2 million for the year ended December 31, 2010 to $1,248.6 million for the year ended December 31, 2011. Per unit metal cost increased 21.3% and contributed $225.2 million to the increase in net sales, primarily as a result of a 16.6% increase in average daily copper prices as reported by COMEX during the year ended December 31, 2011 as compared to the same period in 2010. Lower volume partially offset the increase in the metal cost recovery component of net sales by $96.8 million.
Adjusted Sales
Adjusted sales, the excess of net sales over the metal component of net sales, decreased by $8.0 million, or 1.5%, from $538.5 million for the year ended December 31, 2010 to $530.5 million for the year ended December 31, 2011. Lower volume contributed $54.0 million to the decrease, which was partially offset by $46.0 million related to improved pricing and the rationalization of product mix. Adjusted sales per pound increased in 2011 by 7.2% compared to 2010, which was the result of a net increase in average selling prices at the segment level, partially offset by the effect of changes in the mix of sales by segment relative to the company as a whole.
Adjusted sales is a non-GAAP financial measure. See “—Non-GAAP Measures—Adjusted Sales”. The following table presents a reconciliation of net sales to adjusted sales and net sales per pound to adjusted sales per pound:
| For the Year Ended December 31, |
Change: 2011 vs. 2010 |
|||||||||||||||
| (in millions, except per pound values) | 2011 | 2010 | Amount | Percent | ||||||||||||
| Pounds shipped |
510.0 | 554.1 | (44.1 | ) | (8.0 | %) | ||||||||||
| Net sales |
$ | 1,779.1 | $ | 1,658.7 | $ | 120.4 | 7.3 | % | ||||||||
| Metal component of net sales |
1,248.6 | 1,120.2 | 128.4 | 11.5 | % | |||||||||||
|
|
|
|
|
|
|
|||||||||||
| Adjusted sales |
$ | 530.5 | $ | 538.5 | $ | (8.0 | ) | (1.5 | %) | |||||||
|
|
|
|
|
|
|
|||||||||||
| $ per pound shipped |
||||||||||||||||
| Net sales per pound |
$ | 3.49 | $ | 2.99 | $ | 0.50 | 16.7 | % | ||||||||
| Metal component of net sales per pound |
2.45 | 2.02 | 0.43 | 21.3 | % | |||||||||||
|
|
|
|
|
|
|
|||||||||||
| Adjusted sales per pound |
$ | 1.04 | $ | 0.97 | $ | 0.07 | 7.2 | % | ||||||||
|
|
|
|
|
|
|
|||||||||||
| Average reported copper price per pound |
$ | 4.00 | $ | 3.43 | $ | 0.57 | 16.6 | % | ||||||||
Gross Profit
Gross profit increased by $33.6 million, or 20.7%, from $162.0 million for the year ended December 31, 2010 to $195.6 million for the year ended December 31, 2011. Gross profit per pound increased from $0.29 for the year ended December 31, 2010 to $0.38 for the year ended December 31, 2011.
Gross profit for the year ended December 31, 2011 included a loss of $1.1 million related to net unrealized losses on derivative contracts. Gross profit for the year ended December 31, 2010 includes a loss of $12.0 million related to collateral hedge contracts required under our 2007 ABL Facility and net unrealized losses on other derivative contracts. We exclude all such losses in calculating Segment
87
Table of Contents
Adjusted EBITDA and Consolidated Adjusted EBITDA. See “—Non-GAAP Measures—EBITDA-Based Measures”.
Gross profit for the years ended December 31, 2011 and 2010 also reflect the reduction of inventory quantities and a decrement in the base LIFO layer, which is carried at a copper price of $1.52 per pound and is significantly below weighted-average replacement costs of $4.00 and $3.43 per pound for the years ended December 31, 2011 and 2010, respectively. Gross profit for the year ended December 31, 2011 included a LIFO gain of $15.2 million, compared to a LIFO gain of $21.0 million in the year ended December 31, 2010. We exclude the above items in calculating Adjusted EBITDA and Consolidated Adjusted EBITDA. See “—Non-GAAP Measures—EBITDA-Based Measures”.
Depreciation expense included in gross profit increased from $2.8 million for the year ended December 31, 2010 to $4.5 million for the year ended December 31, 2011. The increase is attributable to an increase in our depreciable asset base from $44.5 million at December 31, 2010 to $67.1 million at December 31, 2011.
Several other offsetting factors contributed to the remaining $30.2 million increase in gross profit in 2011. Higher average sales prices, lower shrinkage costs, and lower restructuring and other business transformation charges in the year ended December 31, 2011 contributed $46.0 million, $2.0 million, and $3.6 million, respectively, to the increase in gross profit. The $3.6 million in restructuring and other business transformation charges recorded in 2010 related to a provision for excess and obsolete inventory resulting from rationalization of our product mix, severance costs related to a reduction in force and fees paid to labor and productivity consultants. Also contributing to the increase in gross profit was $2.6 million related to an organizational realignment of certain departments that were reclassified to selling, general and administrative expenses. These factors were partially offset by the impact of lower volume in the year ended December 31, 2011 of $19.6 million and higher manufacturing conversion costs of $4.4 million.
Selling, General and Administrative Expenses
Selling, general and administrative expenses increased by $0.5 million, or 0.7%, from $68.9 million for the year ended December 31, 2010 to $69.4 million for the year ended December 31, 2011. Non-cash compensation charges for vested profits interest shares included in selling, general and administrative expenses were $0.9 million and $3.5 million for the years ended December 31, 2011 and 2010, respectively.
In 2011, selling, general and administrative expenses included a decrease in the allowance for doubtful accounts of $4.2 million which resulted from management’s change in its estimate of the recoverability of accounts receivable. In 2010, we recorded a provision for bad debt of $1.3 million.
Several other factors contributed to the increase in selling, general and administrative expenses in 2011. Professional fees for accounting, tax, legal and consulting services increased by $3.8 million in 2011 as compared to 2010. Also contributing to the increase to selling, general and administrative expenses was $2.6 million due to an organizational realignment of certain departments that were previously recorded in cost of sales, $1.2 million of expenses incurred with the establishment of an office located in Louisville, Kentucky, and increases in other selling, general and administrative expenses of $1.0 million.
Operating Income
Operating income increased by $33.1 million, or 35.6%, from $93.1 million for the year ended December 31, 2010 to $126.2 million for the year ended December 31, 2011 due to the changes in gross profit and selling, general and administrative expenses described above.
88
Table of Contents
Interest Expense
Interest expense increased by $14.9 million from $25.1 million for the year ended December 31, 2010 to $40.0 million for the year ended December 31, 2011. The increase was due to higher interest rates (a weighted average of 10.26% per annum during 2011 compared to 7.14% per annum during 2010) primarily due to the agreement governing the Term Loan Facility entered into as part of the August 18, 2010 refinancing as well as higher average borrowings on our debt facilities of $319.0 million in 2011 as compared to $313.0 million in 2010.
The following table summarizes the components of interest expense:
| For the Year Ended, December 31, |
||||||||
| (in millions) | 2011 | 2010 | ||||||
| Interest on principal |
$ | 32.7 | $ | 22.3 | ||||
| Interest rate cap agreements |
1.9 | (0.8 | ) | |||||
| Amortization of debt discount and issuance costs |
4.7 | 2.3 | ||||||
| Capitalized interest |
(0.6 | ) | — | |||||
| Other borrowing costs(1) |
1.3 | 1.3 | ||||||
|
|
|
|
|
|||||
| Interest expense |
$ | 40.0 | $ | 25.1 | ||||
|
|
|
|
|
|||||
| (1) | Includes interest on letters of credit, unused line of credit fees and capital lease obligations. |
In compliance with the Term Loan Facility, we entered into interest rate cap agreements to fix a portion of our variable rate debt. During the year ended December 31, 2011, the fair value of the interest rate caps declined by $1.9 million, and the decline in fair value was recorded as non-cash interest expense. The increase in amortization expense was primarily due to the refinancing on August 18, 2010, which resulted in amortization of capitalized costs associated with the refinancing as described in “—Financial Information, Acquisition, Business Transformation and Refinancing—Refinancing” above.
Other Expense, Net
We recorded other expense, net of $0.4 million for the year ended December 31, 2011 compared to $0.8 million for the year ended December 31, 2010. During the year ended December 31, 2011, we recorded income of $2.0 million related to a favorable legal settlement of a products liability lawsuit in which we were named as a third-party defendant. Partially offsetting this was $0.9 million of expense incurred relating to a waiver obtained from our lenders under the Term Loan Facility and the 2010 ABL Facility in May 2011 and $0.6 million of expense related to the October 2011 amendment of the Term Loan Facility and 2010 ABL Facility. The fee paid related to a waiver for a technical restatement of the financial statements of Global Brass and Copper, Inc. previously delivered and an additional waiver because the consolidated financial statements of Global Brass and Copper, Inc. for the year ended December 31, 2010 could not be delivered within the prescribed time period as a result of the restatement. For more information, see “—Liquidity and Capital Resources—Outstanding Indebtedness—The ABL Facility” and “—Internal Control over Financial Reporting”.
Provision for Income Taxes
Income tax expense increased by $4.8 million, from $26.6 million for the year ended December 31, 2010 to $31.4 million for the year ended December 31, 2011. The increase was due to higher income before provision for income taxes and equity income of $85.8 million for the year ended December 31, 2011 as compared to $67.2 million for the year ended December 31, 2010. The effective income tax rate decreased from 39.6% for the year ended December 31, 2010 to 36.6% for the year
89
Table of Contents
ended December 31, 2011. This decrease was due to a lower state effective tax rate, a lower non-deductible non-cash compensation expense, as well as an increase in the Section 199 manufacturing deduction, which is a tax deduction available to certain U.S. firms engaged in domestic manufacturing operations. The increase in the Section 199 manufacturing deduction was driven by the increase in the applicable deduction rate from 6% for the year ended December 31, 2010 to 9% for the year ended December 31, 2011.
The following table summarizes the effective income tax rate components for the years ended December 31, 2011 and 2010.
| For the Year Ended December 31, |
||||||||
| 2011 | 2010 | |||||||
| Statutory provision rate |
35.0 | % | 35.0 | % | ||||
| Permanent differences and other items |
||||||||
| State tax provision |
3.9 | % | 6.0 | % | ||||
| Section 199 manufacturing credit |
(2.3 | %) | (1.5 | %) | ||||
| Incremental tax effects of foreign earnings |
0.2 | % | 0.3 | % | ||||
| Return to provision adjustments |
(0.7 | %) | (2.2 | %) | ||||
| Re-rate of deferred taxes |
(0.3 | %) | (0.2 | %) | ||||
| Non-deductible non-cash compensation(1) |
0.4 | % | 1.8 | % | ||||
| Other |
0.4 | % | 0.4 | % | ||||
|
|
|
|
|
|||||
| Effective income tax rate |
36.6 | % | 39.6 | % | ||||
|
|
|
|
|
|||||
| (1) | Reflects the increase in effective income tax rate resulting from non-cash compensation expense that was recognized by us in connection with $3.5 million of distributions made to certain of our executives and other employees by Halkos in August 2010 from the proceeds it received from us as a result of the August 2010 refinancing transactions. For the year ended December 31, 2011, non-cash compensation expense totaled $0.9 million. See “Use of Proceeds” and “Certain Relationships and Related Party Transactions.” The additional selling, general and administrative expense lowered our income before provision for income taxes and equity income, which resulted in our effective tax rate being higher in the 2010 and 2011 periods. Because even larger distributions to certain of our executives and other employees are expected to be made by Halkos from the net proceeds of this offering, a similar (and proportionally larger) effect is expected to occur in the fiscal periods during which such distributions are recorded. |
Equity Income
Equity income, net of tax, decreased from $1.5 million for the year ended December 31, 2010 to $0.9 million for the year ended December 31, 2011. This decrease was due to reduced profitability from 2010 to 2011 of our equity method investment in our joint venture with Dowa.
Net Income Attributable to Global Brass and Copper Holdings, Inc.
Net income attributable to Global Brass and Copper Holdings, Inc. increased by $13.5 million, or 32.5%, from $41.6 million for the year ended December 31, 2010 to $55.1 million for the year ended December 31, 2011 due to the changes in operating income, partially offset by the increase in interest expense and provision for income taxes, as described above.
Consolidated Adjusted EBITDA
Consolidated Adjusted EBITDA increased by $23.6 million, or 23.8%, from $99.0 million for the year ended December 31, 2010 to $122.6 million for the year ended December 31, 2011. The increase was due to higher average sales prices of $46.0 million, a decrease in the allowance for doubtful accounts of $4.2 million, (as compared to an increase of $1.3 million in 2010) resulting from the change
90
Table of Contents
in management’s estimate on the recoverability of accounts receivable, and decreased shrinkage loss costs of $2.0 million. Partially offsetting the increase was lower volume which negatively impacted Consolidated Adjusted EBITDA by $19.6 million, higher selling, general and administrative expenses of $5.6 million, higher manufacturing conversion costs of $4.4 million and an increase in other adjustments included in the calculation of Consolidated Adjusted EBITDA of $0.3 million.
Consolidated EBITDA and Consolidated Adjusted EBITDA are non-GAAP financial measures. See “—Non-GAAP Measures—EBITDA-Based Measures”.
Below is a reconciliation of net income attributable to Global Brass and Copper Holdings, Inc. to Consolidated EBITDA and Consolidated Adjusted EBITDA for the years ended December 31, 2011 and 2010:
| Year Ended December 31, |
||||||||
| (in millions) | 2011 | 2010 | ||||||
| Net income attributable to Global Brass and Copper Holdings, Inc. |
$ | 55.1 | $ | 41.6 | ||||
| Interest expense |
40.0 | 25.1 | ||||||
| Provision for income taxes |
31.4 | 26.6 | ||||||
| Depreciation expense |
4.5 | 2.8 | ||||||
| Amortization expense |
0.2 | 0.2 | ||||||
|
|
|
|
|
|||||
| Consolidated EBITDA |
$ | 131.2 | $ | 96.3 | ||||
| Loss on derivative contracts(a) |
1.1 | 12.0 | ||||||
| Gain from LIFO layer depletion(b) |
(15.2 | ) | (21.0 | ) | ||||
| Non-cash accretion of income of Dowa joint venture(c) |
(0.7 | ) | (0.7 | ) | ||||
| Non-cash Halkos profits interest compensation expense(d) |
0.9 | 3.5 | ||||||
| Management fees(e) |
1.0 | 1.0 | ||||||
| Restructuring and other business transformation charges(f) |
— | 6.1 | ||||||
| Specified legal/professional expenses(g) |
4.3 | 1.8 | ||||||
|
|
|
|
|
|||||
| Consolidated Adjusted EBITDA |
$ | 122.6 | $ | 98.6 | ||||
|
|
|
|
|
|||||
| (a) | Represents realized and unrealized gains and losses related to the collateral hedge that was required under the 2007 ABL Facility and is no longer required under the ABL Facility, unrealized gains and losses on derivative contracts in support of our balanced book approach and unrealized gains and losses associated with derivative contracts with respect to electricity and natural gas costs. No additional gains and losses with respect to the collateral hedge will be incurred in any subsequent periods. The following table summarizes the loss on derivative contracts: |
| Year Ended December 31, |
||||||||
| 2011 | 2010 | |||||||
| Collateral hedge |
$ | — | $ | 4.6 | ||||
| Other |
1.1 | 7.4 | ||||||
|
|
|
|
|
|||||
| Loss on derivative contracts |
$ | 1.1 | $ | 12.0 | ||||
|
|
|
|
|
|||||
| (b) | Calculated based on the difference between the base year LIFO carrying value and the metal prices prevailing in the market at the time of inventory depletion. |
| (c) | As a result of the application of purchase accounting in connection with the November 2007 acquisition, no carrying value was initially assigned to our equity investment in our joint venture with Dowa. This adjustment represents the accretion of equity in our joint venture with Dowa at the date of the acquisition over a 13-year period (which represents the estimated useful life of the technology and patents of the joint venture). See note 7 to our audited consolidated financial statements, which are included elsewhere in this prospectus. |
| (d) | Represents a portion of the dividend payments made by Halkos to members of our management that resulted in a non-cash compensation charge in connection with the refinancing transaction that occurred in August 2010. See “Certain Relationships and Related Party Transactions”. |
91
Table of Contents
| (e) | Represents annual management fees payable to affiliates of KPS. See “Certain Relationships and Related Party Transactions”. |
| (f) | Restructuring and other business transformation charges for the year ended December 31, 2010 included $3.2 million in severance charges to certain employees at Olin Brass, $0.5 million incurred for labor and productivity consultants in connection with operations at the Somers Thin Strip facility and $2.4 million in charges for excess and obsolete material associated with our exit and our share reduction in negative and low-margin product lines. |
| (g) | Specified legal/professional expenses for the year ended December 31, 2011 included $3.9 million of professional fees for accounting, tax, legal and consulting services related to this offering and $0.9 million of expense incurred relating to a waiver obtained from our lenders under the Term Loan Facility and the 2010 ABL Facility, $0.9 million of expense related to an abandoned contemplated acquisition, and $0.6 million of expense related to the October 2011 amendment of the Term Loan Facility and the 2010 ABL Facility. Partly offsetting this was income of $2.0 million from a favorable legal settlement related to a products liability lawsuit in which we were named as a third-party defendant. The waiver fee paid related to a waiver from the lenders under the Term Loan Facility and the 2010 ABL Facility for a technical restatement of the financial statements of Global Brass and Copper, Inc. previously delivered and an additional waiver because the consolidated financial statements of Global Brass and Copper, Inc. for the year ended December 31, 2010 could not be delivered within the prescribed time period as a result of the restatement. For more information, see “—Liquidity and Capital Resources—Outstanding Indebtedness—The ABL Facility” and “—Internal Control over Financial Reporting”. |
Specified legal/professional expenses for the year ended December 31, 2010 included legal and consulting fees of $0.8 million associated with the successful defense of two assumed predecessor company liabilities, $0.9 million of professional fees incurred in connection with preparations for the August 18, 2010 refinancing of the 2007 ABL Facility and other future financings and $0.1 million associated with regulatory and compliance matters.
92
Table of Contents
Segment Results of Operations
Segment Results of Operations for the Year Ended December 31, 2011, Compared to the Year Ended December 31, 2010
See note 18 of our audited consolidated financial statements included elsewhere in this prospectus for additional information regarding our segment reporting.
| Year Ended December 31, |
Change 2011 vs. 2010 |
|||||||||||||||
| (in millions) | 2011 | 2010 | Amount | Percent | ||||||||||||
| Pounds shipped |
||||||||||||||||
| Olin Brass |
261.9 | 307.0 | (45.1 | ) | (14.7 | %) | ||||||||||
| Chase Brass |
225.8 | 230.8 | (5.0 | ) | (2.2 | %) | ||||||||||
| A.J. Oster |
70.2 | 79.4 | (9.2 | ) | (11.6 | %) | ||||||||||
| Corporate & other(1) |
(47.9 | ) | (63.1 | ) | 15.2 | 24.1 | % | |||||||||
|
|
|
|
|
|
|
|||||||||||
| Total |
510.0 | 554.1 | (44.1 | ) | (8.0 | %) | ||||||||||
|
|
|
|
|
|
|
|||||||||||
| Net Sales |
||||||||||||||||
| Olin Brass |
$ | 766.5 | $ | 768.2 | $ | (1.7 | ) | (0.2 | %) | |||||||
| Chase Brass |
705.6 | 612.6 | 93.0 | 15.2 | % | |||||||||||
| A.J. Oster |
356.2 | 337.5 | 18.7 | 5.5 | % | |||||||||||
| Corporate & other(1) |
(49.2 | ) | (59.6 | ) | 10.4 | 17.4 | % | |||||||||
|
|
|
|
|
|
|
|||||||||||
| Total |
$ | 1,779.1 | $ | 1,658.7 | $ | 120.4 | 7.3 | % | ||||||||
|
|
|
|
|
|
|
|||||||||||
| Segment Adjusted EBITDA |
||||||||||||||||
| Olin Brass |
$ | 45.3 | $ | 23.2 | $ | 22.1 | 95.3 | % | ||||||||
| Chase Brass |
73.7 | 61.2 | 12.5 | 20.4 | % | |||||||||||
| A.J. Oster |
17.9 | 21.3 | (3.4 | ) | (16.0 | %) | ||||||||||
|
|
|
|
|
|
|
|||||||||||
| Total for operating segments |
$ | 136.9 | $ | 105.7 | $ | 31.2 | 29.5 | % | ||||||||
|
|
|
|
|
|
|
|||||||||||
| (1) | Amounts represent intercompany eliminations |
Below is a reconciliation of income before provision for income taxes and equity income to Segment EBITDA and Segment Adjusted EBITDA:
| Year Ended December 31, 2011 |
Year Ended December 31, 2010 |
|||||||||||||||||||||||
| ($ in millions) | Olin Brass |
Chase Brass |
AJ Oster |
Olin Brass |
Chase Brass |
AJ Oster |
||||||||||||||||||
| Income before provision for income taxes and equity income: |
$ | 51.0 | $ | 71.8 | $ | 24.8 | $ | 44.6 | $ | 60.0 | $ | 21.1 | ||||||||||||
| Interest expense |
0.1 | — | — | — | — | — | ||||||||||||||||||
| Depreciation expense |
2.6 | 1.7 | 0.2 | 1.6 | 1.0 | 0.2 | ||||||||||||||||||
| Amortization expense |
— | 0.2 | — | — | 0.2 | — | ||||||||||||||||||
|
|
|
|
|
|
|
|
|
|
|
|
|
|||||||||||||
| Segment EBITDA(1) |
$ | 53.7 | $ | 73.7 | $ | 25.0 | $ | 46.2 | $ | 61.2 | $ | 21.3 | ||||||||||||
| Equity income, net of tax |
0.9 | — | — | 1.5 | — | — | ||||||||||||||||||
| Net income attributable to non-controlling interest |
(0.2 | ) | — | — | (0.5 | ) | — | — | ||||||||||||||||
| Gain from LIFO layer depletion(2) |
(8.4 | ) | — | (7.1 | ) | (23.3 | ) | — | — | |||||||||||||||
| Non-cash accretion of income of Dowa joint venture(3) |
(0.7 | ) | — | — | (0.7 | ) | — | — | ||||||||||||||||
|
|
|
|
|
|
|
|
|
|
|
|
|
|||||||||||||
| Segment Adjusted EBITDA(1) |
$ | 45.3 | $ | 73.7 | $ | 17.9 | $ | 23.2 | $ | 61.2 | $ | 21.3 | ||||||||||||
|
|
|
|
|
|
|
|
|
|
|
|
|
|||||||||||||
93
Table of Contents
| (1) | Segment EBITDA and Segment Adjusted EBITDA are non-GAAP financial measures. See “—Non-GAAP Measures—EBITDA-Based Measures”. |
| (2) | Calculated based on the difference between the base year LIFO carrying value and the metal prices prevailing in the market at the time of inventory depletion. |
| (3) | As a result of the application of purchase accounting in connection with the November 2007 acquisition, no carrying value was initially assigned to our equity investment in our joint venture with Dowa. This adjustment represents the accretion of equity in our joint venture with Dowa over a 13-year period (which represents the estimated useful life of the technology and patents of the joint venture). See Note 7 to our audited consolidated financial statements, which are included elsewhere in this prospectus. |
Olin Brass
Olin Brass net sales decreased by $1.7 million, or 0.2%, from $768.2 million for the year ended December 31, 2010 to $766.5 million for the year ended December 31, 2011. The decrease was due to lower volume offset by higher metal costs and higher average sales prices.
Volume decreased by 45.1 million pounds, or 14.7%, from 307.0 million pounds for the year ended December 31, 2010 to 261.9 million pounds for the year ended December 31, 2011. The decrease in volume, which contributed $112.8 million to the decrease in net sales, was the result of our continued efforts to rationalize our product mix in order to provide optimal margins and growth opportunities which were partially offset by higher demand in the automotive end market.
Higher metal prices, improved pricing and rationalization of the product mix contributed $111.1 million to net sales, offsetting almost all of the impact of the volume decrease.
Segment Adjusted EBITDA of Olin Brass increased by $22.1 million, from $23.2 million for the year ended December 31, 2010 to $45.3 million for the year ended December 31, 2011. The increase was due primarily to higher average sales prices and restructuring and other business transformation charges, partially offset by a decrease in volume. The restructuring and other business transformation charges related to a provision for excess and obsolete inventory resulting from a rationalization of our product mix, severance costs related to a workforce reduction and fees paid to labor and productivity consultants, all of which occurred during the year ended December 31, 2010 and did not recur in 2011.
Chase Brass
Chase Brass net sales increased by $93.0 million, or 15.2%, from $612.6 million for the year ended December 31, 2010 to $705.6 million for the year ended December 31, 2011. The increase was due primarily to higher metal costs and higher average sales prices in the year ended December 31, 2011, partially offset by lower volume.
Volume decreased by 5.0 million pounds, or 2.2%, from 230.8 million pounds for the year ended December 31, 2010 to 225.8 million pounds for the year ended December 31, 2011. The decrease in volume, which partially offset the increase in net sales by $13.2 million, was the result of our continued efforts to rationalize our product mix in order to provide optimal margins and growth opportunities and lower demand in the building and housing end market.
Higher metal prices, improved pricing and rationalization of the product mix contributed $106.2 million to the increase in net sales as compared to 2010.
Segment Adjusted EBITDA of Chase Brass increased by $12.5 million, from $61.2 million for the year ended December 31, 2010 to $73.7 million for the year ended December 31, 2011. The increase was due primarily to higher average sales prices, a decrease in the allowance for doubtful accounts resulting from lower estimated losses, partially offset by lower volume and higher shrinkage loss costs.
94
Table of Contents
A.J. Oster
A.J. Oster net sales increased by $18.7 million, or 5.5%, from $337.5 million for the year ended December 31, 2010 to $356.2 million for the year ended December 31, 2011. The increase was due primarily to higher metal costs and higher average sales prices in the year ended December 31, 2011, partially offset by lower volume.
Volume decreased by 9.2 million pounds, or 11.6%, from 79.4 million pounds for the year ended December 31, 2010 to 70.2 million pounds for the year ended December 31, 2011. The decrease in volume, which partially offset the increase in net sales by $39.2 million, was the result of our continued efforts to rationalize our product mix in order to provide optimal margins and growth opportunities and lower demand in the building and housing end market, partially offset by higher demand in the automotive end market.
Higher metal prices, improved pricing and rationalization of the product mix contributed $57.9 million to the increase in net sales as compared to 2010.
Segment Adjusted EBITDA of A.J. Oster decreased by $3.4 million, from $21.3 million for the year ended December 31, 2010 to $17.9 million for the year ended December 31, 2011. The decrease was due to lower volume and higher supplier prices, including products supplied by Olin Brass, which was partially offset by higher average sales prices.
Liquidity and Capital Resources
Sources and Uses of Cash
Our primary uses of cash are to fund working capital, operating expenses, debt service and capital expenditures. Historically, our primary sources of short-term liquidity have been cash flow from operations and borrowings under our ABL Facility. Global Brass and Copper Holdings derives all its cash flow from its subsidiaries, including Global Brass and Copper, Inc., and receives dividends, distributions and other payments from them to generate the funds necessary to meet its financial obligations. However, Global Brass and Copper Holdings is a holding company with no operations, no employees and no assets other than its investment in Global Brass and Copper, Inc. All of our operations are conducted at Global Brass and Copper, Inc. and its subsidiaries. Global Brass and Copper, Inc. is also the primary obligor on our indebtedness, and Global Brass and Copper Holdings has no indebtedness other than its guarantee of Global Brass and Copper, Inc.’s indebtedness. The credit agreement governing the ABL Facility and the indenture governing the Senior Secured Notes do not limit the ability of subsidiaries of Global Brass and Copper, Inc. to dividend or distribute cash to Global Brass and Copper, Inc. to meet its obligations under those agreements or to operate its business. The credit agreement governing the ABL Facility and the indenture governing the Senior Secured Notes do, however, limit the ability of Global Brass and Copper, Inc. and its subsidiaries to dividend or distribute cash to Global Brass and Copper Holdings and to its equityholders, although ordinary course dividends and distributions to meet the limited holding company expenses and related obligations at Global Brass and Copper Holdings of up to $5 million per year are permitted under those agreements. Under the terms of the indenture governing the Senior Secured Notes, Global Brass and Copper Inc. is also permitted to dividend or distribute to Global Brass and Copper Holdings and its equityholders up to 50% of its Consolidated Net Income (as defined in the indenture governing the Senior Secured Notes) from April 1, 2012 to the end of Global Brass and Copper’s most recently ended fiscal quarter. As of March 31, 2013 all of the net assets of the subsidiaries are restricted except for $22.2 million which are permitted dividend distributions under the indenture governing the Senior Secured Notes. Because these limitations apply only to dividends or distributions to a holding company and our equityholders, we do not believe that the restrictions on dividends and distributions to Global Brass and Copper Holdings and its equityholders imposed by the terms of our debt agreements have
95
Table of Contents
any impact on our liquidity, financial condition or results of operations. We believe that these resources will be sufficient to meet our working capital and debt service needs for the next twelve months, including costs that we may incur in connection with our growth strategy. At March 31, 2013, we had $25.0 million of outstanding borrowings under our ABL Facility, $0.5 million of letters of credit, and borrowing availability of $174.5 million. The letters of credit primarily represent collateral against certain workers compensation liabilities assumed from Olin Corporation.
On August 18, 2010, we refinanced our 2007 ABL Facility, entering into the 2010 ABL Facility. The agreement governing the 2010 ABL Facility (as well as the agreement governing our current ABL Facility) eliminated the collateral hedge requirement that was in the agreement governing the facility being refinanced at the time and required that we lock-in the accumulated mark to market loss recorded in the third quarter 2010 of $32.8 million as of August 18, 2010 such that there would be no further net mark-to-market gains or losses. This was accomplished by taking an offsetting hedge position, in this case a purchase position of matching quantity and maturity to offset the sold position required under the original agreement. Metal price fluctuations from August 18, 2010 to the hedge maturity date resulted in offsetting mark-to-market impacts on the original collateral hedge sold position and on the offsetting purchase position. The accumulated losses were collateralized with a combination of $17.8 million of cash on deposit with the hedge counterparty and $15.0 million of letters of credit. The contracts matured during 2011 and were settled with cash on deposit with the hedge counterparty and canceling the letters of credit.
Our borrowing base under our current ABL Facility fluctuates with changes in eligible accounts receivable and inventory, less outstanding borrowings and letters of credit. As of March 31, 2013, the value of our eligible collateral against which we can borrow exceeded our maximum committed amount of $200.0 million by $132.2 million. Consequently, increases in eligible collateral due to increases in volume, metal prices or inventory balances will not increase the borrowing base but may increase our borrowing requirements. Conversely, decreases in volume, metal prices or inventory balances will not have an immediate impact on the borrowing base due to the excess of eligible collateral over the maximum borrowing base, but may decrease our borrowing requirements. In the event of increased commodity prices as indicated by the terms of the ABL Facility agreement, we may request, but the lenders are not obligated to, increase the maximum borrowings available up to $250.0 million. At any time, if the amount outstanding under the ABL Facility exceeds the maximum allowable borrowings, we are required to make a mandatory prepayment for the amount of the excess borrowings. At any time after the occurrence and during the continuance of a Trigger Event (as defined in the agreement governing the ABL Facility), subject to certain thresholds, reinvestment rights and other exceptions, proceeds received from asset sales, equity issuances or other specified events will be required to be applied (as mandatory prepayments) in whole or in part towards the extinguishment of outstanding amounts due under the ABL Facility.
We are a value-added converter, fabricator, distributor and processor and not a commodity metal producer. We employ our balanced book approach in order to substantially reduce the financial impact of fluctuations in metal costs on our earnings and operating margins. While changes in metal prices do not have a substantial impact on our earnings or margins, except for increased costs attributable to shrinkage loss that occur as a result of increased metal prices and the potential effect higher metal prices may have on our customers’ demand for our products, changes in metal prices do affect our liquidity because of the difference between our payment terms for metal purchases and our credit terms with our customers. As a result, when metal prices are rising, we tend to use more cash or draw more on the ABL Facility to cover the cash flow delay between cash collection from our customers and metal replacement purchases. When metal prices fall, we replace our metal at a lower cost than the metal content of cash collections and generally increase our cash balances or reduce our use of the ABL Facility. Because the financial instruments that we use to effectuate the balanced-book approach are designed to hedge against the cost of metal used in our operations, those financial instruments do
96
Table of Contents
not have a material impact on our liquidity. We believe that our cash flow from operations, supplemented with cash available under the ABL Facility, will provide sufficient liquidity to meet our needs in the current metal price environment.
On August 18, 2010, we refinanced the Term Loan Facility, which resulted in an increase in our interest expense. The proceeds from the Term Loan Facility were used to repay the existing related party term loan facility and the existing asset-based loan facility and to fund a cash distribution of $42.5 million to Halkos. In June 2012, Global Brass and Copper, Inc. issued $375.0 million aggregate principal amount of Senior Secured Notes and used a portion of the net proceeds to repay all outstanding amounts (including premium and unpaid interest) under the Term Loan Facility. We also used a portion of the net proceeds to pay a $160.0 million distribution to Halkos. The Senior Secured Notes bear interest at a rate of 9.50% per annum, payable in cash semi-annually on each June 1 and December 1, beginning on December 1, 2012. See “—Term Loan Facility and ABL Facility Amendment,” below.
We manage our levels of inventory in order to be able to satisfy customers’ needs in a timely fashion, while limiting our working capital requirements, to the extent possible. While we do not have a formal policy with respect to inventory, we generally keep approximately ten weeks of inventory on hand at most times of the year, subject to upward or downward adjustments depending on seasonality and management estimates of expected customer activity. Generally, we use cash on hand or borrowings under the ABL Facility to acquire inventory.
We acquired a substantial base of property, plant and equipment when we acquired the worldwide metals business of Olin Corporation and therefore have operating capacity available to support growth in our base business. Consequently, capital improvements and replacement costs account for the majority of our capital expenditures. In late 2011 and early 2012, we undertook one substantial capacity expansion program related to Eco Brass® and other “green portfolio” products which could not be accommodated on existing equipment. This program required a total of approximately $13 million of capital expenditures. We estimate annual capital expenditures from 2013 to 2017 to range between $25 million to $30 million per annum, of which $20 million to $24 million per annum will consist of capital improvements or replacement of existing capital items.
We generally meet long-term liquidity requirements, the repayment of debt and investment funding needs through cash flow from operations and additional borrowing under the ABL Facility. We believe that cash flow from operations, supplemented by cash available under the ABL Facility will be sufficient to enable us to meet our capital investment, debt service and operational obligations as they continue for at least the next twelve months.
Term Loan Facility and ABL Facility Amendment
In connection with the Term Loan Refinancing, which closed on June 1, 2012, we repaid all outstanding amounts (including $266.5 million of principal, $8.0 million of premium and $1.0 million of accrued but unpaid interest) under the Term Loan Facility using a portion of the proceeds from the issuance of $375.0 million aggregate principal amount of Senior Secured Notes. We also used a portion of the net proceeds to pay the $160.0 million Parent Distribution to Halkos. Halkos distributed the proceeds of the Parent Distribution pro rata to its equityholders (which include certain of our directors and officers) in accordance with the terms of its operating agreement.
In the June 1, 2012 ABL Amendment, we amended the 2010 ABL Facility to, among other things:
| • | increase the commitments under the ABL Facility from $150.0 million to $200.0 million; |
| • | extend the maturity of the ABL Facility from August 18, 2014 to June 1, 2017; |
97
Table of Contents
| • | lower the applicable margin and unused line fee under the ABL Facility; |
| • | permit additional acquisitions, investments, restricted payments, asset sales and debt incurrences if certain conditions are satisfied; |
| • | increase the inventory loan limit for the borrowing base; |
| • | adjust certain reporting requirements and collateral audit requirements to make them less restrictive; and |
| • | reduce the minimum excess availability threshold that triggers testing of the fixed charge coverage ratio covenant to 10.0%. |
While we were required to maintain a maximum leverage ratio and a minimum interest coverage ratio under the Term Loan Facility, the indenture governing the Senior Secured Notes contains no financial maintenance covenants. Furthermore, the fixed charge coverage ratio covenant in the ABL Facility is only triggered by minimum excess availability of less than 10%.
As a result of the ABL Amendment and the Term Loan Refinancing, we currently believe that we will remain in compliance with our covenants based on our current financial projections. However, our financial projections are based on current assumptions with respect to the economy, competition, and other factors and are subject to change. An adverse change in one or more of these assumptions may have an adverse impact on our financial performance and render us unable to comply with some or all of our covenants. We could seek waivers or amendments if a violation did occur. However, we can provide no assurance that we could successfully obtain such waivers or amendments from our lenders. If we are unable to comply with some or all of the financial or non-financial covenants and if we fail to obtain future waivers or amendments to the credit agreements, the lenders may terminate our ABL Facility and declare all or any portion of the obligations under the ABL Facility due and payable. A default under the ABL Facility could result in an event of default under the indenture governing the Senior Secured Notes, which could result in the Senior Secured Notes becoming immediately due and payable.
Cash Flows
The following table presents the summary components of net cash provided by or used in operating, investing and financing activities for the periods indicated. As of March 31, 2013, we had cash of $15.8 million, compared to cash of $13.9 million at December 31, 2012. The accompanying discussion should be read in conjunction with our consolidated statements of cash flows in our audited consolidated financial statements and the consolidated statements of cash flows in our unaudited interim financial statements included elsewhere in this prospectus.
| Cash Flow Analysis | For the Three Months Ended March 31, |
For the Year Ended December 31, | ||||||||||||||||||
| (in millions) | 2013 | 2012 | 2012 | 2011 | 2010 | |||||||||||||||
| Cash flows (used in) provided by operating activities |
(5.1 | ) | 31.8 | $ | 81.9 | $ | 64.8 | $ | 69.4 | |||||||||||
| Cash flows used in investing activities |
(2.9 | ) | (3.7 | ) | $ | (20.4 | ) | $ | (22.3 | ) | $ | (11.9 | ) | |||||||
| Cash flows (provided by) used in financing activities |
10.2 | (1.1 | ) | $ | (96.8 | ) | $ | (8.3 | ) | $ | (49.6 | ) | ||||||||
Cash flows from operating activities
During the three months ended March 31, 2013, net cash used in operating activities was $5.1 million. This amount was primarily attributable to net income of $11.5 million, adjustments to net income of $3.0 million, which was offset by an increase in assets net of liabilities of $19.6 million.
98
Table of Contents
The primary contributor to the increase in assets net of liabilities was an $18.4 million increase in accounts receivable net of accounts payable (total accounts receivable increased by $55.8 million, which was partially offset by the increase in accounts payable of $37.4 million), an increase of $10.9 million in inventory, an increase of prepaid expenses and other current assets of $4.3 million, an increase in income taxes payable net of income taxes receivable of $1.0 million and an increase of $0.1 million in other assets net of liabilities, partially offset by an increase in accrued interest of $8.9 million and an increase in accrued liabilities of $6.2 million.
The increase in inventory is primarily due to a shift in the product mix at Olin Brass to items requiring more processing steps and operational issues affecting product flow and yield within the brass mill and downstream cupping operation.
The increase in accounts receivable was due to an increase in trade receivables as a result of higher volume during the first quarter of 2013 as compared to the fourth quarter of 2012, while the day’s sales outstanding (“DSO”) remained constant at 44 days as of December 31, 2012 and March 31, 2013. The increase in accounts payable was due to higher volume in the first quarter of 2013 as compared to the fourth quarter of 2012, and to the increase in the purchase payment cycle from 24 days at December 31, 2012 to 25 days at March 31, 2013. The increase in the payment purchase cycle was due primarily to vendor mix and to seasonal and intra-month fluctuations in the timing of material receipts and payments.
During the three months ended March 31, 2012, net cash provided by operating activities was $31.8 million. This amount was primarily attributable to net income of $14.1 million, adjustments to net income of $3.0 million and a decrease in assets net of liabilities of $14.7 million.
The primary contributors to the decrease in assets net of liabilities was a decrease in inventory of $13.5 million due to manufacturing process improvements and product portfolio rationalization, a decrease in prepaid expenses and other current assets of $4.9 million, a decrease in income taxes receivable net of income taxes payable of $3.4 million, an increase in accrued liabilities of $1.1 million and an increase in other assets and liabilities of $0.5 million, partially offset by an $8.4 million increase in accounts receivable net of accounts payable (total accounts receivable increased $41.9 million, which was offset by the increase in accounts payable of $33.5 million) and a decrease in accrued interest of $0.3 million.
The increase in accounts receivable was due to an increase in trade receivables as a result of higher volume during the first quarter of 2012 as compared to the fourth quarter of 2011, partially offset by the decrease in the DSO from 43 days as of December 31, 2011 to 42 days as of March 31, 2012. The change in DSO was due primarily to customer mix and to seasonal and intra-month fluctuations in the timing of shipments and collections. The increase in accounts payable was due to higher volume in the first quarter of 2012 as compared to the fourth quarter of 2011, while the purchase payment cycle remained relatively consistent at 23 days as of December 31, 2011 and March 31, 2012.
During the year ended December 31, 2012, net cash provided by operating activities was $81.9 million. This amount was primarily attributable to net income of $12.9 million, adjustments to net income of $47.5 million, and a decrease in assets net of liabilities of $21.5 million. The $47.5 million in adjustments included the loss on extinguishment of debt in connection with the Term Loan Refinancing of $19.6 million and non-cash profits interest compensation expense of $19.5 million.
The primary contributors to the decrease in assets net of liabilities was an $11.5 million reduction in inventory due primarily to commercial and manufacturing process improvements, a decrease of prepaid expenses and other current assets of $4.7 million, a decrease in income taxes receivable net of income taxes payable of $3.7 million, a $2.1 million decrease in accounts receivable net of accounts
99
Table of Contents
payable (total accounts receivable increased $1.6 million, which was offset by the increase in accounts payable of $3.7 million), and an increase in accrued liabilities of $0.9 million, partially offset by a $0.6 million increase in other assets net of liabilities and a decrease in accrued interest of $0.8 million.
The increase in accounts receivable was due primarily to an increase in trade receivables as a result of higher volume in the fourth quarter of 2012 as compared to the fourth quarter of 2011, while the day’s sales outstanding remained relatively consistent at 39 days for both periods. The increase in accounts payable was due to higher volume in the fourth quarter of 2012 as compared to the fourth quarter of 2011, while the purchase payment cycle remained consistent at 19 days for both periods.
During the year ended December 31, 2011, net cash provided by operating activities was $64.8 million. This amount was primarily attributable to net income of $55.3 million and adjustments to net income of $19.1 million and partially offset by an increase in assets net of liabilities of $9.6 million. Included in the adjustments to net income is the provision for bad debt expense, which was a net reduction of $4.2 million from the year ended December 31, 2010, resulting from lower estimated losses. The primary contributor to the increase in assets net of liabilities was the $37.0 million reduction of accrued liabilities, primarily as a result of settlement of derivative contracts, an increase in income taxes receivable net of income taxes payable of $2.7 million, and a decrease in accrued interest of $0.1 million, which was partially offset by a decrease in prepaid expenses of $18.3 million, a reduction in inventory of $6.6 million due to manufacturing process improvements and product portfolio rationalization, a decrease in accounts receivable net of accounts payable of $3.8 million, and a net decrease in other assets and liabilities of $1.5 million.
During the year ended December 31, 2010, net cash provided by operating activities was $69.4 million. This amount was primarily attributable to net income of $42.1 million, adjustments to net income of $26.3 million (primarily unrealized losses on derivative contracts) and a reduction in assets net of liabilities of $1.0 million. The primary contributor to the reduction in assets net of liabilities was a reduction in inventory of $8.7 million due to manufacturing process improvements and product portfolio rationalization, which was partially offset by an increase in accounts receivable net of accounts payable of $5.4 million, reflecting the impact of higher volume and metal prices on the spread between our receivable collection terms and metal purchase terms.
Cash flows from investing activities
Net cash used in investing activities was $2.9 million for the three months ended March 31, 2013, which consisted primarily of $3.1 million of capital improvements or replacement of existing capital items, partially offset by $0.2 million of proceeds from the sale of property, plant and equipment.
Net cash used in investing activities was $3.7 million for the three months ended March 31, 2012, which consisted primarily of capital improvements or replacement of existing capital items.
Net cash used in investing activities was $20.4 million for the year ended December 31, 2012, which consisted primarily of capital improvements or replacement of existing capital items.
Net cash used in investing activities was $22.3 million for the year ended December 31, 2011, which consisted primarily of capital investment, of which $16.3 million was due to capital improvements, or replacement of existing capital items and $6.1 million was due to capacity expansion or other growth, offset by $0.1 million of proceeds from the sale of property, plant and equipment.
Net cash used in investing activities was $11.9 million for the year ended December 31, 2010, which consisted primarily of capital investment, of which $7.8 million was due to capital improvements or replacement of existing capital items and $4.1 million was due to capacity expansion or other growth.
100
Table of Contents
Cash flows from financing activities
Net cash provided by financing activities was $10.2 million for the three months ended March 31, 2013, which consisted primarily of net borrowings under the ABL Facility of $10.5 million and partially offset by a $0.3 million receivable due from stockholder pertaining to reimbursable expenses.
Net cash used in financing activities was $1.1 million for the three months ended March 31, 2012, which consisted primarily of scheduled payments under the Term Loan Facility of $0.8 million and a $0.3 million receivable due from stockholder pertaining to reimbursable expenses.
Net cash used in financing activities was $96.8 million for the year ended December 31, 2012, which was a result of the repayment of the term loan of $310.9 million (including repayment of $266.5 million associated with the Term Loan Refinancing, a voluntary prepayment of $15.0 million, a mandatory prepayment of $28.6 million, and a scheduled payment of $0.8 million), the Parent Distribution to Halkos of $160.0 million, payment of $13.0 million of costs associated with the issuance of the Senior Secured Notes and the ABL Amendment, and $2.4 million receivable due from stockholder pertaining to reimbursable expenses, offset by the proceeds from the Senior Secured Notes of $375.0 million and net borrowings on the ABL Facility of $14.5 million.
Net cash used in financing activities was $8.3 million for the year ended December 31, 2011, which consisted primarily of scheduled payments under the term loan of $3.3 million, a $2.4 million receivable due from stockholder pertaining to reimbursable expenses, $1.7 million of fees and expenses related to the October 2011 amendment of our Term Loan Facility and the 2010 ABL Facility and principal payments on capital lease obligation of $0.9 million.
Net cash used in financing activities was $49.6 million for the year ended December 31, 2010. The August 2010 refinancing included the following transactions, which affected cash used in financing activities:
| • | receipt of $305.6 million of proceeds from the Term Loan Facility (reflecting a 3.0% original discount, which was amortized as interest expense over the life of the Term Loan Facility); |
| • | receipt of $9.0 million of proceeds from borrowings under the ABL Facility; |
| • | repayment of the $60.0 million term loan extended by affiliates of KPS; |
| • | payment of a $42.5 million dividend to Halkos, the sole stockholder of Global Brass and Copper Holdings; |
| • | repayment of the entire $197.8 million outstanding amount under our prior asset-based loan facility; and |
| • | payment of $15.1 million of fees and expenses related to the refinancing. |
Payments on the 2010 ABL Facility for the year ended December 31, 2010 were $1,272.2 million, which offset borrowings of $1,096.6 million.
Aside from the refinancing, uses of cash in financing activities during the year ended December 31, 2010 included an additional $59.8 million for the repayments of the term loan extended by affiliates of KPS, $0.8 million of required amortization payments under the Term Loan Facility and cash overdrafts of $1.2 million.
Covenant Compliance
“EBITDA” (as defined in the agreement governing the ABL Facility) is used in the agreements governing the ABL Facility to measure compliance with various financial ratio tests. See “—Non-GAAP Measures—EBITDA-Based Measures”.
101
Table of Contents
Fixed Charge Coverage Ratio
Pursuant to the agreement governing the ABL Facility, the fixed charge coverage ratio is calculated each month on a rolling twelve-month basis by dividing (1) “EBITDA” (as defined in the agreement governing the ABL Facility) minus cash taxes to the extent actually paid during such period, dividends and capital expenditures paid in cash during such period, for such twelve-month period by (2) Fixed Charges for such twelve-month period. Fixed Charges are defined as all interest expense, excluding paid-in-kind, accrued or deferred interest, net of all interest income, plus all regularly scheduled principal payments of indebtedness for borrowed money, indebtedness for the deferred purchase price of any property or services or indebtedness with respect to capital leases.
The fixed charge coverage ratio covenant only is tested when excess availability is less than $20.0 million for five consecutive days (10% of the $200.0 million maximum borrowing base currently in effect). Under such circumstances, we would be required to maintain a fixed charge coverage ratio of greater than or equal to 1.1:1.
As of March 31, 2013, the fixed charge coverage ratio was not in effect.
Minimum Excess Availability
Pursuant to the agreement governing the ABL Facility, for any period of two consecutive days, Excess Availability under the ABL facility may not be less than $10.0 million. “Excess Availability” is defined as (1) the lesser of: (a) the “Borrowing Base” (as defined in the agreement governing the ABL Facility) and (b) the maximum amount available under the ABL Facility at such time; minus (2) the sum of: (a) the amount of all then outstanding loans under the ABL Facility; plus (b) the amount of all reserves then established in respect of letter of credit obligations; plus (c) the aggregate amount of all then outstanding trade payables that are more than 60 days past due as of the end of the immediately preceding calendar month (other than such payables that are being contested in good faith); plus (d) without duplication, the amount of checks issued but not yet sent to pay trade payables and other obligations more than 60 days past due as of the end of the immediately preceding calendar month, plus (e) Qualified Cash (as defined in the agreement governing the ABL Facility) only in the event that Excess Availability (without giving effect to Qualified Cash) as of such date is greater than $50.0 million.
As of March 31, 2013, we were in compliance with the minimum Excess Availability covenant.
Outstanding Indebtedness
The Term Loan Facility
On November 19, 2007, in conjunction with the acquisition of the worldwide metals business of Olin Corporation, we entered into two credit agreements, one of which provided for a related party term loan and the other the 2007 ABL Facility. KPS Capital Finance, LLC, an affiliate of KPS (refer to note 15, “Related Parties”, in the notes to our audited consolidated financial statements included elsewhere in this prospectus), issued the related party debt, which provided for initial borrowings of $70.0 million. The related party term loan credit agreement was subsequently amended to increase the related party term loan to $119.8 million.
On August 18, 2010, we entered into the Term Loan Facility, which provided for a senior secured term loan facility under which we borrowed $315.0 million, net of an original discount of $9.4 million. The original discount was being amortized using the effective interest method as incremental non-cash interest expense over the term of the Term Loan Facility. The proceeds from the Term Loan Facility were used to repay the existing related party term loan facility and the 2007 ABL Facility and to fund a cash distribution of $42.5 million to Halkos. At December 31, 2011, the Term Loan Facility accrued
102
Table of Contents
interest at a rate of 10.25%. In the Term Loan Refinancing, which closed on June 1, 2012, we repaid all outstanding amounts (including $266.5 million of principal, $8.0 million of premium and $1.0 million of accrued but unpaid interest) under the Term Loan Facility using a portion of the proceeds from the issuance of $375.0 million aggregate principal amount of Senior Secured Notes.
The ABL Facility
On August 18, 2010, we entered into the 2010 ABL Facility, providing for borrowings of up to the lesser of $150.0 million or the borrowing base, in each case, less outstanding loans and letters of credit. As a result of the ABL Amendment, which occurred on June 1, 2012, the maximum availability under the ABL Facility was increased to $200.0 million. The borrowing base is defined as 85% of eligible accounts; plus the lesser of (x) 80% of the value of eligible inventory, (y) 90% of the net recovery percentage for the eligible inventory multiplied by the value of such eligible inventory and (z) the Inventory Loan Limit (which was $200.0 million as of as of December 31, 2012); minus reserves. As of March 31, 2013, our eligible collateral for our borrowing base had a value of $332.2 million, with a maximum availability of $200.0 million. As of March 31, 2013, we had $174.5 million available for borrowing under the ABL Facility, giving effect to $25.0 million of outstanding borrowings and $0.5 million of outstanding letters of credit. In the event of increased commodity prices as indicated by the terms of the ABL Facility agreement, we may request, but the lenders are not obligated to, increase the maximum borrowings available up to $250.0 million. At any time, if the amount outstanding under the ABL Facility exceeds the maximum allowable borrowings, we may be required to make a mandatory prepayment for the amount of the excess borrowings.
At any time after the occurrence and during the continuance of a “Trigger Event”, as defined in the agreement governing the ABL Facility, subject to certain thresholds, reinvestment rights and other exceptions, proceeds received from asset sales, equity issuances or other specified events will be required to be applied (as mandatory prepayments) in whole or in part towards the extinguishment of outstanding amounts due under the ABL Facility.
We may elect to receive advances under the ABL Facility in the form of either prime rate advances or LIBOR rate advances, as defined by the agreement governing the ABL Facility. The unused portion under the ABL Facility determines the applicable spread added to the LIBOR rate. The unused portion the ABL Facility was $174.5 million as of March 31, 2013. Unused amounts under the ABL Facility incur an unused line fee of 0.50% per annum, payable in full on a quarterly basis. Also effective with the ABL Amendment, outstanding borrowings under the ABL Facility bear interest at a rate equal to either (i) for prime rate loans, a prime rate plus a spread between 1.0% and 1.5%, depending on excess availability levels or (ii) for LIBOR rate loans, LIBOR plus a spread of 2.0% to 2.5% depending on excess availability levels. As of March 31, 2013, amounts outstanding under the ABL Facility accrued interest at a rate of 4.25%. As of December 31, 2012, amounts outstanding under the ABL Facility bore interest at a rate of 4.50%.
The ABL Facility has an expiration date of June 1, 2017 and contains various covenants to which we are subject on an ongoing basis. The ABL Facility restricts our ability to, among other things, incur indebtedness, grant liens, repurchase stock, issue cash dividends, make investments and acquisitions and sell assets, in each case subject to certain designated exceptions. Outstanding borrowings under the ABL Facility are secured by a senior-priority security interest in our accounts receivable and inventory (which secure the Senior Secured Notes on a junior-priority basis) and by a junior-priority security interest in our fixed assets (which secure the Senior Secured Notes on a senior-priority basis). As of March 31, 2013, we were in compliance with all of our covenants under the ABL Facility.
The ABL Facility contains customary events of default including, among others, failure to make payment when due, materially incorrect representations and warranties, breach of covenants, events of
103
Table of Contents
bankruptcy, or a change in control. In the case of an event of default occurring, the applicable interest rate spread increases by 2.0%, and the lenders would have the option to call the outstanding amount due.
Senior Secured Notes
On June 1, 2012, we issued $375.0 million in aggregate principal amount of 9.50% Senior Secured Notes due 2019. A portion of the net proceeds of the Senior Secured Notes was used in the Term Loan Refinancing. A portion of the net proceeds of the Senior Secured Notes was used to make the $160.0 million Parent Distribution to Halkos. The Senior Secured Notes are guaranteed by Global Brass and Copper Holdings, Inc., and substantially all of our existing and future 100%-owned U.S. subsidiaries. The Senior Secured Notes are secured by a senior-priority security interest in our fixed assets (which secure the ABL Facility on a junior-priority basis) and by a junior-priority security interest in our accounts receivable and inventory (which secure the ABL Facility on a senior-priority basis).
The indenture governing the Senior Secured Notes contains covenants that limit our ability and the ability of restricted subsidiaries to, among other things, incur or guarantee additional debt or issue preferred stock, pay dividends, repurchase equity interests, repay subordinated indebtedness, make investments, create restrictions on the payment of dividends or other amounts to us from restricted subsidiaries, sell assets, including collateral, enter into transactions with affiliates, merge or consolidate with another person, sell or otherwise dispose of all or substantially all of our assets and create liens on our or the restricted subsidiaries’ assets to secure debt. We were in compliance with all covenants relating to the Senior Secured Notes as of March 31, 2013.
The Senior Secured Notes mature on June 1, 2019. Interest on the Senior Secured Notes accrues at the rate of 9.50% per annum and is payable semiannually in arrears on June 1 and December 1, commencing on December 1, 2012.
We are required to offer to redeem the Senior Secured Notes at a purchase price of 101% of their principal amount (plus accrued and unpaid interest) upon the occurrence of certain change of control events. In addition, upon the completion of certain asset dispositions, we may be required to offer to redeem the Senior Secured Notes at a purchase price of 100% of their principal amount (plus accrued and unpaid interest) if we do not apply the proceeds of such asset dispositions in accordance with the indenture by certain specified deadlines.
Pursuant to a registration rights agreement, dated as of June 1, 2012, we are required to effect a registered offer to issue registered new notes (with substantially the same terms as the Senior Secured Notes) in exchange for the Senior Secured Notes that we issued in a private offering on June 1, 2012. If we do not cause the registration statement for the exchange offer to go effective within 365 days after June 1, 2012, or otherwise fail to comply with the other deadlines in the registration rights agreement, we will be required to pay additional interest on the Senior Secured Notes equal to 0.25% per annum for each 90 days we are in default, up to a maximum of 0.50% per annum.
Interest Rate Caps
During the fourth quarter of 2010, we entered into interest rate cap agreements in compliance with the requirement pursuant to the agreement governing the then existing Term Loan Facility to provide that at least 50% of the Term Loan Facility be subject to a fixed rate or interest rate protection at least through the third anniversary of the agreement governing the Term Loan Facility. The interest rate cap agreements capped the interest rate on $300.0 million of the aggregate principal outstanding under the Term Loan Facility. We have not designated the interest rate cap agreements as an accounting hedge, so changes in the fair value of the interest rate cap agreements are recorded as non-cash interest expense in our consolidated statements of operations.
104
Table of Contents
Contractual Obligations
The following table illustrates our contractual commitments as of December 31, 2012:
| Contractual commitments (in millions) |
2013 | 2014 | 2015 | 2016 | 2017 | Beyond | Total | |||||||||||||||||||||
| Leases |
$ | 2.7 | $ | 1.6 | $ | 1.0 | $ | 0.6 | $ | 0.1 | $ | — | $ | 6.0 | ||||||||||||||
| IAM National Pension Fund |
3.8 | — | — | — | — | — | 3.8 | |||||||||||||||||||||
| Senior Secured Notes—Principal |
— | — | — | — | — | 375.0 | 375.0 | |||||||||||||||||||||
| Senior Secured Notes—Interest |
35.6 | 35.6 | 35.6 | 35.6 | 35.6 | 50.5 | 228.5 | |||||||||||||||||||||
| Purchase Obligations |
195.3 | 3.7 | 2.2 | — | — | — | 201.2 | |||||||||||||||||||||
| KPS Management Fee Obligation |
1.0 | 1.0 | 1.0 | 1.0 | 1.0 | — | 5.0 | |||||||||||||||||||||
|
|
|
|
|
|
|
|
|
|
|
|
|
|
|
|||||||||||||||
| Total |
$ | 238.4 | $ | 41.9 | $ | 39.8 | $ | 37.2 | $ | 36.7 | $ | 425.5 | $ | 819.5 | ||||||||||||||
|
|
|
|
|
|
|
|
|
|
|
|
|
|
|
|||||||||||||||
We are obligated to make future payments under various contracts such as debt agreements, lease agreements and collective bargaining agreements. Operating lease obligations are payment obligations under leases classified as operating leases. Most leases are for a period of three years but some last up to five years and are primarily for equipment used in our manufacturing and distribution operations. Our purchase obligations are agreements to purchase goods or services that are enforceable and legally binding on us that specify all significant terms, including fixed or minimum quantities, fixed or variable prices and the approximate timing of the transaction. Purchase obligations include the pricing of anticipated metal purchases using contractual metal prices, or where pricing is dependent on prevailing COMEX or LME prices at the time of delivery, market metal prices as of December 31, 2012, as well as natural gas and electricity prices. As a result of the variability in the pricing of many of our metal purchasing obligations, actual amounts may vary from the amounts shown above.
We participate in a multi-employer pension plan under the collective bargaining agreement that covers the East Alton, Illinois operations of our Olin Brass segment. The collective bargaining agreement runs through November 2013 and obligates us to contribute to the plan at a rate per eligible hour per covered employee as specified in the agreement. Assuming the collective bargaining agreement is renewed in 2013, we expect to continue its participation in the multi-employer pension plan. We do not have any defined benefit or post-retirement benefit plans. The contributions to the multi-employer plan are a function of employment levels and eligible work hours. As a result, actual amounts may vary from the amounts shown above.
The ABL Facility bears interest at variable rates, and the outstanding amounts under the ABL Facility will vary from time to time, so estimating future interest and principal payments under the ABL Facility is not practicable. The ABL Facility matures on June 1, 2017.
Off-Balance Sheet Arrangements
We have not created, and are not party to, any special-purpose or off-balance sheet entities for the purpose of raising capital, incurring debt or operating our business. We do not have any off-balance sheet arrangements or relationships with entities that are not consolidated into our financial statements that have or are reasonably likely to have a material current or future effect on our financial condition, changes in financial condition, sales, expenses, results of operations, liquidity, capital expenditures or capital resources.
105
Table of Contents
Critical Accounting Policies and Estimates
The discussion and analysis of our financial condition and results of operations is based upon our consolidated financial statements, which have been prepared in accordance with GAAP. The preparation of these consolidated financial statements requires us to make estimates and judgments that affect the reported amounts of assets, liabilities, revenues and expenses, and related disclosures of contingent assets and liabilities. Estimates are based on historical experience and on various other assumptions that are believed to be reasonable under the circumstances. The result of this process forms the basis for making judgments about the carrying value of assets and liabilities that are not readily apparent from other sources. We review our estimates and judgments on a regular, ongoing basis. Actual results may differ from these estimates due to changed circumstances and conditions.
The following accounting policies and estimates are considered critical in light of the potentially material impact that the estimates, judgments and uncertainties affecting the application of these policies might have on our reported financial information.
Our accounting policies are more fully described in note 2 “Summary of Significant Accounting Policies” to our audited consolidated financial statements included elsewhere in this prospectus. There have been no significant changes to our critical accounting policies or estimates for the year ended December 31, 2012.
Revenue Recognition
We recognize revenue for both toll and non-toll basis sales only when risk of loss and title passes to the customer, which generally occurs upon shipment. Estimates for future rebates on certain product lines and product returns are recognized in the period in which the revenue is recorded. Rebates are estimated based upon our historical experience, combined with a review of current developments. The allowance for doubtful accounts is estimated based upon our historical experience, combined with a review of current developments and the specific identification method of accounts for which payment has become unlikely. Billings to customers for shipping costs are included in net sales and the cost of shipping product to those customers is reflected as a component of cost of sales.
Inventories
Inventories include costs attributable to direct labor and manufacturing overhead but are primarily comprised of raw material costs. The raw materials component of inventories that is valued on a LIFO basis comprises approximately 71% and 70% of total inventory at March 31, 2013 and 2012, respectively.
Other manufactured inventories, including the non-material components and certain non-U.S. inventories, are valued on a FIFO basis. Elements of cost in finished goods inventory in addition to the cost of material include depreciation, amortization, utilities, consumable production supplies, maintenance, production wages and transportation costs.
Inventories are stated at the lower of cost or market. The market price of metals used in production and related scrap is subject to volatility. During periods when open-market prices decline below net book value, we may need to record a provision to reduce the carrying value of our inventory. We analyze the carrying value of inventory for impairment if circumstances indicate impairment may have occurred. If an impairment occurs, the amount of impairment loss is determined by measuring the excess of the carrying value of inventory over the net realizable value of inventory.
We record an estimate for slow moving and obsolete inventory based upon product knowledge, physical inventory observation, estimated future demand, market conditions and an aging analysis of
106
Table of Contents
the inventory on hand. Our policy is to evaluate all inventories including raw material, work-in-process and finished goods. Inventory in excess of our estimated usage requirements is written down to its estimated net realizable value.
Purchase Accounting
Determining the fair value of certain assets, liabilities and subsidiaries assumed in a business combination is judgmental in nature and often involves the use of significant estimates and assumptions. Some of the more significant estimates and assumptions used in valuing our acquisition of the worldwide metals business of Olin Corporation in 2007 and our acquisition of the order book, customer list and certain other assets of Bolton’s North American operations in January 2008 included projected future cash flows and discount rates reflecting the risk inherent in future cash flows.
We recognized goodwill related to the acquisition of the order book, customer list and certain other assets of Bolton’s North American operations, as the purchase price exceeded the fair value of net assets. For the acquisition of the worldwide metals business of Olin Corporation, the estimated fair value of the net assets exceeded the purchase price, thus creating negative goodwill under then-current GAAP guidance. As such, noncurrent assets were assigned no value in the acquisition from Olin Corporation.
We own a 50% interest in Dowa-Olin Metal Corporation, a joint venture with Dowa based in Japan. As a result of the acquisition of the worldwide metals business of Olin Corporation, a negative basis difference was created between our books and our share of Dowa-Olin Metal Corporation’s equity. ASC Topic 323-10- 35-5(b) states that basis difference between the investor’s cost and underlying equity in net assets of the investee at the date of investment requires recognition unless it is attributable to a non-amortizing asset such as goodwill. The negative basis difference was created due to the bargain purchase event and was not attributable to any specific element of the joint venture itself. As the difference was not attributable to any of the assets of Dowa-Olin Metal Corporation, the equity investment as a whole was assessed to determine the appropriate accretion period for the basis difference. The purpose of the joint venture is to supply Olin Brass’s HPAs to the Asian market through the licensing of Olin Brass technology. Given consideration of this use, the negative basis difference is being accreted over a period of 13 years.
Uncertain Tax Positions
Our management evaluates the recognition and measurement of uncertain tax positions based on applicable tax law, regulations, case law, administrative rulings and pronouncements and the facts and circumstances surrounding the tax position. Changes in our estimates related to the recognition and measurement of the amount recorded for uncertain tax positions could result in significant changes in our provision for (benefit from) income taxes, which could be material to our consolidated results of operations.
Derivative Contracts
We measure the fair value of our derivative contract positions under the provisions of ASC Topic 820, which defines fair value, establishes a framework for measuring fair value and enhances disclosures about fair value measures required under other accounting pronouncements but does not change existing guidance as to whether or not an instrument is carried at fair value. This guidance also specifies a fair value hierarchy based upon the observability of inputs used in valuation techniques.
107
Table of Contents
In accordance with this guidance, fair value measurements are classified under the following hierarchy:
| • | Level 1—Quoted prices for identical instruments in active markets. |
| • | Level 2—Quoted prices for similar instruments in active markets; quoted prices for identical or similar instruments in markets that are not active and model-derived valuations in which all significant inputs or significant value-drivers are observable in active markets. |
| • | Level 3—Model-derived valuations in which one or more significant inputs or significant value-drivers are unobservable. |
In accordance with ASC Topic 820, we determine the fair value of derivative contracts using Level 2 inputs. As of March 31, 2013, we did not hold assets or liabilities requiring a Level 3 measurement, and there were not any transfers between the hierarchy levels during three months ended March 31, 2013 or 2012 or the years ended December 31, 2012 or 2011. We do not use hedge accounting for our derivative contracts. All gains and losses are recorded as operating expense in the consolidated statement of operations as these contracts are marked to market each period.
Profits Interest Awards
As of March 31, 2013, Halkos owned 100% of the common stock of Global Brass and Copper Holdings. Halkos has granted, pursuant to the Halkos Equity Plan, non-voting membership interests to select members of management, namely Class B Profits Interest Shares, Class C Profits Interest Shares and Class D Profits Interest Shares. The Class B Shares, Class C Shares and Class D Shares are profits interests in Halkos.
Class B Profits Interest Shares
Class B Shares are accounted for as a profit-sharing arrangement. Expense on the Class B Shares is recorded in the period in which distributions from Halkos to Class Share award holders are determined to be probable. We account for these distributions as non-cash compensation expense with a corresponding increase in additional paid-in capital.
Class C Profits Interest Shares and Class D Profits Interest Shares
As of March 31, 2013, there were no Class C Shares or Class D Shares outstanding. Throughout the time they were outstanding, Class C Shares and Class D Shares were considered to be dual-indexed stock based compensation awards that were accounted for as liability awards. An expense would have been recorded if it became probable that a liquidity event occurred and KPS would subsequently sell its shares down to a less than 20% investment in Halkos and exceeding a specified rate of return target on its investment in Global Brass and Copper Holdings. Such expense would have been recognized as compensation over the implied service period and would have been remeasured at each reporting date at fair value with any changes in fair value therein also recorded as compensation expense. For purposes of disclosing unrecognized expense, the fair value of these awards was determined by first using a valuation model that uses a discounted cash flow and comparable company analysis to estimate an enterprise value for Global Brass and Copper Holdings and then used the Black-Scholes model to allocate enterprise value to the Class C Shares and Class D Shares. The determination of fair value is affected by assumptions regarding a number of highly complex and subjective variables. Changes in the subjective assumptions can materially affect the estimate of their fair value.
From the date of grant, we determined that the achievement of performance conditions for the then outstanding Class C Shares and Class D Shares was not probable as it was conditioned upon a liquidity event that is outside the control of the issuer. As a result, no expense relative to these liability awards has been reflected in the accompanying consolidated financial statements.
108
Table of Contents
On June 30, 2011, the Halkos limited liability company agreement was amended and the Class C Shares and Class D Shares were converted into Class B Shares. As a result, there are no longer any Class C Shares or Class D Shares outstanding. The amendment and conversion did not result in any impact to the consolidated financial statements as the conversion was in effect a liability to liability modification and the achievement of the Class C and D Shares performance condition was not probable nor were there any probable distributions payable for Class B Shares at the time of conversion. Future distributions or settlements of the Class B Shares will be expensed when they become probable.
Prior to the conversion, all 2,000 Class C Shares and all 2,000 Class D Shares were held by Mr. Walker. Consideration for the Class C and D Shares consisted of the Class B Shares into which such Class C and D Shares were converted. All 2,000 of the Class C Shares were converted into 2,000 Class B Shares (a 1:1 conversion ratio) and all 2,000 of the Class D Shares were converted into 1,500 Class B Shares (a 4:3 conversion ratio). The Company determined the ratio for the conversion based upon its determination of the relative value of the Class C and Class D Shares converted into Class B Shares at the time of such conversion. The estimated fair value of the Class B Shares received in the exchange was equal to the estimated fair value of the Class C and D Shares surrendered. In accordance with GAAP, we estimated the fair value of each class of Shares in accordance with the valuation model discussed above and in note 17, “Profits Interest Awards,” in the notes to our audited consolidated financial statements included elsewhere in this prospectus. At the time of conversion, the estimated fair value of the Class B Shares was between $1,536 and $1,592 per Share, the estimated fair value of the Class C Shares was between $1,441 and $1,526 per Share, and the estimated fair value of the Class D Shares was between $1,136 and $1,192 per Share.
Recent Accounting Pronouncements
In February 2013, the Financial Accounting Standards Board (“FASB”) issued Accounting Standards Update (“ASU”) 2013-02, Reporting of Amounts Reclassified Out of Accumulated Other Comprehensive Income. This guidance requires entities to provide disclosures about items that are required by U.S. GAAP to be reclassified from accumulated other comprehensive income (“AOCI”) to net income in their entirety in the same reporting period. The disclosure would include the amount of the reclassification and identify the line item on the statement where net income is presented that is affected by the reclassification. For other items reclassified from AOCI, the disclosure would list cross-references to other disclosures where additional details about their effects are disclosed. This guidance is effective for reporting periods beginning after December 15, 2012. The adoption of this guidance in the first quarter of 2013 did not have a material effect on our consolidated financial statements and disclosures.
In December 2011, the FASB issued ASU 2011-11, Disclosures about Offsetting Assets and Liabilities. This guidance requires entities to disclose both gross and net information about both instruments and transactions eligible for offset in the statement of financial position and instruments and transactions subject to an agreement similar to a master netting arrangement. This guidance does not amend existing guidance on when it is appropriate to offset. In January 2013, the FASB issued ASU 2013-01, Clarifying the Scope of Disclosures about Offsetting Assets and Liabilities, which limits the scope of ASU 2011-11 to derivatives, repurchase agreements and reverse repurchase agreements, and securities borrowing and lending arrangements. The guidance is effective for annual periods beginning January 1, 2013 and interim periods within those annual periods. We adopted this guidance in the first quarter of 2013 and have included the required disclosures in note 10, “Derivative Contracts” to our unaudited consolidated financial statements included elsewhere in this prospectus and note 13, “Derivative Contracts” to our audited consolidated financial statement included elsewhere in this prospectus.
109
Table of Contents
Inflation and Seasonality
We experience effects of inflation on input costs, such as wages, natural gas, electricity, plating and other key inputs. We may not be able to offset fully the impact of inflation on these input costs or energy costs through price increases, productivity improvements or cost reduction programs.
There is a slight decrease in our net sales in each fourth fiscal quarter as a result of a decrease in demand due to customer shutdowns for the holidays and holiday and year-end maintenance of plants and inventory by customers. We also typically experience slight working capital increases in the first fiscal quarter.
Quantitative and Qualitative Disclosure about Market Risk
Market risk represents the risk of changes in the value of market risk sensitive instruments caused by fluctuations in interest rates, commodity prices and foreign exchange rates. Changes in these factors could cause fluctuations in the results of our operations and cash flows. In the ordinary course of business, we are primarily exposed to changes in commodity prices, interest rates and foreign currency exchange rates. To manage the volatility related to these exposures we use various financial instruments, including some derivatives, to help us manage our metal price, energy price, and interest rate risk. We also use offsetting forward sale and purchase agreements to help mitigate commodity price risks on operating margins. These agreements generally do not contain minimum purchase requirements.
We do not use derivative instruments for trading or speculative purposes and have not elected to use hedge accounting. We manage counterparty credit risk by entering into derivative instruments only with financial institutions with investment-grade credit ratings.
The following tables set forth the impact of a 10% price change on our hedging positions as of March 31, 2013 and December 31, 2012, respectively.
| (in millions) | ||||||||||||||||
| March 31, 2013 |
Nominal value | Fair value | Unrealized gains |
Impact of 10% price change on fair value |
||||||||||||
| Metals |
$(14.5 | ) | $(14.2 | ) | $0.3 | $1.4 | ||||||||||
| Natural Gas |
— | — | — | — | ||||||||||||
| Electricity |
1.0 | 1.2 | 0.2 | 0.1 | ||||||||||||
| Interest Rate Caps |
— | — | — | — | ||||||||||||
|
|
|
|
|
|
|
|
|
|||||||||
| Totals |
$(13.5) | $(13.0) | $0.5 | $1.5 | ||||||||||||
|
|
|
|
|
|
|
|
|
|||||||||
| (in millions) | ||||||||||||||||
| December 31, 2012 |
Nominal value | Fair value | Unrealized gains |
Impact of 10% price change on fair value |
||||||||||||
| Metals |
$14.0 | $14.4 | $0.4 | $1.4 | ||||||||||||
| Natural Gas |
0.2 | 0.2 | — | — | ||||||||||||
| Electricity |
1.3 | 1.5 | 0.2 | 0.2 | ||||||||||||
| Interest Rate Caps |
— | — | — | — | ||||||||||||
|
|
|
|
|
|
|
|
|
|||||||||
| Totals |
$15.5 | $16.1 | $0.6 | $1.6 | ||||||||||||
|
|
|
|
|
|
|
|
|
|||||||||
110
Table of Contents
Commodity Prices
In the ordinary course of business, we are exposed to earnings and cash flow volatility resulting from fluctuations in metal, natural gas and electricity costs. We use our balanced book approach, supported, where required, by derivative contracts, to substantially reduce the impact of metal price fluctuations on operating margins. Despite our use of our balanced book approach to mitigate the impact of metal price fluctuations on our operating margins, we must bear the cost of any shrinkage during production, which may increase the volatility of our results of operations. We also use derivative contracts to reduce uncertainty and volatility in natural gas and electricity costs.
Interest Rates
We are exposed to volatility in interest rates and expense under the terms of our credit agreement. Interest rates under the ABL Facility are comprised of a base rate and margin. The ABL Facility provides the option of a LIBOR or prime base rate. If interest rates increase, our debt service obligations on variable rate debt would increase even though the amount borrowed would not increase. Assuming the amount of our variable debt remains the same as it was on March 31, 2013, an increase of 1% in the interest rates on our variable rate debt would increase our 2013 debt service requirements by approximately $0.3 million. See also “Risk Factors—Because some of our indebtedness bears interest at rates that fluctuate with changes in certain prevailing short-term interest rates, we are vulnerable to interest rate increases”.
Foreign Exchange
Our international operations accounted for approximately 6% of our net sales in 2012. As a result, we have exposure to foreign exchange risk on transactions that can potentially be denominated in many foreign currencies. The functional currency of our operating subsidiaries is the related local currency. During 2012, the fluctuation of the U.S. dollar against other currencies resulted in an unrealized currency translation loss that decreased our equity by $0.1 million. Gains or losses from currency translation are primarily related to our equity investment in Dowa-Olin Metal Corporation.
We do not attempt to hedge foreign currency exposure in a manner that would eliminate the effect of changes in foreign currency exchange rates on net income and cash flow. We do not speculate in foreign currency nor do we hedge the foreign currency translation of our international business to the U.S. dollar for purposes of consolidating our financial results, or other foreign currency net asset positions. During 2012, foreign currency had a positive impact to net income of approximately $0.2 million.
Internal Control over Financial Reporting
We are not currently required to comply with the SEC’s rules implementing Section 404 of the Sarbanes Oxley Act of 2002, as amended, and are therefore not required to make a formal assessment of the effectiveness of our internal control over financial reporting for that purpose. Upon becoming a public company, we will be required to comply with the SEC’s rules implementing Section 302 and 404 of the Sarbanes-Oxley Act of 2002, as amended, which will require our management to certify financial and other information in our quarterly and annual reports and provide an annual management report on the effectiveness of our internal control over financial reporting. We will not be required to make our first annual assessment of our internal control over financial reporting pursuant to Section 404 until the year following our first annual report required to be filed with the SEC.
111
Table of Contents
In connection with the audits of our financial statements for the fiscal year ended December 31 2011 and 2010, we and our independent auditor identified four material weaknesses in our internal control over financial reporting. A material weakness is a deficiency, or combination of deficiencies, in internal control over financial reporting, such that there is a reasonable possibility that a material misstatement of the annual or interim financial statements will not be prevented or detected on a timely basis. These material weaknesses related to our accounting for joint ventures, income tax matters, physical inventory quantity record keeping and allowance for doubtful accounts. The material weaknesses related to our accounting for joint ventures income tax matters and physical inventory quantity record keeping were remediated as of December 31, 2011. The material weakness related to our allowance for doubtful accounts was remediated as of December 31, 2012.
112
Table of Contents
Our Company
We are a leading, value-added converter, fabricator, distributor and processor of specialized copper and brass products in North America. We engage in metal melting and casting, rolling, drawing, extruding and stamping to fabricate finished and semi-finished alloy products from processed scrap, copper cathode and other refined metals. Our products include a wide range of sheet, strip, foil, rod, tube and fabricated metal component products which we sell under the Olin Brass, Chase Brass and A.J. Oster brand names. Our products are used in a variety of applications across diversified end markets, including the building and housing, munitions, automotive, transportation, coinage, electronics/electrical components, industrial machinery and equipment and general consumer end markets. We access these end markets through direct mill sales, our captive distribution network and third-party distributors. We hold the exclusive production and distribution rights in North America for a free machining, lead-free brass rod product, which we sell under the Green Dot™ and Eco Brass® brand names. The vertical integration of the manufacturing capabilities of Olin Brass and the distribution capabilities of A.J. Oster allows us to access a wide variety of customers with both high and low volume demand for our products. We believe the diversity of our product portfolio, the breadth of our value-added customer services, our vertical integration and our technical expertise underpin the long-standing relationships we have with our broad customer base. Over the past three years, we have significantly enhanced our profitability and operational flexibility, which we believe positions us to benefit from growth in customer demand across the majority of the key end markets we service as macroeconomic conditions improve. In addition, we expect to capitalize on new market and new product growth opportunities, which we are currently pursuing.
We service over 1,700 customers in 28 countries across 5 continents. We employ approximately 1,900 people and operate 11 manufacturing facilities and distribution centers across the U.S., Puerto Rico and Mexico to service our North American customers. Through our 80% owned joint venture in China and our 50/50 joint venture in Japan, together with sales offices in China and Singapore, we supply our products in China and throughout Asia, where we believe we are positioned to take advantage of the region’s expanding copper, brass strip and foil market. We service our European customers through distribution arrangements in the United Kingdom and Germany.
Our leading market positions in each of our operating segments allow us to achieve attractive operating margins. Our strong operating margins are a function of four key characteristics of our business: (1) we earn a premium margin over the cost of metal because of our value-added processing capabilities, patent-protected technologies, and first-class service; (2) we have strategically shifted our product portfolio toward value-added, higher margin products; (3) we employ our “balanced book” approach to substantially reduce the financial impact of metal price volatility on our earnings and operating margins; and (4) we are driving a lean cost structure through fixed and variable cost reductions, process improvements, and workforce flexibility initiatives. For example, we have improved our labor efficiency and cost structure at Olin Brass by streamlining our reporting structure and increasing the number of tasks our Olin Brass employees are qualified to perform. Salaried and hourly employee headcount has been reduced and we have greater flexibility to vary labor levels in line with production volumes. We have also undertaken substantial cost reduction activities since our formation in 2007, which has reduced our fixed costs, improved our net working capital balances, and improved our competitive positioning which has increased operating margins.
Our cost-focused reductions and initiatives have helped us create a lean cost structure. When our production volumes increase, our operating costs increase by a smaller proportion, allowing us to generate higher operating margins. The combination of our lean cost structure and our high-value product mix allows us to maximize our operating margins.
113
Table of Contents
Our financial performance is primarily driven by metal conversion economics, not by the underlying movements in the price of copper and the other metal we use. Through our balanced book approach, we match the timing, quantity and price of our metal sales with the timing, quantity and price of our replacement metal purchases. This practice substantially reduces the financial impact of metal price movements on our earnings and operating margins.
For the year ended December 31, 2012, we shipped 503.2 million pounds of products, and we generated net sales of $1,650.5 million, adjusted sales (as defined in note 4 under “Summary Historical Consolidated Financial Data”) of $524.9 million, net income attributable to Global Brass and Copper Holdings, Inc. of $12.5 million and Consolidated Adjusted EBITDA (as defined in note 5 under “Summary Historical Consolidated Financial Data”) of $115.4 million. Our U.S. operations generated 94% of our total net sales in the year ended December 31, 2012. The following charts show our pounds shipped by our three operating segments and our pounds shipped by key end market for the year ended December 31, 2012.
For the year ended December 31, 2012:
Note: For the Chase Brass segment, pounds shipped by end markets in the above chart reflects management’s allocation among end markets of pounds shipped by Chase Brass to distributors, job shops and forging shops. In addition, management estimates that approximately 50% of the Company’s pounds shipped to the electronics/electrical components end market are directly associated with the building sector.
114
Table of Contents
Segments Overview
We have three operating segments: Olin Brass, Chase Brass and A.J. Oster.
|
|
|
| ||||
| Description |
• Leading manufacturer, fabricator and converter of specialized copper and brass sheet, strip, foil, tube and fabricated products |
• Leading manufacturer and supplier of brass rod |
• Leading distributor and processor of copper and brass products | |||
| • #1 North American Position (by 2012 pounds shipped) |
• #1 or #2 North American Position (by 2012 pounds shipped) |
• #1 North American Position (by 2012 pounds shipped) | ||||
| Key Products / Services |
• Produces 55 copper-based alloys, including 15 HPAs, which provide superior strength, conductivity and formability |
• Produces nine brass alloys which provide superior strength and corrosion resistance, sold under the Blue Dot® brass rod brand name |
• Network of strategically located distribution centers, providing inventory management, distribution and value-added metal processing services to customers | |||
| • Over the past 3 years, approximately 14-18% of Olin Brass’s copper-based products have been sold to A.J. Oster |
• Holds exclusive rights for the production and sale of lead-free brass rod in North America, sold under the Green Dot™ rod and Eco Brass® alloy brand names |
• Over the past 3 years, approximately 70% to 80% of A.J. Oster’s copper-based products have been sourced from Olin Brass | ||||
| • Products sold throughout the U.S., Puerto Rico, Mexico, Asia and Europe |
• Products sold throughout the U.S., Mexico and Canada |
• Products sold throughout the U.S., Puerto Rico and Mexico | ||||
| Key End Markets |
• Munitions, Automotive, Coinage, Building and Housing, Electronics/Electrical Components |
• Building and Housing, Transportation, Electronics/Electrical Components, Industrial Machinery and Equipment and Distribution |
• Building and Housing, Automotive, Electronics/Electrical Components | |||
| Operations |
• 4 strategically located sites in the U.S. and 1 in China |
• 1 strategically located manufacturing site and 1 warehouse facility in the U.S. |
• 4 strategically located sites in the U.S., 1 in Puerto Rico and 1 in Mexico | |||
| • Marketing and sales joint venture office in Japan
• Sales office in Singapore
• 1,382 employees; 1,344 in the U.S. and 38 in Asia as of December 31, 2012 |
• 316 employees as of December 31, 2012 |
• 268 employees as of December 31, 2012 | ||||
115
Table of Contents
Our Competitive Strengths
Market Leader in Key Industrial Segments
We believe we have leading market positions in the industry sectors served by each of our three operating segments. Management estimates that our strategically located plants represent approximately 40% of North American capacity for copper and copper-alloy SSP and brass rod production, supplying over 1,700 customers with over 15,000 SKUs, with approximately 10%, 24% and 66% of those SKUs being sold by Chase Brass, Olin Brass and A.J. Oster, respectively. We believe our customers value our ability to provide a diverse range of products, many of which are exclusively offered by us. For example, at Olin Brass, we produce 55 alloys (including 15 HPAs), which, management estimates, based on available market information, is nearly twice as many types of alloys as produced by our closest competitor. Our ability to provide high quality product in varying quantities at attractive prices and in a timely manner to meet the product needs of our customers has resulted in long-standing customer relationships, many of whom we have served for more than 30 years. Our leading market positions and scale also enable us to negotiate favorable arrangements with our suppliers. During 2012, we operated at approximately 57-65% capacity utilization across our portfolio of facilities. As a result, we believe it would require a significant investment to become a substantial new participant in the industry, and any such investment might not yield attractive returns for a significant period of time.
Exposure to Cyclical, End Market and New Product Growth
In 2012, approximately 49% of our pounds shipped served end markets principally influenced by new residential construction, repair and remodeling activity and light vehicle sales in the United States. Our operations are well-positioned to take advantage of the recovery that we believe is underway in the U.S. housing market. According to management estimates, U.S. housing starts are expected to grow from 740,000 in 2012 at a compound annual growth rate (“CAGR”) of 13.1% through 2015. According to management estimates, U.S. existing home sales are expected to grow from 4.1 million in 2012 at a CAGR of 6.1% through 2015. We also believe there is considerable growth potential in the U.S. automotive sector. According to management estimates, North American light vehicle production is forecast to grow from 14.9 million in 2012 at a CAGR of 4.5% through 2015. Additionally, we believe further growth will be driven by demand for our new products. We hold exclusive production and sales rights for “lead-free” Eco Brass® rod and control the licensing of Eco Brass® ingot in North America. This “lead-free” alloy can be used to make products that comply with recently enacted Federal legislation that will require a reduction of lead content in all drinking water and plumbing devices in January 2014. In addition, we believe that the Company is well positioned to become an industry leader in anti-microbial copper products through its CuVerro product line. In 2011 Olin Brass completed the Federal and state registration processes necessary to market its CuVerro™ materials as having anti-microbial properties and has licensed more than a dozen exclusive component manufacturers to market CuVerro™ products to the healthcare industry. We believe there is significant opportunity for us to expand our customer base to include companies that develop copper products for use in the healthcare, food service and other industries, replacing stainless steel and aluminum. We also anticipate a significant increase in the size of the coinage market if the U.S. transitions to the $1 coin and eliminates the dollar bill. As a certified supplier to the United States Mint, we expect to capture a material portion of this new demand. Finally, we currently believe that demand levels for rod and strip products in the U.S. are significantly below historical averages and that with the expected continued recovery in our key end-markets, we will observe significant increases in demand for our products. Given our current installed operating capacity and associated utilization rates, we believe we can meet this increase in demand with very low capital investment.
116
Table of Contents
Significant Expected Profit Growth through Volume Increases
Since our formation in 2007, we have implemented various cost reduction initiatives and workforce flexibility programs focused on reducing our fixed and non-metal variable costs. We believe the largely automated nature of our operations at our Chase Brass facility and the absence of defined benefit pension obligations or retiree healthcare obligations have contributed to a lean, flexible cost structure, which should position us to achieve strong operating margins going forward. Specifically:
| • | During 2012, we operated at approximately 57-65% capacity utilization across our portfolio of facilities. As such, we have available operating capacity that we can bring online quickly to respond to increased demand for our products and value-added services; |
| • | We believe we can increase production at our facilities with minimal change in our fixed costs and without significant additional capital investment; and |
| • | We believe we have the financial capacity and balance sheet strength to meet the working capital requirements that would accompany production increases in response to growing customer demand. |
Since our formation in 2007, we have consistently improved our Consolidated Adjusted EBITDA per pound, a metric that management monitors to assess our profitability and operating efficiency, from $0.10 per pound for the year ended December 31, 2008 to $0.23 per pound for the year ended December 31, 2012.
Margin and Cash Flow Profile Insulated from Metal Price Volatility
Approximately 70%-75% of our cost structure consists of variable metal costs, for which we use our balanced book approach to substantially reduce the financial impact of metal price volatility on our earnings and operating margins. Our business model is principally based on the conversion and fabrication of the metal we purchase into finished and semi-finished alloy products. Our financial performance is driven by metal conversion economics (i.e., the prices we charge for our products and value-added services and our ability to control our operating costs); we do not seek to profit from movements in underlying metal prices. Through our balanced book approach, we match the timing, quantity and price of our metal sales with the timing, quantity and price of our replacement metal purchases. Our balanced book approach allows us to substantially reduce the financial impact of metal price volatility on our earnings and operating margins. Our balanced book approach and low fixed cost position has allowed us to generate substantial cash flows. For the three months ended March 31, 2013, net cash used in operating activities was $5.1 million and in the three months ended March 31, 2012, we generated net cash provided by operating activities of $31.8 million. For the fiscal years ended December 31, 2012, 2011 and 2010, we generated net cash provided by operating activities of $81.9 million, $64.8 million and $69.4 million, respectively. In addition, we have low capital expenditure requirements. We estimate annual capital expenditures from 2013 to 2017 to range between $25 million to $30 million per annum, of which $20 million to $24 million per annum will consist of capital improvements or replacement of existing capital items. Our total capital expenditures as a percentage of our adjusted sales have ranged from approximately 2% to 4% for the last three fiscal years.
Net income attributable to Global Brass and Copper Holdings, Inc. per pound was $0.09 and $0.11 for the three months ended March 31, 2013, and 2012, respectively. Net income (loss) attributable to Global Brass and Copper Holdings, Inc. per pound was $0.02, $0.11, $0.08, $0.02 and $(0.11) for the years ended December 31, 2012, 2011, 2010, 2009 and 2008, respectively. Net income attributable to Global Brass and Copper Holdings, Inc. per pound was $1.02 for the successor period from October 10, 2007 to December 31, 2007, and net income per pound of our predecessor was $0.07 for the predecessor period from January 1, 2007 to November 18, 2007.
117
Table of Contents
As illustrated in the following chart, we have increased our historical Consolidated Adjusted EBITDA(1) per pound over the period from 2007 to the first quarter 2013, despite relatively volatile underlying copper prices:
Source: Copper prices from the London Metal Exchange reported by Bloomberg
(1) See note 5 to “Summary Historical Consolidated Financial Data” for the calculation of Consolidated Adjusted EBITDA and a reconciliation to net income (loss) attributable to Global Brass and Copper Holdings, Inc., which is the most directly comparable U.S. GAAP financial measure to Consolidated Adjusted EBITDA.
(2) We acquired the worldwide metals business of Olin Corporation on November 19, 2007. As a result, the 2007 fiscal year is composed of a predecessor period from January 1, 2007 to November 18, 2007 (represented by “2007(P)” in the chart above), and a successor period from the date of our formation, October 10, 2007, to December 31, 2007 (represented by “2007(S)” in the chart above). We had no material operations or assets prior to November 19, 2007. Data for the period from January 1, 2007 to November 18, 2007 are based on books and records provided to us by Olin Corporation in connection with the acquisition, we believe were prepared on a basis consistent with Olin Corporation’s accounting policies and procedures and have not been subject to an audit or review. Data for the predecessor period of 2007 are not prepared using our accounting policies and procedures, do not reflect the application of purchase accounting (which has been applied to the successor period financial statements) and also do not reflect the allocation of Olin Corporation selling, general and administrative expenses to the metals business unit. We believe that the unaudited financial information for the predecessor period of 2007 may be useful to investors for purposes of illustrating trends in our business. Although we have no reason to believe that the unaudited financial information for the predecessor period of 2007 is materially deficient, there is a risk that this unaudited financial information may contain errors that might have been detected in a review or audit process or might have been different if prepared in accordance with our policies and procedures instead of those of Olin Corporation. See note 5 to “Summary Historical Consolidated Financial Data” and note (a) to the reconciliation table contained in such note and “Risk Factors—Risks Related to Our Business—You should not place undue reliance on the selected financial and other information of our predecessor as of November 18, 2007 and for the period from January 1, 2007 to November 18, 2007, which are summarized in this prospectus”.
(3) For the three months ended March 31, 2013.
Over the past three years, we have demonstrated the ability to generate significant operating cash flow despite the relatively difficult operating environment. Our strong cash flow generation has enabled us to significantly reduce our leverage from approximately 7.9x gross debt to Consolidated Adjusted EBITDA upon formation in 2007 to 3.4x as of December 31, 2012. Our debt reduction achievements have also been delivered while distributing dividends to our shareholders. We believe we will continue to generate significant operating cash flow, which will provide us the opportunity to deploy future excess cash flow to fund dividends or value-enhancing acquisitions. We will continue to manage our capital with financial discipline with the objective of maximizing value for our shareholders.
Highly Experienced Management Team
Since our formation in 2007, we have assembled a highly experienced management team, which combines our predecessor’s legacy experience with new team members who have many years of relevant industry experience. The members of our senior management team have, on average, over 26
118
Table of Contents
years of metals industry experience. Since our formation, our senior management team has implemented a new business strategy and successfully transformed the cost structure and operating strategy of the business. Our management team has also instilled a culture that promotes performance excellence with a strong focus on driving profitability and, as a direct result, our operational and financial performance has improved significantly since 2007.
Our Growth Strategy
Participate in Demand Recovery as Economic Conditions Strengthen
Our premium products and services have allowed us to achieve leading positions across a number of attractive end markets. In addition, we maintain strong relationships with a diverse set of customers across those end markets. As U.S. macroeconomic conditions continue to improve, we expect to see increased activity in many of our key end markets, especially building and housing, automotive, coinage and industrial machinery and equipment, which we expect will drive increased demand for our products and services. In the beginning of 2013, the U.S. housing market has experienced a recovery from the sharp downturn that began in 2007. We believe that our available production capacity will allow us to effectively and efficiently respond to increasing demand.
Capitalize on Growth Opportunities for Our Existing Products and Services
We believe there are opportunities to expand the supply of our existing products and services in several key high-value end markets. Examples include:
| • | Lead-free and Low-lead Plumbing Products. New regulations designed to reduce lead content in drinking water plumbing devices provide a key opportunity for future growth. Chase Brass is a premier provider of specialized lead-free products and low-lead alloys. Recently enacted Federal legislation in the United States (the Reduction of Lead in Drinking Water Act, which was patterned after legislation enacted in California and Vermont) will require the reduction of lead content in all drinking water plumbing devices beginning in January 2014. This legislation presents a significant growth opportunity for Chase Brass. Our Eco Brass® products meet Federal, California and Vermont standards and can be used to produce cast, machined and forged faucet parts. We currently supply major faucet, valve and fitting manufacturers who produce multiple products using machined Eco Brass® parts. |
| • | Transition to the Dollar Coin. On September 20, 2011, Representatives David Schweikert and Jeb Hensarling introduced the Currency Optimization, Innovation and National Savings, or “COINS Act”, which is intended to modernize the U.S. currency system by transitioning fully from a $1 note to a $1 coin. On January 31, 2012, the COINS Act was introduced in the U.S. Senate. The Government Accountability Office estimated in 2011 that the transition to a $1 coin would save the government on average $184 million a year. While it is uncertain whether any legislation implementing the transition to the $1 coin will be adopted and despite a recently announced substantial reduction in $1 coin production over the next couple of years, we anticipate a significant increase in the size of the coinage market if the U.S. does transition to the $1 coin and eliminates the dollar bill. In addition, increased demand for coinage represents a key potential source of growth for our company. As a certified supplier to the United States Mint, we expect to capture a material portion of this new demand. |
Pursue New Growth Opportunities
We have identified a number of important trends in key growth markets which we believe will drive significant incremental growth for our company, including:
| • | Anti-microbial Applications. Olin Brass is well positioned to become a leader in commercializing anti-microbial copper products through its CuVerro™ anti-microbial product |
119
Table of Contents
| line. The EPA recently recognized that copper is inherently capable of neutralizing potentially harmful viruses and bacteria and began accepting registrations of copper alloys with anti-microbial properties. Olin Brass manufactures several such registered alloys, and we believe there is significant opportunity for us to expand our customer base to include companies that develop copper products for use in the healthcare, food service, heating, ventilation and air conditioning industries, replacing stainless steel and aluminum. Olin Brass has completed the Federal and state registration process necessary to market products containing anti-microbial public health claims in full compliance with EPA standards. |
| • | Renewable Energy Applications. Renewable energy is a fast growing and attractive sector, with significant long-term growth potential. Copper, copper-alloy and brass products are used in renewable energy technologies, including lithium batteries and solar power applications (such as photovoltaic cells). We believe increasing demand for renewable energy applications will be a key opportunity for further growth. |
In addition, we plan to continue to identify opportunities to extend our existing range of products and services through ongoing investment in technology research and development through our Materials Research Laboratory. The Materials Research Laboratory is a copper-alloy research, manufacturing and production innovation lab and is responsible for numerous patents held by our Company and also by our customers. The Materials Research Laboratory was instrumental in developing patented products such as CopperBond®, CopperBond® XTF, and other unique foil products such as C7025 for computer disk drives.
Pursue Strategic Opportunities to Expand Our Business
The North American copper and brass distribution industry includes numerous small, regional players. We believe future industry consolidation and possible strategic acquisitions in key growth markets, notably Asia, will provide opportunities for us to create shareholder value and increase our presence in these markets. In addition, we may pursue strategic acquisition and/or partnership opportunities to increase the breadth and distribution of our product portfolio and metal distribution services in the future.
Company History
Global Brass and Copper Holdings is a portfolio company of KPS. Global Brass and Copper Holdings was formed in October 2007 to acquire the worldwide metals business of Olin Corporation. In connection with the acquisition, which was completed on November 19, 2007, we recruited a new senior management team, led by John Walker, our Chief Executive Officer, to lead the company. In January 2008, we acquired the order book, customer list and certain other assets of Bolton’s North American operations. Our senior management team has led a transformation of the business, implementing a new business strategy and cost structure and significantly increasing the profitability of the business, despite the severe economic downturn that began in late 2008.
Before Global Brass and Copper Holdings acquired the worldwide metals business of Olin Corporation, most of what is now our business operated for almost 90 years as the Metals segment of Olin Corporation. Over many decades, Olin Corporation’s Metals segment expanded by greatly increasing capacity, developing new technologies and products, such as developing HPAs for the automotive sector, forging business relationships in foreign markets, such as China, and acquiring a distribution business to complement its core metals manufacturing business.
120
Table of Contents
Olin Brass
Olin Brass is a leading manufacturer and converter of specialized copper and brass sheet, strip and fabricated products. The Olin Brass segment also rerolls and forms other alloys such as stainless steel, carbon steel and aluminum. Key attributes of sheet and strip are conductivity, corrosion resistance, strength, formability, cosmetic appearance and antimicrobial properties. Sheet and strip is generally manufactured from copper and copper-alloy scrap.
Olin Brass manufactures its products through four sites in North America and as of December 31, 2012 employed 1,382 employees. The integrated brass mill in East Alton, Illinois is the main operating facility, which produces strip products. Strip products are processed further through the segment’s downstream operations for value-added applications. Olin Brass’s downstream operations include: a stamping operation located in East Alton; a rolling mill in Waterbury, Connecticut with rolling, annealing, leveling, plating and slitting capabilities for various products; a rolling mill in Bryan, Ohio specializing in products sold in the automotive and electronics/electrical components end markets; and a manufacturing facility in Cuba, Missouri that produces high frequency welded copper-alloy tube for heat transfer, utility, decorative, automotive and plumbing applications.
Olin Brass produces a wide variety of products. During the fiscal year ended December 31, 2012, it produced 55 alloys, including 15 HPAs. Olin Brass is working to expand its market portfolio further by capitalizing on certain trends, including applications that utilize the anti-microbial properties of copper, possible transition to the dollar coin in the U.S. and the use of copper, copper-alloy and brass products in renewable energy technologies, including lithium batteries and solar power applications.
Olin Brass’s products are distributed either directly to original equipment manufacturers (“OEMs”) or supply chain customers or to A.J. Oster. In the year ended December 31, 2012, approximately 20% of Olin Brass’s products were shipped to supply chain customers, of which management estimates that approximately 60% of such shipments were directly associated with the building and housing or automotive sectors. Between approximately 14% and 18% of these products are sold to A.J. Oster.
The vertical integration of the manufacturing capabilities of Olin Brass and the distribution capabilities of A.J. Oster allows us to access a wide variety of customers with both high and low volume demand for our products and “just in time” product requirements. The manufacturing and distribution integration between Olin Brass and A.J. Oster is also a competitive strength because we believe that among our major competitors Olin Brass is the only major mill in North America with an associated “in-house” distribution operation that can provide customers flexibility in volume and service levels.
Olin Brass also has operations in Guangzhou, China, through an 80% owned service center joint venture with Chinalco, Olin Luotong Metals. Olin Luotong Metals mainly distributes HPA products within China, accounting for 3.2% of products shipped from Olin Brass during the fiscal year ended December 31, 2012. Olin Brass also has other operations in other parts of Asia and Europe. See “—International”.
Net sales from the shipments to external customers by the Olin Brass segment were $676.6 million during the fiscal year ended December 31, 2012 (41.0% of our net sales), $718.2 million during the fiscal year ended December 31, 2011 (40.3% of our net sales) and $710.3 million during the fiscal year ended December 31, 2010 (42.8% of our total net sales). The total assets of the Olin Brass segment were $216.7 million as of December 31, 2012, $205.4 million as of December 31, 2011 and $208.8 million as of December 31, 2010.
Income before provision for income taxes and equity income for the Olin Brass segment was $41.6 million, $51.0 million and $44.6 million for the years ended December 31, 2012, 2011 and 2010, respectively. Segment Adjusted EBITDA for the Olin Brass segment was $45.1 million, $45.3 million, and $23.2 million, for the years ended December 31, 2012, 2011 and 2010, respectively.
121
Table of Contents
Olin Brass’s products are used in five primary end markets: building and housing, munitions, automotive, coinage and electronics/electrical components.
Building and Housing End Market
Olin Brass manufactures strip, welded tube and stamped parts for a variety of products used in commercial and residential buildings, including faucets, locksets, decorative door hardware and hinges, which require workability, corrosion resistance and attractive appearance. Olin Brass also manufactures strip used in products that require electrical conductivity such as plug outlets, switches, lamp shells, other wiring devices, industrial controls, circuit breakers and switchgears. The products are generally manufactured with copper and copper-alloy sheet and strip, both HPAs and standard alloys, as well as copper-alloy welded tube.
We intend to further expand our customer base in this end market with a focus on healthcare, heating, ventilating and air conditioning by utilizing the anti-microbial properties of copper to replace stainless steel and aluminum.
Customers in this end market are OEMs producing building and housing products. These products are supplied either directly to customers or to A.J. Oster. Olin Brass also supplies building and housing products in China through Olin Luotong Metals.
Demand within this end market is affected by new residential housing, existing home sales, and commercial construction all of which are significantly dependent on overall economic conditions. The building and housing end market accounted for 4% of the total pounds shipped by the Olin Brass segment during the fiscal year ended December 31, 2012, 5% during the fiscal year ended December 31, 2011 and 5% during the fiscal year ended December 31, 2010.
Munitions End Market
Olin Brass manufactures parts utilized in both the military and commercial munitions markets, such as strip and cups, including for uses in shot shell bullet jackets, centerfire, rimfire and small caliber military munitions. Munitions demand is predominantly domestic, with occasional opportunities to supply U.S. alliance partners with these parts.
Customers in this end market include major munitions producers in the U.S., as well as government facilities producing small caliber ammunition.
Demand within this market is affected by the U.S. government’s security policies, as well as consumer demand for firearms and munitions. The munitions end market accounted for 42% of the total pounds shipped by the Olin Brass segment during fiscal year ended December 31, 2012, 40% during the fiscal year ended December 31, 2011, and 41% during the fiscal year ended December 31, 2010.
Automotive End Market
Olin Brass manufactures both strip and fabricated products used as lead frames and electrical connectors for use in automobiles. These products are made with HPAs, which makes these products suitable for applications requiring high reliability, high temperature and low insertion force. For example, these electrical connectors, along with lead frames manufactured by us, are used in junction boxes, wiring harnesses, ignition systems, lighting and automotive entertainment systems.
122
Table of Contents
Customers in this end market include primary automotive connector suppliers in the U.S. Although historically the business in this end market remained largely regional in the U.S., Olin Brass and A.J. Oster are collectively working to capitalize on the migration of automotive production to Mexico, where an A.J. Oster service center is located.
Demand within this end market is affected by the level of consumer spending on automobiles, which is significantly dependent on overall economic conditions. The automotive end market accounted for 13% of the total pounds shipped by the Olin Brass segment during the fiscal year ended December 31, 2012, 13% during the fiscal year ended December 31, 2011 and 12% during the fiscal year ended December 31, 2010.
Coinage End Market
Olin Brass supplies coinage strip for use in the production of dollar coins, quarters, dimes and nickels. Customers in this end market include the United States Mint, for which we are a supplier contracted through 2017. Olin Brass has been a supplier for the United States Mint for over 30 years and expects to continue to renew its contract periodically with the United States Mint for the foreseeable future. Olin Brass services the United States Mint directly.
The demand within this end market is affected by the level of activities in retail transactions. If the U.S. economy continues to improve and/or the United States Mint transitions from dollar bills to $1 coins, we expect the demand for our coinage strip to increase further. The coinage end market accounted for 8% of the total pounds shipped by the Olin Brass segment during the fiscal year ended December 31, 2012, 8% during the fiscal year ended December 31, 2011 and 5% during the fiscal year ended December 31, 2010.
Electronics/Electrical Components End Market
Olin Brass manufactures strip used in integrated circuit sockets for circuit boards, electrical connectors for laptop computers, consumer electronics and appliances, and foils for flexible circuit applications. The strip manufactured in this end market is high in HPA content. We intend to further expand the product base in this end market through the use of copper, copper-alloy and brass products in renewable energy technology, including lithium batteries and solar power applications.
Customers in this end market are primarily electronics manufacturers that operate globally. A portion of these customers is serviced through A.J. Oster, and the remainder is supplied directly by Olin Brass, with the Somers Thin Strip facility providing the foil products on a global scale.
Demand within this end market is affected by consumer spending on electronics, which may fluctuate significantly as a result of economic conditions. The electronics end market accounted for 5% of the total pounds shipped by the Olin Brass segment during the fiscal year ended December 31, 2012, 4% during the fiscal year ended December 31, 2011 and 6% during the fiscal year ended December 31, 2010.
International
Asia
Olin Brass’s operations in Asia primarily consist of Olin Luotong Metals in Guangzhou, China, a value-added service center joint venture between Olin Brass and Chinalco; GBC Metals Asia Pacific PTE, a 100% owned subsidiary in Singapore; and Dowa-Olin Metal Corporation, a marketing and sales joint venture with Dowa located in Hamamatsu, Japan.
123
Table of Contents
Olin Luotong Metals, established in 2002, is a value-added service center joint venture in Guangzhou, China, which is 80% owned by Olin Brass and 20% owned by Chinalco. It distributes into the Chinese market HPAs manufactured by Olin Brass in the U.S. and standard alloys manufactured by Chinalco. Olin Luotong Metals performs value-added slitting and winding operations to these alloys prior to distribution. Primary customers include major multinational manufacturers of components used in automotive, electronic and electrical applications. Almost all of Olin Luotong Metals’ sales are settled in U.S. dollars. During the fiscal year ended December 31, 2012, Olin Luotong Metals generated $37.5 million of net sales (excluding sales to other Olin Brass affiliates).
Dowa-Olin Metal Corporation, established in 1987, is a marketing and sales joint venture located in Hamamatsu, Japan, and is 50% owned by Olin Brass and 50% owned by Dowa. The main function of Dowa-Olin Metal Corporation is to market and sell HPAs licensed from Olin Brass and manufactured at Dowa’s strip mills to key customers in Japan and southeast Asia. The primary markets served include electronic lead frames and electrical connectors. During the fiscal year ended December 31, 2012, Dowa-Olin Metal Corporation generated $83.0 million of net sales. As Dowa-Olin Metal Corporation is accounted for as a non-consolidated entity, these sales are not included in our total net sales or the net sales of Olin Brass.
GBC Metals Asia Pacific PTE is an Olin Brass wholly-owned subsidiary located in Singapore. GBC Metals Asia Pacific PTE markets and sells HPAs supplied primarily by Olin Brass and Dowa-Olin Metal Corporation into key electronics markets in Asia, including Singapore, Malaysia, Korea, Taiwan and China. During the fiscal year ended December 31, 2012, GBC Metals Asia Pacific PTE generated $16.2 million of net sales (excluding sales to other Olin Brass affiliates).
Sales volume of Olin Brass in Asia (excluding Dowa-Olin Metal Corporation) was 10.4 million pounds during fiscal year ended December 31, 2012 (3.9% of total pounds shipped by Olin Brass), 9.7 million pounds during the fiscal year ended December 31, 2011 (3.7% of total pounds shipped by Olin Brass) and 13.1 million pounds during the fiscal year ended December 31, 2010 (4.3% of total pounds shipped by Olin Brass).
Europe
Olin Brass’s business in Europe is conducted through distribution arrangements with Aurubis U.K. in the United Kingdom and Türkis GmbH in Germany.
Sales volume of Olin Brass in the European region was 1.1 million pounds during the fiscal year ended December 31, 2012 (0.4% of total pounds shipped by Olin Brass), 0.9 million pounds during the fiscal year ended December 31, 2011 (0.3% of total pounds shipped by Olin Brass) and 1.1 million pounds during the fiscal year ended December 31, 2010 (0.4% of total pounds shipped by Olin Brass).
Others
Sales volume from Olin Brass’s international business in regions other than Asia and Europe, including sales shipments in Mexico and Canada, was 7.9 million pounds during the fiscal year ended December 31, 2012 (3.0% of total pounds shipped by Olin Brass), 8.5 million pounds during the fiscal year ended December 31, 2011 (3.2% of total pounds shipped by Olin Brass) and 7.3 million pounds during the fiscal year ended December 31, 2010 (2.4% of total pounds shipped by Olin Brass).
For a discussion of the risks relating to our foreign operations, see “Risk Factors—Risks Related to Our Business—A portion of our net sales is derived from our international operations, which exposes us to certain risks inherent in doing business abroad”.
124
Table of Contents
Chase Brass
Chase Brass primarily manufactures brass rod, including round and other shapes, ranging in size from 1/4 inch to 4.5 inches in diameter. These primary shapes and sizes are used by consumers of brass rod, who machine or otherwise process the rod for applications used in various end markets. Brass rod is primarily used for forging and machining products, such as valves and fittings. Key attributes of brass rod include its machinability, corrosion resistance and moderate strength. Brass rod is generally manufactured from copper or copper-alloy scrap.
All of the segment’s rod is manufactured at its facility located in Montpelier, Ohio. Chase Brass distributes all of its products directly to customers. The acquisition of the order book, customer list and certain other assets of Bolton’s North American operations in January 2008 boosted Chase Brass’s capabilities and customer base. Chase Brass plans to further capitalize on opportunities arising from regulation limiting lead content in potable water plumbing fixtures. We believe this will increase the need for low-lead and lead-free materials, including Eco Brass®.
Chase Brass’s products are distributed either directly to original equipment manufacturers or to supply chain customers. During fiscal year ended December 31, 2012, approximately 37% of Chase Brass’s products were sold to supply chain customers.
Net sales from shipments to external customers by the Chase Brass segment were $647.7 million during the fiscal year ended December 31, 2012 (39.2% of our total net sales), $705.0 million during the fiscal year ended December 31, 2011 (39.6% of our total net sales) and $611.9 million during the fiscal year ended December 31, 2010 (36.9% of our total net sales). The total assets of the Chase Brass segment were $125.1 million as of December 31, 2012, $132.3 million as of December 31, 2011 and $107.5 million as of December 31, 2010.
Income before provision for income taxes and equity income for the Chase Brass segment was $65.7 million, $71.8 million and $60.0 million for the years ended December 31, 2012, 2011 and 2010, respectively. Segment Adjusted EBITDA for the Chase Brass segment was $66.6 million, $73.7 million and $61.2 million for the years ended December 31, 2012, 2011 and 2010, respectively.
Chase Brass’s products are used in four primary end markets: building and housing, transportation, electronics/electrical components and industrial machinery and equipment. During the year ended December 31, 2012, Chase Brass shipped a total of 216.9 million pounds, including 80.3 million pounds shipped to distributors, job shops and forging shops, which were allocated by management to Chase Brass’s end markets based on information gathered by management from such distributors, job shops and forging shops to calculate the pounds shipped to the various end markets presented below.
Building and Housing End Market
Chase Brass manufactures brass rod for use in faucets, valves and fittings, including single lever faucet hubs, bodies of standard stop valves and stems and balls of valves. Demand within this end market is affected by new residential housing activity, and existing home sales, all of which are significantly dependent on overall economic conditions.
Chase Brass produces a number of low-lead and lead-free products, or “green portfolio” products, which meet the standards under new state laws in California and Vermont as well as Federal standards (patterned after legislation enacted in California and Vermont) that will go into effect in January 2014 with respect to the level of lead content in products used in plumbing and drinking water applications. Chase Brass’s Green Dot rod and Eco Brass® ingot products are part of the green portfolio, and Chase Brass is the exclusive licensee of the intellectual property rights for their production and sale in North America. Chase Brass also manufactures other non-patented green
125
Table of Contents
portfolio products. Our green portfolio products accounted for 9.9% of pounds shipped of Chase Brass during the fiscal year ended December 31, 2012, as compared to 8.5% and 8.7% in the fiscal years ended December 31, 2011 and 2010, respectively. See “—Our Growth Strategy”.
Customers in this end market include major faucet, valve and fitting manufacturers who are producing multiple products using green portfolio materials.
The building and housing end market accounted for 48% of the total pounds shipped of Chase Brass during the fiscal year ended December 31, 2012, 48% during the fiscal year ended December 31, 2011 and 52% during the fiscal year ended December 31, 2010.
Transportation End Market
Chase Brass manufactures brass rod for uses in automobiles and trucking. Specific applications include heavy truck braking systems, tire valves, heat sensors and various truck and automotive fittings. Demand within this end market is affected by levels of transportation activity, levels of maintenance capital spending by transportation companies and the level of commercial truck fleet replacement activity, all of which are affected significantly by overall economic conditions. Customers in this end market include major OEMs in the transport industry and customers who support domestic automotive production.
The transportation end market accounted for 13% of the total pounds shipped by the Chase Brass segment during the fiscal year ended December 31, 2012, 12% during the fiscal year ended December 31, 2011 and 11% during the fiscal year ended December 31, 2010.
Electronics/Electrical Components End Market
Chase Brass manufactures brass rod used for telecommunication applications, including products such as coaxial connectors and traps and filters for cable television. Demand within this end market is affected by consumer spending along with new home construction.
Customers within these end markets include major manufacturers of specialty products for use in home and commercial construction, both of which are very dependent on overall economic conditions. Management believes that substantially all of the shipments in this market segment are directly associated with the building and housing and transportation end markets.
The electronics/electrical components end market accounted for 11% of the total pounds shipped by Chase Brass during the fiscal year ended December 31, 2012, 13% during the fiscal year ended December 31, 2011 and 11% during the fiscal year ended December 31, 2010.
Industrial Machinery and Equipment End Market
Chase Brass manufactures brass rod used in industrial valves and fittings. Demand within this end market is affected by capital spending levels, U.S. GDP growth and industrial production growth in the U.S.
Customers in this end market include various major diversified manufacturers and a variety of screw machine companies supporting OEMs.
The industrial machinery and equipment end market accounted for 28% of the total pounds shipped by the Chase Brass segment during the fiscal year ended December 31, 2012, 27% during the fiscal year ended December 31, 2011 and 26% during the fiscal year ended December 31, 2010.
126
Table of Contents
International
Chase Brass primarily supplies products within North America. Export sales outside of North America accounted for less than 1.0% of net sales in each year from 2010 through 2012. Net sales to Canada and Mexico during this time period averaged 4.5% to 5.7% of Chase Brass net sales.
For a discussion of the risks relating to our foreign operations, see “Risk Factors—Risks Related to Our Business—A portion of our net sales is derived from our international operations, which exposes us to certain risks inherent in doing business abroad”.
A.J. Oster
A.J. Oster is a processing distributor of copper and copper-alloy sheet, strip and foil. A.J. Oster operates six strategically-located service centers in the United States, Puerto Rico and Mexico. Olin Brass supplies A.J. Oster with approximately 70% to 80% of A.J. Oster’s copper-alloy products. Aurubis is A.J. Oster’s second largest supplier after Olin Brass, supplying approximately 16% of A.J. Oster’s copper-alloy products in the year ended December 31, 2012. Many of the coils purchased from Olin Brass are full-width and require slitting. Key A.J. Oster competitive advantages are short lead-times with high reliability, small-quantity deliveries and a wide range of high-quality, copper-alloy products. We believe these advantages can help our customers reduce their costs and working capital requirements.
Each A.J. Oster service center reliably provides a broad range of high-quality products at quick lead-times in small quantities. These capabilities, combined with A.J. Oster’s operations of precision slitting, hot tinning, traverse winding, cutting, edging and special packaging, provide value to a broad customer base.
Net sales from the shipments to external customers by the A.J. Oster segment were $326.2 million during the fiscal year ended December 31, 2012 (19.8% of our total net sales), $355.9 million during the fiscal year ended December 31, 2011 (20.0% of our total net sales) and $336.6 million during the fiscal year ended December 31, 2010 (20.3% of our total net sales). The total assets of the A.J. Oster segment were $79.1 million as of December 31, 2012, $78.9 million as of December 31, 2011 and $89.7 million as of December 31, 2010.
Income before provision for income taxes and equity income for the A.J. Oster segment was $23.7 million, $24.8 million and $21.1 million for the years ended December 31, 2012, 2011 and 2010, respectively. Segment Adjusted EBITDA for the A.J. Oster segment was $19.5 million, $17.9 million and $21.3 million for the years ended December 31, 2012, 2011 and 2010, respectively.
A.J. Oster’s products are used in three primary end markets: building and housing, automotive and electronics/electrical components.
Building and Housing End Market
A.J. Oster slits and distributes copper-alloy strip and aluminum foil used for products in commercial and residential buildings. The two primary applications are electrical and hardware.
Electrical products are primarily for wiring devices. Other applications include switchgears, switches, controls and circuit breakers. Several of our customers for these products are in Puerto Rico or Mexico. These customers require short lead-times, small quantities and numerous specifications. A.J. Oster’s capabilities are well-suited for the geographic locations and the stringent service requirements of the electrical end market.
127
Table of Contents
Hardware products include products such as faucets, window trim, locksets, hinges and kick plates.
Demand in the building and housing end market is affected by new residential housing, commercial construction and existing home sales, all of which are significantly dependent on overall economic conditions. The building and housing end market accounted for 32% of the total pounds shipped for A.J. Oster during the fiscal year ended December 31, 2012, 34% during the fiscal year ended December 31, 2011 and 35% during the fiscal year ended December 31, 2010.
Automotive End Market
A.J. Oster slits, traverse winds, hot tin dips, coats and distributes copper-alloy strip and aluminum foil used in automobile production. Primary customer products are electrical connectors, automotive trim and heat exchangers.
A.J. Oster has excellent geographic coverage to service this market. A.J. Oster Mexico, Queretaro is well-positioned to take advantage of the growing number of second-tier automobile component suppliers that are growing in Mexico.
Demand within this end market is affected by the level of consumer spending on automobiles, which is significantly dependent on overall economic conditions. The automotive end market accounted for 28% of the total pounds shipped by the A.J. Oster segment during the fiscal year ended December 31, 2012, 25% during the fiscal year ended December 31, 2011 and 22% during the fiscal year ended December 31, 2010.
Electronics/Electrical Components End Market
A.J. Oster slits, traverse winds, hot tin dips, coats and distributes copper-alloy strip used for electrical connectors in computers, consumer electronics and automobiles. The markets served by A.J. Oster are service intensive and therefore require A.J. Oster capabilities.
The demand within this end market is affected by consumer spending on electronics, which may fluctuate significantly as a result of economic conditions. The electronics/electrical components end market accounted for 21% of the total pounds shipped by the A.J. Oster segment during the fiscal year ended December 31, 2012, 23% during the fiscal year ended December 31, 2011 and 26% during the fiscal year ended December 31, 2010.
International
A.J. Oster’s North American operations include a service center in central Mexico. The facility is located in Queretaro on the NAFTA Highway in the center of Mexico’s industrial triangle marked by Mexico City, Monterey and Guadalajara.
Automakers in Mexico produce approximately two million automobiles per year. Automotive sub-suppliers that consume copper-alloy strip are now locating facilities in central Mexico in order to support primary automotive manufacturing.
A.J. Oster is well positioned to capture growth in the Mexican market for copper-alloy strip. Our customers located in Mexico will require first-class service and quality levels traditionally demanded by the electrical, electronics and automotive industries. Meeting these demands is a core competency of A.J. Oster.
128
Table of Contents
Net sales from A.J. Oster Mexico were $40.0 million during the fiscal year ended December 31, 2012 (12.3% of A.J. Oster net sales), $33.5 million during the fiscal year ended December 31, 2011 (9.4% of A.J. Oster net sales) and $28.9 million during the fiscal year ended December 31, 2010 (8.6% of A.J. Oster net sales).
For a discussion of the risks related to our foreign operations, see “Risk Factors—Risks Related to Our Business—A portion of our net sales is derived from our international operations, which exposes us to certain risks inherent in doing business abroad”.
Raw Materials and Supply
We manufacture our products using metal in the form of scrap metal (both internally generated and externally sourced) or virgin raw materials. During the fiscal year ended December 31, 2012, 89.5% of our metal came from scrap metal, and the remainder came from virgin raw materials. Olin Brass utilizes both scrap and virgin raw materials, while Chase Brass almost exclusively uses scrap.
The following table shows the breakdown of externally sourced metal used in casting facilities of Chase Brass and Olin Brass during the fiscal year ended December 31, 2012:
| Input Raw Material |
Olin Brass (million lbs) |
Chase Brass (million lbs) |
Total (million lbs) |
% of Total | ||||||||||||
| Virgin raw materials |
68.0 | 19.9 | 87.9 | 18.7 | % | |||||||||||
| Dealer scrap |
116.9 | 53.2 | 170.1 | 36.3 | % | |||||||||||
| Customer scrap |
63.9 | 147.2 | 211.1 | 45.0 | % | |||||||||||
| Total Externally Sourced Metal |
248.8 | 220.3 | 469.1 | 100.0 | % | |||||||||||
We obtain scrap in the following ways:
| • | Internally generated scrap. During the fiscal year ended December 31, 2012, at our facilities in East Alton, Illinois and Montpelier, Ohio, 371.7 million pounds of internally generated process scrap (including 5.0 million pounds generated by A.J. Oster) were returned to the casting facilities to be re-melted based on 800.3 million pounds of copper and copper-alloy slabs and billets produced. |
| • | Customer generated scrap. Primarily in the Chase Brass segment, we execute scrap supply agreements with most customers that purchase Chase Brass’s brass rod. |
| • | Dealer scrap. A portion of scrap metal procured by us is obtained in the open market from a wide variety of scrap dealers. |
Virgin raw materials, including copper cathode, are purchased at a premium on the London Metal Exchange or Commodities Exchange, or directly from key dealers that support producers around the world. Although virgin raw materials are more expensive compared to scrap, we use them to produce HPAs and other products that require exact specifications.
Customers
Our customer base is broadly diversified, spanning various North American end markets, including building and housing, munitions, automotive, transportation, coinage, electronics/electrical components, industrial machinery and equipment and general consumer end markets. In the fiscal year ended December 31, 2012, we sold over 15,000 different SKUs to more than 1,700 customers, with no customer representing greater than 7% of net sales. In the fiscal years ended December 31, 2012, 2011, and 2010, net sales from all foreign countries were $93.7 million, $88.1 million, and $91.3 million, respectively. We have long-term relationships with our customers, although our contracts with
129
Table of Contents
our customers generally have relatively short terms. Our relationships with many of our significant customers have lasted more than 30 years. For additional information see “Risk Factors—Risks Related to Our Business—We do not have long-term contractual arrangements with a substantial number of our customers, and our sales volumes and net sales could be reduced if our customers switch some or all of their business with us to other suppliers”.
Two of our operating segments had customers to whom shipments constituted more than 10% of net sales during the fiscal year ended December 31, 2012. Olin Brass generated 16.3% of its total net sales through shipments to the United States Mint, 11.2% of its total net sales through shipments to Delphi Packard and 10.4% of its total net sales through shipments to ATK. A.J. Oster generated 16.0% of its total net sales through shipments to Molex Incorporated.
Competition
We compete with other companies on price, service, quality and product breadth and availability both domestically and internationally. We believe we have been able to compete effectively because of our high levels of service, breadth of product offering, knowledgeable and trained sales force, modern equipment, numerous locations, geographic dispersion, operational economies of scale and sales volume.
The North American market for brass and copper strip and sheet and brass rod consists of a few large participants and a few smaller competitors for Olin Brass and Chase Brass and a number of smaller competitors for A.J. Oster. Our international competitors are based principally in Europe and Asia.
Our largest competitors in each of the markets in which we operate are the following:
| • | Aurubis and PMX Industries, Inc.: manufacturing of copper and copper-alloys in the form of strip, sheet and plate (Olin Brass); |
| • | ThyssenKrupp Materials NA, Copper and Brass Sales Division: distribution and processing of copper, brass, stainless and aluminum products; Wieland Metals, Inc.: re-roll mill and service center for copper and copper-alloy strip (A.J. Oster); |
| • | Mueller Industries, Inc.: manufacturing of brass rod (Chase Brass). |
Based on the data published by Copper Development Association Inc., Copper and Brass Servicenter Association, Inc. (both independent industry associations) and management estimates, as of December 31, 2012, the Olin Brass segment accounted for 35.2% of North American shipments (including shipments to A.J. Oster) of copper and brass alloys in the form of sheet, strip and plate; the A.J. Oster segment accounted for 33.3% of North American shipments of copper and brass, sheet and strip products from distribution centers and rerolling facilities; and the Chase Brass segment accounted for 47.7% of North American domestic shipments of brass rod.
Government Regulation and Environmental Matters
Anti-microbial Products
Olin Brass’s copper-based CuVerro™ materials are in full compliance with EPA standards for products recognized by the EPA as having anti-microbial properties. Olin Brass has now completed the Federal and state registration processes that will allow it to market its CuVerro™ products with anti-microbial public health claims.
130
Table of Contents
Lead-free and Low-lead Plumbing Products
New regulations designed to reduce lead content in drinking water plumbing devices provide a key opportunity for future growth. Chase Brass is a premier provider of specialized lead-free products and low-lead alloys. Recently enacted Federal legislation in the United States (the Reduction of Lead in Drinking Water Act, which was patterned after legislation enacted in California and Vermont) will require the reduction of lead content in all drinking water plumbing devices beginning in January 2014. This legislation presents a significant growth opportunity for Chase Brass. Our Eco Brass® products meet Federal, California and Vermont standards and can be used to produce cast, machined and forged faucet parts. We currently supply major faucet, valve and fitting manufacturers who produce multiple products using machined Eco Brass® parts.
Environmental
Our operations are subject to a number of Federal, state and local laws and regulations relating to the protection of the environment and to workplace health and safety. In particular, our operations are subject to extensive Federal, state and local laws and regulations governing the creation, transportation, use, release and disposal of wastes, air and water emissions, the storage and handling of hazardous substances, environmental protection, remediation, workplace exposure and other matters. Hazardous materials used in our operations include general commercial lubricants, cleaning solvents and cutting oils. Among the regulated activities that occur at some of our facilities are: the accumulation of scrap metal, which is sold for recycling; and the generation of hazardous waste, solid wastes and wastewaters, such as water from burning tables operated at some of our facilities. The generation, storage, and disposal of these wastes is in accordance with the Federal Water Pollution Control Act, CERCLA and the Resource Conservation and Recovery Act, and we use third-party commercial disposal services as permitted by these laws for the removal and disposal of these wastes. The storage, handling, and use of lubricating and cutting oils and small quantities of maintenance-related products and chemicals are also regulated under environmental laws, and the health hazards of these materials are communicated to employees pursuant to the Occupational Safety and Health Act.
In general, our facilities’ operations do not involve the types of emissions of air pollutants, discharges of pollutants to land or surface water, or treatment, storage, or disposal of hazardous waste which would ordinarily require Federal or state environmental permits. Some of our facilities possess authorizations under the Clean Air Act for air emissions from paints and coatings. At some locations, we also possess hazardous materials storage permits under local fire codes or ordinances for the storage of combustible materials such as oils or paints. At some facilities we possess state or local permits for on-site septic systems. Our cost of obtaining and complying with such permits has not been, and is not anticipated to be, material.
We believe that we are in substantial compliance with all applicable environmental and workplace health and safety laws and do not currently anticipate that we will be required to expend any substantial amounts in the foreseeable future in order to meet such requirements. Nevertheless, some of the properties we own or lease are located in areas with a history of heavy industrial use, and are near sites listed on the CERCLA National Priority List, CERCLIS and comparable state listings. CERCLA establishes responsibility for clean-up without regard to fault for persons who have released or arranged for disposal of hazardous substances at sites that have become contaminated and for persons who own or operate contaminated facilities. In many cases, courts have imposed joint and severable liability on parties at CERCLA clean-up sites. We have a number of properties located in or near industrial or light industrial use areas; accordingly, these properties may have been contaminated by pollutants which may have migrated from neighboring facilities or have been released by prior occupants. Some of our properties have been affected by releases of cutting oils and similar materials and we are investigating and remediating such known contamination pursuant to applicable environmental laws. The costs of these clean-ups have not been material in the past. We are not
131
Table of Contents
currently subject to any claims or notices with respect to clean-up or remediation under CERCLA or similar laws for contamination at our leased or owned properties or at any off-site location. However, we could be notified of such claims in the future. It is also possible that we could be identified by the U.S. Environmental Protection Agency, a state agency or one or more third parties as a potentially responsible party under CERCLA or under analogous state laws.
Pursuant to the agreement, dated November 19, 2007, by which we purchased our current operating locations from Olin Corporation, Olin Corporation agreed to retain responsibility for a wide range of liabilities under environmental laws arising out of existing contamination on our properties, and agreed to indemnify us without limitation with respect to these liabilities. Specifically, Olin Corporation retained responsibility for:
| • | compliance with all obligations to perform investigations and remedial action required under the Connecticut Real Property Transfer Act at properties in Connecticut; |
| • | pending corrective action/compliance obligations under the Federal Resource Conservation and Recovery Act for certain areas of concern at our East Alton, Illinois facility; and |
| • | all obligations under environmental laws arising out of 24 additional specifically identified areas of concern on various of our properties. |
Olin Corporation also retained complete responsibility for all liabilities arising out of then pending governmental inquiries relating to environmental matters; for “any liability or obligation in connection with a facility of the Business to the extent related to pre-Closing human exposure to Hazardous Materials, including asbestos-containing materials”; and for “any liability or obligation in connection with the off-site transportation or disposal of Hazardous Materials arising out of any pre-Closing operations of the Business”.
In addition, Olin Corporation agreed to indemnify us, subject to a $1.0 million deductible and $30.0 million liability cap, for any other environmental liabilities arising out of pre-acquisition activities in decreasing percentages, starting with 75% of losses in the first two years following the closing and decreasing to 0% of losses by the seventh year. Since 2007, Olin Corporation has continued to perform environmental remedial actions on our properties, including the East Alton, Illinois and Waterbury, Connecticut properties, and continues to work closely with us to address matters covered by the indemnity. Because of the Olin Corporation indemnity, we have not been required to engage in any significant environmental cleanup activity on our properties during the past four years and do not currently have any material reserves established to address environmental remedial requirements.
Management Information Systems
Each of our three operating segments has its own information systems that organize various business data to streamline its operations. Olin Brass generally uses a unified custom-developed application platform that keeps track of data, including with respect to plant maintenance, procurement, accounts payable and fixed assets. Olin Brass’s facility in Waterbury, Connecticut is the only facility that has its own independent application environment that supports all business and financial data on site. A.J. Oster utilizes two applications on a single platform. One application handles inventory and customer orders, and the other application handles customer information, supplier information and the general ledger. Chase Brass uses a fully integrated ERP system that supports purchasing, inventory, accounts payables, customer data, sales orders, billing, accounts receivables, cash application and the general ledger.
We currently use an automated centralized consolidation system that was implemented in the fourth quarter of 2011. Prior to the implementation of our automated centralized consolidation system, we used Olin Brass’s general ledger as the base for the company-wide general ledger and consolidated all business segments manually.
132
Table of Contents
Employees
As of December 31, 2012, we employed 1,986 persons. As of the same date, the Olin Brass segment employed 1,382 persons, 70% of our total employees, the A.J. Oster segment employed 268 persons, 13% of our total employees, the Chase Brass segment employed 316 persons, 16% of our total employees and the corporate office employed 20 persons, 1% of our total employees.
As of December 31, 2012, 1,118, or approximately 56%, of our employees at various sites were members of unions. We have generally maintained good relationships with all unions and employees, which has been an important aspect of our ability to be competitive in our industry. There are nine unions representing employees in the Olin Brass segment (eight representing employees at the East Alton, Illinois facility and one representing employees of Bryan Metals, LLC), two representing employees of the A.J. Oster segment (one representing employees of A.J. Oster Foils, LLC and another representing employees of A.J.O. Global Services Mexico S.A. de C.V.) and one representing employees of the Chase Brass segment. In July 2012, employees at the Olin Brass Somers Thin Strip facility elected a union representative, and the election was certified by the National Labor Relations Board on July 27, 2012. On April 2, 2013, Somers Thin Strip employees ratified a collective bargaining agreement. That agreement took effect on April 3, 2013 and expires on December 15, 2015. The collective bargaining agreement with the eight unions that represent employees at the East Alton facility of Olin Brass expires in November 2013. The collective bargaining agreement with the union representing employees of Chase Brass expires in June 2013, and Chase Brass will soon begin negotiations with the union over terms and conditions of a collective bargaining agreement. The collective bargaining agreement with the union representing employees of A.J. Oster Foils, LLC expires in January 2014. The collective bargaining agreement with the union representing employees of A.J.O. Global Services Mexico S.A. de C.V. has an indeterminate term, with a review of wages every year and a review of benefits every two years. The collective bargaining agreement with the union represented employees of Bryan Metals, LLC is effective through September 30, 2014. Since our acquisition of the worldwide metals business of Olin Corporation in November 2007, we have not experienced any work stoppages at any of our facilities. We presently do not anticipate any problems or issues with respect to renewing the outstanding collective bargaining agreements upon acceptable terms. Historically, we have succeeded in negotiating new collective bargaining agreements without a strike. See “Risk Factors—Risks Related to Our Business—Adverse developments in our relationship with our employees could have a material adverse effect on our business, financial condition, results of operations and cash flows”.
Research and Development
We conduct research and development through our Materials Research Laboratory, located within our facilities in East Alton, Illinois and Waterbury, Connecticut. Our research facilities are staffed with six scientists in metallurgy and electrochemistry. We intend to continue to invest in research and development to develop new products and to expand our value-added services that meet our customers’ needs.
Our key research and development accomplishments are the following:
| • | Alloy Development. We have developed numerous alloy systems that we have designed and patented, including those that meet many of the global standards for electronic, lead frame and connector applications, as well as specialty clad alloys supplied to the United States Mint, including a gold-colored metal alloy we developed for both the Sacagawea and Presidential one-dollar coins. |
| • | Foil Products—CopperBond®; CopperBond® XTF. We have developed CopperBond® treated foil, an ultra-thin copper plated foil product used in electronic flexible circuit applications. Our rolling mill in Waterbury, Connecticut utilizes four specialized plating lines to manufacture |
133
Table of Contents
| CopperBond® foil. Other unique foil products developed include C7025 for computer disk drives and CopperBond® XTF foil, a flexible extra-thin treated foil that can be produced in thicknesses as thin as one micron. |
| • | Specialized Coatings. We have developed specialized coatings and plating systems for copper-based alloys. The proprietary tin coatings used by us have been licensed in many countries for automotive terminal applications, which require extreme thermal stability and low insertion forces. We have also been developing specialized anti-tarnish coatings for a variety of end markets. |
| • | Process Improvements. We research and develop improvements for the Olin Brass manufacturing facilities intended to enhance product quality, operating efficiency and cost effectiveness. We have also developed melting and casting procedures that are tailored to improve cast bar quality and yield in commercial operations. We are currently working on the development of improved casting techniques for Olin Brass. We also utilize the Materials Research Laboratory facilities to improve our downstream mill processing process to reduce costs and further improve product quality. |
The following describes some of the primary laboratory functions available at our Materials Research Laboratory facilities:
| • | Metal Forming. Formability tests are used to determine the ability of sheet metal to make a desired part. Standard simulative tests and specialized tests assess strip metal formability. |
| • | Electrical Interconnects. A fully-automated, computer-driven data acquisition and control system is used to measure static contact resistance, fretting wear, macro wear and coefficients of friction. The equipment simulates and quantifies various failure mechanisms typically responsible for connector malfunction. |
| • | Test Development. We have the capability to perform a wide range of tests to applicable standards, such as ASTM, or in accordance with locally developed or customer specific procedures. If a currently available test is not appropriate, a new test can be developed. |
| • | Materials Characterization. A broad range of materials characterization capabilities are available to support the Materials Research Laboratory technology development efforts. |
Our research and development expenditures for the fiscal year ended December 31, 2012 were $1.5 million (0.1% of total net sales), $1.5 million for the fiscal year ended December 31, 2011 (0.1% of total net sales) and $1.7 million for the fiscal year ended December 31, 2010 (0.1% total net sales). See “Risk Factors—Risks Related to Our Business—Failure to protect, or uncertainty regarding the validity, enforceability or scope of, our intellectual property rights could impair our competitive position”.
Risk Management and Insurance
The primary risks in our operations are personal injury, property damage, transportation, criminal acts, risks associated with international operations, directors and officers’ liability and general commercial liabilities. We are insured against general commercial liabilities, automobile accidents (including injury to employees and physical damage of goods and property and employer liabilities), directors and officers liability, crime, foreign risks, aircraft products liability, ocean cargo liability and flood through insurance policies provided by various insurance companies up to amounts we consider are sufficient to protect against losses due to claims associated with these risks. Our insurance policies are renewed annually, and reassessed as we deem appropriate.
We also maintain bonds with certain Federal, state and international authorities to insure against risks relating to, among other things, delays due to customs clearances, compliance with certain laws and regulations and import and export of goods.
134
Table of Contents
Safety
Consistent with other strategic initiatives, management is pursuing a ‘Best in Class’ performance status for employee safety. Our management has committed itself to achieving a formal ‘Star’ certification within the OSHA sponsored Voluntary Protection Program, or VPP. A formal VPP Star certification is OSHA’s official recognition for outstanding efforts between employers and employees for achieving exemplary occupational safety and health. The Safety Excellence / VPP initiative shifts the safety paradigm to an aggressive proactive approach that stresses strong employee participation and collaboration, management accountability, employee training and hazard elimination as core foundational elements.
Patents, Trademarks and Other Intellectual Property Rights
Chase Brass has an exclusive intellectual property license, valid through the expiration of the U.S. patents in 2027, to produce and sell Eco Brass® rod and ingot in North America, granted by Mitsubishi Shindoh Company, Ltd., the Japanese company that owns the relevant intellectual property rights. We have sublicensed our rights to three sublicensees, none of which is a competitor of any of our subsidiaries or segments. These sublicensing arrangements are valid until the expiration of the relevant patents in North America. In addition, we have alloy licensing arrangements with companies in Germany, Japan and China.
As of December 31, 2012, we owned 189 patents, of which 59 were U.S. patents. We also own various trademarks relating to our products. As of December 31, 2012, we owned 25 trademarks, of which 12 are U.S. trademarks. Most of these are owned by GBC Metals, LLC, a wholly owned subsidiary of ours. We license the marks OLIN BRASS and OLIN METALS for metal products from Olin Corporation. These licenses continue unless we breach the license agreement. We also license stylized versions of these marks from Olin Corporation and the license to the stylized version includes an annual termination option.
We license the intellectual property rights related to certain proprietary alloy systems to other major brass mills around the world, including Dowa. As of December 31, 2012, there were seven such licenses.
Government Contract
The United States Mint is a significant customer of Olin Brass. Olin Brass has been one of the authorized suppliers to the United States Mint since 1969 and currently has a contractual arrangement to supply nickel and brass coinage strip to multiple United States Mint facilities. Our supply agreement with the United States Mint runs through 2017. The United States Mint can terminate our contract in whole or in part when it is in the best interest of the United States Mint to do so and any damages payable to us by the United States Mint for such termination would not include lost profits.
Seasonality and Backlog
There is a slight decrease in our net sales in the fourth fiscal quarter as a result of the decrease in demand due to customer shutdowns for the holidays and year-end maintenance of plants and inventory by customers. We also typically experience slight working capital increases in the first fiscal quarter.
Vehicles
We operate a fleet of owned or leased trucks and trailers, as well as fork lifts and support vehicles. We believe these vehicles are generally well maintained and adequate for our current operations.
135
Table of Contents
Manufacturing, Property and Facilities
Many of our facilities are capable of being used at higher capacities than those at which they are currently being used, and as a result we can increase production to respond to increased demand for our products and services. We believe that our facilities will be adequate for the expected needs of our existing businesses over the next several years. We estimate based on generally available data that our plants currently represent approximately 40% of North American capacity for copper and copper-alloy SSP and brass rod production, supplying our customers with over 15,000 SKUs.
Pursuant to a 2007 transition services agreement, Olin Corporation supplies Olin Brass with natural gas, water, steam and waste water disposal, among other things, at its East Alton, Illinois facility. According to the transition services agreement, Olin Corporation has agreed to provide utility services until Olin Corporation ceases operations at its East Alton, Illinois facility, at which time Olin Brass has the option to acquire the utilities infrastructure at fair market value.
136
Table of Contents
The following table summarizes our major facilities as of March 31, 2013:
| Operation |
Location |
Owned or |
Products | |||||
| Corporate and other segment |
Corporate Headquarters |
Schaumburg, Illinois | Leased | |||||
| Olin Brass segment(1) |
Mill Products | East Alton, Illinois(2) | Owned(3) | Copper-based strip
Clad copper & copper-alloy strip | ||||
| Fabricated Products | East Alton, Illinois | Owned(3) | Stamped & drawn copper-based parts | |||||
| Fineweld Tube |
Cuba, Missouri | Owned | Welded copper-alloy tube | |||||
| Bryan Metals | Bryan, Ohio | Owned | Copper-based strip | |||||
| Somers Thin
Strip |
Waterbury, Connecticut | Owned | Copper-based strip and foil
Stainless steel light gauge strip | |||||
| Olin Luotong Metals | Guangzhou, China | Owned building; 50-year lease on land | Copper-based strip | |||||
| Olin Brass Headquarters |
Louisville, Kentucky | Leased | ||||||
| Chase Brass segment |
Manufacturing | Montpelier, Ohio(4) | Owned | Alloy-rod | ||||
| Warehouse | Los Angeles, California | Leased | Alloy-rod | |||||
| A.J. Oster segment |
Processing and Distribution | Warwick, Rhode Island | Leased | |||||
| Processing and Distribution | Alliance, Ohio | Owned | ||||||
| Processing and Distribution | Carol Stream, Illinois | Owned | Copper-alloy strip, aluminum foil, specialty stainless steel, specialty rod and wire | |||||
| Processing and Distribution | Yorba Linda, California | Leased | ||||||
| Processing and Distribution | Caguas, Puerto Rico | Owned | ||||||
| Processing and Distribution | Queretaro, Mexico | Owned | ||||||
| A.J. Oster Headquarters |
Warwick, Rhode Island | Leased |
| (1) | All of Olin Brass’s copper and copper-alloy sheet and strip mills are ISO 9000-2000 certified. |
| (2) | The East Alton, Illinois facility is TS 16949 certified. |
| (3) | Certain utility infrastructure at the East Alton, Illinois facility is leased by Olin Brass from Olin Corporation. |
| (4) | The Montpelier, Ohio facility is ISO 9001-200 certified. |
Legal Proceedings
We are currently and from time to time involved in a variety of claims, lawsuits and other disputes arising in the ordinary course of business, none of which management currently believes are, or will be, material to our business.
137
Table of Contents
Our executive officers and directors as of the date of this prospectus are as follows. Each is a citizen of the U.S. unless otherwise indicated.
| Name |
Age | Position | ||||
| John H. Walker |
55 | Chief Executive Officer and Class Director | ||||
| Robert T. Micchelli |
57 | Chief Financial Officer | ||||
| Daniel B. Becker |
59 | President—A.J. Oster | ||||
| Devin K. Denner |
55 | President—Chase Brass | ||||
| John J. Wasz |
52 | President—Olin Brass; Chief Operating Officer | ||||
| Scott B. Hamilton |
54 | General Counsel and Secretary | ||||
| Paul Schwind |
37 | Corporate Controller | ||||
| Michael Psaros |
45 | Chairman of Board of Directors (Class Director) | ||||
| Raquel Palmer |
40 | Class Director | ||||
| David Shapiro |
51 | Class Director | ||||
| Jay Bernstein |
37 | Class Director | ||||
| George Thanopoulos |
49 | Class Director | ||||
| Ronald C. Whitaker |
65 | Class Director | ||||
| Martin E. Welch, III |
64 | Class Director | ||||
| David Burritt |
57 | Class Director | ||||
John H. Walker—Mr. Walker has served as chief executive officer of Global Brass and Copper Holdings and as a director of Global Brass and Copper Holdings since 2007. From 2003 to 2006, he served as chief executive officer and president of The Boler Company, a major transportation manufacturer. Additionally, he currently serves as a director of Nucor Corporation, a major steel manufacturer, and of United Continental Holdings, Inc., a global airline. Mr. Walker served as a director of Delphi Corporation, an auto parts manufacturer, from 2005 to 2009 and of The Boler Company from 2003 to 2006. Mr. Walker provides valuable business expertise and extensive management knowledge to the Board of Directors, having served as our chief executive officer and in key management and operational oversight roles in various other corporations. The restructuring knowledge he has gained from his executive role at Weirton Steel, a major steel producer, which reorganized under federal bankruptcy laws, provided valuable turnaround experience. He also brings consulting and strategy expertise from his early career with McKinsey & Company, a global management consulting firm. Mr. Walker brings audit and financial experience to the Board of Directors through his service on the audit committees of United Continental Holdings, Inc. Delphi Corporation and Nucor Corporation, and knowledge of director and executive compensation through his service on the compensation committee of United Continental Holdings, Inc. and Nucor Corporation. Further, Mr. Walker serves on the nominating and governance committee of Nucor Corporation as well as the public responsibility committee of United Continental Holdings, Inc. For the foregoing reasons, we believe Mr. Walker is a valuable member of the Board of Directors.
Robert T. Micchelli—Mr. Micchelli has served as the chief financial officer of Global Brass and Copper Holdings since 2008. Prior to joining Global Brass and Copper Holdings, from 2007 to 2008 Mr. Micchelli served as executive vice president and chief financial officer of Wilbert Plastics, Inc., a plastics design and processing company, vice president of finance of The Boler Company from 2001 to 2006 and vice president of finance of Marconi Medical Systems, Inc., a medical diagnostics equipment manufacturer. Mr. Micchelli brings to us 30 years of diverse financial management experience in the fields of manufacturing, plastics processing, transportation equipment, medical imaging and specialty chemicals. He holds a bachelor’s degree from Rutgers University and an MBA from the University of Chicago Booth School of Business.
138
Table of Contents
Daniel B. Becker—Mr. Becker has been president of A.J. Oster since 2004. Prior to becoming president of A.J. Oster, Mr. Becker served in executive roles both domestically and internationally at Olin Corporation, a major metals manufacturer. Mr. Becker has led successful restructurings of several European business units of Olin Corporation and achieved turnaround and profitability improvements at Olin Corporation’s pool chemical business. Mr. Becker earned his degree in accounting from Iowa State University in 1976.
Devin K. Denner—Mr. Denner has served as the president of Chase Brass since 2007. Prior to this role, he was vice president and general manager of Chase Brass from 2006 to 2007 and before that held executive positions of increasing responsibility with Olin Corporation. He has led multiple business acquisition integration efforts during his career. He is well respected in the metals industry and currently serves as the vice chairman of the Copper and Brass Fabricators Council. Mr. Denner holds a degree in mechanical engineering from the Missouri University of Science and Technology and an MBA in finance from Saint Louis University.
John J. Wasz—Mr. Wasz has served as the Chief Operating Officer of Global Brass and Copper Holdings since January 2012 and as the president of Olin Brass since 2010. From 2008 to 2009, he was the special advisor to the chief executive officer of Aleris International, Inc. From 2004 to 2008, Mr. Wasz served as executive vice president and president of Aleris Rolled Products North America, an aluminum manufacturer. Prior to that time, from 1999 to 2001, he served as executive vice president and president of Aflex, a manufacturer of industrial flexible hose, and prior to that Mr. Wasz held the position of vice president of operations of Aflex. Additionally, Mr. Wasz has served in several other management capacities at other companies.
Scott B. Hamilton—Mr. Hamilton has served as General Counsel of Global Brass and Copper Holdings since May 2011. From 2007 to 2011, Mr. Hamilton served as the general counsel and chief restructuring officer of Basin Water, Inc., a designer and manufacturer of water treatment systems that filed for bankruptcy in July of 2009. From 1999 to 2007, Mr. Hamilton served as associate general counsel of Veolia Water North America, a leading wastewater services provider, and from 1998 to 1999 he served as vice president and general counsel of USFilter Operating Services, Inc., a wastewater services provider. Mr. Hamilton also served at the SEC from 1992 to 1998, where he held the position of branch chief. Mr. Hamilton holds a degree in history from Duke University and a degree in law from the University of Illinois College of Law.
Paul Schwind—Mr. Schwind currently serves as corporate controller and has been with Global Brass and Copper Holdings since he became director of financial planning and analysis in July 2010. From January 2009 to June 2010, Mr. Schwind served as senior manager of financial reporting and consolidations for PepsiAmericas, a global beverage distribution company. From 2006 to 2008, he served as manager of financial reporting at Kimball Hill Homes, a national homebuilding company, and from 2002 to 2006 he served as a senior accountant at Nuveen Investments, an investment management and advisement firm. Mr. Schwind also served as a senior audit associate at PricewaterhouseCoopers from 1999 to 2002. Mr. Schwind holds an accounting degree from Illinois State University and an MBA from the Northwestern University Kellogg School of Management.
Michael Psaros—Mr. Psaros currently serves as chairman of the Board of Directors and has held this position since 2007. He is a co-founder and managing partner of KPS. Mr. Psaros currently serves as chairman of the board of WWRD Holdings Limited, a provider of luxury home and lifestyle products, American & Efird, a major manufacturer and distributor of industrial sewing thread and textiles and Chassis Brakes International Group, a major manufacturer of automotive foundation brakes and brake components. He also serves as a director of Motor Coach Industries, Inc., a major coach bus manufacturer, International Equipment Solutions, LLC, a global engineered equipment company, United Copper Industries, Inc., a major manufacturer of building wire and cable, and Waupaca Foundry, Inc., a major producer of iron castings used in the automotive, agriculture and
139
Table of Contents
construction industries. He has also previously served on the boards of directors of many former KPS portfolio companies. Mr. Psaros earned his finance degree from Georgetown University and prior to founding KPS was an investment banker at Bear, Stearns and Co., Inc. Mr. Psaros brings extensive experience in leadership, finance and business turnaround to the Board of Directors. For these reasons, we believe he is well qualified to serve as chairman of the Board of Directors.
Raquel Palmer—Ms. Palmer has been a director of Global Brass and Copper Holdings since 2007. Ms. Palmer is a partner at KPS. She currently serves as chairman of the board of International Equipment Solutions, LLC. She also serves as a director of WWRD Holdings Limited, American & Efird, Chassis Brakes International Group, United Copper Industries, Inc., Waupaca Foundry, Inc. and Motor Coach Industries, Inc. She has also previously served on the boards of directors of many former KPS portfolio companies. Ms. Palmer holds a degree in political science from Stanford University. Prior to joining KPS in 1997, Ms. Palmer was an investment banker with Kidder, Peabody & Co. Ms. Palmer brings extensive experience in leadership, finance and business turnaround to the Board of Directors. For these reasons, we believe she is well qualified to serve on the Board of Directors.
David Shapiro—Mr. Shapiro has been a director of Global Brass and Copper Holdings since 2007. Mr. Shapiro is a co-founder and managing partner of KPS. He currently serves as chairman of the board of United Copper Industries, Inc. and Waupaca Foundry, Inc. He also serves as a director of WWRD Holdings Limited, American & Efird, Chassis Brakes International Group, International Equipment Solutions, LLC and Motor Coach Industries, Inc. He has also previously served on the boards of directors of many former KPS portfolio companies. Mr. Shapiro holds a degree in history from the University of Michigan and an MBA in finance from the University of Chicago Booth School of Business. Prior to founding KPS, Mr. Shapiro was an investment banker with Drexel Burnham Lambert and Dean Witter Reynolds. Mr. Shapiro brings extensive experience in leadership, finance and business turnaround to the Board of Directors. For these reasons, we believe he is well qualified to serve on the Board of Directors.
Jay Bernstein—Mr. Bernstein has been a director of Global Brass and Copper Holdings since 2007. Mr. Bernstein is a partner at KPS. He currently serves as chairman of the board of Motor Coach Industries, Inc. He also serves as a director of WWRD Holdings Limited, American & Efird, Chassis Brakes International Group, International Equipment Solutions, LLC, United Copper Industries, Inc. and Waupaca Foundry Inc. He has also previously served on the boards of directors of many former KPS portfolio companies. Mr. Bernstein holds a degree in economics from the University of Michigan and an MBA in finance from Columbia University. Prior to joining KPS in 1999, Mr. Bernstein was an investment banker with Schroders. Mr. Bernstein brings extensive experience in leadership, finance and business turnaround to the Board of Directors. For these reasons, we believe he is well qualified to serve on the Board of Directors.
George Thanopoulos—Mr. Thanopoulos has served as a director of Global Brass and Copper Holdings since July 2011. Concurrently, Mr. Thanopoulos has served as chief executive officer of HHI Group Holdings, a leading manufacturer of forged and forged/machined components in North America, since 2005 and also currently serves as a director of JL French, one of the leading global suppliers of die cast aluminum components and assemblies. Since 2012, Mr. Thanopoulos has served as a director of Chassis Brakes International, one of the world’s three largest manufacturers of automotive foundation brakes and foundation brake components. Prior to joining HHI Group Holdings, Mr. Thanopoulos was president of the engine group of Metaldyne, an automotive parts manufacturer, located in Plymouth, Michigan. He holds a degree in mechanical engineering from the University of Michigan. We believe Mr. Thanopoulos’s extensive experience in management and in the manufacturing industry makes him well qualified to serve on the Board of Directors.
Ronald C. Whitaker—Mr. Whitaker has served as a director of Global Brass and Copper Holdings since July 2011. Mr. Whitaker served as the president and chief executive officer of Hyco International Inc, a major manufacturer of hydraulic cylinders, from 2003 to 2011. From 1995 to 2003,
140
Table of Contents
he served as chief executive officer or chairman of the board of directors of various manufacturing companies, including Strategic Distributions, Inc., a distributor of items to industrial customers, Johnson Outdoors, a sporting goods manufacturer, and EWI (Studebaker) Inc., an automotive tier-1 stampings supplier. Mr. Whitaker currently serves on the boards of directors of Sturm Ruger & Co., a firearms manufacturer, Pangborn Corp., an industrial surfacing company, and The Savannah Music Festival. Mr. Whitaker graduated from the College of Wooster in 1969 with a degree in economics and from Dartmouth’s Tuck School of Business in 1971. We believe Mr. Whitaker’s extensive background in turnaround leadership, corporate strategy, operations and marketing make him well qualified to serve on the Board of Directors.
Martin E. Welch, III—Mr. Welch has served as a director of Global Brass and Copper Holdings since July 2011. Mr. Welch served as executive vice president and chief financial officer of Visteon Corporation, a global automotive parts supplier from 2011 to 2012. Mr. Welch served as executive vice president and chief financial officer of United Rentals, Inc., an industrial and construction equipment rental company, from 2005 to 2009, and concurrently from 2002 to 2008 he served as business advisor to the private equity firm York Management Services. Mr. Welch served on the board of directors and chaired the audit committee of Delphi Corporation from 2006 to 2009. Mr. Welch served as chief financial officer of Kmart Corporation, a major retailer that filed for bankruptcy in 2002, from 1995 to 2001. From 1991 until 1995, Mr. Welch served as chief financial officer for Federal-Mogul Corporation, an automotive parts supplier. Mr. Welch is a certified public accountant. Mr. Welch has acquired important business leadership, financial and accounting skills from his career in the retail, business services, and automotive industries, including through his tenure as chief financial officer of United Rentals, Inc., Kmart Corporation and Federal-Mogul Corporation. We believe these skills make him well suited to serve on the Board of Directors.
David Burritt—Mr. Burritt has served as a director of Global Brass and Copper Holdings since July 2011. Until June 2010, Mr. Burritt served as chief financial officer and vice president of global finance and strategic services for Caterpillar Inc., an industrial and construction machinery and engines manufacturer. Since 2008, Mr. Burritt has also served on the board of directors of Lockheed Martin Corporation, a global security company, and since 2009, he has chaired the audit committee. Mr. Burritt recently joined the board of directors of Aperam, S.A., a spinoff of the stainless steel division of AcelorMittal, where he also chairs the audit committee. Mr. Burritt earned a degree in accounting from Bradley University in 1977 and an MBA from the University of Illinois at Champaign-Urbana in 1990. Mr. Burritt is a certified public accountant and a certified management accountant. Mr. Burritt brings extensive accounting, financial and manufacturing industry experience to the Board of Directors. For this reason, we believe he is well qualified to serve on the Board of Directors.
Controlled Company
We intend to list the shares offered in this offering on the NYSE. Upon consummation of this offering, Halkos will own approximately 55.6% of the voting stock of Global Brass and Copper Holdings (48.9% if the underwriters exercise in full their option to purchase additional shares). If Halkos beneficially owns more than 50% of such voting stock after the completion of this offering, we will avail ourselves of the “controlled company” exemptions under the NYSE rules. If we are not able to use the controlled company exemptions, our Board of Directors will be required to have a majority of independent directors within one year after the date this offering closes. As of the date of the closing of this offering we expect the Board of Directors to have four independent members (Messrs. Burritt, Welch, Whitaker and Thanopoulos) out of nine total members.
Director Independence
The Board of Directors has determined that Messrs. Thanopoulos, Whitaker, Welch and Burritt are “independent directors” as such term is defined by the applicable rules and regulations of the NYSE.
141
Table of Contents
Board Structure
Composition
The Board of Directors currently consists of nine members. In accordance with our amended and restated certificate of incorporation and our amended and restated bylaws, the number of directors on the Board of Directors will be determined from time to time by the Board of Directors, and only a majority of the Board of Directors may fix the number of directors. Each director is to hold office until his or her successor is duly elected and qualified or until his or her earlier death, resignation or removal. At any meeting of the Board of Directors, except as otherwise required by law, a majority of the total number of directors then in office will constitute a quorum for all purposes.
Our amended and restated certificate of incorporation will provide that the Board of Directors will be divided into three classes of directors, with staggered three-year terms, with the classes to be as nearly equal in number as possible. The classified board provisions are subject to a “sunset” provision. Class I, Class II and Class III directors will serve initial terms expiring at our annual meeting of stockholders in 2014, 2015 and 2016, respectively. Each director elected at any annual meeting of stockholders after the completion of this offering will serve a term expiring at the next annual meeting of stockholders. Therefore, by the 2016 annual meeting of stockholders, the classified board provisions will no longer be in effect. The classification of directors has the effect of making it more difficult for stockholders to change the composition of the Board of Directors.
Committees of the Board
Upon consummation of this offering, the Board of Directors will have four standing committees. We will be required to have an audit committee consisting entirely of independent directors, subject to applicable phase-in periods.
Audit Committee
Upon completion of this offering, our audit committee will consist of Messrs. Burritt, Welch and Whitaker. The Board of Directors has determined that Messrs. Burritt, Welch and Whitaker all qualify as “audit committee financial experts” as such term is defined in Item 407(d)(5) of Regulation S-K and that each of Messrs. Burritt, Welch and Whitaker are “independent” for purposes of Rule 10A-3 of the Securities Exchange Act of 1934 and under the NYSE listing standards. The composition of the audit committee satisfies the independence requirements of the SEC and the NYSE.
The principal duties and responsibilities of our audit committee are to prepare the report required by the rules of the SEC to be included in our annual proxy statement or annual report and oversee and monitor the following:
| • | the integrity of our financial statements; |
| • | the independence, qualifications and performance of our independent registered public accounting firm; |
| • | compliance by our personnel with our code of ethics and related-party transactions policies; |
| • | the performance of our internal audit function; and |
| • | compliance by us with legal and regulatory requirements. |
Compensation Committee
Upon completion of this offering, our compensation committee will consist of Messrs. Burritt, Welch, Whitaker, Thanopoulos, Psaros and Shapiro. If Halkos beneficially owns more than 50% of Global Brass and Copper Holdings voting stock after the completion of this offering, we will avail
142
Table of Contents
ourselves of the “controlled company” exemptions under the NYSE rules, and in such a case, there would be no independence requirements for the compensation committee. If we are not able to use the controlled company exemptions, our compensation committee will be required to have one independent member as of the date this offering closes, a majority of independent directors within 90 days after the closing date and all independent directors within one year after the closing date. As of the date of the closing of this offering we expect the compensation committee to have four independent members (Messrs. Burritt, Welch, Whitaker and Thanopoulos) out of six total members.
The principal duties and responsibilities of the compensation committee are as follows:
| • | developing and monitoring our overall compensation policies, including, without limitation, determining the appropriate balance among base salary, annual bonus and long-term incentive awards, and establishing performance based incentives that support and reinforce our long-term strategic goals, organizational objectives and shareholder interests; |
| • | annually reviewing and approving corporate goals and objectives relevant to CEO compensation, evaluating the CEO’s performance and determining and approving the CEO’s compensation level; |
| • | reviewing and approving the annual base salaries and annual incentive opportunities of other members of our senior management; |
| • | reviewing and approving employment agreements, change-in-control agreements and all other incentive awards and opportunities, including both cash-based and equity-based awards and opportunities, retirement benefits, perquisites and other compensation and benefits for the members of our senior management both during and after employment; |
| • | monitoring and reviewing our incentive compensation plans and equity-based compensation plans and making recommendations to the Board of Directors with respect to those plans; |
| • | reviewing and approving our Compensation Discussion and Analysis and other reports and disclosures to be included in our various public filings; |
| • | reviewing our employee compensation programs as they relate to risk management and risk-taking incentives; |
| • | overseeing compliance with NYSE rules with respect to equity compensation plans; and |
| • | providing regular reports to the Board of Directors and any compensation committee reports required by the SEC to be included in our proxy statement and annual report. |
The compensation committee will have the sole authority to retain and terminate any compensation consultant to assist in the evaluation of employee compensation and to approve the consultant’s fees and the other terms and conditions of the consultant’s retention.
Nominating and Governance Committee
Upon completion of this offering, the nominating and governance committee will consist of Messrs. Welch, Burritt, Whitaker, Thanopoulos, Psaros and Shapiro. If Halkos beneficially owns more than 50% of Global Brass and Copper Holdings voting stock after the completion of this offering, we will avail ourselves of the “controlled company” exemptions under the NYSE rules, and in such a case, there would be no independence requirements for the nominating and governance committee. If we are not able to use the controlled company exemptions, our nominating and governance committee will be required to have one independent member as of the date this offering closes, a majority of independent directors within 90 days after the closing date and all independent directors within one year after the closing date. As of the date of the closing of this offering we expect the nominating and
143
Table of Contents
governance committee to have four independent members (Messrs. Welch, Burritt, Whitaker and Thanopoulos) out of six total members. The principal duties and responsibilities of the nominating and governance committee will be as follows:
| • | to establish criteria for board and committee membership and recommend to the Board of Directors proposed nominees for election to the Board of Directors and for membership on committees of the Board of Directors; |
| • | to make recommendations to the Board of Directors regarding board governance matters and practices; |
| • | to develop and recommend to the Board of Directors sound corporate governance practices and principles; |
| • | to oversee the implementation of processes and procedures for the annual review of corporate management, members of the Board of Directors and its committees; |
| • | to consider and report to the Board of Directors on all matters relating to the selection and qualification of the candidates nominated to the Board of Directors; |
| • | to assist the Board of Directors by identifying individuals believed qualified to become members of the Board of Directors, consistent with criteria approved by the Board of Directors, and to recommend to the Board of Directors the director nominees for the next annual meeting of stockholders; |
| • | to recommend to the Board of Directors director nominees for each committee; and |
| • | to perform such other functions as the Board of Directors may from time to time assign to the nominating and governance committee. In performing its duties, the nominating and governance committee shall seek to maintain an effective working relationship with the Board of Directors and our management. |
Executive Committee
Upon completion of this offering, our executive committee will consist of Messrs. Walker, Psaros, Shapiro, Bernstein and Ms. Palmer. The principal duties and responsibilities of the executive committee will be as follows:
| • | to exercise the powers and duties of the Board of Directors when the Board of Directors is not in session; |
| • | to make regular reports to the Board of Directors; |
| • | to review and exercise final approval authority over earnings press releases, financial information and earnings and earnings guidance provided to analysts, rating agencies and included in some of our SEC filings; and |
| • | to implement the policy decisions of the Board of Directors. |
Risk Oversight
The Board of Directors has an oversight role, as a whole and also at the committee level, in overseeing management of our risks. The Board of Directors regularly reviews information regarding our credit, liquidity and operations, as well as the risks associated with each. The compensation committee of the Board of Directors is responsible for overseeing the management of risks relating to our employee compensation plans and arrangements and the audit committee of the Board of Directors oversees the management of financial risks. While each committee is responsible for evaluating certain risks and overseeing the management of such risks, the entire Board of Directors is regularly informed through committee reports about such risks.
144
Table of Contents
Risk and Compensation Policies
Our management, at the direction of the Board of Directors, has reviewed our employee compensation policies, plans and practices to determine if they create incentives or encourage behavior that is reasonably likely to have a material adverse effect on us. In conducting this evaluation, management has reviewed our various compensation plans, including our incentive and bonus plans, equity award plans and severance compensation plans, to evaluate risks and the internal controls we have implemented to manage those risks. In completing this evaluation, the Board of Directors and management believe that there are no unmitigated risks created by our compensation policies, plans and practices that create incentives or encourage behavior that is reasonably likely to have a material adverse effect on us.
Compensation Committee Interlocks and Insider Participation
None of our executive officers will serve as a member of our compensation committee, and none of them have served, or will be permitted to serve, on the compensation committee (or any other committee serving a similar function) of any other entity.
Codes of Conduct
We maintain and enforce a Code of Ethics that applies to our President, Chief Executive Officer, Chief Financial Officer, senior financial officers and controllers at the corporate and segment levels (the “Senior Officers Code”). The Senior Officers Code was designed to be read and applied in conjunction with our Code of Business Conduct and Ethics applicable to all employees. Both the Senior Officers Code and the Code of Business Conduct are available at www.gbcholdings.com. Any future changes or amendments to the Senior Officers Code or the Code of Business Conduct, and any waiver of the Senior Officers Code or the Code of Business Conduct that applies to our Chief Executive Officer, Chief Financial Officer or Principal Accounting Officer will be posted to our website at the above location.
Related Person Transactions
We maintain and enforce a Related Person Transaction Policy, which sets forth our policy with respect to the review, approval, ratification and disclosure of all related person transactions by our audit committee. In accordance with our Related Person Transaction Policy, our audit committee has overall responsibility for the implementation and compliance with this policy.
For the purposes of our Related Person Transaction Policy, a “related person transaction” is a transaction, arrangement or relationship (or any series of similar transactions, arrangements or relationships) in which we were, are or will be a participant and in which any related person (as defined in our Related Person Transaction Policy) had, has or will have a direct or indirect material interest, in excess of $10,000. A “related person transaction” does not include any employment relationship or transaction involving an executive officer and any related compensation resulting solely from that employment relationship which has been reviewed and approved by the Board of Directors or compensation committee.
Our Related Person Transaction Policy requires that notice of a proposed related person transaction be provided to our legal department prior to entering into such transaction. If our legal department determines that such transaction is a related person transaction, the proposed transaction will be submitted to our audit committee for consideration at its next meeting. Under our Related Person Transaction Policy, our audit committee will only be permitted to approve those related person transactions that are in, or not inconsistent with, our best interests. In the event we become aware of a
145
Table of Contents
related person transaction that has not been previously reviewed, approved or ratified under our Related Person Transaction Policy and that is ongoing or is completed, the transaction will be submitted to the audit committee so that it may determine whether to ratify, rescind or terminate the related person transaction.
Our Related Person Transaction Policy also provides that the audit committee will review certain previously approved or ratified related person transactions that are ongoing to determine whether the related person transaction remains in our best interests and the best interests of our stockholders.
146
Table of Contents
COMPENSATION DISCUSSION AND ANALYSIS
Executive Compensation
The following Compensation Discussion and Analysis provides information regarding the objectives and elements of our compensation philosophy, policies and practices with respect to the compensation of our named executive officers. The following discussion and analysis of compensation arrangements of our named executive officers for 2012 should be read together with the compensation tables and related disclosures set forth below. This discussion is based on our current plans, considerations and expectations regarding our compensation programs. Compensation policies that we adopt in the future may differ materially from the policies summarized in this discussion.
Our named executive officers for the fiscal year ended December 31, 2012 were:
| • | John H. Walker, Chief Executive Officer |
| • | Robert T. Micchelli, Chief Financial Officer |
| • | John J. Wasz, Chief Operating Officer, President—Olin Brass |
| • | Daniel B. Becker, President—A.J. Oster |
| • | Devin K. Denner, President—Chase Brass |
Objectives of Our Executive Compensation Program
Our executive compensation philosophy is based on the principle of pay-for-performance. Accordingly, our executive compensation programs are designed to achieve the following objectives:
| • | Align the interests of our named executive officers with those of our stockholders. We link a meaningful portion of compensation to the achievement of our long-term goals by rewarding named executive officers as stockholder value increases. To that end, a significant portion of the compensation awarded to our named executive officers is in the form of profits interests in Halkos, our ultimate parent. |
| • | Retain management. Compensation is designed to retain our named executive officers by having significant long-term equity compensation. |
| • | Motivate through ownership. We believe that the best way to inspire leadership and performance is by distributing ownership in the form of equity-based compensation and requiring executive management to retain meaningful exposure to our stock through the grant of profits interests in Halkos. |
We anticipate increasing the flexibility and expanding the elements of our compensation structure in the future, while maintaining simplicity and a pay-for-performance culture. As we transition into a public company, we intend to evaluate our compensation programs and philosophy and will review executive compensation on an annual basis. We intend to adopt a new omnibus equity incentive plan in connection with this offering. See “—Global Brass and Copper Holdings, Inc. 2013 Omnibus Equity Incentive Plan”.
Setting Executive Compensation
Our current executive compensation program is largely based on arrangements that were negotiated at the time of our formation. KPS directly negotiated with Mr. Walker the terms of his compensation as well as the compensation arrangements for the other named executive officers.
147
Table of Contents
Role of Compensation Committee
Prior to this offering, we did not have a formal compensation committee, and Mr. Walker and his management team were responsible for compensation arrangements, subject to the approval of the Board of Directors. In connection with this offering, on September 23, 2011 we formed a compensation committee, which was not subject to the NYSE listing rules with respect to compensation committee independence. If Halkos beneficially owns more than 50% of Global Brass and Copper Holdings voting stock after the completion of this offering, we will avail ourselves of the “controlled company” exemptions under the NYSE rules, and in such a case, there would be no independence requirements for the compensation committee. Otherwise, we will comply with such NYSE independence rules, subject to the prescribed phase-in provisions. See “Management—Controlled Company” and “Management—Board Structure—Committees of the Board—Compensation Committee”. The Compensation Committee consists of David Burritt (Chairman), Michael Psaros, David Shapiro, George Thanopoulos, Martin Welch and Ron Whitaker.
Role of Compensation Consultant
In connection with this offering and our transition from a privately held company to a public company, we have engaged Towers Watson in order to benchmark compensation and make recommendations for future compensation (including cash, annual bonus and equity-based compensation) for our named executive officers. The Board of Directors intends to review and evaluate the results of Towers Watson’s work and will use its judgment to implement new compensation arrangements with the named executive officers, while considering best practices with respect to executive compensation arrangements. During 2012, Towers Watson reviewed the executive compensation programs that we had in place, including salary, bonus and long-term incentive awards (which consisted solely of profits interests shares granted to the named executive officers).
Towers Watson benchmarked the named executive officer compensation against a peer group of fifteen companies. Towers Watson benchmarked the components of base salary and target bonuses against the 25th percentile, median and 75th percentile of its peer group. The Board of Directors did not determine to target cash compensation at any specific percentage but has concluded that the cash compensation for the named executive officers is generally at (or slightly above or below) the median of the peer group. The peer group was updated in 2012 to include three companies (marked with an asterisk below) and to remove three companies from the peer group. The three companies that were added are in a similar industry and are also considered peers by some of our competitors. We removed three companies because two of the companies had revenues in excess of three times our revenues and one company had revenues less than 0.4% of our revenues. The companies in the peer group for 2012 were:
| • | Alliant Techsystems Inc. |
| • | Carpenter Technology Corporation |
| • | Century Aluminum Company |
| • | Gibraltar Industries, Inc. |
| • | Handy & Harman Ltd. (formerly known as WHX Corporation) |
| • | Kaiser Aluminum Corporation |
| • | Materion Corporation (formerly known as Brush Engineered Materials Inc.) |
| • | Mueller Industries, Inc. |
| • | OM Group, Inc. |
| • | Olin Corp. |
148
Table of Contents
| • | Schnitzer Steel Industries Inc.* |
| • | Titan International, Inc. |
| • | Titanium Metals Corporation |
| • | Valmont Industries, Inc.* |
| • | Worthington Industries, Inc.* |
Based on the recommendation of Towers Watson, in the first quarter of 2012, we increased the base salaries of our named executive officers by 4% except for Mr. Wasz, whose base salary was increased by $100,000 in connection with his promotion to Chief Operating Officer. Additionally, based on the recommendation of Towers Watson, the base salaries of each of our named executive officers increased by 3% effective April 1, 2013.
Principal Components of Compensation of Our Named Executive Officers
The compensation package offered to our named executive officers consists of:
Base salary. The base salary for each of our named executive officers is designed to compensate the named executive officer for his experience, education, personal qualities and other qualifications that are essential for the specific role the named executive officer serves for us while remaining competitive with the market.
Annual cash bonuses. Our named executive officers are eligible to receive annual cash bonuses based on an annual bonus plan established by the Board of Directors. Each of our named executive officers has a target bonus based on a percentage of his base salary. In addition, a discretionary bonus of up to $1.0 million in the aggregate may be paid out based on Mr. Walker’s subjective assessment of performance of our executive officers, subject to the approval of the Compensation Committee and the Board of Directors. The cash bonuses are considered at-risk compensation as such payments are not guaranteed.
Long-term equity-based compensation. In general, we provide a significant portion of the compensation due to our named executive officers in the form of long-term equity-based compensation. We believe that providing compensation that is contingent on our long-term performance and that is at-risk serves to align the long-term interests of our named executive officers with the long-term interests of our stockholders. To date, long-term equity-based compensation has been granted to our named executive officers solely in the form of Class B Shares in Halkos. See “—Equity-Based Compensation”.
Limited perquisites and other benefits. Our named executive officers are eligible to participate in our 401(k) retirement plan and life insurance coverage and are eligible for reimbursement of financial and estate planning services of up to $15,000. In addition, Mr. Becker is entitled to use of a company car.
Compensation Mix
Our current compensation package is designed to provide a strong link between the compensation of our executive officers, our success and our stockholders generally. The cash components—base salary and cash bonus compensation—collectively represent what we believe is appropriate pay for expected performance during the year. The equity-based compensation component is designed to encourage high performance by closely aligning an executive officer’s pay with the interests of our stockholders. The allocation between different elements of compensation with respect to our named executive officers has been a product of individual negotiations to date.
149
Table of Contents
Employment Agreement and Severance Protection
We have entered into an employment agreement with Mr. Walker, as well as severance protection agreements with each of our other named executive officers. Previously, Messrs. Becker and Denner were not parties to employment agreements, offer letters or severance protection agreements because they were employed by us prior to our acquisition of the worldwide metals business of Olin Corporation in 2007.
Mr. Micchelli’s prior severance protection agreement was amended and restated, effective October 20, 2011, to incorporate a revised definition of “cause”. In anticipation of this offering, Messrs. Wasz, Becker and Denner entered into new severance protection agreements with us on August 31, 2011, July 28, 2011, and July 29, 2011, respectively, which are substantially similar to Mr. Micchelli’s severance protection agreement, except with respect to the definition of “good reason”. Mr. Wasz’s new severance protection agreement supersedes his prior severance protection agreement.
Under Mr. Micchelli’s amended and restated severance protection agreement, and under each of Messrs. Wasz’s, Becker’s and Denner’s new severance protection agreements, “cause” generally means:
| • | the failure or refusal to perform the duties of his position after written notice from the Chief Executive Officer; |
| • | willful misconduct or gross negligence in the performance of his duties that has an adverse effect on our operations after receipt of at least one warning from us (or, if applicable, the president’s segment); |
| • | intentional breach by the executive of a written covenant with us or, if applicable, the president’s segment, of a written policy, in each case relating to the use and preservation of intellectual property and/or confidentiality; |
| • | being impaired by or under the influence of alcohol, illegal drugs or controlled substances while working or while on our property; |
| • | conviction of or plea of nolo contendere to a felony; or |
| • | dishonest, disloyal or illegal conduct or gross misconduct that materially and adversely affects his performance or our reputation or business (or, if applicable, that of the president’s segment) (it being agreed that a petty offense or a violation of the motor vehicle code shall not constitute “cause”). |
Prior to the determination that “cause” has occurred with respect to any of the grounds listed above other than a conviction of or plea of nolo contendere to a felony, the executive will have a 30-day cure period to remedy such breach, unless, in the Board of Directors’ discretion, the “cause” event is incapable of reasonably prompt cure or if the Board of Directors determines that its fiduciary duty requires such termination.
“Good reason” under Mr. Micchelli’s amended and restated severance protection agreement generally means any of the following events occurring without Mr. Micchelli’s consent:
| • | any change in title or reporting relationship that does not reasonably constitute a promotion; |
| • | assignment of duties materially and adversely inconsistent with his position which results in a material diminution of position, authorities, duties or responsibilities; |
| • | any material diminution in base salary, bonus opportunities or benefits; |
| • | any requirement to relocate from Mr. Micchelli’s principal residence; or |
150
Table of Contents
| • | if John Walker is no longer the Chief Executive Officer. |
“Good reason” under our segment presidents’ new severance protection agreements generally means any of the following events occurring without such executive’s consent:
| • | assignment of duties materially and adversely inconsistent with his position which results in a material diminution of position, authorities, duties or responsibilities; |
| • | any material diminution in base salary, bonus opportunities or benefits; or |
| • | for Mr. Wasz, a requirement that he relocate, which increases his one-way commute by more than 50 miles from his current location. |
Under Mr. Micchelli’s amended and restated severance protection agreement, and under each of Messrs. Wasz’s Becker’s, and Denner’s severance protection agreements, the executive must provide written notice of events claimed to constitute “good reason” within 60 days of the initial occurrence of such events and provide us (or, if applicable, the president’s segment) with an opportunity to cure the applicable circumstance within 30 days following such written notice. If we (or, if applicable, the president’s segment) fail to cure such circumstance, the executive’s resignation for “good reason” must be tendered within 30 days of our (or, if applicable, the president’s segments) failure to cure.
For additional information regarding Mr. Walker’s employment agreement and the severance protection agreements of Messrs. Micchelli, Wasz, Becker and Denner, see “—Employment Arrangements with Named Executive Officers” and “—Potential Payments Upon Termination or Change in Control”.
Base Salary
We provide our named executive officers with base salary to compensate them for services rendered during the year. We believe that, with respect to our named executive officers, base salary should compensate the executives for their service and performance but that superior contributions and performance should be rewarded by other forms of compensation, including long-term equity-based compensation. The minimum base salary for each of Messrs. Walker and Wasz was set in his respective employment agreement or offer letter. On April 1, 2012 we increased the base salary of our named executive officers by 4% except for Mr. Wasz whose base salary was increased to $500,000 on January 9, 2012 in connection with his promotion to Chief Operating Officer. Based on a recommendation by Towers Watson, effective April 1, 2013, the base salaries of our named executive officers increased by 3%. The increased base salaries are set forth in the table below:
Base Salaries
| Name |
Base Salary January 1, 2012 ($) |
Base Salary April 1, 2012 ($) |
Base Salary April 1, 2013 ($) |
|||||||||
| John H. Walker |
770,000 | 800,800 | 824,824 | |||||||||
| Robert T. Micchelli |
375,000 | 390,000 | 401,700 | |||||||||
| John J. Wasz |
400,000 | 500,000 | 515,000 | |||||||||
| Daniel B. Becker |
300,000 | 312,000 | 321,360 | |||||||||
| Devin K. Denner |
300,000 | 312,000 | 321,360 | |||||||||
151
Table of Contents
Annual Cash Bonuses
During 2012, the Board of Directors approved an annual bonus plan with performance targets based on Company performance and individual performance. The Compensation Committee set a target annual incentive for each named executive officer based on the scope of each executive’s duties and respective individual capacity to affect our overall performance as follows: 100% of base salary for Mr. Walker, 70% of base salary for Mr. Micchelli, 75% of base salary for Mr. Wasz and 50% of base salary for Messrs. Becker and Denner with potential maximum bonuses of two times each executive’s respective target bonus amount. The potential target and maximum bonus amounts were consistent with our annual bonus plan for prior years.
For 2012, 70% of each named executive officer’s annual bonus was based on the achievement of budgeted EBITDA (the “EBITDA Bonus”) and 30% was based on the achievement of specific individual performance measures (the “Individual Bonus”). To be eligible for any portion of the EBITDA Bonus, the Company was required to achieve a minimum of 80% of its budgeted EBITDA (80% of budgeted EBITDA achievement would earn the executive the threshold amount of the EBITDA Bonus). Set forth below is a chart showing the sliding scale on which the named executive officer’s incentive compensation was based in terms of percentage of the budgeted EBITDA component achieved and the payout as a percentage of his base salary. Linear interpolation of the EBITDA Bonus payout occurs between 80% and 100% achievement and again, but in different gradations, between 100% and 110%, with a maximum payout of 200% of the component based on the level of achievement of budgeted EBITDA.
| Level of Achievement of EBITDA Target |
% of EBITDA Bonus |
|||
| Less than 80% |
0 | % | ||
| 80% |
50 | % | ||
| 90% |
75 | % | ||
| 100% |
100 | % | ||
| 105% |
150 | % | ||
| 110% (maximum) |
200 | % | ||
For 2012, we budgeted EBITDA of $119 million. We actually achieved EBITDA of $115 million. Based on the results, each named executive officer received 90.8% of the EBITDA Bonus. The chart below sets forth the EBITDA Bonus that each named executive officer received.
| Name |
Target Payout as a % of Salary |
Actual Award ($) |
||||||
| John H. Walker |
70 | % | 508,988 | |||||
| Robert T. Micchelli |
49 | % | 173,519 | |||||
| John J. Wasz |
53 | % | 238,350 | |||||
| Daniel B. Becker |
35 | % | 99,154 | |||||
| Devin K. Denner |
35 | % | 99,154 | |||||
The Individual Bonus was assessed using three performance goals. The first individual performance goal was based on the executive’s involvement and success in preparing this S-1 registration statement in connection with this offering. The second individual performance goal was based on improvement in financial controls and processes, specifically in the areas of effective inventory control, payroll procedures, IT policies and procedures and closing processes. The third, and final, individual performance goal was based on progress in developing our five-year growth strategy.
152
Table of Contents
The named executive officers contributed to the successful preparation of this S-1 registration statement, including several filings during 2012. The named executive officers were instrumental in improving the financial controls and processes in connection with our preparation for becoming a public company. Finally, the named executive officers devoted time and effort in analyzing our existing markets in order to inform and guide the development of our current business model and to develop the Company’s five-year growth strategy. For each of the three individual performance goals, Messrs. Walker, Micchelli and Wasz had responsibility for us as a whole (which required significantly more work) and Messrs. Becker and Denner had responsibility for their business units.
With respect to the individual performance measures, the Board of Directors determined that each of the named executive officers met or exceeded all of the individual goals, resulting in a payout of 200% of the Individual Bonus for Messrs. Walker, Micchelli and Wasz due to exceptional performance in meeting their respective non-financial goals which, as noted above, required significantly more work, and 100% for Messrs. Denner and Becker. The payout based on the individual performance metrics is shown in the chart below.
| Name |
Target Payout as a % of Salary |
Actual Award ($) |
||||||
| John H. Walker |
30 | % | 480,480 | |||||
| Robert T. Micchelli |
21 | % | 163,800 | |||||
| John J. Wasz |
23 | % | 225,000 | |||||
| Daniel B. Becker |
15 | % | 46,800 | |||||
| Devin K. Denner |
15 | % | 46,800 | |||||
In addition, the Board of Directors decided to pay Messrs. Walker, Micchelli and Wasz an additional discretionary bonus of $360,000, $180,000 and $30,000, respectively. The Board determined to pay the additional bonuses in light of the exceptional performance of the executives with respect to our safety initiatives, completion of the June 1, 2012 Senior Secured Notes offering, cash flow management, development of sales processes and organizational initiatives.
Set forth below is a chart showing the total bonus payments (and as a percentage of base salary) made to each named executive officer for 2012, which includes the EBITDA Bonus, Individual Bonus and in the case of Messrs. Walker, Micchelli and Wasz an additional discretionary bonus.
| Name |
Actual Award ($) |
% of Base Salary | ||||||
| John H. Walker |
1,349,468 | 169 | % | |||||
| Robert T. Micchelli |
517,319 | 133 | % | |||||
| John J. Wasz |
493,530 | 99 | % | |||||
| Daniel B. Becker |
145,954 | 47 | % | |||||
| Devin K. Denner |
145,954 | 47 | % | |||||
For 2013, the Board of Directors has approved an annual bonus plan, which is substantially similar to the 2012 annual bonus plan for our named executive officers, provided that the Individual Bonus components are based on preparing this Registration Statement on Form S-1 in connection with this offering, filing a Registration Statement on Form S-4 to register the exchange offer required for the Senior Secured Notes and becoming compliant with Section 404 of the Sarbanes-Oxley Act. For Mr. Becker and Mr. Denner, their 2013 annual bonus plan may provide that the EBITDA Bonus component will comprise 75% of their annual bonus and may be partially based on our EBITDA and EBITDA of the respective business units. In addition, the Chief Executive Officer may allocate discretionary bonuses of up to an aggregate of $1.0 million to our named executive officers and other officers who are subject to Section 16 under the Exchange Act, subject to the approval of the Compensation Committee.
153
Table of Contents
Equity-Based Compensation
Profits Interest Shares
Pursuant to the limited liability company agreement of Halkos and related award agreements, our named executive officers each received equity-based compensation in the form of Profits Interest Shares in Halkos. The Profits Interest Shares are membership interests in Halkos and represent the right of the holder to share in distributions from Halkos after KPS has received certain returns on its investment. At the time of our inception, Profits Interest Shares representing the right to receive an amount equal to 12% of our increase in value after returns to KPS and its affiliates had been made were allocated to a pool for grants to the named executive officers and other key employees. Of the total membership interests, 11.8% have been allocated to management, out of the amount reserved. The Profits Interest Shares were structured such that if the value of Halkos did not increase, then the Profits Interest Shares would have no value.
Each of Messrs. Walker, Micchelli, Becker and Denner were granted Class B Profits Interest Shares on December 31, 2008. The awards were intended to vest over three years following our acquisition of the worldwide metals business of Olin Corporation, and thus have a vesting start date of October 15, 2007. One-third of the Class B Profits Interest Shares were vested on the grant date, one-third vested in October 2009 and the remaining third vested on October 15, 2010. Mr. Wasz was granted Class B Profits Interest Shares on April 7, 2010, and one-third of his Profits Interest Shares vested on January 18, 2011 (the first anniversary of his employment with us), and, in anticipation of this offering, the remaining two-thirds were subject to accelerated vesting on January 4, 2012. Halkos has the right, but not the obligation, to repurchase the Class B Profits Interest Shares upon termination of employment, at a formula price. The Profits Interest Shares were granted in lieu of any other equity or equity based compensation. The awards were granted in order to foster a long term commitment to our named executive officers and to align a large portion of our executives’ compensation with the interests of Halkos.
The table below sets forth the number of Class B Profits Interest Shares owned by our named executive officers:
Class B Profits Interest Shares
| Name |
Class B Shares ($) |
|||
| John H. Walker |
13,500 | (1) | ||
| Robert T. Micchelli |
2,920 | |||
| John J. Wasz |
3,000 | |||
| Daniel B. Becker |
1,000 | |||
| Devin K. Denner |
1,500 | |||
| (1) | This represents 10,000 Class B Profits Interest Shares which were granted to Mr. Walker in 2008. Also represents 2,000 Class C Profits Interest Shares and 2,000 Class D Profits Interest Shares that were granted in 2008 but were, collectively, converted into 3,500 Class B Profits Interest Shares on June 30, 2011. |
On May 19, 2011, the Board of Directors awarded the 420 Class B Profits Interest Shares that were unallocated to Mr. Micchelli. Those shares were 100% vested on May 19, 2011.
On August 18, 2010 and on June 1, 2012, Halkos distributed cash to its members, including with respect to the Class B Profits Interest Shares, in the amounts set forth in the table below, to our named executive officers. Mr. Wasz did not receive a distribution of cash in 2010 because he was not vested in his Class B Profits Interest Shares. On January 18, 2011 and January 17, 2012, Mr. Wasz received distributions of $169,588 and $344,315 respectively with respect to his vested Class B Profits Interest
154
Table of Contents
Shares, which was determined by deducting monetized tax advances of $45,080 and $91,527 from gross distribution amounts of $214,668 and $435,842 respectively. Distributions were made on vested Profits Interest Shares, similar to the way that dividends and distributions would be made with respect to shares of stock that were owned outright. No distribution would be made with respect to the Profits Interest Shares if Halkos did not appreciate in value.
Distributions in Respect of Class B Profits Interest Shares
| Name |
Distribution in Respect of Class B Profits Interest Shares on August 18, 2010 ($) |
Distributions in Respect of Class B Profits Interest Shares on June 1, 2012 ($) |
||||||
| John H. Walker |
2,213,903 | 11,496,600 | ||||||
| Robert T. Micchelli |
587,627 | 2,341,856 | ||||||
| John J. Wasz |
— | 2,406,015 | ||||||
| Daniel B. Becker |
216,837 | 802,005 | ||||||
| Devin K. Denner |
325,255 | 1,203,008 | ||||||
These distributions were paid in cash by Halkos but were recorded as a non-cash compensation expense by us. The Class B Profits Interest Shares held by our named executive officers are reflected in such executive’s holdings set forth under the caption “Principal and Selling Stockholder”, and are not reflected in the tabular disclosure of compensation following this Compensation Discussion and Analysis. However, in the Summary Compensation Table, we have included the amount of distributions that the executives received with respect to their ownership of Profits Interest Shares. These distributions reflect payments with respect to Profits Interest Shares which are owned by our named executive officers. However, if instead of Profits Interest Shares, stock of a corporation (which had fully vested in a prior year) received distributions with respect to such vested stock, such distributions would not appear in the Summary Compensation Table. Accordingly, we have also presented an alternative summary compensation table which excludes such distributions. See “Alternative Summary Compensation Table for 2012”.
Mr. Walker was also granted 2,000 performance-based Class C Profits Interest Shares and 2,000 Class D Profits Interest Shares on December 31, 2008. On June 30, 2011, the Halkos limited liability company agreement was amended, and the Class C Profits Interest Shares and Class D Profits Interest Shares were converted into Class B Profits Interest Shares. As a result, no Class C Profits Interest Shares or Class D Profits Interest Shares are outstanding. Pursuant to such amendment, the 2,000 Class C Profits Interest Shares and 2,000 Class D Profits Interest Shares held by Mr. Walker were converted into 2,000 and 1,500 Class B Profits Interest Shares, respectively. As of December 31, 2011, there were no Class C or D Profits Interest Shares outstanding.
Stock Options and Other Equity and Equity-Based Awards
We have not granted any stock options or other equity or equity-based awards to date.
In connection with this offering, we plan to adopt an omnibus equity plan which will provide for the grant of options, restricted stock, restricted stock units, performance shares and other equity-based awards. For more information about the omnibus equity plan, see “—Global Brass and Copper Holdings, Inc. 2013 Omnibus Equity Incentive Plan”.
155
Table of Contents
Stock Ownership Guidelines
We do not currently have established stock ownership guidelines for our members of management. Recognizing the potential benefits of such guidelines, we are considering formally implementing a required policy and are in the process of seeking input from management and compensation consultants regarding best practices. We believe that requiring members of our management to maintain ownership in our company serves to align their interests with the interests of our stockholders generally.
Tax and Accounting Considerations
Deductibility of Executive Compensation
Section 162(m) of the U.S. Internal Revenue Code of 1986, as amended, which we refer to as the “Code,” limits the amount that we may deduct from our Federal income taxes for remuneration paid to our named executive officers (other than the chief financial officer) to one million dollars per named executive officer per year, unless certain requirements are met. Section 162(m) provides an exception from this deduction limitation for certain forms of “performance-based compensation”, as well as for the gain recognized by named executive officers upon the exercise of qualifying compensatory stock options. In addition, transition provisions under Section 162(m) may apply for a period of three years following the consummation of this offering to certain compensation arrangements that were entered into by us before we were publicly held. After this offering, our compensation committee will generally seek to structure performance-based, equity and equity-based compensation for the named executive officers in a manner that complies with Section 162(m) in order to provide for the deductibility of such compensation. At the same time, there may be circumstances in which the compensation committee determines, in its judgment, that it is in our best interests to provide for compensation that may not be deductible.
Taxation of “Parachute” Payments and Deferred Compensation
We did not provide any named executive officer with a “gross-up” or other reimbursement payment for any tax liability that he might owe as a result of the application of Sections 280G, 4999, or 409A of the Code during 2010, 2011 or 2012, and we have not agreed and are not otherwise obligated to provide any named executive officers with such a gross-up or other reimbursement. Sections 280G and 4999 of the Code provide that executive officers, certain highly compensated employees, directors who hold significant equity interests and certain other service providers may be subject to an excise tax if they receive payments or benefits in connection with a change in control that exceeds certain prescribed limits, and that we, or a successor, may forfeit a deduction on the amounts subject to this additional tax. Section 409A of the Code also imposes additional significant taxes on the individual in the event that an executive officer, director or other service provider receives “deferred compensation” that does not meet the requirements of Section 409A of the Code.
156
Table of Contents
Summary Compensation Table
The following summary compensation table sets forth the total compensation paid or accrued for the years ended December 31, 2012, 2011 and 2010 to our named executive officers.
| Name and Principal |
Year | Salary ($) | Bonus ($)(1) | Stock Awards |
Non-Equity Incentive Plan Compensation ($) |
All Other Compensation ($)(5)(6)(8) |
Total ($) | |||||||||||||||||||||
| John H. Walker |
2012 | 793,100 | 360,000 | — | 989,468 | (2) | 11,541,963 | 13,684,531 | ||||||||||||||||||||
| Chief Executive |
2011 | 770,000 | 1,540,000 | — | — | 42,925 | 2,352,925 | |||||||||||||||||||||
| 2010 | 770,000 | — | — | 1,540,000 | 2,256,828 | 4,566,828 | ||||||||||||||||||||||
| Robert T. Micchelli, |
2012 | 386,250 | 180,000 | — | 337,319 | (2) | 2,384,990 | 3,288,559 | ||||||||||||||||||||
| Chief Financial |
2011 | 375,000 | 650,000 | — | — | 35,485 | 1,060,485 | |||||||||||||||||||||
| 2010 | 337,500 | — | — | 525,000 | 622,887 | 1,485,387 | ||||||||||||||||||||||
| John J. Wasz, |
2012 | 496,795 | 30,000 | — | 463,350 | (2) | 2,887,277 | 3,877,422 | ||||||||||||||||||||
| President-Olin Brass, |
2011 | 400,000 | 400,000 | — | — | 251,038 | 1,051,038 | |||||||||||||||||||||
| Chief Operating |
2010 | 383,333 | — | — | 350,000 | 34,870 | 768,203 | |||||||||||||||||||||
| Daniel B. Becker, |
2012 | 309,000 | — | — | 145,954 | (2) | 837,907 | 1,292,861 | ||||||||||||||||||||
| President-A.J. |
2011 | 300,000 | 150,000 | — | — | 37,318 | 487,318 | |||||||||||||||||||||
| 2010 | 289,320 | — | — | 300,000 | (3) | 254,770 | 844,090 | |||||||||||||||||||||
| Devin K. Denner, |
2012 | 309,000 | — | — | 145,954 | (2) | 1,240,858 | 1,695,812 | ||||||||||||||||||||
| President-Chase |
2011 | 300,000 | 300,000 | — | 600,000 | (4) | $ | 32,325 | 1,232,325 | |||||||||||||||||||
| 2010 | 287,500 | — | — | 300,000 | 356,995 | 944,495 | ||||||||||||||||||||||
| (1) | Messrs. Walker, Micchelli and Wasz earned a discretionary bonus for 2012 of $360,000, $180,000 and $30,000 respectively. The table below sets forth the amount of discretionary annual bonus earned that was earned for 2011 based on corporate performance and the amount that was earned based on individual objectives. The Board of Directors authorized an additional $125,000 which was paid to Mr. Micchelli in connection with his additional work in connection with certain registration statements. The 2011 bonuses were paid on April 6, 2012. |
| Executive |
Corporate Objective ($) |
Individual Objective ($) |
Total ($) | |||||||||
| John H. Walker |
1,128,095 | 411,905 | 1,540,000 | |||||||||
| Robert T. Micchelli |
384,578 | 140,422 | 525,000 | |||||||||
| John J. Wasz |
320,875 | 79,125 | 400,000 | |||||||||
| Daniel B. Becker |
— | 150,000 | 150,000 | |||||||||
| Devin K. Denner |
300,000 | — | 300,000 | |||||||||
| (2) | The table below sets forth the amount of non-discretionary annual bonus earned that was earned for 2012 based on achievement of EBITDA objectives and the amount that was earned based on individual objectives. The 2012 bonuses were paid on April 12, 2013. |
| Executive |
Achievement of EBITDA ($) |
Individual Objectives ($) |
Total ($) | |||||||||
| John H. Walker |
508,988 | 480,480 | 989,468 | |||||||||
| Robert T. Micchelli |
173,519 | 163,800 | 337,319 | |||||||||
| John J. Wasz |
238,350 | 225,000 | 463,350 | |||||||||
| Daniel B. Becker |
99,154 | 46,800 | 145,954 | |||||||||
| Devin K. Denner |
99,154 | 46,800 | 145,954 | |||||||||
| (3) | Mr. Becker declined to accept $20,000 out of the $300,000 bonus in order to fund a $20,000 bonus for certain sales employees of A.J. Oster. |
| (4) | Mr. Denner received a payout of $600,000 with respect to the termination of his bonus bank. |
157
Table of Contents
| (5) | Amounts in the “All Other Compensation” column for 2012 consist of: |
| Name |
Employer Matching Contribution ($)(a) |
Non-Elective Company Contribution ($)(b) |
Life Insurance Premiums ($)(c) |
Financial and Estate Planning Reimbursements ($)(d) |
Car ($) |
Profits Interest Distribution ($) |
Total ($) |
|||||||||||||||||||||
| John H. Walker |
7,500 | 18,750 | 17,200 | 1,913 | — | 11,496,600 | 11,541,963 | |||||||||||||||||||||
| Robert T. Micchelli |
7,500 | 18,750 | 9,760 | 7,124 | — | 2,341,856 | 2,384,990 | |||||||||||||||||||||
| John J. Wasz |
7,500 | 18,750 | 10,645 | 8,525 | — | 2,841,857 | 2,887,277 | |||||||||||||||||||||
| Daniel B. Becker |
7,500 | 18,750 | 6,850 | — | 2,802 | (e) | 802,005 | 837,907 | ||||||||||||||||||||
| Devin K. Denner |
7,500 | 18,750 | 6,600 | 5,000 | — | 1,203,008 | 1,240,858 | |||||||||||||||||||||
| (a) | Represents a matching contribution of 50% of the first 6% of eligible compensation the named executive officer defers into our 401(k) Plan (the “Retirement Savings Plan”). |
| (b) | Represents a Company-provided non-elective contribution of 7.5% of eligible compensation into the Retirement Savings Plan. |
| (c) | Represents the annual life insurance premium paid for the fiscal year. We provide life insurance coverage equal to two times base salary for each named executive officer. |
| (d) | Represents the reimbursements of financial and estate planning services up to a maximum of $15,000. |
| (e) | Represents the cost of maintenance, insurance and fuel for Mr. Becker’s personal use of a Company car, calculated by multiplying a per mile rate by the number of miles related to Mr. Becker’s personal use, and subtracting reimbursements that Mr. Becker paid to the Company. Mr. Becker is the only executive provided with a Company car. |
| (f) | This amount includes a monetized tax advance of $91,527. |
| (6) | Includes distributions to the named executive officers’ profits interest shares as paid by Halkos on June 1, 2012 and with respect to Mr. Wasz also on January 17, 2012, in respect of their Class B Profits Interest Shares which are described above under “Compensation Discussion and Analysis—Equity—Based Compensation—Profits Interest Shares”. |
| (7) | Mr. Wasz was promoted to Chief Operating Officer on January 9, 2012. |
| (8) | Set forth below is an alternative Summary Compensation Table for our named executive officers for 2012. The difference between this alternative table and the summary Compensation Table which appears above is that this alternative table does not include the value of distributions which were made on vested “profits interests” in 2012. Profits Interest Shares were awarded to the named executive officers in prior years and are fully vested. Distributions were made in 2012 to all holders of Halkos, including to our named executive officers with respect to their vested Profits Interest Shares. The Profits Interest Shares only shared in the distribution because the value of Halkos increased and had the value of Halkos not appreciated, then no distributions would have been made to our named executive officers. We consider these distributions to be similar to dividends paid on shares of stock owned by named executive officers, not compensation. See “Distributions in Respect of Class B Profits Interest Shares” for additional information on the Profits Interest Shares and related distributions. |
Alternative Summary Compensation Table for 2012
| Name |
Salary | Bonus ($) |
Non Equity Incentive Compensation ($) |
All Other Compensation ($) |
Total ($) |
|||||||||||||||
| John H. Walker |
793,100 | 360,000 | 989,468 | 45,363 | 2,187,931 | |||||||||||||||
| Robert T. Micchelli |
386,250 | 180,000 | 337,319 | 43,134 | 946,703 | |||||||||||||||
| John J. Wasz |
496,794 | 30,000 | 463,350 | 45,420 | 1,035,564 | |||||||||||||||
| Daniel B. Becker |
309,000 | — | 145,954 | 35,902 | 490,856 | |||||||||||||||
| Devin K. Denner |
309,000 | — | 145,954 | 37,850 | 492,804 | |||||||||||||||
158
Table of Contents
2012 Grants of Plan-Based Awards
The following Grants of Plan-Based Awards table provides information concerning awards granted in Fiscal 2012 to our named executive officers.
| Estimated Possible Payouts Under Non- Equity Incentive Plan Awards (1) |
||||||||||||
| Name |
Grant Date |
Target ($) |
Maximum ($) |
|||||||||
| John H. Walker |
1/1/2012 | 800,800 | 1,601,600 | |||||||||
| Robert T. Micchelli |
1/1/2012 | 273,000 | 546,000 | |||||||||
| John J. Wasz |
1/1/2012 | 375,000 | 750,000 | |||||||||
| Daniel B. Becker |
1/1/2012 | 156,000 | 312,000 | |||||||||
| Devin K. Denner |
1/1/2012 | 156,000 | 312,000 | |||||||||
| (1) | Represents possible cash awards for 2012 under the annual bonus plan. Cash awards paid to named executive officers under the bonus plan are dependent on the achievement of certain Company performance targets (referred to as the EBITDA Bonus) and individual targets ( referred to as the Individual Bonus), as well as the level of achievement. The annual bonus plan does not have threshold awards because the Individual Bonus (weighted at 30% of the bonus) may be paid out anywhere from 0% to 200% of the total potential amount, while the EBITDA Bonus will only be paid out once 80% of budgeted EBITDA is achieved, starting at 50% of the potential amount and weighted at 70% of the total bonus. For additional information, see “Compensation Discussion and Analysis—Annual Cash Bonuses” section of this registration statement. The amounts listed under the “Target” column represent the cash awards payable for 2012 assuming 100% achievement of all goals. The amounts listed under the “Maximum” column represent the maximum cash awards payable, which for each named executive officer equal two times target bonus. This table does not include the discretionary bonuses of $360,000, $180,000 and $30,000, which were paid to Messrs. Walker, Micchelli and Wasz. Actual cash awards paid to the named executive officers for 2012 are reported in the Summary Compensation Table under the “Non-Equity Incentive Plan Compensation” column. |
Employment Arrangements with Named Executive Officers
On October 15, 2007, we entered into an employment agreement with Mr. Walker, our chief executive officer. The employment agreement was for an initial term of three years, and on each anniversary of October 15, 2007, the term extends for an additional year, unless prior written notice is given. The employment agreement provides that Mr. Walker will receive a base salary of $770,000 and a target bonus equal to 100% of his base salary during the term. In addition, the employment agreement provides that Mr. Walker is entitled to an equity-based award of up to 7% of our total equity value. The grant to Mr. Walker of 10,000 Class B Profits Interest Shares, 2,000 Class C Profits Interest Shares and 2,000 Class D Profits Interest shares are in full satisfaction of such 7% equity award. As described above, on June 30, 2011, the 2,000 Class C Profits Interest Shares and 2,000 Class D Profits Interest Shares were converted into 2,000 Class B Profits Interest Shares and 1,500 Class B Profits Interest Shares, respectively.
Mr. Micchelli, our chief financial officer, is party to a severance protection agreement, dated as of March 24, 2009, which was amended and restated effective October 20, 2011. As of July 28, 2011, July 29, 2011 and August 31, 2011, respectively, Messrs. Wasz, Becker and Denner our segment presidents, also entered into severance protection agreements, which are substantially similar to Mr. Micchelli’s amended and restated severance protection agreement. Mr. Wasz’s new severance protection agreement supersedes his prior severance protection agreement, which was dated as of January 16, 2010.
In addition, Mr. Wasz’s offer letter, dated as of January 6, 2010, provides that Mr. Wasz will serve as the president of Olin Brass, and will receive a starting base salary of $400,000 per year, a target bonus of 50% of base salary with a maximum bonus of 100% of base salary, and entitlement to participation in our
159
Table of Contents
standard health and welfare benefits plans. In addition, pursuant to the terms of his offer letter, Mr. Wasz was granted Class B Profits Interest Shares, subject to vesting over a three-year period.
For a description of severance payments and benefits made available under Mr. Walker’s employment agreement and our other named executive officers severance protection agreements in effect as of December 31, 2012, see “—Potential Payments upon Termination or Change in Control”.
IPO Equity Grants
In connection with this offering, we intend to grant awards for an aggregate of 168,068 shares of our common stock to our named executive officers under the 2013 Plan described below, as set forth in the table below (which amount of shares gives effect to the planned 211,100-to-1 stock split to be effected after the effective date of this registration statement and prior to the completion of this offering). Mr. Walker will not receive any awards in connection with this offering because Mr. Walker has determined that he does not require additional equity awards based on his ownership percentage of our parent, Halkos.
| Executive |
Options |
Restricted |
Performance | |||
| John J. Wasz |
21,552 | 10,156 | 20,313 | |||
| Robert T. Micchelli |
21,552 | 10,156 | 20,313 | |||
| Daniel B. Becker |
11,605 | 5,469 | 10,938 | |||
| Devin K. Denner |
14,920 | 7,031 | 14,063 | |||
|
|
|
| ||||
| Total |
69,629 | 32,812 | 65,627 | |||
|
|
|
|
The options and restricted stock will generally vest in three equal installments on each of the first, second and third anniversary of the date of grant, subject to continued employment on the applicable vesting date and shall otherwise be on terms consistent with the 2013 Plan described below. The exercise price of the options will be equal to the price per share paid by investors in this offering. The performance shares will generally vest based on satisfaction of the performance condition, with 100% of the performance shares vesting upon achievement of the performance condition. The performance condition is our achievement of return on net assets (“RONA”) of 14.2% at the end of 2013. If we achieve RONA of 14.2%, then 100% of the performance shares will vest. If we achieve RONA of 14.9% or greater then 205% of the performance shares will vest. If we achieve RONA of less than 13.2%, then no performance shares will vest. If we achieve RONA between 13.2% and 14.9%, then a percentage of the performance shares shall vest. The performance shares shall otherwise be on terms consistent with the terms of the 2013 Plan.
Global Brass and Copper Holdings, Inc. 2013 Omnibus Equity Incentive Plan
In connection with this offering, we intend to establish the Global Brass and Copper Holdings, Inc. 2013 Omnibus Equity Incentive Plan, which we refer to as the “2013 Plan”. The Board of Directors adopted, and our shareholders approved, the 2013 Plan on April 10, 2013, subject to the completion of this offering. The 2013 Plan will become effective immediately prior to the consummation of this offering.
The following summary of the material features of the 2013 Plan is qualified in its entirety by reference to the complete text of the 2013 Plan, the form of which is filed as an exhibit to our registration statement relating to this offering.
Administration
Our compensation committee (or a subcommittee thereof, if necessary to comply with Section 162(m) of the Code) will administer the 2013 Plan. The compensation committee will have the authority to determine the terms and conditions of any agreements evidencing any awards granted
160
Table of Contents
under the 2013 Plan and to adopt, alter and repeal rules, guidelines and practices relating to the 2013 Plan. The compensation committee will have full discretion to administer and interpret the 2013 Plan and to adopt such rules, regulations and procedures as it deems necessary or advisable and to determine, among other things, the time or times at which the awards may be exercised and whether and under what circumstances an award may be exercised.
Eligibility
Any of our employees, directors, officers, consultants or advisors (or prospective employees, directors, officers, consultants or advisors), or any of the employees, directors, officers, consultants or advisors (or prospective employees, directors, officers, consultants or advisors) of our subsidiaries or their respective affiliates will be eligible for awards under the 2013 Plan. The compensation committee will have the sole and complete authority to determine who will be granted an award under the 2013 Plan. Employees of certain of our designated foreign subsidiaries are also eligible under separate “Sub Plans”.
Number of Shares Authorized
The 2013 Plan provides for an aggregate of 1,111,053 shares of Global Brass and Copper Holdings’ common stock to be available for awards (which amount of shares gives effect to the planned 211,100-to-1 stock split to be effected after the effective date of this registration statement and prior to the completion of this offering). No more than 100,000 shares of common stock may be issued with respect to incentive stock options under the 2013 Plan. No participant may be granted awards of options and stock appreciation rights (“SARs”) with respect to more than 200,000 shares of our common stock in any one fiscal year. No more than 250,000 shares of our common stock may be granted under the 2013 Plan to any participant with respect to performance compensation awards in any one performance period (or with respect to each fiscal year in the event a performance period extends beyond a single fiscal year). The maximum amount payable for an individual participant under the 2013 Plan for any one performance period (or with respect to each fiscal year in the event a performance period extends beyond a single fiscal year) is $10,000,000 (with respect to each year if the performance period is more than one year). Shares of our common stock subject to awards are generally unavailable for future grant; provided, in no event may we increase the number of shares of common stock that may be delivered pursuant to incentive stock options granted under the 2013 Plan. If any award granted under the 2013 Plan expires, terminates, is canceled or forfeited without being settled or exercised, or if a SAR is settled in cash or otherwise without the issuance of shares, shares of common stock subject to such award will again be made available for future grant. In addition, if any shares are surrendered or tendered to pay the exercise price of an award or to satisfy withholding taxes owed, such shares will again be available for grant under the 2013 Plan. If there is any change in our corporate capitalization, the compensation committee in its sole discretion may make substitutions or adjustments to the number of shares reserved for issuance under the 2013 Plan, the number of shares covered by awards then outstanding under the 2013 Plan, the limitations on awards under the 2013 Plan, the exercise price of outstanding options and such other equitable substitution or adjustments as it may determine appropriate.
Change in Capitalization
If there is a change in Global Brass and Copper Holdings’ corporate capitalization in the event of a stock or extraordinary cash dividend, recapitalization, stock split, reverse stock split, reorganization, merger, consolidation, split up, split-off, spin-off, consolidation or other relevant change in capitalization or applicable law or circumstances, such that the compensation committee determines that an adjustment is necessary or appropriate, then the compensation committee may make adjustments in a manner that it deems equitable.
161
Table of Contents
Awards Available for Grant
The compensation committee may grant awards of non-qualified stock options, incentive (qualified) stock options, SARs, restricted stock awards, restricted stock units, other stock-based awards, performance compensation awards (including cash bonus awards), other cash-based awards or any combination of the foregoing. Awards may be granted under the 2013 Plan and in assumption of, or in substitution for, outstanding awards previously granted by an entity acquired by us or with which we combine (the “Substitute Awards”).
Stock Options
The compensation committee will be authorized to grant options to purchase shares of our common stock that are either “qualified”, meaning they are intended to satisfy the requirements of Section 422 of the Code for incentive stock options, or “non-qualified”, meaning they are not intended to satisfy the requirements of Section 422 of the Code. All options granted under the 2013 Plan shall be non-qualified unless the applicable award agreement expressly states that the option is intended to be an “incentive stock option”. Options granted under the 2013 Plan will be subject to the terms and conditions established by the compensation committee. Under the terms of the 2013 Plan, the exercise price of the options will not be less than the fair market value of common stock at the time of grant (except with respect to Substitute Awards). Options granted under the 2013 Plan will be subject to such terms, including the exercise price and the conditions and timing of exercise, as may be determined by the compensation committee and specified in the applicable award agreement. The maximum term of an option granted under the 2013 Plan will be ten years from the date of grant (or five years in the case of a qualified option granted to a 10% stockholder); provided, that, if the term of a non-qualified option would expire at a time when trading in the shares of common stock is prohibited by our insider trading policy, the option’s term shall be automatically extended until the 30th day following the expiration of such prohibition. Payment in respect of the exercise of an option may be made in cash, by check, by cash equivalent and/or shares of our common stock valued at the fair market value at the time the option is exercised (provided that such shares are not subject to any pledge or other security interest), or by such other method as the compensation committee may permit in its sole discretion, including:
| • | by surrendering the minimum number of shares of our common stock otherwise deliverable in respect of an option that are needed to pay the exercise price and all applicable required withholding taxes; |
| • | if there is a public market for the shares of our common stock at such time, by means of a broker-assisted cashless exercise mechanism; or |
| • | by means of a “net exercise” procedure effected by withholding the minimum number of shares otherwise deliverable in respect of an option that are needed to pay the exercise price and all applicable required withholding taxes. |
The compensation committee may, in its sole discretion, at any time buy out for a payment in cash, or the delivery of shares of our common stock, or other property, an option previously granted to a participant. Any fractional shares of our common stock will be settled in cash.
Stock Appreciation Rights
The compensation committee will be authorized to award SARs under the 2013 Plan. SARs will be subject to the terms and conditions established by the compensation committee. A SAR is a contractual right that allows a participant to receive, either in the form of cash, shares or any combination of cash and shares, the appreciation, if any, in the value of a share over a certain period of time. An option granted under the 2013 Plan may include SARs and SARs may also be awarded to
162
Table of Contents
a participant independent of the grant of an option. SARs granted in connection with an option shall be subject to terms similar to the option corresponding to such SARs, including with respect to vesting and expiration. Except as otherwise provided by the compensation committee (in the case of Substitute Awards or SARs granted in tandem with previously granted options), the strike price per share of common stock for each SAR shall not be less than 100% of the fair market value of such share, determined as of the date of grant. The remaining terms of the SARs shall be subject to terms established by the compensation committee and reflected in the award agreement.
Restricted Stock
The compensation committee will be authorized to award restricted stock under the 2013 Plan. Awards of restricted stock will be subject to the terms and conditions established by the compensation committee. Restricted stock is common stock that generally is non-transferable and is subject to other restrictions determined by the compensation committee for a specified period.
Restricted Stock Unit Awards
The compensation committee will be authorized to award restricted stock unit awards. Restricted stock unit awards will be subject to the terms and conditions established by the compensation committee. Unless the compensation committee determines otherwise, or specifies otherwise in an award agreement, if the participant terminates employment or services during the period of time over which all or a portion of the units are to be earned, then any unvested units will be forfeited. At the election of the compensation committee, the participant will receive a number of shares of our common stock equal to the number of units earned or an amount in cash equal to the fair market value of that number of shares at the expiration of the period over which the units are to be earned or at a later date selected by the compensation committee, less an amount equal to any taxes required to be withheld. To the extent provided in an award agreement, the holder of outstanding restricted stock units shall be entitled to be credited with dividend equivalent payments upon the payment by Global Brass and Copper Holdings of dividends on shares of our common stock, either in cash or (at the sole discretion of the compensation committee) in shares of our common stock having a fair market value equal to the amount of such dividends, and interest may, at the sole discretion of the compensation committee, be credited on the amount of cash dividend equivalents at a rate and subject to such terms as determined by the compensation committee, which accumulated dividend equivalents (and interest thereon, if applicable) shall be payable at the same time as the underlying restricted stock units are settled.
Other Stock-Based Awards
The compensation committee will be authorized to grant awards of unrestricted shares of our common stock, rights to receive grants of awards at a future date, or other awards denominated in shares of our common stock or which provide for cash payments based in whole or in part on the value or future value of shares of our common stock under the 2013 Plan under such terms and conditions as the compensation committee may determine and as set forth in the applicable award agreement.
Performance Compensation Awards
The compensation committee may grant any award under the 2013 Plan in the form of a “Performance Compensation Award” by conditioning the number of shares earned or vested under the award on the satisfaction of certain “Performance Goals”. The compensation committee may establish these Performance Goals with reference to one or more of the following:
| • | net earnings or net income (before or after taxes); |
| • | basic or diluted earnings per share (before or after taxes); |
163
Table of Contents
| • | net revenue or net revenue growth; |
| • | gross revenue or gross revenue growth, gross profit or gross profit growth; |
| • | net operating income or profit (before or after taxes); |
| • | return measures (including, but not limited to, return on investment, assets, capital, gross revenue or gross revenue growth, invested capital, equity or sales); |
| • | cash flow measures (including, but not limited to, operating cash flow, free cash flow and cash flow return on capital), which may but are not required to be measured on a per-share basis; |
| • | earnings before or after taxes, interest, depreciation and amortization (including EBIT and EBITDA); |
| • | gross or net operating margins; productivity ratios; share price (including, but not limited to, growth measures and total stockholder return); expense targets or cost reduction goals, general and administrative expense savings; margins; and operating efficiency; |
| • | objective measures of customer satisfaction; |
| • | working capital targets; |
| • | measures of economic value-added or other “value creation” metrics; |
| • | inventory control; |
| • | enterprise value; |
| • | sales; |
| • | stockholder return; |
| • | client retention; |
| • | competitive market metrics; |
| • | employee retention; |
| • | timely completion of new product rollouts; |
| • | timely launch of new facilities; |
| • | objective measures of personal targets, goals or completion of projects (including, but not limited to, succession and hiring projects, completion of specific acquisitions, reorganizations or other corporate transactions or capital-raising transactions, expansions of specific business operations and meeting segment project budgets); |
| • | system-wide revenues; |
| • | royalty income; |
| • | cost of capital, debt leverage, year-end cash position or book value; |
| • | strategic objectives, development of new product lines and related revenue, sales and margin targets, or international operations; or |
| • | any combination of the above. |
Any of the above Performance Goal elements can be stated as a percentage of another Performance Goal or used on an absolute, relative or adjusted basis to measure our performance or the performance of our affiliates or any segments, divisions, operations or business units, product lines, brands, operating segments, administrative departments or combination thereof, as the compensation committee deems appropriate. Performance Goals may be compared to the
164
Table of Contents
performance of a group of comparator companies or a published or special index that the compensation committee deems appropriate or, stock market indices. The compensation committee also may provide for accelerated vesting of any award based on the achievement of Performance Goals. Any award that is intended to qualify as “performance-based compensation” under Section 162(m) of the Code will be granted, and Performance Goals for such an award will be established, by the compensation committee in writing not later than 90 days after the commencement of the performance period to which the Performance Goals relate, or such other period required under Section 162(m) of the Code; provided that the outcome is substantially uncertain at the time the compensation committee establishes the Performance Goal; and provided further that in no event will a Performance Goal be considered to be pre-established if it is established after 25% of the performance period (as scheduled in good faith at the time the Performance Goal is established) has elapsed. Before any payment is made in connection with any award intended to qualify as performance-based compensation under Section 162(m) of the Code, the compensation committee must certify in writing that the Performance Goals established with respect to such award have been achieved. In determining the actual amount of an individual participant’s Performance Compensation Award for a performance period, the compensation committee may reduce or eliminate the amount of the Performance Compensation Award earned through the use of negative discretion consistent with Section 162(m) of the Code, if, in its sole judgment, such reduction or elimination is appropriate.
The compensation committee may also specify adjustments or modifications (to the extent it would not result in adverse results under Section 162(m) of the Code) to be made to the calculation of a Performance Goal for such performance period, based on and in order to appropriately reflect the following events:
| • | asset write-downs; |
| • | litigation or claim judgments or settlements; |
| • | the effect of changes in tax laws, accounting principles, or other laws or regulatory rules affecting reported results; |
| • | any reorganization and restructuring programs; |
| • | extraordinary nonrecurring items and/or in management’s discussion and analysis of financial condition and results of operations appearing in our annual report to stockholders for the applicable year; |
| • | acquisitions or divestitures; |
| • | any other specific, unusual or nonrecurring events, or objectively determinable category thereof; |
| • | foreign exchange gains and losses; |
| • | discontinued operations and nonrecurring charges; and |
| • | a change in our fiscal year. |
Unless otherwise provided in the applicable award agreement, a participant shall be eligible to receive payment in respect of a Performance Compensation Award only to the extent that the Performance Goals for such period are achieved and all or some of the portion of such participant’s Performance Compensation Award has been earned for the performance period based on the application of the “Performance Formula” (as defined in the 2013 Plan) to such Performance Goals.
Effect of a Change in Control in Global Brass and Copper Holdings
In the event of a “change in control” in Global Brass and Copper Holdings, the Board of Directors may take steps it considers appropriate. Unless otherwise provided in an award agreement, the Board
165
Table of Contents
of Directors in its sole discretion may provide that, with respect to any particular outstanding award:
| • | all then-outstanding options and SARs shall become immediately exercisable as of immediately prior to the “change in control” with respect to up to 100% of the shares subject to such option or SAR; |
| • | any restricted period shall expire as of immediately prior to the “change in control” with respect to up to 100% of then-outstanding shares of restricted stock or restricted stock units (including without limitation a waiver of any applicable Performance Goals); |
| • | all incomplete performance periods in effect on the date the “change in control” occurs shall end on such date, and the compensation committee may: |
| • | determine the extent to which Performance Goals with respect to each such performance period have been met based upon such audited or unaudited financial information or other information then available as it deems relevant; and |
| • | cause the participant to receive partial or full payment of awards for each such performance period based upon the compensation committee’s determination of the degree of attainment of Performance Goals, or assuming that the applicable “target” levels of performance have been attained or on such other basis determined by the compensation committee; and |
| • | all awards previously deferred will be settled in full as soon as practicable. |
Transferability
Each award may be exercised during the participant’s lifetime by the participant or, if permissible under applicable law, by the participant’s guardian or legal representative. In addition, during the participant’s lifetime, the award may be transferred, without consideration, to one or more immediate family members of the participant (within the meaning of the instructions to Form S-8 under the Securities Act), to a trust established exclusively for the participant or one or more of his or her immediate family members, a partnership or limited liability company whose only partners or shareholders are the participant and his or her immediate family members, or any other transferee as may be approved either:
| • | by the Board of Directors or the compensation committee in its sole discretion; or |
| • | as provided in the applicable award agreement, in each case subject to such rules as the compensation committee may adopt consistent with any applicable award agreement to preserve the purposes of the 2013 Plan. |
The terms applicable to the assigned portion shall generally be the same as those in effect for the award immediately prior to such assignment. Other than as described above, awards may not be transferred or encumbered by a participant other than by will or by the laws of descent and distribution.
Amendment
The 2013 Plan will have a term of ten years. The Board of Directors may amend, suspend or terminate the 2013 Plan at any time; however, stockholder approval to amend the 2013 Plan may be necessary if required by law or by NYSE rules. No amendment, suspension or termination will impair the rights of any participant or recipient of any award without the consent of the participant or recipient.
The compensation committee may, to the extent consistent with the terms of any applicable award agreement, waive any conditions or rights under, amend any terms of, or alter, suspend, discontinue, cancel or terminate, any award theretofore granted or the associated award agreement, prospectively or retroactively. Any such waiver, amendment, alteration, suspension, discontinuance, cancellation or termination that would materially and adversely affect the rights of any participant or
166
Table of Contents
any holder or beneficiary of any option theretofore granted will not to that extent be effective without the consent of the affected participant, holder or beneficiary. Further, without stockholder approval:
| • | no amendment or modification may reduce the option price of any option or the strike price of any SAR; |
| • | the compensation committee may not cancel any outstanding option and replace it with a new option (with a lower option price) or cancel any SAR and replace it with a new SAR (with a lower strike price); and |
| • | no option or SAR may be exchanged for cash or another award. |
However, stockholder approval is not required with respect to any of the preceding three bullets with respect to certain adjustments on changes in capitalization. In addition, none of the requirements described in the preceding three bullets can be amended without stockholder approval.
U.S. Federal Income Tax Consequences
The following is a general summary of the material U.S. Federal income tax consequences of the grant and exercise and vesting of awards under the 2013 Plan and the disposition of shares acquired pursuant to the exercise or settlement of such awards and is intended to reflect the current provisions of the Code and the regulations thereunder. This summary is not intended to be a complete statement of applicable law, nor does it address foreign, state, local and payroll tax considerations. Moreover, the U.S. Federal income tax consequences to any particular participant may differ from those described herein by reason of, among other things, the particular circumstances of such participant.
Stock Options. The Code requires that, for treatment of an option as an incentive stock option, shares of Common Stock acquired through the exercise of an incentive stock option cannot be disposed of before the later of two years from the date of grant of the option, or one year from the date of exercise. Holders of incentive stock options will generally incur no Federal income tax liability at the time of grant or upon exercise of those options. However, the spread at exercise will be an “item of tax preference”, which may give rise to “alternative minimum tax” liability for the taxable year in which the exercise occurs. If the holder does not dispose of the shares before two years following the date of grant and one year following the date of exercise, the difference between the exercise price and the amount realized upon disposition of the shares will constitute long-term capital gain or loss, as the case may be. Assuming both holding periods are satisfied, no deduction will be allowed to us for Federal income tax purposes in connection with the grant or exercise of the incentive stock option. If, within two years following the date of grant or within one year following the date of exercise, the holder of shares acquired through the exercise of an incentive stock option disposes of those shares, the participant will generally realize taxable compensation at the time of such disposition equal to the difference between the exercise price and the lesser of the fair market value of the share on the date of exercise or the amount realized on the subsequent disposition of the shares, and that amount will generally be deductible by us for Federal income tax purposes, subject to the possible limitations on deductibility under Sections 280G and 162(m) of the Code for compensation paid to executives designated in those Sections. Finally, if an incentive stock option becomes first exercisable in any one year for shares having an aggregate value in excess of $100,000 (based on the grant date value), the portion of the incentive stock option in respect of those excess shares will be treated as a non-qualified stock option for Federal income tax purposes. No income will be realized by a participant upon grant of an option that does not qualify as an incentive stock option (“a non-qualified stock option”). Upon the exercise of a non-qualified stock option, the participant will recognize ordinary compensation income in an amount equal to the excess, if any, of the fair market value of the underlying exercised shares over the option exercise price paid at the time of exercise, and the participant’s tax basis will equal the sum of the compensation income
167
Table of Contents
recognized and the exercise price. We will be able to deduct this same amount for U.S. Federal income tax purposes, but such deduction may be limited under Sections 280G and 162(m) of the Code for compensation paid to certain executives designated in those Sections. In the event of a sale of shares received upon the exercise of a non-qualified stock option, any appreciation or depreciation after the exercise date generally will be taxed as capital gain or loss and will be long-term gain or loss if the holding period for such shares is more than one year.
SARs. No income will be realized by a participant upon grant of a SAR. Upon the exercise of a SAR, the participant will recognize ordinary compensation income in an amount equal to the fair market value of the payment received in respect of the SAR. We will be able to deduct this same amount for U.S. Federal income tax purposes, but such deduction may be limited under Sections 280G and 162(m) of the Code for compensation paid to certain executives designated in those Sections.
Restricted Stock. A participant will not be subject to tax upon the grant of an award of restricted stock unless the participant otherwise elects to be taxed at the time of grant pursuant to Section 83(b) of the Code. On the date an award of restricted stock becomes transferable or is no longer subject to a substantial risk of forfeiture, the participant will have taxable compensation equal to the difference between the fair market value of the shares on that date over the amount the participant paid for such shares, if any, unless the participant made an election under Section 83(b) of the Code to be taxed at the time of grant. If the participant made an election under Section 83(b), the participant will have taxable compensation at the time of grant equal to the difference between the fair market value of the shares on the date of grant over the amount the participant paid for such shares, if any. If the election is made, the participant will not be allowed a deduction for amounts subsequently required to be returned to us. Special rules apply to the receipt and disposition of restricted shares received by officers and directors who are subject to Section 16(b) of the Exchange Act. We will be able to deduct, at the same time as it is recognized by the participant, the amount of taxable compensation to the participant for U.S. Federal income tax purposes, but such deduction may be limited under Sections 280G and 162(m) of the Code for compensation paid to certain executives designated in those Sections.
Restricted Stock Units. A participant will not be subject to tax upon the grant of a restricted stock unit award. Rather, upon the delivery of shares or cash pursuant to a restricted stock unit award, the participant will have taxable compensation equal to the fair market value of the number of shares (or the amount of cash) the participant actually receives with respect to the award. We will be able to deduct the amount of taxable compensation to the participant for U.S. Federal income tax purposes, but the deduction may be limited under Sections 280G and 162(m) of the Code for compensation paid to certain executives designated in those Sections.
Section 162(m). In general, Section 162(m) of the Code denies a publicly held corporation a deduction for U.S. Federal income tax purposes for compensation in excess of $1,000,000 per year per person to its chief executive officer and the three other officers whose compensation is required to be disclosed in its proxy statement (excluding the chief financial officer), subject to certain exceptions. The 2013 Plan is intended to satisfy an exception with respect to grants of options and SARs to covered employees. In addition, the 2013 Plan is designed to permit certain awards of restricted stock, restricted stock units and other awards (including cash bonus awards) to be awarded as performance compensation awards intended to qualify under the “performance-based compensation” exception to Section 162(m) of the Code. In addition, under a Section 162(m) transition rule for compensation plans of corporations which are privately-held and which become publicly-held in an initial public offering, the 2013 Plan will not be subject to Section 162(m) until a specified transition date, which is generally the earliest of:
| • | the material modification of the 2013 Plan; |
168
Table of Contents
| • | the issuance of all employer stock and other compensation that has been allocated under the 2013 Plan; or |
| • | the first annual meeting of stockholders at which directors are to be elected that occurs after the close of the third calendar year following the calendar year in which the initial public offering occurs. |
New Plan Benefits
It is not possible to determine the benefits or amounts that will be received by or allocated to participants under the 2013 Plan because awards under the 2013 Plan will be made at the discretion of the compensation committee (or subcommittee thereof, if necessary for Section 162(m) of the Code).
Option Exercises and Stock Vested
We did not grant any stock options or stock in 2012 or prior years.
Pension Benefits
We do not offer any defined benefit pension plans.
Nonqualified Deferred Compensation
We do not offer any nonqualified deferred compensation plans.
Potential Payments Upon Termination or Change in Control
Employment Agreement with John H. Walker
Mr. Walker’s employment agreement provides him with severance benefits upon certain terminations of employment.
Mr. Walker’s employment may be terminated at any time and for any reason. If Mr. Walker’s employment is terminated by us for “cause” (as defined below) then he is entitled to receive any base salary which has been earned but not paid through the date of termination. If his employment is terminated due to his death, disability or by Mr. Walker upon 60 days’ prior notice without “good reason” (as defined below), he is entitled to receive:
| • | the base salary accrued through the date of termination; |
| • | pay for any vacation time earned but not used; |
| • | any earned but unpaid bonus for the year prior to termination; and |
| • | any business expenses properly incurred but not submitted prior to the date of termination, provided that such expenses are submitted within 30 days of termination and are reimbursable in accordance with our policy (collectively, the “Accrued but Unpaid Payments”). |
For purposes of the employment agreement, “disability” means the inability of Mr. Walker to perform his duties for 90 consecutive days, or for an aggregate of 120 days in any consecutive 12-month period.
Mr. Walker’s employment may be terminated by us without “cause” or by him for “good reason” (which includes a non-renewal by us of his employment term). Upon such a termination, he is entitled
169
Table of Contents
to receive: (a) the Accrued but Unpaid Payments and (b) 24 months’ base salary continuation which will be paid out in continuing bimonthly installments over such 24 month period. The continuation of his base salary is contingent upon Mr. Walker executing a general release of claims in our favor.
“Cause” under Mr. Walker’s employment agreement generally means:
| • | a commission of fraud or gross negligence that, in the case of gross negligence, has a material adverse effect on our business or financial condition; |
| • | a willful material misrepresentation to the Board of Directors; |
| • | refusal to comply with any material obligations under Mr. Walker’s employment agreement or to comply with a reasonable and lawful instruction of the Board of Directors; |
| • | engaging in any conduct or commission of any act that is, in the reasonable opinion of the Board of Directors, materially injurious or detrimental to our substantial interest (provided that a termination by us for “cause” on this ground shall be effective only if, within 30 days following the delivery of a notice of termination for “cause” by us to Mr. Walker, Mr. Walker has failed to cure any unintentional occurrence which gave rise to such “cause” event, so long as Mr. Walker is reasonably capable of curing in the 30-day cure period); |
| • | conviction of, or entry of a pleading of guilty or no contest to any (a) felony, (b) lesser crime of which fraud or dishonesty is a material element or (c) crime of moral turpitude; or |
| • | failure to comply with any material obligations under Mr. Walker’s employment agreement or with any of our written rules, regulations, policies or procedures furnished to Mr. Walker that, if not complied with, could reasonably be expected to have a material adverse effect on our business (provided that a termination by us for “cause” on this ground shall be effective only if, within 30 days following the delivery of a notice of termination for “cause” by us to Mr. Walker, Mr. Walker has failed to cure any unintentional occurrence which gave rise to such “cause” event, so long as Mr. Walker is reasonably capable of curing in the 30-day cure period). |
“Good reason” under Mr. Walker’s employment agreement generally means any of the following events occurring without Mr. Walker’s consent:
| • | our failure to continue Mr. Walker in the position of CEO; |
| • | our requiring that Mr. Walker report to an individual or body other than the Board of Directors; |
| • | a material diminution in Mr. Walker’s position with us or the duties and responsibilities associated with such position; |
| • | a reduction of Mr. Walker’s base salary or annual target bonus opportunity; |
| • | our requiring Mr. Walker to relocate to an office more than 50 miles from both the city of Chicago, Illinois and Mr. Walker’s primary place of residence on the date of termination; or |
| • | nonrenewal of the employment term by us. |
Mr. Walker must provide written notice of events claimed to constitute “good reason” within 30 days after the initial occurrence of such events, and provide us with an opportunity to cure the applicable circumstance within 30 days following such written notice. If we fail to cure such circumstance, Mr. Walker’s resignation for “good reason” must be tendered within 60 days after our failure to cure.
Mr. Walker is subject to non-competition and non-solicitation covenants for 24 months post-termination. In addition, he is subject to perpetual confidentiality covenants.
170
Table of Contents
Severance Protection Agreement with Robert T. Micchelli
Mr. Micchelli is party to a severance protection agreement, dated as of March 24, 2009, which was amended and restated effective October 20, 2011. Under his amended and restated severance protection agreement, Mr. Micchelli’s employment may be terminated at any time for any reason. If his employment is terminated by us without “cause” or he resigns for “good reason” (each as defined below), then he will be entitled to a severance payment. Assuming such termination occurred on December 31, 2012, the severance payment would be payable in a cash lump sum, equal to one year of base pay at the highest rate of base salary payable to the executive during the one-year period immediately prior to the termination, plus the highest of (x) his target bonus amount for the year in which the last day of employment occurs (which is currently 70% of base salary), (y) the amount of the average of his annual bonus over the three years immediately prior to the year in which the last day of employment occurs and (z) an amount set forth on an exhibit to the severance protection agreement (which is currently zero). In addition, upon such a termination, Mr. Micchelli and his dependents will be entitled to continued health and welfare participation for one year following such termination, unless he obtains coverage from a new employer, and he will be entitled to COBRA coverage at the end of such one-year period if he has not obtained new coverage. Such severance payments and benefits are contingent upon Mr. Micchelli executing a general release of claims in our favor.
Mr. Micchelli will also be entitled to payment of any accrued but unpaid base salary and business expenses in accordance with our policy, as well as any payments, benefits or entitlements that are vested, fully and unconditionally earned pursuant to any plan, policy, program or arrangement or other agreement, other than those providing for severance, separation pay or salary continuation payments or benefits. Mr. Micchelli’s severance payment pursuant to his amended and restated severance protection agreement is in lieu and satisfaction of any amount otherwise payable under the annual bonus plan.
For the definitions of “cause” and “good reason” under Mr. Micchelli’s amended and restated severance protection agreement, see “—Employment Agreement and Severance Protection”.
Mr. Micchelli is subject to a non-competition covenant which extends for 24 months following his termination of employment for any reason, a nondisparagement covenant, as well as a confidentiality covenant extending for five years following any termination of the severance protection agreement.
Severance Protection Agreement with John J. Wasz
Mr. Wasz was party to a severance protection agreement, dated as of January 16, 2010, which was superseded by a new severance protection agreement, effective as of August 31, 2011. The new severance protection agreement is substantially similar to Mr. Micchelli’s amended and restated severance protection agreement.
Mr. Wasz’s employment may be terminated at any time for any reason. If his employment is terminated by us without “cause” or he resigns for “good reason” (each as defined below), then he will be entitled to a severance payment. Assuming such termination occurred on December 31, 2012, he will be entitled to a lump sum severance payment equal to his annual base salary plus the highest of (x) his target bonus amount for the year in which the last date of employment occurs (which is currently 75% of base salary), (y) the amount of the average of his annual bonus over the three years immediately prior to the year in which the last day of employment occurs and (z) an amount set forth on an exhibit to the severance protection agreement (which is currently zero). In addition, he will be entitled to continued health and welfare participation and participation for his dependents for a one-year period, unless he obtains coverage from a new employer, and he will be entitled to COBRA coverage at the end of such one-year period if he has not obtained new coverage.
171
Table of Contents
For the definitions of “cause” and “good reason” under Mr. Wasz’s new severance protection agreement, see “—Employment Agreement and Severance Protection”.
Mr. Wasz is subject to a non-competition covenant which extends for 12 months following his termination of employment for any reason, a nonsolicitation of employees, vendors, customers or other parties covenant that extends for 12 months following any such termination, as well as a confidentiality covenant extending for five years following any termination of the severance protection agreement.
Severance Protection Agreements with Daniel B. Becker and Devin K. Denner
Mr. Becker and Mr. Denner entered into severance protection agreements with us on July 28, 2011 and July 29, 2011. The severance protection agreements are substantially similar to Mr. Micchelli’s amended and restated severance protection agreement.
Mr. Becker and Mr. Denner’s employment may be terminated by us at any time for any reason. If such executive’s employment is terminated by us without “cause” or he resigns for “good reason” (each as defined below), then he will be entitled to a severance payment. Assuming such termination occurred on December 31, 2012, he will be entitled to a lump sum severance payment equal to his annual base salary plus the highest of (x) his target bonus amount for the year in which the last date of employment occurs (which is currently 50% of base salary), (y) the amount of the average of his annual bonus over the three years immediately prior to the year in which the last day of employment occurs and (z) an amount set forth on an exhibit to the severance protection agreement (which is currently zero for both Mr. Becker and Mr. Denner; provided that such amount was reduced to zero for Mr. Denner after his bonus bank of $600,000 was paid out in January 2012). In addition, he will be entitled to continued health and welfare participation and participation for his dependents for a one-year period, unless he obtains coverage from a new employer, and he will be entitled to COBRA coverage at the end of such one-year period if he has not obtained new coverage.
For the definitions of “cause” and “good reason” under Mr. Becker and Mr. Denner’s severance protection agreements, see “—Employment Agreement and Severance Protection”.
Mr. Becker and Mr. Denner are each subject to a non-competition covenant which extends for 12 months following his termination of employment for any reason, a nonsolicitation of employees, vendors, customers or other parties covenant that extends for 24 months following any such termination, as well as a confidentiality covenant extending for five years following any termination of the severance protection agreement.
The following table shows the severance payments and benefits that would have become payable to each named executive officer, assuming the termination of his employment occurred as of December 31, 2012. We do not provide enhanced severance upon a change of control.
Potential Payments upon Termination of Employment without Cause or for Good Reason
| Name |
Cash Severance ($)(1) |
Health and Welfare Benefits Continuation ($) |
Total ($) | |||||||||
| John Walker |
1,601,600 | — | 1,601,600 | |||||||||
| Robert Micchelli |
873,333 | 9,331 | 882,664 | |||||||||
| John Wasz |
875,000 | 9,331 | 884,331 | |||||||||
| Daniel Becker |
520,808 | 9,331 | 530,139 | |||||||||
| Devin Denner |
603,667 | 9,331 | 612,998 | |||||||||
172
Table of Contents
| (1) | For Mr. Walker, the cash severance is equal to two times his base salary of $800,800. |
| For Mr. Micchelli, the cash severance is equal to his base salary of $390,000 plus his average bonus of $483,333. |
| For Mr. Wasz, the cash severance is equal to his base salary of $500,000 plus his target bonus of $375,000 |
| For Mr. Becker, the cash severance is equal to his base salary of $312,000 plus his average bonus of $208,808. |
| For Mr. Denner, the cash severance is equal to his base salary of $312,000 plus his average bonus of $291,667. |
Director Compensation in 2012
The following table shows the director fees earned by the directors for 2012. In addition, we reimbursed the directors for expenses incurred in attending Board meetings. The reimbursements are not included in the table below as the reimbursement was significantly below the $10,000 threshold. We did not pay the non-independent directors of Global Brass and Copper Holdings any compensation for their service on the Board of Directors in 2012. We are currently evaluating a compensation program in order to attract and retain qualified directors in connection with this offering. On August 8, 2012 the Compensation Committee, based upon benchmark data from Towers Watson, increased the annual director fee from $50,000 to $70,000 plus an additional $15,000 annual fee for the Chairman of the Audit Committee. Accordingly, our independent directors received two quarterly payments of $12,500 and after the August 8, 2012 increase two quarterly payments of $17,500. In the future, directors who are also our employees will not receive any compensation from us for service on the Board of Directors.
DIRECTOR COMPENSATION
| Name |
Fees Earned or Paid in Cash ($) |
Total | ||||||
| Michael Psaros |
— | — | ||||||
| Raquel Palmer |
— | — | ||||||
| David Shapiro |
— | — | ||||||
| Jay Bernstein |
— | — | ||||||
| George Thanopoulos |
$ | 60,000 | $ | 60,000 | ||||
| Ronald C. Whitaker |
$ | 60,000 | $ | 60,000 | ||||
| Martin E. Welch III |
$ | 75,000 | $ | 75,000 | ||||
| David Burritt |
$ | 60,000 | $ | 60,000 | ||||
173
Table of Contents
CERTAIN RELATIONSHIPS AND RELATED PARTY TRANSACTIONS
Distributions to Halkos and Certain Members of Management
The KPS Funds are majority members of Halkos. Halkos owns all of the outstanding shares of Global Brass and Copper Holdings. Global Brass and Copper Holdings is the direct parent of Global Brass and Copper and the source of the initial investment as reported in additional paid in capital in the consolidated balance sheets. The KPS Funds are also affiliates of KPS Capital Finance, LLC, the agent of a related party term loan credit agreement. On August 18, 2010, we repaid the $60.0 million balance then outstanding on the related party term loan credit agreement and in connection with the related party term loan agreement we made interest payments of $2.5 million in 2010, $6.8 million in 2009 and $4.1 million in 2008. In August 2010, we distributed $42.5 million to the KPS Funds and other members of Halkos. Of this total, $2.2 million was paid by Halkos to Mr. Walker, our Chief Executive Officer, $1.3 million collectively was paid by Halkos to Messrs. Micchelli, Denner, Becker and other employees, and $0.9 million was escrowed to be paid to other employees. Even though the amounts were paid by Halkos, these payments resulted in non-cash compensation charges to Global Brass and Copper Holdings.
In connection with the Transactions, we used a portion of the net proceeds of the Senior Secured Notes to make a distribution of $160.0 million to Halkos. Halkos distributed such proceeds pro rata to its equityholders (which include certain of our officers and directors as described under “Compensation Discussion and Analysis—Distributions in respect of Class B Profits Interest Shares”) in accordance with the terms of its operating agreement on June 1, 2012. See “Prospectus Summary—Recent Transactions—Distribution to Halkos”.
Additionally, we expect that approximately $16.4 million of the proceeds from this offering (based on an assumed initial offering price of $16.00 per share, the midpoint of the price range set forth on the cover of this prospectus (approximately $18.9 million if the underwriters’ option to purchase additional shares is exercised)) will be paid to our executive officers, which include Messrs. Walker, Micchelli, Becker, Denner and Wasz, as holders of Class B Shares. The management committee of Halkos, which consists of Michael Psaros, David Shapiro, Raquel Palmer, Jay Bernstein and John Walker, will determine payouts of the offering proceeds among the Halkos shareholders according to the Halkos capital accounts. According to the Halkos capital accounts, Messrs. Walker, Micchelli, Becker, Denner and Wasz will receive the following approximate amounts, respectively, based on the midpoint of the price range set forth on the cover of this Prospectus: $9.4 million, $2.0 million, $0.7 million, $1.0 million and $2.1 million (and the following approximate amounts if the underwriters’ option is exercised in full: $10.9 million, $2.3 million, $0.8 million, $1.2 million and $2.4 million). Offering proceeds among the Halkos shareholders are allocated first to holders of Class A Shares until each holder of Class A Shares has recovered the amount of any of its capital contributions, then to holders of Class B Shares until each holder of Class B Shares has recovered the amount of any of its capital contributions and finally to holders of Class A and Class B Shares pro rata based on the number of such shares outstanding. See “Compensation Discussion and Analysis—Equity-Based Compensation—Profits Interest Shares”.
Management Services Agreement
We and affiliates of the KPS Funds are parties to an agreement under which those affiliates charge us for management and other services provided to us. The charges, which are included in selling, general and administrative expenses, were $1.0 million for each of the years ended December 31, 2012, 2011 and 2010, of which $0.25 million is included in accrued liabilities at December 31, 2012, 2011 and 2010. This agreement will be terminated at the closing of this offering. We expect to pay KPS or its affiliates an amount in cash equal to $4.5 million, the aggregate amount of the remaining payments due under the management agreement upon termination of that agreement at the closing of this offering.
174
Table of Contents
Reimbursement Agreement
We and the KPS Funds are also parties to an agreement whereby the KPS Funds have agreed to reimburse us for specific incremental costs directly attributable to an offering of equity securities. As of March 31, 2013, we have recorded $5.2 million as a receivable from our stockholder.
Investor Rights Agreement
In connection with this offering, we intend to enter into an investor rights agreement with Halkos. The investor rights agreement will provide Halkos with certain demand, shelf and piggyback registration rights with respect to its shares of Global Brass and Copper Holdings common stock and will also provide Halkos with certain governance rights, depending on the size of its holdings of Global Brass and Copper Holdings common stock.
Under the registration rights provisions of the investor rights agreement:
| • | after 180 days after the completion of this offering, Halkos and its affiliates have the right to cause us to conduct up to five demand registrations, subject to certain customary restrictions; |
| • | once we are eligible to do so, Halkos and its affiliates have the right to cause us to file and have declared effective a shelf registration statement on Form S-3 with respect to all of their shares of Global Brass and Copper Holdings common stock; and |
| • | Halkos and its affiliates have the right to participate in certain registered offerings by us. |
The registration rights provisions also contain customary provisions relating to cooperation with the registration process, black-out periods and customary securities law indemnity provisions in favor of the selling stockholders. With certain customary exceptions, we will be required to bear all registration expenses, other than underwriting discounts and commissions and transfer taxes, associated with any registration of shares pursuant to the agreement. Registration rights may be transferred by Halkos and its affiliates, subject to certain restrictions.
Under the governance rights provisions of the investor rights agreement:
| • | at the time of this offering, the Board of Directors is required to consist of nine members, four of which are designated by Halkos, three of which are independent and one of which is our Chief Executive Officer; |
| • | we are required to have a classified Board of Directors with a sunset provision, as described under “Management—Board Structure—Composition”; |
| • | we are required to have an audit committee with at least three independent directors and an executive committee of at least one independent director, one management director and one Halkos nominee; and |
| • | each committee of the Board of Directors other than the audit committee and the executive committee is required to have at least two directors, of which Halkos shall have the ability to designate one member from among the Halkos nominees and the independent directors. |
Under the governance rights provisions, Halkos has the right to designate: (i) five directors if it beneficially owns more than 50% of the outstanding Global Brass and Copper Holdings common stock, (ii) three directors if it beneficially owns more than 30% but 50% or less, (iii) two directors if it beneficially owns more than 15% but 30% or less and (iv) one director if it beneficially owns greater than 10% but 15% or less. Halkos loses the right to designate directors at 10% or less.
The investor rights agreement is expected to be executed at the closing of this offering and will terminate on the tenth anniversary of its execution.
175
Table of Contents
Indemnification Agreements
We have entered into customary indemnification agreements with our executive officers and directors that provide, in general, that we will provide them with customary indemnification in connection with their service to us or on our behalf.
These indemnification agreements require us, among other things, to indemnify our directors and officers against liabilities that may arise by reason of their status or service as directors or officers, other than liabilities arising from willful misconduct. These indemnification agreements also require us to advance any expenses incurred by the directors or officers as a result of any proceeding against them as to which they could be indemnified and to obtain directors’ and officers’ insurance, if available on reasonable terms.
176
Table of Contents
PRINCIPAL AND SELLING STOCKHOLDERS
The table below sets forth, as of May 1, 2013, information with respect to the beneficial ownership of our common stock by:
| • | each of our directors and each of the executive officers named in the Summary Compensation Table; |
| • | the selling stockholder; |
| • | each person or group of affiliated persons who is known to be the beneficial owner of more than 5% of any class or series of our capital stock; and |
| • | all of our directors and executive officers as a group. |
The amounts and percentages of common stock outstanding and percentage of beneficial ownership before this offering are based on the number of shares of common stock to be issued and outstanding prior to this offering, giving effect to the planned 211,100-to-1 stock split to be effected after the effective date of this registration statement and prior to the completion of this offering.
The amounts and percentages of common stock beneficially owned are reported on the basis of the regulations of the SEC governing the determination of beneficial ownership of securities. Under these rules, a person is deemed to be a beneficial owner of a security if that person has or shares voting power, which includes the power to vote or to direct the voting of such security, or investment power, which includes the power to dispose of or to direct the disposition of such security. A person is also deemed to be a beneficial owner of any securities of which that person has a right to acquire beneficial ownership within 60 days. Under these rules, more than one person may be deemed to be a beneficial owner of the same securities.
The following table shows beneficial ownership of our shares, both under the assumption that the underwriters’ option to purchase additional shares is not exercised and the assumption that the underwriters’ option to purchase additional shares is exercised in full:
| Shares Offered Hereby | Shares Beneficially Owned After Closing |
|||||||||||||||||||||||||||||||
| Beneficial Owner |
Shares Beneficially Owned Prior to the Offering |
Assuming No Exercise of Option to Purchase Additional Shares |
Assuming Full Exercise of Option to Purchase Additional Shares |
Assuming No Exercise of Option to Purchase Additional Shares |
Assuming Full Exercise of Option to Purchase Additional Shares |
|||||||||||||||||||||||||||
| Number | % | Number | Number | Number | % | Number | % | |||||||||||||||||||||||||
| Halkos Holdings, LLC(1) |
21,110,000 | 100 | 9,375,000 | 10,781,000 | 11,735,000 | 55.6 | 10,329,000 | 48.9 | ||||||||||||||||||||||||
| John H. Walker(2) |
— | — | — | — | — | — | — | — | ||||||||||||||||||||||||
| Robert T. Micchelli(2) |
— | — | — | — | — | — | — | — | ||||||||||||||||||||||||
| Daniel B. Becker(2) |
— | — | — | — | — | — | — | — | ||||||||||||||||||||||||
| Devin K. Denner(2) |
— | — | — | — | — | — | — | — | ||||||||||||||||||||||||
| John J. Wasz(2) |
— | — | — | — | — | — | — | — | ||||||||||||||||||||||||
| Scott B. Hamilton(2) |
— | — | — | — | — | — | — | — | ||||||||||||||||||||||||
| Paul Schwind(2) |
— | — | — | — | — | — | — | — | ||||||||||||||||||||||||
| Michael Psaros(2)(3) |
21,110,000 | 100 | 9,375,000 | 10,781,000 | 11,735,000 | 55.6 | 10,329,000 | 48.9 | ||||||||||||||||||||||||
| Raquel Palmer(2) |
— | — | — | — | — | — | — | — | ||||||||||||||||||||||||
| David Shapiro(2)(3) |
21,110,000 | 100 | 9,375,000 | 10,781,000 | 11,735,000 | 55.6 | 10,329,000 | 48.9 | ||||||||||||||||||||||||
| Jay Bernstein(2) |
— | — | — | — | — | — | — | — | ||||||||||||||||||||||||
| George Thanopoulos(2) |
— | — | — | — | — | — | — | — | ||||||||||||||||||||||||
| Ronald C. Whitaker(2) |
— | — | — | — | — | — | — | — | ||||||||||||||||||||||||
| Martin E. Welch, III(2) |
— | — | — | — | — | — | — | — | ||||||||||||||||||||||||
| David Burritt(2) |
— | — | — | — | — | — | — | — | ||||||||||||||||||||||||
| All directors and executive officers as a group |
21,110,000 | 100 | 9,375,000 | 10,781,000 | 11,735,000 | 56.6 | 10,329,000 | 48.9 | ||||||||||||||||||||||||
177
Table of Contents
| (1) | The address of Halkos is 475 N. Martingale Road, Suite 1050, Schaumburg, IL 60173. The majority members of Halkos are the KPS Funds. |
| (2) | The address for each officer and director is c/o Global Brass and Copper Holdings, Inc., 475 Martingale Road, Suite 1050, Schaumburg, IL 60173. |
| (3) | KPS Special Situations Fund II, L.P., KPS Special Situations Fund II(A), L.P., KPS Special Situations Fund III, LP and KPS Special Situations Fund III(A), L.P. (collectively, the “KPS Funds”) are, collectively, majority members of Halkos. The KPS Funds that control Halkos are ultimately controlled by KPS Capital Partners, LLC, whose managing members, Messrs. Michael Psaros and David Shapiro, have investment and voting control over such KPS Funds and therefore Halkos. Messrs. Psaros and Shapiro disclaim beneficial ownership of the shares of Global Brass and Copper Holdings owned by Halkos. The address for the KPS Funds and KPS Capital Partners, LLC is 485 Lexington Avenue, 31st Floor, New York, NY 10017. |
Relationship with Selling Stockholder
All of the shares sold in this offering will be sold by the selling stockholder. The selling stockholder is Halkos, an affiliate of KPS. For additional information with respect to the selling stockholder and its relationships with us please see “Certain Relationships and Related Party Transactions”.
178
Table of Contents
Capital Stock
In connection with this offering, Global Brass and Copper Holdings expects to amend its certificate of incorporation so that its authorized capital stock will consist of 80,000,000 shares of common stock, par value $0.01 per share, and 20,000,000 shares of preferred stock, par value $0.01 per share. After the consummation of this offering, and after giving effect to the planned 211,100-to-1 stock split to be effected after the effective date of this registration statement and prior to the completion of this offering, Global Brass and Copper Holdings expects to have 21,110,000 shares of common stock and no shares of preferred stock outstanding. Summarized below are material provisions of Global Brass and Copper Holdings’ amended and restated certificate of incorporation and amended and restated bylaws as they will be in effect upon the completion of this offering, as well as relevant sections of the Delaware General Corporation Law (the “DGCL”). The following summary is qualified in its entirety by the provisions of Global Brass and Copper Holdings’ amended and restated certificate of incorporation and amended and restated bylaws, copies of which have been filed as exhibits to the registration statement of which this prospectus is a part.
Common Stock
The holders of our common stock are entitled to one vote per share on all matters submitted to a vote of stockholders, including the election of directors. Generally, all matters to be voted on by stockholders must be approved by a majority of the votes entitled to be cast by the holders of our common stock present in person or represented by proxy, subject to any voting rights granted to holders of any preferred stock. An election of directors by our stockholders shall be determined by a plurality of the votes cast by the stockholders entitled to vote on the election. Holders of our common stock do not have any preemptive rights or cumulative voting rights, which means that the holders of a majority of the outstanding common stock voting for the election of directors can elect all directors then being elected. At completion of this offering will own a majority of the shares of our common stock. The holders of our common stock are entitled to receive dividends when, as, and if declared by the Board of Directors out of legally available funds. Upon the liquidation or dissolution of Global Brass and Copper Holdings, the holders of our common stock will be entitled to share ratably in those of Global Brass and Copper Holdings’ assets that are legally available for distribution to its stockholders after payment of liabilities and subject to the prior rights of any holders of preferred stock then outstanding. All of the outstanding shares of our common stock are fully paid and nonassessable. The rights, preferences and privileges of holders of our common stock are subject to the rights of the holders of shares of any series of preferred stock that may be issued in the future. The shares of our common stock are not subject to any redemption provisions and are not convertible into any other shares of our capital stock.
Preferred Stock
Under the terms of Global Brass and Copper Holdings’ amended and restated certificate of incorporation (which will be in effect upon the consummation of this offering), Global Brass and Copper Holdings will be authorized to issue up to 20,000,000 shares of preferred stock without further action by holders of our common stock. The Board of Directors will be authorized, subject to limitations prescribed by Delaware law and Global Brass and Copper Holdings’ amended and restated certificate of incorporation, to determine the terms and conditions of the preferred stock, including whether the shares of preferred stock will be issued in one or more series, the number of shares to be included in each series and the powers, designations, preferences and rights of the shares. The Board of Directors will also be authorized to designate any qualifications, limitations or restrictions on the shares without any further vote or action by the stockholders. The purpose of authorizing the Board of Directors to issue preferred stock and determine its rights and preferences is to eliminate delays associated with a stockholder vote on specific issuances. The ability of the Board of Directors to issue preferred stock, while providing flexibility in connection with possible acquisitions, future financings and other corporate
179
Table of Contents
purposes, could make it more difficult for a third party to acquire us, or could adversely affect the rights of holders of our common stock by restricting dividends on our common stock, diluting the voting power of our common stock, impairing the liquidation rights of our common stock or delaying or preventing a change in control without further action by the holders of our common stock. As a result of these or other factors, the issuance of preferred stock could have an adverse impact on the market price of our common stock.
Options
As of the completion of this offering, options to purchase a total of 104,444 shares of Global Brass and Copper Holdings’ common stock will be outstanding, none of which will be eligible for exercise or sale immediately following the completion of this offering. Options issued concurrently with completion of this offering, if any, will be exercisable at the same price as the offering price. Common stock may be subject to the granting of options under the equity incentive plan. See “Compensation Discussion and Analysis—Global Brass and Copper Holdings, Inc. 2013 Omnibus Equity Incentive Plan” and “Shares Eligible for Future Sale”.
Special Meetings of Stockholders
Upon completion of this offering, the amended and restated bylaws of Global Brass and Copper Holdings will provide that special meetings of the stockholders may be called only by the Board of Directors or the chairman of the Board of Directors.
Anti-Takeover Provisions
Certain provisions in the amended and restated certificate of incorporation and amended and restated bylaws of Global Brass and Copper Holdings summarized below may be deemed to have an anti-takeover effect and may delay, deter or prevent a tender offer or other takeover attempt that a stockholder might consider to be in its best interests, including attempts that might result in a premium being paid over the market price for the shares of our common stock held by stockholders.
No Action by Written Consent of Stockholders and Special Meetings of Stockholders
The amended and restated certificate of incorporation and amended and restated bylaws of Global Brass and Copper Holdings that will be in effect upon the completion of this offering will provide that any action required or permitted to be taken by its stockholders must be taken at a duly called meeting of stockholders and not by written consent.
Authorized But Unissued Shares
The amended and restated certificate of incorporation of Global Brass and Copper Holdings that will be in effect upon the completion of this offering will contain provisions that permit the Board of Directors to issue, without any further vote or action by the stockholders, shares of preferred stock and common stock in one or more series and, with respect to each such series, to fix the number of shares constituting the series and the designation of the series, the voting rights (if any) of the shares of the series and, with respect to preferred stock, the powers, preferences and relative, participation, optional and other special rights, if any, and any qualifications, limitations or restrictions on the shares of such series. See “—Capital Stock—Preferred Stock”. The existence of authorized but unissued shares of our common stock and preferred stock could render more difficult or discourage an attempt to obtain control of us by means of a proxy contest, tender offer, merger or otherwise.
180
Table of Contents
Classified Board; Number of Directors
The amended and restated certificate of incorporation of Global Brass and Copper Holdings that will be in effect upon the completion of this offering will provide that the Board of Directors is divided into three classes of directors, with staggered three-year terms, with the classes to be as nearly equal in number as possible. Only one class of directors will be elected at each annual meeting of stockholders, with the other classes continuing for the remainder of their respective three-year terms. The amended and restated certificate of incorporation will also provide that the number of directors on the Board of Directors may be fixed only by the majority of the Board of Directors, as described above in “Management—Board Structure—Composition”.
Removal of Directors; Vacancies
The stockholders of Global Brass and Copper Holdings will be able to remove directors only for cause and only by the affirmative vote of the holders of a majority of the outstanding shares of its capital stock entitled to vote in the election of directors. Vacancies on the Board of Directors may be filled only by a majority of the Board of Directors.
No Cumulative Voting
The amended and restated certificate of incorporation of Global Brass and Copper Holdings that will be in effect upon the completion of this offering will provide that stockholders do not have the right to vote cumulatively in the election of directors.
Advance Notice Requirements for Stockholder Proposals and Director Nominations
The amended and restated bylaws of Global Brass and Copper Holdings that will be in effect upon the completion of this offering will provide that stockholders seeking to nominate candidates for election as directors or to bring business before an annual meeting of stockholders must provide timely notice of their proposal in writing to the corporate secretary.
Generally, to be timely, a stockholder’s notice must be received at our principal executive offices not less than 60 days nor more than 120 days prior to the first anniversary date of the previous year’s annual meeting. The amended and restated bylaws of Global Brass and Copper Holdings that will be in effect upon the completion of this offering will also specify requirements as to the form and content of a stockholder’s notice. These provisions may impede stockholders’ ability to bring matters before an annual meeting of stockholders or make nominations for directors at an annual meeting of stockholders.
Supermajority Voting Requirement for Amendment of Certificate of Incorporation
The amended and restated certificate of incorporation of Global Brass and Copper Holdings that will be in effect upon the completion of this offering will provide that it can be amended only with the affirmative vote of the holders of 66 2/3% of the shares of its capital stock then entitled to vote at a meeting of stockholders.
Supermajority Voting Requirement for Amendment of Bylaws
The amended and restated bylaws of Global Brass and Copper Holdings that will be in effect upon the completion of this offering will provide that they can be amended only with the affirmative vote of the holders of 66 2/3% of the shares of its capital stock then entitled to vote at a meeting of stockholders or by the vote of a majority of the Board of Directors.
181
Table of Contents
All the above-described provisions of the amended and restated certificate of incorporation and amended and restated bylaws of Global Brass and Copper Holdings could discourage potential acquisition proposals and could delay or prevent a change in control. These provisions are intended to enhance the likelihood of continuity and stability in the composition of the Board of Directors and in the policies formulated by the Board of Directors and to discourage certain types of transactions that may involve an actual or threatened change of control. These provisions are designed to reduce our vulnerability to an unsolicited acquisition proposal. The provisions also are intended to discourage certain tactics that may be used in proxy fights. These same provisions may delay, deter or prevent a tender offer or takeover attempt that a stockholder might consider to be in its best interest. In addition, such provisions could have the effect of discouraging others from making tender offers for shares of our common stock and, as a consequence, they also may inhibit fluctuations in the market price of our common stock that could result from actual or rumored takeover attempts. Such provisions also may have the effect of preventing changes in the management of Global Brass and Copper Holdings.
Section 203 of the DGCL
Upon the closing of this offering, the amended and restated certificate of incorporation of Global Brass and Copper Holdings will contain a provision to the effect that Global Brass and Copper Holdings will not be subject to Section 203 of the Delaware General Corporation Law. Section 203 prohibits a publicly held Delaware corporation from engaging in a business combination, such as a merger, with a person or group owning 15% or more of the corporation’s voting stock for a period of three years following the date the person became an interested stockholder, unless (with certain exceptions) the business combination or the transaction in which the person became an interested stockholder is approved in a prescribed manner.
While Global Brass and Copper Holdings will not be subject to any anti-takeover effects of Section 203, its amended and restated certificate of incorporation will contain provisions (the “203 Provisions”) that have the same effect as Section 203, except that they provide that KPS, investment funds affiliated with KPS and their respective affiliates and successors and transferees of any of them (the “Exempted Parties”) will not be deemed to be “interested stockholders,” regardless of the percentage of Global Brass and Copper Holdings voting stock owned by them, and accordingly will not be subject to such restrictions. The 203 Provisions in the amended and restated certificate of incorporation will provide that Global Brass and Copper Holdings may not engage in a business combination with any interested stockholder for a period of three years following the time that such stockholder became an interested stockholder unless:
| • | prior to such time the board of directors of Global Brass and Copper Holdings approved either the business combination or transaction which resulted in the stockholder becoming an interested stockholder; |
| • | upon consummation of the transaction which resulted in the stockholder becoming an interested stockholder, the interested stockholder owned at least 85% of the voting stock of Global Brass and Copper Holdings outstanding at the time the transaction commenced, excluding shares owned by persons who are directors and also officers and employee stock plans in which participants do not have the right to determine confidentially whether shares held subject to the plan will be tendered in a tender or exchange offer; or |
| • | at or subsequent to such time, the business combination is approved by the board of directors of Global Brass and Copper Holdings and authorized at an annual or special meeting of stockholders, and not by written consent, by the affirmative vote of 66 2/3% of the outstanding voting stock which is not owned by the interested stockholder. |
Under the 203 Provisions, an “interested stockholder” will mean any person (other than Global Brass and Copper Holdings and any Exempted Parties and any direct or indirect majority-owned
182
Table of Contents
subsidiary) who owns 15% or more of the outstanding voting stock of Global Brass and Copper Holdings or is an affiliate or associate of Global Brass and Copper Holdings and was the owner of 15% or more of the outstanding voting stock of Global Brass and Copper Holdings at any time within the three-year period immediately prior to the date of determination, and the affiliates and associates of such person.
Corporate Opportunities
The amended and restated certificate of incorporation of Global Brass and Copper Holdings will provide that no officer or director of Global Brass and Copper Holdings who is also an officer, director, employee or other affiliate of KPS or an officer, director or employee of an affiliate of KPS will be liable to us or its stockholders for breach of any fiduciary duty by reason of the fact that any such individual directs a corporate opportunity to KPS or its affiliates instead of us, or does not communicate information regarding a corporate opportunity to us that such person or affiliate has directed to KPS or its affiliates. Similar provisions will apply to the constituent documents of the various direct and indirect subsidiaries of Global Brass and Copper Holdings.
Limitation of Liability and Indemnification
The amended and restated certificate of incorporation of Global Brass and Copper Holdings that will be in effect at the time of this offering will provide that no director will be personally liable for monetary damages for breach of any fiduciary duty as a director, except with respect to liability:
| • | for any breach of the director’s duty of loyalty to us or our stockholders; |
| • | for acts or omissions not in good faith or that involve intentional misconduct or a knowing violation of law; |
| • | under Section 174 of the DGCL (governing distributions to stockholders); or |
| • | for any transaction from which the director derived any improper personal benefit. |
However, if the DGCL is amended to authorize corporate action further eliminating or limiting the personal liability of directors, then the liability of the directors of Global Brass and Copper Holdings will be eliminated or limited to the fullest extent permitted by the DGCL, as so amended. The modification or repeal of this provision of the amended and restated certificate of incorporation of Global Brass and Copper Holdings will not adversely affect any right or protection of a director existing at the time of such modification or repeal.
The amended and restated certificate of incorporation of Global Brass and Copper Holdings will provide that it will, to the fullest extent from time to time permitted by law, indemnify its directors and officers against all liabilities and expenses in any suit or proceeding, arising out of their status as an officer or director or their activities in these capacities. It will also indemnify any person who, at its request, is or was serving as a director, officer or employee of another corporation, partnership, joint venture, trust or other enterprise. It may, by action of the Board of Directors, provide indemnification to its employees and agents within the same scope and effect as the foregoing indemnification of directors and officers.
The right to be indemnified will include the right of an officer or a director to be paid expenses in advance of the final disposition of any proceeding, provided that, if required by law, Global Brass and Copper Holdings receives an undertaking to repay such amount if it will be determined that he or she is not entitled to be indemnified. The Board of Directors may take such action as it deems necessary to carry out these indemnification provisions, including adopting procedures for determining and enforcing indemnification rights and purchasing insurance policies. The Board of Directors may also adopt bylaws, resolutions or contracts implementing indemnification arrangements as may be permitted by
183
Table of Contents
law. Neither the amendment or repeal of these indemnification provisions, nor the adoption of any provision of its amended and restated certificate of incorporation inconsistent with these indemnification provisions, will eliminate or reduce any rights to indemnification relating to their status or any activities prior to such amendment, repeal or adoption. We believe these provisions will assist in attracting and retaining qualified individuals to serve as directors.
The amended and restated certificate of incorporation and amended and restated bylaws of Global Brass and Copper Holdings, which will be in effect upon the completion of this offering, will permit it to purchase and maintain insurance on behalf of its current and former directors, officers, employees or agents against any liability asserted against them and incurred by them in any such capacity or arising out of their status as such. It currently maintains liability insurance for its officers and directors.
Global Brass and Copper Holdings has entered into separate indemnification agreements with each of its directors and officers, which are broader than the specific indemnification provisions contained in the DGCL. These indemnification agreements require it, among other things, to indemnify its directors and officers against liabilities that may arise by reason of their status or service as directors or officers, other than liabilities arising from willful misconduct. These indemnification agreements also require it to advance any expenses incurred by the directors or officers as a result of any proceeding against them as to which they could be indemnified and to obtain directors’ and officers’ insurance, if available on reasonable terms. See “Certain Relationships and Related Party Transactions—Indemnification Agreements”.
The limitation of liability and indemnification provisions in the amended and restated certificate of incorporation and amended and restated bylaws of Global Brass and Copper Holdings may discourage stockholders from bringing a lawsuit against directors for breach of their fiduciary duty. These provisions may also have the effect of reducing the likelihood of derivative litigation against directors and officers, even though such an action, if successful, might otherwise benefit us and our stockholders.
Currently, to our knowledge, there is no pending litigation or proceeding involving any of our directors, officers, employees or agents in which indemnification by us is sought, nor are we aware of any threatened litigation or proceeding that may result in a claim for indemnification.
Insofar as indemnification for liabilities arising under the Securities Act may be permitted for our directors, officers and controlling persons under the foregoing provisions or otherwise, we have been informed that, in the opinion of the SEC, such indemnification is against public policy as expressed in the Securities Act and is, therefore, unenforceable.
Transfer Agent and Registrar
The transfer agent and registrar for our common stock will be American Stock Transfer & Trust Company, LLC.
New York Stock Exchange Listing
We have been approved to list our common stock on the NYSE under the symbol “BRSS”.
184
Table of Contents
DESCRIPTION OF CERTAIN INDEBTEDNESS
ABL Facility
In November 2007, we entered into the 2007 ABL Facility, and in August 2010, we entered into the 2010 ABL Facility, amending and restating the 2007 ABL Facility. On June 1, 2012, we entered into an amendment to the 2010 ABL Facility. See “Prospectus Summary—Recent Transactions—Amendment of the ABL Facility.”
Outstanding borrowings under the ABL Facility bear interest at a rate equal to either:
| • | a base rate plus a margin between 2.0% and 2.5%, depending on excess availability levels, for base rate loans, or |
| • | LIBOR plus a margin of 3.0% to 3.5%, depending on excess availability levels for Eurodollar loans. |
As of March 31, 2013, outstanding borrowings under the ABL Facility bore interest at a rate of 4.25% per year.
Global Brass and Copper Holdings is a guarantor of the ABL Facility and substantially all of its wholly owned domestic subsidiaries are borrowers under, or guarantors of, the ABL Facility. The ABL Facility is available on a revolving basis until its June 1, 2017 maturity date. Availability under the ABL Facility is based on a formula that is based on eligible inventory and eligible accounts receivable, subject to certain reserves and various adjustments. A portion of the funds available under the ABL Facility not in excess of $40.0 million is available for the issuance of letters of credit. As of March 31, 2013, maximum availability under the ABL Facility was $200.0 million, and remaining availability was $174.5 million, giving effect to $25.0 million of outstanding borrowings and to $0.5 million of outstanding letters of credit. In the event of increased commodity prices as indicated by the terms of the ABL Facility agreement, we may request, but the lenders are not obligated to, increase the maximum borrowings available up to $250.0 million. At any time, if the amount outstanding under the ABL Facility exceeds the maximum allowable borrowings, we are required to make a mandatory prepayment for the amount of the excess borrowings. The ABL Facility is secured by a first priority lien on accounts and inventory, and a second priority lien on all real estate, equipment and equity interests of the borrowers under, and guarantors of, the ABL Facility.
The agreement governing the ABL Facility restricts our ability to, among other things, incur indebtedness, grant liens, repurchase stock, pay cash dividends, make investments and acquisitions and sell assets, in each case subject to certain designated exceptions. In addition, the agreement governing the ABL Facility:
| • | requires us to maintain excess availability of not less than $10.0 million for any two consecutive-day period each year; |
| • | requires us to maintain a minimum fixed charge coverage ratio of 1.1:1 if our average excess availability for the prior five days is less than 10% of the maximum availability; and |
| • | requires us to apply substantially all cash collections to reduce outstanding borrowings under the ABL Facility when certain trigger events have occurred. |
The funds available under the ABL Facility may be used for working capital and for general corporate purposes. The ABL Facility contains customary event of default clauses and cross-default provisions with respect to our other outstanding indebtedness, including the Senior Secured Notes. Upon the occurrence of an event of default pursuant to the agreement governing the ABL Facility,
185
Table of Contents
lenders representing a majority of the commitments under the ABL Facility could require us to repay all outstanding borrowings under the ABL Facility, and during the continuance of an event of default we would not be able to make additional borrowings under the ABL Facility.
Senior Secured Notes
On June 1, 2012, Global Brass and Copper, Inc. issued $375.0 million in aggregate principal amount of 9.50% Senior Secured Notes due 2019. A portion of the net proceeds of the Senior Secured Notes was used in the Term Loan Refinancing. A portion of the net proceeds of the Senior Secured Notes was used to make the $160.0 million Parent Distribution to Halkos. The Senior Secured Notes are guaranteed by Global Brass and Copper Holdings, Inc., and substantially all of Global Brass and Copper, Inc.’s existing and future 100%-owned U.S. subsidiaries. The Senior Secured Notes are secured by a senior-priority security interest in our fixed assets (which secure the ABL Facility on a junior-priority basis) and by a junior-priority security interest in our accounts receivable and inventory (which secure the ABL Facility on a senior-priority basis).
The indenture governing the Senior Secured Notes contains covenants that limit our ability and the ability of restricted subsidiaries to, among other things, incur or guarantee additional debt or issue preferred stock, pay dividends, repurchase equity interests, repay subordinated indebtedness, make investments, create restrictions on the payment of dividends or other amounts to us from restricted subsidiaries, sell assets, including collateral, enter into transactions with affiliates, merge or consolidate with another person, sell or otherwise dispose of all or substantially all of our assets and create liens on our or the restricted subsidiaries’ assets to secure debt.
The Senior Secured Notes mature on June 1, 2019. Interest on the Senior Secured Notes accrues at the rate of 9.50% per annum and is payable semiannually in arrears on June 1 and December 1, commencing on December 1, 2012.
We are required to offer to redeem the Senior Secured Notes at a purchase price of 101% of their principal amount (plus accrued and unpaid interest) upon the occurrence of certain change of control events. In addition, upon the completion of certain asset dispositions, we may be required to offer to redeem the Senior Secured Notes at a purchase price of 100% of their principal amount (plus accrued and unpaid interest) if we do not apply the proceeds of such asset dispositions in accordance with the indenture by certain specified deadlines.
Pursuant to a registration rights agreement, dated as of June 1, 2012, we are required to effect a registered offer to issue new registered notes (with substantially the same terms as the Senior Secured Notes) in exchange for the Senior Secured Notes that Global Brass and Copper, Inc. issued in a private offering on June 1, 2012. If we do not cause the registration statement for the exchange offer to go effective within 365 days after June 1, 2012, or otherwise fail to comply with the other deadlines in the registration rights agreement, we will be required to pay additional interest on the Senior Secured Notes equal to 0.25% per annum for each 90 days we are in default, up to a maximum of 0.50% per annum.
186
Table of Contents
SHARES ELIGIBLE FOR FUTURE SALE
Prior to this offering, there has been no public market for our common stock. We cannot make any prediction as to the effect, if any, that sales of common stock or the availability of common stock for sale will have on the market price of our common stock. The market price of our common stock could decline because of the sale of a large number of shares of our common stock or the perception that such sales could occur. These factors could also make it more difficult to raise funds through future offerings of common stock. See “Risk Factors—Risks Related to an Investment in Our Common Stock and this Offering—Future sales of shares of our common stock in the public market could cause our stock price to fall significantly even if our business is profitable”.
Sale of Restricted Shares
Upon the completion of this offering, and after giving effect to the planned 211,100-to-1 stock split to be effected after the effective date of this registration statement and prior to the completion of this offering, we will have 21,110,000 shares of common stock outstanding, excluding 338,979 shares of common stock underlying outstanding equity awards. Of these shares, the 9,375,000 shares sold in this offering (or 10,781,000 shares if the underwriters exercise their option to purchase additional shares in full) will be freely tradable without restriction or further restriction under the Securities Act, except that any shares purchased by our affiliates, as that term is defined in Rule 144 under the Securities Act, may generally only be sold in compliance with the limitations of Rule 144 described below. As defined in Rule 144, an affiliate of an issuer is a person that directly, or indirectly through one or more intermediaries, controls, is controlled by or is under common control with the issuer. After this offering, and after giving effect to the planned 211,100-to-1 stock split to be effected after the effective date of this registration statement and prior to the completion of this offering, approximately 11,735,000 of our outstanding shares of common stock will be deemed “restricted securities,” as that term is defined under Rule 144 (10,329,000 shares, if the underwriters’ option to purchase additional shares is fully exercised). Restricted securities may be sold in the public market only if they qualify for an exemption from registration under Rule 144 or 701 under the Securities Act, which rules are summarized below, or any other applicable exemption under the Securities Act. Immediately following the consummation of the offering, all outstanding shares of common stock beneficially owned by Halkos will be subject to a 180-day underwriter “lock-up” period, which the underwriters are entitled to waive at their absolute discretion. The shares beneficially owned by Halkos will be otherwise transferable pursuant to Rule 144, subject to the volume and other restrictions of Rule 144.
Rule 144
The availability of Rule 144 will vary depending on whether restricted securities are held by an affiliate or a non-affiliate. In general, under Rule 144, an affiliate who has beneficially owned restricted securities within the meaning of Rule 144 for at least six months would be entitled to sell within any three-month period a number of shares that does not exceed the greater of one percent of the then outstanding shares of our common stock or the average weekly trading volume of our common stock reported through the NYSE during the four calendar weeks preceding such sale. Sales under Rule 144 are also subject to certain manner of sale provisions, notice requirements and the availability of current public information about us. The volume limitations, manner of sale and notice provisions described above will not apply to sales by non-affiliates. For purposes of Rule 144, a non-affiliate is any person or entity who is not our affiliate at the time of sale and has not been our affiliate during the preceding three months. A non-affiliate who has beneficially owned restricted securities for six months may rely on Rule 144 provided that certain public information regarding us is available. A non-affiliate who has beneficially owned the restricted securities proposed to be sold for at least one year will not be subject to any restrictions under Rule 144.
187
Table of Contents
Rule 701
Securities issued in reliance on Rule 701 under the Securities Act are also restricted and may be sold by stockholders other than our affiliates subject only to the manner of sale provisions of Rule 144 and by affiliates under Rule 144 without compliance with its one year holding period requirement.
Options/Equity Awards
We intend to file a registration statement under the Securities Act to register 1,111,053 shares of common stock reserved for issuance under our 2013 Plan (which amount of shares gives effect to the planned 211,100-to-1 stock split to be effected after the effective date of this registration statement and prior to the completion of this offering). Immediately after the offering, after giving effect to the IPO Equity Grants, there will be 104,444 options outstanding under our 2013 Plan to purchase a total of 104,444 shares of our common stock, of which no options will be immediately exercisable. Shares issued upon the exercise of stock options after the effective date of the registration statement will be eligible for resale in the public market without restriction, subject to Rule 144 limitations applicable to affiliates and the lock-up agreements described below.
Lock-up Agreements
We and each of our executive officers, directors and the selling stockholder have agreed with the underwriters, that for a period of 180 days after the date of this prospectus, we or they will not offer, sell, assign, transfer, pledge, contract to sell or otherwise dispose of or hedge any shares of our common stock, or any options or warrants to purchase any shares of our common stock or any securities convertible into or exchangeable for shares of common stock, subject to specified exceptions. The representatives of the underwriters may, in their discretion, release all or any portion of the shares from the restrictions in any such agreement. See “Underwriting” for additional information regarding such agreements and the exceptions thereto.
Registration Rights
We intend to enter into an investor rights agreement with the selling stockholder which will provide the selling stockholder with registration rights with respect to the additional shares of our common stock it will hold after the completion of this offering. This agreement will not provide for any maximum cash penalties nor any penalties connected with delays in registering our common stock. See “Certain Relationships and Related Party Transactions—Investor Rights Agreement” for additional information.
188
Table of Contents
MATERIAL UNITED STATES FEDERAL INCOME TAX
CONSEQUENCES FOR NON-U.S. HOLDERS
The following is a discussion of the material U.S. Federal income tax consequences of the acquisition, ownership and disposition of common stock by Non-U.S. Holders (as defined below) that acquire common stock pursuant to this offering and that hold such shares as capital assets (generally, for investment). This discussion is not a complete analysis or listing of all of the possible tax consequences of such transactions and does not address all tax considerations that might be relevant to particular holders in light of their personal circumstances or to persons that are subject to special tax rules. In addition, this description of the material U.S. Federal income tax consequences does not address the tax treatment of special classes of Non-U.S. Holders, such as:
| • | financial institutions |
| • | regulated investment companies |
| • | real estate investment trusts |
| • | tax-exempt entities |
| • | insurance companies |
| • | persons holding the shares as part of a hedging, integrated or conversion transaction, constructive sale or “straddle” |
| • | persons who acquired common stock through the exercise or cancellation of employee stock options or otherwise as compensation for their services |
| • | U.S. expatriates |
| • | persons subject to the alternative minimum tax |
| • | dealers or traders in securities or currencies. |
This summary does not address estate and gift tax consequences (except to the extent specifically provided herein) or tax consequences under any state, local or foreign laws.
For purposes of this section, you are a “U.S. Holder” if you are: (1) an individual citizen of the United States or a resident alien of the United States as determined for U.S. Federal income tax purposes; (2) a corporation (or other entity treated as a corporation for U.S. Federal income tax purposes) created or organized under the laws of the United States or any state thereof or the District of Columbia; (3) an estate the income of which is subject to U.S. Federal income taxation regardless of its source; or (4) a trust (A) if a court within the United States is able to exercise primary jurisdiction over its administration and one or more U.S. persons have authority to control all substantial decisions of the trust or (B) that has a valid election in effect under applicable Treasury regulations to be treated as a U.S. person.
The term “Non-U.S. Holder” means any Holder of our common stock that is neither a U.S. Holder nor a partnership (including for this purpose any entity that is treated as a partnership for U.S. Federal income tax purposes).
If a partnership or other pass-through entity is a beneficial owner of our common stock, the tax treatment of a partner or other owner will generally depend upon the status of the partner (or other owner) and the activities of the entity. If you are a partner (or other owner) of a pass-through entity that acquires our common stock, you should consult your tax advisor regarding the tax consequences of acquiring, owning and disposing of our common stock.
189
Table of Contents
The following discussion is based upon the Internal Revenue Code of 1986, as amended (the “Code”), U.S. judicial decisions, administrative pronouncements and existing and proposed Treasury regulations, all as in effect as of the date hereof. All of the preceding authorities are subject to change, possibly with retroactive effect, which may result in U.S. Federal income tax consequences different from those discussed below. We have not requested, and will not request, a ruling from the U.S. Internal Revenue Service (the “IRS”) with respect to any of the U.S. Federal income tax consequences described below, and as a result there can be no assurance that the IRS will not disagree with or challenge any of the conclusions we have reached and describe herein.
The following discussion is for general information only and is not intended to be, nor should it be construed to be, legal or tax advice to any holder or prospective holder of our common stock and no opinion or representation with respect to the U.S. Federal income tax consequences to any such holder or prospective holder is made. Prospective purchasers are urged to consult their tax advisors as to the particular consequences to them under U.S. Federal, state and local, and applicable foreign tax laws of the acquisition, ownership and disposition of our common stock.
Distributions
Distributions of cash or property that we pay in respect of our common stock will constitute dividends for U.S. Federal income tax purposes to the extent paid from our current or accumulated earnings and profits (as determined under U.S. Federal income tax principles). Distributions of cash and property that constitute dividends for U.S. Federal income tax purposes generally will be subject to U.S. Federal withholding at a thirty percent (30%) rate unless a reduced rate is prescribed by an applicable income tax treaty. If the amount of the distribution exceeds our current and accumulated earnings and profits, such excess first will be treated as a return of capital to the extent of your tax basis in our common stock, and thereafter will be treated as capital gain. However, except to the extent that we elect (or the paying agent or other intermediary through which you hold your common stock elects) otherwise, we (or the intermediary) must generally withhold on the entire distribution, in which case you would be entitled to a refund from the IRS for the withholding tax on the portion of the distribution that exceeded our current and accumulated earnings and profits.
Subject to the discussion of FATCA below, in order to obtain a reduced rate of U.S. Federal withholding tax under an applicable income tax treaty, you will be required to provide a properly executed IRS Form W-8BEN (or successor form) certifying your entitlement to benefits under the treaty. If you are eligible for a reduced rate of U.S. Federal withholding tax under an income tax treaty, you may obtain a refund or credit of any excess amounts withheld by filing an appropriate claim for a refund with the IRS. You are urged to consult your own tax advisor regarding your possible entitlement to benefits under an income tax treaty.
Sale, Exchange or Other Taxable Disposition of Common Stock
Subject to the discussion below concerning backup withholding and FATCA, you generally will not be subject to U.S. Federal income or withholding tax in respect of any gain on a sale, exchange or other disposition of our common stock unless:
| • | the gain is U.S. trade or business income, in which case, such gain will be taxed as described in “U.S. Trade or Business Income,” below; |
| • | you are an individual who is present in the United States for 183 or more days in the taxable year of the disposition and certain other conditions are met, in which case you will be subject to U.S. Federal income tax at a rate of 30% (or a reduced rate under an applicable tax treaty) on the amount by which certain capital gains allocable to U.S. sources exceed certain capital losses allocable to U.S. sources; or |
190
Table of Contents
| • | we are or have been a “U.S. real property holding corporation” (a “USRPHC”) under section 897 of the Code at any time during the shorter of the five-year period ending on the date of the disposition and your holding period for the common stock, in which case, subject to the exception set forth in the second sentence of the next paragraph, such gain will be subject to U.S. Federal income tax in the same manner as U.S. trade or business income. |
In general, a corporation is a USRPHC if the fair market value of its “U.S. real property interests” equals or exceeds 50% of the sum of the fair market value of its worldwide real property interests and its other assets used or held for use in a trade or business. In the event that we are determined to be a USRPHC, gain will not be subject to tax as U.S. trade or business income if your holdings (direct and indirect) at all times during the applicable period constituted 5% or less of our common stock, provided that our common stock was regularly traded on an established securities market during such period. We believe that we are not currently, and we do not anticipate becoming in the future, a “U.S. real property holding corporation” for U.S. Federal income tax purposes.
U.S. Trade or Business Income
For purposes of this discussion, dividend income and gain on the sale, exchange or other taxable disposition of our common stock will be considered to be “U.S. trade or business income” if (A) such income or gain is (i) effectively connected with your conduct of a trade or business within the United States and (ii) if you are eligible for the benefits of an income tax treaty with the United States, attributable to a permanent establishment (or, if you are an individual, a fixed base) that you maintain in the United States or (B) we are or have been a USRPHC at any time during the shorter of the five-year period ending on the date of the disposition of your interest and your holding period for the common stock (subject to the exception set forth above in the second paragraph of “Sale, Exchange or Other Taxable Disposition of Common Stock)”. Generally, U.S. trade or business income is not subject to U.S. Federal withholding tax, provided that you comply with applicable certification and disclosure requirements, including providing a properly executed IRS Form W-8ECI (or successor form); instead, you are subject to U.S. Federal income tax on a net basis at regular U.S. Federal income tax rates (in the same manner as a U.S. person) on your U.S. trade or business income. If you are a corporation, any U.S. trade or business income that you receive may also be subject to a “branch profits tax” at a 30% rate, or at a lower rate prescribed by an applicable income tax treaty.
U.S. Federal Estate Tax
If you are an individual Non-U.S. Holder who is treated as the owner of or has made certain lifetime transfers of an interest in our common stock, you will be required to include the value thereof in your gross estate for U.S. Federal estate tax purposes, and you may be subject to U.S. Federal estate tax unless an applicable estate tax treaty provides otherwise.
Information Reporting and Backup Withholding Tax
We must annually report to the IRS and to each Non-U.S. Holder any dividend income that is subject to U.S. Federal withholding tax, or that is exempt from such withholding pursuant to an income tax treaty. Copies of these information returns may also be made available under the provisions of a specific treaty or agreement to the tax authorities of the country in which a Non-U.S. Holder resides. Under certain circumstances, the Code imposes a backup withholding obligation on certain reportable payments. Dividends paid to you will generally be exempt from backup withholding if you provide a properly executed IRS Form W-8BEN (or successor form) or otherwise establish an exemption and we do not have actual knowledge or reason to know that you are a U.S. person or that the conditions of such other exemption are not, in fact, satisfied.
191
Table of Contents
The payment of the proceeds from the disposition of our common stock to or through the U.S. office of any broker (U.S. or non-U.S.) will be subject to information reporting and possible backup withholding unless you certify as to your non-U.S. status under penalties of perjury or otherwise establish an exemption and the broker does not have actual knowledge or reason to know that you are a U.S. person or that the conditions of any other exemption are not, in fact, satisfied. The payment of proceeds from the disposition of our common stock to or through a non-U.S. office of a non-U.S. broker will not be subject to information reporting or backup withholding unless the non-U.S. broker has certain types of relationships with the United States (a “U.S. related financial intermediary”). In the case of the payment of proceeds from the disposition of our common stock to or through a non-U.S. office of a broker that is either a U.S. person or a U.S. related financial intermediary, the Treasury regulations require information reporting (but not backup withholding) on the payment unless the broker has documentary evidence in its files that the owner is a Non-U.S. Holder and the broker has no knowledge to the contrary. You are urged to consult your tax advisor on the application of information reporting and backup withholding in light of your particular circumstances.
Backup withholding is not an additional tax. Any amounts withheld under the backup withholding rules from a payment to you will be refunded or credited against your U.S. Federal income tax liability, if any, provided that the required information is furnished to the IRS.
FATCA
Pursuant to Code provisions commonly referred to as “FATCA”, foreign financial institutions (which include most hedge funds, private equity funds, mutual funds, securitization vehicles and any other investment vehicles regardless of their size) must comply with certain information reporting rules with respect to their U.S. account holders and investors or be subject to a 30% withholding tax with respect to “withholdable payments”. For this purpose, withholdable payments are U.S.-source payments otherwise subject to nonresident withholding tax and also include the entire gross proceeds from the sale of any equity or debt instruments of U.S. issuers. FATCA withholding tax will apply even if the payment would otherwise not be subject to U.S. nonresident withholding tax (e.g., because it is capital gain treated as foreign source income under the Code). This withholding obligation goes into effect on January 1, 2014 for payments of dividends on common stock of U.S. corporations and on January 1, 2017 for payments of gross proceeds from dispositions of common stock of such corporations. Any intergovernmental agreement between the United States and an applicable foreign country, or future Treasury regulations, may modify the FATCA reporting rules and withholding obligations.
FATCA withholding will not apply to withholdable payments made directly to foreign governments, international organizations, and foreign central banks of issue, and Treasury is authorized to provide additional exceptions.
Non-U.S. Holders are urged to consult with their own tax advisors regarding the effect, if any, of the FATCA provisions to them based on their particular circumstances.
Medicare Surtax on Investment Income
Certain persons, including individuals that do not qualify as “nonresident aliens” within the meaning of Section 7701(b)(1)(B) of the Code, as well as certain estates and trusts, are required to pay a 3.8% Medicare surtax on “net investment income” including, among other things, dividends and net gain from disposition of property (other than property held in a trade or business). Non-U.S. Holders are urged to consult with their own tax advisors regarding the effect, if any, of this tax on their ownership and disposition of our common stock.
192
Table of Contents
We, the selling stockholder and the underwriters named below have entered into an underwriting agreement with respect to the shares being offered. Subject to certain conditions, each underwriter has severally agreed to purchase the number of shares indicated in the following table (which amount of shares gives effect to the planned 211,100-to-1 stock split to be effected after the effective date of this registration statement and prior to the completion of this offering). Goldman, Sachs & Co. and Morgan Stanley & Co. LLC are the representatives of the underwriters.
| Underwriters |
Number of Shares | |||
| Goldman, Sachs & Co. |
||||
| Morgan Stanley & Co. LLC |
||||
| William Blair & Company, L.L.C. |
||||
| KeyBanc Capital Markets Inc. |
||||
|
|
|
|||
| Total |
9,375,000 | |||
The underwriters are committed to take and pay for all of the shares being offered, if any are taken, other than the shares covered by the option described below unless and until this option is exercised.
If the underwriters sell more shares than the total number set forth in the table above, the underwriters have an option to buy up to an additional 1,406,000 shares from the selling stockholder. They may exercise that option for 30 days. If any shares are purchased pursuant to this option, the underwriters will severally purchase shares in approximately the same proportion as set forth in the table above.
The following tables show the per share and total underwriting discounts and commissions to be paid to the underwriters by the selling stockholder. Such amounts are shown assuming both no exercise and full exercise of the underwriters’ option to purchase 1,406,000 additional shares.
Paid by the Selling Stockholder
| No Exercise | Full Exercise | |||||||
| Per Share |
$ | $ | ||||||
| Total |
$ | $ | ||||||
Shares sold by the underwriters to the public will initially be offered at the initial public offering price set forth on the cover of this prospectus. Any shares sold by the underwriters to securities dealers may be sold at a discount of up to $ per share from the initial public offering price. If all the shares are not sold at the initial public offering price, the representatives may change the offering price and the other selling terms. The offering of the shares by the underwriters is subject to receipt and acceptance and subject to the underwriters’ right to reject any order in whole or in part.
The selling stockholder may be deemed an “underwriter” within the meaning of Section 2(11) of the Securities Act. The selling stockholder represented to us at the time of its purchase of our common stock that such purchase was made for investment purposes and not with a view towards distribution.
We have agreed with the underwriters, subject to certain exceptions, not to offer, sell, contract to sell, pledge, grant any option to purchase, make any short sale or otherwise dispose of, any of our securities that are substantially similar to the shares of our common stock, including but not limited to any options or warrants to purchase shares of our common stock or any securities that are convertible into or exchangeable for, or that represent the right to receive, our common stock or any such substantially similar securities (other than pursuant to employee stock option plans existing on the date
193
Table of Contents
hereof, or upon the conversion or exchange of convertible or exchangeable securities issued pursuant to such employee stock plans or outstanding as of the date of this prospectus), during the period from the date of this prospectus continuing through the date 180 days after the date of this prospectus, without the prior written consent of the representatives of the underwriters. This agreement does not apply to any existing employee benefit plans. See “Shares Eligible for Future Sale” for a discussion of certain transfer restrictions.
Our executive officers, directors and the selling stockholder have agreed with the underwriters, subject to certain exceptions, not to offer, sell, contract to sell, pledge, grant any option to purchase, make any short sale or otherwise dispose of or hedge any of their shares of our common stock or any options or warrants to purchase any shares of our common stock or any securities convertible into or exchangeable for or that represent the right to receive shares of our common stock during the period from the date of this prospectus continuing through the date 180 days after the date of this prospectus, except with the prior written consent of the representatives of the underwriters. The foregoing restrictions shall not apply to (a) bona fide gifts, (b) dispositions to any trust for the direct or indirect benefit of the applicable officer, director or selling stockholder or such person’s immediate family, (c) transfers in response to a bona fide third party take-over bid made to all holders of shares of our common stock or any other acquisition transaction whereby all or substantially all of the shares of our common stock are acquired by a bona fide third party, (d) if the party to such agreement is a corporation, limited partnership, limited liability company or other entity, transfers of our common stock by such entity to its partners, members, stockholders or other affiliates, or any wholly owned subsidiary of such entity, or (e) sales of shares of our common stock purchased by such executive officer, director or the selling stockholder in open market transactions following the completion of this offering. For purposes of this paragraph, “immediate family” means any relationship by blood, marriage or adoption, not more remote than first cousin. See “Shares Eligible for Future Sale” for a discussion of certain transfer restrictions.
The 180-day restricted period described in the preceding paragraph will be automatically extended if: (1) during the last 17 days of the 180-day restricted period we issue an earnings release or announce material news or a material event; or (2) prior to the expiration of the 180-day restricted period, we announce that we will release earnings results during the 15-day period following the last day of the 180-day period, in which case the restrictions described in the preceding paragraph will continue to apply until the expiration of the 18-day period beginning on the issuance of the earnings release of the announcement of the material news or material event.
Prior to this offering, there has been no public market for the shares. The initial public offering price has been negotiated among us, the selling stockholder and the representatives. Among the factors to be considered in determining the initial public offering price of the shares, in addition to prevailing market conditions, will be the company’s historical performance, estimates of the business potential and earnings prospects of our company, an assessment of our company’s management and the consideration of the above factors in relation to market valuation of companies in related businesses.
We have been approved to list our common stock on the NYSE under the symbol “BRSS”. In order to meet one of the requirements for listing our common stock on the NYSE, the underwriters have undertaken to sell lots of 100 or more shares to a minimum of 400 beneficial holders.
In connection with the offering, the underwriters may purchase and sell shares of our common stock in the open market. These transactions may include short sales, stabilizing transactions and purchases to cover positions created by short sales. Short sales involve the sale by the underwriters of a greater number of shares than they are required to purchase in the offering. “Covered” short sales are sales made in an amount not greater than the underwriters’ option to purchase additional shares
194
Table of Contents
from the selling stockholder in the offering. The underwriters may close out any covered short position by either exercising their option to purchase additional shares or purchasing shares in the open market. In determining the source of shares to close out the covered short position, the underwriters will consider, among other things, the price of shares available for purchase in the open market as compared to the price at which they may purchase additional shares pursuant to the option granted to them. “Naked” short sales are any sales in excess of such option. The underwriters must close out any naked short position by purchasing shares in the open market. A naked short position is more likely to be created if the underwriters are concerned that there may be downward pressure on the price of the common stock in the open market after pricing that could adversely affect investors who purchase in the offering. Stabilizing transactions consist of various bids for or purchases of our common stock made by the underwriters in the open market prior to the completion of the offering.
The underwriters may also impose a penalty bid. This occurs when a particular underwriter repays to the underwriters a portion of the underwriting discount received by it because the representatives have repurchased shares sold by or for the account of such underwriter in stabilizing or short covering transactions.
Purchases to cover a short position and stabilizing transactions, as well as other purchases by the underwriters for their own accounts, may have the effect of preventing or retarding a decline in the market price of the company’s stock, and together with the imposition of the penalty bid, may stabilize, maintain or otherwise affect the market price of our common stock. As a result, the price of our common stock may be higher than the price that otherwise might exist in the open market. If these activities are commenced, they may be discontinued at any time. These transactions may be effected on the NYSE, in the over-the-counter market or otherwise.
At our request, the underwriters have reserved five percent of the shares of common stock offered by this prospectus for sale, at the initial public offering price, to directors, officers, employees, business associates and related persons of Global Brass and Copper Holdings, Inc. The number of shares of common stock available for sale to the general public will be reduced to the extent these individuals purchase such reserved shares. Any reserved shares that are not so purchased will be offered by the underwriters to the general public on the same basis as the other shares offered by this prospectus.
European Economic Area
In relation to each Member State of the European Economic Area which has implemented the Prospectus Directive (each, a Relevant Member State), each underwriter has represented and agreed that with effect from and including the date on which the Prospectus Directive is implemented in that Relevant Member State (the Relevant Implementation Date) it has not made and will not make an offer of shares to the public in that Relevant Member State prior to the publication of a prospectus in relation to the shares which has been approved by the competent authority in that Relevant Member State or, where appropriate, approved in another Relevant Member State and notified to the competent authority in that Relevant Member State, all in accordance with the Prospectus Directive, except that it may, with effect from and including the Relevant Implementation Date, make an offer of shares to the public in that Relevant Member State at any time:
| (a) | to legal entities which are authorised or regulated to operate in the financial markets or, if not so authorised or regulated, whose corporate purpose is solely to invest in securities; |
| (b) | to any legal entity which has two or more of (1) an average of at least 250 employees during the last financial year; (2) a total balance sheet of more than €43,000,000 and (3) an annual net turnover of more than €50,000,000, as shown in its last annual or consolidated accounts; |
195
Table of Contents
| (c) | to fewer than 100 natural or legal persons (other than qualified investors as defined in the Prospectus Directive) subject to obtaining the prior consent of the representatives for any such offer; or |
| (d) | in any other circumstances which do not require the publication by the Issuer of a prospectus pursuant to Article 3 of the Prospectus Directive. |
For the purposes of this provision, the expression an “offer of shares to the public” in relation to any shares in any Relevant Member State means the communication in any form and by any means of sufficient information on the terms of the offer and the shares to be offered so as to enable an investor to decide to purchase or subscribe the shares, as the same may be varied in that Relevant Member State by any measure implementing the Prospectus Directive in that Relevant Member State and the expression Prospectus Directive means Directive 2003/71/EC and includes any relevant implementing measure in each Relevant Member State.
Each underwriter has represented and agreed that:
| (a) | it has only communicated or caused to be communicated and will only communicate or cause to be communicated an invitation or inducement to engage in investment activity (within the meaning of Section 21 of the FSMA) received by it in connection with the issue or sale of the shares of common stock in circumstances in which Section 21(1) of the FSMA does not apply to us; and |
| (b) | it has complied and will comply with all applicable provisions of the FSMA with respect to anything done by it in relation to the shares in, from or otherwise involving the United Kingdom. |
The shares may not be offered or sold by means of any document other than (i) in circumstances which do not constitute an offer to the public within the meaning of the Companies Ordinance (Cap.32, Laws of Hong Kong), or (ii) to “professional investors” within the meaning of the Securities and Futures Ordinance (Cap.571, Laws of Hong Kong) and any rules made thereunder, or (iii) in other circumstances which do not result in the document being a “prospectus” within the meaning of the Companies Ordinance (Cap.32, Laws of Hong Kong), and no advertisement, invitation or document relating to the shares may be issued or may be in the possession of any person for the purpose of issue (in each case whether in Hong Kong or elsewhere), which is directed at, or the contents of which are likely to be accessed or read by, the public in Hong Kong (except if permitted to do so under the laws of Hong Kong) other than with respect to shares which are or are intended to be disposed of only to persons outside Hong Kong or only to “professional investors” within the meaning of the Securities and Futures Ordinance (Cap. 571, Laws of Hong Kong) and any rules made thereunder.
This prospectus has not been registered as a prospectus with the Monetary Authority of Singapore. Accordingly, this prospectus and any other document or material in connection with the offer or sale, or invitation for subscription or purchase, of the shares may not be circulated or distributed, nor may the shares be offered or sold, or be made the subject of an invitation for subscription or purchase, whether directly or indirectly, to persons in Singapore other than (i) to an institutional investor under Section 274 of the Securities and Futures Act, Chapter 289 of Singapore (the “SFA”), (ii) to a relevant person, or any person pursuant to Section 275(1A), and in accordance with the conditions, specified in Section 275 of the SFA or (iii) otherwise pursuant to, and in accordance with the conditions of, any other applicable provision of the SFA.
Where the shares are subscribed or purchased under Section 275 by a relevant person which is: (a) a corporation (which is not an accredited investor) the sole business of which is to hold investments and the entire share capital of which is owned by one or more individuals, each of whom is an accredited investor; or (b) a trust (where the trustee is not an accredited investor) whose sole purpose
196
Table of Contents
is to hold investments and each beneficiary is an accredited investor, shares, debentures and units of shares and debentures of that corporation or the beneficiaries’ rights and interest in that trust shall not be transferable for 6 months after that corporation or that trust has acquired the shares under Section 275 except: (1) to an institutional investor under Section 274 of the SFA or to a relevant person, or any person pursuant to Section 275(1A), and in accordance with the conditions, specified in Section 275 of the SFA; (2) where no consideration is given for the transfer; or (3) by operation of law.
The securities have not been and will not be registered under the Financial Instruments and Exchange Law of Japan (the Financial Instruments and Exchange Law) and each underwriter has agreed that it will not offer or sell any securities, directly or indirectly, in Japan or to, or for the benefit of, any resident of Japan (which term as used herein means any person resident in Japan, including any corporation or other entity organized under the laws of Japan), or to others for re-offering or resale, directly or indirectly, in Japan or to a resident of Japan, except pursuant to an exemption from the registration requirements of, and otherwise in compliance with, the Financial Instruments and Exchange Law and any other applicable laws, regulations and ministerial guidelines of Japan.
The underwriters do not expect sales to discretionary accounts to exceed five percent of the total number of shares offered.
The company and the selling stockholder estimate that their share of the total expenses of the offering, excluding underwriting discounts and commissions, will be approximately $4.6 million.
The company and the selling stockholder have agreed to indemnify the several underwriters against certain liabilities, including liabilities under the Securities Act of 1933.
The underwriters and their respective affiliates are full service financial institutions engaged in various activities, which may include securities trading, commercial and investment banking, financial advisory, investment management, investment research, principal investment, hedging, financing and brokerage activities. Certain of the underwriters and their respective affiliates have, from time to time, performed, and may in the future perform, various financial advisory and investment banking services for the issuer, for which they received or will receive customary fees and expenses.
In the ordinary course of their various business activities, the underwriters and their respective affiliates may make or hold a broad array of investments, including serving as counterparties to certain derivative and hedging arrangements, and actively trade debt and equity securities (or related derivative securities) and financial instruments (including bank loans) for their own account and for the accounts of their customers, and such investment and securities activities may involve securities and/or instruments of the issuer. The underwriters and their respective affiliates may also make investment recommendations and/or publish or express independent research views in respect of such securities or instruments and may at any time hold, or recommend to clients that they acquire, long and/or short positions in such securities and instruments.
197
Table of Contents
Paul, Weiss, Rifkind, Wharton & Garrison LLP, New York, New York, will pass on the validity of the common stock offered by this prospectus for us and the selling stockholder. Paul, Weiss, Rifkind, Wharton & Garrison LLP has represented KPS and its related parties from time to time in various matters. The underwriters have been represented by Cravath, Swaine & Moore LLP, New York, New York.
The consolidated financial statements of Global Brass and Copper Holdings, Inc. as of December 31, 2012 and 2011 and for each of the three years in the period ended December 31, 2012 included in this prospectus have been so included in reliance on the report of PricewaterhouseCoopers LLP, an independent registered public accounting firm, given on the authority of said firm as experts in auditing and accounting.
After we complete this offering, we will become subject to the informational requirements of the Exchange Act and will file annual, quarterly and current reports and other information with the SEC. We have also filed with the SEC a registration statement on Form S-1 with respect to the common stock being sold in this offering. This prospectus constitutes a part of that registration statement. This prospectus does not contain all the information set forth in the registration statement and the exhibits and schedules to the registration statement because some parts have been omitted in accordance with the rules and regulations of the SEC. For further information with respect to us and our common stock being sold in this offering, you should refer to the registration statement and the exhibits and schedules filed as part of the registration statement. Statements contained in this prospectus regarding the contents of any agreement, contract or other document referred to are not necessarily complete. Reference is made in each instance to the copy of the actual contract or other document filed as an exhibit to the registration statement. Each statement is qualified by reference to the exhibit. You may inspect a copy of the registration statement and its exhibits and schedules without charge at the SEC’s principal office in Washington, D.C. and at the SEC’s website referred to below. Copies of all or any part of the registration statement may be obtained after payment of fees prescribed by the SEC from the SEC’s Public Reference Room at the SEC’s principal office, at 100 F Street, N.E., Washington, D.C. 20549.
You may obtain information regarding the operation of the Public Reference Room by calling the SEC at 1-800-SEC-0330. The SEC maintains an Internet site that contains reports, proxy and information statements, including a copy of the registration statement of which this prospectus constitutes a part and its exhibits and schedules, and other information regarding registrants that file electronically with the SEC. The SEC’s website address is www.sec.gov.
198
Table of Contents
INDEX TO CONSOLIDATED FINANCIAL STATEMENTS
Unaudited Financial Statements
Audited Financial Statements
F-1
Table of Contents
Global Brass and Copper Holdings, Inc.
Consolidated Balance Sheets (Unaudited)
| As of | ||||||||
| (In thousands, except share and per share data) | March 31, 2013 |
December 31, 2012 |
||||||
| Assets |
||||||||
| Current assets: |
||||||||
| Cash |
$ | 15,785 | $ | 13,862 | ||||
| Accounts receivable (net of allowance of $1,429 and $1,408 at March 31, 2013 and December 31, 2012, respectively) |
220,325 | 164,317 | ||||||
| Inventories |
185,491 | 174,378 | ||||||
| Prepaid expenses and other current assets |
16,452 | 12,141 | ||||||
| Deferred income taxes |
32,645 | 33,465 | ||||||
| Income tax receivable, net |
2,364 | 1,300 | ||||||
|
|
|
|
|
|||||
| Total current assets |
473,062 | 399,463 | ||||||
| Property, plant and equipment, net |
72,168 | 71,127 | ||||||
| Investment in joint venture |
2,394 | 2,972 | ||||||
| Goodwill |
4,399 | 4,399 | ||||||
| Intangible assets, net |
813 | 839 | ||||||
| Deferred income taxes |
6,407 | 6,138 | ||||||
| Other noncurrent assets |
17,213 | 17,755 | ||||||
|
|
|
|
|
|||||
| Total assets |
$ | 576,456 | $ | 502,693 | ||||
|
|
|
|
|
|||||
| Liabilities and deficit |
||||||||
| Current liabilities: |
||||||||
| Accounts payable |
$ | 118,985 | $ | 81,577 | ||||
| Accrued liabilities |
54,587 | 48,424 | ||||||
| Accrued interest |
12,211 | 3,287 | ||||||
| Income tax payable |
339 | 248 | ||||||
|
|
|
|
|
|||||
| Total current liabilities |
186,122 | 133,536 | ||||||
| Long-term debt |
400,000 | 389,522 | ||||||
| Other noncurrent liabilities |
27,349 | 27,436 | ||||||
|
|
|
|
|
|||||
| Total liabilities |
613,471 | 550,494 | ||||||
|
|
|
|
|
|||||
| Commitments and contingencies (Note 13) |
— | — | ||||||
| Global Brass and Copper Holdings, Inc. stockholder’s deficit: |
||||||||
| Common stock—$.01 par value; 200 shares authorized; |
||||||||
| 100 shares issued and outstanding at March 31, 2013 and December 31, 2012 |
— | — | ||||||
| Additional paid-in capital |
— | — | ||||||
| Accumulated deficit |
(36,554 | ) | (47,942 | ) | ||||
| Accumulated other comprehensive income |
1,076 | 1,466 | ||||||
| Receivable from stockholder |
(5,203 | ) | (4,875 | ) | ||||
|
|
|
|
|
|||||
| Total Global Brass and Copper Holdings, Inc. stockholder’s deficit |
(40,681 | ) | (51,351 | ) | ||||
| Noncontrolling interest |
3,666 | 3,550 | ||||||
|
|
|
|
|
|||||
| Total deficit |
(37,015 | ) | (47,801 | ) | ||||
|
|
|
|
|
|||||
| Total liabilities and deficit |
$ | 576,456 | $ | 502,693 | ||||
|
|
|
|
|
|||||
The accompanying notes are an integral part of these consolidated financial statements.
F-2
Table of Contents
Global Brass and Copper Holdings, Inc.
Consolidated Statements of Operations (Unaudited)
| Three Months Ended March 31, |
||||||||
| (In thousands, except share and per share data) | 2013 | 2012 | ||||||
| Net sales |
$ | 444,962 | $ | 443,391 | ||||
| Cost of sales |
398,046 | 393,437 | ||||||
|
|
|
|
|
|||||
| Gross profit |
46,916 | 49,954 | ||||||
| Selling, general and administrative expenses |
19,678 | 17,923 | ||||||
|
|
|
|
|
|||||
| Operating income |
27,238 | 32,031 | ||||||
| Interest expense |
9,875 | 9,749 | ||||||
| Other expense, net |
187 | 311 | ||||||
|
|
|
|
|
|||||
| Income before provision for income taxes and equity income |
17,176 | 21,971 | ||||||
| Provision for income taxes |
6,042 | 8,198 | ||||||
|
|
|
|
|
|||||
| Income before equity income |
11,134 | 13,773 | ||||||
| Equity income, net of tax |
352 | 274 | ||||||
|
|
|
|
|
|||||
| Net income |
11,486 | 14,047 | ||||||
| Less: Net income attributable to noncontrolling interest |
98 | 54 | ||||||
|
|
|
|
|
|||||
| Net income attributable to Global Brass and Copper Holdings, Inc. |
$ | 11,388 | $ | 13,993 | ||||
|
|
|
|
|
|||||
| Net income attributable to Global Brass and Copper Holdings, Inc. per common share: |
||||||||
| Basic |
$ | 113,880 | $ | 139,930 | ||||
| Weighted average common shares outstanding: |
||||||||
| Basic |
100 | 100 | ||||||
The accompanying notes are an integral part of these consolidated financial statements.
F-3
Table of Contents
Global Brass and Copper Holdings, Inc.
Consolidated Statements of Comprehensive Income (Unaudited)
| Three Months Ended March 31, |
||||||||
| (In thousands) | 2013 | 2012 | ||||||
| Net income |
$ | 11,486 | $ | 14,047 | ||||
| Other comprehensive (loss) income: |
||||||||
| Foreign currency translation adjustment |
(642 | ) | 23 | |||||
| Less: Income tax (benefit) expense on other comprehensive income |
(270 | ) | 3 | |||||
|
|
|
|
|
|||||
| Comprehensive income |
11,114 | 14,067 | ||||||
| Less: Comprehensive income attributable to noncontrolling interest |
116 | 71 | ||||||
|
|
|
|
|
|||||
| Comprehensive income attributable to Global Brass and Copper Holdings, Inc. |
$ | 10,998 | $ | 13,996 | ||||
|
|
|
|
|
|||||
The accompanying notes are an integral part of these consolidated financial statements.
F-4
Table of Contents
Global Brass and Copper Holdings, Inc.
Consolidated Statements of Changes in (Deficit) / Equity (Unaudited)
| (In thousands) | Common stock |
Additional paid-in capital |
Retained earnings |
Accumulated other comprehensive income |
Receivable from stockholder |
Total Global Brass and Copper Holdings, Inc. stockholder’s equity |
Noncontrolling interest |
Total equity |
||||||||||||||||||||||||
| Balance at December 31, 2011 |
$ | — | $ | 11,091 | $ | 68,929 | $ | 1,923 | $ | (2,451 | ) | 79,492 | $ | 3,168 | $ | 82,660 | ||||||||||||||||
| Amounts due from stockholder |
— | — | — | — | (241 | ) | (241 | ) | — | (241 | ) | |||||||||||||||||||||
| Net income |
— | — | 13,993 | — | — | 13,993 | 54 | 14,047 | ||||||||||||||||||||||||
| Other comprehensive income, net of tax |
— | — | — | 3 | — | 3 | 17 | 20 | ||||||||||||||||||||||||
|
|
|
|
|
|
|
|
|
|
|
|
|
|
|
|
|
|||||||||||||||||
| Balance at March 31, 2012 |
$ | — | $ | 11,091 | $ | 82,922 | $ | 1,926 | $ | (2,692 | ) | $ | 93,247 | $ | 3,239 | $ | 96,486 | |||||||||||||||
|
|
|
|
|
|
|
|
|
|
|
|
|
|
|
|
|
|||||||||||||||||
| (In thousands) | Common stock |
Additional paid-in capital |
Accumulated deficit |
Accumulated other comprehensive income |
Receivable from stockholder |
Total Global Brass and Copper Holdings, Inc. stockholder’s deficit |
Noncontrolling interest |
Total deficit |
||||||||||||||||||||||||
| Balance at December 31, 2012 |
$ | — | $ | — | $ | (47,942 | ) | $ | 1,466 | $ | (4,875 | ) | $ | (51,351 | ) | $ | 3,550 | $ | (47,801 | ) | ||||||||||||
| Amounts due from stockholder |
— | — | — | — | (328 | ) | (328 | ) | — | (328 | ) | |||||||||||||||||||||
| Net income |
— | — | 11,388 | — | — | 11,388 | 98 | 11,486 | ||||||||||||||||||||||||
| Other comprehensive (loss) income, net of tax |
— | — | — | (390 | ) | — | (390 | ) | 18 | (372 | ) | |||||||||||||||||||||
|
|
|
|
|
|
|
|
|
|
|
|
|
|
|
|
|
|||||||||||||||||
| Balance at March 31, 2013 |
$ | — | $ | — | $ | (36,554 | ) | $ | 1,076 | $ | (5,203 | ) | $ | (40,681 | ) | $ | 3,666 | $ | (37,015 | ) | ||||||||||||
|
|
|
|
|
|
|
|
|
|
|
|
|
|
|
|
|
|||||||||||||||||
The accompanying notes are an integral part of these consolidated financial statements.
F-5
Table of Contents
Global Brass and Copper Holdings, Inc.
Consolidated Statements of Cash Flows (Unaudited)
| Three Months Ended March 31, |
||||||||
| (In thousands) | 2013 | 2012 | ||||||
| Cash flows from operating activities |
||||||||
| Net income |
$ | 11,486 | $ | 14,047 | ||||
| Adjustments to reconcile net income to net cash (used in) provided by operating activities: |
||||||||
| Mark to market on commodity contracts |
21 | (1,313 | ) | |||||
| Mark to market on interest rate cap agreements |
1 | 134 | ||||||
| Depreciation |
1,883 | 1,490 | ||||||
| Amortization of intangible assets |
26 | 34 | ||||||
| Amortization of debt discount and issuance costs |
611 | 1,314 | ||||||
| Provision for bad debts, net of reductions |
65 | 84 | ||||||
| Deferred income taxes |
733 | 1,051 | ||||||
| Loss on sale of property, plant and equipment |
3 | 4 | ||||||
| Equity income, net of tax |
(352 | ) | (274 | ) | ||||
| Distributions from equity method investment |
— | 500 | ||||||
| Change in assets and liabilities: |
||||||||
| Accounts receivable |
(55,837 | ) | (41,861 | ) | ||||
| Inventories |
(10,850 | ) | 13,514 | |||||
| Prepaid expenses and other current assets |
(4,338 | ) | 4,913 | |||||
| Accounts payable |
37,433 | 33,510 | ||||||
| Accrued liabilities |
6,165 | 1,060 | ||||||
| Accrued interest |
8,924 | (345 | ) | |||||
| Income taxes, net |
(982 | ) | 3,441 | |||||
| Other, net |
(70 | ) | 454 | |||||
|
|
|
|
|
|||||
| Net cash (used in) provided by operating activities |
(5,078 | ) | 31,757 | |||||
| Cash flows from investing activities |
||||||||
| Capital expenditures |
(3,077 | ) | (3,726 | ) | ||||
| Proceeds from sale of property, plant and equipment |
157 | 5 | ||||||
|
|
|
|
|
|||||
| Net cash used in investing activities |
(2,920 | ) | (3,721 | ) | ||||
| Cash flows from financing activities |
||||||||
| Payments on term loan |
— | (825 | ) | |||||
| Borrowings on ABL Facility |
93,418 | 323 | ||||||
| Payments on ABL Facility |
(82,940 | ) | (318 | ) | ||||
| Amounts due from stockholder |
(328 | ) | (241 | ) | ||||
|
|
|
|
|
|||||
| Net cash provided by (used in) financing activities |
10,150 | (1,061 | ) | |||||
| Effect of foreign currency exchange rates |
(229 | ) | (125 | ) | ||||
|
|
|
|
|
|||||
| Net increase in cash |
1,923 | 26,850 | ||||||
| Cash at beginning of period |
13,862 | 49,537 | ||||||
|
|
|
|
|
|||||
| Cash at end of period |
$ | 15,785 | $ | 76,387 | ||||
|
|
|
|
|
|||||
The accompanying notes are an integral part of these consolidated financial statements.
F-6
Table of Contents
Global Brass and Copper Holdings, Inc.
Notes to Consolidated Financial Statements (Unaudited)
(All amounts in thousands, except per share data)
| 1. | Basis of Presentation and Principles of Consolidation |
Global Brass and Copper Holdings, Inc. (“Holdings” or the “Company”), an investee company of KPS Capital Partners, L.P. and its affiliates (“KPS”), was incorporated in Delaware, on October 10, 2007. KPS is the majority shareholder of Halkos Holdings, LLC (“Halkos”). Halkos owns 100% of Holdings. Holdings, through its wholly-owned principal operating subsidiary, Global Brass and Copper, Inc. (“GBC”), commenced commercial operations on November 19, 2007 through the acquisition of the metals business from Olin Corporation. GBC is a leading value added manufacturer, fabricator and distributor of specialty copper and brass products in North America.
The Company is operated and managed through three distinct divisions which are also the Company’s reportable segments: GBC Metals, LLC (“Olin Brass”), Chase Brass and Copper Company, LLC (“Chase”) and A.J. Oster, LLC (“Oster”).
Results of operations for the interim periods presented are not necessarily indicative of results which may be expected for any other interim period or for the year as a whole. There have been no significant changes to the Company’s significant accounting policies during the three months ended March 31, 2013. These interim financial statements should be read in conjunction with the December 31, 2012 consolidated financial statements of the Company.
The accompanying unaudited interim financial statements include all normal recurring adjustments which are, in the opinion of management, necessary to a fair statement of the results for the interim periods presented. The December 31, 2012 consolidated balance sheet data was derived from audited financial statements, but does not include all disclosures required by accounting principles generally accepted in the United States of America (“U.S. GAAP”). Certain information and footnote disclosures normally included in annual financial statements prepared in accordance with accounting principles generally accepted in the United States of America have been condensed or omitted.
These consolidated financial statements include the accounts of the Company, its wholly-owned subsidiaries and its majority-owned subsidiaries in which the Company has a controlling interest. All significant intercompany accounts and transactions relative to wholly- and majority-owned subsidiaries have been eliminated. The equity method is used to account for investments in affiliated companies, 20% to 50% owned where the Company does not hold a controlling voting interest and does not direct the matters that most significantly impact the investee’s operations.
The preparation of financial statements in conformity with accounting principles generally accepted in the United States of America requires management to make estimates and assumptions that affect the reported amounts of assets and liabilities and disclosure of contingent assets and liabilities at the date of the financial statements. In addition, it requires management to make estimates and assumptions that affect the reported amount of net sales and expenses during the reporting period. Actual amounts could differ from those estimates.
For the three months ended March 31, 2013 and 2012, non-toll net sales were $424,612 and $423,749, respectively. For the three months ended March 31, 2013 and 2012, toll net sales were $20,350 and $19,642, respectively.
F-7
Table of Contents
Global Brass and Copper Holdings, Inc.
Notes to Consolidated Financial Statements (Unaudited)
(All amounts in thousands, except per share data)
Revision of Prior Period Financial Statements
During 2012, the Company identified immaterial errors in previously issued consolidated financial statements related to the three months ended March 31, 2012 which were corrected in the year identified, including:
| 1. | An error in accounting for workers’ compensation insurance that was identified in the second quarter of fiscal 2012 resulted in accrued liabilities and cost of sales being understated by $298 as of and for the three months ended March 31, 2012. |
| 2. | An error in the accounting for raw material in-transit was identified in the third quarter of fiscal 2012. Inventory was overstated by $423 and $861 as of December 31, 2011 and March 31, 2012, respectively. Cost of sales was understated by $438 for the three months ended March 31, 2012, respectively. |
The Company assessed the materiality of all errors, individually and in the aggregate, on previously issued consolidated financial statements and concluded that the errors were not material to any of the Company’s previously issued quarterly or annual financial statements.
A summary of the revisions to the consolidated financial statements as of March 31, 2012 and for the three months ended March 31, 2012 is as follows:
| As Previously Reported |
Adjustment | As Revised | ||||||||||
| Consolidated Balance Sheet |
||||||||||||
| March 31, 2012 | ||||||||||||
| Accounts receivable, net of allowance |
$ | 202,756 | $ | 984 | $ | 203,740 | ||||||
| Inventories |
173,538 | (861 | ) | 172,677 | ||||||||
| Deferred income tax assets—current |
26,793 | 1,326 | 28,119 | |||||||||
| Income tax receivable |
1,567 | (162 | ) | 1,405 | ||||||||
| Total current assets |
496,052 | 1,287 | 497,339 | |||||||||
| Deferred income tax assets—noncurrent |
20,092 | (294 | ) | 19,798 | ||||||||
| Total assets |
593,912 | 993 | 594,905 | |||||||||
| Accounts payable |
111,814 | (389 | ) | 111,425 | ||||||||
| Income tax payable |
— | 64 | 64 | |||||||||
| Accrued liabilities |
47,080 | 1,284 | 48,364 | |||||||||
| Total current liabilities |
194,498 | 959 | 195,457 | |||||||||
| Total liabilities |
497,460 | 959 | 498,419 | |||||||||
| Retained earnings |
82,888 | 34 | 82,922 | |||||||||
| Total Global Brass and Copper Holdings, Inc. stockholder’s equity |
93,213 | 34 | 93,247 | |||||||||
| Total equity |
96,452 | 34 | 96,486 | |||||||||
| Total liabilities and equity |
593,912 | 993 | 594,905 | |||||||||
F-8
Table of Contents
Global Brass and Copper Holdings, Inc.
Notes to Consolidated Financial Statements (Unaudited)
(All amounts in thousands, except per share data)
| As Previously Reported |
Adjustment | As Revised | ||||||||||
| Consolidated Statement of Operations |
||||||||||||
| Three Months Ended March 31, 2012 | ||||||||||||
| Cost of sales |
$ | 392,701 | $ | 736 | $ | 393,437 | ||||||
| Gross profit |
50,690 | (736 | ) | 49,954 | ||||||||
| Operating income |
32,767 | (736 | ) | 32,031 | ||||||||
| Income before provision for income taxes and equity income |
22,707 | (736 | ) | 21,971 | ||||||||
| Provision for income taxes |
8,468 | (270 | ) | 8,198 | ||||||||
| Income before equity income |
14,239 | (466 | ) | 13,773 | ||||||||
| Net income |
14,513 | (466 | ) | 14,047 | ||||||||
| Net income attributable to Global Brass and Copper Holdings, Inc. |
14,459 | (466 | ) | 13,993 | ||||||||
| Net income attributable to Global Brass and Copper Holdings, Inc. per common share: |
||||||||||||
| Basic |
$ | 144,590 | $ | (4,660 | ) | $ | 139,930 | |||||
| Consolidated Statement of Comprehensive Income |
||||||||||||
| Three Months Ended March 31, 2012 | ||||||||||||
| Net income |
$ | 14,513 | $ | (466 | ) | $ | 14,047 | |||||
| Comprehensive income |
14,533 | (466 | ) | 14,067 | ||||||||
| Comprehensive income attributable to Global Brass and Copper Holdings, Inc. |
14,462 | (466 | ) | 13,996 | ||||||||
| Consolidated Statement of Changes in Equity |
||||||||||||
| Three Months Ended March 31, 2012 | ||||||||||||
| Net income |
$ | 14,513 | $ | (466 | ) | $ | 14,047 | |||||
| Net income attributable to Global Brass and Copper Holdings, Inc. |
14,459 | (466 | ) | 13,993 | ||||||||
| Retained earnings—Balance, March 31, 2012 |
82,888 | 34 | 82,922 | |||||||||
| Total Global Brass and Copper Holdings, Inc. stockholder’s equity—Balance, March 31, 2012 |
93,213 | 34 | 93,247 | |||||||||
| Total equity—Balance, March 31, 2012 |
96,452 | 34 | 96,486 | |||||||||
Recently Issued and Recently Adopted Accounting Pronouncements
In February 2013, the Financial Accounting Standards Board (“FASB”) issued Accounting Standards Update (“ASU”) 2013-02, Reporting of Amounts Reclassified Out of Accumulated Other Comprehensive Income. This guidance requires entities to provide disclosures about items that are required by U.S. GAAP to be reclassified from accumulated other comprehensive income (“AOCI”) to net income in their entirety in the same reporting period. The disclosure would include the amount of the reclassification and identify the line item on the statement where net income is presented that is affected by the reclassification. For other items reclassified from AOCI, the disclosure would list cross-references to other disclosures where additional details about their effects are disclosed. This guidance is effective for reporting periods beginning after December 15, 2012. The adoption of this guidance in the first quarter of 2013 did not have a material effect on the Company’s consolidated financial statements and disclosures.
F-9
Table of Contents
Global Brass and Copper Holdings, Inc.
Notes to Consolidated Financial Statements (Unaudited)
(All amounts in thousands, except per share data)
In December 2011, the FASB issued ASU 2011-11, Disclosures about Offsetting Assets and Liabilities. This guidance requires entities to disclose both gross and net information about both instruments and transactions eligible for offset in the statement of financial position and instruments and transactions subject to an agreement similar to a master netting arrangement. This guidance does not amend existing guidance on when it is appropriate to offset. In January 2013, the FASB issued ASU 2013-01, Clarifying the Scope of Disclosures about Offsetting Assets and Liabilities, which limits the scope of ASU 2011-11 to derivatives, repurchase agreements and reverse repurchase agreements, and securities borrowing and lending arrangements. The guidance is effective for annual periods beginning January 1, 2013 and interim periods within those annual periods. The Company adopted this guidance in the first quarter of 2013 and has included the required disclosures in note 10, “Derivative Contracts”.
| 2. | Inventories |
The Company’s inventories are as follows:
| As of | ||||||||
| March 31, 2013 |
December 31, 2012 |
|||||||
| Raw materials and supplies |
$ | 36,245 | $ | 37,766 | ||||
| Work-in-process |
80,262 | 69,286 | ||||||
| Finished goods |
68,984 | 67,326 | ||||||
|
|
|
|
|
|||||
| Total inventories |
$ | 185,491 | $ | 174,378 | ||||
|
|
|
|
|
|||||
Inventories include costs attributable to direct labor and manufacturing overhead but are primarily comprised of raw material costs. The material component of inventories that is valued on a last-in, first-out (“LIFO”) basis comprises approximately 71% and 70% of total inventory at March 31, 2013 and December 31, 2012, respectively. Other manufactured inventories, including the non-material components and certain non-U.S. inventories, are valued on a first-in, first-out (“FIFO”) basis.
If all inventories had been valued at period-end market values, inventories would have been approximately $299,481 and $319,282 at March 31, 2013 and December 31, 2012, respectively.
F-10
Table of Contents
Global Brass and Copper Holdings, Inc.
Notes to Consolidated Financial Statements (Unaudited)
(All amounts in thousands, except per share data)
| 3. | Prepaid Expenses and Other Current Assets |
The Company’s prepaid expenses and other current assets are as follows:
| As of | ||||||||
| March 31, 2013 |
December 31, 2012 |
|||||||
| Collateral on deposit—commodity derivative contracts |
$ | 444 | $ | 767 | ||||
| Commodity derivative contracts |
513 | 548 | ||||||
| Loss fund payments—workers’ compensation |
7,450 | 6,968 | ||||||
| Prepaid insurance |
1,819 | 1,261 | ||||||
| Prepaid tooling |
1,580 | 764 | ||||||
| Deferred expense |
3,064 | — | ||||||
| Other |
1,582 | 1,833 | ||||||
|
|
|
|
|
|||||
| Total prepaid expenses and other current assets |
$ | 16,452 | $ | 12,141 | ||||
|
|
|
|
|
|||||
| 4. | Goodwill |
On January 31, 2008, the Company, through its Chase reportable segment, acquired certain assets of the brass business of Bolton Metals Product Company (“Bolton”). As of March 31, 2013 and December 31, 2012, the carrying value of goodwill was $4,399. All goodwill is assigned to Chase, which is the Company’s applicable reporting unit for purposes of testing goodwill impairment. The Bolton acquisition is treated as an asset acquisition for tax purposes. As of March 31, 2013, $2,078 of goodwill is expected to be deductible for tax purposes.
| 5. | Investment in Joint Venture |
The Company owns a 50% interest in Dowa—Olin Metal Corporation (“Dowa”), a joint venture based in Japan. The Company accounts for Dowa under the equity method of accounting. Due to the timing of the receipt of available financial information, the results of Dowa are recorded on a one-month lag basis.
In November 2007, the equity investment in Dowa, which was purchased as part of the metals business acquired from Olin Corporation, was recorded at a carrying value of zero as a result of the bargain purchase event recognized under the purchase method of accounting for the acquisition, creating a negative basis difference of $9,416. Based on management’s estimate as to the underlying commercial utility of the alloys that Dowa manufactured and sold at the date of acquisition, the negative basis difference is being accreted on a straight-line basis over a 13-year period as an increase to equity earnings. Accretion of the negative basis difference of $181 was reflected in equity income, net of tax in the accompanying consolidated statements of operations for each of the three months ended March 31, 2013 and 2012. At March 31, 2013 and December 31, 2012, the remaining negative basis difference was $5,554 and $5,735, respectively.
No cash dividends were received from Dowa during the three months ended March 31, 2013. During the three months ended March 31, 2012, the Company received cash dividends from Dowa of $500, which were recorded as reduction in the Company’s investment in Dowa. During the three
F-11
Table of Contents
Global Brass and Copper Holdings, Inc.
Notes to Consolidated Financial Statements (Unaudited)
(All amounts in thousands, except per share data)
months ended March 31, 2013 and 2012, the Company recorded $352, and $274, respectively, of equity income, net of tax, including $181 of accretion of the negative basis difference in each period. The undistributed earnings of Dowa in GBC’s retained earnings as of March 31, 2013 December 31, 2012 totaled $414 and $62, respectively.
| 6. | Other Noncurrent Assets |
Other noncurrent assets consisted of the following:
| As of | ||||||||
| March 31, 2013 |
December 31, 2012 |
|||||||
| Deferred financing fees, net |
$ | 16,471 | $ | 17,082 | ||||
| Utility and other deposits |
742 | 668 | ||||||
| Interest rate cap agreements |
— | 1 | ||||||
| Other |
— | 4 | ||||||
|
|
|
|
|
|||||
| Total other noncurrent assets |
$ | 17,213 | $ | 17,755 | ||||
|
|
|
|
|
|||||
| 7. | Accrued Liabilities |
Accrued liabilities consisted of the following:
| As of | ||||||||
| March 31, 2013 |
December 31, 2012 |
|||||||
| Personnel expense |
$ | 25,616 | $ | 20,872 | ||||
| Workers’ compensation |
15,678 | 15,754 | ||||||
| Professional fees |
2,063 | 2,145 | ||||||
| Insurance |
1,913 | 2,253 | ||||||
| Utilities |
1,999 | 1,844 | ||||||
| Taxes |
1,044 | 1,745 | ||||||
| Deferred revenue |
3,970 | 686 | ||||||
| Other |
2,304 | 3,125 | ||||||
|
|
|
|
|
|||||
| Total accrued liabilities |
$ | 54,587 | $ | 48,424 | ||||
|
|
|
|
|
|||||
| 8. | Financing |
Long-term debt consisted of the following:
| As of | ||||||||
| March 31, 2013 |
December 31, 2012 |
|||||||
| ABL Facility |
$ | 25,000 | $ | 14,522 | ||||
| Senior Secured Notes |
375,000 | 375,000 | ||||||
|
|
|
|
|
|||||
| Total long-term debt |
$ | 400,000 | $ | 389,522 | ||||
|
|
|
|
|
|||||
F-12
Table of Contents
Global Brass and Copper Holdings, Inc.
Notes to Consolidated Financial Statements (Unaudited)
(All amounts in thousands, except per share data)
Senior Secured Notes
On June 1, 2012, GBC issued $375,000 in aggregate principal amount of 9.50% Senior Secured Notes due 2019 (the “Senior Secured Notes”). The Senior Secured Notes mature on June 1, 2019. Interest on the Senior Secured Notes accrues at the rate of 9.50% per annum and is payable semiannually in arrears on June 1 and December 1, commencing on December 1, 2012.
The credit agreement governing the ABL Facility (hereinafter defined) and the indenture governing the Senior Secured Notes limit the ability of Global Brass and Copper Inc. and its subsidiaries to dividend or distribute cash to Global Brass and Copper Holdings and to its equityholders, although ordinary course dividends and distributions to meet the limited holding company expenses and related obligations at Global Brass and Copper Holdings of up to $5 million per year are permitted under those agreements. Under the terms of the indenture governing the Senior Secured Notes, Global Brass and Copper Inc. is also permitted to dividend or distribute to Global Brass and Copper Holdings and its equityholders up to 50% of its Consolidated Net Income (as defined in the indenture governing the Senior Secured Notes) from April 1, 2012 to the end of Global Brass and Copper’s most recently ended fiscal quarter. All of the net assets of the subsidiaries are restricted except for $22,208, which are permitted dividend distributions under the Company’s indenture governing the Senior Secured Notes. As of March 31, 2013, the Company was in compliance with all of its covenants relating to the Senior Secured Notes.
Pursuant to a registration rights agreement, dated as of June 1, 2012, the Company is required to effect a registered offer to issue registered new notes (with substantially the same terms as the Senior Secured Notes) in exchange for the Senior Secured Notes that the Company issued in a private offering on June 1, 2012. If the Company does not cause the registration statement for the exchange offer to go effective within 365 days after June 1, 2012, or otherwise fails to comply with the other deadlines in the registration rights agreement, it will be required to pay additional interest on the Senior Secured Notes equal to 0.25% per annum for each 90 days it is in default, up to a maximum of 0.50% per annum.
ABL Facility
Concurrent with the issuance of the Senior Secured Notes, the Company amended the agreement governing its asset-based revolving loan facility (the “ABL Facility).
The unused portion of the ABL Facility was $174,500 and $184,978 as of March 31, 2013 and December 31, 2012, respectively. As of March 31, 2013 and December 31, 2012, amounts outstanding under the ABL Facility accrued interest at a rate of 4.25% and 4.50%, respectively.
The ABL Facility has an expiration date of June 1, 2017 and contains various debt covenants to which the Company is subject on an ongoing basis. As of March 31, 2013, the Company was in compliance with all of its covenants under the ABL Facility.
F-13
Table of Contents
Global Brass and Copper Holdings, Inc.
Notes to Consolidated Financial Statements (Unaudited)
(All amounts in thousands, except per share data)
| 9. | Income Taxes |
The effective income tax rate, which is provision for income taxes as a percentage of income before provision for income taxes and equity income, differs from the amount determined by applying the applicable U.S. statutory federal income tax rate to pretax results primarily as a result of the following:
| Three Months Ended March 31, |
||||||||
| 2013 | 2012 | |||||||
| Statutory provision rate |
35.0 | % | 35.0 | % | ||||
| Permanent differences and other items |
||||||||
| State tax provision |
3.3 | % | 3.9 | % | ||||
| Section 199 manufacturing credit |
(2.7 | %) | (2.8 | %) | ||||
| Re-rate of deferred taxes |
0.4 | % | — | |||||
| Other |
(0.8 | %) | 1.2 | % | ||||
|
|
|
|
|
|||||
| Effective income tax rate |
35.2 | % | 37.3 | % | ||||
|
|
|
|
|
|||||
At March 31, 2013 and December 31, 2012, the Company had $27,314 and $27,401 respectively, of unrecognized tax benefits, none of which would impact the effective tax rate, if recognized. Estimated interest and penalties related to the underpayment of income taxes were $1 and $19 for the three months ended March 31, 2013 and 2012, respectively, and are classified as a component of income tax expense in the accompanying consolidated statements of operations. Accrued interest and penalties as of March 31, 2013 and December 31, 2012 were $35 and $35, respectively, inclusive of the estimated interest and penalties mentioned above. The Company’s liability for uncertain tax positions of $27,349 and $27,436 at March 31, 2013 and December 31, 2012, respectively, are presented in other noncurrent liabilities.
The Company is subject to income taxation in several jurisdictions around the world. Resolution of the related tax positions through negotiations with relevant tax authorities or through litigation may take years to complete. Therefore, it is difficult to predict the timing for resolution of tax positions. However, the Company does not anticipate that the total amount of unrecognized tax benefits will increase or decrease significantly in the next twelve months. The Company’s U.S. federal returns and the majority of state returns for the period ended September 30, 2009 and all subsequent periods remain open for audit. The Company’s federal returns are currently under examination by the Internal Revenue Service for the periods ended September 30, 2009 through December 31, 2010. The Company believes it has adequately reserved for any potential tax exposures at March 31, 2013.
| 10. | Derivative Contracts |
The Company maintains a metal, natural gas and electricity pricing risk-management strategy that uses commodity derivative contracts to minimize significant, unanticipated gains or losses and cash fluctuations that may arise from volatility of the commodity indices.
The Company’s commodity derivative contracts consist of delivery contracts matched in quantity, price and maturity to firm price sales orders, in circumstances where physical firm price metal is unavailable, in order to protect sales margins from metal price fluctuations between the firm price sale order date and shipment date.
F-14
Table of Contents
Global Brass and Copper Holdings, Inc.
Notes to Consolidated Financial Statements (Unaudited)
(All amounts in thousands, except per share data)
The prices of natural gas and electricity can be particularly volatile. As a result, our natural gas and electricity costs may fluctuate dramatically. The Company attempts to mitigate short-term volatility in natural gas and electricity costs through the use of derivatives contracts in an effort to offset the effect of increasing costs.
The Company also utilized interest rate cap agreements in compliance with the requirement under its senior secured term loan credit facility (the “Term Loan Facility”) to provide that at least 50% of the term loan be subject to a fixed rate or interest rate protection for a period of not less than three years. In June 2012, the Term Loan Facility was repaid and retired. During 2010, the Company entered into three-year interest rate cap agreements that capped the interest rate on $300,000 of the aggregate principal outstanding. The interest rate cap agreements are not designated as an accounting hedge and changes in the fair value of the interest rate cap agreements are recorded as non-cash interest expense.
By using derivative contracts to limit exposures to fluctuations in metal, natural gas and electricity prices and interest rate movements, the Company exposes itself to credit risk and market risk. Credit risk is the risk that the counterparty might fail to fulfill its performance obligations under the terms of the derivative contract. Market risk is the risk that the value of a derivative instrument might be adversely affected by a change in commodity price or interest rates. The Company manages the market risk associated with derivative contracts by establishing and monitoring parameters that limit the types and degree of market risk that may be undertaken.
The Company only executes derivative instruments with counterparties with investment-grade credit ratings. These counterparties expose the Company to credit risk in the event of non-performance. The amount of such exposure is limited to the fair value of the derivative contract plus the unpaid portion of amounts due to the Company pursuant to terms of the derivative contracts, if any. If a downgrade in the credit rating of these counterparties occurs, management believes that this exposure is mitigated by provisions in the derivative arrangements which allow for the legal right of offset of any amounts due to the Company from the counterparties with any amounts payable to the counterparties by the Company.
F-15
Table of Contents
Global Brass and Copper Holdings, Inc.
Notes to Consolidated Financial Statements (Unaudited)
(All amounts in thousands, except per share data)
The fair values of derivative contracts in the consolidated balance sheet include the impact of netting derivative assets and liabilities when a legally enforceable master netting arrangement exists. The following tables summarize the gross amounts of recognized derivative assets and liabilities, the net amounts presented in the consolidated balance sheet, and the net amounts after deducting collateral that has been deposited with counterparties:
| As of March 31, 2013 | ||||||||||||||||||||||||
| Amounts Not Offset in the Consolidated Balance Sheet |
||||||||||||||||||||||||
| Gross Amounts of Recognized Assets |
Gross Amounts Offset in Consolidated Balance Sheet |
Net Amounts of Assets Presented in Consolidated Balance Sheet |
Financial Instruments |
Cash Collateral Received |
Net Amount |
|||||||||||||||||||
| Open metal contracts |
$ | 1,274 | $ | (1,002 | ) | $ | 272 | $ | — | $ | — | $ | 272 | |||||||||||
| (402 contracts) |
||||||||||||||||||||||||
| Open electricity contracts |
241 | — | 241 | — | — | 241 | ||||||||||||||||||
| (15 contracts) |
||||||||||||||||||||||||
| Interest rate cap agreements |
— | — | — | — | — | — | ||||||||||||||||||
| (2 contracts) |
||||||||||||||||||||||||
|
|
|
|
|
|
|
|
|
|
|
|
|
|||||||||||||
| Total |
$ | 1,515 | $ | (1,002 | ) | $ | 513 | $ | — | $ | — | $ | 513 | |||||||||||
|
|
|
|
|
|
|
|
|
|
|
|
|
|||||||||||||
| Consolidated balance sheet location: |
|
|||||||||||||||||||||||
| Prepaid expenses and other current assets |
|
$ | 513 | |||||||||||||||||||||
|
|
|
|||||||||||||||||||||||
| Total |
|
$ | 513 | |||||||||||||||||||||
|
|
|
|||||||||||||||||||||||
| Amounts Not Offset in the Consolidated Balance Sheet |
||||||||||||||||||||||||
| Gross Amounts of Recognized Liabilities |
Gross Amounts Offset in Consolidated Balance Sheet |
Net Amounts of Liabilities Presented in Consolidated Balance Sheet |
Financial Instruments |
Cash Collateral Deposited |
Net Amount |
|||||||||||||||||||
| Open metal contracts |
$ | 1,002 | $ | (1,002 | ) | $ | — | $ | — | $ | — | $ | — | |||||||||||
| (230 contracts) |
||||||||||||||||||||||||
|
|
|
|
|
|
|
|
|
|
|
|
|
|||||||||||||
| Total |
$ | 1,002 | $ | (1,002 | ) | $ | — | $ | — | $ | — | $ | — | |||||||||||
|
|
|
|
|
|
|
|
|
|
|
|
|
|||||||||||||
F-16
Table of Contents
Global Brass and Copper Holdings, Inc.
Notes to Consolidated Financial Statements (Unaudited)
(All amounts in thousands, except per share data)
Not included in the above table is $444 of collateral included in Prepaid Expenses and Other Current Assets, which is because collateral is limited to the net amounts of assets or liabilities presented in the consolidated balance sheet.
| As of December 31, 2012 | ||||||||||||||||||||||||
| Amounts Not Offset in the Consolidated Balance Sheet |
||||||||||||||||||||||||
| Gross Amounts of Recognized Assets |
Gross Amounts Offset in Consolidated Balance Sheet |
Net Amounts of Assets Presented in Consolidated Balance Sheet |
Financial Instruments |
Cash Collateral Received |
Net Amount |
|||||||||||||||||||
| Open metals contracts |
$ | 603 | $ | (224 | ) | $ | 379 | $ | — | $ | — | $ | 379 | |||||||||||
| (208 contracts) |
||||||||||||||||||||||||
| Open natural gas contracts |
2 | — | 2 | — | — | 2 | ||||||||||||||||||
| (6 contracts) |
||||||||||||||||||||||||
| Open electricity contracts |
169 | (2 | ) | 167 | — | — | 167 | |||||||||||||||||
| (17 contracts) |
||||||||||||||||||||||||
| Interest rate cap agreements |
1 | — | 1 | — | — | 1 | ||||||||||||||||||
| (2 contracts) |
||||||||||||||||||||||||
|
|
|
|
|
|
|
|
|
|
|
|
|
|||||||||||||
| Total |
$ | 775 | $ | (226 | ) | $ | 549 | $ | — | $ | — | $ | 549 | |||||||||||
|
|
|
|
|
|
|
|
|
|
|
|
|
|||||||||||||
| Consolidated balance sheet location: |
|
|||||||||||||||||||||||
| Prepaid expenses and other current assets |
|
$ | 548 | |||||||||||||||||||||
| Other noncurrent assets |
|
1 | ||||||||||||||||||||||
|
|
|
|||||||||||||||||||||||
| Total |
$ | 549 | ||||||||||||||||||||||
|
|
|
|||||||||||||||||||||||
| Amounts Not Offset in the Consolidated Balance Sheet |
||||||||||||||||||||||||
| Gross Amounts of Recognized Liabilities |
Gross Amounts Offset in Consolidated Balance Sheet |
Net Amounts of Liabilities Presented in Consolidated Balance Sheet |
Financial Instruments |
Cash Collateral Deposited |
Net Amount |
|||||||||||||||||||
| Open metals contracts |
$ | 224 | $ | (224 | ) | $ | — | $ | — | $ | — | $ | — | |||||||||||
| (85 contracts) |
||||||||||||||||||||||||
| Open electricity contracts |
2 | (2 | ) | — | — | — | — | |||||||||||||||||
| (1 contract) |
||||||||||||||||||||||||
|
|
|
|
|
|
|
|
|
|
|
|
|
|||||||||||||
| Total |
$ | 226 | $ | (226 | ) | $ | — | $ | — | $ | — | $ | — | |||||||||||
|
|
|
|
|
|
|
|
|
|
|
|
|
|||||||||||||
Not included in the above table is $767 of collateral included in Prepaid Expenses and Other Current Assets, which is because collateral is limited to the net amounts of assets or liabilities presented in the consolidated balance sheet.
F-17
Table of Contents
Global Brass and Copper Holdings, Inc.
Notes to Consolidated Financial Statements (Unaudited)
(All amounts in thousands, except per share data)
The following table summarizes the effects of derivative contracts in the consolidated statements of operations:
| Three Months Ended March 31, |
||||||||
| 2013 | 2012 | |||||||
| Cost of sales |
||||||||
| Realized and unrealized gain—metal contracts |
$ | 17 | $ | 1,110 | ||||
| Realized and unrealized (loss) gain—natural gas contracts |
(2 | ) | 35 | |||||
| Realized and unrealized gain (loss)—electricity contracts |
80 | (182 | ) | |||||
|
|
|
|
|
|||||
| Total |
$ | 95 | $ | 963 | ||||
|
|
|
|
|
|||||
| Interest expense |
||||||||
| Unrealized loss—interest rate cap agreements |
$ | (1 | ) | $ | (134 | ) | ||
|
|
|
|
|
|||||
| 11. | Fair Value Measurements |
ASC 820 defines fair value, establishes a framework for measuring fair value and enhances disclosures about fair value measures required under other accounting pronouncements but does not change existing guidance as to whether or not an instrument is carried at fair value. This guidance also specifies a fair value hierarchy based upon the observability of inputs used in valuation techniques. In accordance with this guidance, fair value measurements are classified under the following hierarchy:
| • | Level 1—Quoted prices for identical instruments in active markets. |
| • | Level 2—Quoted prices for similar instruments in active markets; quoted prices for identical or similar instruments in markets that are not active and model-derived valuations in which all significant inputs or significant value-drivers are observable in active markets. |
| • | Level 3—Model-derived valuations in which one or more significant inputs or significant value-drivers are unobservable. |
The following tables provide the hierarchy of inputs used to derive the fair value of the Company’s assets at fair value on a recurring basis as of March 31, 2013 and December 31, 2012.
| As of March 31, 2013 | ||||||||||||||||
| Level 1 | Level 2 | Level 3 | Total | |||||||||||||
| Open metal contracts |
$ | — | $ | 272 | $ | — | $ | 272 | ||||||||
| Open electricity contracts |
— | 241 | — | 241 | ||||||||||||
|
|
|
|
|
|
|
|
|
|||||||||
| Total assets |
$ | — | $ | 513 | $ | — | $ | 513 | ||||||||
|
|
|
|
|
|
|
|
|
|||||||||
| As of December 31, 2012 | ||||||||||||||||
| Level 1 | Level 2 | Level 3 | Total | |||||||||||||
| Open metal contracts |
$ | — | $ | 379 | $ | — | $ | 379 | ||||||||
| Open natural gas contracts |
— | 2 | — | 2 | ||||||||||||
| Open electricity contracts |
— | 167 | — | 167 | ||||||||||||
| Interest rate cap agreements |
— | 1 | — | 1 | ||||||||||||
|
|
|
|
|
|
|
|
|
|||||||||
| Total assets |
$ | — | $ | 549 | $ | — | $ | 549 | ||||||||
|
|
|
|
|
|
|
|
|
|||||||||
F-18
Table of Contents
Global Brass and Copper Holdings, Inc.
Notes to Consolidated Financial Statements (Unaudited)
(All amounts in thousands, except per share data)
In accordance with ASC 820, the Company determines the fair value of its interest rate agreement and commodity derivative contracts using Level 2 inputs.
The Company’s metal, natural gas and electricity commodity derivative contracts are considered Level 2 as fair value measurements consist of both quoted price inputs and inputs provided by a third party that are derived principally from or corroborated by observable market data by correlation. These assumptions include, but are not limited to, those concerning interest rates, credit rates, discount rates, default rates and other factors. All derivative commodity contracts have a set term of 12 months or less.
The Company’s interest rate cap agreements are considered Level 2 fair value measurements as the pricing is derived from discounting the future expected cash flows that would occur if variable interest rates rise above the strike rates of the caps. The variable interest rates used in the calculation of projected cash flows on the caps are based on an expectation of future interest rates derived from observable market interest rate curves (LIBOR forward curves) and volatilities that are observable at commonly quoted intervals.
The Company does not hold assets or liabilities requiring a Level 3 measurement and there have not been any transfers between the hierarchy levels during 2013 or 2012.
For purposes of financial reporting, the Company has determined that the carrying value of cash, accounts receivable, accounts payable, and accrued expenses approximates fair value due to the short maturities of these instruments. Additionally, given the revolving nature and the variable interest rates, the Company has determined that the carrying value of the ABL Facility also approximates fair value. As of March 31, 2013, the fair value of the Company’s Senior Secured Notes approximated $417,188. The fair value of the Senior Secured Notes was based upon quotes from financial institutions (Level 2 in the fair value hierarchy as defined by ASC 820).
| 12. | Related Parties |
KPS Special Situations Fund II, L.P., KPS Special Situations Fund II (A), L.P., KPS Special Situations Fund III, L.P. and KPS Special Situations Fund III (A), L.P. (together, “KPS Funds”) are majority shareholders of Halkos. Halkos owns all of the outstanding shares of Holdings.
The Company and KPS Funds have entered into an agreement whereby affiliates of KPS Funds charge the Company for services of their personnel engaged in line or staff functions relating specifically to the operations of the Company (the “Management Services Agreement”). The charges, which are included in selling, general and administrative expenses, were $250 for each of the three months ended March 31, 2013 and 2012, of which $250 is included in accrued liabilities at March 31, 2013 and December 31, 2012. Additionally, pursuant to the Management Services Agreement, the Company is required to reimburse the KPS Funds for all reasonable costs and expenses incurred in connection with the services provided. These costs were $11 and $41 for the three months ended March 31, 2013 and 2012, respectively.
The Company and KPS Funds entered into an agreement dated October 18, 2011 whereby the KPS Funds agreed to reimburse the Company for specific incremental costs directly attributable to an offering of equity securities (the “KPS Reimbursement Obligation”). As of March 31, 2013 and December 31, 2012, the Company has recorded $5,203 and $4,875, respectively, as a receivable from stockholder pertaining to the KPS Reimbursement Obligation.
F-19
Table of Contents
Global Brass and Copper Holdings, Inc.
Notes to Consolidated Financial Statements (Unaudited)
(All amounts in thousands, except per share data)
| 13. | Commitments and Contingencies |
Environmental Considerations
The Company is subject to a variety of environmental laws and regulations governing discharges to air and water, the handling, storage and disposal of hazardous or solid waste materials and the remediation of contamination associated with releases of hazardous substances. Although the Company believes it is in material compliance with all of the various regulations applicable to its business, there can be no assurance that requirements will not change in the future or that the Company will not incur significant cost to comply with such requirements. The Company employs responsible personnel at each facility, along with various environmental engineering consultants from time to time to assist with ongoing management of environmental, health and safety requirements. Management expenses environmental costs related to existing conditions resulting from past or current operations and from which no current or future benefit is discernible. Expenditures that extend the life of the related property are capitalized. The Company determines its liability on a location by location basis and records a liability at the time it is deemed probable and can be reasonably estimated. The Company is currently not aware of any environmental matters which may have a material impact on the Company’s financial position, results of operations, or liquidity.
On November 19, 2007 (the date of inception of GBC), the Company acquired the assets and operations relating to the worldwide metals business of Olin Corporation. Olin Corporation agreed to retain liability arising out of the existing conditions on certain of our properties for any remedial actions required by environmental laws, and agreed to indemnify the Company for all or part of a number of other environmental liabilities. Since 2007, Olin Corporation has been performing remedial actions at the facilities in East Alton, Illinois and Waterbury, Connecticut, and has been participating in remedial actions at certain other properties as well. If Olin Corporation were to stop its environmental remedial activities at the Company’s properties, the Company could be required to assume responsibility for these activities, the cost of which could be material.
Insurance Coverage
The Company maintains Comprehensive Medical Plans for employees of GBC and its subsidiaries (the “Plans”) to provide health insurance for eligible employees on a self-insured basis. The Plans are covered by a stop loss policy for those benefits provided on a self-insured basis with a deductible of $275 per occurrence for all GBC employees, except for employees of our Chase Brass division, which has a deductible of $100 per occurrence. The policy for our Chase Brass division also has a specific stop loss maximum resulting in the Company being responsible for paying the amount in excess of $2,000 per occurrence.
The Company is self-insured for workers’ compensation claims assumed from its predecessor company for activity prior to November 19, 2007. Workers’ compensation claims relating to activity after November 19, 2007 are covered by a loss funding insurance arrangement whereby the Company makes a fixed payment to the insurer which is used to pay submitted claims. The Company is self-insured for annual workers’ compensation costs relating to activity after November 19, 2007 of up to $500 per occurrence.
F-20
Table of Contents
Global Brass and Copper Holdings, Inc.
Notes to Consolidated Financial Statements (Unaudited)
(All amounts in thousands, except per share data)
Legal Considerations
The Company is party to various legal proceedings arising in the ordinary course of business. The Company believes that none of its lawsuits are individually material or that the aggregate exposure of all of its lawsuits, including those that are probable and those that are only reasonably possible, is material to its financial condition, results of operations or cash flows.
| 14. | Profits Interest Awards |
Halkos has granted, pursuant to the Halkos Equity Plan, non-voting membership interests to select members of the Company’s management titled Class B Shares. The Class B Shares are profits interests in Halkos.
Certain members of the Company’s management may receive distributions from Halkos to the extent their B Shares were vested. There were no distributions from Halkos during the three months ended March 31, 2013. During the three months ended March 31, 2012 certain members of the Company’s management received distributions from Halkos in the amount of $593. Distributions are accounted for by GBC as non-cash compensation expense with a corresponding increase in additional paid-in capital in the period in which the distributions were determined to be probable. In the case of the first quarter 2012 distribution, the Company recorded such expense in the fourth quarter of 2011.
| 15. | Segment Information |
The Company’s Chief Operating Decision Maker allocates resources and evaluates performance at the divisional level. As such, the Company has determined that it has three reportable segments: Olin Brass, Chase and Oster.
Olin Brass is a leading manufacturer and converter of copper and brass sheet, strip and fabricated products. Olin Brass also rerolls and forms other alloys such as stainless, carbon steel and aluminum. Olin Brass’s products are used in five primary end markets: building and housing, munitions, automotive, coinage, and electronics/electrical components.
Chase is a leading manufacturer of brass rod in North America. Chase primarily manufactures brass rod, including round and other shapes, ranging from 1/4 inch to 4.5 inches in diameter. The key attributes of brass rod include its machinability, corrosion resistance and moderate strength, such as valves and fittings. Brass rod is generally manufactured from copper or copper-alloy scrap. Chase Brass produces brass rod used in production applications which can be grouped into four primary end markets: building and housing, transportation, electronics/electrical components and industrial machinery and equipment.
A.J. Oster is a processing distributor of copper and copper-alloy sheet, strip and foil. A.J. Oster operates six strategically-located service centers in the United States, Puerto Rico and Mexico. Each A.J. Oster service center reliably provides a broad range of high quality products at quick lead-times in small quantities. These capabilities, combined with A.J. Oster’s operations of precision slitting, hot tinning, traverse winding, cutting, edging and special packaging, provide value to a broad customer base. A.J. Oster’s products are used in three primary end markets: building and housing, automotive and electronics/electrical components.
The Chief Operating Decision Maker evaluates performance and determines resource allocations based on a number of factors, the primary performance measure being Segment Adjusted EBITDA.
F-21
Table of Contents
Global Brass and Copper Holdings, Inc.
Notes to Consolidated Financial Statements (Unaudited)
(All amounts in thousands, except per share data)
Segment Adjusted EBITDA is an EBITDA based measure of operating performance, with EBITDA being defined by the Company as net income before depreciation and amortization, interest expense, and income taxes. The Company defines Segment Adjusted EBITDA as EBITDA further adjusted to remove the impacts of inventory values for LIFO and lower of cost or market charges, the cost of terminating certain collateral hedges, unrealized mark to market gains and losses on derivative instruments, non-cash compensation expense, loss on extinguishment of debt and non-cash income accretion related to the Company’s joint venture investment, each of which are excluded because management believes they are not indicative of the ongoing performance of the Company’s core operations. Corporate and Other includes compensation for corporate executives and officers, corporate office and administrative salaries, and professional fees for accounting, tax and legal services. Corporate and Other also includes interest expense, state and Federal income taxes, overhead costs that management has not allocated to our operating segments and the elimination of intercompany balances.
Below is a reconciliation of the Company’s Segment Adjusted EBITDA to income before provision for income taxes and equity income:
| Three Months Ended March 31, | ||||||||||||
| 2013 | 2012 | |||||||||||
| Net Sales, External Customers |
||||||||||||
| Olin Brass |
$ | 186,565 | $ | 166,287 | ||||||||
| Chase |
174,482 | 188,687 | ||||||||||
| Oster |
83,915 | 88,417 | ||||||||||
|
|
|
|
|
|||||||||
| Total net sales, external customers |
$ | 444,962 | $ | 443,391 | ||||||||
|
|
|
|
|
|||||||||
| Intersegment Net Sales |
||||||||||||
| Olin Brass |
$ | 14,338 | $ | 12,353 | ||||||||
| Chase |
— | 146 | ||||||||||
| Oster |
66 | 3 | ||||||||||
|
|
|
|
|
|||||||||
| Total intersegment net sales |
$ | 14,404 | $ | 12,502 | ||||||||
|
|
|
|
|
|||||||||
| Segment Adjusted EBITDA |
||||||||||||
| Olin Brass |
$ | 11,450 | $ | 10,689 | ||||||||
| Chase |
18,881 | 19,940 | ||||||||||
| Oster |
4,550 | 5,220 | ||||||||||
|
|
|
|
|
|||||||||
| Total segment adjusted EBITDA |
34,881 | 35,849 | ||||||||||
| Corporate and Other |
(5,827 | ) | (3,879 | ) | ||||||||
| Depreciation and amortization |
(1,909 | ) | (1,524 | ) | ||||||||
| Interest expense |
(9,875 | ) | (9,749 | ) | ||||||||
| Equity method investment income |
(A | ) | (171 | ) | (93 | ) | ||||||
| Net income attributable to noncontrolling interest |
98 | 54 | ||||||||||
| (Loss) gain on derivative contracts |
(21 | ) | 1,313 | |||||||||
|
|
|
|
|
|||||||||
| Income before provision for income taxes and equity income |
$ | 17,176 | $ | 21,971 | ||||||||
|
|
|
|
|
|||||||||
F-22
Table of Contents
Global Brass and Copper Holdings, Inc.
Notes to Consolidated Financial Statements (Unaudited)
(All amounts in thousands, except per share data)
| (A) | Excludes accretion income of $181 in each of the three months ended March 31, 2013 and 2012. Equity method investment income is exclusive to Olin Brass. |
| 16. | Stock Split |
On April 10, 2013 the Company’s Board of Directors authorized a 211,100-to-1 stock split to be effected after the effective date of this Form S-1 Registration Statement and prior to the completion of the Company’s contemplated initial public offering. The share numbers and per share amounts disclosed in the consolidated financial statements and notes to consolidated financial statements have not been retroactively adjusted to give effect to the stock split. Presented below are pro forma earnings per common share after giving effect for the stock split:
| Three Months Ended March 31, |
||||||||
| 2013 | 2012 | |||||||
| Pro forma net income attributable to Global Brass and Copper Holdings, Inc. per common share |
$ | 0.54 | $ | 0.66 | ||||
| Historical net income attributable to Global Brass and Copper Holdings, Inc. per common share |
$ | 113,880 | $ | 139,930 | ||||
The pro forma impact of the stock split on the balance sheet at March 31, 2013 is an increase in common stock by $211 with an offsetting charge to accumulated deficit.
| 17. | Subsequent Events |
The Company has performed an evaluation of events that have occurred subsequent to March 31, 2013 and through May 8, 2013 (which is the date the Company issued its financial statements). There have been no subsequent events that occurred during such period that would require disclosure in this Form S-1 Registration Statement, other than those that are described in note 16, “Stock Split”, or that are required to be recognized in the consolidated financial statements as of or for the three months ended March 31, 2013.
F-23
Table of Contents
Report of Independent Registered Public Accounting Firm
To the Board of Directors
and the Stockholder of
Global Brass and Copper Holdings, Inc.:
In our opinion, the accompanying consolidated balance sheets and the related consolidated statements of operations, of comprehensive income, of changes in (deficit)/equity and of cash flows present fairly, in all material respects, the financial position of Global Brass and Copper Holdings, Inc. and its subsidiaries at December 31, 2012 and 2011, and the results of their operations and their cash flows for each of the three years in the period ended December 31, 2012 in conformity with accounting principles generally accepted in the United States of America. In addition, in our opinion, the accompanying financial statement schedule presents fairly, in all material respects, the information set forth therein when read in conjunction with the related consolidated financial statements. These financial statements and financial statement schedule are the responsibility of the Company’s management. Our responsibility is to express opinions on these financial statements and financial statement schedule based on our audits. We conducted our audits of these statements in accordance with the standards of the Public Company Accounting Oversight Board (United States). Those standards require that we plan and perform the audit to obtain reasonable assurance about whether the financial statements are free of material misstatement. An audit includes examining, on a test basis, evidence supporting the amounts and disclosures in the financial statements, assessing the accounting principles used and significant estimates made by management, and evaluating the overall financial statement presentation. We believe that our audits provide a reasonable basis for our opinion.
/s/ PricewaterhouseCoopers LLP
PricewaterhouseCoopers LLP
Chicago, Illinois
March 29, 2013
F-24
Table of Contents
Global Brass and Copper Holdings, Inc.
Consolidated Balance Sheets
| As of December 31, | ||||||||
| (In thousands, except share data) | 2012 | 2011 | ||||||
| Assets |
||||||||
| Current assets: |
||||||||
| Cash |
$ | 13,862 | $ | 49,537 | ||||
| Accounts receivable (net of allowance of $1,408 and $2,067 at December 31, 2012 and 2011, respectively) |
164,317 | 161,715 | ||||||
| Inventories |
174,378 | 185,947 | ||||||
| Prepaid expenses and other current assets |
12,141 | 19,912 | ||||||
| Deferred income taxes |
33,465 | 29,027 | ||||||
| Income tax receivable, net |
1,300 | 5,046 | ||||||
|
|
|
|
|
|||||
| Total current assets |
399,463 | 451,184 | ||||||
| Property, plant and equipment, net |
71,127 | 57,556 | ||||||
| Investment in joint venture |
2,972 | 3,507 | ||||||
| Goodwill |
4,399 | 4,399 | ||||||
| Intangible assets, net |
839 | 951 | ||||||
| Deferred income taxes |
6,138 | 19,970 | ||||||
| Other noncurrent assets |
17,755 | 11,173 | ||||||
|
|
|
|
|
|||||
| Total assets |
$ | 502,693 | $ | 548,740 | ||||
|
|
|
|
|
|||||
| Liabilities and (deficit)/equity |
||||||||
| Current liabilities: |
||||||||
| Current maturities of long-term debt |
$ | — | $ | 31,880 | ||||
| Accounts payable |
81,577 | 77,888 | ||||||
| Accrued liabilities |
48,424 | 48,604 | ||||||
| Accrued interest |
3,287 | 4,069 | ||||||
| Income tax payable |
248 | 300 | ||||||
|
|
|
|
|
|||||
| Total current liabilities |
133,536 | 162,741 | ||||||
| Long-term debt |
389,522 | 271,698 | ||||||
| Other noncurrent liabilities |
27,436 | 31,641 | ||||||
|
|
|
|
|
|||||
| Total liabilities |
550,494 | 466,080 | ||||||
|
|
|
|
|
|||||
| Commitments and contingencies (Note 16) |
— | — | ||||||
| Global Brass and Copper Holdings, Inc. stockholder’s (deficit)/equity: |
||||||||
| Common stock—$.01 par value; 200 shares authorized; 100 shares issued and outstanding at December 31, 2012 and 2011 |
— | — | ||||||
| Additional paid-in capital |
— | 11,091 | ||||||
| (Accumulated deficit)/Retained earnings |
(47,942 | ) | 68,929 | |||||
| Accumulated other comprehensive income |
1,466 | 1,923 | ||||||
| Receivable from stockholder |
(4,875 | ) | (2,451 | ) | ||||
|
|
|
|
|
|||||
| Total Global Brass and Copper Holdings, Inc. stockholder’s (deficit)/equity |
(51,351 | ) | 79,492 | |||||
| Noncontrolling interest |
3,550 | 3,168 | ||||||
|
|
|
|
|
|||||
| Total (deficit)/equity |
(47,801 | ) | 82,660 | |||||
|
|
|
|
|
|||||
| Total liabilities and (deficit)/equity |
$ | 502,693 | $ | 548,740 | ||||
|
|
|
|
|
|||||
The accompanying notes are an integral part of these consolidated financial statements.
F-25
Table of Contents
Global Brass and Copper Holdings, Inc.
Consolidated Statements of Operations
| Year Ended December 31, | ||||||||||||
| (In thousands, except share and per share data) | 2012 | 2011 | 2010 | |||||||||
| Net sales |
$ | 1,650,520 | $ | 1,779,143 | $ | 1,658,729 | ||||||
| Cost of sales |
1,467,334 | 1,583,473 | 1,496,695 | |||||||||
|
|
|
|
|
|
|
|||||||
| Gross profit |
183,186 | 195,670 | 162,034 | |||||||||
| Selling, general and administrative expenses |
92,641 | 69,391 | 68,857 | |||||||||
|
|
|
|
|
|
|
|||||||
| Operating income |
90,545 | 126,279 | 93,177 | |||||||||
| Third party interest expense |
39,727 | 40,010 | 22,613 | |||||||||
| Related party interest expense |
— | — | 2,463 | |||||||||
| Loss on extinguishment of debt |
19,612 | — | — | |||||||||
| Other expense, net |
121 | 432 | 810 | |||||||||
|
|
|
|
|
|
|
|||||||
| Income before provision for income taxes and equity income |
31,085 | 85,837 | 67,291 | |||||||||
| Provision for income taxes |
19,185 | 31,437 | 26,676 | |||||||||
|
|
|
|
|
|
|
|||||||
| Income before equity income |
11,900 | 54,400 | 40,615 | |||||||||
| Equity income, net of tax |
995 | 888 | 1,530 | |||||||||
|
|
|
|
|
|
|
|||||||
| Net income |
12,895 | 55,288 | 42,145 | |||||||||
| Less: Net income attributable to noncontrolling interest |
374 | 156 | 512 | |||||||||
|
|
|
|
|
|
|
|||||||
| Net income attributable to Global Brass and Copper Holdings, Inc. |
$ | 12,521 | $ | 55,132 | $ | 41,633 | ||||||
|
|
|
|
|
|
|
|||||||
| Net income attributable to Global Brass and Copper Holdings, Inc. per common share: |
||||||||||||
| Basic |
$ | 125,210 | $ | 551,320 | $ | 416,330 | ||||||
| Weighted average common shares outstanding: |
||||||||||||
| Basic |
100 | 100 | 100 | |||||||||
The accompanying notes are an integral part of these consolidated financial statements.
F-26
Table of Contents
Global Brass and Copper Holdings, Inc.
Consolidated Statements of Comprehensive Income
| Year Ended December 31, | ||||||||||||
| (In thousands) | 2012 | 2011 | 2010 | |||||||||
| Net income |
$ | 12,895 | $ | 55,288 | $ | 42,145 | ||||||
| Other comprehensive income: |
||||||||||||
| Foreign currency translation adjustment |
(512 | ) | 522 | 793 | ||||||||
| Less: Income tax (benefit) expense on other comprehensive income |
(63 | ) | 53 | 280 | ||||||||
|
|
|
|
|
|
|
|||||||
| Comprehensive income |
12,446 | 55,757 | 42,658 | |||||||||
| Less: Comprehensive income attributable to noncontrolling interest |
382 | 263 | 583 | |||||||||
|
|
|
|
|
|
|
|||||||
| Comprehensive income attributable to Global Brass and Copper Holdings, Inc. |
$ | 12,064 | $ | 55,494 | $ | 42,075 | ||||||
|
|
|
|
|
|
|
|||||||
The accompanying notes are an integral part of these consolidated financial statements.
F-27
Table of Contents
Global Brass and Copper Holdings, Inc.
Consolidated Statements of Changes in (Deficit)/Equity
| (In thousands) | Common stock |
Additional paid-in capital |
(Accumulated deficit)/ retained earnings |
Accumulated other comprehensive income |
Receivable from stockholder |
Total Global Brass and Copper Holdings, Inc. stockholder’s (deficit)/ equity |
Noncontrolling interest |
Total (deficit)/ equity |
||||||||||||||||||||||||
| Balance at January 1, 2010 |
$ | — | $ | 20,000 | $ | 1,418 | $ | 1,119 | $ | — | 22,537 | $ | 2,322 | 24,859 | ||||||||||||||||||
| Profits interest compensation |
— | 3,452 | — | — | — | 3,452 | — | 3,452 | ||||||||||||||||||||||||
| Distribution to shareholder |
— | (13,246 | ) | (29,254 | ) | — | — | (42,500 | ) | — | (42,500 | ) | ||||||||||||||||||||
| Net income |
— | — | 41,633 | — | — | 41,633 | 512 | 42,145 | ||||||||||||||||||||||||
| Other comprehensive income, net of tax |
— | — | — | 442 | — | 442 | 71 | 513 | ||||||||||||||||||||||||
|
|
|
|
|
|
|
|
|
|
|
|
|
|
|
|
|
|||||||||||||||||
| Balance at December 31, 2010 |
$ | — | $ | 10,206 | $ | 13,797 | $ | 1,561 | $ | — | $ | 25,564 | $ | 2,905 | $ | 28,469 | ||||||||||||||||
| Profits interest compensation |
— | 885 | — | — | — | 885 | — | 885 | ||||||||||||||||||||||||
| Amounts due from stockholder |
— | — | — | — | (2,451 | ) | (2,451 | ) | — | (2,451 | ) | |||||||||||||||||||||
| Net income |
— | — | 55,132 | — | — | 55,132 | 156 | 55,288 | ||||||||||||||||||||||||
| Other comprehensive income, net of tax |
— | — | — | 362 | — | 362 | 107 | 469 | ||||||||||||||||||||||||
|
|
|
|
|
|
|
|
|
|
|
|
|
|
|
|
|
|||||||||||||||||
| Balance at December 31, 2011 |
$ | — | $ | 11,091 | $ | 68,929 | $ | 1,923 | $ | (2,451 | ) | $ | 79,492 | $ | 3,168 | $ | 82,660 | |||||||||||||||
| Profits interest compensation |
— | 19,517 | — | — | — | 19,517 | — | 19,517 | ||||||||||||||||||||||||
| Distribution to stockholder |
— | (30,608 | ) | (129,392 | ) | — | — | (160,000 | ) | — | (160,000 | ) | ||||||||||||||||||||
| Amounts due from stockholder |
— | — | — | — | (2,424 | ) | (2,424 | ) | — | (2,424 | ) | |||||||||||||||||||||
| Net income |
— | — | 12,521 | — | — | 12,521 | 374 | 12,895 | ||||||||||||||||||||||||
| Other comprehensive (loss) income, net of tax |
— | — | — | (457 | ) | — | (457 | ) | 8 | (449 | ) | |||||||||||||||||||||
|
|
|
|
|
|
|
|
|
|
|
|
|
|
|
|
|
|||||||||||||||||
| Balance at December 31, 2012 |
$ | — | $ | — | $ | (47,942 | ) | $ | 1,466 | $ | (4,875 | ) | $ | (51,351 | ) | $ | 3,550 | $ | (47,801 | ) | ||||||||||||
|
|
|
|
|
|
|
|
|
|
|
|
|
|
|
|
|
|||||||||||||||||
The accompanying notes are an integral part of these consolidated financial statements.
F-28
Table of Contents
Global Brass and Copper Holdings, Inc.
Consolidated Statements of Cash Flows
| Year Ended December 31, | ||||||||||||
| (In thousands) | 2012 | 2011 | 2010 | |||||||||
| Cash flows from operating activities |
||||||||||||
| Net income |
$ | 12,895 | $ | 55,288 | $ | 42,145 | ||||||
| Adjustments to reconcile net income to net cash provided by operating activities: |
||||||||||||
| Lower of cost or market adjustment to inventory |
302 | — | — | |||||||||
| Mark to market on commodity contracts |
(1,588 | ) | 1,095 | 11,984 | ||||||||
| Mark to market on interest rate cap agreements |
156 | 1,851 | (800 | ) | ||||||||
| Depreciation |
6,822 | 4,560 | 2,772 | |||||||||
| Amortization of intangible assets |
112 | 199 | 199 | |||||||||
| Amortization of debt discount and issuance costs |
4,564 | 4,701 | 2,299 | |||||||||
| Term loan call premium |
(6,394 | ) | — | — | ||||||||
| Loss on debt extinguishment |
19,612 | — | — | |||||||||
| Profits interest compensation expense |
19,517 | 885 | 3,452 | |||||||||
| Provision for bad debts, net of reductions |
(814 | ) | (4,171 | ) | 1,324 | |||||||
| Deferred income taxes |
5,248 | 10,491 | 6,041 | |||||||||
| Gain on sale of property, plant and equipment |
(17 | ) | (69 | ) | (39 | ) | ||||||
| Equity income, net of tax |
(995 | ) | (888 | ) | (1,530 | ) | ||||||
| Distributions from equity method investment |
1,000 | 500 | 566 | |||||||||
| Change in assets and liabilities: |
||||||||||||
| Accounts receivable |
(1,540 | ) | 3,848 | (20,241 | ) | |||||||
| Inventories |
11,512 | 6,592 | 8,656 | |||||||||
| Prepaid expenses and other current assets |
4,676 | 18,264 | (8,308 | ) | ||||||||
| Accounts payable |
3,682 | (50 | ) | 14,856 | ||||||||
| Accrued liabilities |
850 | (36,988 | ) | 341 | ||||||||
| Accrued interest |
(782 | ) | (151 | ) | 2,507 | |||||||
| Income taxes, net |
3,685 | (2,674 | ) | 855 | ||||||||
| Other, net |
(589 | ) | 1,565 | 2,335 | ||||||||
|
|
|
|
|
|
|
|||||||
| Net cash provided by operating activities |
81,914 | 64,848 | 69,414 | |||||||||
| Cash flows from investing activities |
||||||||||||
| Capital expenditures |
(20,408 | ) | (22,440 | ) | (11,927 | ) | ||||||
| Proceeds from sale of property, plant and equipment |
32 | 97 | 39 | |||||||||
|
|
|
|
|
|
|
|||||||
| Net cash used in investing activities |
(20,376 | ) | (22,343 | ) | (11,888 | ) | ||||||
| Cash flows from financing activities |
||||||||||||
| Deferred financing fees |
(12,981 | ) | (1,675 | ) | (15,131 | ) | ||||||
| Proceeds from senior secured notes |
375,000 | — | — | |||||||||
| Proceeds from term loan, net of discount |
— | — | 305,550 | |||||||||
| Payments on term loan |
(310,875 | ) | (3,300 | ) | (825 | ) | ||||||
| Borrowings on ABL Facility |
204,275 | 168,021 | 1,096,578 | |||||||||
| Payments on ABL Facility |
(189,753 | ) | (168,021 | ) | (1,272,197 | ) | ||||||
| Principal payments under capital lease obligation |
— | (916 | ) | (52 | ) | |||||||
| Payments on related party debt |
— | — | (119,805 | ) | ||||||||
| Distribution to stockholder |
(160,000 | ) | — | (42,500 | ) | |||||||
| Amounts due from stockholder |
(2,424 | ) | (2,451 | ) | — | |||||||
| Cash overdrafts |
— | — | (1,228 | ) | ||||||||
|
|
|
|
|
|
|
|||||||
| Net cash used in financing activities |
(96,758 | ) | (8,342 | ) | (49,610 | ) | ||||||
| Effect of foreign currency exchange rates |
(455 | ) | (149 | ) | (225 | ) | ||||||
|
|
|
|
|
|
|
|||||||
| Net (decrease) increase in cash |
(35,675 | ) | 34,014 | 7,691 | ||||||||
| Cash at beginning of year |
49,537 | 15,523 | 7,832 | |||||||||
|
|
|
|
|
|
|
|||||||
| Cash at end of year |
$ | 13,862 | $ | 49,537 | $ | 15,523 | ||||||
|
|
|
|
|
|
|
|||||||
| Supplemental disclosure of cash flows information |
||||||||||||
| Cash paid during the period for: |
||||||||||||
| Interest, net of amount capitalized |
$ | 35,788 | $ | 33,580 | $ | 19,626 | ||||||
| Income taxes, net of refunds |
$ | 10,235 | $ | 24,017 | $ | 19,657 | ||||||
| Noncash investing activities |
||||||||||||
| Capital lease obligations |
$ | — | $ | — | $ | 968 | ||||||
The accompanying notes are an integral part of these consolidated financial statements.
F-29
Table of Contents
Global Brass and Copper Holdings, Inc.
Notes to Consolidated Financial Statements
(All amounts in thousands, except per share data)
| 1. | Organization and Formation of the Company |
Global Brass and Copper Holdings, Inc. (“Holdings” or the “Company”), an investee company of KPS Capital Partners, L.P. and its affiliates (“KPS”), was incorporated in Delaware, on October 10, 2007. KPS is the majority shareholder of Halkos Holdings, LLC (“Halkos”). Halkos owns 100% of Holdings. Holdings, through its wholly-owned principal operating subsidiary, Global Brass and Copper, Inc. (“GBC”), commenced commercial operations on November 19, 2007 through the acquisition of the metals business from Olin Corporation. GBC is a leading value added manufacturer, fabricator and distributor of specialty copper and brass products in North America.
The Company is operated and managed through three distinct divisions which are also the Company’s reportable segments: GBC Metals, LLC (“Olin Brass”), Chase Brass and Copper Company, LLC (“Chase”) and A.J. Oster, LLC (“Oster”).
Olin Brass
The Olin Brass division manufactures sheet, strip and fabricated components by primarily processing copper and copper alloys. The division also rerolls and forms other alloys such as stainless and carbon steel.
Olin Brass manufactures its products through four sites in North America. The strip mill in East Alton, IL is the main operating facility, which produces strip products. Strip products are processed further through the division’s downstream operations for specified uses. The division’s downstream operations include: a stamping operation located also in East Alton, IL; a rolling mill in Waterbury, CT with rolling, annealing, leveling, plating and slitting capabilities for various products; a rolling mill in Bryan, OH specializing in products sold in the automotive and electrical connectors end-market; and a manufacturing facility in Cuba, MO that produces high frequency welded copper-alloy tube for heat transfer, utility, decorative, automotive and plumbing applications.
Olin Brass also has operations in Guangzhou, People’s Republic of China, or PRC, through a service center joint venture with Luoyang Copper. Olin Brass’s products are distributed either directly to customers or through Oster.
Chase
Chase manufactures round and hexagonal shaped brass rod. The main attributes of brass rod are its machinability, corrosion resistance and moderate strength, and it is used for forging and machining products such as valves and fittings.
All of the division’s rod is manufactured at the facility located in Montpelier, OH. Chase distributes all of its products directly to customers.
Oster
Oster is a distributor of primarily copper and copper-alloy strip products as well as phosphor bronze, nickel, silver, stainless steel and aluminum products. Oster operates as an independent service center with Olin Brass as its primary supplier. Oster also conducts finishing operations on products it distributes, including slitting, traverse coil winding, edging and cutting that aim to enhance product quality and usefulness.
Oster has six service centers in the U.S. and Mexico, which are strategically located with the objective to service customers throughout North America.
F-30
Table of Contents
Global Brass and Copper Holdings, Inc.
Notes to Consolidated Financial Statements
(All amounts in thousands, except per share data)
| 2. | Summary of Significant Accounting Policies |
Principles of Consolidation
The consolidated financial statements include the accounts of the Company, its wholly-owned subsidiaries and its majority-owned subsidiaries, in which the Company holds a controlling interest. All intercompany accounts and transactions are eliminated in consolidation. The equity method is used to account for investments in affiliated companies, 20% to 50% owned, where the Company does not hold a controlling voting interest and does not direct the matters that most significantly impact the investee’s operations.
The Company owns an 80% interest in Olin Luotong (GZ) Corporation (“Luotong”), based in China, and Luotong’s financial information is consolidated herein, with the net results attributable to the 20% noncontrolling interest reflected in the consolidated financial statements.
Use of Estimates and Assumptions
The preparation of financial statements in conformity with accounting principles generally accepted in the United States of America (“U.S. GAAP”) requires management to make estimates and assumptions that affect the reported amounts of assets and liabilities and disclosure of contingent assets and liabilities at the date of the financial statements. In addition, it requires management to make estimates and assumptions that affect the reported amount of net sales and expenses during the reporting period. Actual amounts could differ from those estimates.
Revision of Prior Period Financial Statements
During 2012, the Company identified the following errors:
| 1. | The Company historically had not recognized deferred tax assets or liabilities related to inside basis differences of its foreign subsidiaries. The unrecognized net deferred tax asset was $797, $888, and $794 as January 1, 2010, December 31, 2010 and December 31, 2011, respectively. The provision for income taxes was overstated by $91 and understated by $94 for the years ended December 31, 2010 and 2011, respectively. |
| 2. | Duplicate accruals for the receipt of raw material were identified in the third quarter of fiscal 2012. The error had no impact on the year ended December 31, 2010. Accrued liabilities and cost of sales were overstated by $389 as of and for the year ended December 31, 2011. |
| 3. | An error in the accounting for raw material in-transit was identified in the third quarter of fiscal 2012. Inventory was understated by $22 as of January 1, 2010 and overstated by $275 and $423 as of December 31, 2010 and 2011, respectively. Cost of sales was understated by $297 and $148 for the years ended December 31, 2010 and 2011, respectively. |
Additionally, the Company identified immaterial errors in previously issued consolidated financial statements which were corrected in the year identified, including:
| 4. | An error in accounting for workers’ compensation insurance that was corrected during the year ended December 31, 2011 by decreasing cost of sales by $44 and by increasing |
F-31
Table of Contents
Global Brass and Copper Holdings, Inc.
Notes to Consolidated Financial Statements
(All amounts in thousands, except per share data)
| prepaid expenses and other current assets by $7,269 and increasing accrued liabilities by $7,225. Prepaid expenses and other current assets were understated by $5,036 and $7,269 as of January 1, 2010 and December 31, 2010, respectively. Accrued liabilities were understated by $5,725 and $7,225 as of January 1, 2010 and December 31, 2010, respectively. Cost of sales was overstated by $733 for the year ended December 31, 2010. |
| 5. | An error in accounting for certain derivative contracts that was corrected during the year ended December 31, 2011 by increasing prepaid expenses and other current assets and decreasing cost of sales by $510. Prepaid expenses and other current assets were overstated by $303 as of January 1, 2010 and understated by $510 as of December 31, 2010. Cost of sales was overstated by $813 for the year ended December 31, 2010. |
The Company assessed the materiality of all errors, individually and in the aggregate, on previously issued consolidated financial statements and concluded that the errors were not material to any of the Company’s previously issued quarterly or annual financial statements. In assessing the effect of correcting previously unrecorded errors in 2012, the Company has concluded that correction of these errors in 2012 could be considered material to 2012 net income. Accordingly, the consolidated financial statements as of and for the year ended December 31, 2011 and as of and for the year ended December 31, 2010 have been revised to reflect the correction of all errors identified in their proper periods. To recognize the cumulative effect of all error corrections as of January 1, 2010, an adjustment of $482 was made to increase retained earnings.
F-32
Table of Contents
Global Brass and Copper Holdings, Inc.
Notes to Consolidated Financial Statements
(All amounts in thousands, except per share data)
A summary of the revisions to the consolidated financial statements as of December 31, 2011 and 2010 and for the periods ended December 31, 2011 and 2010 is as follows:
| As Previously Reported |
Adjustment | As Revised | ||||||||||
| Consolidated Balance Sheet |
||||||||||||
| December 31, 2010 | ||||||||||||
| Inventories |
$ | 192,898 | $ | (275 | ) | $ | 192,623 | |||||
| Prepaid expenses and other current assets |
30,662 | 7,779 | 38,441 | |||||||||
| Deferred income tax assets—current |
28,433 | 879 | 29,312 | |||||||||
| Income tax receivable |
2,139 | 137 | 2,276 | |||||||||
| Total current assets |
431,044 | 8,520 | 439,564 | |||||||||
| Deferred income tax assets—noncurrent |
34,354 | (100 | ) | 34,254 | ||||||||
| Total assets |
529,301 | 8,420 | 537,721 | |||||||||
| Accrued liabilities |
78,002 | 6,990 | 84,992 | |||||||||
| Income tax payable |
— | 199 | 199 | |||||||||
| Total current liabilities |
163,810 | 7,189 | 170,999 | |||||||||
| Total liabilities |
502,063 | 7,189 | 509,252 | |||||||||
| Retained earnings |
12,566 | 1,231 | 13,797 | |||||||||
| Total Global Brass and Copper Holdings, Inc. stockholder’s equity |
24,333 | 1,231 | 25,564 | |||||||||
| Total equity |
27,238 | 1,231 | 28,469 | |||||||||
| Total liabilities and equity |
529,301 | 8,420 | 537,721 | |||||||||
| Consolidated Statement of Operations |
||||||||||||
| Year Ended December 31, 2010 | ||||||||||||
| Cost of sales |
$ | 1,497,944 | $ | (1,249 | ) | $ | 1,496,695 | |||||
| Gross profit |
160,785 | 1,249 | 162,034 | |||||||||
| Operating income |
91,928 | 1,249 | 93,177 | |||||||||
| Income before provision for income taxes and equity income |
66,042 | 1,249 | 67,291 | |||||||||
| Provision for income taxes |
26,176 | 500 | 26,676 | |||||||||
| Income before equity income |
39,866 | 749 | 40,615 | |||||||||
| Net income |
41,396 | 749 | 42,145 | |||||||||
| Net income attributable to Global Brass and Copper Holdings, Inc. |
40,884 | 749 | 41,633 | |||||||||
| Net income attributable to Global Brass and Copper Holdings, Inc. per common share: |
||||||||||||
| Basic |
$ | 408,840 | $ | 7,490 | $ | 416,330 | ||||||
| Consolidated Statement of Comprehensive Income |
||||||||||||
| Year Ended December 31, 2010 | ||||||||||||
| Net income |
$ | 41,396 | $ | 749 | $ | 42,145 | ||||||
| Comprehensive income |
41,909 | 749 | 42,658 | |||||||||
| Comprehensive income attributable to Global Brass and Copper Holdings, Inc. |
41,326 | 749 | 42,075 | |||||||||
| Consolidated Statement of Changes in Equity |
||||||||||||
| Year Ended December 31, 2010 | ||||||||||||
| Net income |
$ | 41,396 | $ | 749 | $ | 42,145 | ||||||
| Net income attributable to Global Brass and Copper Holdings, Inc. |
40,884 | 749 | 41,633 | |||||||||
| Retained earnings —Balance, December 31, 2010 |
12,566 | 1,231 | 13,797 | |||||||||
| Total Global Brass and Copper Holdings, Inc. stockholder’s equity—Balance, December 31, 2010 |
24,333 | 1,231 | 25,564 | |||||||||
| Total equity—Balance, December 31, 2010 |
27,238 | 1,231 | 28,469 | |||||||||
F-33
Table of Contents
Global Brass and Copper Holdings, Inc.
Notes to Consolidated Financial Statements
(All amounts in thousands, except per share data)
| As Previously Reported |
Adjustment | As Revised | ||||||||||
| Consolidated Balance Sheet |
||||||||||||
| December 31, 2011 | ||||||||||||
| Accounts receivable, net of allowance |
$ | 160,731 | $ | 984 | $ | 161,715 | ||||||
| Inventories |
186,370 | (423 | ) | 185,947 | ||||||||
| Deferred income tax assets—current |
27,972 | 1,055 | 29,027 | |||||||||
| Income tax receivable |
5,017 | 29 | 5,046 | |||||||||
| Total current assets |
449,539 | 1,645 | 451,184 | |||||||||
| Deferred income tax assets—noncurrent |
20,218 | (248 | ) | 19,970 | ||||||||
| Total assets |
547,343 | 1,397 | 548,740 | |||||||||
| Accounts payable |
78,276 | (388 | ) | 77,888 | ||||||||
| Accrued liabilities |
47,619 | 985 | 48,604 | |||||||||
| Income tax payable |
— | 300 | 300 | |||||||||
| Total current liabilities |
161,844 | 897 | 162,741 | |||||||||
| Total liabilities |
465,183 | 897 | 466,080 | |||||||||
| Retained earnings |
68,429 | 500 | 68,929 | |||||||||
| Total Global Brass and Copper Holdings, Inc. stockholder’s equity |
78,992 | 500 | 79,492 | |||||||||
| Total equity |
82,160 | 500 | 82,660 | |||||||||
| Total liabilities and equity |
547,343 | 1,397 | 548,740 | |||||||||
| Consolidated Statement of Operations |
||||||||||||
| Year Ended December 31, 2011 | ||||||||||||
| Cost of sales |
$ | 1,582,925 | $ | 548 | $ | 1,583,473 | ||||||
| Gross profit |
196,218 | (548 | ) | 195,670 | ||||||||
| Operating income |
126,827 | (548 | ) | 126,279 | ||||||||
| Income before provision for income taxes and equity income |
86,385 | (548 | ) | 85,837 | ||||||||
| Provision for income taxes |
31,254 | 183 | 31,437 | |||||||||
| Income before equity income |
55,131 | (731 | ) | 54,400 | ||||||||
| Net income |
56,019 | (731 | ) | 55,288 | ||||||||
| Net income attributable to Global Brass and Copper Holdings, Inc. |
55,863 | (731 | ) | 55,132 | ||||||||
| Net income attributable to Global Brass and Copper Holdings, Inc. per common share: |
||||||||||||
| Basic |
$ | 558,630 | $ | (7,310 | ) | $ | 551,320 | |||||
| Consolidated Statement of Comprehensive Income |
||||||||||||
| Year Ended December 31, 2011 | ||||||||||||
| Net income |
$ | 56,019 | $ | (731 | ) | $ | 55,288 | |||||
| Comprehensive income |
56,488 | (731 | ) | 55,757 | ||||||||
| Comprehensive income attributable to Global Brass and Copper Holdings, Inc. |
56,225 | (731 | ) | 55,494 | ||||||||
| Consolidated Statement of Changes in Equity |
||||||||||||
| Year Ended December 31, 2011 | ||||||||||||
| Net income |
$ | 56,019 | $ | (731 | ) | $ | 55,288 | |||||
| Net income attributable to Global Brass and Copper Holdings, Inc. |
55,863 | (731 | ) | 55,132 | ||||||||
| Retained earnings —Balance, December 31, 2011 |
68,429 | 500 | 68,929 | |||||||||
| Total Global Brass and Copper Holdings, Inc. stockholder’s equity—Balance, December 31, 2011 |
78,992 | 500 | 79,492 | |||||||||
| Total equity—Balance, December 31, 2011 |
82,160 | 500 | 82,660 | |||||||||
F-34
Table of Contents
Global Brass and Copper Holdings, Inc.
Notes to Consolidated Financial Statements
(All amounts in thousands, except per share data)
Accounts Receivable and Allowance for Doubtful Accounts
Accounts receivable primarily consists of trade receivables for amounts billed to customers for products sold and other receivables. The determination of collectability of the Company’s accounts receivable requires management to make frequent judgments and estimates in order to determine the appropriate amount of allowance needed for doubtful accounts. In circumstances where the Company is aware of a customer’s inability to meet its financial obligations (e.g., bankruptcy filings or substantial down-grading of credit ratings), it records an allowance for bad debts equal to the amount the Company does not believe to be collectible. For all other customers, the Company recognizes allowances for bad debts based on its historical collection experience. If circumstances change (e.g., greater than expected defaults or an unexpected material change in a major customer’s ability to meet its financial obligations), the Company’s estimate of the recoverability of amounts due could be changed by a material amount. Accounts are written off once deemed to be uncollectible. Any subsequent cash collections relating to accounts that have been previously written off are recorded as a reduction to the provision for bad debts in the period of collection.
The reconciliation of the activity in the allowance for doubtful accounts is summarized below:
| Year Ended December 31, | ||||||||||||
| 2012 | 2011 | 2010 | ||||||||||
| Balance at beginning of period |
$ | 2,067 | $ | 7,921 | $ | 7,505 | ||||||
| Provision for bad debts, net of reductions |
(814 | ) | (4,171 | ) | 1,324 | |||||||
| Write-offs, net of recoveries |
— | (1,683 | ) | (908 | ) | |||||||
| Recoveries, net of write-offs |
155 | — | — | |||||||||
|
|
|
|
|
|
|
|||||||
| Balance at end of period |
$ | 1,408 | $ | 2,067 | $ | 7,921 | ||||||
|
|
|
|
|
|
|
|||||||
Inventories
Inventories include costs attributable to direct labor and manufacturing overhead but are primarily comprised of raw material costs. The material component of inventories that is valued on a last-in, first-out (“LIFO”) basis comprises approximately 70% and 72% of total inventory at December 31, 2012 and 2011, respectively. Other manufactured inventories, including the non-material components and certain non-U.S. inventories, are valued on a first-in, first-out (“FIFO”) basis. Elements of cost in finished goods inventory in addition to the cost of material include depreciation, utilities, consumable production supplies, maintenance, production wages and transportation costs.
Inventories are stated at the lower of cost or market. The market price of metals used in production and related scrap is subject to volatility. We evaluate the need to record adjustments for inventory on a regular basis. During periods when open market prices decline below net book value, the Company records a provision to reduce the carrying value of its inventory. Additionally, the Company records an estimate for slow moving and obsolete inventory based upon product knowledge, physical inventory observation, future demand, market conditions and an aging analysis of the inventory on hand. Our policy is to evaluate all inventories including raw material, work-in-process, finished goods, and spare parts. Inventory in excess of our estimated usage requirements is written down to its estimated net realizable value. See note 3, “Inventories,” in these notes to the consolidated financial statements.
F-35
Table of Contents
Global Brass and Copper Holdings, Inc.
Notes to Consolidated Financial Statements
(All amounts in thousands, except per share data)
Prepaid Expenses and Other Current Assets
Prepaid expenses are stated at historical cost, net of any related amortization, and consist of amounts which are of continuing benefit to the Company. See note 4, “Prepaid Expenses and Other Current Assets,” in these notes to the consolidated financial statements.
Property, Plant and Equipment
Property, plant and equipment are recorded at cost. Depreciation of property, plant and equipment generally is computed using the straight-line method based on the estimated useful lives of the assets as they are placed into service. Depreciation expense is recorded in cost of sales or selling, general and administrative costs depending on the nature and use of the underlying asset.
Expenditures for repairs, maintenance and minor renewals are expensed as incurred. Expenditures which improve an asset or extend its estimated useful life are capitalized. Interest related to the construction of qualifying assets is capitalized as part of the construction costs. When assets are retired or otherwise disposed of, the related cost and accumulated depreciation are removed from the accounts and any gain or loss is included in the accompanying consolidated statement of operations.
The Company reviews property, plant and equipment for impairment when a change in events or circumstances indicates that the carrying value of the assets may not be recoverable. The Company has determined that its asset group for impairment testing is comprised of the assets and liabilities of each of its reporting units. Reporting units are businesses, for which discrete financial information is available and reviewed by segment management. The Company’s reporting units are one level below the operating segment, with the exception of one operating segment, for which the operating segment represents the lowest level of identifiable cash flows. The Company determines the fair value of its asset group through various valuation techniques, including discounted cash flow models, quoted market values and third-party independent appraisals, as considered necessary. See note 5, “Property, Plant and Equipment,” in these notes to the consolidated financial statements.
Investment in Joint Venture
The Company owns a 50% interest in Dowa-Olin Metal Corporation (“Dowa”), a joint venture based in Japan. The Company accounts for Dowa under the equity method of accounting. Due to the timing of the receipt of available financial information, the results of Dowa are recorded on a one-month lag basis.
As a result of the purchase method of accounting, a negative basis difference of $9,416 was created between the Company’s books and the Company’s share of Dowa’s equity as of November 19, 2007. ASC 323, Investments—Equity Method & Joint Ventures, provides that the basis difference between the investor cost and underlying equity in net assets of the investee at the date of investment requires recognition unless it is attributable to a non-amortizing asset such as goodwill. The negative basis difference was created due to the bargain purchase event associated with the metals business acquired from Olin Corporation and was not attributable to any specific element of the joint venture itself. As the difference was not attributable to any of the specific assets of Dowa, the equity investment as a whole was assessed to determine the appropriate accretion period for the basis difference. The purpose of the joint venture is to provide Olin Brass’s high performance alloy materials to the Asia market through the licensing of Olin
F-36
Table of Contents
Global Brass and Copper Holdings, Inc.
Notes to Consolidated Financial Statements
(All amounts in thousands, except per share data)
Brass technology. Given consideration of this use, the negative basis difference is being accreted over a period of 13 years. See note 7, “Investment in Joint Venture,” in these notes to the consolidated financial statements.
The Company reviews its equity method investment for impairment using an other-than-temporary model when triggering events are identified. An impairment loss is recognized when the investment’s carrying amount exceeds its fair value and this decline in fair value is deemed to be other-than-temporary.
Acquisitions and Goodwill
All acquisitions are accounted for using the acquisition method as prescribed by ASC 805, Business Combinations. The purchase price paid is allocated to the assets acquired and liabilities assumed based on their estimated fair values. Any excess purchase price over the fair value of the net assets acquired is recorded as goodwill.
Pursuant to ASC 350, Intangibles—Goodwill and Other, the Company does not amortize goodwill and other intangible assets with indefinite useful lives. The Company reviews goodwill to determine potential impairment annually, or more frequently if events and circumstances indicate that the asset might be impaired, by comparing the carrying value of the asset with the anticipated present value of future cash flows.
In 2011, the Financial Accounting Standards Board (“FASB”) amended its guidance to simplify the testing of goodwill for impairment. The amended guidance provides an option to perform a qualitative assessment to determine whether further impairment testing is necessary. If the qualitative evaluation yields support that it is more likely than not that the fair value of a reporting unit exceeds its carrying value, the quantitative impairment test is not required. The Company adopted the qualitative goodwill evaluation model for its annual goodwill impairment test conducted as of October 31, 2012. Based on the results of that qualitative assessment, the Company believes it was more likely than not that the fair value of the reporting units significantly exceeded their carrying values as of October 31, 2012, indicating no impairment of goodwill. The $4,399 of goodwill was assigned to the Chase business segment and as of December 31, 2012, $2,131 of goodwill is expected to be deductible for tax purposes.
Intangible Assets
Definite-lived intangible assets are recorded at fair value under the purchase method of accounting as of the respective acquisition dates and are amortized using the straight-line method over the estimated useful lives of the assets. Amortization expense related to intangible assets is reflected in selling, general and administrative expenses. Identifiable definite-lived intangible assets are reviewed for impairment whenever events or circumstances indicate that the carrying value may not be recoverable. See note 6, “Intangible Assets,” in these notes to the consolidated financial statements.
Deferred Financing Fees
Deferred financing fees incurred in connection with the issuance of debt are amortized as non-cash interest expense over the terms of the debt agreements.
Deferred financing fees incurred in connection with the issuance of the Senior Secured Notes, as defined in note 8, “Other Noncurrent Assets,” are amortized using the effective interest method
F-37
Table of Contents
Global Brass and Copper Holdings, Inc.
Notes to Consolidated Financial Statements
(All amounts in thousands, except per share data)
over the term of the Senior Secured Notes. Deferred financing fees incurred in connection with the issuance of the ABL Facility, as defined in note 8, “Other Noncurrent Assets,” in these notes to the consolidated financial statements, are amortized on a straight-line basis over the term of the ABL Facility.
Derivative Contracts
The Company’s operating activities expose it to a variety of market risks, including risks related to the effects of commodity prices and interest rates. These financial exposures are monitored and managed by the Company as an integral part of its overall risk-management program. The Company does not enter into derivative contracts for speculation purposes where the objective is to generate profits. The Company has not applied hedge accounting to its derivative contracts in any of the years ended December 31, 2012, 2011 or 2010. The Company includes the fair value of the derivative contracts as assets or liabilities in its balance sheet and recognizes all amounts paid and received and changes in fair value of derivative contracts, including unrealized gains and losses, as adjustments to income. See note 13, “Derivative Contracts,” in these notes to the consolidated financial statements.
Revenue Recognition
The Company recognizes revenue for both toll and non-toll basis sales only when risk of loss and title passes to the customer, which generally occurs upon shipment. For the years ended December 31, 2012, 2011 and 2010, non-toll net sales were $1,576,070, $1,710,595 and $1,577,771, respectively. For the years ended December 31, 2012, 2011 and 2010, toll net sales were $74,450, $68,548 and $80,958, respectively. Estimates for future rebates on certain product lines and product returns are recognized in the period in which the revenue is recorded. Such rebates were not material for the years ended December 31, 2012, 2011 and 2010. Billings to customers for shipping costs are included in net sales and the cost of shipping product to those customers is reflected in cost of sales in the consolidated statements of operations.
Research and Development
The Company conducts research and development primarily through the Olin Brass reportable segment, the costs for which are expensed as incurred. Research and development expenditures for the years ended December 31, 2012, 2011 and 2010 were $1,516, $1,540 and $1,740, respectively, and are included as a component of selling, general and administrative expenses in the consolidated statements of operations.
Income Taxes
The provision for income taxes is determined using the asset and liability approach. The current and deferred tax consequences are measured by applying the provisions of enacted tax laws to determine the amount of taxes payable currently or in future years. Deferred income taxes are provided for temporary differences between the income tax basis of assets and liabilities and their carrying amounts for financial reporting purposes. A valuation allowance is recorded to reduce deferred tax assets when management determines it is “more likely than not” that some portion or all of the deferred tax assets will not be realized.
F-38
Table of Contents
Global Brass and Copper Holdings, Inc.
Notes to Consolidated Financial Statements
(All amounts in thousands, except per share data)
Profits Interest Compensation
Halkos has granted, pursuant to the Halkos Holdings, LLC Executive Equity Incentive Plan (“Halkos Equity Plan”), non-voting membership interests to select members of the Company’s management in the form of shares. The shares are profits interests in Halkos. See note 17, “Profits Interest Awards,” in these notes to the consolidated financial statements.
The shares are accounted for as a profit sharing arrangement under ASC 710, Compensation—General. Expense is recorded in the period in which distributions to award holders are determined to be probable. These distributions are accounted for by the Company as non-cash compensation expense with a corresponding increase in additional paid-in capital.
Foreign Currency Translation
The financial statements of foreign subsidiaries are translated into United States dollars in accordance with ASC 830, Foreign Currency Matters. The functional currency of the Company’s foreign subsidiaries is the local currency. The consolidated statements of foreign operations are translated at weighted-average exchange rates for the periods. Assets and liabilities are translated at period-end exchange rates and equity transactions are translated at historical rates. Gains and losses resulting from the translation adjustment are reported as a component of other comprehensive income. The income tax effect of currency translation adjustments related to foreign subsidiaries and joint ventures that are not considered indefinitely reinvested are recorded as a component of deferred taxes with an offset to other comprehensive income.
Concentrations of Credit Risk and Certain Other Exposures
The Company sells and distributes its products to a wide range of companies primarily in the ammunition, automotive, electronics, housing and coinage industries. The Company performs ongoing credit evaluations of its customers and generally does not require collateral. For the years ended December 31, 2012, 2011 and 2010, sales to any one customer did not exceed 10% of consolidated net sales.
The Company uses various strategies to minimize the impact of changes in the base metal prices between the date of order and the date of sale. Generally, the Company prices a forward replacement purchase of an equivalent amount of copper and other metals under flexible pricing arrangements it maintains with its suppliers, at the same time it determines the forward selling price of finished products to its customers. The Company has various sources of raw materials and is not materially dependent on any one supplier.
There are nine unions at the Olin Brass division, two labor unions at the Oster division, and one labor union at the Chase division. In 2012, employees at an Olin Brass downstream operation elected a union representative which was subsequently certified. The relationship with these unions has been satisfactory. The collective bargaining agreements with the Olin Brass unions expire between November 2013 and September 2014, the collective bargaining agreements with Oster’s unions expire January 2014 and the other has an indeterminable term, and the collective bargaining agreement with Chase’s union expires in June 2013. Since the Company’s establishment in November 2007, the Company has not experienced any work stoppages at any of its facilities.
F-39
Table of Contents
Global Brass and Copper Holdings, Inc.
Notes to Consolidated Financial Statements
(All amounts in thousands, except per share data)
Self-Insurance Programs
The Company is self-insured for workers’ compensation claims and benefits paid under employee health care programs. Accruals for employee health care are primarily based on estimated undiscounted cost of claims, which includes incurred but not reported claims. Accruals for workers’ compensation benefits and related expenses for claims are estimated, in part, by considering historical claims experience and undiscounted claims estimates provided by insurance carriers, third-party administrators and actuaries. Self-insurance accruals are deemed to be sufficient to cover outstanding claims, including those incurred but not reported as of the estimation date.
Workers’ compensation claims relating to activity after November 19, 2007 are covered by a loss funding insurance arrangement whereby the Company makes a fixed payment to the insurer which is used to pay submitted claims. Loss fund payments to the insurer in excess of workers’ compensation claim payments are classified as prepaid expenses and other current assets. The amount of the loss fund payments to the insurer is based on a combination of claims experience and a contractually agreed upon loss development factor.
Environmental Reserves and Environmental Expenses
The Company recognizes an environmental liability when it is probable the liability exists and the amount is reasonably estimable. The Company estimates the duration and extent of its remediation obligations based upon internal analyses of clean-up costs, ongoing monitoring costs and estimated legal fees, communications with regulatory agencies and changes in environmental law. If the Company were to determine that its estimates of the duration or extent of its environmental obligations were no longer accurate, the Company would adjust its environmental liabilities accordingly in the period that such determination is made. Estimated future expenditures for environmental remediation are not discounted to their present value. Accrued environmental liabilities are not reduced by potential insurance reimbursements.
Environmental expenses that relate to ongoing operations are included as a component of cost of sales. See note 16, “Commitments and Contingencies,” in these notes to the consolidated financial statements.
Recent Accounting Pronouncements
In February 2013, the FASB issued Accounting Standards Update (“ASU”) 2013-02, Reporting of Amounts Reclassified Out of Accumulated Other Comprehensive Income. This guidance requires entities to provide disclosures about items that are required by U.S. GAAP to be reclassified from accumulated other comprehensive income (“AOCI”) to net income in their entirety in the same reporting period. The disclosure would include the amount of the reclassification and identify the line item on the statement where net income is presented that is affected by the reclassification. For other items reclassified from AOCI, the disclosure would list cross-references to other disclosures where additional details about their effects are disclosed. This guidance is effective for reporting periods beginning after December 15, 2012. The Company does not expect that adoption of the guidance will have a material effect on its financial statements and disclosures.
In December 2011, the FASB issued ASU 2011-11, Disclosures about Offsetting Assets and Liabilities. This guidance requires entities to disclose both gross and net information about both instruments and transactions eligible for offset in the statement of financial position and instruments and transactions subject to an agreement similar to a master netting arrangement. This guidance does not amend
F-40
Table of Contents
Global Brass and Copper Holdings, Inc.
Notes to Consolidated Financial Statements
(All amounts in thousands, except per share data)
existing guidance on when it is appropriate to offset. In January 2013, the FASB issued ASU 2013-01, Clarifying the Scope of Disclosures about Offsetting Assets and Liabilities, which limits the scope of ASU 2011-11 to derivatives, repurchase agreements and reverse repurchase agreements, and securities borrowing and lending arrangements. The guidance is effective for annual periods beginning January 1, 2013 and interim periods within those annual periods. Early adoption is not permitted, but retrospective application is required. Adoption of the guidance is not expected to have a material impact on the Company’s consolidated financial statements and disclosures.
| 3. | Inventories |
The Company’s inventories are as follows:
| As of December 31, | ||||||||
| 2012 | 2011 | |||||||
| Raw materials and supplies |
$ | 37,766 | $ | 21,320 | ||||
| Work-in-process |
69,286 | 93,555 | ||||||
| Finished goods |
67,326 | 71,072 | ||||||
|
|
|
|
|
|||||
| Total inventories |
$ | 174,378 | $ | 185,947 | ||||
|
|
|
|
|
|||||
During 2012, 2011 and 2010, inventory quantities were reduced resulting in a liquidation of LIFO inventory layers carried at lower costs prevailing in prior years as compared with current costs. In 2012, the effect of this reduction of inventory decreased cost of sales by $4,775 and increased net income attributable to Global Brass and Copper Holdings, Inc. by $2,908. In 2011, the effect of this reduction of inventory decreased cost of sales by $15,236 and increased net income attributable to Global Brass and Copper Holdings, Inc. by $9,291. In 2010, the effect of this reduction of inventory decreased cost of sales by $21,009 and increased net income by $12,862. If all inventories had been valued at period-end market values, inventories would have been approximately $319,282 and $347,840 at December 31, 2012 and December 31, 2011, respectively.
During 2012, the Company reduced the recorded value of inventory by $302. This non-cash, lower of cost or market adjustment was recorded in cost of sales in the accompanying consolidated statement of operations.
| 4. | Prepaid Expenses and Other Current Assets |
The Company’s prepaid expenses and other current assets are as follows:
| As of December 31, | ||||||||
| 2012 | 2011 | |||||||
| Collateral on deposit—commodity derivative contracts |
$ | 767 | $ | 4,622 | ||||
| Commodity derivative contracts |
548 | — | ||||||
| Deferred financing fees, net |
— | 3,646 | ||||||
| Loss fund payments—workers’ compensation |
6,968 | 7,538 | ||||||
| Prepaid insurance |
1,261 | 1,974 | ||||||
| Other |
2,597 | 2,132 | ||||||
|
|
|
|
|
|||||
| Total prepaid expenses and other current assets |
$ | 12,141 | $ | 19,912 | ||||
|
|
|
|
|
|||||
F-41
Table of Contents
Global Brass and Copper Holdings, Inc.
Notes to Consolidated Financial Statements
(All amounts in thousands, except per share data)
| 5. | Property, Plant and Equipment |
The Company’s property, plant and equipment balances are as follows:
| As of December 31, | Useful Life (in years) | |||||||||
| 2012 | 2011 | |||||||||
| Land and land improvements |
$ | 1,726 | $ | 1,598 | ||||||
| Buildings |
9,077 | 8,489 | 20 | |||||||
| Machinery and equipment |
55,175 | 42,715 | 12 | |||||||
| Information technology |
4,477 | 2,462 | 5 | |||||||
| Motor vehicles |
2,521 | 1,403 | 5 | |||||||
| Leasehold improvements |
1,083 | 127 | ||||||||
| Construction-in-process |
13,324 | 10,279 | ||||||||
|
|
|
|
|
|||||||
| Gross property, plant and equipment |
87,383 | 67,073 | ||||||||
| Accumulated depreciation |
(16,256 | ) | (9,517 | ) | ||||||
|
|
|
|
|
|||||||
| Property, plant and equipment, net |
$ | 71,127 | $ | 57,556 | ||||||
|
|
|
|
|
|||||||
Leasehold improvements are amortized over the lesser of their useful lives or the remaining lease term.
The Company capitalized interest relating to the construction of long-term assets in the amount of $557 in 2011. No interest was capitalized in 2012 or 2010.
| 6. | Intangible Assets |
Intangible assets other than goodwill consisted of the following:
| As of December 31, |
Amortization Period (in years) |
|||||||||||
| 2012 | 2011 | |||||||||||
| Gross carrying amount: |
||||||||||||
| Customer relationships |
$ | 1,350 | $ | 1,350 | 13 | |||||||
| Non-compete agreement |
380 | 380 | 4 | |||||||||
|
|
|
|
|
|||||||||
| Total gross intangible assets |
1,730 | 1,730 | ||||||||||
| Accumulated amortization: |
||||||||||||
| Customer relationships |
(511 | ) | (407 | ) | ||||||||
| Non-compete agreement |
(380 | ) | (372 | ) | ||||||||
|
|
|
|
|
|||||||||
| Total accumulated amortization |
(891 | ) | (779 | ) | ||||||||
|
|
|
|
|
|||||||||
| Intangible assets, net |
$ | 839 | $ | 951 | ||||||||
|
|
|
|
|
|||||||||
Amortization expense is expected to be incurred in subsequent years as follows:
| Year |
Amortization | |||
| 2013 |
$ | 104 | ||
| 2014 |
104 | |||
| 2015 |
104 | |||
| 2016 |
104 | |||
| 2017 |
104 | |||
| Thereafter |
319 | |||
|
|
|
|||
| $ | 839 | |||
|
|
|
|||
F-42
Table of Contents
Global Brass and Copper Holdings, Inc.
Notes to Consolidated Financial Statements
(All amounts in thousands, except per share data)
| 7. | Investment in Joint Venture |
In November 2007, the equity investment in Dowa, which was purchased as part of the metals business acquired from Olin Corporation, was recorded at a carrying value of zero as a result of the bargain purchase event recognized under the purchase method of accounting for the acquisition, creating a negative basis difference of $9,416. Based on management’s estimate as to the underlying commercial utility of the alloys that Dowa manufactured and sold at the date of acquisition, the negative basis difference is being accreted on a straight-line basis over a 13-year period as an increase to equity earnings. Accretion of the negative basis difference of $724 was reflected in equity income, net of tax in the accompanying consolidated statements of operations for each of the years ended December 31, 2012, 2011 and 2010. At December 31, 2012 and 2011, the remaining negative basis difference was $5,735 and $6,459, respectively.
During the years ended December 31, 2012, 2011 and 2010, the Company received cash dividends from Dowa of $1,000, $500 and $566, respectively, which were recorded as reductions in the Company’s investment in Dowa. During the years ended December 31, 2012, 2011 and 2010, the Company recorded $995, $888 and $1,530, respectively, of equity income, net of tax, including $724 of accretion of the negative basis difference in each year. The undistributed earnings of Dowa in GBC’s retained earnings as of December 31, 2012 and 2011 totaled $62 and $67, respectively.
| 8. | Other Noncurrent Assets |
Other noncurrent assets consisted of the following:
| As of December 31, | ||||||||
| 2012 | 2011 | |||||||
| Deferred financing fees, net |
$ | 17,082 | $ | 9,779 | ||||
| Utility and other deposits |
668 | 1,060 | ||||||
| Interest rate cap agreements |
1 | 157 | ||||||
| Other |
4 | 177 | ||||||
|
|
|
|
|
|||||
| Total other noncurrent assets |
$ | 17,755 | $ | 11,173 | ||||
|
|
|
|
|
|||||
As described in note 10, “Financing,” on June 1, 2012, GBC (i) issued $375,000 in aggregate principal amount of 9.50% senior secured notes due 2019 (the “Senior Secured Notes”), (ii) amended the agreement governing its asset-based revolving loan facility (the “2010 ABL Facility”, and, as currently amended, the “ABL Facility”), and (iii) repaid and retired its senior secured term loan credit facility (the “Term Loan Facility”) under the Credit and Guaranty Agreement dated August 18, 2010, as amended. The Company refers to these transactions as the “Term Loan Refinancing”.
As a result of the Term Loan Refinancing described above, the Company incurred and deferred debt issuance costs of $12,981, of which $10,196 was related to the Senior Secured Notes and $2,785 was for the ABL Facility. Additionally, $1,783 of unamortized debt issuance costs and $1,234 of unamortized issuance discount relating to the retired Term Loan Facility is being amortized over the term of the Senior Secured Notes in accordance with ASC 470-50, Modifications and Extinguishments.
F-43
Table of Contents
Global Brass and Copper Holdings, Inc.
Notes to Consolidated Financial Statements
(All amounts in thousands, except per share data)
| 9. | Accrued Liabilities |
Accrued liabilities consisted of the following:
| As of December 31, | ||||||||
| 2012 | 2011 | |||||||
| Commodity derivative contracts |
$ | — | $ | 1,825 | ||||
| Personnel expense |
20,872 | 20,548 | ||||||
| Workers’ compensation |
15,754 | 15,653 | ||||||
| Professional fees |
2,145 | 2,623 | ||||||
| Insurance |
2,253 | 1,689 | ||||||
| Utilities |
1,844 | 1,531 | ||||||
| Taxes |
1,745 | 1,471 | ||||||
| Other |
3,811 | 3,264 | ||||||
|
|
|
|
|
|||||
| Total accrued liabilities |
$ | 48,424 | $ | 48,604 | ||||
|
|
|
|
|
|||||
| 10. | Financing |
Long-term debt consisted of the following:
| As of December 31, | ||||||||
| 2012 | 2011 | |||||||
| ABL Facility |
$ | 14,522 | $ | — | ||||
| Senior Secured Notes |
375,000 | — | ||||||
| Term Loan Facility |
— | 310,875 | ||||||
| Discount, net of amortization |
— | (7,297 | ) | |||||
|
|
|
|
|
|||||
| 389,522 | 303,578 | |||||||
| Less: Current maturities of long-term debt |
— | 31,880 | ||||||
|
|
|
|
|
|||||
| Total long-term debt |
$ | 389,522 | $ | 271,698 | ||||
|
|
|
|
|
|||||
Senior Secured Notes
On June 1, 2012, GBC issued $375,000 in aggregate principal amount of 9.50% Senior Secured Notes due 2019. The Senior Secured Notes are guaranteed by Holdings and substantially all of the existing and future 100%-owned U.S. subsidiaries. The Senior Secured Notes are secured by a senior-priority security interest in the Company’s fixed assets (which secure the ABL Facility on a junior-priority basis) and by a junior-priority security interest in the Company’s accounts receivable and inventory (which secure the Company’s ABL Facility on a senior-priority basis).
The proceeds from the issuance of the Senior Secured Notes were used to repay the Term Loan Facility under the Credit and Guaranty Agreement and to fund a cash distribution of $160,000 to Halkos. The indenture governing the Senior Secured Notes contains covenants that limit GBC’s ability and the ability of restricted subsidiaries to, among other things: incur or guarantee additional debt or issue preferred stock; pay dividends; repurchase equity interests; repay subordinated indebtedness; make investments; create restrictions on the payment of dividends or other amounts to GBC from restricted subsidiaries; sell assets, including collateral; enter into
F-44
Table of Contents
Global Brass and Copper Holdings, Inc.
Notes to Consolidated Financial Statements
(All amounts in thousands, except per share data)
transactions with affiliates; merge or consolidate with another person, or sell or otherwise dispose of all or substantially all of GBC’s assets; and create liens on GBC’s or the restricted subsidiaries’ assets to secure debt. The credit agreement governing the ABL Facility and the indenture governing the Senior Secured Notes do, however, limit the ability of Global Brass and Copper, Inc. and its subsidiaries to dividend or distribute cash to Global Brass and Copper Holdings and to its equityholders, although ordinary course dividends and distributions to meet the limited holding company expenses and related obligations at Global Brass and Copper Holdings of up to $5 million per year are permitted under those agreements. Under the terms of the indenture governing the Senior Secured Notes, Global Brass and Copper, Inc. is also permitted to dividend or distribute to Global Brass and Copper Holdings and its equityholders up to 50% of its Consolidated Net Income (as defined in the indenture governing the Senior Secured Notes) from April 1, 2012 to the end of Global Brass and Copper’s most recently ended fiscal quarter. All of the net assets of the subsidiaries are restricted except for $16,432, which are permitted dividend distributions under the Company’s indenture governing the Senior Secured Notes. As of December 31, 2012, the Company was in compliance with all of its covenants relating to the Senior Secured Notes.
The Senior Secured Notes mature on June 1, 2019. Interest on the Senior Secured Notes accrues at the rate of 9.50% per annum and is payable semiannually in arrears on June 1 and December 1, commencing on December 1, 2012.
The Company is required to offer to redeem the Senior Secured Notes at a purchase price of 101% of their principal amount (plus accrued and unpaid interest) upon the occurrence of certain change of control events. In addition, upon the completion of certain asset dispositions, the Company may be required to offer to redeem the Senior Secured Notes at a purchase price of 100% of their principal amount (plus accrued and unpaid interest) if it does not apply the proceeds of such asset dispositions in accordance with the indenture by certain specified deadlines.
Pursuant to a registration rights agreement, dated as of June 1, 2012, the Company is required to effect a registered offer to issue registered new notes (with substantially the same terms as the Senior Secured Notes) in exchange for the Senior Secured Notes that the Company issued in a private offering on June 1, 2012. If the Company does not cause the registration statement for the exchange offer to go effective within 365 days after June 1, 2012, or otherwise fails to comply with the other deadlines in the registration rights agreement, it will be required to pay additional interest on the Senior Secured Notes equal to 0.25% per annum for each 90 days it is in default, up to a maximum of 0.50% per annum.
ABL Facility
Concurrent with the issuance of the Senior Secured Notes, the Company amended the ABL Facility to, among other things:
| • | increase the commitments under the facility from $150,000 to $200,000; |
| • | extend the maturity of the ABL Facility to June 1, 2017; |
| • | lower the applicable margin and unused line fee under the ABL Facility; |
| • | permit additional acquisitions, investments, restricted payments, asset sales and debt incurrences if certain conditions are satisfied; |
F-45
Table of Contents
Global Brass and Copper Holdings, Inc.
Notes to Consolidated Financial Statements
(All amounts in thousands, except per share data)
| • | increase the inventory loan limit for the borrowing base; |
| • | adjust certain reporting requirements and collateral audit requirements to make them less restrictive; and |
| • | reduce the excess availability threshold which requires testing of the fixed charge coverage ratio covenant. |
The Company refers to these amendments collectively as the “ABL Credit Facility Amendment”.
The ABL Facility provides for borrowings of up to the lesser of $200,000 or the Borrowing Base less outstanding loans and letters of credit. The Borrowing Base is defined as 85% of Eligible Accounts; plus the lesser of 80% of Eligible Inventory, 90% of the Net Recovery Percentage for the Eligible Inventory or the Inventory Loan Limit; minus Reserves. The maximum availability was $200,000 at December 31, 2012 and the Company had outstanding letters of credit of approximately $500 at December 31, 2012. In the event of increased commodity prices as indicated by the terms of the agreement, the Company may request, but the lenders are not obligated to, increase the maximum borrowings up to $250,000. At any time, if the amount outstanding under the ABL Facility exceeds the maximum allowable borrowings, the Company may be required to make a mandatory prepayment for the amount of the excess borrowings. At any time after the occurrence and during the continuance of a Trigger Event (as defined in the agreement governing the ABL Facility), subject to certain thresholds, reinvestment rights and other exceptions, proceeds received from asset sales, equity issuances or other specified events will be required to be applied (as mandatory prepayments) in whole or in part towards the extinguishment of outstanding amounts due under the ABL Facility.
The Company may elect to receive advances under the ABL Facility in the form of either prime rate advances or LIBOR rate advances, as defined by the agreement governing the ABL Facility. The unused portion under the ABL Facility determines the applicable spread added to the prime rate or LIBOR rate. The unused portion of the ABL Facility was $184,978 and $149,300 as of December 31, 2012 and 2011, respectively. Effective with the amendment described above, unused amounts under the ABL Facility incur an unused line fee at a rate of 0.50% per annum, payable in full on a quarterly basis (subject to certain possible adjustments on and after January 1, 2013). Also effective with the amendment described above, outstanding borrowings under the ABL Facility bear interest at a rate equal to either (i) for prime rate loans, a prime rate plus a spread between 1.0% and 1.5%, depending on excess availability levels or (ii) for LIBOR rate loans, LIBOR plus a spread of 2.0% to 2.5% depending on excess availability levels. As of December 31, 2012 and 2011, amounts outstanding under the ABL Facility accrued interest at a rate of 4.50% and 5.25%, respectively.
The ABL Facility has an expiration date of June 1, 2017 and contains various debt covenants to which the Company is subject on an ongoing basis. The ABL Facility restricts the Company’s ability to, among other things, incur indebtedness, grant liens, repurchase stock, issue cash dividends, make investments and acquisitions and sell assets, in each case subject to certain designated exceptions. Outstanding borrowings under the ABL Facility are secured by a senior-priority security interest in the Company’s accounts receivable and inventory (which secure the Senior Secured Notes on a junior-priority basis) and by a junior-priority security interest in the Company’s fixed assets (which secure the Senior Secured Notes on a senior-priority basis). As of December 31, 2012, the Company was in compliance with all of its covenants under the ABL Facility.
F-46
Table of Contents
Global Brass and Copper Holdings, Inc.
Notes to Consolidated Financial Statements
(All amounts in thousands, except per share data)
The ABL Facility contains customary events of default including, among others, failure to make payment when due, materially incorrect representations and warranties, breach of covenants, events of bankruptcy, or a change in control. In the case of an event of default occurring, the applicable interest rate spread increases by 2.0% and the lenders would have the option to call the outstanding amount due.
Term Loan Facility
On June 1, 2012, the Company repaid and retired its senior secured term loan credit facility under the Credit and Guaranty Agreement dated August 18, 2010, as amended, with proceeds received from the issuance of the Senior Secured Notes offering.
In connection with the termination prior to maturity of the Term Loan Facility, the Company recognized $19,612 as loss from extinguishment of debt for the fiscal year ended December 31, 2012 on the Company’s consolidated statements of operations. The loss on extinguishment of debt includes the write-off of $7,126 of unamortized debt issuance costs and $4,932 of unamortized debt discount as well as the payment of $6,394 of call premium and $21 of professional services fees related to the termination.
Furthermore, in accordance with ASC 470-50, Modifications and Extinguishments, $1,139 of costs associated with the issuance of the Senior Secured Notes was expensed as incurred and reflected in the loss from extinguishment of debt.
| 11. | Income Taxes |
Income before provision for income taxes and equity income is comprised of the following:
| Year Ended December 31, | ||||||||||||
| 2012 | 2011 | 2010 | ||||||||||
| Domestic |
$ | 24,583 | $ | 81,534 | $ | 61,903 | ||||||
| Foreign |
6,502 | 4,303 | 5,388 | |||||||||
|
|
|
|
|
|
|
|||||||
| Total |
$ | 31,085 | $ | 85,837 | $ | 67,291 | ||||||
|
|
|
|
|
|
|
|||||||
The provision for income taxes is summarized as follows:
| Year Ended December 31, | ||||||||||||
| 2012 | 2011 | 2010 | ||||||||||
| Current tax provision |
||||||||||||
| U.S. federal |
$ | 10,329 | $ | 16,518 | $ | 13,663 | ||||||
| State and local |
1,923 | 3,347 | 5,660 | |||||||||
| Foreign |
1,685 | 1,081 | 1,312 | |||||||||
|
|
|
|
|
|
|
|||||||
| Total current |
13,937 | 20,946 | 20,635 | |||||||||
|
|
|
|
|
|
|
|||||||
| Deferred tax provision |
||||||||||||
| U.S. federal |
4,389 | 10,209 | 5,760 | |||||||||
| State and local |
571 | 188 | 372 | |||||||||
| Foreign |
288 | 94 | (91 | ) | ||||||||
|
|
|
|
|
|
|
|||||||
| Total deferred |
5,248 | 10,491 | 6,041 | |||||||||
|
|
|
|
|
|
|
|||||||
| Total provision |
$ | 19,185 | $ | 31,437 | $ | 26,676 | ||||||
|
|
|
|
|
|
|
|||||||
F-47
Table of Contents
Global Brass and Copper Holdings, Inc.
Notes to Consolidated Financial Statements
(All amounts in thousands, except per share data)
The effective income tax rate differs from the amount determined by applying the applicable U.S. statutory federal income tax rate to pretax results primarily as a result of the following:
| Year Ended December 31, | ||||||||||||
| 2012 | 2011 | 2010 | ||||||||||
| Statutory provision rate |
35.0 | % | 35.0 | % | 35.0 | % | ||||||
| Permanent differences and other items |
||||||||||||
| State tax provision |
6.7 | % | 3.9 | % | 6.0 | % | ||||||
| Section 199 manufacturing credit |
(3.2 | %) | (2.3 | %) | (1.5 | %) | ||||||
| Incremental tax effects of foreign earnings |
1.8 | % | 0.2 | % | 0.3 | % | ||||||
| Return to provision adjustments |
1.2 | % | (0.7 | %) | (2.2 | %) | ||||||
| Re-rate of deferred taxes |
(0.8 | %) | (0.3 | %) | (0.2 | %) | ||||||
| Non-deductible non-cash compensation |
22.0 | % | 0.4 | % | 1.8 | % | ||||||
| Other |
(1.0 | %) | 0.4 | % | 0.4 | % | ||||||
|
|
|
|
|
|
|
|||||||
| Effective income tax rate |
61.7 | % | 36.6 | % | 39.6 | % | ||||||
|
|
|
|
|
|
|
|||||||
The “Non-deductible non-cash compensation” expense as described further in note 17, “Profits Interest Awards,” is not deductible in the Company’s tax returns and has been reflected as a permanent difference in the effective tax rate reconciliations above.
Deferred tax assets and liabilities are comprised of the following:
| As of December 31, | ||||||||
| 2012 | 2011 | |||||||
| Deferred tax assets |
||||||||
| Inventory |
$ | 48,932 | $ | 50,936 | ||||
| Accruals and other reserves |
7,721 | 8,376 | ||||||
| Financing fees |
— | 731 | ||||||
| Accounts receivable |
1,082 | 939 | ||||||
| UNICAP adjustment |
1,278 | 1,319 | ||||||
| Derivative contracts |
487 | 1,104 | ||||||
| Other |
680 | — | ||||||
|
|
|
|
|
|||||
| Gross deferred tax assets |
$ | 60,180 | $ | 63,405 | ||||
| Deferred tax liabilities |
||||||||
| Investments in foreign entities |
$ | 7,310 | $ | 6,507 | ||||
| Fixed assets and intangibles |
11,122 | 7,139 | ||||||
| Financing fees |
2,145 | — | ||||||
| Other |
— | 762 | ||||||
|
|
|
|
|
|||||
| Gross deferred tax liability |
20,577 | 14,408 | ||||||
|
|
|
|
|
|||||
| Net deferred tax asset |
$ | 39,603 | $ | 48,997 | ||||
|
|
|
|
|
|||||
| Net current deferred tax asset |
$ | 33,465 | $ | 29,027 | ||||
| Net long-term deferred tax asset |
6,138 | 19,970 | ||||||
|
|
|
|
|
|||||
| Net deferred tax asset |
$ | 39,603 | $ | 48,997 | ||||
|
|
|
|
|
|||||
F-48
Table of Contents
Global Brass and Copper Holdings, Inc.
Notes to Consolidated Financial Statements
(All amounts in thousands, except per share data)
At December 31, 2012, the inventory deferred tax asset includes $25,521 related to the impact of the November 19, 2007 purchase price allocations to LIFO inventories for tax purposes, which resulted in a bargain purchase gain. There is a corresponding liability recorded in the Company’s other noncurrent liabilities in accordance with the provisions of ASC 740, Income Taxes.
The net deferred tax assets do not require a valuation allowance at December 31, 2012 and 2011 as it is more likely than not that the tax benefit will be realized.
The Company does not assert permanent reinvestment on the excess of its financial reporting over tax basis of its foreign investments. As a result, deferred tax liabilities of $7,310 and $6,507 have been established on the U.S. federal and state income taxes, net of applicable credits, on the excess financial reporting over tax basis of its foreign entities at December 31, 2012 and 2011, respectively. The Company plans foreign remittance amounts based on projected cash flow needs as well as the working capital and long-term investment requirements of its foreign subsidiaries and its domestic operations.
At December 31, 2012, the Company has a foreign tax credit carryforward of $514 which will expire by 2022.
Uncertain Tax Positions
The Company accounts for its income tax positions under the provisions of ASC 740, which was initially adopted on November 19, 2007. ASC 740 prescribes a minimum threshold a tax position is required to meet before being recognized in these consolidated financial statements. ASC 740 requires the Company to recognize in its consolidated financial statements tax positions determined more likely than not to be sustained upon examination, based on the technical merits of the position.
The Company is subject to income taxation in several jurisdictions around the world. Resolution of the related tax positions through negotiations with relevant tax authorities or through litigation may take years to complete. Therefore, it is difficult to predict the timing for resolution of tax positions. However, the Company does not anticipate that the total amount of unrecognized tax benefits will increase or decrease significantly in the next twelve months. The Company’s U.S. federal returns and the majority of state returns for the period ended September 30, 2009 and all subsequent periods remain open for audit. The Company’s federal returns are currently under examination by the Internal Revenue Service for the periods ended September 30, 2009 through December 31, 2010. The Company believes it has adequately reserved for any potential tax exposures at December 31, 2012.
At December 31, 2012 and 2011, the Company had $27,401 and $31,340, respectively, of unrecognized tax benefits, none of which would impact the effective tax rate, if recognized. Estimated interest and penalties related to the underpayment of income taxes are classified as a component of income tax expense in the accompanying consolidated statements of operations. Accrued interest and penalties as of December 31, 2012 and 2011 were $35 and $301, respectively. The Company’s liability for uncertain tax positions, including accrued interest and penalties, of $27,436 and $31,641 at December 31, 2012 and 2011, respectively, are presented in other noncurrent liabilities.
F-49
Table of Contents
Global Brass and Copper Holdings, Inc.
Notes to Consolidated Financial Statements
(All amounts in thousands, except per share data)
A reconciliation of the summary of activity of the Company’s uncertain tax positions is summarized as follows:
| Balance at January 1, 2011 |
$ | 35,483 | ||
| Additions for tax positions related to prior years |
207 | |||
| Reductions for tax positions related to prior years |
(4,350 | ) | ||
|
|
|
|||
| Balance at December 31, 2011 |
$ | 31,340 | ||
| Additions for tax positions related to prior years |
— | |||
| Reductions for tax positions related to prior years |
(1,963 | ) | ||
| Reductions due to tax settlements |
(1,515 | ) | ||
| Reductions due to tax statute of limitations |
(461 | ) | ||
|
|
|
|||
| Balance at December 31, 2012 |
$ | 27,401 | ||
|
|
|
From 2007 through 2009, the Company’s tax year end was September 30 and its fiscal year end was December 31. During 2010, the Company filed a request to change its tax year end to December 31. The effective date of this request was December 31, 2010. Accordingly, the Company filed a stub year income tax return for the period from October 1, 2010 through December 31, 2010.
| 12. | Employee Defined Contribution Plans and Multi-Employer Pension Plans |
The Company has a retirement savings plan (the “Plan”) for all of its domestic subsidiaries under section 401(k) of the Internal Revenue Code that covers all U.S. salaried and most hourly employees. Participants may elect to defer a percentage of their compensation to the Plan, subject to aggregate limits required by the Internal Revenue Code. The Plan provides for discretionary matching contributions under certain circumstances, for employees based on location, pay status and membership in a collective bargaining unit. In addition, the Company provides a retirement contribution to certain employees based on location and age. The Company contributed $7,439, $7,412 and $6,599 to the Plan for the years ended December 31, 2012, 2011 and 2010, respectively.
Bargaining unit employees in East Alton, IL and Alliance, OH participate in the IAM National Pension Plan (“IAM Plan”). The IAM Plan is a multi-employer pension plan with negotiated fixed company costs per employee hour worked. The risks of participating in these multiemployer plans are different from single-employer plans, as the Company can be subject to additional risks if others do not meet their obligations. The Company recorded expense of $2,714, $2,669 and $2,779 for the years ended December 31, 2012, 2011 and 2010, respectively, which are included in cost of sales in the consolidated statement of operations. The Company’s participation in the IAM Plan for the annual period ended December 31, 2012, is outlined in the table below. There have been no significant changes that affect the comparability of 2012 and 2011 contributions. The IAM Plan reported $350,359 and $332,430 in employers’ contributions for the years ended December 31, 2012 and 2011, respectively.
F-50
Table of Contents
Global Brass and Copper Holdings, Inc.
Notes to Consolidated Financial Statements
(All amounts in thousands, except per share data)
| Pension Fund | IAM National Pension Fund | |
| EIN/ Pension Plan Number | 51-6031295 / 002 | |
| Pension Protection Act Zone Status (2011 and 2010)* | Green Zone | |
| FIP/RP Status Pending/Implemented | No | |
| Company Contributions (FY 2012) | $2,699 | |
| Company Contributions (FY 2011) | $2,689 | |
| Surcharge Imposed | No | |
| Expiration Date of Collective-Bargaining Agreement | November 3, 2013 |
| * | Plans in the green zone are at least 80 percent funded. |
At the date the financial statements were issued, Forms 5500 were not available for the plan year ended in 2012.
| 13. | Derivative Contracts |
The Company maintains a metal, natural gas and electricity pricing risk-management strategy that uses commodity derivative contracts to minimize significant, unanticipated gains or losses and cash fluctuations that may arise from volatility of the commodity indices.
The Company’s commodity derivative contracts consist of delivery contracts matched in quantity, price and maturity to firm price sales orders, in circumstances where physical firm price metal is unavailable, in order to protect sales margins from metal price fluctuations between the firm price sale order date and shipment date.
The prices of natural gas and electricity can be particularly volatile. As a result, our natural gas and electricity costs may fluctuate dramatically. The Company attempts to mitigate short-term volatility in natural gas and electricity costs through the use of derivatives contracts in an effort to offset the effect of increasing costs.
The Company also utilized interest rate cap agreements in compliance with the requirement under the Term Loan Facility to provide that at least 50% of the term loan be subject to a fixed rate or interest rate protection for a period of not less than three years. During 2010, the Company entered into three-year interest rate cap agreements that capped the interest rate on $300,000 of the aggregate principal outstanding. The interest rate cap agreements are not designated as an accounting hedge and changes in the fair value of the interest rate cap agreements are recorded as non-cash interest expense.
By using derivative contracts to limit exposures to fluctuations in metal, natural gas and electricity prices and interest rate movements, the Company exposes itself to credit risk and market risk. Credit risk is the risk that the counterparty might fail to fulfill its performance obligations under the terms of the derivative contract. Market risk is the risk that the value of a derivative instrument might be adversely affected by a change in commodity price or interest rates. The Company manages the market risk associated with derivative contracts by establishing and monitoring parameters that limit the types and degree of market risk that may be undertaken.
The Company primarily executes derivative contracts with major financial institutions. These counterparties expose the Company to credit risk in the event of non-performance. The amount of such exposure is limited to the fair value of the derivative contract plus the unpaid portion of amounts due to the Company pursuant to terms of the derivative contracts, if any. If a downgrade
F-51
Table of Contents
Global Brass and Copper Holdings, Inc.
Notes to Consolidated Financial Statements
(All amounts in thousands, except per share data)
in the credit rating of these counterparties occurs, management believes that this exposure is mitigated by provisions in the derivative arrangements which allow for the legal right of offset of any amounts due to the Company from the counterparties with any amounts payable to the counterparties by the Company.
The fair values of derivative contracts in the consolidated balance sheet include the impact of netting derivative assets and liabilities when a legally enforceable master netting arrangement exists. The following tables summarize the gross amounts of recognized derivative assets and liabilities, the net amounts presented in the consolidated balance sheet, and the net amounts after deducting collateral that has been deposited with counterparties:
| As of December 31, 2012 | ||||||||||||||||||||||||
| Amounts Not Offset in the Consolidated Balance Sheet |
||||||||||||||||||||||||
| Gross Amounts of Recognized Assets |
Gross Amounts Offset in Consolidated Balance Sheet |
Net Amounts of Assets Presented in Consolidated Balance Sheet |
Financial Instruments |
Cash Collateral Received |
Net Amount |
|||||||||||||||||||
| Open metals contracts |
$ | 603 | $ | (224 | ) | $ | 379 | $ | — | $ | — | $ | 379 | |||||||||||
| (208 contracts) |
||||||||||||||||||||||||
| Open natural gas contracts |
2 | — | 2 | — | — | 2 | ||||||||||||||||||
| (6 contracts) |
||||||||||||||||||||||||
| Open electricity contracts |
169 | (2 | ) | 167 | — | — | 167 | |||||||||||||||||
| (17 contracts) |
||||||||||||||||||||||||
| Interest rate cap agreements |
1 | — | 1 | — | — | 1 | ||||||||||||||||||
| (2 contracts) |
||||||||||||||||||||||||
|
|
|
|
|
|
|
|
|
|
|
|
|
|||||||||||||
| Total |
$ | 775 | $ | (226 | ) | $ | 549 | $ | — | $ | — | $ | 549 | |||||||||||
|
|
|
|
|
|
|
|
|
|
|
|
|
|||||||||||||
| Consolidated balance sheet location: |
|
|||||||||||||||||||||||
| Prepaid expenses and other current assets |
|
$ | 548 | |||||||||||||||||||||
| Other noncurrent assets |
|
1 | ||||||||||||||||||||||
|
|
|
|||||||||||||||||||||||
| Total |
|
$ | 549 | |||||||||||||||||||||
|
|
|
|||||||||||||||||||||||
| Amounts Not Offset in the Consolidated Balance Sheet |
||||||||||||||||||||||||
| Gross Amounts of Recognized Liabilities |
Gross Amounts Offset in Consolidated Balance Sheet |
Net Amounts of Liabilities Presented in Consolidated Balance Sheet |
Financial Instruments |
Cash Collateral Deposited |
Net Amount |
|||||||||||||||||||
| Open metals contracts |
$ | 224 | $ | (224 | ) | $ | — | $ | — | $ | — | $ | — | |||||||||||
| (85 contracts) |
||||||||||||||||||||||||
| Open electricity contracts |
2 | (2 | ) | — | — | — | — | |||||||||||||||||
| (1 contract) |
||||||||||||||||||||||||
|
|
|
|
|
|
|
|
|
|
|
|
|
|||||||||||||
| Total |
$ | 226 | $ | (226 | ) | $ | — | $ | — | $ | — | $ | — | |||||||||||
|
|
|
|
|
|
|
|
|
|
|
|
|
|||||||||||||
F-52
Table of Contents
Global Brass and Copper Holdings, Inc.
Notes to Consolidated Financial Statements
(All amounts in thousands, except per share data)
Not included in the table above is $767 of collateral included in Prepaid Expenses and Other Current Assets, which is because collateral is limited to the net amounts of assets or liabilities presented in the consolidated balance sheet.
| As of December 31, 2011 | ||||||||||||||||||||||||
| Gross Amounts Not Offset in the Consolidated Balance Sheet |
||||||||||||||||||||||||
| (dollars in thousands) | Gross Amounts of Recognized Assets |
Gross Amounts Offset in Consolidated Balance Sheet |
Net Amounts of Assets Presented in Consolidated Balance Sheet |
Financial Instruments |
Cash Collateral Received |
Net Amount |
||||||||||||||||||
| Open metals contracts (88 contracts) |
$ | 294 | $ | (294 | ) | $ | — | $ | — | $ | — | $ | — | |||||||||||
| Open electricity contracts (6 contracts) |
43 | (43 | ) | — | — | — | — | |||||||||||||||||
| Interest rate cap agreements (2 contracts) |
157 | — | 157 | — | — | 157 | ||||||||||||||||||
|
|
|
|
|
|
|
|
|
|
|
|
|
|||||||||||||
| Total |
$ | 494 | $ | (337 | ) | $ | 157 | $ | — | $ | — | $ | 157 | |||||||||||
|
|
|
|
|
|
|
|
|
|
|
|
|
|||||||||||||
| Consolidated balance sheet location: |
||||||||||||||||||||||||
| Other noncurrent assets |
$ | 157 | ||||||||||||||||||||||
|
|
|
|||||||||||||||||||||||
| Gross Amounts Not Offset in the Consolidated Balance Sheet |
||||||||||||||||||||||||
| (dollars in thousands) | Gross Amounts of Recognized Liabilities |
Gross Amounts Offset in Consolidated Balance Sheet |
Net Amounts of Liabilities Presented in Consolidated Balance Sheet |
Financial Instruments |
Cash Collateral Deposited |
Net Amount |
||||||||||||||||||
| Open metals contracts (151 contracts) |
$ | 1,647 | $ | (294 | ) | $ | 1,353 | $ | — | $ | (1,353 | ) | $ | — | ||||||||||
| Open natural gas contracts (31 contracts) |
384 | — | 384 | — | (384 | ) | — | |||||||||||||||||
| Open electricity contracts (8 contracts) |
131 | (43 | ) | 88 | — | — | 88 | |||||||||||||||||
|
|
|
|
|
|
|
|
|
|
|
|
|
|||||||||||||
| Total |
$ | 2,162 | $ | (337 | ) | $ | 1,825 | $ | — | $ | (1,737 | ) | $ | 88 | ||||||||||
|
|
|
|
|
|
|
|
|
|
|
|
|
|||||||||||||
| Consolidated balance sheet location: |
||||||||||||||||||||||||
| Accrued liabilities |
$ | 1,825 | ||||||||||||||||||||||
|
|
|
|||||||||||||||||||||||
F-53
Table of Contents
Global Brass and Copper Holdings, Inc.
Notes to Consolidated Financial Statements
(All amounts in thousands, except per share data)
Not included in the table above is $2,885 of collateral included in Prepaid Expenses and Other Current Assets, which is because collateral is limited to the net amounts of assets or liabilities presented in the consolidated balance sheet.
The following table summarizes the effects of derivative contracts in the consolidated statements of operations:
| Year Ended December 31, | ||||||||||||
| 2012 | 2011 | 2010 | ||||||||||
| Cost of sales |
||||||||||||
| Realized and unrealized loss—metal contracts |
$ | 1,339 | $ | 3,884 | $ | 7,605 | ||||||
| Realized and unrealized loss—natural gas contracts |
76 | 517 | 1,825 | |||||||||
| Realized and unrealized loss—electricity contracts |
243 | 57 | — | |||||||||
|
|
|
|
|
|
|
|||||||
| Total |
$ | 1,658 | $ | 4,458 | $ | 9,430 | ||||||
|
|
|
|
|
|
|
|||||||
| Interest expense |
||||||||||||
| Unrealized loss (gain)—interest rate cap agreements |
$ | 156 | $ | 1,851 | $ | (800 | ) | |||||
|
|
|
|
|
|
|
|||||||
| 14. | Fair Value Measurements |
ASC 820 defines fair value, establishes a framework for measuring fair value and enhances disclosures about fair value measures required under other accounting pronouncements but does not change existing guidance as to whether or not an instrument is carried at fair value. This guidance also specifies a fair value hierarchy based upon the observability of inputs used in valuation techniques. In accordance with this guidance, fair value measurements are classified under the following hierarchy:
| • | Level 1—Quoted prices for identical instruments in active markets. |
| • | Level 2—Quoted prices for similar instruments in active markets; quoted prices for identical or similar instruments in markets that are not active and model-derived valuations in which all significant inputs or significant value-drivers are observable in active markets. |
| • | Level 3—Model-derived valuations in which one or more significant inputs or significant value-drivers are unobservable. |
The following tables provide the hierarchy of inputs used to derive the fair value of the Company’s assets and liabilities measured at fair value on a recurring basis as of December 31, 2012 and December 31, 2011:
| As of December 31, 2012 | ||||||||||||||||
| Level 1 | Level 2 | Level 3 | Total | |||||||||||||
| Open metal contracts |
$ | — | $ | 379 | $ | — | $ | 379 | ||||||||
| Open natural gas contracts |
— | 2 | — | 2 | ||||||||||||
| Open electricity contracts |
— | 167 | — | 167 | ||||||||||||
| Interest rate cap agreements |
— | 1 | — | 1 | ||||||||||||
|
|
|
|
|
|
|
|
|
|||||||||
| Total assets |
$ | — | $ | 549 | $ | — | $ | 549 | ||||||||
|
|
|
|
|
|
|
|
|
|||||||||
F-54
Table of Contents
Global Brass and Copper Holdings, Inc.
Notes to Consolidated Financial Statements
(All amounts in thousands, except per share data)
| As of December 31, 2011 | ||||||||||||||||
| Level 1 | Level 2 | Level 3 | Total | |||||||||||||
| Interest rate cap agreements |
$ | — | $ | 157 | $ | — | $ | 157 | ||||||||
|
|
|
|
|
|
|
|
|
|||||||||
| Total assets |
$ | — | $ | 157 | $ | — | $ | 157 | ||||||||
|
|
|
|
|
|
|
|
|
|||||||||
| Open metal contracts |
$ | — | $ | 1,353 | $ | — | $ | 1,353 | ||||||||
| Open natural gas contracts |
— | 384 | — | 384 | ||||||||||||
| Open electricity contracts |
— | 88 | — | 88 | ||||||||||||
|
|
|
|
|
|
|
|
|
|||||||||
| Total liabilities |
$ | — | $ | 1,825 | $ | — | $ | 1,825 | ||||||||
|
|
|
|
|
|
|
|
|
|||||||||
In accordance with ASC 820, the Company determines the fair value of its interest rate agreement and commodity derivative contracts using Level 2 inputs.
The Company’s metal, natural gas and electricity commodity derivative contracts are considered Level 2 as fair value measurements consist of both quoted price inputs and inputs provided by a third party that are derived principally from or corroborated by observable market data by correlation. These assumptions include, but are not limited to, those concerning interest rates, credit rates, discount rates, default rates and other factors. All derivative commodity contracts have a set term of 24 months or less.
The Company’s interest rate cap agreements are considered Level 2 fair value measurements as the pricing is derived from discounting the future expected cash flows that would occur if variable interest rates rise above the strike rates of the caps. The variable interest rates used in the calculation of projected cash flows on the caps are based on an expectation of future interest rates derived from observable market interest rate curves (LIBOR forward curves) and volatilities that are observable at commonly quoted intervals.
The Company does not hold assets or liabilities requiring a Level 3 measurement and there have not been any transfers between the hierarchy levels during 2012 or 2011.
For purposes of financial reporting, the Company has determined that the carrying value of cash, accounts receivable, accounts payable, and accrued expenses approximates fair value due to the short maturities of these instruments. Additionally, given the revolving nature and the variable interest rates, the Company has determined that the carrying value of the ABL Facility also approximates fair value. As of December 31, 2012, the fair value of the Company’s Senior Secured Notes approximated $406,875. The fair value of the Senior Secured Notes was based upon quotes from financial institutions (Level 2 in the fair value hierarchy as defined by ASC 820).
| 15. | Related Parties |
KPS Special Situations Fund II, L.P., KPS Special Situations Fund II (A), L.P., KPS Special Situations Fund III, L.P. and KPS Special Situations Fund III (A), L.P. (together, “KPS Funds”) are majority shareholders of Halkos. Halkos owns all of the outstanding shares of Holdings. On June 1, 2012, the Company distributed $160,000 to Halkos (see note 10, “Financing”).
The Company and KPS Funds have entered into an agreement whereby affiliates of KPS Funds charge the Company for services of their personnel engaged in line or staff functions relating specifically to the operations of the Company (the “Management Services Agreement”). The charges, which are included in selling, general and administrative expenses, were $1,000 for each
F-55
Table of Contents
Global Brass and Copper Holdings, Inc.
Notes to Consolidated Financial Statements
(All amounts in thousands, except per share data)
of the years ended December 31, 2012, 2011 and 2010, of which $250 is included in accrued liabilities at December 31, 2012 and 2011. Additionally, pursuant to the Management Services Agreement, the Company is required to reimburse the KPS Funds for all reasonable costs and expenses incurred in connection with the services provided. These costs were $77, $167 and $102 for the year ended December 31, 2012, 2011 and 2010, respectively.
The Company and KPS Funds entered into an agreement dated October 18, 2011 whereby the KPS Funds agreed to reimburse the Company for specific incremental costs directly attributable to an offering of equity securities (the “KPS Reimbursement Obligation”). As of December 31, 2012 and 2011, the Company has recorded $4,875 and $2,451, respectively, as a receivable from stockholder pertaining to the KPS Reimbursement Obligation.
| 16. | Commitments and Contingencies |
Environmental Considerations
The Company is subject to a variety of environmental laws and regulations governing discharges to air and water, the handling, storage and disposal of hazardous or solid waste materials and the remediation of contamination associated with releases of hazardous substances. Although the Company believes it is in material compliance with all of the various regulations applicable to its business, there can be no assurance that requirements will not change in the future or that the Company will not incur significant cost to comply with such requirements. The Company employs responsible personnel at each facility, along with various environmental engineering consultants from time to time to assist with ongoing management of environmental, health and safety requirements. Management expenses environmental costs related to existing conditions resulting from past or current operations and from which no current or future benefit is discernible. Expenditures that extend the life of the related property are capitalized. The Company determines its liability on a location by location basis and records a liability at the time it is deemed probable and can be reasonably estimated. The Company is currently not aware of any environmental matters which may have a material impact on the Company’s financial position, results of operations, or liquidity.
On November 19, 2007 (the date of inception of GBC), the Company acquired the assets and operations relating to the worldwide metals business of Olin Corporation. Olin Corporation agreed to retain liability arising out of the existing conditions on certain of our properties for any remedial actions required by environmental laws, and agreed to indemnify the Company for all or part of a number of other environmental liabilities. Since 2007, Olin Corporation has been performing remedial actions at the facilities in East Alton, Illinois and Waterbury, Connecticut, and has been participating in remedial actions at certain other properties as well. If Olin Corporation were to stop its environmental remedial activities at the Company’s properties, the Company could be required to assume responsibility for these activities, the cost of which could be material.
Insurance Coverage
The Company maintains Comprehensive Medical Plans for employees of GBC and its subsidiaries (the “Plans”) to provide health insurance for eligible employees on a self-insured basis. The Plans are covered by a stop loss policy for those benefits provided on a self-insured basis with a deductible of $275 per occurrence for all GBC employees, except for employees of our Chase Brass division, which has a deductible of $100 per occurrence and a specific stop loss maximum of $2,000.
F-56
Table of Contents
Global Brass and Copper Holdings, Inc.
Notes to Consolidated Financial Statements
(All amounts in thousands, except per share data)
The Company is self-insured for workers’ compensation claims assumed from its predecessor company for activity prior to November 19, 2007 and benefits paid under employee health care programs. Workers’ compensation claims relating to activity after November 19, 2007 are covered by a loss funding insurance arrangement whereby the Company makes a fixed payment to the insurer which is used to pay submitted claims. The Company is self-insured for annual workers’ compensation costs relating to activity after November 19, 2007 of up to $500 per occurrence.
Legal Considerations
The Company is party to various legal proceedings arising in the ordinary course of business. The Company believes that none of its lawsuits are individually material or that the aggregate exposure of all of its lawsuits, including those that are probable and those that are only reasonably possible, is material to its financial condition, results of operations or cash flows.
Operating Leases
The Company has operating leases covering certain of its facilities and equipment under non-cancelable lease agreements.
Future minimum lease payments under non-cancelable leases in effect are as follows:
| Year |
Payment | |||
| 2013 |
$ | 2,654 | ||
| 2014 |
1,621 | |||
| 2015 |
956 | |||
| 2016 |
612 | |||
| 2017 |
122 | |||
| Thereafter |
— | |||
|
|
|
|||
| Total minimum lease payments |
$ | 5,965 | ||
|
|
|
|||
Rental expense under all operating leases was approximately $3,606, $3,603 and $3,543 for the years ended December 31, 2012, 2011 and 2010, respectively, and is recorded in cost of sales or selling, general and administrative costs depending on the nature and use of the underlying asset being leased.
| 17. | Profits Interest Awards |
Halkos has granted, pursuant to the Halkos Equity Plan, non-voting membership interests to select members of the Company’s management titled Class B, C and D Shares. The Class B, C and D Shares are profits interests in Halkos.
Class B Shares
In 2007, in connection with the issuance of Class C and D Shares, Halkos issued Class B Shares to certain members of the Company’s management. Halkos issued additional Class B Shares in 2010 and 2011 to certain members of the Company’s management. Class B Shares generally vest over a period of three years. Despite the fact that these Shares are in the form of equity, the Class B Shares are considered a profit sharing plan due to certain aspects of the plan, primarily
F-57
Table of Contents
Global Brass and Copper Holdings, Inc.
Notes to Consolidated Financial Statements
(All amounts in thousands, except per share data)
the ability of Halkos to repurchase the Shares at no cost from the employee holding such shares. Award recipients substantively derive economic value in the instrument through profit sharing distributions. Accordingly, the Class B Shares are a compensation liability award accounted for as a profit sharing arrangement by Halkos. Because the awards were granted by Halkos, an economic interest holder of the Company, to employees of the Company, distributions are accounted for by the Company as non-cash compensation expense with a corresponding increase in additional paid-in capital to reflect the deemed capital contribution by Halkos. Expense on the Class B Shares is recorded in the period in which distributions to Class B award holders are determined to be probable.
During the years ended December 31, 2012, 2011 and 2010, certain members of the Company’s management received distributions from Halkos in the amount of $20,110, $292 and $3,452, respectively. The Company recorded the distributions as non-cash compensation expense with a corresponding increase in additional paid in capital in the period in which these distributions were determined to be probable. Non-cash compensation expense of $19,517, $885 and $3,452 is included as a component of selling, general and administrative expenses in the consolidated statements of operations for the years ended December 31, 2012, 2011 and 2010, respectively.
Class C and D Shares
In June 2011, the Halkos limited liability company agreement was amended and the Class C and D Shares were converted to Class B Shares at fair value. No expense relative to these awards is reflected in the accompanying consolidated financial statements. The conversion was in effect a liability to liability modification and the achievement of the Class C and D Shares performance condition was not probable nor were there any probable distributions payable for Class B Shares at the time of conversion.
| 18. | Segment Information |
The Company’s Chief Operating Decision Maker allocates resources and evaluates performance at the divisional level. As such, the Company has determined that it has three reportable segments: Olin Brass, Chase and Oster.
The Olin Brass segment is the leading manufacturer and converter of copper and copper-alloy sheet, strip, foil, and fabricated components in North America. While primarily processing copper and copper-alloys, the segment also rerolls and forms other metals such as stainless and carbon steel. Olin Brass’s products are used in five primary end markets: building and housing, munitions, automotive, coinage, and electronics/electrical components.
Chase is a leading North American manufacturer of brass rod. The segment principally produces brass rod in sizes ranging from 1/4 inch to 4.5 inches in diameter. The key attributes of brass rod include its machinability, corrosion resistance and moderate strength, making it ideal for forging and machining products such as valves and fittings. Chase produces brass rod used in production applications which can be grouped into four end markets: building and housing, transportation, electronics/electrical components and industrial machinery and equipment.
Oster is a leading copper-alloy distributor and processor. The segment, through its family of metal service centers, is strategically focused on satisfying its customers’ needs for brass and copper parts and other products, with a high level of service, quality and flexibility by offering customization and just-in-time delivery. Value-added processing services include precision slitting
F-58
Table of Contents
Global Brass and Copper Holdings, Inc.
Notes to Consolidated Financial Statements
(All amounts in thousands, except per share data)
and traverse winding to provide greater customer press up-time, hot air level tinning for superior corrosion resistance and product enhancement such as edging and cutting. Important Oster end markets include building and housing, automotive, transportation, and electronics/electrical components (primarily for housing and commercial construction).
The Chief Operating Decision Maker evaluates performance and determines resource allocations based on a number of factors, the primary performance measure being Segment Adjusted EBITDA.
Segment Adjusted EBITDA is an EBITDA based measure of operating performance, with EBITDA being defined by the Company as net income before depreciation and amortization, interest expense, and income taxes. The Company defines Segment Adjusted EBITDA as EBITDA further adjusted to remove the impacts of inventory values for LIFO and lower of cost or market charges, the cost of terminating certain collateral hedges, unrealized mark to market gains and losses on derivative instruments, non-cash compensation expense, loss on extinguishment of debt and non-cash income accretion related to the Company’s joint venture investment, each of which are excluded because management believes they are not indicative of the ongoing performance of the Company’s core operations. Corporate and Eliminations include corporate amounts, primarily compensation, tax and overhead costs unrelated to a specific segment, and elimination of intercompany balances. The Chief Operating Decision Maker is not provided with nor reviews assets by segment for purposes of allocating resources.
F-59
Table of Contents
Global Brass and Copper Holdings, Inc.
Notes to Consolidated Financial Statements
(All amounts in thousands, except per share data)
Below is a reconciliation of the Company’s Segment Adjusted EBITDA to income before provision for income taxes and equity income:
| Year Ended December 31, | ||||||||||||||||
| 2012 | 2011 | 2010 | ||||||||||||||
| Net Sales, External Customers |
||||||||||||||||
| Olin Brass |
$ | 676,563 | $ | 718,244 | $ | 710,271 | ||||||||||
| Chase |
647,711 | 704,968 | 611,870 | |||||||||||||
| Oster |
326,246 | 355,931 | 336,588 | |||||||||||||
|
|
|
|
|
|
|
|||||||||||
| Total net sales, external customers |
$ | 1,650,520 | $ | 1,779,143 | $ | 1,658,729 | ||||||||||
|
|
|
|
|
|
|
|||||||||||
| Intersegment Net Sales |
||||||||||||||||
| Olin Brass |
$ | 46,287 | $ | 48,312 | $ | 57,919 | ||||||||||
| Chase |
305 | 626 | 765 | |||||||||||||
| Oster |
167 | 285 | 928 | |||||||||||||
|
|
|
|
|
|
|
|||||||||||
| Total intersegment net sales |
$ | 46,759 | $ | 49,223 | $ | 59,612 | ||||||||||
|
|
|
|
|
|
|
|||||||||||
| Segment Adjusted EBITDA |
||||||||||||||||
| Olin Brass |
$ | 45,115 | $ | 45,320 | $ | 23,291 | ||||||||||
| Chase |
66,641 | 73,658 | 61,158 | |||||||||||||
| Oster |
19,517 | 17,898 | 21,324 | |||||||||||||
|
|
|
|
|
|
|
|||||||||||
| Total segment adjusted EBITDA |
131,273 | 136,876 | 105,773 | |||||||||||||
| Corporate and Eliminations |
(20,562 | ) | (19,518 | ) | (15,714 | ) | ||||||||||
| Loss on extinguishment of debt |
(19,612 | ) | — | — | ||||||||||||
| Depreciation and amortization |
(6,934 | ) | (4,759 | ) | (2,971 | ) | ||||||||||
| Interest expense |
(39,727 | ) | (40,010 | ) | (25,076 | ) | ||||||||||
| Equity method investment income |
(A | ) | (271 | ) | (164 | ) | (806 | ) | ||||||||
| Net income attributable to noncontrolling interest |
374 | 156 | 512 | |||||||||||||
| LIFO liquidation gain |
4,775 | 15,236 | 21,009 | |||||||||||||
| Lower of cost or market adjustment to inventory |
(302 | ) | — | — | ||||||||||||
| Gain (loss) on derivative contracts |
1,588 | (1,095 | ) | (11,984 | ) | |||||||||||
| Compensation expense—profits interest awards |
(19,517 | ) | (885 | ) | (3,452 | ) | ||||||||||
|
|
|
|
|
|
|
|||||||||||
| Income before provision for income taxes and equity income |
$ | 31,085 | $ | 85,837 | $ | 67,291 | ||||||||||
|
|
|
|
|
|
|
|||||||||||
F-60
Table of Contents
Global Brass and Copper Holdings, Inc.
Notes to Consolidated Financial Statements
(All amounts in thousands, except per share data)
| (A) | Excludes accretion income of $724 in each of the years ended December 31, 2012, 2011 and 2010. Equity method investment income is exclusive to Olin Brass. |
| Year Ended December 31, | ||||||||||||
| 2012 | 2011 | 2010 | ||||||||||
| Depreciation and amortization |
||||||||||||
| Olin Brass |
$ | 3,849 | $ | 2,622 | $ | 1,624 | ||||||
| Chase |
2,521 | 1,921 | 1,200 | |||||||||
| Oster |
247 | 196 | 147 | |||||||||
| Corporate and Eliminations |
317 | 20 | — | |||||||||
|
|
|
|
|
|
|
|||||||
| Total depreciation and amortization |
$ | 6,934 | $ | 4,759 | $ | 2,971 | ||||||
|
|
|
|
|
|
|
|||||||
| LIFO liquidation gain/(loss) |
||||||||||||
| Olin Brass |
$ | 175 | $ | 8,401 | $ | 23,253 | ||||||
| Chase |
1,623 | — | 75 | |||||||||
| Oster |
4,478 | 7,050 | (48 | ) | ||||||||
| Corporate and Eliminations |
(1,501 | ) | (215 | ) | (2,271 | ) | ||||||
|
|
|
|
|
|
|
|||||||
| Total LIFO liquidation gain |
$ | 4,775 | $ | 15,236 | $ | 21,009 | ||||||
|
|
|
|
|
|
|
|||||||
| Capital expenditures |
||||||||||||
| Olin Brass |
$ | 12,455 | $ | 10,818 | $ | 3,999 | ||||||
| Chase |
6,846 | 10,171 | 7,377 | |||||||||
| Oster |
558 | 505 | 551 | |||||||||
| Corporate and Eliminations |
549 | 946 | — | |||||||||
|
|
|
|
|
|
|
|||||||
| Total capital expenditures |
$ | 20,408 | $ | 22,440 | $ | 11,927 | ||||||
|
|
|
|
|
|
|
|||||||
Summarized geographic information is shown in the following table. Net sales are attributed to individual countries based on the location from which the products are shipped. No customer represented 10 percent or more of consolidated revenues in 2012, 2011 or 2010.
| Year Ended December 31, | ||||||||||||
| 2012 | 2011 | 2010 | ||||||||||
| Net sales: |
||||||||||||
| United States |
$ | 1,556,865 | $ | 1,691,007 | $ | 1,567,472 | ||||||
| Asia Pacific |
53,668 | 54,638 | 62,358 | |||||||||
| Mexico |
39,987 | 33,498 | 28,899 | |||||||||
|
|
|
|
|
|
|
|||||||
| Total net sales |
$ | 1,650,520 | $ | 1,779,143 | $ | 1,658,729 | ||||||
|
|
|
|
|
|
|
|||||||
Substantially all long-lived assets are maintained in the United States.
| 19. | Subsequent Events |
The Company has performed an evaluation of events that have occurred subsequent to December 31, 2012 and through March 29, 2013 (which is the date the Company issued its financial statements). There have been no subsequent events that occurred during such period
F-61
Table of Contents
Global Brass and Copper Holdings, Inc.
Notes to Consolidated Financial Statements
(All amounts in thousands, except per share data)
that would require disclosure in this Form S-1 Registration Statement, other than those that are described in note 20, “Stock Split”, or that are required to be recognized in the consolidated financial statements as of or for the year ended December 31, 2012.
| 20. | Stock Split (Unaudited) |
On April 10, 2013 the Company’s Board of Directors authorized a 211,100-to-1 stock split to be effected after the effective date of this Form S-1 Registration Statement and prior to the completion of the Company’s contemplated initial public offering. The share numbers and per share amounts disclosed in the consolidated financial statements and notes to consolidated financial statements have not been retroactively adjusted to give effect to the stock split. Presented below are unaudited pro forma earnings per common share after giving effect for the stock split:
| (Unaudited) | 2012 | 2011 | 2010 | |||||||||
| Pro forma net income attributable to Global Brass and Copper Holdings, Inc. per common share |
$ | 0.59 | $ | 2.61 | $ | 1.97 | ||||||
| Historical net income attributable to Global Brass and Copper Holdings, Inc. per common share |
$ | 125,210 | $ | 551,320 | $ | 416,330 | ||||||
The unaudited pro forma impact of the stock split on the balance sheet at December 31, 2012 is an increase in common stock by $211 with an offsetting charge to accumulated deficit.
F-62
Table of Contents
Global Brass and Copper Holdings, Inc.
Notes to Consolidated Financial Statements
(All amounts in thousands, except per share data)
| 21. | Revision of Prior Period Financial Statements (Unaudited) |
As discussed in note 2 “Summary of Significant Accounting Policies”, during 2012, the Company identified and corrected certain errors. A summary of the revisions to the consolidated financial statements during the interim periods is as follows:
| As Previously Reported |
Adjustment | As Revised | ||||||||||
| Consolidated Balance Sheet |
||||||||||||
| March 31, 2011 | ||||||||||||
| Inventories |
$ | 202,745 | $ | (230 | ) | $ | 202,515 | |||||
| Prepaid expenses and other current assets |
23,623 | 7,478 | 31,101 | |||||||||
| Deferred income tax assets—current |
27,143 | 1,251 | 28,394 | |||||||||
| Income tax receivable |
2,666 | 327 | 2,993 | |||||||||
| Total current assets |
501,575 | 8,826 | 510,401 | |||||||||
| Property, plant and equipment, net |
42,475 | 112 | 42,587 | |||||||||
| Deferred income tax assets—noncurrent |
32,867 | (347 | ) | 32,520 | ||||||||
| Total assets |
601,811 | 8,591 | 610,402 | |||||||||
| Accrued liabilities |
65,352 | 7,240 | 72,592 | |||||||||
| Income tax payable |
— | 398 | 398 | |||||||||
| Total current liabilities |
193,688 | 7,638 | 201,326 | |||||||||
| Total liabilities |
559,825 | 7,638 | 567,463 | |||||||||
| Retained earnings |
26,902 | 953 | 27,855 | |||||||||
| Total Global Brass and Copper Holdings, Inc. stockholder’s equity |
38,954 | 953 | 39,907 | |||||||||
| Total equity |
41,987 | 953 | 42,940 | |||||||||
| Total liabilities and equity |
601,811 | 8,591 | 610,402 | |||||||||
| Consolidated Statement of Operations |
||||||||||||
| Three Months Ended March 31, 2011 | ||||||||||||
| Cost of sales |
$ | 442,383 | $ | 506 | $ | 442,889 | ||||||
| Gross profit |
50,532 | (506 | ) | 50,026 | ||||||||
| Operating income |
31,672 | (506 | ) | 31,166 | ||||||||
| Third party interest expense |
9,562 | (112 | ) | 9,450 | ||||||||
| Income before provision for income taxes and equity income |
22,106 | (394 | ) | 21,712 | ||||||||
| Provision for income taxes |
7,956 | (116 | ) | 7,840 | ||||||||
| Income before equity income |
14,150 | (278 | ) | 13,872 | ||||||||
| Net income |
14,448 | (278 | ) | 14,170 | ||||||||
| Net income attributable to Global Brass and Copper Holdings, Inc. |
14,336 | (278 | ) | 14,058 | ||||||||
| Net income attributable to Global Brass and Copper Holdings, Inc. per common share: |
||||||||||||
| Basic |
$ | 143,360 | $ | (2,780 | ) | $ | 140,580 | |||||
| Consolidated Statement of Comprehensive Income |
||||||||||||
| Three Months Ended March 31, 2011 | ||||||||||||
| Net income |
$ | 14,448 | $ | (278 | ) | $ | 14,170 | |||||
| Comprehensive income |
14,771 | (278 | ) | 14,493 | ||||||||
| Comprehensive income attributable to Global Brass and Copper Holdings, Inc. |
14,643 | (278 | ) | 14,365 | ||||||||
F-63
Table of Contents
Global Brass and Copper Holdings, Inc.
Notes to Consolidated Financial Statements
(All amounts in thousands, except per share data)
| As Previously Reported |
Adjustment | As Revised | ||||||||||
| Consolidated Statement of Changes in Equity |
||||||||||||
| Three Months Ended March 31, 2011 | ||||||||||||
| Net income |
$ | 14,448 | $ | (278 | ) | $ | 14,170 | |||||
| Net income attributable to Global Brass and Copper Holdings, Inc. |
14,336 | (278 | ) | 14,058 | ||||||||
| Retained earnings—Balance, March 31, 2011 |
26,902 | 953 | 27,855 | |||||||||
| Total Global Brass and Copper Holdings, Inc. stockholder’s equity—Balance, March 31, 2011 |
38,954 | 953 | 39,907 | |||||||||
| Total equity—Balance, March 31, 2011 |
41,987 | 953 | 42,940 | |||||||||
| Consolidated Statement of Cash Flows |
||||||||||||
| Three Months Ended March 31, 2011 | ||||||||||||
| Cash flows from operating activities: |
||||||||||||
| Net cash used in operating activities |
$ | (22,494 | ) | $ | 112 | $ | (22,382 | ) | ||||
| Cash flows from investing activities: |
||||||||||||
| Capital expenditures |
(3,476 | ) | (112 | ) | (3,588 | ) | ||||||
| Net cash used in investing activities |
(3,476 | ) | (112 | ) | (3,588 | ) | ||||||
| Consolidated Balance Sheet |
||||||||||||
| June 30, 2011 | ||||||||||||
| Inventories |
$ | 169,137 | $ | (402 | ) | $ | 168,735 | |||||
| Prepaid expenses and other current assets |
13,989 | 8,212 | 22,201 | |||||||||
| Deferred income tax assets—current |
25,823 | 1,230 | 27,053 | |||||||||
| Income tax receivable |
2,147 | (343 | ) | 1,804 | ||||||||
| Total current assets |
464,534 | 8,697 | 473,231 | |||||||||
| Property, plant and equipment, net |
47,507 | 273 | 47,780 | |||||||||
| Deferred income tax assets—noncurrent |
32,450 | (529 | ) | 31,921 | ||||||||
| Total assets |
565,534 | 8,441 | 573,975 | |||||||||
| Accrued liabilities |
55,849 | 7,465 | 63,314 | |||||||||
| Total current liabilities |
176,521 | 7,465 | 183,986 | |||||||||
| Total liabilities |
514,032 | 7,465 | 521,497 | |||||||||
| Retained earnings |
37,080 | 976 | 38,056 | |||||||||
| Total Global Brass and Copper Holdings, Inc. stockholder’s equity |
48,371 | 976 | 49,347 | |||||||||
| Total equity |
51,502 | 976 | 52,478 | |||||||||
| Total liabilities and equity |
565,534 | 8,441 | 573,975 | |||||||||
F-64
Table of Contents
Global Brass and Copper Holdings, Inc.
Notes to Consolidated Financial Statements
(All amounts in thousands, except per share data)
| As Previously Reported |
Adjustment | As Revised | ||||||||||
| Consolidated Statements of Operations |
||||||||||||
| Three Months Ended June 30, 2011 | ||||||||||||
| Cost of sales |
$ | 429,357 | $ | (337 | ) | $ | 429,020 | |||||
| Gross profit |
43,894 | 337 | 44,231 | |||||||||
| Operating income |
27,411 | 337 | 27,748 | |||||||||
| Third party interest expense |
11,149 | (161 | ) | 10,988 | ||||||||
| Income before provision for income taxes and equity income |
17,000 | 498 | 17,498 | |||||||||
| Provision for income taxes |
6,783 | 475 | 7,258 | |||||||||
| Income before equity income |
10,217 | 23 | 10,240 | |||||||||
| Net income |
10,245 | 23 | 10,268 | |||||||||
| Net income attributable to Global Brass and Copper Holdings, Inc. |
10,178 | 23 | 10,201 | |||||||||
| Net income attributable to Global Brass and Copper Holdings, Inc. per common share: |
||||||||||||
| Basic |
$ | 101,780 | $ | 230 | $ | 102,010 | ||||||
| Six Months Ended June 30, 2011 | ||||||||||||
| Cost of sales |
$ | 871,740 | $ | 169 | $ | 871,909 | ||||||
| Gross profit |
94,426 | (169 | ) | 94,257 | ||||||||
| Operating income |
59,083 | (169 | ) | 58,914 | ||||||||
| Third party interest expense |
20,711 | (273 | ) | 20,438 | ||||||||
| Income before provision for income taxes and equity income |
39,106 | 104 | 39,210 | |||||||||
| Provision for income taxes |
14,739 | 359 | 15,098 | |||||||||
| Income before equity income |
24,367 | (255 | ) | 24,112 | ||||||||
| Net income |
24,693 | (255 | ) | 24,438 | ||||||||
| Net income attributable to Global Brass and Copper Holdings, Inc. |
24,514 | (255 | ) | 24,259 | ||||||||
| Net income attributable to Global Brass and Copper Holdings, Inc. per common share: |
||||||||||||
| Basic |
$ | 245,140 | $ | (2,550 | ) | $ | 242,590 | |||||
| Consolidated Statements of Comprehensive Income |
||||||||||||
| Three Months Ended June 30, 2011 | ||||||||||||
| Net income |
$ | 10,245 | $ | 23 | $ | 10,268 | ||||||
| Comprehensive income |
10,452 | 23 | 10,475 | |||||||||
| Comprehensive income attributable to Global Brass and Copper Holdings, Inc. |
10,354 | 23 | 10,377 | |||||||||
| Six Months Ended June 30, 2011 | ||||||||||||
| Net income |
$ | 24,693 | $ | (255 | ) | $ | 24,438 | |||||
| Comprehensive income |
25,223 | (255 | ) | 24,968 | ||||||||
| Comprehensive income attributable to Global Brass and Copper Holdings, Inc. |
24,997 | (255 | ) | 24,742 | ||||||||
F-65
Table of Contents
Global Brass and Copper Holdings, Inc.
Notes to Consolidated Financial Statements
(All amounts in thousands, except per share data)
| As Previously Reported |
Adjustment | As Revised | ||||||||||
| Consolidated Statement of Changes in Equity |
||||||||||||
| Six Months Ended June 30, 2011 | ||||||||||||
| Net income |
$ | 24,693 | $ | (255 | ) | $ | 24,438 | |||||
| Net income attributable to Global Brass and Copper Holdings, Inc. |
24,514 | (255 | ) | 24,259 | ||||||||
| Retained earnings—Balance, June 30, 2011 |
37,080 | 976 | 38,056 | |||||||||
| Total Global Brass and Copper Holdings, Inc. stockholder’s equity—Balance, June 30, 2011 |
48,371 | 976 | 49,347 | |||||||||
| Total equity—Balance, June 30, 2011 |
51,502 | 976 | 52,478 | |||||||||
| Consolidated Statement of Cash Flows |
||||||||||||
| Six Months Ended June 30, 2011 | ||||||||||||
| Cash flows from operating activities: |
||||||||||||
| Net cash provided by operating activities |
$ | 32,428 | $ | 273 | $ | 32,701 | ||||||
| Cash flows from investing activities: |
||||||||||||
| Capital expenditures |
(9,709 | ) | (273 | ) | (9,982 | ) | ||||||
| Net cash used in investing activities |
(9,683 | ) | (273 | ) | (9,956 | ) | ||||||
| Consolidated Balance Sheet |
||||||||||||
| September 30, 2011 | ||||||||||||
| Inventories |
$ | 163,880 | $ | (388 | ) | $ | 163,492 | |||||
| Prepaid expenses and other current assets |
24,752 | 994 | 25,746 | |||||||||
| Deferred income tax assets—current |
26,658 | 1,058 | 27,716 | |||||||||
| Income tax receivable |
3,612 | (352 | ) | 3,260 | ||||||||
| Total current assets |
462,786 | 1,312 | 464,098 | |||||||||
| Property, plant and equipment, net |
51,589 | 478 | 52,067 | |||||||||
| Deferred income tax assets—noncurrent |
31,903 | (646 | ) | 31,257 | ||||||||
| Total assets |
565,819 | 1,144 | 566,963 | |||||||||
| Accounts payable |
107,971 | (12 | ) | 107,959 | ||||||||
| Accrued liabilities |
59,526 | (235 | ) | 59,291 | ||||||||
| Total current liabilities |
175,291 | (247 | ) | 175,044 | ||||||||
| Total liabilities |
507,655 | (247 | ) | 507,408 | ||||||||
| Retained earnings |
43,948 | 1,391 | 45,339 | |||||||||
| Total Global Brass and Copper Holdings, Inc. stockholder’s equity |
54,991 | 1,391 | 56,382 | |||||||||
| Total equity |
58,164 | 1,391 | 59,555 | |||||||||
| Total liabilities and equity |
565,819 | 1,144 | 566,963 | |||||||||
F-66
Table of Contents
Global Brass and Copper Holdings, Inc.
Notes to Consolidated Financial Statements
(All amounts in thousands, except per share data)
| As Previously Reported |
Adjustment | As Revised | ||||||||||
| Consolidated Statements of Operations |
||||||||||||
| Three Months Ended September 30, 2011 | ||||||||||||
| Cost of sales |
$ | 401,931 | $ | (508 | ) | $ | 401,423 | |||||
| Gross profit |
37,569 | 508 | 38,077 | |||||||||
| Operating income |
20,471 | 508 | 20,979 | |||||||||
| Third party interest expense |
10,159 | (205 | ) | 9,954 | ||||||||
| Income before provision for income taxes and equity income |
10,066 | 713 | 10,779 | |||||||||
| Provision for income taxes |
3,428 | 298 | 3,726 | |||||||||
| Income before equity income |
6,638 | 415 | 7,053 | |||||||||
| Net income |
6,865 | 415 | 7,280 | |||||||||
| Net income attributable to Global Brass and Copper Holdings, Inc. |
6,868 | 415 | 7,283 | |||||||||
| Net income attributable to Global Brass and Copper Holdings, Inc. per common share: |
||||||||||||
| Basic |
$ | 68,680 | $ | 4,150 | $ | 72,830 | ||||||
| Nine Months Ended September 30, 2011 | ||||||||||||
| Cost of sales |
$ | 1,273,671 | $ | (339 | ) | $ | 1,273,332 | |||||
| Gross profit |
131,995 | 339 | 132,334 | |||||||||
| Operating income |
79,554 | 339 | 79,893 | |||||||||
| Third party interest expense |
30,870 | (478 | ) | 30,392 | ||||||||
| Income before provision for income taxes and equity income |
49,172 | 817 | 49,989 | |||||||||
| Provision for income taxes |
18,167 | 657 | 18,824 | |||||||||
| Income before equity income |
31,005 | 160 | 31,165 | |||||||||
| Net income |
31,558 | 160 | 31,718 | |||||||||
| Net income attributable to Global Brass and Copper Holdings, Inc. |
31,382 | 160 | 31,542 | |||||||||
| Net income attributable to Global Brass and Copper Holdings, Inc. per common share: |
||||||||||||
| Basic |
$ | 313,820 | $ | 1,600 | $ | 315,420 | ||||||
| Consolidated Statements of Comprehensive Income |
||||||||||||
| Three Months Ended September 30, 2011 | ||||||||||||
| Net income |
$ | 6,865 | $ | 415 | $ | 7,280 | ||||||
| Comprehensive income |
6,955 | 415 | 7,370 | |||||||||
| Comprehensive income attributable to Global Brass and Copper Holdings, Inc. |
6,913 | 415 | 7,328 | |||||||||
| Nine Months Ended September 30, 2011 | ||||||||||||
| Net income |
$ | 31,558 | $ | 160 | $ | 31,718 | ||||||
| Comprehensive income |
32,178 | 160 | 32,338 | |||||||||
| Comprehensive income attributable to Global Brass and Copper Holdings, Inc. |
31,910 | 160 | 32,070 | |||||||||
F-67
Table of Contents
Global Brass and Copper Holdings, Inc.
Notes to Consolidated Financial Statements
(All amounts in thousands, except per share data)
| As Previously Reported |
Adjustment | As Revised | ||||||||||
| Consolidated Statement of Changes in Equity |
||||||||||||
| Nine Months Ended September 30, 2011 | ||||||||||||
| Net income |
$ | 31,558 | $ | 160 | $ | 31,718 | ||||||
| Net income attributable to Global Brass and Copper Holdings, Inc. |
31,382 | 160 | 31,542 | |||||||||
| Retained earnings—Balance, September 30, 2011 |
43,948 | 1,391 | 45,339 | |||||||||
| Total Global Brass and Copper Holdings, Inc. stockholder’s equity—Balance, September 30, 2011 |
54,991 | 1,391 | 56,382 | |||||||||
| Total equity—Balance, September 30, 2011 |
58,164 | 1,391 | 59,555 | |||||||||
| Consolidated Statement of Cash Flows |
||||||||||||
| Nine Months Ended September 30, 2011 | ||||||||||||
| Cash flows from operating activities: |
||||||||||||
| Net cash provided by operating activities |
$ | 44,367 | $ | 478 | $ | 44,845 | ||||||
| Cash flows from investing activities: |
||||||||||||
| Capital expenditures |
(15,062 | ) | (478 | ) | (15,540 | ) | ||||||
| Net cash used in investing activities |
(14,992 | ) | (478 | ) | (15,470 | ) | ||||||
| Consolidated Statement of Operations |
||||||||||||
| Three Months Ended December 31, 2011 | ||||||||||||
| Cost of sales |
$ | 309,254 | $ | 887 | $ | 310,141 | ||||||
| Gross profit |
64,223 | (887 | ) | 63,336 | ||||||||
| Operating income |
47,273 | (887 | ) | 46,386 | ||||||||
| Third party interest expense |
9,140 | 478 | 9,618 | |||||||||
| Income before provision for income taxes and equity income |
37,213 | (1,365 | ) | 35,848 | ||||||||
| Provision for income taxes |
13,087 | (474 | ) | 12,613 | ||||||||
| Income before equity income |
24,126 | (891 | ) | 23,235 | ||||||||
| Net income |
24,461 | (891 | ) | 23,570 | ||||||||
| Net income attributable to Global Brass and Copper Holdings, Inc. |
24,481 | (891 | ) | 23,590 | ||||||||
| Net income attributable to Global Brass and Copper Holdings, Inc. per common share: |
||||||||||||
| Basic |
$ | 244,810 | $ | (8,910 | ) | $ | 235,900 | |||||
| Consolidated Statement of Comprehensive Income |
||||||||||||
| Three Months Ended December 31, 2011 | ||||||||||||
| Net income |
$ | 24,461 | $ | (891 | ) | $ | 23,570 | |||||
| Comprehensive income |
24,310 | (891 | ) | 23,419 | ||||||||
| Comprehensive income attributable to Global Brass and Copper Holdings, Inc. |
24,315 | (891 | ) | 23,424 | ||||||||
F-68
Table of Contents
Global Brass and Copper Holdings, Inc.
Notes to Consolidated Financial Statements
(All amounts in thousands, except per share data)
| As Previously Reported |
Adjustment | As Revised | ||||||||||
| Consolidated Balance Sheet |
||||||||||||
| March 31, 2012 | ||||||||||||
| Accounts receivable, net of allowance |
$ | 202,756 | $ | 984 | $ | 203,740 | ||||||
| Inventories |
173,538 | (861 | ) | 172,677 | ||||||||
| Deferred income tax assets—current |
26,793 | 1,326 | 28,119 | |||||||||
| Income tax receivable |
1,567 | (162 | ) | 1,405 | ||||||||
| Total current assets |
496,052 | 1,287 | 497,339 | |||||||||
| Deferred income tax assets—noncurrent |
20,092 | (294 | ) | 19,798 | ||||||||
| Total assets |
593,912 | 993 | 594,905 | |||||||||
| Accounts payable |
111,814 | (389 | ) | 111,425 | ||||||||
| Income Tax payable |
— | 64 | 64 | |||||||||
| Accrued liabilities |
47,080 | 1,284 | 48,364 | |||||||||
| Total current liabilities |
194,498 | 959 | 195,457 | |||||||||
| Total liabilities |
497,460 | 959 | 498,419 | |||||||||
| Retained earnings |
82,888 | 34 | 82,922 | |||||||||
| Total Global Brass and Copper Holdings, Inc. stockholder’s equity |
93,213 | 34 | 93,247 | |||||||||
| Total equity |
96,452 | 34 | 96,486 | |||||||||
| Total liabilities and equity |
593,912 | 993 | 594,905 | |||||||||
| Consolidated Statement of Operations |
||||||||||||
| Three Months Ended March 31, 2012 | ||||||||||||
| Cost of sales |
$ | 392,701 | $ | 736 | $ | 393,437 | ||||||
| Gross profit |
50,690 | (736 | ) | 49,954 | ||||||||
| Operating income |
32,767 | (736 | ) | 32,031 | ||||||||
| Income before provision for income taxes and equity income |
22,707 | (736 | ) | 21,971 | ||||||||
| Provision for income taxes |
8,468 | (270 | ) | 8,198 | ||||||||
| Income before equity income |
14,239 | (466 | ) | 13,773 | ||||||||
| Net income |
14,513 | (466 | ) | 14,047 | ||||||||
| Net income attributable to Global Brass and Copper Holdings, Inc. |
14,459 | (466 | ) | 13,993 | ||||||||
| Net income attributable to Global Brass and Copper Holdings, Inc. per common share: |
||||||||||||
| Basic |
$ | 144,590 | $ | (4,660 | ) | $ | 139,930 | |||||
| Consolidated Statement of Comprehensive Income |
||||||||||||
| Three Months Ended March 31, 2012 | ||||||||||||
| Net income |
$ | 14,513 | $ | (466 | ) | $ | 14,047 | |||||
| Comprehensive income |
14,533 | (466 | ) | 14,067 | ||||||||
| Comprehensive income attributable to Global Brass and Copper Holdings, Inc. |
14,462 | (466 | ) | 13,996 | ||||||||
F-69
Table of Contents
Global Brass and Copper Holdings, Inc.
Notes to Consolidated Financial Statements
(All amounts in thousands, except per share data)
| As Previously Reported |
Adjustment | As Revised | ||||||||||
| Consolidated Statement of Changes in Equity |
||||||||||||
| Three Months Ended March 31, 2012 | ||||||||||||
| Net income |
$ | 14,513 | $ | (466 | ) | $ | 14,047 | |||||
| Net income attributable to Global Brass and Copper Holdings, Inc. |
14,459 | (466 | ) | 13,993 | ||||||||
| Retained earnings—Balance, March 31, 2012 |
82,888 | 34 | 82,922 | |||||||||
| Total Global Brass and Copper Holdings, Inc. stockholder’s equity—Balance, March 31, 2012 |
93,213 | 34 | 93,247 | |||||||||
| Total equity—Balance, March 31, 2012 |
96,452 | 34 | 96,486 | |||||||||
| Consolidated Balance Sheet |
||||||||||||
| June 30, 2012 | ||||||||||||
| Accounts receivable, net of allowance |
$ | 192,326 | $ | 984 | $ | 193,310 | ||||||
| Inventories |
180,815 | (811 | ) | 180,004 | ||||||||
| Deferred income tax assets—current |
28,079 | 1,264 | 29,343 | |||||||||
| Income tax receivable |
4,996 | (476 | ) | 4,520 | ||||||||
| Total current assets |
429,443 | 961 | 430,404 | |||||||||
| Deferred income tax assets—noncurrent |
19,917 | (260 | ) | 19,657 | ||||||||
| Total assets |
538,522 | 701 | 539,223 | |||||||||
| Accounts payable |
105,981 | (1,396 | ) | 104,585 | ||||||||
| Accrued liabilities |
39,590 | 984 | 40,574 | |||||||||
| Total current liabilities |
148,919 | (412 | ) | 148,507 | ||||||||
| Total liabilities |
605,586 | (412 | ) | 605,174 | ||||||||
| Accumulated deficit |
(67,588 | ) | 1,113 | (66,475 | ) | |||||||
| Total Global Brass and Copper Holdings, Inc. stockholder’s deficit |
(70,422 | ) | 1,113 | (69,309 | ) | |||||||
| Total deficit |
(67,064 | ) | 1,113 | (65,951 | ) | |||||||
| Total liabilities and deficit |
538,522 | 701 | 539,223 | |||||||||
| Consolidated Statements of Operations |
||||||||||||
| Three Months Ended June 30, 2012 | ||||||||||||
| Cost of sales |
$ | 371,213 | $ | (1,355 | ) | $ | 369,858 | |||||
| Gross profit |
45,766 | 1,355 | 47,121 | |||||||||
| Operating income |
7,801 | 1,355 | 9,156 | |||||||||
| Loss before provision for income taxes and equity income |
(22,418 | ) | 1,355 | (21,063 | ) | |||||||
| Benefit from income taxes |
(1,247 | ) | 276 | (971 | ) | |||||||
| Income before equity income |
(21,171 | ) | 1,079 | (20,092 | ) | |||||||
| Net loss |
(20,970 | ) | 1,079 | (19,891 | ) | |||||||
| Net loss attributable to Global Brass and Copper Holdings, Inc. |
(21,084 | ) | 1,079 | (20,005 | ) | |||||||
| Net loss attributable to Global Brass and Copper Holdings, Inc. per common share: |
||||||||||||
| Basic |
$ | (210,840 | ) | $ | 10,790 | $ | (200,050 | ) | ||||
F-70
Table of Contents
Global Brass and Copper Holdings, Inc.
Notes to Consolidated Financial Statements
(All amounts in thousands, except per share data)
| As Previously Reported |
Adjustment | As Revised | ||||||||||
| Six Months Ended June 30, 2012 | ||||||||||||
| Cost of sales |
$ | 763,914 | $ | (619 | ) | $ | 763,295 | |||||
| Gross profit |
96,456 | 619 | 97,075 | |||||||||
| Operating income |
40,568 | 619 | 41,187 | |||||||||
| Income before provision for income taxes and equity income |
289 | 619 | 908 | |||||||||
| Provision for income taxes |
7,221 | 6 | 7,227 | |||||||||
| Loss before equity income |
(6,932 | ) | 613 | (6,319 | ) | |||||||
| Net loss |
(6,457 | ) | 613 | (5,844 | ) | |||||||
| Net loss attributable to Global Brass and Copper Holdings, Inc. |
(6,625 | ) | 613 | (6,012 | ) | |||||||
| Net loss attributable to Global Brass and Copper Holdings, Inc. per common share: |
||||||||||||
| Basic |
$ | (66,250 | ) | $ | 6,130 | $ | (60,120 | ) | ||||
| Consolidated Statements of Comprehensive Loss |
||||||||||||
| Three Months Ended June 30, 2012 | ||||||||||||
| Net loss |
$ | (20,970 | ) | $ | 1,079 | $ | (19,891 | ) | ||||
| Comprehensive loss |
(21,113 | ) | 1,079 | (20,034 | ) | |||||||
| Comprehensive loss attributable to Global Brass and Copper Holdings, Inc. |
(21,232 | ) | 1,079 | (20,153 | ) | |||||||
| Six Months Ended June 30, 2012 | ||||||||||||
| Net loss |
$ | (6,457 | ) | $ | 613 | $ | (5,844 | ) | ||||
| Comprehensive loss |
(6,580 | ) | 613 | (5,967 | ) | |||||||
| Comprehensive loss attributable to Global Brass and Copper Holdings, Inc. |
(6,770 | ) | 613 | (6,157 | ) | |||||||
| Consolidated Statement of Changes in Equity |
||||||||||||
| Six Months Ended June 30, 2012 | ||||||||||||
| Net loss |
$ | (6,457 | ) | $ | 613 | $ | (5,844 | ) | ||||
| Net loss attributable to Global Brass and Copper Holdings, Inc. |
(6,625 | ) | 613 | (6,012 | ) | |||||||
| Accumulated deficit—Balance, June 30, 2012 |
(67,588 | ) | 1,113 | (66,475 | ) | |||||||
| Total Global Brass and Copper Holdings, Inc. stockholder’s deficit—Balance, June 30, 2012 |
(70,422 | ) | 1,113 | (69,309 | ) | |||||||
| Total deficit—Balance, June 30, 2012 |
(67,064 | ) | 1,113 | (65,951 | ) | |||||||
F-71
Table of Contents
Global Brass and Copper Holdings, Inc.
Notes to Consolidated Financial Statements
(All amounts in thousands, except per share data)
| As Previously Reported |
Adjustment | As Revised | ||||||||||
| Consolidated Balance Sheet |
||||||||||||
| September 30, 2012 | ||||||||||||
| Accounts receivable, net of allowance |
$ | 210,654 | $ | 984 | $ | 211,638 | ||||||
| Deferred income tax assets—current |
25,390 | 971 | 26,361 | |||||||||
| Income tax receivable |
648 | (174 | ) | 474 | ||||||||
| Total current assets |
445,517 | 1,781 | 447,298 | |||||||||
| Deferred income tax assets—noncurrent |
17,350 | (310 | ) | 17,040 | ||||||||
| Total assets |
554,198 | 1,471 | 555,669 | |||||||||
| Accrued liabilities |
58,620 | 984 | 59,604 | |||||||||
| Income tax payable |
— | 58 | 58 | |||||||||
| Total current liabilities |
179,553 | 1,042 | 180,595 | |||||||||
| Total liabilities |
609,685 | 1,042 | 610,727 | |||||||||
| Accumulated deficit |
(55,872 | ) | 429 | (55,443 | ) | |||||||
| Total Global Brass and Copper Holdings, Inc. stockholder’s deficit |
(58,928 | ) | 429 | (58,499 | ) | |||||||
| Total deficit |
(55,487 | ) | 429 | (55,058 | ) | |||||||
| Total liabilities and deficit |
554,198 | 1,471 | 555,669 | |||||||||
| Consolidated Statements of Operations |
||||||||||||
| Three Months Ended September 30, 2012 | ||||||||||||
| Cost of sales |
$ | 348,995 | $ | 585 | $ | 349,580 | ||||||
| Gross profit |
44,982 | (585 | ) | 44,397 | ||||||||
| Operating income |
27,629 | (585 | ) | 27,044 | ||||||||
| Income before provision for income taxes and equity income |
18,230 | (585 | ) | 17,645 | ||||||||
| Provision for income taxes |
6,670 | 99 | 6,769 | |||||||||
| Income before equity income |
11,560 | (684 | ) | 10,876 | ||||||||
| Net income |
11,821 | (684 | ) | 11,137 | ||||||||
| Net income attributable to Global Brass and Copper Holdings, Inc. |
11,716 | (684 | ) | 11,032 | ||||||||
| Net income attributable to Global Brass and Copper Holdings, Inc. per common share: |
||||||||||||
| Basic |
$ | 117,160 | $ | (6,840 | ) | $ | 110,320 | |||||
| Nine Months Ended September 30, 2012 | ||||||||||||
| Cost of sales |
$ | 1,112,909 | $ | (34 | ) | $ | 1,112,875 | |||||
| Gross profit |
141,438 | 34 | 141,472 | |||||||||
| Operating income |
68,197 | 34 | 68,231 | |||||||||
| Income before provision for income taxes and equity income |
18,519 | 34 | 18,553 | |||||||||
| Provision for income taxes |
13,891 | 105 | 13,996 | |||||||||
| Income before equity income |
4,628 | (71 | ) | 4,557 | ||||||||
| Net income |
5,364 | (71 | ) | 5,293 | ||||||||
| Net income attributable to Global Brass and Copper Holdings, Inc. |
5,091 | (71 | ) | 5,020 | ||||||||
| Net income attributable to Global Brass and Copper Holdings, Inc. per common share: |
||||||||||||
| Basic |
$ | 50,910 | $ | 710 | $ | 50,200 | ||||||
F-72
Table of Contents
Global Brass and Copper Holdings, Inc.
Notes to Consolidated Financial Statements
(All amounts in thousands, except per share data)
| As Previously Reported |
Adjustment | As Revised | ||||||||||
| Consolidated Statements of Comprehensive Income |
||||||||||||
| Three Months Ended September 30, 2012 | ||||||||||||
| Net income |
$ | 11,821 | $ | (684 | ) | $ | 11,137 | |||||
| Comprehensive income |
11,814 | (684 | ) | 11,130 | ||||||||
| Comprehensive income attributable to Global Brass and Copper Holdings, Inc. |
11,731 | (684 | ) | 11,047 | ||||||||
| Nine Months Ended September 30, 2012 | ||||||||||||
| Net income |
$ | 5,364 | $ | (71 | ) | $ | 5,293 | |||||
| Comprehensive income |
5,234 | (71 | ) | 5,163 | ||||||||
| Comprehensive income attributable to Global Brass and Copper Holdings, Inc. |
4,961 | (71 | ) | 4,890 | ||||||||
| Consolidated Statement of Changes in Equity |
||||||||||||
| Nine Months Ended September 30, 2012 | ||||||||||||
| Net income |
$ | 5,364 | $ | (71 | ) | $ | 5,293 | |||||
| Net income attributable to Global Brass and Copper Holdings, Inc. |
5,091 | (71 | ) | 5,020 | ||||||||
| Accumulated deficit—Balance, September 30, 2012 |
(55,872 | ) | 429 | (55,443 | ) | |||||||
| Total Global Brass and Copper Holdings, Inc. stockholder’s deficit—Balance, September 30, 2012 |
(58,928 | ) | 429 | (58,499 | ) | |||||||
| Total deficit—Balance, September 30, 2012 |
(55,487 | ) | 429 | (55,058 | ) | |||||||
F-73
Table of Contents
Schedule I – Condensed Financial Information of Registrant
Global Brass and Copper Holdings, Inc. (Parent Company Only)
Condensed Balance Sheets
| As of December 31, | ||||||||
| (In thousands, except share data) | 2012 | 2011 | ||||||
| Assets |
||||||||
| Current assets: |
||||||||
| Cash |
$ | — | $ | — | ||||
|
|
|
|
|
|||||
| Total current assets |
— | — | ||||||
| Investment in subsidiary |
— | 85,020 | ||||||
|
|
|
|
|
|||||
| Total assets |
$ | — | $ | 85,020 | ||||
|
|
|
|
|
|||||
| Liabilities and stockholder’s (deficit)/equity |
||||||||
| Current liabilities: |
||||||||
| Accounts payable |
$ | — | $ | — | ||||
|
|
|
|
|
|||||
| Total current liabilities |
— | — | ||||||
| Payable to subsidiary |
8,829 | 5,528 | ||||||
| Obligations and advances in excess of investment in subsidiary |
42,522 | — | ||||||
|
|
|
|
|
|||||
| Total liabilities |
51,351 | 5,528 | ||||||
|
|
|
|
|
|||||
| Stockholder’s (deficit)/equity: |
||||||||
| Common stock—$.01 par value; 200 shares authorized; 100 shares issued and outstanding at December 31, 2012 and 2011 |
— | — | ||||||
| Additional paid-in capital |
— | 11,091 | ||||||
| (Accumulated deficit)/retained earnings |
(47,942 | ) | 68,929 | |||||
| Accumulated other comprehensive income |
1,466 | 1,923 | ||||||
| Receivable from stockholder |
(4,875 | ) | (2,451 | ) | ||||
|
|
|
|
|
|||||
| Total stockholder’s (deficit)/equity |
(51,351 | ) | 79,492 | |||||
|
|
|
|
|
|||||
| Total liabilities and stockholder’s (deficit)/equity |
$ | — | $ | 85,020 | ||||
|
|
|
|
|
|||||
See accompanying notes to condensed financial statements.
F-74
Table of Contents
Schedule I – Condensed Financial Information of Registrant
Global Brass and Copper Holdings, Inc. (Parent Company Only)
Condensed Statements of Operations
| Year Ended December 31, | ||||||||||||
| (In thousands) | 2012 | 2011 | 2010 | |||||||||
| Net sales |
$ | — | $ | — | $ | — | ||||||
| Cost of sales |
— | — | — | |||||||||
|
|
|
|
|
|
|
|||||||
| Gross profit |
— | — | — | |||||||||
| Selling, general and administrative expenses |
1,427 | 1,650 | 1,102 | |||||||||
|
|
|
|
|
|
|
|||||||
| Loss before income taxes and equity income |
(1,427 | ) | (1,650 | ) | (1,102 | ) | ||||||
| Benefit from income taxes |
(550 | ) | (635 | ) | (424 | ) | ||||||
|
|
|
|
|
|
|
|||||||
| Loss before equity income |
(877 | ) | (1,015 | ) | (678 | ) | ||||||
| Equity income, net of tax |
13,398 | 56,147 | 42,311 | |||||||||
|
|
|
|
|
|
|
|||||||
| Net income |
$ | 12,521 | $ | 55,132 | $ | 41,633 | ||||||
|
|
|
|
|
|
|
|||||||
See accompanying notes to condensed financial statements.
F-75
Table of Contents
Schedule I – Condensed Financial Information of Registrant
Global Brass and Copper Holdings, Inc. (Parent Company Only)
Condensed Statements of Comprehensive Income
| Year Ended December 31, | ||||||||||||
| (In thousands) | 2012 | 2011 | 2010 | |||||||||
| Net income |
$ | 12,521 | $ | 55,132 | $ | 41,633 | ||||||
| Other comprehensive income: |
||||||||||||
| Foreign currency translation adjustment, net of tax |
(457 | ) | 362 | 442 | ||||||||
|
|
|
|
|
|
|
|||||||
| Comprehensive income |
$ | 12,064 | $ | 55,494 | $ | 42,075 | ||||||
|
|
|
|
|
|
|
|||||||
See accompanying notes to condensed financial statements.
F-76
Table of Contents
Schedule I – Condensed Financial Information of Registrant
Global Brass and Copper Holdings, Inc. (Parent Company Only)
Condensed Statements of Cash Flows
| Year Ended December 31, | ||||||||||||
| (In thousands) | 2012 | 2011 | 2010 | |||||||||
| Net cash provided by operating activities |
$ | 73,624 | $ | — | $ | 42,500 | ||||||
|
|
|
|
|
|
|
|||||||
| Cash flows from investing activities |
||||||||||||
| Capital distributions from subsidiary |
86,376 | — | — | |||||||||
| Payable to subsidiary |
2,424 | 2,451 | — | |||||||||
|
|
|
|
|
|
|
|||||||
| Net cash provided by investing activities |
88,800 | 2,451 | — | |||||||||
|
|
|
|
|
|
|
|||||||
| Cash flows from financing activities |
||||||||||||
| Distributions to stockholder |
(160,000 | ) | — | (42,500 | ) | |||||||
| Amounts due from stockholder |
(2,424 | ) | (2,451 | ) | — | |||||||
|
|
|
|
|
|
|
|||||||
| Net cash used in financing activities |
(162,424 | ) | (2,451 | ) | (42,500 | ) | ||||||
|
|
|
|
|
|
|
|||||||
| Net increase (decrease) in cash |
— | — | — | |||||||||
| Cash at beginning of year |
— | — | — | |||||||||
|
|
|
|
|
|
|
|||||||
| Cash at end of year |
$ | — | $ | — | $ | — | ||||||
|
|
|
|
|
|
|
|||||||
See accompanying notes to condensed financial statements.
F-77
Table of Contents
Schedule I – Condensed Financial Information of Registrant
Global Brass and Copper Holdings, Inc. (Parent Company Only)
Notes to Condensed Financial Statements
December 31, 2012
(All dollar amounts in thousands)
| 1. | Basis of Presentation |
Global Brass and Copper, Inc. (“GBC”) is a direct subsidiary of Global Brass and Copper Holdings, Inc. (the “Company”). Under the terms of the agreements governing the 9.50% Senior Secured Notes issued by GBC and the asset-based revolving loan facility entered into by GBC and certain of its subsidiaries (the “ABL Facility”), GBC and substantially all of its existing and future 100%-owned U.S. subsidiaries are significantly restricted from making dividend payments, loans or advances to the Company. These restrictions have resulted in the restricted net assets (as defined in Rule 4-08(e)(3) of Regulation S-X) of the Company’s subsidiaries exceeding 25% of the consolidated net assets of the Company and its subsidiaries. These condensed financial statements should be read in conjunction with the consolidated financial statements and related notes thereto included in this filing.
| 2. | Guarantees |
The Senior Secured Notes and the ABL Facility are guaranteed by the Company and substantially all of GBC’s existing and future 100%-owned U.S. subsidiaries. The Senior Secured Notes, the ABL Facility and the related guarantees are secured by the fixed assets, accounts receivable and inventory of GBC and the guarantors.
| 3. | Distributions from Subsidiary |
Cash distributions received by the Company from GBC were $160,000 and $42,500 for the years ended December 31, 2012 and 2010, respectively. Of the $160,000 received during the year ended December 31, 2012, $73,624 represented a return on capital and $86,376 represented a return of capital. The $42,500 received during the year ended December 31, 2010 represented a return on capital. The Company did not receive any cash distributions for the year ended December 31, 2011.
F-78
Table of Contents
9,375,000 Shares
Global Brass and Copper Holdings, Inc.
Common Stock
| Goldman, Sachs & Co. | Morgan Stanley |
| William Blair | KeyBanc Capital Markets |
Through and including , 2013 (the 25th day after the date of this prospectus), all dealers effecting transactions in these securities, whether or not participating in this offering, may be required to deliver a prospectus. This is in addition to a dealer’s obligation to deliver a prospectus when acting as an underwriter and with respect to an unsold allotment or subscription.
Table of Contents
PART II
INFORMATION NOT REQUIRED IN PROSPECTUS
| Item 13. | Other Expenses of Issuance and Distribution. |
The following table sets forth the costs and expenses, other than underwriting discounts and commissions, expected to be incurred in connection with the issuance and distribution of the common stock registered hereby. All amounts are estimates except the SEC registration, Financial Industry Regulatory Authority, or FINRA, and the New York Stock Exchange filing fees.
| SEC registration fee. |
$ | 24,992 | ||
| FINRA filing fee. |
$ | 20,492 | ||
| New York Stock Exchange listing fee |
$ | 125,000 | ||
| Accountants’ fees and expenses |
$ | 1,800,000 | ||
| Legal fees and expenses |
$ | 2,200,000 | ||
| Transfer Agent’s fees and expenses. |
$ | 4,900 | ||
| Printing and engraving expenses |
$ | 450,000 | ||
| Miscellaneous |
$ | 1,000 | ||
|
|
|
|||
| Total Expenses |
$ | 4,626,384 | ||
|
|
|
| Item 14. | Indemnification of Directors and Officers. |
Directors’ liability; indemnification of directors and officers. Global Brass and Copper Holdings, Inc. is a Delaware corporation. Section 145(a) of the Delaware General Corporation Law provides, in general, that a corporation shall have the power to indemnify any person who was or is a party or is threatened to be made a party to any threatened, pending or completed action, suit or proceeding, whether civil, criminal, administrative or investigative, other than an action by or in the right of the corporation, because the person is or was a director or officer of the corporation. Such indemnity may be against expenses (including attorneys’ fees), judgments, fines and amounts paid in settlement actually and reasonably incurred by the person in connection with such action, suit or proceeding, if the person acted in good faith and in a manner the person reasonably believed to be in or not opposed to the best interests of the corporation and if, with respect to any criminal action or proceeding, the person did not have reasonable cause to believe the person’s conduct was unlawful.
Section 145(b) of the Delaware General Corporation Law provides, in general, that a corporation shall have the power to indemnify any person who was or is a party or is threatened to be made a party to any threatened, pending or completed action or suit by or in the right of the corporation to procure a judgment in its favor because the person is or was a director or officer of the corporation, against any expenses (including attorneys’ fees) actually and reasonably incurred by the person in connection with the defense or settlement of such action or suit if the person acted in good faith and in a manner the person reasonably believed to be in or not opposed to the best interests of the corporation, except that no indemnification shall be made in respect of any claim, issue or matter as to which such person shall have been adjudged to be liable to the corporation unless and only to the extent that the Court of Chancery or the court in which such action or suit was brought shall determine upon application that, despite the adjudication of liability but in view of all the circumstances of the case, such person is fairly and reasonably entitled to be indemnified for such expenses which the Court of Chancery or such other court shall deem proper.
Section 145(g) of the Delaware General Corporation Law provides, in general, that a corporation shall have the power to purchase and maintain insurance on behalf of any person who is or was a director or officer of the corporation against any liability asserted against the person in any such
II-1
Table of Contents
capacity, or arising out of the person’s status as such, whether or not the corporation would have the power to indemnify the person against such liability under the provisions of the law. Our amended and restated certificate of incorporation provides that, to the fullest extent permitted by applicable law, a director will not be liable to us or our stockholders for monetary damages for breach of fiduciary duty as a director. In addition, our bylaws provide that we will indemnify each director and officer and may indemnify employees and agents, as determined by our board, to the fullest extent provided by the laws of the State of Delaware.
The foregoing statements are subject to the detailed provisions of Section 145 of the Delaware General Corporation Law and our amended and restated certificate of incorporation and by-laws.
Section 102 of the Delaware General Corporation Law permits the limitation of directors’ personal liability to the corporation or its stockholders for monetary damages for breach of fiduciary duties as a director except for (i) any breach of the director’s duty of loyalty to the corporation or its stockholders, (ii) acts or omissions not in good faith or which involve intentional misconduct or a knowing violation of the law, (iii) breaches under Section 174 of the Delaware General Corporation Law, which relates to unlawful payments of dividends or unlawful stock repurchase or redemptions, and (iv) any transaction from which the director derived an improper personal benefit.
Reference is made to Item 17 for our undertakings with respect to indemnification for liabilities arising under the Securities Act.
We maintain directors’ and officers’ liability insurance for our officers and directors.
The underwriting agreement for this offering will provide that each underwriter severally agrees to indemnify and hold us harmless, each of our directors, each of our officers who signs the registration statement, and each person who controls us within the meaning of the Securities Act but only with respect to written information relating to such underwriter furnished to the us by or on behalf of such underwriter specifically for inclusion in the documents referred to in the foregoing indemnity.
Upon completion of this offering, we expect to enter into an indemnification agreement with each of our executive officers and directors that provides, in general, that we will indemnify them to the fullest extent permitted by law in connection with their service to us or on our behalf.
The indemnification rights set forth above shall not be exclusive of any other right which an indemnified person may have or hereafter acquire under any statute, provision of our amended and restated certificate of incorporation, our amended and restated bylaws, agreement, vote of stockholders or disinterested directors or otherwise.
| Item 15. | Recent Sales of Unregistered Securities. |
9.50% Senior Secured Notes due 2019
On May 24, 2012, Global Brass and Copper, Inc., a wholly owned subsidiary of Global Brass and Copper Holdings, Inc., sold $375,000,000 aggregate principal amount of 9.50% senior secured notes due 2012 (the “Senior Secured Notes”). Global Brass and Copper Holdings, Inc. and substantially all of Global Brass and Copper, Inc.’s subsidiaries are guarantors of the Senior Secured Notes. Goldman, Sachs & Co. and Morgan Stanley & Co LLC acted as representatives of the initial purchasers of the sale. The Notes were offered only to qualified institutional buyers in reliance on Rule 144A under the Securities Act, and outside the United States, only to non-U.S. investors pursuant to Regulation S.
II-2
Table of Contents
| Item 16. | Exhibits and Financial Statement Schedules. |
| (a) | Exhibits |
| Exhibit |
Description | |
| 1.1** | Form of Underwriting Agreement. | |
| 2.1** | Purchase Agreement, between Global Brass and Copper Acquisition Co. and Olin Corporation, dated as of October 15, 2007. | |
| 3.1** | Amended and Restated Certificate of Incorporation of Global Brass and Copper Holdings, Inc. | |
| 3.2** | Amended and Restated Bylaws of Global Brass and Copper Holdings, Inc. | |
| 4.1** | Form of Certificate of Common Stock of Global Brass and Copper Holdings, Inc. | |
| 5.1** | Opinion of Paul, Weiss, Rifkind, Wharton & Garrison LLP regarding the validity of common stock being registered. | |
| 10.1** | Global Brass and Copper Holdings, Inc. 2013 Omnibus Equity Incentive Plan. | |
| 10.2** | Employment Agreement between Global Brass and Copper, Inc. and John Walker, dated October 31, 2008. | |
| 10.3** | Severance Agreement, by and between John J. Wasz and Global Brass and Copper, Inc., dated August 31, 2011. | |
| 10.4** | Severance Agreement, by and between Daniel B. Becker and Global Brass and Copper, Inc., dated July 28, 2011. | |
| 10.5** | Severance Agreement, by and between Robert T. Micchelli and Global Brass and Copper, Inc., dated October 20, 2011. | |
| 10.6** | Severance Agreement, by and between Devin K. Denner and Global Brass and Copper, Inc., dated July 29, 2011. | |
| 10.7** | Amendment No. 1 to Severance Agreement, by and between Devin K. Denner and Global Brass and Copper, Inc., dated February 9, 2012. | |
| 10.8** | Amended and Restated Loan and Security Agreement, by and among Global Brass and Copper, Inc., Chase Brass and Copper Company, LLC, GBC Metals, LLC, Chase Brass, LLC, A.J. Oster, LLC, Global Brass and Copper Holdings, Inc., other guarantors, and Wells Fargo Bank, National Association and other lenders, dated August 18, 2010. | |
| 10.9** | Amendment No. 1 to Amended and Restated Loan and Security Agreement and Waiver, by and among Global Brass and Copper, Inc., Chase Brass and Copper Company, LLC, GBC Metals, LLC, Chase Brass, LLC, A.J. Oster, LLC, Global Brass and Copper Holdings, Inc., other guarantors, and Wells Fargo Bank, National Association and other lenders, dated May 13, 2011. | |
| 10.10** |
Amendment No. 2 to Amended and Restated Loan and Security Agreement, by and among Global Brass and Copper, Inc., Chase Brass and Copper Company, LLC, GBC Metals, LLC, Chase Brass, LLC, A.J. Oster, LLC, Global Brass and Copper Holdings, Inc., other guarantors, and Wells Fargo Bank, National Association and other lenders, dated October 26, 2011. | |
| 10.11** | Amendment No. 3 to Amended and Restated Loan and Security Agreement, by and among Global Brass and Copper, Inc., Chase Brass and Copper Company, LLC, GBC Metals, LLC, Chase Brass, LLC, A.J. Oster, LLC, Global Brass and Copper Holdings, Inc., other guarantors, and Wells Fargo Bank, National Association and other lenders, dated June 1, 2012. | |
II-3
Table of Contents
| Exhibit |
Description | |
| 10.12** | Senior Lien Intercreditor Agreement, among Wells Fargo Bank, National Association, Global Brass and Copper, Inc., Global Brass and Copper Holdings, Inc., and the Subsidiaries of Global Brass and Copper Holdings, Inc. named therein dated as of June 1, 2012. | |
| 10.13** | Indenture, by and among Global Brass and Copper, Inc., Wells Fargo Bank, National Association, and the Guarantors named therein, dated June 1, 2012. | |
| 10.14** | Exchange and Registration Rights Agreement, by and among Global Brass and Copper, Inc., Goldman, Sachs & Co. and Morgan Stanley & Co. LLC, dated June 1, 2012. | |
| 10.15** | Pledge and Security Agreement, between each guarantor party thereto and Wells Fargo Bank, National Association, dated as of June 1, 2012. | |
| 10.16** | Indenture of Lease, between The Lares Group II and A.J. Oster Company, dated March 1, 1995, as amended. | |
| 10.17** | Single Tenant Lease, between La Palmea Flex, L.P. and A.J. Oster West LLC, dated February 1, 2009. | |
| 10.18** | Form of Indemnity Agreement. | |
| 10.19** | Form of Investor Rights Agreement. | |
| 21.1** | List of Subsidiaries of Global Brass and Copper Holdings, Inc. | |
| 23.1** | Consent of Paul, Weiss, Rifkind, Wharton & Garrison LLP (included in the opinion filed as Exhibit 5.1). | |
| 23.2 | Consent of PricewaterhouseCoopers LLP. | |
| 24.1** | Power of Attorney (included on the signature page hereof). | |
| ** | Previously filed |
| (b) | Financial Statement Schedules |
See Global Brass and Copper Holdings, Inc.’s Consolidated Financial Statements starting on page F-1. All other schedules for which provision is made in the applicable accounting regulations of the SEC are not required, are inapplicable or the information is included in the consolidated financial statements, and have therefore been omitted.
| Item 17. | Undertakings. |
(a) The undersigned registrant hereby undertakes to provide to the underwriters at the closing date specified in the underwriting agreements certificates in such denominations and registered in such names as required by the underwriters to permit prompt delivery to each purchaser.
(b) Insofar as indemnification for liabilities arising under the Securities Act of 1933 may be permitted to directors, officers and controlling persons of the registrant pursuant to the foregoing provisions, or otherwise, the registrant has been advised that in the opinion of the Securities and Exchange Commission such indemnification is against public policy as expressed in the Act and is, therefore, unenforceable. In the event that a claim for indemnification against such liabilities (other than the payment by the registrant of expenses incurred or paid by a director, officer or controlling person of the registrant in the successful defense of any action, suit or proceeding) is asserted by such director, officer or controlling person in connection with the securities being registered, the registrant will, unless in the opinion of its counsel the matter has been settled by controlling precedent, submit to a court of appropriate jurisdiction the question whether such indemnification by it is against public policy as expressed in the Act and will be governed by the final adjudication of such issue.
II-4
Table of Contents
(c) The undersigned registrant hereby undertakes that:
(1) for purposes of determining any liability under the Securities Act of 1933, the information omitted from the form of prospectus filed as part of this registration statement in reliance upon Rule 430A and contained in a form of prospectus filed by the registrant pursuant to Rule 424(b)(1) or (4) or 497(h) under the Securities Act shall be deemed to be part of this registration statement as of the time it was declared effective.
(2) for the purpose of determining any liability under the Securities Act of 1933, each post-effective amendment that contains a form of prospectus shall be deemed to be a new registration statement relating to the securities offered therein, and the offering of such securities at that time shall be deemed to be the initial bona fide offering thereof.
II-5
Table of Contents
SIGNATURES
Pursuant to the requirements of the Securities Act of 1933, as amended, the registrant has duly caused this registration statement to be signed on its behalf by the undersigned, thereunto duly authorized, in the city of Schaumburg, in the state of Illinois, on the 20th day of May, 2013.
| GLOBAL BRASS AND COPPER HOLDINGS, INC. | ||
| By: | /s/ John H. Walker | |
| Name: | John H. Walker | |
| Title: | Chief Executive Officer and Director (principal executive officer) | |
Pursuant to the requirements of the Securities Act of 1933, this registration statement has been signed on May 20, 2013 by the following persons in the capacities indicated.
| Name |
Position | |
|
/s/ John H. Walker John H. Walker |
Chief Executive Officer and Director (principal executive officer) | |
|
/s/ Robert T. Micchelli Robert T. Micchelli |
Chief Financial Officer (principal financial officer and principal accounting officer) | |
| * Michael Psaros |
Chairman of the Board of Directors | |
| * Raquel Palmer |
Director | |
| * David Shapiro |
Director | |
| * Jay Bernstein |
Director | |
| * George Thanopoulos |
Director | |
| * Ronald C. Whitaker |
Director | |
| * Martin E. Welch, III |
Director | |
| * David Burritt |
Director | |
| *By: |
/s/ Robert T. Micchelli | |
| Robert T. Micchelli | ||
| Attorney-in-fact |
II-6
Table of Contents
EXHIBITS
| Exhibit |
Description | |
| 1.1** | Form of Underwriting Agreement. | |
| 2.1** | Purchase Agreement, between Global Brass and Copper Acquisition Co. and Olin Corporation, dated as of October 15, 2007. | |
| 3.1** | Amended and Restated Certificate of Incorporation of Global Brass and Copper Holdings, Inc. | |
| 3.2** | Amended and Restated Bylaws of Global Brass and Copper Holdings, Inc. | |
| 4.1** | Form of Certificate of Common Stock of Global Brass and Copper Holdings, Inc. | |
| 5.1** | Opinion of Paul, Weiss, Rifkind, Wharton & Garrison LLP regarding the validity of common stock being registered. | |
| 10.1** | Global Brass and Copper Holdings, Inc. 2013 Omnibus Equity Incentive Plan. | |
| 10.2** | Employment Agreement between Global Brass and Copper, Inc. and John Walker, dated October 31, 2008. | |
| 10.3** | Severance Agreement, by and between John J. Wasz and Global Brass and Copper, Inc., dated August 31, 2011. | |
| 10.4** | Severance Agreement, by and between Daniel B. Becker and Global Brass and Copper, Inc., dated July 28, 2011. | |
| 10.5** | Severance Agreement, by and between Robert T. Micchelli and Global Brass and Copper, Inc., dated October 20, 2011. | |
| 10.6** | Severance Agreement, by and between Devin K. Denner and Global Brass and Copper, Inc., dated July 29, 2011. | |
| 10.7** | Amendment No. 1 to Severance Agreement, by and between Devin K. Denner and Global Brass and Copper, Inc., dated February 9, 2012. | |
| 10.8** | Amended and Restated Loan and Security Agreement, by and among Global Brass and Copper, Inc., Chase Brass and Copper Company, LLC, GBC Metals, LLC, Chase Brass, LLC, A.J. Oster, LLC, Global Brass and Copper Holdings, Inc., other guarantors, and Wells Fargo Bank, National Association and other lenders, dated August 18, 2010. | |
| 10.9** | Amendment No. 1 to Amended and Restated Loan and Security Agreement and Waiver, by and among Global Brass and Copper, Inc., Chase Brass and Copper Company, LLC, GBC Metals, LLC, Chase Brass, LLC, A.J. Oster, LLC, Global Brass and Copper Holdings, Inc., other guarantors, and Wells Fargo Bank, National Association and other lenders, dated May 13, 2011. | |
| 10.10** | Amendment No. 2 to Amended and Restated Loan and Security Agreement, by and among Global Brass and Copper, Inc., Chase Brass and Copper Company, LLC, GBC Metals, LLC, Chase Brass, LLC, A.J. Oster, LLC, Global Brass and Copper Holdings, Inc., other guarantors, and Wells Fargo Bank, National Association and other lenders, dated October 26, 2011. | |
| 10.11** | Amendment No. 3 to Amended and Restated Loan and Security Agreement, by and among Global Brass and Copper, Inc., Chase Brass and Copper Company, LLC, GBC Metals, LLC, Chase Brass, LLC, A.J. Oster, LLC, Global Brass and Copper Holdings, Inc., other guarantors, and Wells Fargo Bank, National Association and other lenders, dated June 1, 2012. | |
| 10.12** | Senior Lien Intercreditor Agreement, among Wells Fargo Bank, National Association, Global Brass and Copper, Inc., Global Brass and Copper Holdings, Inc., and the Subsidiaries of Global Brass and Copper Holdings, Inc. named therein dated as of June 1, 2012. | |
II-7
Table of Contents
| Exhibit |
Description | |||
| 10.13** | Indenture, by and among Global Brass and Copper, Inc., Wells Fargo Bank, National Association, and the Guarantors named therein, dated June 1, 2012. | |||
| 10.14** | Exchange and Registration Rights Agreement, by and among Global Brass and Copper, Inc., Goldman, Sachs & Co. and Morgan Stanley & Co. LLC, dated June 1, 2012. | |||
| 10.15** | Pledge and Security Agreement, between each guarantor party thereto and Wells Fargo Bank, National Association, dated as of June 1, 2012. | |||
| 10.16** | Indenture of Lease, between The Lares Group II and A.J. Oster Company, dated March 1, 1995, as amended. | |||
| 10.17** | Single Tenant Lease, between La Palmea Flex, L.P. and A.J. Oster West LLC, dated February 1, 2009. | |||
| 10.18** | Form of Indemnity Agreement. | |||
| 10.19** | Form of Investor Rights Agreement. | |||
| 21.1** | List of Subsidiaries of Global Brass and Copper Holdings, Inc. | |||
| 23.1** | Consent of Paul, Weiss, Rifkind, Wharton & Garrison LLP (included in the opinion filed as Exhibit 5.1). | |||
| 23.2 | Consent of PricewaterhouseCoopers LLP. | |||
| 24.1** | Power of Attorney (included on the signature page hereof). | |||
| ** | Previously filed |
II-8