Attached files
| file | filename |
|---|---|
| 8-K - 8-K - FAIRPOINT COMMUNICATIONS INC | frp-8kx52013.htm |

May 2013 Company Presentation Exhibit 99.1
2 Safe Harbor Statement The information contained herein is current only as of the date hereof; however, unless otherwise indicated, financial information contained herein is as of March 31, 2013. The business, prospects, financial condition or performance of FairPoint Communications, Inc. (“FairPoint”) and its subsidiaries described herein may have changed since that date. FairPoint does not intend to update or otherwise revise the information contained herein. FairPoint makes no representation or warranty, express or implied, as to the completeness of the information contained herein. Market data used throughout this presentation is based on surveys and studies conducted by third parties, as well as industry and general publications. FairPoint has no obligation (express or implied) to update any or all of the information or to advise you of any changes; nor does FairPoint make any express or implied warranties or representations as to the completeness or accuracy nor does it accept responsibility for errors. Some statements herein are known as “forward-looking statements” within the meaning of Section 27A of the Securities Act of 1933, as amended, and Section 21E of the Securities Exchange Act of 1934, as amended. These forward-looking statements include, but are not limited to, statements about our plans, objectives, expectations and intentions and other statements contained herein that are not historical facts. When used herein, the words “expects,” “anticipates,” “intends,” “plans,” “believes,” “seeks,” “estimates” and similar expressions are generally intended to identify forward-looking statements. Because these forward-looking statements involve known and unknown risks and uncertainties, there are important factors that could cause actual results, events or developments to differ materially from those expressed or implied by these forward-looking statements, including our plans, objectives, expectations and intentions and other factors. You should not place undue reliance on such forward-looking statements, which are based on the information currently available to us and speak only as of the date hereof. FairPoint does not undertake any obligation to publicly update or revise any forward-looking statements, whether as a result of new information, future events or otherwise. Throughout this presentation, reference is made to Adjusted EBITDA and Unlevered Free Cash Flow and adjustments to GAAP and non-GAAP measures to exclude the effect of special items. Management believes that Adjusted EBITDA provides a useful measure of operational and financial performance and removes variability related to pension contributions and payments for other post-employment benefits and that Unlevered Free Cash Flow may be useful to investors in assessing the Company’s ability to generate cash and meet its debt service requirements. The maintenance covenants contained in the Company’s credit facility are based on Adjusted EBITDA. In addition, management believes that the adjustments to GAAP and non-GAAP measures to exclude the effect of special items may be useful to investors in understanding period-to-period operating performance and in identifying historical and prospective trends. We provide guidance as to certain financial information herein, which consists of forward-looking statements. Our guidance is not prepared with a view toward compliance with the published guidelines of the American Institute of Certified Public Accountants, and neither our independent registered public accounting firm nor any other independent expert or outside party compiles or examines the guidance and, accordingly, no such person expresses any opinion or any other form of assurance with respect thereto. Guidance is based upon a number of assumptions and estimates that, while presented with numerical specificity, are inherently subject to significant business, economic and competitive uncertainties and contingencies, many of which are beyond our control and are based upon specific assumptions with respect to future business decisions, some of which will change. We generally state possible outcomes as high and low ranges which are intended to provide a sensitivity analysis as variables are changed but are not intended to represent our actual results which could fall outside of the suggested ranges. The principal reason that we release this data is to provide a basis for our management to discuss our business outlook with analysts and investors. Notwithstanding this, we do not accept any responsibility for any projections or reports published by any such outside analysts or investors. Guidance is necessarily speculative in nature, and it can be expected that some or all of the assumptions or the guidance furnished by us will not materialize or will vary significantly from actual results. Accordingly, our guidance is only an estimate of what management believes is realizable as of the date hereof. Actual results may vary from the guidance and the variations may be material. Investors should also recognize that the reliability of any forecasted financial data diminishes the farther in the future that the data is forecast. In light of the foregoing, investors are urged to put the guidance in context and not to place undue reliance on it. Any inability to successfully implement our operating strategy or the occurrence of any of the events or circumstances discussed therein could result in the actual operating results being different than the guidance, and such differences may be material.
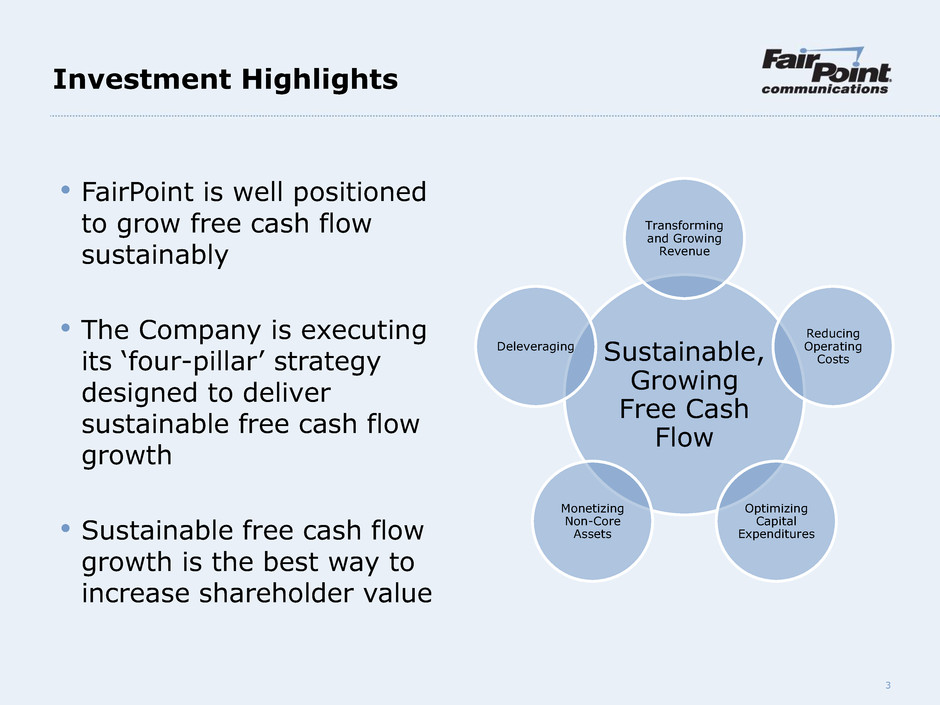
3 Investment Highlights Sustainable, Growing Free Cash Flow Transforming and Growing Revenue Reducing Operating Costs Optimizing Capital Expenditures Monetizing Non-Core Assets Deleveraging • FairPoint is well positioned to grow free cash flow sustainably • The Company is executing its ‘four-pillar’ strategy designed to deliver sustainable free cash flow growth • Sustainable free cash flow growth is the best way to increase shareholder value
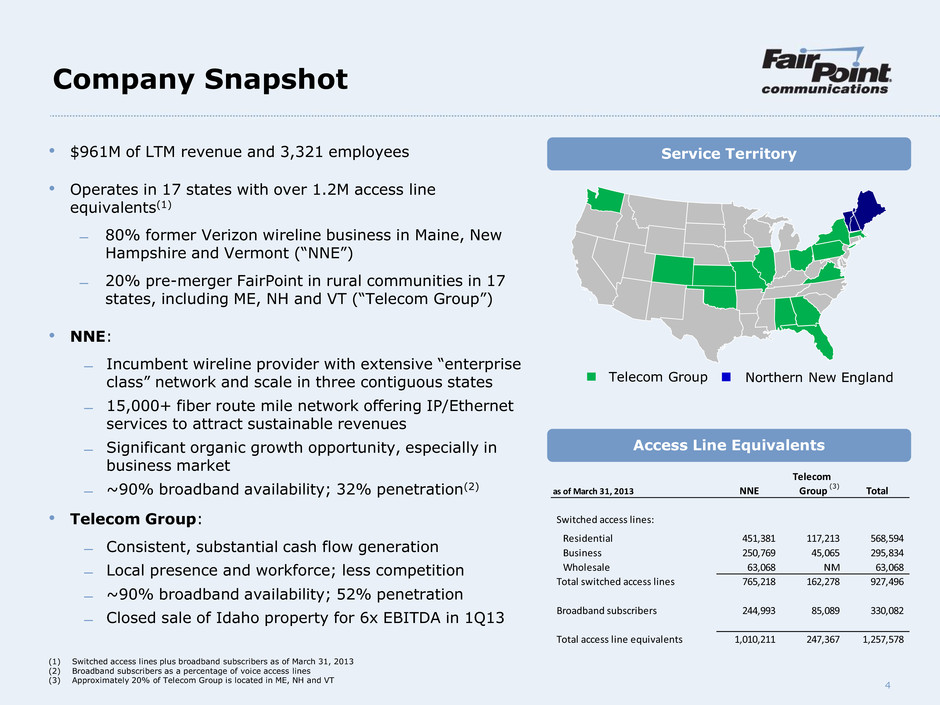
4 Telecom as of March 31, 2013 NNE Group Total Switched access lines: Residential 451,381 117,213 568,594 Business 250,769 45,065 295,834 Wholesale 63,068 NM 63,068 Total switched access lines 765,218 162,278 927,496 Broadband subscribers 244,993 85,089 330,082 Total access line equivalents 1,010,211 247,367 1,257,578 Access Line Equivalents Company Snapshot • $961M of LTM revenue and 3,321 employees • Operates in 17 states with over 1.2M access line equivalents(1) ̶ 80% former Verizon wireline business in Maine, New Hampshire and Vermont (“NNE”) ̶ 20% pre-merger FairPoint in rural communities in 17 states, including ME, NH and VT (“Telecom Group”) • NNE: ̶ Incumbent wireline provider with extensive “enterprise class” network and scale in three contiguous states ̶ 15,000+ fiber route mile network offering IP/Ethernet services to attract sustainable revenues ̶ Significant organic growth opportunity, especially in business market ̶ ~90% broadband availability; 32% penetration(2) • Telecom Group: ̶ Consistent, substantial cash flow generation ̶ Local presence and workforce; less competition ̶ ~90% broadband availability; 52% penetration ̶ Closed sale of Idaho property for 6x EBITDA in 1Q13 Telecom Group Northern New England (1) Switched access lines plus broadband subscribers as of March 31, 2013 (2) Broadband subscribers as a percentage of voice access lines (3) Approximately 20% of Telecom Group is located in ME, NH and VT Service Territory (3)

5 Four Pillar Strategy Transform & Grow Revenue Execute HR Strategy Continued operational improvement across FairPoint’s core businesses Improve Operations Change Regulatory Environment Return the Company to Growth and Create Long Term Value for Shareholders Level playing field in NNE provides flexibility on retail products and lightens regulatory burden Generated $112 million in Unlevered Free Cash Flow(1) in 2012 Continuing priority in 2013 Improving productivity and efficiency Renegotiate labor contracts in August 2014 1 2 3 4 (1) Unlevered Free Cash Flow means Adjusted EBITDA minus the sum of pension contributions, OPEB payments and capital expenditures. Unlevered Free Cash Flow is a non-GAAP financial measure. For a reconciliation of Net Income (Loss) to Unlevered Free Cash Flow, see our first quarter 2013 earnings release furnished May 6, 2013 on Form 8-K
6 Proven Operational Performance 1 Meaningful improvement in service quality (1) - 51% YoY improvement in Ethernet installation intervals - 12% YoY reduction in trouble reports - 6% YoY reduction in repair calls Best-in-class complex project management - Fiber-to-the-Tower initiative - Over 900 mobile Ethernet backhaul connections. Contracted to increase to over 1,300 in 2013 - Next Generation E-911 service Fiber and next generation 911 service to all 26 Public Service Answering Points in Maine - New England Telehealth Consortium Fiber connection to over 400+ healthcare institutions Response during major storms (Sandy and Irene), along with the recovery efforts, further solidified our position as a trusted provider among our customers, regulators and state administrations Focus on Quality and Service Leveraging Network with Outstanding Project Management Key Operational Highlights in 1Q13 (1) March 2013 as compared to March 2012. Northern New England only
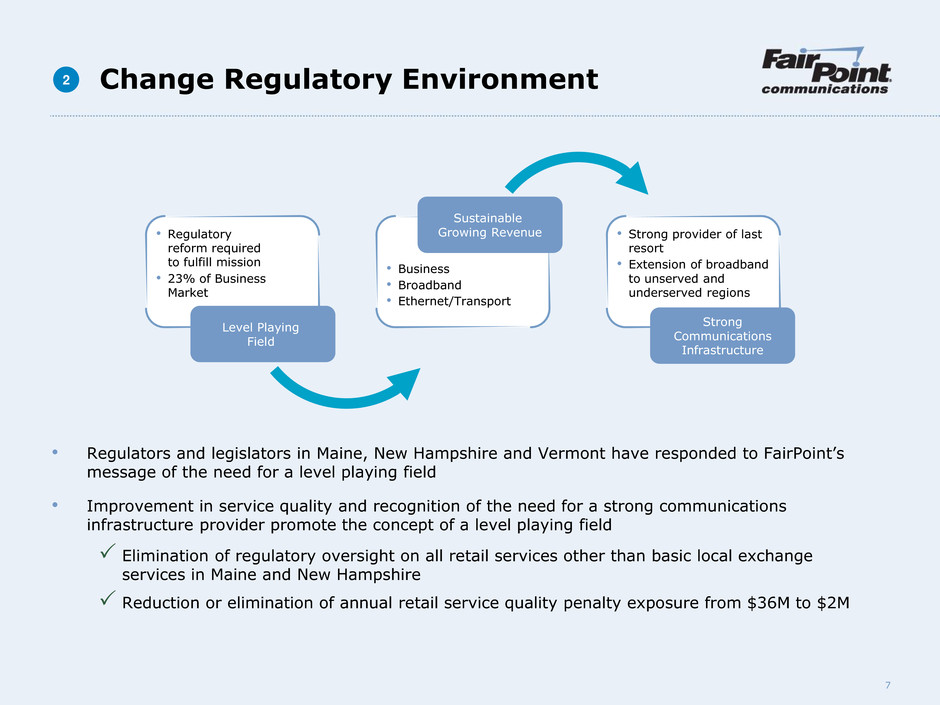
7 • Regulators and legislators in Maine, New Hampshire and Vermont have responded to FairPoint’s message of the need for a level playing field • Improvement in service quality and recognition of the need for a strong communications infrastructure provider promote the concept of a level playing field Elimination of regulatory oversight on all retail services other than basic local exchange services in Maine and New Hampshire Reduction or elimination of annual retail service quality penalty exposure from $36M to $2M • Regulatory reform required to fulfill mission • 23% of Business Market Change Regulatory Environment 2 • Strong provider of last resort • Extension of broadband to unserved and underserved regions Level Playing Field Strong Communications Infrastructure • Business • Broadband • Ethernet/Transport Sustainable Growing Revenue
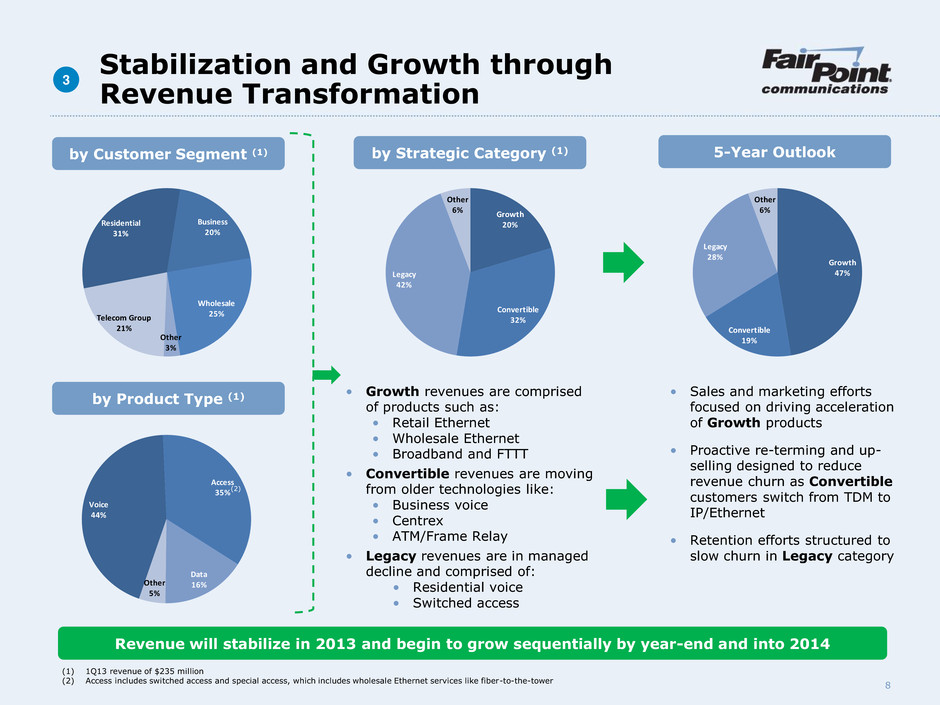
8 Stabilization and Growth through Revenue Transformation 3 by Customer Segment (1) • Growth revenues are comprised of products such as: • Retail Ethernet • Wholesale Ethernet • Broadband and FTTT • Convertible revenues are moving from older technologies like: • Business voice • Centrex • ATM/Frame Relay • Legacy revenues are in managed decline and comprised of: • Residential voice • Switched access by Strategic Category (1) 5-Year Outlook • Sales and marketing efforts focused on driving acceleration of Growth products • Proactive re-terming and up- selling designed to reduce revenue churn as Convertible customers switch from TDM to IP/Ethernet • Retention efforts structured to slow churn in Legacy category Voice 44% Access 35% Data 16%Other 5% Growth 20% Convertible 32% Legacy 42% Other 6% by Product Type (1) Growth 47% Convertible 19% Legacy 28% Other 6% Revenue will stabilize in 2013 and begin to grow sequentially by year-end and into 2014 (1) 1Q13 revenue of $235 million (2) Access includes switched access and special access, which includes wholesale Ethernet services like fiber-to-the-tower Residential 31% Business 20% Wholesale 25% Other 3% Telecom Group 21% (2)

9 Revenue Strategy • Focus: Growth-oriented, sustainable high-margin revenues • Service: “Enterprise Class” Ethernet and data-centric services enabled by extensive fiber network • Target: Three contiguous state footprint for regional, wholesale and local customers in NNE Next Generation Network • Network (NNE) engineered for “enterprise Class” customers to support latest VantagePoint SM high-speed data services • 15K fiber route miles connecting over 350 Central Offices • 2.1 million high-speed Internet qualified loops, including over 1.3 million qualified ADSL-2+ loops and over 100K fiber-to- the-premise passings • Latest generation IP/MPLS network core and over 400G DWDM optical transport 3 3a Enhanced Data Products Focused and Driven Sales Culture 3b 3c Significant Growth Opportunities in NNE Business Market (23% Market Share) • Focus on data-centric products such as Ethernet, fiber-to-the- tower and Broadband • Easy access to NNE through out- of-territory service connections in New York and Boston • Matching growing customer bandwidth demands with next- generation products • Reliability, redundancy and service quality are competitive advantages • Improved sales recruiting process, sales activity model and best-in-class practices • Focused go-to-market strategy based on customer, product and sales verticals • Key wins across the Business, Wholesale and Government / Education markets • Target key segments (e.g. Enterprise, SMB) that are expected to have high take-up
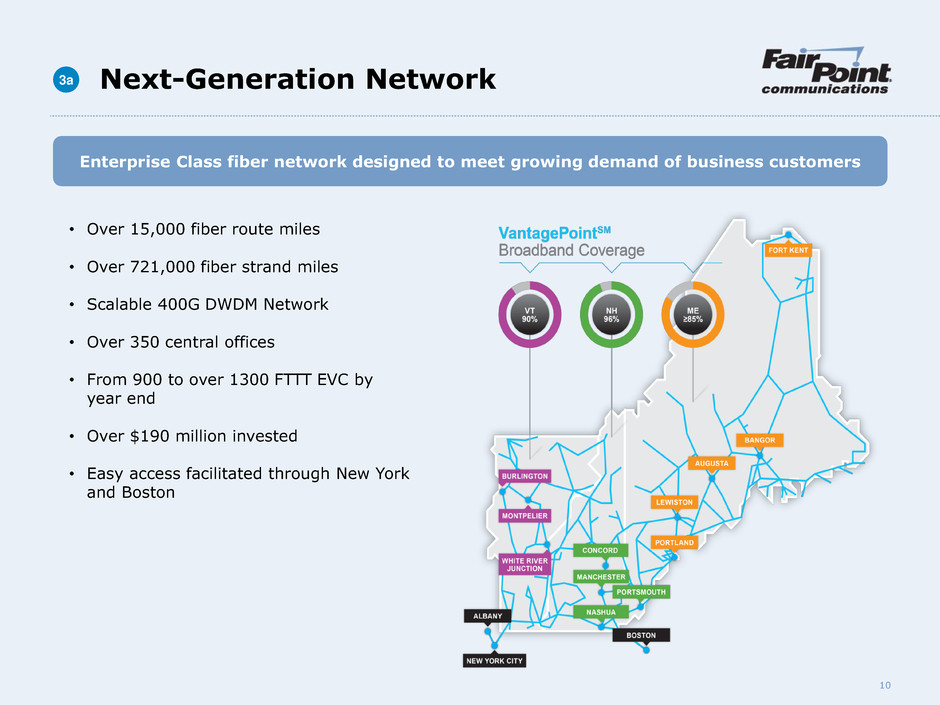
10 Next-Generation Network • Over 15,000 fiber route miles • Over 721,000 fiber strand miles • Scalable 400G DWDM Network • Over 350 central offices • From 900 to over 1300 FTTT EVC by year end • Over $190 million invested • Easy access facilitated through New York and Boston Enterprise Class fiber network designed to meet growing demand of business customers 3a
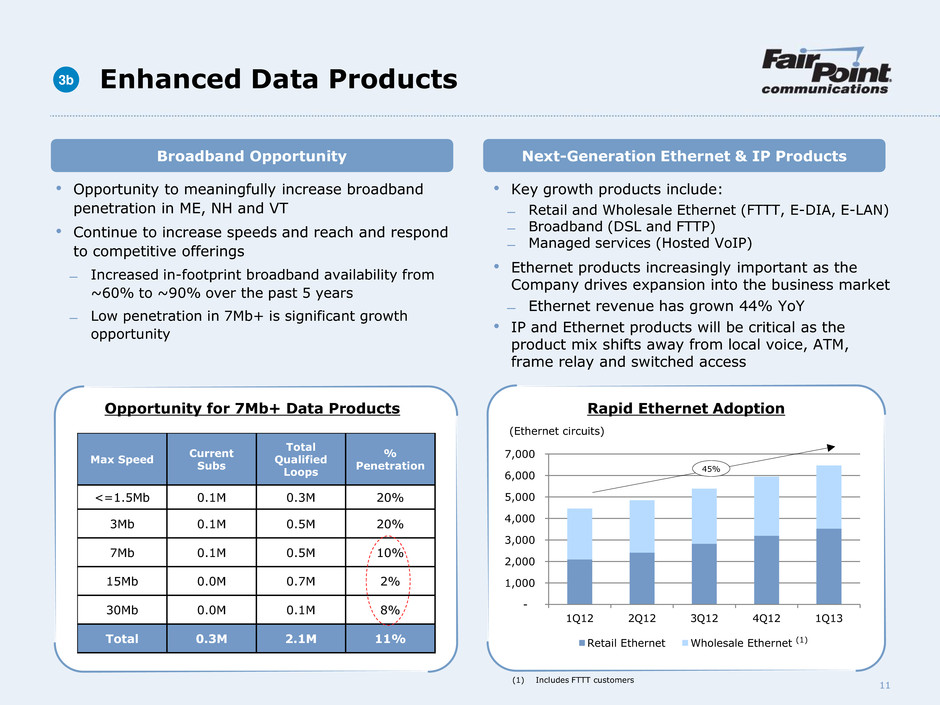
11 Enhanced Data Products • Opportunity to meaningfully increase broadband penetration in ME, NH and VT • Continue to increase speeds and reach and respond to competitive offerings ̶ Increased in-footprint broadband availability from ~60% to ~90% over the past 5 years ̶ Low penetration in 7Mb+ is significant growth opportunity Broadband Opportunity Next-Generation Ethernet & IP Products 3b • Key growth products include: ̶ Retail and Wholesale Ethernet (FTTT, E-DIA, E-LAN) ̶ Broadband (DSL and FTTP) ̶ Managed services (Hosted VoIP) • Ethernet products increasingly important as the Company drives expansion into the business market ̶ Ethernet revenue has grown 44% YoY • IP and Ethernet products will be critical as the product mix shifts away from local voice, ATM, frame relay and switched access Opportunity for 7Mb+ Data Products Max Speed Current Subs Total Qualified Loops % Penetration <=1.5Mb 0.1M 0.3M 20% 3Mb 0.1M 0.5M 20% 7Mb 0.1M 0.5M 10% 15Mb 0.0M 0.7M 2% 30Mb 0.0M 0.1M 8% Total 0.3M 2.1M 11% - 1,000 2,000 3,000 4,000 5,000 6,000 7,000 1Q12 2Q12 3Q12 4Q12 1Q13 Retail Ethernet Wholesale Ethernet Rapid Ethernet Adoption 45% (Ethernet circuits) (1) (1) Includes FTTT customers
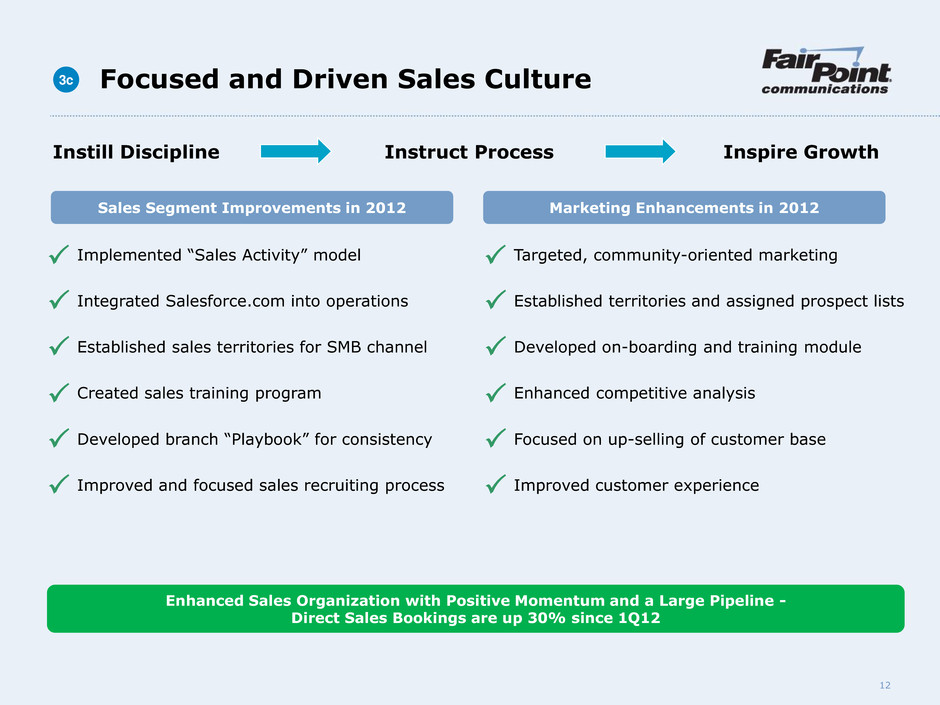
12 Instill Discipline Instruct Process Inspire Growth Focused and Driven Sales Culture 3c Sales Segment Improvements in 2012 Marketing Enhancements in 2012 Implemented “Sales Activity” model Integrated Salesforce.com into operations Established sales territories for SMB channel Created sales training program Developed branch “Playbook” for consistency Improved and focused sales recruiting process Enhanced Sales Organization with Positive Momentum and a Large Pipeline - Direct Sales Bookings are up 30% since 1Q12 Targeted, community-oriented marketing Established territories and assigned prospect lists Developed on-boarding and training module Enhanced competitive analysis Focused on up-selling of customer base Improved customer experience
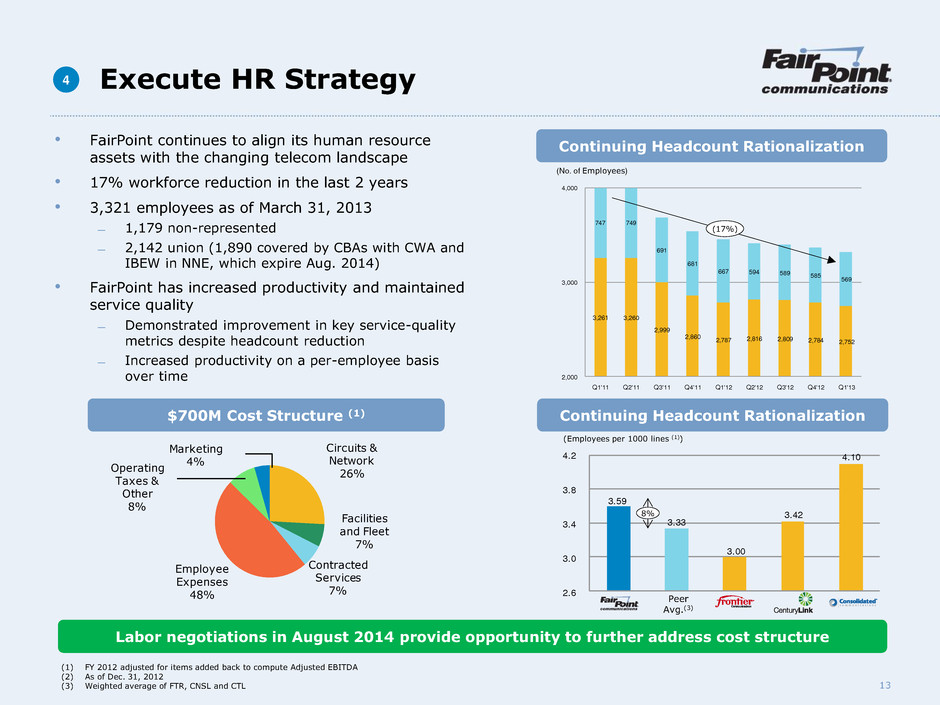
13 Circuits & Network 26% Facilities and Fleet 7% Contracted Services 7% Employee Expenses 48% Operating Taxes & Other 8% Marketing 4% 3,261 3,260 2,999 2,860 2,787 2,816 2,809 2,784 2,752 747 749 691 681 667 594 589 585 569 2,000 3,000 4,000 Q1'11 Q2'11 Q3'11 Q4'11 Q1'12 Q2'12 Q3'12 Q4'12 Q1'13 NNE Telecom (No. of Employees) Execute HR Strategy 4 • FairPoint continues to align its human resource assets with the changing telecom landscape • 17% workforce reduction in the last 2 years • 3,321 employees as of March 31, 2013 ̶ 1,179 non-represented ̶ 2,142 union (1,890 covered by CBAs with CWA and IBEW in NNE, which expire Aug. 2014) • FairPoint has increased productivity and maintained service quality ̶ Demonstrated improvement in key service-quality metrics despite headcount reduction ̶ Increased productivity on a per-employee basis over time Continuing Headcount Rationalization (17%) $700M Cost Structure (1) 3.59 3.33 3.00 3.42 4.10 2.6 3.0 3.4 3.8 4.2 (Employees per 1000 lines (1)) Continuing Headcount Rationalization Labor negotiations in August 2014 provide opportunity to further address cost structure (1) FY 2012 adjusted for items added back to compute Adjusted EBITDA (2) As of Dec. 31, 2012 (3) Weighted average of FTR, CNSL and CTL 8% Peer Avg.(3)
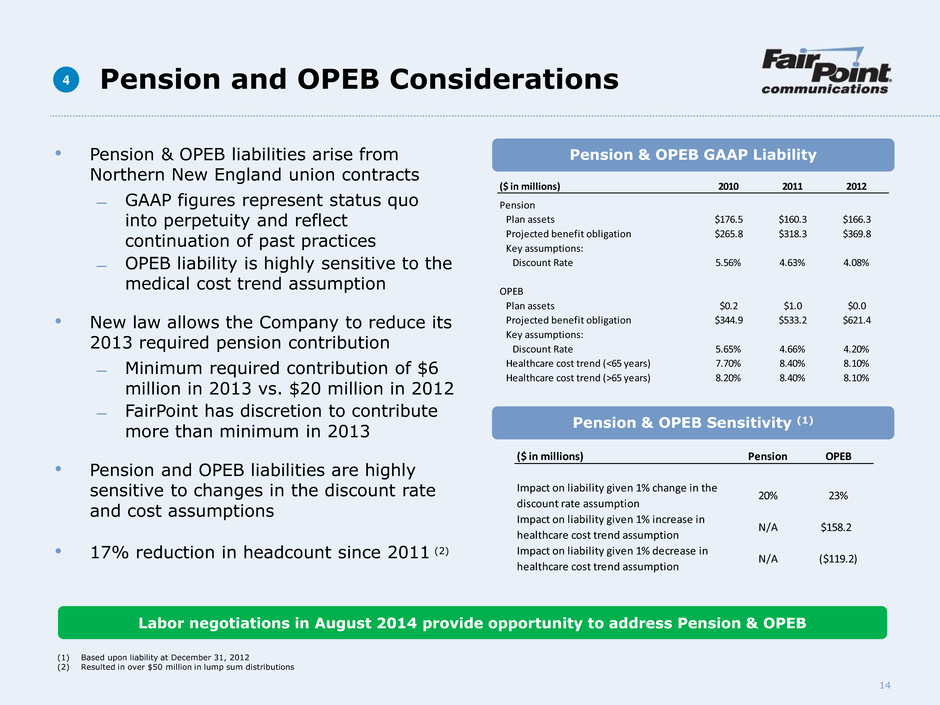
14 Pension & OPEB Sensitivity (1) Pension & OPEB GAAP Liability • Pension & OPEB liabilities arise from Northern New England union contracts ̶ GAAP figures represent status quo into perpetuity and reflect continuation of past practices ̶ OPEB liability is highly sensitive to the medical cost trend assumption • New law allows the Company to reduce its 2013 required pension contribution ̶ Minimum required contribution of $6 million in 2013 vs. $20 million in 2012 ̶ FairPoint has discretion to contribute more than minimum in 2013 • Pension and OPEB liabilities are highly sensitive to changes in the discount rate and cost assumptions • 17% reduction in headcount since 2011 (2) (1) Based upon liability at December 31, 2012 (2) Resulted in over $50 million in lump sum distributions ($ in millions) 2010 2011 2012 Pension Plan assets $176.5 $160.3 $166.3 Projected benefit obligation $265.8 $318.3 $369.8 Key assumptions: Discount Rate 5.56% 4.63% 4.08% OPEB Pla assets $0.2 $1.0 $0.0 Projected benefit obligation $344.9 $533.2 $621.4 Key assumptions: Discount Rate 5.65% 4.66% 4.20% Healthcare cost trend (<65 years) 7.70% 8.40% 8.10% Healthcare cost trend (>65 years) 8.20% 8.40% 8.10%($ in millions) Pension OPEB Impact o liability given 1% change in the discount rate assumption 20% 23% Impact on liability given 1% increase in healthcare cost trend assumption N/A $158.2 Impact on liability given 1% decrease in healthcare cost trend assumption N/A ($119.2) Labor negotiations in August 2014 provide opportunity to address Pension & OPEB Pension and OPEB Considerations 4

15 Financial Overview
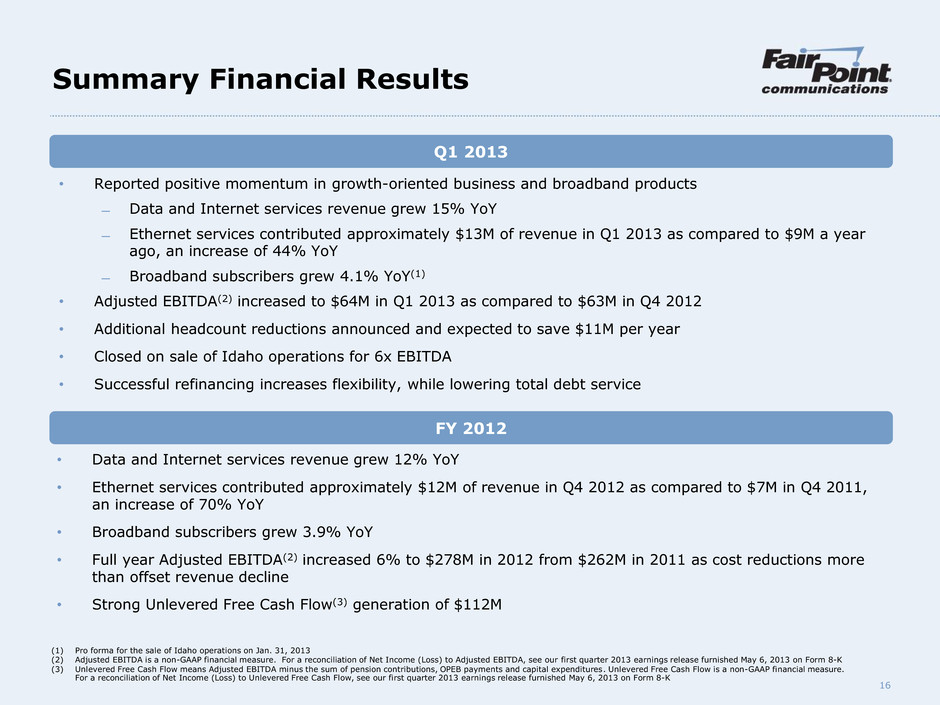
16 Summary Financial Results • Data and Internet services revenue grew 12% YoY • Ethernet services contributed approximately $12M of revenue in Q4 2012 as compared to $7M in Q4 2011, an increase of 70% YoY • Broadband subscribers grew 3.9% YoY • Full year Adjusted EBITDA(2) increased 6% to $278M in 2012 from $262M in 2011 as cost reductions more than offset revenue decline • Strong Unlevered Free Cash Flow(3) generation of $112M (1) Pro forma for the sale of Idaho operations on Jan. 31, 2013 (2) Adjusted EBITDA is a non-GAAP financial measure. For a reconciliation of Net Income (Loss) to Adjusted EBITDA, see our first quarter 2013 earnings release furnished May 6, 2013 on Form 8-K (3) Unlevered Free Cash Flow means Adjusted EBITDA minus the sum of pension contributions, OPEB payments and capital expenditures. Unlevered Free Cash Flow is a non-GAAP financial measure. For a reconciliation of Net Income (Loss) to Unlevered Free Cash Flow, see our first quarter 2013 earnings release furnished May 6, 2013 on Form 8-K Q1 2013 FY 2012 • Reported positive momentum in growth-oriented business and broadband products ̶ Data and Internet services revenue grew 15% YoY ̶ Ethernet services contributed approximately $13M of revenue in Q1 2013 as compared to $9M a year ago, an increase of 44% YoY ̶ Broadband subscribers grew 4.1% YoY(1) • Adjusted EBITDA(2) increased to $64M in Q1 2013 as compared to $63M in Q4 2012 • Additional headcount reductions announced and expected to save $11M per year • Closed on sale of Idaho operations for 6x EBITDA • Successful refinancing increases flexibility, while lowering total debt service

17 Commentary: • 2013 guidance takes into account the sale of Idaho on Jan. 31, 2013 ($8M of revenue, $5M of EBITDA and $1M of CapEx per year) • Annual cash interest expense, on a pro forma basis, is expected to be $75 to 80 million per year • Annual mandatory debt amortization, on a pro forma basis, of $6 million Recent Financial Trends (1) Adjusted EBITDA is a non-GAAP financial measure. For a reconciliation of Net Income (Loss) to Adjusted EBITDA, see the Company’s first quarter 2013 earnings release furnished May 6, 2013 on Form 8-K (2) Unlevered Free Cash Flow means Adjusted EBITDA minus the sum of pension contributions, OPEB payments and capital expenditures. Unlevered Free Cash Flow is a non-GAAP financial measure. For a reconciliation of Net Income (Loss) to Unlevered Free Cash Flow, see our first quarter 2013 earnings release furnished May 6, 2013 on Form 8-K (3) Sale of Idaho on Jan. 31, 2013 resulted in $2M of sequential revenue decline from 4Q12 to 1Q13 ($ in M) 1Q12 2Q12 3Q12 4Q12 1Q13 2012 2013 Guidance Revenue $248 $243 $242 $240 $235 $974 Adjusted EBITDA(1) $73 $73 $69 $63 $64 $278 $255 - $265 margin 29% 30% 29% 26% 27% 29% Capital expenditures $26 $32 $38 $49 $30 $145 $135 % of revenue 11% 13% 16% 20% 13% 15% Cash Pension & OPEB $6 $6 $8 $1 $1 $21 $20 Unlevered Free Cash Flow(2) $41 $35 $24 $12 $33 $112 $100 - $110 Cash on hand $36 $44 $22 $23 $17 $23 Debt $998 $995 $970 $957 $940 $957 Financial Highlights (3)
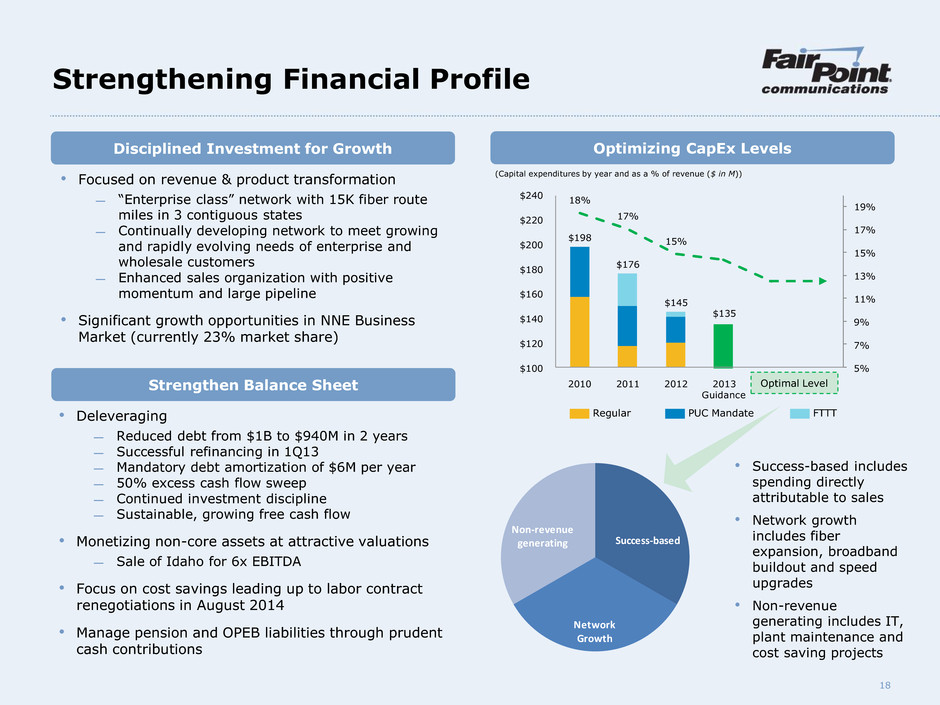
18 • Focused on revenue & product transformation ̶ “Enterprise class” network with 15K fiber route miles in 3 contiguous states ̶ Continually developing network to meet growing and rapidly evolving needs of enterprise and wholesale customers ̶ Enhanced sales organization with positive momentum and large pipeline • Significant growth opportunities in NNE Business Market (currently 23% market share) Disciplined Investment for Growth Strengthen Balance Sheet • Deleveraging ̶ Reduced debt from $1B to $940M in 2 years ̶ Successful refinancing in 1Q13 ̶ Mandatory debt amortization of $6M per year ̶ 50% excess cash flow sweep ̶ Continued investment discipline ̶ Sustainable, growing free cash flow • Monetizing non-core assets at attractive valuations ̶ Sale of Idaho for 6x EBITDA • Focus on cost savings leading up to labor contract renegotiations in August 2014 • Manage pension and OPEB liabilities through prudent cash contributions Strengthening Financial Profile $198 $176 $145 $135 18% 17% 15% 5% 7% 9% 11% 13% 15% 17% 19% $100 $120 $140 $160 $180 $200 $220 $240 2010 2011 2012 2013 Guidance (Capital expenditures by year and as a % of revenue ($ in M)) Optimizing CapEx Levels Regular PUC Mandate FTTT Optimal Level Success-based Network Growth Non-revenue generating • Success-based includes spending directly attributable to sales • Network growth includes fiber expansion, broadband buildout and speed upgrades • Non-revenue generating includes IT, plant maintenance and cost saving projects
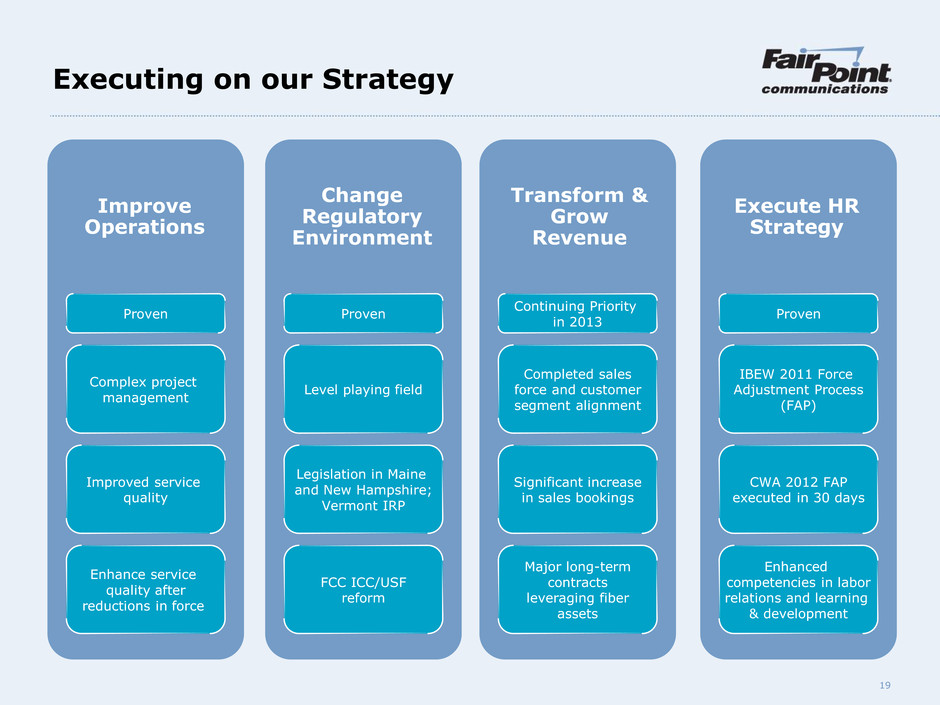
19 Executing on our Strategy 1 2 3 4 Improve Operations Change Regulatory Environment Transform & Grow Revenue Execute HR Strategy Proven Proven Continuing Priority in 2013 Proven Complex project management Level playing field Completed sales force and customer segment alignment IBEW 2011 Force Adjustment Process (FAP) Improved service quality Legislation in Maine and New Hampshire; Vermont IRP Significant increase in sales bookings CWA 2012 FAP executed in 30 days Enhance service quality after reductions in force FCC ICC/USF reform Major long-term contracts leveraging fiber assets Enhanced competencies in labor relations and learning & development
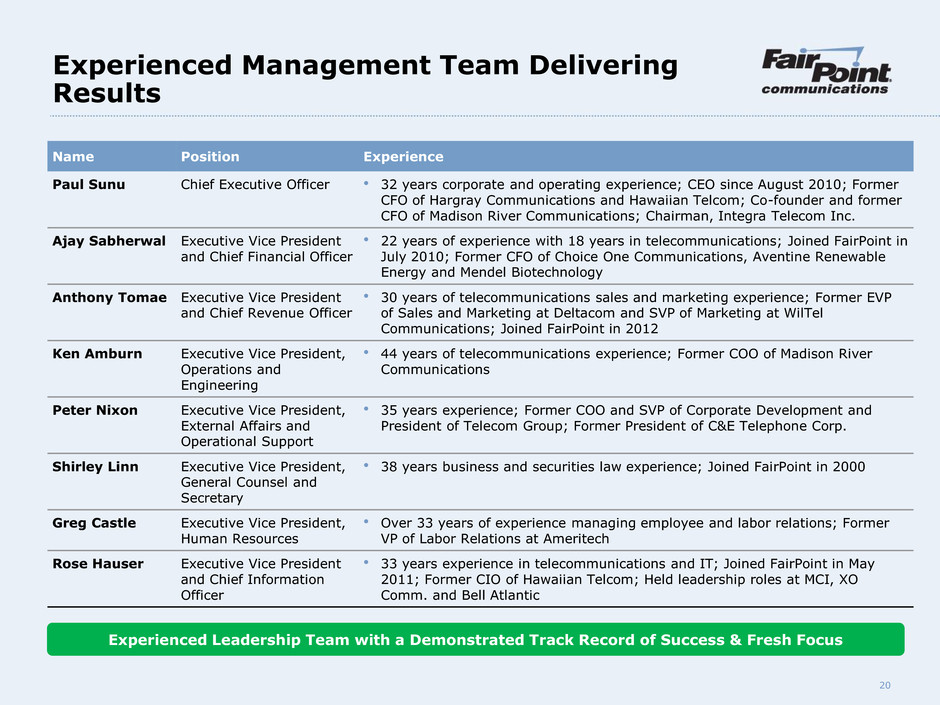
20 Experienced Management Team Delivering Results Name Position Experience Paul Sunu Chief Executive Officer • 32 years corporate and operating experience; CEO since August 2010; Former CFO of Hargray Communications and Hawaiian Telcom; Co-founder and former CFO of Madison River Communications; Chairman, Integra Telecom Inc. Ajay Sabherwal Executive Vice President and Chief Financial Officer • 22 years of experience with 18 years in telecommunications; Joined FairPoint in July 2010; Former CFO of Choice One Communications, Aventine Renewable Energy and Mendel Biotechnology Anthony Tomae Executive Vice President and Chief Revenue Officer • 30 years of telecommunications sales and marketing experience; Former EVP of Sales and Marketing at Deltacom and SVP of Marketing at WilTel Communications; Joined FairPoint in 2012 Ken Amburn Executive Vice President, Operations and Engineering • 44 years of telecommunications experience; Former COO of Madison River Communications Peter Nixon Executive Vice President, External Affairs and Operational Support • 35 years experience; Former COO and SVP of Corporate Development and President of Telecom Group; Former President of C&E Telephone Corp. Shirley Linn Executive Vice President, General Counsel and Secretary • 38 years business and securities law experience; Joined FairPoint in 2000 Greg Castle Executive Vice President, Human Resources • Over 33 years of experience managing employee and labor relations; Former VP of Labor Relations at Ameritech Rose Hauser Executive Vice President and Chief Information Officer • 33 years experience in telecommunications and IT; Joined FairPoint in May 2011; Former CIO of Hawaiian Telcom; Held leadership roles at MCI, XO Comm. and Bell Atlantic Experienced Leadership Team with a Demonstrated Track Record of Success & Fresh Focus
