UNITED STATES
SECURITIES AND EXCHANGE COMMISSION
Washington, D.C. 20549
FORM 8-K
CURRENT REPORT
Pursuant to Section 13 or 15(d) of the Securities Exchange Act of 1934
Date of Report (Date of earliest event reported): May 15, 2013
|
Eagle Bulk Shipping Inc.
|
||
|
(Exact name of registrant as specified in its charter)
|
||
|
Republic of the Marshall Islands
|
001-33831
|
98-0453513
|
|
(State or other jurisdiction of incorporation or organization)
|
(Commission File Number)
|
(IRS employer identification no.)
|
|
477 Madison Avenue
New York, New York
|
10022
|
|
|
(Address of principal executive offices)
|
(Zip Code)
|
|
(Registrant's telephone number, including area code): (212) 785-2500
(Former Name or Former Address, if Changed Since Last Report): None
Check the appropriate box below if the Form 8-K filing is intended to simultaneously satisfy the filing obligation of the registrant under any of the following provisions (see General Instruction A.2. below):
[_] Written communications pursuant to Rule 425 under the Securities Act (17 CFR 230.425)
[_] Soliciting material pursuant to Rule 14a-12 under the Exchange Act (17 CFR 240.14a-12)
|
[_]
|
Pre-commencement communications pursuant to Rule 14d-2(b) under the Exchange Act (17 CFR 240.14d-2(b))
|
|
[_]
|
Pre-commencement communications pursuant to Rule 13e-4(c) under the Exchange Act (17 CFR 240.13e-4(c))
|
Item 2.02.Results of Operations and Financial Condition
On May 15, 2013, Eagle Bulk Shipping Inc. (the "Company") issued a press release (the "Press Release") relating to its financial results for the first quarter ended March 31, 2013.
In accordance with General Instruction B.2 to the Form 8-K, the information under this Item 2.02 and the Press Release, attached hereto as Exhibit 99.1, shall be deemed to be "furnished" to the Securities and Exchange Commission (the "SEC") and not be deemed to be "filed" with the SEC for purposes of Section 18 of the Exchange Act or otherwise subject to the liabilities of that section.
Item 8.01. Other Events
On May 16, 2013, the Company posted on its website, www.eagleships.com, under the section entitled "Investors - Webcasts & Presentations" a presentation dated May 16, 2013 of its financial results for the first quarter ended March 31, 2013. A copy of the presentation is hereby furnished to the SEC and is attached as Exhibit 99.2.
Item 9.01.Financial Statements and Exhibits
(d) Exhibits
|
Exhibit Number
|
Description
|
|
99.1
|
Press Release dated May 15, 2013.
|
|
99.2
|
Financial Presentation dated May 16, 2013
|
SIGNATURES
Pursuant to the requirements of the Securities Exchange Act of 1934, the registrant has duly caused this report to be signed on its behalf by the undersigned hereunto duly authorized.
|
EAGLE BULK SHIPPING INC.
|
|||
|
(registrant)
|
|||
|
Dated: May 20, 2013
|
By:
|
/s/ Adir Katzav |
|
|
Name:
|
Adir Katzav
|
||
|
Title:
|
Chief Financial Officer
|
||
EXHIBIT INDEX
|
Exhibit No.
|
Description
|
|
99.1
|
Press Release dated May 15, 2013.
|
|
99.2
|
Financial Presentation dated May 16, 2013
|
Exhibit 99.1
Eagle Bulk Shipping Inc. Reports First Quarter 2013 Results
NEW YORK, NY, May 15, 2013-- Eagle Bulk Shipping Inc. (Nasdaq: EGLE) today announced its results for the first quarter ended March 31, 2013.
For the First Quarter:
|
|
●
|
Net reported income of $1.4 million or $0.08 per share (based on a weighted average of 16,966,070 diluted shares outstanding for the quarter), compared with net loss of $17.4 million, or $1.11 per share, for the comparable quarter of 2012.
|
|
|
●
|
Net revenues of $72.2 million, compared to $52.6 million for the comparable quarter in 2012. Gross time charter and freight revenues of $73.6 million, compared with $54.8 million for the comparable quarter of 2012.
|
|
|
●
|
EBITDA, as adjusted for exceptional items under the terms of the Company's credit agreement, was $32.5 million for the first quarter of 2013, compared with $13.8 million for the first quarter of 2012.
|
|
|
●
|
Fleet utilization rate of 99.1%.
|
Sophocles N. Zoullas, Chairman and CEO, commented, "Conditions in the dry bulk market remain challenging and, for the most part, unchanged from our most recent earnings report. Though vessel supply dynamics are steadily improving, they have not yet aligned with demand fundamentals. Our focus in this environment continues to emphasize a flexible, opportunistic chartering strategy, access to the relatively stable minor bulk trade, and operational excellence and efficiency."
Results of Operations for the three-month period ended March 31, 2013 and 2012
For the first quarter of 2013, the Company reported net income of $1,374,270 or $0.08 per share, based on a weighted average of 16,966,070 diluted shares outstanding. In the comparable first quarter of 2012, the Company reported net loss of $17,433,529 or $1.11 per share, based on a weighted average of 15,750,821 diluted shares outstanding.
Gross time and voyage charter revenues in the quarter ended March 31, 2013 were $73,618,991, compared with $54,823,130 recorded in the comparable quarter in 2012. The increase in revenue is attributable to the settlement agreement with KLC, pursuant to which the Company recognized revenue of approximately $32.8 million, offset by lower time charter rates earned by the fleet and a marginal decrease in voyage charter revenues. Gross revenues recorded in the quarter ended March 31, 2013 and 2012 include an amount of $10,280,559 and $1,228,764, respectively, relating to the non-cash amortization of fair value below contract value of time charters acquired of which $10,106,247 relates to the KLC settlement agreement in the quarter ended March 31, 2013. Brokerage commissions incurred on revenues earned in the quarter ended March 31, 2013 and 2012 were $1,396,638 and $2,206,730, respectively. Net revenues during the quarter ended March 31, 2013 and 2012, were $72,222,353 and $52,616,400, respectively.
Total operating expenses for the quarter ended March 31, 2013 were $47,420,291 compared with $60,118,356 recorded in the first quarter of 2012. The Company operated 45 vessels in both first quarters of 2013 and 2012. The decrease in operating expenses resulted primarily from a reduction in the allowance for accounts receivable of approximately $3,438,145, lower professional fee costs and compensation expenses in general and administrative expenses and a gain realized from the settlement agreement with KLC of $3,331,692. The decrease in depreciation and amortization expense is attributable to a lower drydock amortization. In addition, there was a reduction in charter hire expenses as none was incurred during the quarter ended March 31, 2013.
EBITDA, adjusted for exceptional items under the terms of the Company's credit agreement, was $32,524,714 for the first quarter of 2013, compared with $13,813,999 for the first quarter of 2012. (Please see below for a reconciliation of EBITDA to net income / (loss).
1
Liquidity and Capital Resources
Net cash provided by operating activities during the three-month period ended March 31, 2013, was $1,248,839, compared with net cash provided by operating activities of $2,653,413 during the corresponding three-month period ended March 31, 2012. The decrease was primarily due to lower rates on charter renewals.
Net cash used by investing activities during the three-month period ended March 31, 2013, was $49,994, compared with net cash provided by investing activities of $338,400 during the corresponding three-month period ended March 31, 2012.
Net cash used by financing activities during the three-month period ended March 31, 2013, was $48,000, compared to none in 2012.
As of March 31, 2013, our cash balance was $19,270,813, compared to a cash balance of $18,119,968 at December 31, 2012. Also recorded in Restricted Cash is an amount of $276,056, which collateralizes letters of credit relating to our office leases.
At March 31, 2013, the Company's debt consisted of $1,129,478,741 in term loans and $22,561,496 paid-in-kind loans.
Disclosure of Non-GAAP Financial Measures
EBITDA represents operating earnings before extraordinary items, depreciation and amortization, interest expense, and income taxes, if any. EBITDA is included because it is used by certain investors to measure a company's financial performance. EBITDA is not an item recognized by U.S. GAAP and should not be considered a substitute for net income, cash flow from operating activities and other operations or cash flow statement data prepared in accordance with accounting principles generally accepted in the United States or as a measure of profitability or liquidity. EBITDA is presented to provide additional information with respect to the Company's ability to satisfy its obligations including debt service, capital expenditures, and working capital requirements. While EBITDA is frequently used as a measure of operating results and the ability to meet debt service requirements, the definition of EBITDA used herein may not be comparable to that used by other companies due to differences in methods of calculation.
Our term loan agreement requires us to comply with financial covenants based on debt and interest ratio with extraordinary or exceptional items, interest, taxes, non-cash compensation, depreciation and amortization ("Credit Agreement EBITDA"). Therefore, we believe that this non-U.S. GAAP measure is important for our investors as it reflects our ability to meet our covenants. The following table is a reconciliation of net income/(loss), as reflected in the consolidated statements of operations, to the Credit Agreement EBITDA:
|
Three Months Ended
|
||||||||
|
|
March 31,2013
|
March 31,2012
|
||||||
|
Net Income/(Loss)
|
$ | 1,374,270 | $ | (17,433,529 | ) | |||
|
Interest Expense
|
20,539,035 | 10,960,910 | ||||||
|
Depreciation and Amortization
|
18,936,577 | 19,433,357 | ||||||
|
Amortization of fair value (below) above market of time charter acquired
|
(10,280,559 | ) | (1,228,764 | ) | ||||
|
EBITDA
|
30,569,323 | 11,731,974 | ||||||
|
|
||||||||
|
Non-cash Compensation Expense (1)
|
1,955,391 | 2,082,025 | ||||||
|
Credit Agreement EBITDA
|
$ | 32,524,714 | $ | 13,813,999 | ||||
(1) Stock based compensation related to stock options and restricted stock units.
Capital Expenditures and Drydocking
Our capital expenditures relate to the purchase of vessels and capital improvements to our vessels which are expected to enhance the revenue earning capabilities and safety of these vessels.
2
In addition to acquisitions that we may undertake in future periods, the Company's other major capital expenditures include funding the Company's maintenance program of regularly scheduled drydocking necessary to preserve the quality of our vessels as well as to comply with international shipping standards and environmental laws and regulations. Although the Company has some flexibility regarding the timing of its dry docking, the costs are relatively predictable. Management anticipates that vessels are to be drydocked every two and a half years. Funding of these requirements is anticipated to be met with cash from operations. We anticipate that this process of recertification will require us to reposition these vessels from a discharge port to shipyard facilities, which will reduce our available days and operating days during that period.
Drydocking costs incurred are deferred and amortized to expense on a straight-line basis over the period through the date of the next scheduled drydocking for those vessels. One vessel drydocked in the three months ended March 31, 2013. The following table represents certain information about the estimated costs for anticipated vessel drydockings in the next four quarters, along with the anticipated off-hire days:
|
Quarter Ending
|
Off-hire Days(1)
|
Projected Costs(2)
|
|||
|
June 30, 2013
|
44 |
$1.20 million
|
|||
|
September 30, 2013
|
22 |
$0.60 million
|
|||
|
December 31, 2013
|
44 |
$1.20 million
|
|||
|
March 31, 2014
|
44 |
$1.20 million
|
|||
|
(1)Actual duration of drydocking will vary based on the condition of the vessel, yard schedules and other factors.
(2)Actual costs will vary based on various factors, including where the drydockings are actually performed.
|
|||||
3
Summary Consolidated Financial and Other Data:
The following table summarizes the Company's selected consolidated financial and other data for the periods indicated below.
CONSOLIDATED STATEMENTS OF OPERATIONS
(UNAUDITED)
|
Three Months Ended
|
||||||||
|
March 31, 2013
|
March 31, 2012
|
|||||||
|
Revenues, net of commissions
|
$ | 72,222,353 | $ | 52,616,400 | ||||
|
Voyage expenses
|
8,204,657 | 7,017,793 | ||||||
|
Vessel expenses
|
20,494,412 | 22,442,06 | ||||||
|
Charter hire expenses
|
— | 590,484 | ||||||
|
Depreciation and amortization
|
18,936,577 | 19,433,357 | ||||||
|
General and administrative expenses
|
3,116,337 | 10,634,660 | ||||||
|
Gain on time charter agreement termination
|
(3,331,692 | ) | — | |||||
|
|
||||||||
|
Total operating expenses
|
47,420,291 | 60,118,356 | ||||||
|
Operating income (loss)
|
24,802,062 | (7,501,956 | ) | |||||
|
Interest expense
|
20,539,035 | 10,960,910 | ||||||
|
Interest income
|
(64,170 | ) | (8,038 | ) | ||||
|
Other expense (income)
|
2,952,927 | (1,021,299 | ) | |||||
|
Total other expense, net
|
23,427,792 | 9,931,573 | ||||||
|
Net income (loss)
|
$ | 1,374,270 | $ | (17,433,529 | ) | |||
|
Weighted average shares outstanding:
|
||||||||
|
Basic
|
16,966,070 | 15,750,821 | * | |||||
|
Diluted
|
16,966,070 | 15,750,821 | * | |||||
|
Per share amounts:
|
||||||||
|
Basic net income (loss)
|
$ | 0.08 | $ | (1.11 | ) | |||
|
Diluted net income (loss)
|
$ | 0.08 | $ | (1.11 | ) | |||
* Adjusted to give effect to the 1 for 4 reverse stock split that became effective on May 22, 2012, see Note 1.
Fleet Operating Data
|
Three Months Ended
|
||||||||
|
March 31, 2013
|
March 31, 2012
|
|||||||
|
Ownership Days
|
4,050 | 4,095 | ||||||
|
Chartered-in under operating lease Days
|
- | 32 | ||||||
|
Available Days
|
4,030 | 4,094 | ||||||
|
Operating Days
|
3,992 | 4,041 | ||||||
|
Fleet Utilization
|
99.1 | % | 98.7 | % | ||||
4
CONSOLIDATED BALANCE SHEETS
(UNAUDITED)
|
March 31, 2013
|
December 31, 2012
|
|||||||
|
ASSETS:
|
||||||||
|
Current assets:
|
||||||||
|
Cash and cash equivalents
|
$ | 19,270,813 | $ | 18,119,968 | ||||
|
Accounts receivable, net
|
10,755,027 | 9,303,958 | ||||||
|
Prepaid expenses
|
4,255,287 | 3,544,810 | ||||||
|
Inventories
|
12,719,310 | 12,083,125 | ||||||
|
Investment and other current asset
|
6,267,836 | 197,509 | ||||||
|
Fair value above contract value of time charters acquired
|
— | 549,965 | ||||||
|
Total current assets
|
53,268,273 | 43,799,335 | ||||||
|
Noncurrent assets:
|
||||||||
|
Vessels and vessel improvements, at cost, net of accumulated depreciation of $333,169,297 and $314,700,681, respectively
|
1,695,889,031 | 1,714,307,653 | ||||||
|
Other fixed assets, net of accumulated amortization of $595,242 and $515,896, respectively
|
401,242 | 447,716 | ||||||
|
Restricted cash
|
276,056 | 276,056 | ||||||
|
Deferred drydock costs
|
2,392,520 | 2,132,379 | ||||||
|
Deferred financing costs
|
23,036,131 | 25,095,469 | ||||||
|
Fair value above contract value of time charters acquired
|
— | 2,491,530 | ||||||
|
Other assets
|
1,318,333 | 594,012 | ||||||
|
Total noncurrent assets
|
1,723,313,313 | 1,745,344,815 | ||||||
|
Total assets
|
$ | 1,776,581,586 | $ | 1,789,144,150 | ||||
|
LIABILITIES & STOCKHOLDERS' EQUITY
|
||||||||
|
Current liabilities:
|
||||||||
|
Accounts payable
|
$ | 8,142,372 | $ | 10,235,007 | ||||
|
Accrued interest
|
1,047,546 | 2,430,751 | ||||||
|
Other accrued liabilities
|
10,868,808 | 14,330,141 | ||||||
|
Deferred revenue and fair value below contract value of time charters acquired
|
— | 3,237,694 | ||||||
|
Unearned charter hire revenue
|
3,948,943 | 3,755,166 | ||||||
|
Total current liabilities
|
24,007,669 | 33,988,759 | ||||||
|
Noncurrent liabilities:
|
||||||||
|
Long-term debt
|
1,129,478,741 | 1,129,478,741 | ||||||
|
Payment-in-kind loans
|
22,561,496 | 15,387,468 | ||||||
|
Deferred revenue and fair value below contract value of time charters acquired
|
— | 13,850,772 | ||||||
|
Fair value of derivative instruments
|
1,420,611 | 2,243,833 | ||||||
|
Total noncurrent liabilities
|
1,153,460,848 | 1,160,960,814 | ||||||
|
Total liabilities
|
1,177,468,517 | 1,194,949,573 | ||||||
|
Commitment and contingencies
|
||||||||
|
Stockholders' equity:
|
||||||||
|
Preferred stock, $.01 par value, 25,000,000 shares authorized, none issued
|
— | — | ||||||
|
Common stock, $.01 par value, 100,000,000 shares authorized, 16,638,092 and 16,638,092 shares issued and outstanding, respectively
|
166,378 | 166,378 | ||||||
|
Additional paid-in capital
|
764,268,421 | 762,313,030 | ||||||
|
Retained earnings (net of historical dividends declared of $262,118,388)
|
(163,901,119 | ) | (165,275,389 | ) | ||||
|
Accumulated other comprehensive loss
|
(1,420,611 | ) | (3,009,442 | ) | ||||
|
Total stockholders' equity
|
599,113,069 | 594,194,577 | ||||||
|
Total liabilities and stockholders' equity
|
$ | 1,776,581,586 | $ | 1,789,144,150 | ||||
5
CONSOLIDATED STATEMENTS OF CASH FLOWS
(UNAUDITED)
|
Three Months Ended
|
||||||||
|
March 31, 2013
|
March 31, 2012
|
|||||||
|
Cash flows from operating activities:
|
||||||||
|
Net income (loss)
|
$ | 1,374,270 | $ | (17,433,529 | ) | |||
|
Adjustments to reconcile net income (loss) to net cash provided by operating activities:
|
||||||||
|
Items included in net income (loss) not affecting cash flows:
|
||||||||
|
Depreciation
|
18,515,090 | 18,728,907 | ||||||
|
Amortization of deferred drydocking costs
|
421,487 | 704,450 | ||||||
|
Amortization of deferred financing costs
|
2,075,338 | 1,135,491 | ||||||
|
Amortization of fair value below contract value of time charter acquired
|
(10,280,559 | ) | (1,228,764 | ) | ||||
|
Payment-in-kind interest on debt
|
7,174,028 | — | ||||||
|
Unrealized gain from forward freight agreements, net
|
— | (142,560 | ) | |||||
|
Investment and other current asset
|
(4,925,953 | ) | — | |||||
|
Realized loss from investment
|
2,952,927 | — | ||||||
|
Gain on time charter agreement termination
|
(3,331,692 | ) | — | |||||
|
Allowance for accounts receivable
|
— | 3,438,145 | ||||||
|
Non-cash compensation expense
|
1,955,391 | 2,082,025 | ||||||
|
Drydocking expenditures
|
(681,628 | ) | (527,465 | ) | ||||
|
Changes in operating assets and liabilities:
|
||||||||
|
Accounts receivable
|
(1,451,069 | ) | (2,444,647 | ) | ||||
|
Other assets
|
(724,321 | ) | 436,455 | |||||
|
Prepaid expenses
|
(710,477 | ) | 565,346 | |||||
|
Inventories
|
(636,185 | ) | (533,862 | ) | ||||
|
Accounts payable
|
(2,092,635 | ) | (138,469 | ) | ||||
|
Accrued interest
|
(1,383,205 | ) | (580,140 | ) | ||||
|
Accrued expenses
|
(3,429,333 | ) | 902,638 | |||||
|
Deferred revenue
|
(3,766,412 | ) | (124,548 | ) | ||||
|
Unearned revenue
|
193,777 | (2,186,060 | ) | |||||
|
Net cash provided by operating activities
|
1,248,839 | 2,653,413 | ||||||
|
Cash flows from investing activities:
|
||||||||
|
Vessels and vessel improvements and advances for vessel construction
|
(49,994 | ) | (54,659 | ) | ||||
|
Purchase of other fixed assets
|
— | (1,303 | ) | |||||
|
Changes in restricted cash
|
— | 394,362 | ||||||
|
Net cash (used in) provided by investing activities
|
(49,994 | ) | 338,400 | |||||
|
Cash flows from financing activities:
|
||||||||
|
Deferred financing costs
|
(48,000 | ) | — | |||||
|
Net cash used in financing activities
|
(48,000 | ) | — | |||||
|
Net increase in cash
|
1,150,845 | 2,991,813 | ||||||
|
Cash at beginning of period
|
18,119,968 | 25,075,203 | ||||||
|
Cash at end of period
|
$ | 19,270,813 | $ | 28,067,016 | ||||
6
We have employed all of our vessels in our operating fleet on time and voyage charters. The following table represents certain information about our revenue earning charters with respect to our operating fleet as of March 31, 2013:
|
Vessel
|
Year Built
|
Dwt
|
Charter Expiration (1)
|
Daily Charter Hire Rate
|
|||||
|
Avocet
|
|
2010
|
53,462
|
|
Apr 2013
|
Voyage(2)
|
|||
|
Bittern
|
|
2009
|
57,809
|
May 2013
|
$
|
8,150
|
|||
|
Canary
|
|
2009
|
57,809
|
|
Apr 2013
|
$
|
7,100 (2)
|
||
|
Cardinal
|
|
2004
|
55,362
|
|
May 2013
|
$
|
8,000
|
||
|
Condor
|
|
2001
|
50,296
|
|
Apr 2013
|
$
|
4,700(2)
|
||
|
Crane
|
|
2010
|
57,809
|
|
Apr 2013
|
$
|
7,500(2)
|
||
|
Crested Eagle
|
|
2009
|
55,989
|
|
May 2013
|
$
|
11,000
|
||
|
Crowned Eagle
|
|
2008
|
55,940
|
|
-
|
Spot
|
|||
|
Egret Bulker
|
|
2010
|
57,809
|
|
July 2013
|
$
|
10,250
|
||
|
Falcon
|
|
2001
|
50,296
|
|
May 2013
|
$
|
7,200
|
||
|
Gannet Bulker
|
2010
|
57,809
|
Apr 2013
|
$
|
10,000(2)
|
||||
|
Golden Eagle
|
|
2010
|
55,989
|
|
May 2013
|
$
|
12,400
|
||
|
Goldeneye
|
|
2002
|
52,421
|
|
May 2013
|
|
Index(3)
|
||
|
Grebe Bulker
|
|
2010
|
57,809
|
|
Apr 2013
|
$
|
15,000(2)
|
||
|
Harrier
|
|
2001
|
50,296
|
|
May 2013
|
$
|
10,000
|
||
|
Hawk I
|
|
2001
|
50,296
|
|
Apr 2013
|
Voyage(2)
|
|||
|
Ibis Bulker
|
|
2010
|
57,775
|
|
Jun 2013
|
$
|
8,900
|
||
|
Imperial Eagle
|
|
2010
|
55,989
|
|
Apr 2013
|
$
|
11,150(2)
|
||
|
Jaeger
|
|
2004
|
52,248
|
|
Apr 2013
|
$
|
13,000(2)
|
||
|
Jay
|
|
2010
|
57,802
|
|
Apr 2013
|
|
Voyage(2)
|
||
|
Kestrel I
|
|
2004
|
50,326
|
|
Apr 2013
|
$
|
9,500(2)
|
||
|
Kingfisher
|
|
2010
|
57,776
|
|
Apr 2013
|
Voyage(2)
|
|||
|
Kite
|
|
1997
|
47,195
|
|
Apr 2013
|
Voyage(2)
|
|||
|
Kittiwake
|
|
2002
|
53,146
|
|
Aug 2013
|
$
|
9,500
|
||
|
Martin
|
|
2010
|
57,809
|
|
Apr 2013
|
Voyage(2)
|
|||
|
Merlin
|
|
2001
|
50,296
|
|
Apr 2013
|
$
|
10,000(2)
|
||
|
Nighthawk
|
|
2011
|
57,809
|
|
May 2013
|
$
|
8,350
|
||
|
Oriole
|
|
2011
|
57,809
|
|
Apr 2013
|
$
|
7,000(2)
|
||
|
Osprey I
|
|
2002
|
50,206
|
|
Apr 2013
|
$
|
8,000(2)
|
||
|
Owl
|
|
2011
|
57,809
|
|
Apr 2013
|
$
|
12,500(2)
|
||
|
Peregrine
|
|
2001
|
50,913
|
|
Jun 2013
|
$
|
8,250
|
||
|
Petrel Bulker
|
|
2011
|
57,809
|
May 2014 to Sep 2014
|
|
$17,650(4) (with 50%
profit share over $20,000)
|
|||
|
Puffin Bulker
|
|
2011
|
57,809
|
May 2014 to Sep 2014
|
|
$17,650(4) (with 50%
profit share over $20,000)
|
|||
|
Redwing
|
|
2007
|
53,411
|
Apr 2013
|
$
|
9,800(2)
|
|||
|
Roadrunner Bulker
|
|
2011
|
57,809
|
Aug 2014 to Dec 2014
|
|
$17,650(4) (with 50%
profit share over $20,000)
|
|||
|
Sandpiper Bulker
|
|
2011
|
57,809
|
Aug 2014 to Dec 2014
|
|
$17,650(4) (with 50%
profit share over $20,000)
|
|||
|
Shrike
|
|
2003
|
53,343
|
Apr 2013
|
Voyage(2)
|
||||
|
Skua
|
|
2003
|
53,350
|
Apr 2013
|
$
|
4,500(2)
|
|||
|
Sparrow
|
|
2000
|
48,225
|
Jun 2013
|
$
|
8,400
|
|||
|
Stellar Eagle
|
|
2009
|
55,989
|
Nov 2013
|
Index(3)
|
||||
|
Tern
|
|
2003
|
50,200
|
Apr 2013
|
$
|
12,000(2)
|
|||
|
Thrasher
|
|
2010
|
53,360
|
May 2013
|
$
|
12,500
|
|||
|
Thrush
|
|
2011
|
53,297
|
Apr 2013
|
$
|
13,000(2)
|
|||
|
Woodstar
|
|
2008
|
53,390
|
-
|
Spot(2)
|
||||
|
Wren
|
|
2008
|
53,349
|
Apr 2013
|
$
|
10,500(2)
|
|
|
(1)
|
The date range provided represents the earliest and latest date on which the charterer may redeliver the vessel to the Company upon the termination of the charter. The time charter hire rates presented are gross daily charter rates before brokerage commissions, ranging from 0.625% to 5.00%, to third party ship brokers.
|
|
|
(2)
|
Upon conclusion of the previous charter the vessel will commence a short term charter for up to six months.
|
|
|
(3)
|
Index, an average of the trailing Baltic Supramax Index.
|
|
|
(4)
|
The charterer has an option to extend the charter by two periods of 11 to 13 months each.
|
7
Glossary of Terms:
Ownership days: The Company defines ownership days as the aggregate number of days in a period during which each vessel in its fleet has been owned. Ownership days are an indicator of the size of the fleet over a period and affect both the amount of revenues and the amount of expenses that is recorded during a period.
Chartered-in under operating lease days: The Company defines chartered-in under operating lease days as the aggregate number of days in a period during which the Company chartered-in vessels.
Available days: The Company defines available days as the number of ownership days less the aggregate number of days that its vessels are off-hire due to vessel familiarization upon acquisition, scheduled repairs or repairs under guarantee, vessel upgrades or special surveys and the aggregate amount of time that we spend positioning our vessels. The shipping industry uses available days to measure the number of days in a period during which vessels should be capable of generating revenues.
Operating days: The Company defines operating days as the number of its available days in a period less the aggregate number of days that the vessels are off-hire due to any reason, including unforeseen circumstances. The shipping industry uses operating days to measure the aggregate number of days in a period during which vessels actually generate revenues.
Fleet utilization: The Company calculates fleet utilization by dividing the number of our operating days during a period by the number of our available days during the period. The shipping industry uses fleet utilization to measure a company's efficiency in finding suitable employment for its vessels and minimizing the amount of days that its vessels are off-hire for reasons other than scheduled repairs or repairs under guarantee, vessel upgrades, special surveys or vessel positioning. Our fleet continues to perform at very high utilization rates.
Conference CallInformation
Members of Eagle Bulk's senior management team will host a teleconference and webcast at 8:30 a.m. ET on Thursday, May 16th to discuss the results.
To participate in the teleconference, investors and analysts are invited to call 866-510-0707 in the U.S., or 617-597-5376 outside of the U.S., and reference participant code 49839481. A simultaneous webcast of the call, including a slide presentation for interested investors and others, may be accessed by visiting http://www.eagleships.com.
A replay will be available following the call until 11:59 PM ET on May 23, 2013. To access the replay, call 888-286-8010 in the U.S., or 617-801-6888 outside of the U.S., and reference passcode 43657265.
About Eagle Bulk Shipping Inc.
Eagle Bulk Shipping Inc. is a Marshall Islands corporation headquartered in New York. The Company is a leading global owner of Supramax dry bulk vessels that range in size from 50,000 to 60,000 deadweight tons and transport a broad range of major and minor bulk cargoes, including iron ore, coal, grain, cement and fertilizer, along worldwide shipping routes.
8
Forward-Looking Statements
Matters discussed in this release may constitute forward-looking statements. Forward-looking statements reflect our current views with respect to future events and financial performance and may include statements concerning plans, objectives, goals, strategies, future events or performance, and underlying assumptions and other statements, which are other than statements of historical facts.
The forward-looking statements in this release are based upon various assumptions, many of which are based, in turn, upon further assumptions, including without limitation, management's examination of historical operating trends, data contained in our records and other data available from third parties. Although Eagle Bulk Shipping Inc. believes that these assumptions were reasonable when made, because these assumptions are inherently subject to significant uncertainties and contingencies which are difficult or impossible to predict and are beyond our control, Eagle Bulk Shipping Inc. cannot assure you that it will achieve or accomplish these expectations, beliefs or projections.
Important factors that, in our view, could cause actual results to differ materially from those discussed in the forward-looking statements include the strength of world economies and currencies, general market conditions, including changes in charter hire rates and vessel values, changes in demand that may affect attitudes of time charterers to scheduled and unscheduled drydocking, changes in our vessel operating expenses, including dry-docking and insurance costs, or actions taken by regulatory authorities, potential liability from future litigation, domestic and international political conditions, potential disruption of shipping routes due to accidents and political events or acts by terrorists.
Risks and uncertainties are further described in reports filed by Eagle Bulk Shipping Inc. with the US Securities and Exchange Commission.
Visit our website at www.eagleships.com
Contact:
Company Contact:
Adir Katzav
Chief Financial Officer
Eagle Bulk Shipping Inc.
Tel. +1 212-785-2500
Investor Relations / Media:
Jonathan Morgan
Perry Street Communications, New York
Tel. +1 212-741-0014
--------------------------------------------------------------------------------
Source: Eagle Bulk Shipping Inc.
9
Exhibit 99.2

EAGLE BULK SHIPPING INC. 1Q 2013 Results Presentation 16 May 2013
EAGLE BULK SHIPPING INC. * Forward Looking Statements This presentation contains certain statements that may be deemed to be “forward-looking statements” within the meaning of the Securities Acts. Forward-looking statements reflect management’s current views with respect to future events and financial performance and may include statements concerning plans, objectives, goals, strategies, future events or performance, and underlying assumptions and other statements, which are other than statements of historical facts. The forward-looking statements in this presentation are based upon various assumptions, many of which are based, in turn, upon further assumptions, including without limitation, management's examination of historical operating trends, data contained in our records and other data available from third parties. Although Eagle Bulk Shipping Inc. believes that these assumptions were reasonable when made, because these assumptions are inherently subject to significant uncertainties and contingencies which are difficult or impossible to predict and are beyond our control, Eagle Bulk Shipping Inc. cannot assure you that it will achieve or accomplish these expectations, beliefs or projections. Important factors that, in our view, could cause actual results to differ materially from those discussed in the forward-looking statements include the strength of world economies and currencies, general market conditions, including changes in charter hire rates and vessel values, changes in demand that may affect attitudes of time charterers to scheduled and unscheduled drydocking, changes in our vessel operating expenses, including dry-docking and insurance costs, or actions taken by regulatory authorities, ability of our counterparties to perform their obligations under sales agreements, charter contracts, and other agreements on a timely basis, potential liability from future litigation, domestic and international political conditions, potential disruption of shipping routes due to accidents and political events or acts by terrorists. Risks and uncertainties are further described in reports filed by Eagle Bulk Shipping Inc. with the US Securities and Exchange Commission.
EAGLE BULK SHIPPING INC. * Results and Highlights Commercial Industry Financials Q&A Appendix Agenda
EAGLE BULK SHIPPING INC. EAGLE BULK SHIPPING INC. Results and Highlights
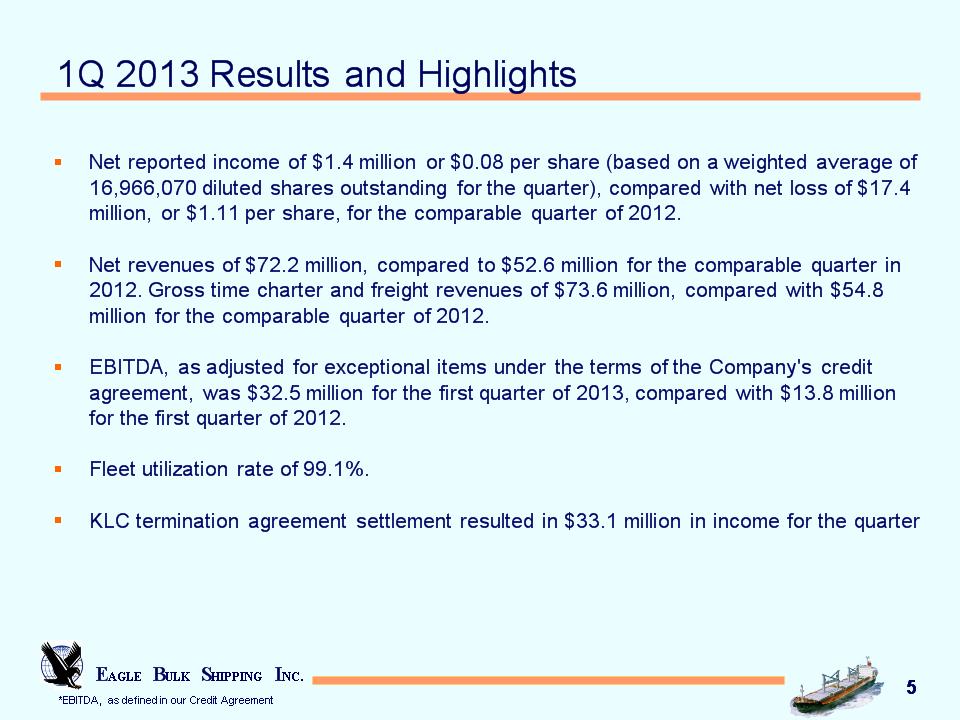
EAGLE BULK SHIPPING INC. 1Q 2013 Results and Highlights * * Net reported income of $1.4 million or $0.08 per share (based on a weighted average of 16,966,070 diluted shares outstanding for the quarter), compared with net loss of $17.4 million, or $1.11 per share, for the comparable quarter of 2012. Net revenues of $72.2 million, compared to $52.6 million for the comparable quarter in 2012. Gross time charter and freight revenues of $73.6 million, compared with $54.8 million for the comparable quarter of 2012. EBITDA, as adjusted for exceptional items under the terms of the Company's credit agreement, was $32.5 million for the first quarter of 2013, compared with $13.8 million for the first quarter of 2012. Fleet utilization rate of 99.1%. KLC termination agreement settlement resulted in $33.1 million in income for the quarter *EBITDA, as defined in our Credit Agreement
EAGLE BULK SHIPPING INC. EAGLE BULK SHIPPING INC. Commercial
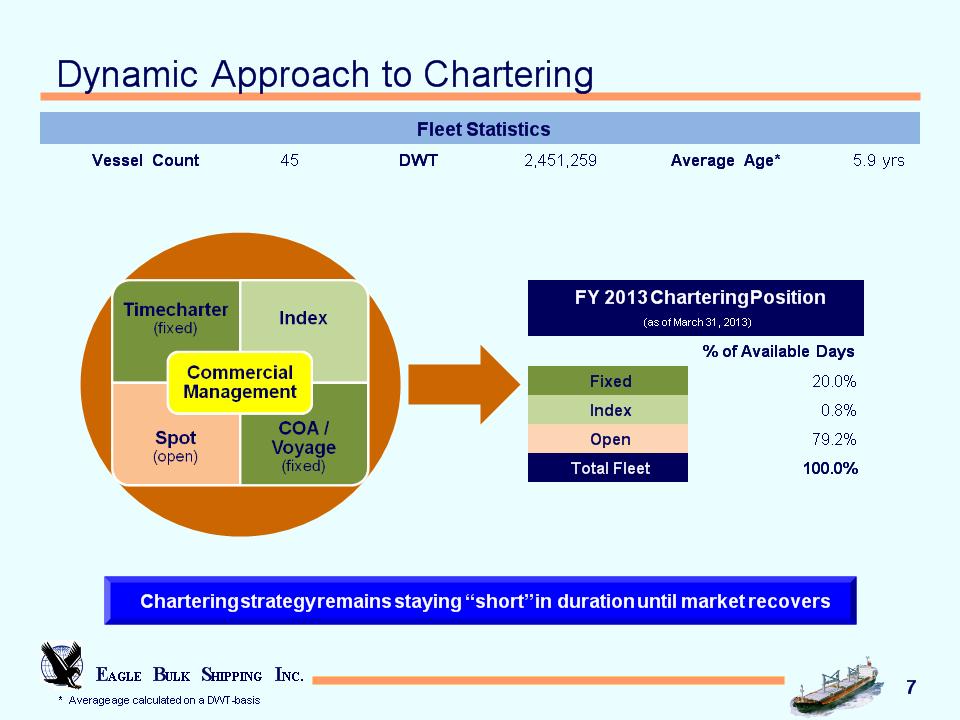
EAGLE BULK SHIPPING INC. * Dynamic Approach to Chartering Chartering strategy remains staying “short” in duration until market recovers Fleet Statistics Fleet Statistics Fleet Statistics Fleet Statistics Fleet Statistics Fleet Statistics Vessel Count 45 DWT 2,451,259 Average Age* 5.9 yrs * Average age calculated on a DWT-basis FY 2013 Chartering Position (as of March 31, 2013) FY 2013 Chartering Position (as of March 31, 2013) % of Available Days Fixed 20.0% Index 0.8% Open 79.2% Total Fleet 100.0%
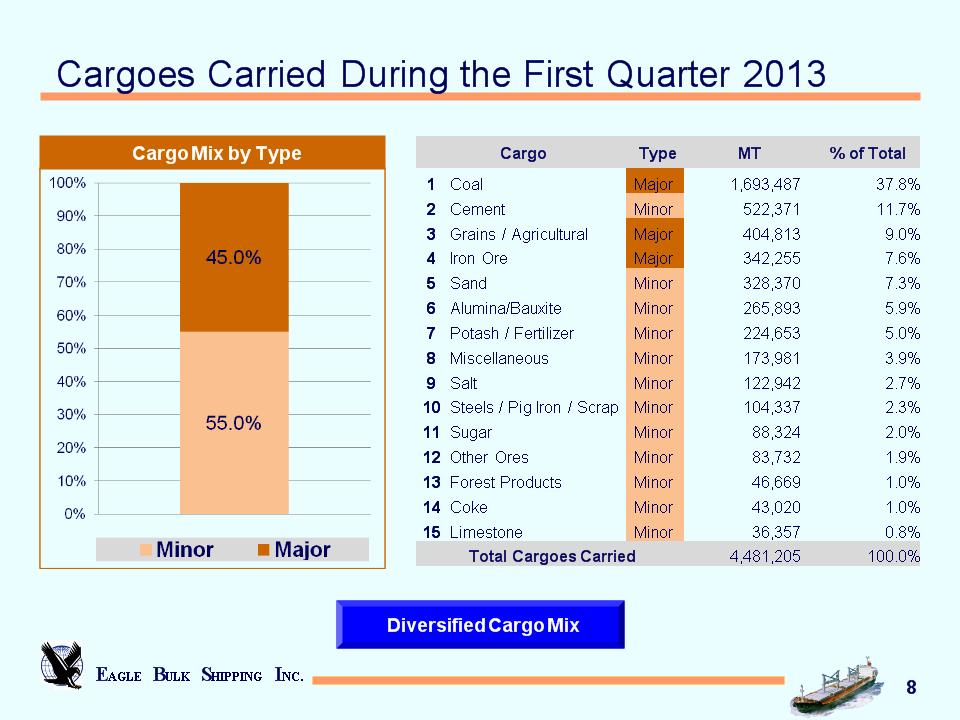
EAGLE BULK SHIPPING INC. * Cargoes Carried During the First Quarter 2013 Diversified Cargo Mix Cargo Cargo Type MT % of Total 1 Coal Major 1,693,487 37.8% 2 Cement Minor 522,371 11.7% 3 Grains / Agricultural Major 404,813 9.0% 4 Iron Ore Major 342,255 7.6% 5 Sand Minor 328,370 7.3% 6 Alumina/Bauxite Minor 265,893 5.9% 7 Potash / Fertilizer Minor 224,653 5.0% 8 Miscellaneous Minor 173,981 3.9% 9 Salt Minor 122,942 2.7% 10 Steels / Pig Iron / Scrap Minor 104,337 2.3% 11 Sugar Minor 88,324 2.0% 12 Other Ores Minor 83,732 1.9% 13 Forest Products Minor 46,669 1.0% 14 Coke Minor 43,020 1.0% 15 Limestone Minor 36,357 0.8% Total Cargoes Carried Total Cargoes Carried Total Cargoes Carried 4,481,205 100.0% Cargo Mix by Type

EAGLE BULK SHIPPING INC. EAGLE BULK SHIPPING INC. Industry
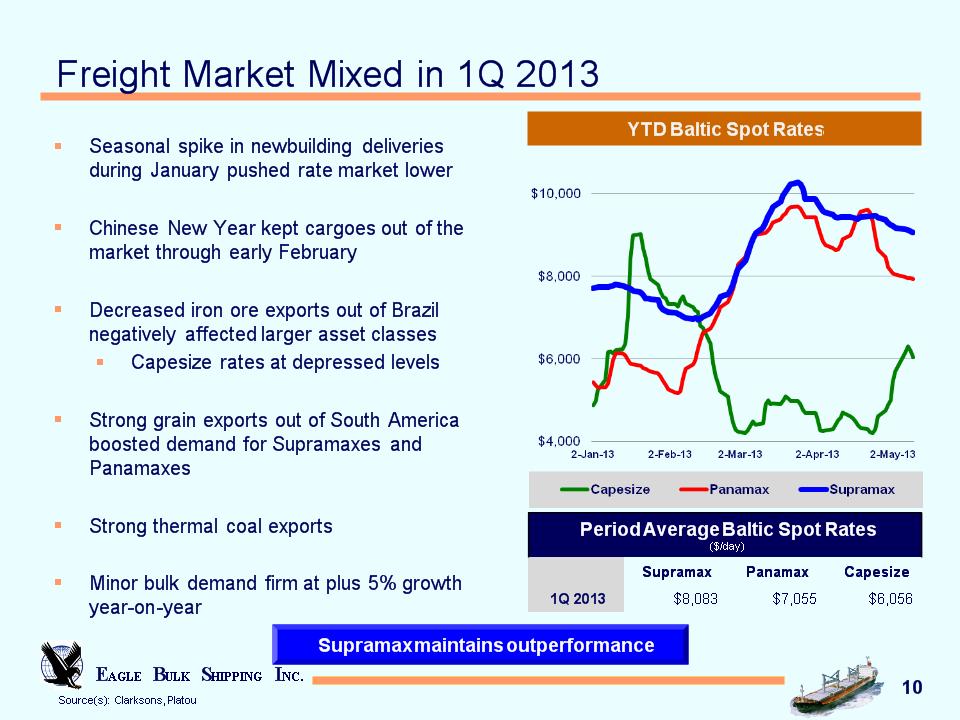
EAGLE BULK SHIPPING INC. * Source(s): Clarksons, Platou Freight Market Mixed in 1Q 2013 Seasonal spike in newbuilding deliveries during January pushed rate market lower Chinese New Year kept cargoes out of the market through early February Decreased iron ore exports out of Brazil negatively affected larger asset classes Capesize rates at depressed levels Strong grain exports out of South America boosted demand for Supramaxes and Panamaxes Strong thermal coal exports Minor bulk demand firm at plus 5% growth year-on-year Period Average Baltic Spot Rates ($/day) Period Average Baltic Spot Rates ($/day) Period Average Baltic Spot Rates ($/day) Period Average Baltic Spot Rates ($/day) Supramax Panamax Capesize 1Q 2013 $8,083 $7,055 $6,056 YTD Baltic Spot Rates( Supramax maintains outperformance
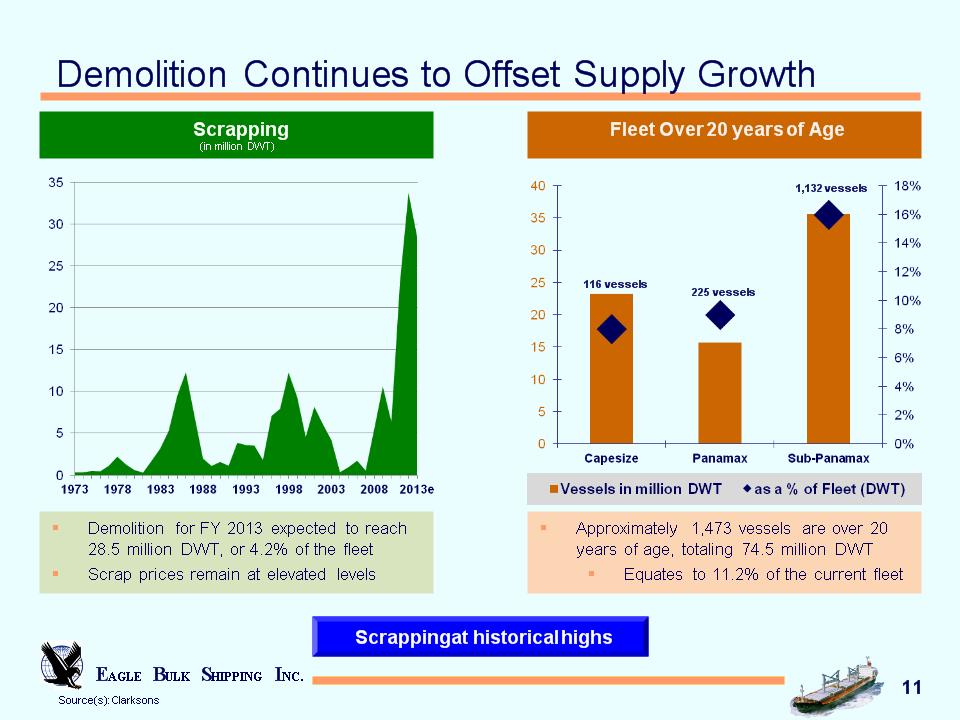
EAGLE BULK SHIPPING INC. * Source(s): Clarksons Scrapping at historical highs Demolition Continues to Offset Supply Growth Scrapping (in million DWT) Fleet Over 20 years of Age ( 116 vessels 225 vessels 1,132 vessels Demolition for FY 2013 expected to reach 28.5 million DWT, or 4.2% of the fleet Scrap prices remain at elevated levels Approximately 1,473 vessels are over 20 years of age, totaling 74.5 million DWT Equates to 11.2% of the current fleet
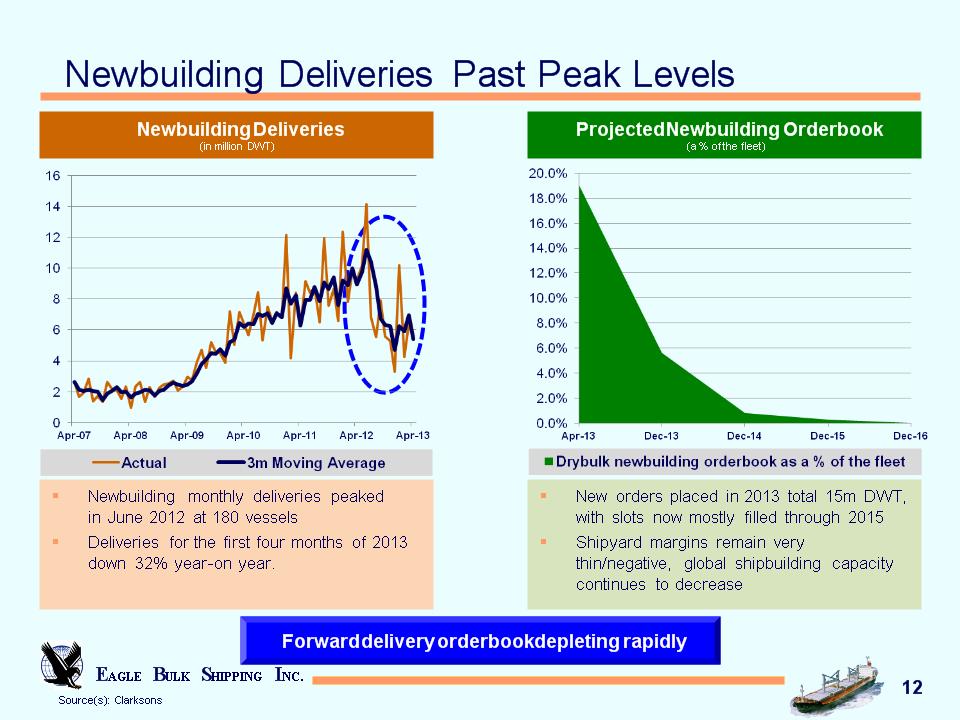
EAGLE BULK SHIPPING INC. * Source(s): Clarksons Newbuilding Deliveries Past Peak Levels Forward delivery orderbook depleting rapidly Projected Newbuilding Orderbook (a % of the fleet) Newbuilding Deliveries (in million DWT) New orders placed in 2013 total 15m DWT, with slots now mostly filled through 2015 Shipyard margins remain very thin/negative, global shipbuilding capacity continues to decrease Newbuilding monthly deliveries peaked in June 2012 at 180 vessels Deliveries for the first four months of 2013 down 32% year-on year.
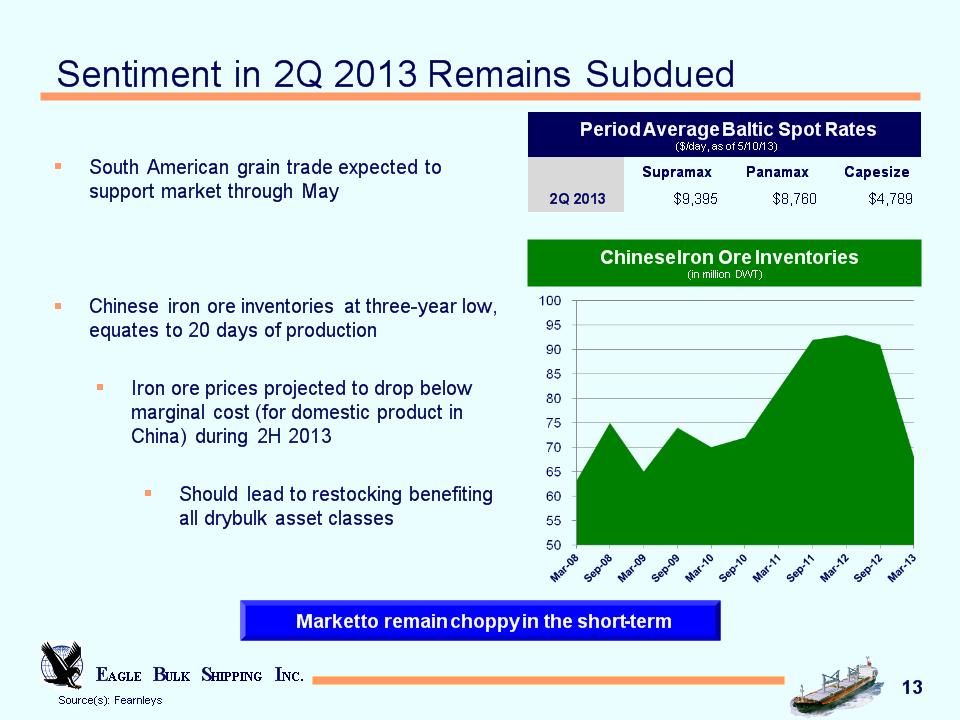
EAGLE BULK SHIPPING INC. * Source(s): Fearnleys South American grain trade expected to support market through May Chinese iron ore inventories at three-year low, equates to 20 days of production Iron ore prices projected to drop below marginal cost (for domestic product in China) during 2H 2013 Should lead to restocking benefiting all drybulk asset classes Sentiment in 2Q 2013 Remains Subdued Chinese Iron Ore Inventories (in million DWT) Period Average Baltic Spot Rates ($/day, as of 5/10/13) Period Average Baltic Spot Rates ($/day, as of 5/10/13) Period Average Baltic Spot Rates ($/day, as of 5/10/13) Period Average Baltic Spot Rates ($/day, as of 5/10/13) Supramax Panamax Capesize 2Q 2013 $9,395 $8,760 $4,789 Market to remain choppy in the short-term
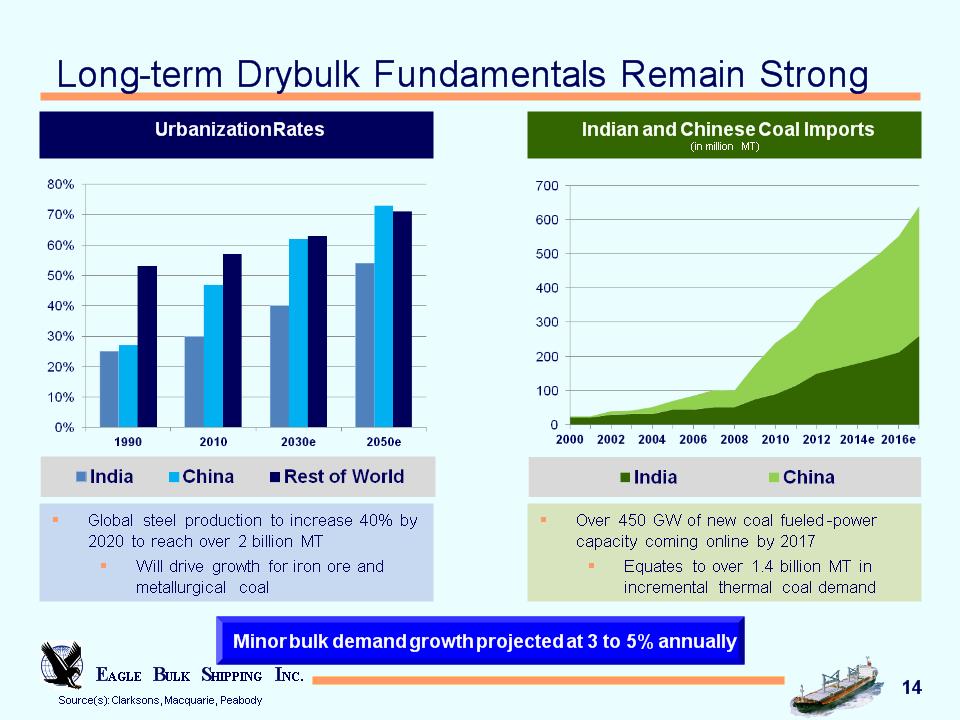
EAGLE BULK SHIPPING INC. * Source(s): Clarksons, Macquarie, Peabody Long-term Drybulk Fundamentals Remain Strong Minor bulk demand growth projected at 3 to 5% annually Indian and Chinese Coal Imports (in million MT) Urbanization Rates (in million MT) Global steel production to increase 40% by 2020 to reach over 2 billion MT Will drive growth for iron ore and metallurgical coal Over 450 GW of new coal fueled-power capacity coming online by 2017 Equates to over 1.4 billion MT in incremental thermal coal demand

EAGLE BULK SHIPPING INC. EAGLE BULK SHIPPING INC. Financials
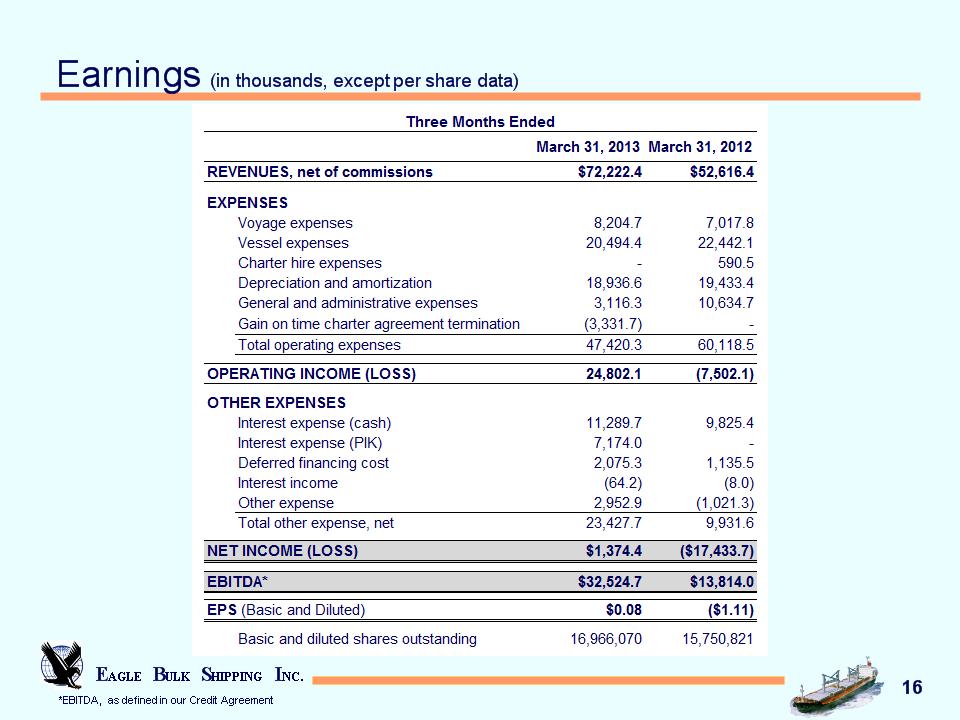
EAGLE BULK SHIPPING INC. * Earnings (in thousands, except per share data) *EBITDA, as defined in our Credit Agreement
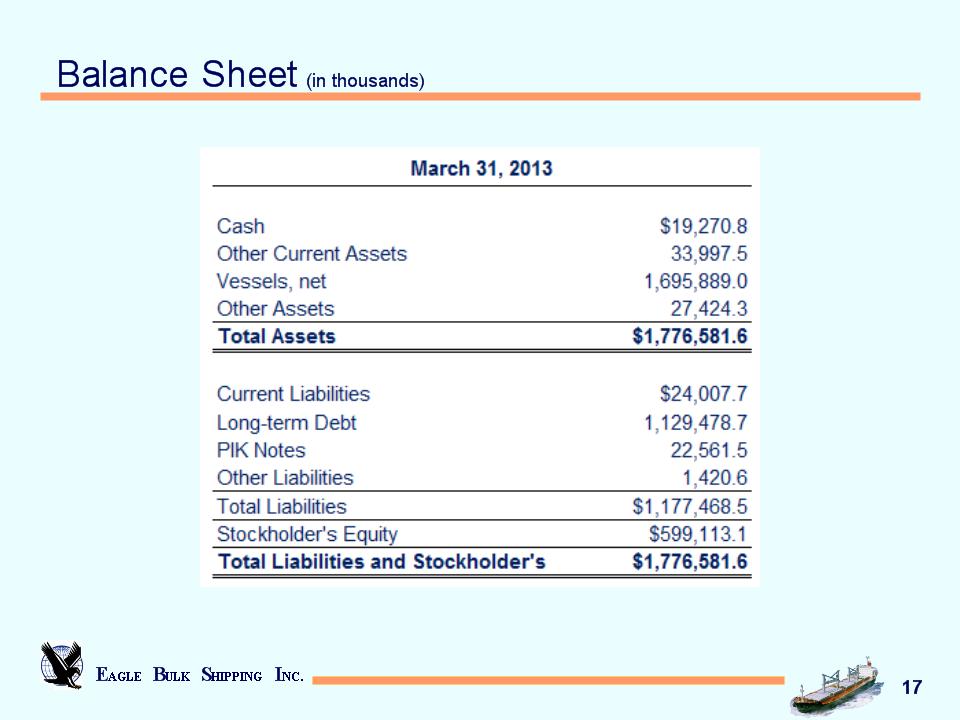
EAGLE BULK SHIPPING INC. * Balance Sheet (in thousands)
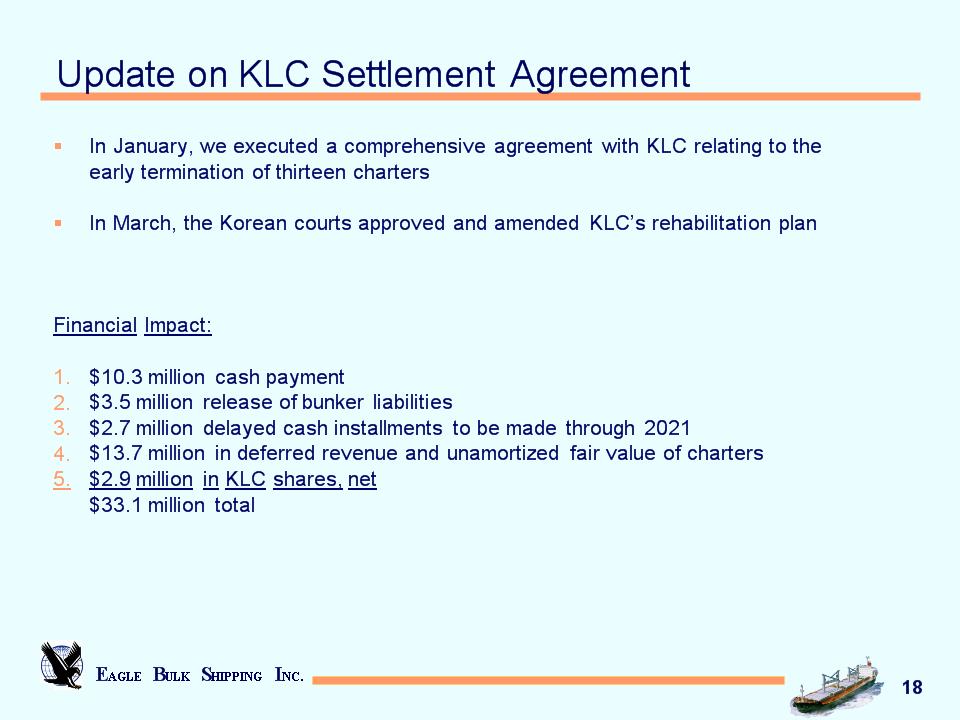
EAGLE BULK SHIPPING INC. * Update on KLC Settlement Agreement In January, we executed a comprehensive agreement with KLC relating to the early termination of thirteen charters In March, the Korean courts approved and amended KLC’s rehabilitation plan Financial Impact: $10.3 million cash payment $3.5 million release of bunker liabilities $2.7 million delayed cash installments to be made through 2021 $13.7 million in deferred revenue and unamortized fair value of charters $2.9 million in KLC shares, net $33.1 million total
EAGLE BULK SHIPPING INC. EAGLE BULK SHIPPING INC. Q&A
EAGLE BULK SHIPPING INC. EAGLE BULK SHIPPING INC. EAGLE BULK SHIPPING INC.
EAGLE BULK SHIPPING INC. EAGLE BULK SHIPPING INC. Appendix
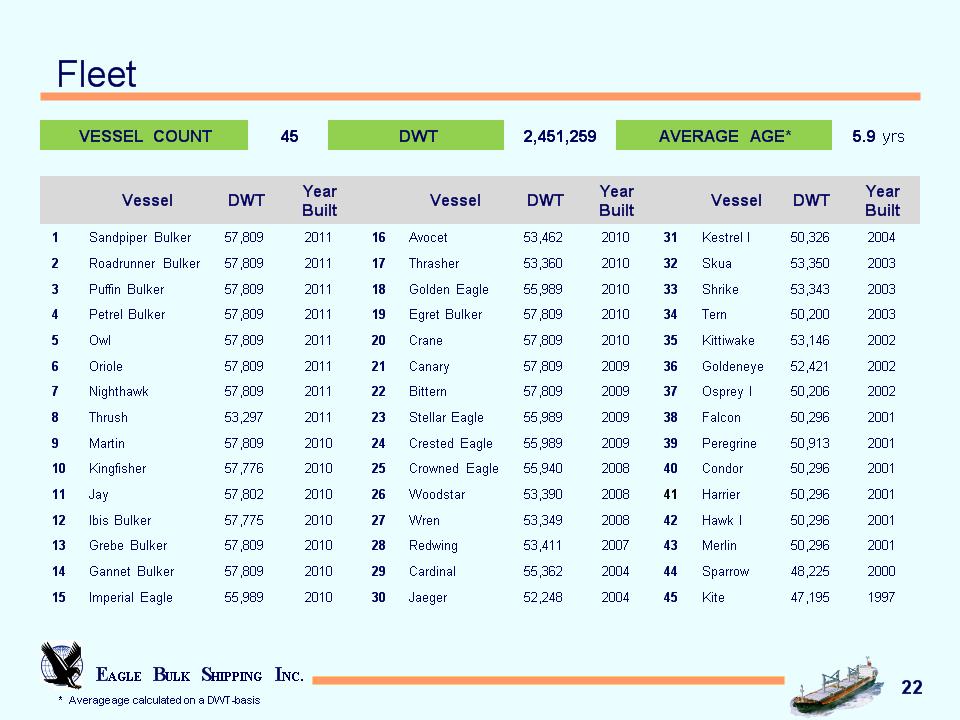
EAGLE BULK SHIPPING INC. * Fleet Vessel DWT Year Built Vessel DWT Year Built Vessel DWT Year Built 1 Sandpiper Bulker 57,809 2011 16 Avocet 53,462 2010 31 Kestrel I 50,326 2004 2 Roadrunner Bulker 57,809 2011 17 Thrasher 53,360 2010 32 Skua 53,350 2003 3 Puffin Bulker 57,809 2011 18 Golden Eagle 55,989 2010 33 Shrike 53,343 2003 4 Petrel Bulker 57,809 2011 19 Egret Bulker 57,809 2010 34 Tern 50,200 2003 5 Owl 57,809 2011 20 Crane 57,809 2010 35 Kittiwake 53,146 2002 6 Oriole 57,809 2011 21 Canary 57,809 2009 36 Goldeneye 52,421 2002 7 Nighthawk 57,809 2011 22 Bittern 57,809 2009 37 Osprey I 50,206 2002 8 Thrush 53,297 2011 23 Stellar Eagle 55,989 2009 38 Falcon 50,296 2001 9 Martin 57,809 2010 24 Crested Eagle 55,989 2009 39 Peregrine 50,913 2001 10 Kingfisher 57,776 2010 25 Crowned Eagle 55,940 2008 40 Condor 50,296 2001 11 Jay 57,802 2010 26 Woodstar 53,390 2008 41 Harrier 50,296 2001 12 Ibis Bulker 57,775 2010 27 Wren 53,349 2008 42 Hawk I 50,296 2001 13 Grebe Bulker 57,809 2010 28 Redwing 53,411 2007 43 Merlin 50,296 2001 14 Gannet Bulker 57,809 2010 29 Cardinal 55,362 2004 44 Sparrow 48,225 2000 15 Imperial Eagle 55,989 2010 30 Jaeger 52,248 2004 45 Kite 47,195 1997 * Average age calculated on a DWT-basis VESSEL COUNT 45 DWT 2,451,259 AVERAGE AGE* 5.9 yrs
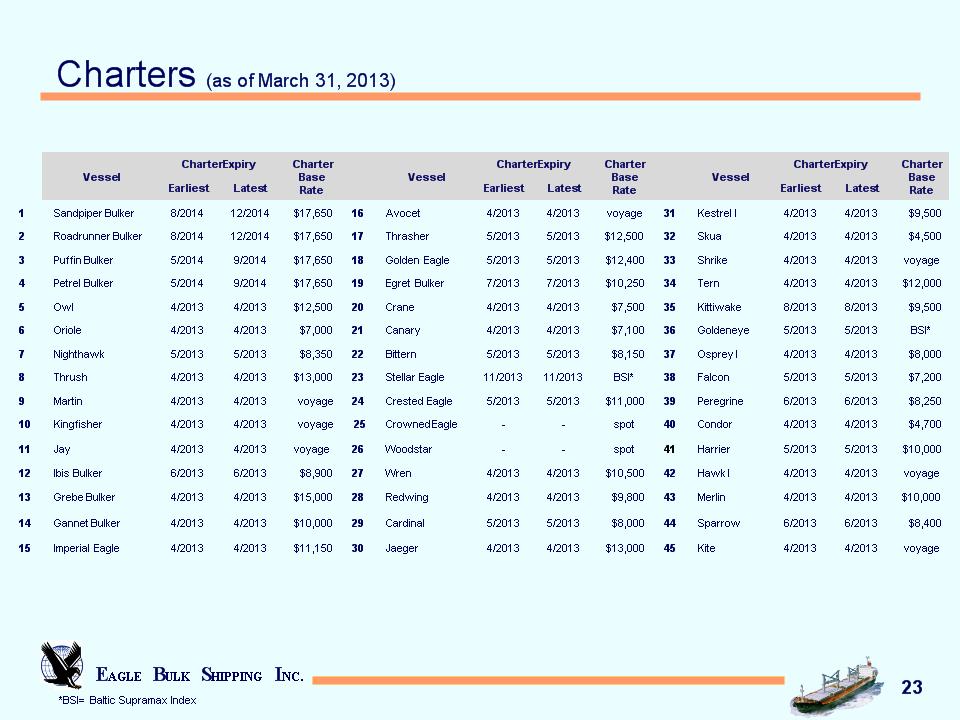
EAGLE BULK SHIPPING INC. * Charters (as of March 31, 2013) Vessel Charter Expiry Charter Expiry Charter Base Rate Vessel Charter Expiry Charter Expiry Charter Base Rate Vessel Charter Expiry Charter Expiry Charter Base Rate Vessel Earliest Latest Charter Base Rate Vessel Earliest Latest Charter Base Rate Vessel Earliest Latest Charter Base Rate 1 Sandpiper Bulker 8/2014 12/2014 $17,650 16 Avocet 4/2013 4/2013 voyage 31 Kestrel I 4/2013 4/2013 $9,500 2 Roadrunner Bulker 8/2014 12/2014 $17,650 17 Thrasher 5/2013 5/2013 $12,500 32 Skua 4/2013 4/2013 $4,500 3 Puffin Bulker 5/2014 9/2014 $17,650 18 Golden Eagle 5/2013 5/2013 $12,400 33 Shrike 4/2013 4/2013 voyage 4 Petrel Bulker 5/2014 9/2014 $17,650 19 Egret Bulker 7/2013 7/2013 $10,250 34 Tern 4/2013 4/2013 $12,000 5 Owl 4/2013 4/2013 $12,500 20 Crane 4/2013 4/2013 $7,500 35 Kittiwake 8/2013 8/2013 $9,500 6 Oriole 4/2013 4/2013 $7,000 21 Canary 4/2013 4/2013 $7,100 36 Goldeneye 5/2013 5/2013 BSI* 7 Nighthawk 5/2013 5/2013 $8,350 22 Bittern 5/2013 5/2013 $8,150 37 Osprey I 4/2013 4/2013 $8,000 8 Thrush 4/2013 4/2013 $13,000 23 Stellar Eagle 11/2013 11/2013 BSI* 38 Falcon 5/2013 5/2013 $7,200 9 Martin 4/2013 4/2013 voyage 24 Crested Eagle 5/2013 5/2013 $11,000 39 Peregrine 6/2013 6/2013 $8,250 10 Kingfisher 4/2013 4/2013 voyage 25 Crowned Eagle - - spot 40 Condor 4/2013 4/2013 $4,700 11 Jay 4/2013 4/2013 voyage 26 Woodstar - - spot 41 Harrier 5/2013 5/2013 $10,000 12 Ibis Bulker 6/2013 6/2013 $8,900 27 Wren 4/2013 4/2013 $10,500 42 Hawk I 4/2013 4/2013 voyage 13 Grebe Bulker 4/2013 4/2013 $15,000 28 Redwing 4/2013 4/2013 $9,800 43 Merlin 4/2013 4/2013 $10,000 14 Gannet Bulker 4/2013 4/2013 $10,000 29 Cardinal 5/2013 5/2013 $8,000 44 Sparrow 6/2013 6/2013 $8,400 15 Imperial Eagle 4/2013 4/2013 $11,150 30 Jaeger 4/2013 4/2013 $13,000 45 Kite 4/2013 4/2013 voyage *BSI= Baltic Supramax Index