Attached files
| file | filename |
|---|---|
| 8-K - FORM 8-K - CENTURY ALUMINUM CO | d541267d8k.htm |
| EX-99.1 - EX-99.1 - CENTURY ALUMINUM CO | d541267dex991.htm |
| EX-99.2 - EX-99.2 - CENTURY ALUMINUM CO | d541267dex992.htm |
| EX-99.3 - EX-99.3 - CENTURY ALUMINUM CO | d541267dex993.htm |
Exhibit 99.4
Legal Disclaimer
This presentation and comments made by Century Aluminum management contain “forward-looking statements” within the meaning of the Private Securities Litigation Reform Act of 1995. Forward-looking statements are statements about future, not past, events and involve certain important risks and uncertainties, any of which could cause our actual results to differ materially from those expressed in our forward-looking statements, including, without limitation, declines in aluminum prices or increases in our operating costs; worsening of global financial and economic conditions; risks related to our raw material supply arrangements; our ability to successfully obtain long-term competitive power arrangements; our ability to successfully complete our Helguvik, Iceland smelter, the acquisition of the Sebree smelter, our new ABL revolver and the restart of our Ravenswood smelter and Vlissingen carbon anode facility; and our ability to successfully manage and/or improve performance at each of our operating smelters. Forward-looking statements in this presentation include, without limitation, statements regarding the Company’s future revenues, costs, cash flows, liquidity and production levels; future global and local operational, financial and economic conditions; future industry conditions, capacity and aluminum prices; our ability to successfully restart our Vlissingen carbon anode facility; our ability to complete our Helguvik, Iceland smelter, including securing a reliable power supply; our ability to complete the Sebree acquisition; our ability to restructure the Hawesville and Sebree power contracts; and statements regarding our new ABL revolver. More information about these risks, uncertainties and assumptions can be found in the risk factors and forward-looking statements cautionary language contained in our Annual Report on Form 10-K and in other filings made with the Securities and Exchange Commission incorporated by reference in the preliminary offering circular.
Information provided in this presentation and discussion is based on information available as of May 20, 2013. We believe the expectations reflected in these forward-looking statements are reasonable, based on information available to us on the date of this presentation. However, given the described uncertainties and risks, we cannot guarantee our future financial performance, results of operations or financial condition and you should not place undue reliance on these forward-looking statements. Century undertakes no duty to update or revise any forward-looking statements, whether as a result of new information, actual events, future events or otherwise.
In addition, throughout this presentation, we will use non-GAAP financial measures. Reconciliations to the most comparable GAAP financial measures can be found in the Appendix of today’s presentation.

1
Investment Highlights
| • | World-class Grundartangi smelter in Iceland – generates significant free cash flow in virtually all price environments |
| • | Successful restructuring of U.S. smelter system; results in meaningful cash generation at current aluminum prices |
| • | Announced acquisition of Sebree smelter provides significant upside |
| • | Restructuring of two power contracts, if implemented, would improve consolidated breakeven from approximately $1,800/T to under $1,700/T LME |
| • | Aluminum fundamentals supportive over medium/long term – regional premiums at historically high levels |
| • | Strong liquidity position and significant asset coverage |
| • | Historical track record of strong free cash flow generation |
| • | Experienced management team with proven ability to reduce cash costs |
| • | Supportive major shareholder in Glencore |
2
Hawesville Power Update
| • | Reached agreement (detailed 30-page term sheet) with current power provider (Big Rivers Electric Cooperative “BREC”) |
| • | BREC will procure power in wholesale market |
| • | Century can buy at daily market rate and/or on longer-term bilateral contracts |
| • | Cost will be market price (for energy, capacity, transmission) plus small charge for ancillary services |
| • | Current estimate of fully delivered cost based on forward screen post August – $35/MWH |
| • | Additional $2/MWH supplement until all approvals received and Coleman generating station can be shut (expected by year end) |
| • | Power savings translates to an increase in LTM 3/31/13 EBITDA of $59 million based on Hawesville’s annual power consumption of ~4.2 million MWH |
| • | Requires Century to make capital investment ($3MM) for capacitors to provide system voltage support |
| • | Conditions include full documentation, approval of various regulators (Kentucky PSC, MISO, etc), and consent of various third parties of power provider |
3
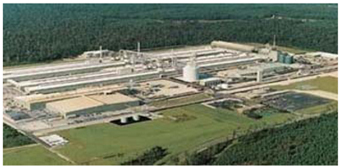
Sebree Acquisition
4
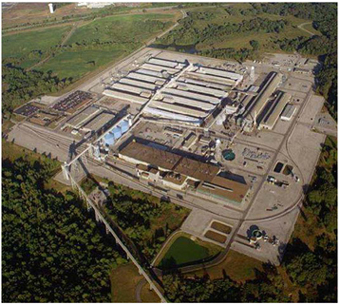
Successful Restructuring of U.S. Smelter Systems – Mt. Holly
Mt. Holly is free cash flow positive at recent LME pricing environment
| (1) | Represents Century’s 49.7% ownership. |
5
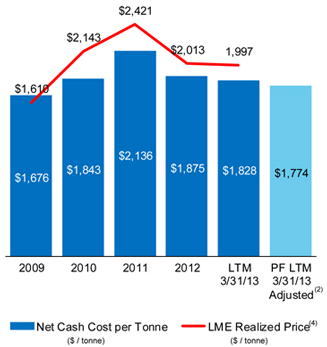
Summary Historical Financial Performance
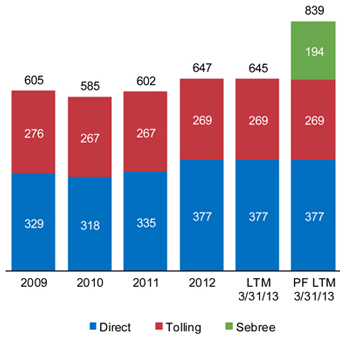
Note: Not pro forma for Sebree except for PF LTM 3/31/13. PF LTM 3/31/13 results reflect Sebree financial data for FYE 12/31/12 as Q1 2013 info is not yet available.
| (1) | LME realized price is based on one month lag in pricing contracts. |
6
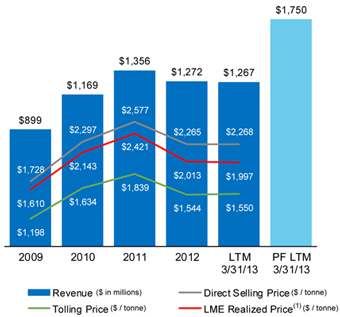
Summary Historical Financial Performance
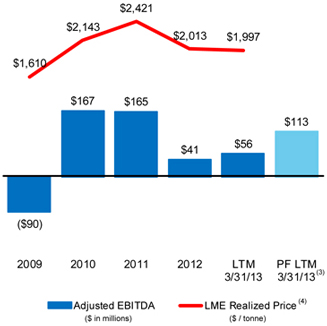
Note: Not pro forma for Sebree or market power except for PF LTM 3/31/13.
| (1) | See reconciliation on slide 35. |
| (2) | Includes 2012 Sebree operating cash cost per tonne and Hawesville power adjustment assuming entry into new power contract at current market price. |
| (3) | PF LTM 3/31/13 Adj. EBITDA based on Century LTM 3/31/13 Adj. EBITDA, Sebree 2012 PF Adj. EBITDA (Q1 2013 info is not available), and new Hawesville power contract adjustment. See reconciliation on slide 34. |
| (4) | LME realized price is based on one month lag in pricing contracts. |
7
Strong Free Cash Flow Generation Capacity
Historical EBITDA before Hedges less Capital Expenditures and Working Capital Changes
($ in millions)
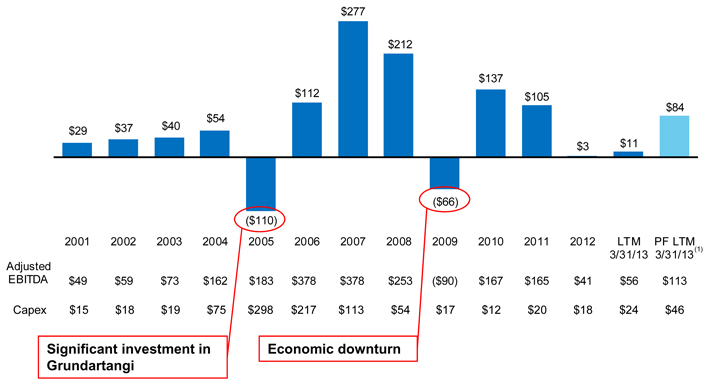
Note: Not pro forma for Sebree or market power except for PF LTM 3/31/13. Does not include Helguvik capital expenditures.
| (1) | PF LTM 3/31/13 Adj. EBITDA based on Century LTM 3/31/13 Adj. EBITDA, Sebree 2012 PF Adj. EBITDA (Q1 2013 info is not available), and new Hawesville power contract adjustment. See reconciliation on slide 34. |
8
Adjusted EBITDA Sensitivity Analysis
Pro forma LTM 3/31/13 EBITDA Sensitivity
(Includes 2012 Sebree)
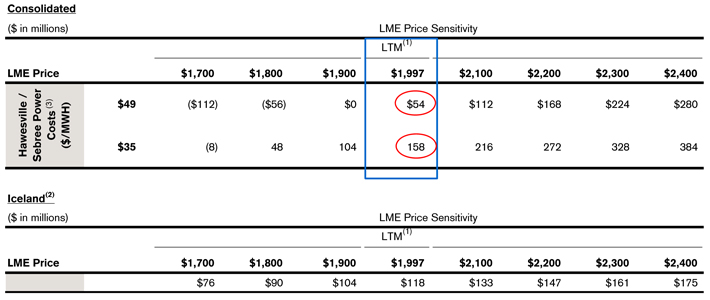
| • | Assumes US margins change by $75/T and Iceland margins change by $50/T for each $100 movement in LME |
| (1) | LTM realized LME is based on one month lag in pricing contracts. |
| (2) | Iceland EBITDA does not include $43 million for corporate SG&A and $16 million for other operating costs. |
| (3) | Hawesville based on 482MW or ~16.8MWh/T and power cost improvement of $14/MWh. |
Sebree based on 368MW or ~15.7MWh/T and power cost improvement of $14/MWh.
9


10
EBITDA and Free Cash Flow Reconciliation
| PF | ||||||||||||||||||||||||||||||||||||||||||||||||||||||||||||||||
| 3 months | LTM | LTM | ||||||||||||||||||||||||||||||||||||||||||||||||||||||||||||||
| ($ in millions) |
2001 | 2002 | 2003 | 2004 | 2005 | 2006 | 2007 | 2008 | 2009 | 2010 | 2011 | 2012A | 2012 | 2013 | 3/31/13 | 3/31/13 | ||||||||||||||||||||||||||||||||||||||||||||||||
| Operating income |
$ | 5 | $ | 2 | $ | 48 | $ | 90 | ($ | 184 | ) | ($ | 74 | ) | ($ | 209 | ) | ($ | 576 | ) | ($ | 97 | ) | $ | 103 | $ | 47 | ($ | 7 | ) | $ | 8 | $ | 0 | ($ | 15 | ) | ($ | 15 | ) | ||||||||||||||||||||||||
| (–) Unrealized gain on contractual receivable |
— | — | — | — | — | — | — | — | (82 | ) | — | — | — | — | — | — | — | |||||||||||||||||||||||||||||||||||||||||||||||
| (+) Realized benefit of contractual receivable |
— | — | — | — | — | — | — | — | 26 | 56 | — | — | — | — | — | — | ||||||||||||||||||||||||||||||||||||||||||||||||
| (+) Write-off of intangible asset |
— | — | — | — | — | — | — | — | 24 | — | — | — | — | — | — | — | ||||||||||||||||||||||||||||||||||||||||||||||||
| (+/–) Accrued plant curtailment costs (Ravenswood) |
— | — | — | — | — | — | — | — | 10 | (56 | ) | (14 | ) | 5 | 1 | 1 | 5 | 5 | ||||||||||||||||||||||||||||||||||||||||||||||
| (+) Hawesville restart and unabsorbed fixed costs |
— | — | — | — | — | — | — | — | — | — | 47 | — | — | — | — | — | ||||||||||||||||||||||||||||||||||||||||||||||||
| (+/–) Lower of cost or market adjustments |
— | — | — | — | — | — | — | — | (47 | ) | (0 | ) | 20 | (20 | ) | (17 | ) | 6 | 3 | 3 | ||||||||||||||||||||||||||||||||||||||||||||
| (+) Stock based compensation |
— | — | — | — | — | — | — | — | 3 | 2 | 3 | 1 | 0 | 0 | 1 | 1 | ||||||||||||||||||||||||||||||||||||||||||||||||
| (+) Net loss (gain) on forward contracts |
— | — | (26 | ) | 22 | 310 | 390 | 509 | 744 | — | — | — | — | — | — | — | — | |||||||||||||||||||||||||||||||||||||||||||||||
| (+) Gain on sale of property |
— | — | — | — | — | (7 | ) | — | — | — | — | — | — | — | — | — | — | |||||||||||||||||||||||||||||||||||||||||||||||
|
|
|
|
|
|
|
|
|
|
|
|
|
|
|
|
|
|
|
|
|
|
|
|
|
|
|
|
|
|
|
|
|
|||||||||||||||||||||||||||||||||
| Adjusted operating income |
$ | 5 | $ | 2 | $ | 22 | $ | 112 | $ | 126 | $ | 309 | $ | 300 | $ | 169 | ($ | 163 | ) | $ | 104 | $ | 103 | ($ | 21 | ) | ($ | 7 | ) | $ | 7 | ($ | 7 | ) | ($ | 7 | ) | |||||||||||||||||||||||||||
| Depreciation & amortization |
44 | 57 | 51 | 50 | 57 | 69 | 78 | 84 | 73 | 64 | 62 | 63 | 16 | 16 | 63 | 63 | ||||||||||||||||||||||||||||||||||||||||||||||||
|
|
|
|
|
|
|
|
|
|
|
|
|
|
|
|
|
|
|
|
|
|
|
|
|
|
|
|
|
|
|
|
|
|||||||||||||||||||||||||||||||||
| Adjusted EBITDA |
$ | 49 | $ | 59 | $ | 73 | $ | 162 | $ | 183 | $ | 378 | $ | 378 | $ | 253 | ($ | 90 | ) | $ | 167 | $ | 165 | $ | 41 | $ | 9 | $ | 23 | $ | 56 | $ | 56 | |||||||||||||||||||||||||||||||
| (+) Sebree 2012 adj. EBITDA |
(2 | ) | ||||||||||||||||||||||||||||||||||||||||||||||||||||||||||||||
|
|
|
|
|
|
|
|
|
|
|
|
|
|
|
|
|
|
|
|
|
|
|
|
|
|
|
|
|
|
|
|
|
|||||||||||||||||||||||||||||||||
| PF Adjusted EBITDA (for Sebree) |
$ | 54 | ||||||||||||||||||||||||||||||||||||||||||||||||||||||||||||||
| (+) Hawesville power adjustment |
59 | |||||||||||||||||||||||||||||||||||||||||||||||||||||||||||||||
|
|
|
|
|
|
|
|
|
|
|
|
|
|
|
|
|
|
|
|
|
|
|
|
|
|
|
|
|
|
|
|
|
|||||||||||||||||||||||||||||||||
| PF Adjusted EBITDA (for Sebree and new Hawesville Power Contract) |
$ | 113 | ||||||||||||||||||||||||||||||||||||||||||||||||||||||||||||||
| (+) Sebree power adjustment |
45 | |||||||||||||||||||||||||||||||||||||||||||||||||||||||||||||||
|
|
|
|
|
|
|
|
|
|
|
|
|
|
|
|
|
|
|
|
|
|
|
|
|
|
|
|
|
|
|
|
|
|||||||||||||||||||||||||||||||||
| PF Adjusted EBITDA (for Sebree and new Hawesville and Sebree Power Contracts) |
$ | 158 | ||||||||||||||||||||||||||||||||||||||||||||||||||||||||||||||
| Capex |
(15 | ) | (18 | ) | (19 | ) | (75 | ) | (298 | ) | (217 | ) | (113 | ) | (54 | ) | (17 | ) | (12 | ) | (20 | ) | (18 | ) | (3 | ) | (9 | ) | (24 | ) | (46 | ) | ||||||||||||||||||||||||||||||||
| Change in working capital |
(5 | ) | (4 | ) | (14 | ) | (33 | ) | 5 | (49 | ) | 12 | 12 | 41 | (19 | ) | (40 | ) | (21 | ) | (12 | ) | (12 | ) | (21 | ) | (28 | ) | ||||||||||||||||||||||||||||||||||||
|
|
|
|
|
|
|
|
|
|
|
|
|
|
|
|
|
|
|
|
|
|
|
|
|
|
|
|
|
|
|
|
|
|||||||||||||||||||||||||||||||||
| Free cash flow |
$ | 29 | $ | 37 | $ | 40 | $ | 54 | ($ | 110 | ) | $ | 112 | $ | 277 | $ | 212 | ($ | 66 | ) | $ | 137 | $ | 105 | $ | 3 | ($ | 6 | ) | $ | 2 | $ | 11 | $ | 84 | |||||||||||||||||||||||||||||
|
|
|
|
|
|
|
|
|
|
|
|
|
|
|
|
|
|
|
|
|
|
|
|
|
|
|
|
|
|
|
|
|
|||||||||||||||||||||||||||||||||

11
Net Cash Cost per Tonne Reconciliation
| ($ in millions, except shipments and per tonne data) |
||||||||||||||||||||||||
| 2009 | 2010 | 2011 | 2012 | LTM 3/31/13 |
PF LTM 3/31/13 |
|||||||||||||||||||
| LME Realized Price per Tonne |
$ | 1,610 | $ | 2,143 | $ | 2,421 | $ | 2,013 | $ | 1,997 | $ | 1,997 | ||||||||||||
| Revenue |
899 | 1,169 | 1,356 | 1,272 | 1,267 | 1,750 | ||||||||||||||||||
| COGS |
965 | 1,057 | 1,267 | 1,226 | 1,224 | 1,661 | ||||||||||||||||||
| (–) Lower of Cost or Market |
47 | 0 | (20 | ) | 20 | (3 | ) | (3 | ) | |||||||||||||||
| (–) Depreciation and Amortization |
(73 | ) | (64 | ) | (62 | ) | (63 | ) | (63 | ) | (96 | ) | ||||||||||||
|
|
|
|
|
|
|
|
|
|
|
|
|
|||||||||||||
| Cash Cost |
$ | 939 | $ | 994 | $ | 1,185 | $ | 1,183 | $ | 1,158 | $ | 1,563 | ||||||||||||
| Shipments (k tonnes) |
605 | 585 | 602 | 647 | 645 | 839 | ||||||||||||||||||
|
|
|
|
|
|
|
|
|
|
|
|
|
|||||||||||||
| Cash Costs per Tonne |
$ | 1,553 | $ | 1,698 | $ | 1,968 | $ | 1,830 | $ | 1,795 | $ | 1,862 | ||||||||||||
| (–) Premium per Tonne |
124 | 146 | 168 | 45 | 33 | (88 | ) | |||||||||||||||||
|
|
|
|
|
|
|
|
|
|
|
|
|
|||||||||||||
| Net Cash Costs per Tonne |
$ | 1,676 | $ | 1,843 | $ | 2,136 | $ | 1,875 | $ | 1,828 | $ | 1,774 | ||||||||||||
|
|
|
|
|
|
|
|
|
|
|
|
|
|||||||||||||
12