Attached files
| file | filename |
|---|---|
| 8-K - 8-K - OGLETHORPE POWER CORP | a2215332z8-k.htm |
Exhibit 99.1
|
|
First Quarter 2013 Investor Update |

|
|
2 Notice to Recipients Cautionary Note Regarding Forward Looking Statements Certain of the information contained in this presentation, including certain of the statements made by representatives of Oglethorpe Power Corporation (An Electric Membership Corporation) (“Oglethorpe”), that are not historical facts are forward-looking statements. Although Oglethorpe believes that in making these forward-looking statements its expectations are based on reasonable assumptions, Oglethorpe cautions the reader not to put undue reliance on these forward-looking statements, which are not guarantees of future performance. Forward-looking statements involve uncertainties and there are important factors, many of which are outside management’s control, which could cause actual results to differ materially from those expressed or implied by these forward-looking statements. Some of the risks, uncertainties and assumptions that may cause actual results to differ from these forward-looking statements are described under the headings “CAUTIONARY STATEMENT REGARDING FORWARD-LOOKING STATEMENTS” in our Quarterly Report on Form 10-Q for the quarter ended March 31, 2013, filed with the Securities and Exchange Commission on May 13, 2013 and “Item 1A – RISK FACTORS” in our Annual Report on Form 10-K for the fiscal year ended December 31, 2012, filed with the Securities and Exchange Commission on March 22, 2013. This electronic presentation is provided as of May 17, 2013. If you are viewing this presentation after that date, there may have been events that occurred subsequent to such date that would have a material adverse effect on the information that was presented. Oglethorpe undertakes no obligation to publicly update any forward-looking statements. Non-GAAP Financial Measures This electronic presentation contains certain non-GAAP financial measures, as defined under Regulation G of the rules and regulations of the SEC. For purposes of Regulation G, a “non-GAAP financial measure” is a numerical measure of a registrant’s historical or future financial performance, financial position or cash flows that excludes amounts, or is subject to adjustments that have the effect of excluding amounts, that are included in the most directly comparable measure calculated and presented in accordance with GAAP in the statement of operations, balance sheet or statement of cash flows of the registrant; or includes amounts, or is subject to adjustments that have the effect of including amounts, that are excluded from the most directly comparable measure so calculated and presented. For purposes of the definition, GAAP refers to generally accepted accounting principles in the United States. Pursuant to the requirements of Regulation G, Oglethorpe has provided, as a part of this electronic presentation, a reconciliation of each of the non-GAAP financial measures to the most directly comparable GAAP financial measure. |

|
|
Financial Strength of Oglethorpe’s Member Systems Vogtle 3&4 Construction Update DOE and RUS Loan Updates Q1 Financial & Operational Results 3 Presenters and Agenda Mike Price Executive Vice President and Chief Operating Officer Betsy Higgins Executive Vice President and Chief Financial Officer For a more comprehensive overview of Oglethorpe Power please refer to Oglethorpe’s periodic reports filed with the SEC and the 2012 year-end investor briefing, available on the Investor Relations page at www.opc.com. |
|
|
Members’ Load MWh sales of 35 million in 2012. Average residential revenue of 10.8 cents/kWh in 2012. 66% residential by MWh sales. Oglethorpe serves 38 Member distribution cooperatives in Georgia. Members serve 1.8 million meters, or approximately 4.1 million people. Covers 38,000 square miles, or 65% of Georgia. Includes 151 out of 159 counties in Georgia. No residential competition. Exclusive right to provide retail service in designated service territories. Competition only at inception for C&I loads in excess of 900kW. 4 Member Systems Update = Oglethorpe’s Members Members’ Service Territory and Competition Member Average Financial Ratios1 TIER: 2.12x Equity/Assets: 41% Equity/Total Capitalization: 48% Members’ Aggregate Financial Metrics1 Total Annual Revenues: $3.7 billion Total Net Margins: $186 million Total Patronage Capital: $2.9 billion Total Assets: $7.1 billion 1 Year ended 12/31/2012. Oglethorpe’s debt is not the direct obligation of the Members and, as a result, the capital of the Members does not directly support the principal and interest payments to be made by Oglethorpe on its outstanding indebtedness. 2012 Member Customer Base by MWh Sales Commercial and Industrial 30% Residential 66% Other 4% Revenue Contribution to Oglethorpe In 2012, Cobb EMC and Jackson EMC accounted for 12.8% and 11.9% of our total revenues, respectively. No other Member over 10%. |

|
|
5 Members’ Stable Financial History Note: For detailed financial and statistical information (2010-2012) on Oglethorpe’s Members, see Exhibit 99.1 Filed with Form 10-Q for the quarter ended 3/31/2013. (Exhibits are available on EDGAR, but not on Oglethorpe’s website). |
|
|
Consolidated System Equity 6 Includes long-term debt and capital leases due within one year, to correspond to Oglethorpe’s First Mortgage Indenture calculation. Oglethorpe’s debt is not the direct obligation of the Members and, as a result, the capital of the Members does not directly support the principal and interest payments to be made by Oglethorpe on its outstanding indebtedness. This information constitutes non-GAAP financial measures. A reconciliation of such measures to the most directly comparable GAAP measures is set forth in the immediately preceding row of this table. “Patronage Capital” and “Total Capitalization” columns do not add down since Oglethorpe patronage capital (equity) is also included in Members’ patronage capital. Key Point: Our Members have a greater stake in Oglethorpe than our equity ratio indicates. The Members are not only our owners, but are also our customers and through their Wholesale Power Contracts with us, the Members’ financial commitment goes well beyond the amount of patronage capital they hold in us. Consolidated System Equity – FYE 2012 ($ Millions) Patronage Capital Total Capitalization Equity Ratio 38 Members $2,920 $6,087 48% Oglethorpe $673 $6,776 (a) 10% Combined (b)(c) $2,920 (d) $12,190 (d) 24% |
|
|
Rate Structure Assures Recovery of All Costs + Margin Fixed costs: Members billed based on board-approved annual budget and budget revisions throughout the year, if necessary. Prior period adjustment mechanism covers any year-end shortfall below required 1.10 MFI (board approval not required). Energy costs: Actual costs are passed through. Monthly true-up of estimate vs. actual. Note: First Mortgage Indenture requires an MFI ratio of least 1.10x MFI coverage requirement of 1.10x under First Mortgage Indenture. Achieved 1.14x MFI for 2010, 2011 and 2012. Budget of 1.14x MFI for 2013. Formulary rate under Wholesale Power Contract. Designed to recover all costs, plus margin, without any further regulatory approval. Annual budget and rate adjustments to reflect budget changes are generally not subject to approval of RUS or any other regulatory authority. Changes to rate schedule are subject to RUS approval. (Projected) Margin Coverage 7 $17.2 $17.7 $18.2 $19.1 $19.3 $26.4 $33.7 $37.7 $39.3 $42.6 $0.0 $15.0 $30.0 $45.0 Net Margin (MM) |

|
|
8 Cornerstones of Our Credit Strength: Contracts, Rate Structure and Members Rates not Subject to Georgia PSC Regulation Mostly (2/3) Residential Customer Base Diversified Power Supply Portfolio Significant Equity at Member Level Strong Liquidity |
|
|
Plant Vogtle Conceptual Drawing of Vogtle Units 3 & 4 Georgia Power 45.7% Oglethorpe Power 30.0% MEAG 22.7% Dalton Utilities 1.6% 9 |
|
|
Vogtle Units 3 & 4 Project Update Overview 30% share (660 MW) of 2,200 MW new AP1000 units at existing Vogtle site. $4.5 billion estimated total cost to Oglethorpe (including AFUDC and contingency), which assumes commercial operation in 4th quarter of 2017 and 2018 for units 3 and 4, respectively. Recent Updates Unit 3 Nuclear Island Basemat (“First Nuclear Concrete”) completed in March. Large CR10 module “rebar cradle” installed on Unit 3 Nuclear Island Basemat in April. Project now over 1/3 complete. Two disputes with contractors currently in litigation. 10 0 1.5 3 4.5 ($ Billions ) $ 1.8 billion spent through 3/31/2013 Actuals Forecasts DEC 2011 DCD Final Rule 2005 2017 2016 2015 2014 2013 2012 2011 2010 2009 2006 2007 2008 2018 MAY 2005 Development Agreement MAR 2008 Filed COL with NRC APR 2006 Definitive Agreements MAY 2010 Signed DOE Conditional Term Sheet 2018 Unit 4 In - Service AUG 2006 Filed Early Site Permit ( ESP) with NRC AUG 2009 NRC Issuance of ESP/LWA 2017 Unit 3 In - Service AUG 2011 NRC Completed Work on FSER for both AP1000 DCD and COL FEB 2012 COLs Issued MAR 2013 Unit 3 First Nuclear Concrete 2013 Projected Start of DOE Funding |

|
|
11 Unit 3 Module CR10 Rebar Cradle |
|
|
12 Unit 3 Reactor Vessel Delivered to Site |
|
|
13 Cooling Tower Construction Unit 3 Unit 4 |
|
|
14 Other Work in Progress Unit 3 & 4 Turbine Island construction Structural Module assembly Unit 3 Condenser assembly Receipt of major equipment and components Permanent buildings |
|
|
Signed conditional term sheet with DOE in May 2010. DOE loan guarantee will fund up to $3.057 billion of project costs. All-in pricing expected to be favorable relative to taxable capital markets. Will be secured under Oglethorpe’s First Mortgage Indenture on parity with other secured debt. Final approval subject to negotiation of definitive agreements by the co-owners, due diligence by DOE and satisfaction of other conditions. There can be no assurance that DOE will ultimately issue loan guarantee to Oglethorpe. The conditional commitment will expire on June 30, 2013, unless further extended by the DOE. Projected start of DOE funding is 2013. Any costs not funded by DOE will be financed through taxable bonds (have already issued $1.36 billion of taxable bonds). 15 DOE Loan Guarantees for Vogtle 3 & 4 |
|
|
RUS Loan Status Total Amount Outstanding of All RUS Guaranteed Loans: $2.2 billion Purpose/Use of Proceeds Approved Advanced (to date) Remaining Amount Approved Loans General & Environmental Improvements $ 441,522,000 $ 395,084,102 $ 46,437,898 General & Environmental Improvements $ 310,228,000 $ 164,835,350 $ 145,392,650 Hawk Road Energy Facility $ 203,100,000 $ 127,382,732 $ 75,717,268 General Improvements1 $ 127,703,000 $ - $ 127,703,000 Thomas A. Smith Energy Facility2 $ 492,610,000 $ - $ 492,610,000 $ 1,575,163,000 $ 687,302,184 $ 887,860,816 1 Anticipate loan will begin funding in Q2 2013. 2 Anticipate loan will fully fund in Q2 2013. 16 |
|
|
Income Statement Excerpts Margins for Interest ratio is calculated on an annual basis and is determined by dividing Oglethorpe’s Margins for Interest by Interest Charges, both as defined in Oglethorpe’s First Mortgage Indenture. The Indenture obligates Oglethorpe to establish and collect rates that, subject to any necessary regulatory approvals, are reasonably expected to yield a Margins for Interest ratio equal to at least 1.10x for each fiscal year. In addition, the Indenture requires a showing of Oglethorpe’s having met this requirement for certain historical periods as a condition for issuing additional obligations under the Indenture. Oglethorpe increased its Margins for Interest ratio 1.14x for 2010, 2011, 2012 and 2013, above the minimum 1.10x ratio required by the Indenture. Oglethorpe’s Board of Directors will continue to evaluate margin coverage throughout the Vogtle construction period and may chose to further increase, or decrease, the Margins for Interest ratio in the future. 17 $13,520 Year Ended March 31, December 31, ($ in thousands) 2013 2012 2012 2011 2010 Statement of Revenues and Expenses:Operating Revenues:Sales to Members $286,653 $295,230 $1,204,008 $1,224,238 $1,292,667 Sales to Non-Members 19,261 23,994 120,102 166,040 1,478 Operating Expenses 238,360 257,168 1,102,277 1,152,458 1,054,896 Other Income 9,554 11,998 61,487 44,264 43,651 Net Interest Charges 55,084 60,534 244,000 244,347 249,167 Net Margin $22,024 $13,520 $39,320 $37,737 $33,733 Margins for Interest Ratio(a) n/a n/a 1.14x 1.14x 1.14x Average Power Cost (cents/kWh) 6.90 6.28 5.77 6.25 5.71 Sales to Members (MWh) 4,153,662 4,702,799 20,852,826 19,574,145 22,644,790 |
|
|
18 First Quarter Capacity Factor Comparison Nuclear Coal Gas - CC Gas - CT Pumped Storage Hydro (a) T.A. Smith not currently used to serve Member load. Hawk Road currently serves eight Members under separate PPA. Both resources will begin serving subscribing Members under the Wholesale Power Contract in 2016. |
|
|
Balance Sheet Excerpts (a) The equity ratio is calculated, pursuant to Oglethorpe’s First Mortgage Indenture, by dividing patronage capital and membership fees by total capitalization plus long-term debt due within one year (Total Long-Term Debt and Equities in the table above). Oglethorpe has no financial covenant that requires it to maintain a minimum equity ratio; however, a covenant in the Indenture restricts distributions of equity (patronage capital) to its Members if its equity ratio is below 20%. Oglethorpe also has a covenant in a credit agreement that currently requires a minimum total patronage capital of $575 million. The equity ratio is less than that of many investor-owned utilities because Oglethorpe operates on a not-for-profit basis and has a significant amount of authority to set and change rates to ensure sufficient cost recovery to produce margins to meet financial coverage requirements. 19 March 31, December 31,($ in thousands) 2013 2012 2011 Balance Sheet Data:Assets:Electric Plant: Net Plant in Service $4,024,891 $4,034,620 $4,007,281 CWIP $2,367,023 $2,240,920 $1,784,264 Nuclear Fuel $329,626 $321,196 $284,205 Total Electric Plant $6,721,540 $6,596,736 $6,075,750 Cash and Cash Equivalents $239,514 $298,565 $443,671 Total Assets $8,525,609 $8,314,566 $8,078,829 Capitalization:Patronage Capital and Membership Fees $695,033 $673,009 $633,689 Accumulated Other Comprehensive Loss $691 $903 $618 Subtotal $695,724 $673,912 $634,307 Long-term Debt and Obligations under Capital Leases $5,909,288 $5,920,073 $5,709,706 Obligation under Rocky Mountain Transactions $14,635 $14,392 $132,048 Long-term Debt and Capital Leases due within one year $197,042 $168,393 $172,818 Total Long-Term Debt and Equities $6,816,689 $6,776,770 $6,648,879 Equity Ratio(a) 10.2% 9.9% 9.5% |
|
|
Oglethorpe’s Available Liquidity as of May 13, 2013 Borrowings Detail $404.8 MM Vogtle Interim Financing $251.4 MM Letter of Credit Support for VRDBs/Thomas A. Smith $236.7 MM Thomas A. Smith Acquisition Interim Financing $100.4 MM Vogtle Interest Rate Hedging Represents 515 days of liquidity on hand. 20 0 500 1,000 1,500 2,000 Total Credit Facilities Less Borrowings Available Credit Facilities Capacity Cash (Excluding $206 Million in RUS Cushion of Credit) Total Liquidity $1,925 - $993 $932 $185 $1,117 (Millions) |
|
|
21 Recent and Upcoming Financing Activity Completed to date in 2013: $212.76 million tax-exempt refinancing. Upcoming: Renew $150 million J.P. Morgan unsecured bilateral credit facility. (4th Quarter). Restructure $250 million CFC secured bilateral credit facility and renew as an unsecured facility. (4th Quarter). |

|
|
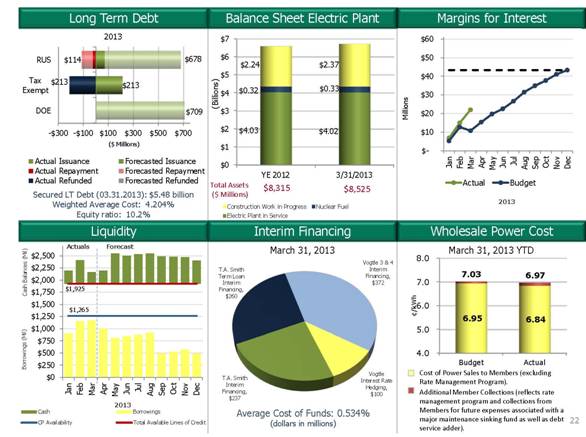
22 Liquidity Margins for Interest Wholesale Power Cost Interim Financing Long Term Debt Balance Sheet Electric Plant Average Cost of Funds: 0.534% (dollars in millions) Secured LT Debt (03.31.2013): $5.48 billion Weighted Average Cost: 4.204% Equity ratio: 10.2% 2013 1.14 MFI March 31, 2013 March 31, 2013 YTD Cost of Power Sales to Members (excluding Rate Management Program). Additional Member Collections (reflects rate management program and collections from Members for future expenses associated with a major maintenance sinking fund as well as debt service adder). 2013 2013 Actuals Forecast |
|
|
A link to this presentation will be posted on Oglethorpe’s website www.opc.com. Oglethorpe’s SEC filings, including its annual reports on Form 10-K, quarterly reports on Form 10-Q, current reports on Form 8-K are made available on its website. Member information is filed as an exhibit to Form 10-Q for the first quarter. For additional information please contact: 23 Additional Information Name Title Email Address Phone Number Betsy Higgins Executive Vice President and Chief Financial Officer betsy.higgins@opc.com 770-270-7168 Tom Brendiar Director, Bank and Investor Relations tom.brendiar@opc.com 770-270-7173 Joe Rick Director, Capital Markets joe.rick@opc.com 770-270-7240 |